
IOOF Investments€¦ · IOOF Investments uarterly report (to 31 March 2014) IOOF MultiMix...
24
IOOF Investments IOOF MultiMix Trusts IOOF Multi Series Balanced Trust IOOF Cash Management Trust IOOF Balanced Investor Trust Quarterly report (to 31 March 2014) For adviser use only
Transcript of IOOF Investments€¦ · IOOF Investments uarterly report (to 31 March 2014) IOOF MultiMix...
IOOF Investments
IOOF MultiMix TrustsIOOF Multi Series Balanced TrustIOOF Cash Management TrustIOOF Balanced Investor Trust
Quarterly report (to 31 March 2014)
For adviser use only
1
ContentsIOOF MultiMix portfolio construction 2
Asset allocation process 2
Manager selection process 2
IOOF Investments 3
Market overview and single asset class trust performance 4
Australian shares 4
International shares 5
Fixed interest 7
Cash 8
Property 9
Alternatives 10
Diversified trusts overview 11
IOOF MultiMix Capital Stable Trust 11
IOOF MultiMix Conservative Trust 12
IOOF MultiMix Moderate Trust 13
IOOF MultiMix Balanced Growth Trust 14
IOOF MultiMix Growth Trust 15
IOOF Multi Series Balanced Trust 16
IOOF Balanced Investor Trust 17
Strategic tilting update 18
Cash and fixed interest 18
International shares 18
Currency 18
Market outlook 19
Underlying investment managers 20
Investments Trust performance 21
2
IOOF Investments | Quarterly report (to 31 March 2014)
IOOF MultiMix portfolio constructionThe portfolio managers at IOOF follow a rigorous process to construct MultiMix portfolios which are true-to-label and therefore properly positioned to meet the needs of clients across a range of risk profiles. There are two separate, but equally important, elements of the process – asset allocation and manager selection.
Asset allocation processSetting asset allocation is a blend of art and science. Qualitative judgement is needed but our strategic decisions are supported by quantitative analysis to inject a level of rigour and consistency.
The core of our strategic asset allocation is always built around the mainstream listed asset classes. We then go through a systematic process to investigate whether or not the introduction of alternative asset classes has any potential benefits.
Two stage asset allocation process
Stage 1
The first stage involves building an optimal exposure to the broad market asset classes whose performance can be forecast with the greatest confidence – cash, bonds, listed property and shares.
Stage 2
The second stage focuses on making performance-enhancing adjustments to the fund’s stage one asset mix. For example, the portfolio management team will investigate the potential for:
• over or under-weighting various sub-components of broadly defined asset classes (such as small caps within Australian shares)
• the addition of illiquid asset classes (such as private shares)
• the addition of uncorrelated asset classes (such as commodities)
• exposure to alternative investments (such as hedge funds).
We stress test our strategic asset allocation to see how it would perform under different investment and economic conditions to ensure it's appropriate and to minimise risk.
Manager selection processManager selection builds on strategic asset allocation to create a portfolio that aims to deliver the right risk/return outcomes for investors.
Initial filters
An initial filter is used to narrow the field of managers to a manageable number who are then assessed more thoroughly. Managers are filtered according to:
• asset class
• type of strategy being sought
• independent manager ratings from external consultants
• manager capacity
• fees
• consistency of track record.
Manager research and analysis
Manager evaluation and selection is the responsibility of our portfolio managers and is both disciplined and transparent. The process involves intensive research combined with rigorous due diligence, risk management and monitoring procedures. We begin with a comprehensive review of documentation from both the manager and external ratings organisations.
This is followed by detailed analysis of the organisation, its people, process and performance. We also get a view from our asset consultant – Russell Investments.
The portfolio manager then prepares an extensive and detailed manager recommendation which is subject to full peer review, analysis and discussion. The recommendation is then finalised and the manager is proposed to the Investment Management Committee for approval.
3
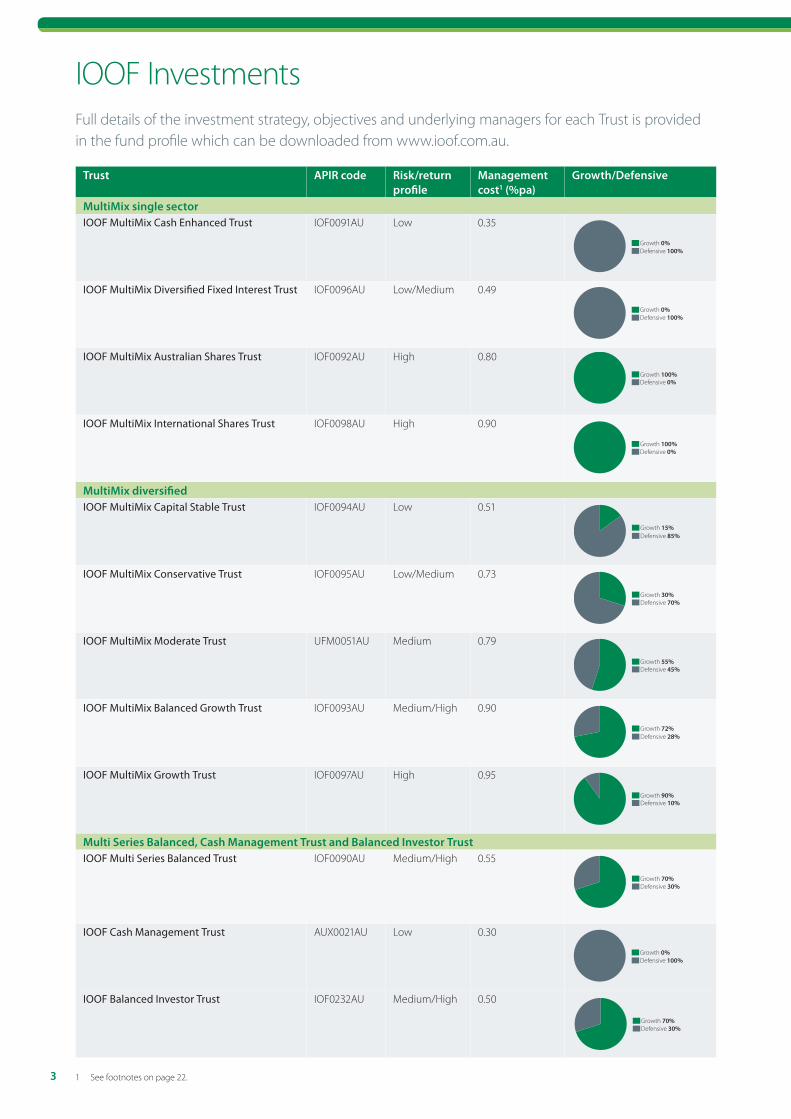
IOOF InvestmentsFull details of the investment strategy, objectives and underlying managers for each Trust is provided in the fund profile which can be downloaded from www.ioof.com.au.
Trust APIR code Risk/return profile
Management cost1 (%pa)
Growth/Defensive
MultiMix single sectorIOOF MultiMix Cash Enhanced Trust IOF0091AU Low 0.35
Defensive 100%Growth 0%
IOOF MultiMix Diversified Fixed Interest Trust IOF0096AU Low/Medium 0.49
Defensive 100%Growth 0%
IOOF MultiMix Australian Shares Trust IOF0092AU High 0.80
Defensive 0%Growth 100%
IOOF MultiMix International Shares Trust IOF0098AU High 0.90
Defensive 0%Growth 100%
MultiMix diversifiedIOOF MultiMix Capital Stable Trust IOF0094AU Low 0.51
Defensive 85%Growth 15%
IOOF MultiMix Conservative Trust IOF0095AU Low/Medium 0.73
Defensive 70%Growth 30%
IOOF MultiMix Moderate Trust UFM0051AU Medium 0.79
Defensive 45%Growth 55%
IOOF MultiMix Balanced Growth Trust IOF0093AU Medium/High 0.90
Defensive 28%Growth 72%
IOOF MultiMix Growth Trust IOF0097AU High 0.95
Defensive 10%Growth 90%
Multi Series Balanced, Cash Management Trust and Balanced Investor TrustIOOF Multi Series Balanced Trust IOF0090AU Medium/High 0.55
Defensive 30%Growth 70%
IOOF Cash Management Trust AUX0021AU Low 0.30
Defensive 100%Growth 0%
IOOF Balanced Investor Trust IOF0232AU Medium/High 0.50
Defensive 30%Growth 70%
1 See footnotes on page 22.
4
IOOF Investments | Quarterly report (to 31 March 2014)
2 See footnote on page 22.Past performance is not a reliable indicator of future performance.
Market overview and single asset class trust performanceAustralian shares
Market overview
Australian shares continued to grind higher over the quarter, albeit with a reasonable degree of volatility. After having lagged many other developed markets over the last four quarters our share market enjoyed a moderate level of outperformance over the March quarter which was particularly impressive given weak equity returns in key trading partners Japan and China whose markets fell 6.7% and 3.0% respectively in local currency terms.
The share market weakness in key export countries did impact the resource sector with the S&P/ASX Metals and Mining Index falling 1.7% over the quarter. The pace of future growth in China was a major concern, and was more than just a sentiment drag on the large miners with the iron ore price falling 13% and coking coal declining 18%.
The US Federal Reserve (Fed) ‘tapering’ program commenced with little immediate impact on Australian shares. Our dollar strengthened from US$0.89 to US$0.93 over the quarter despite a soft commodity backdrop. Investors continue to watch the dollar carefully as further rises may negatively affect competitiveness and earnings in a number of key sectors.
Half-year profit reports released over the quarter generally met expectations with overall net profit growth of 14.2% posted. The bulk of this earnings growth came from the markets’ two largest sectors - resources and banks - which grew net profits at 38.1% and 9.5% respectively. Forecast earnings for the market as a whole were upgraded by around 3% after reporting season. With the Australian market trading on a forward price earnings multiple of 14.9 times, 10% above its ten year average, earnings growth needs to continue in order for markets to continue higher.
Our portfolio
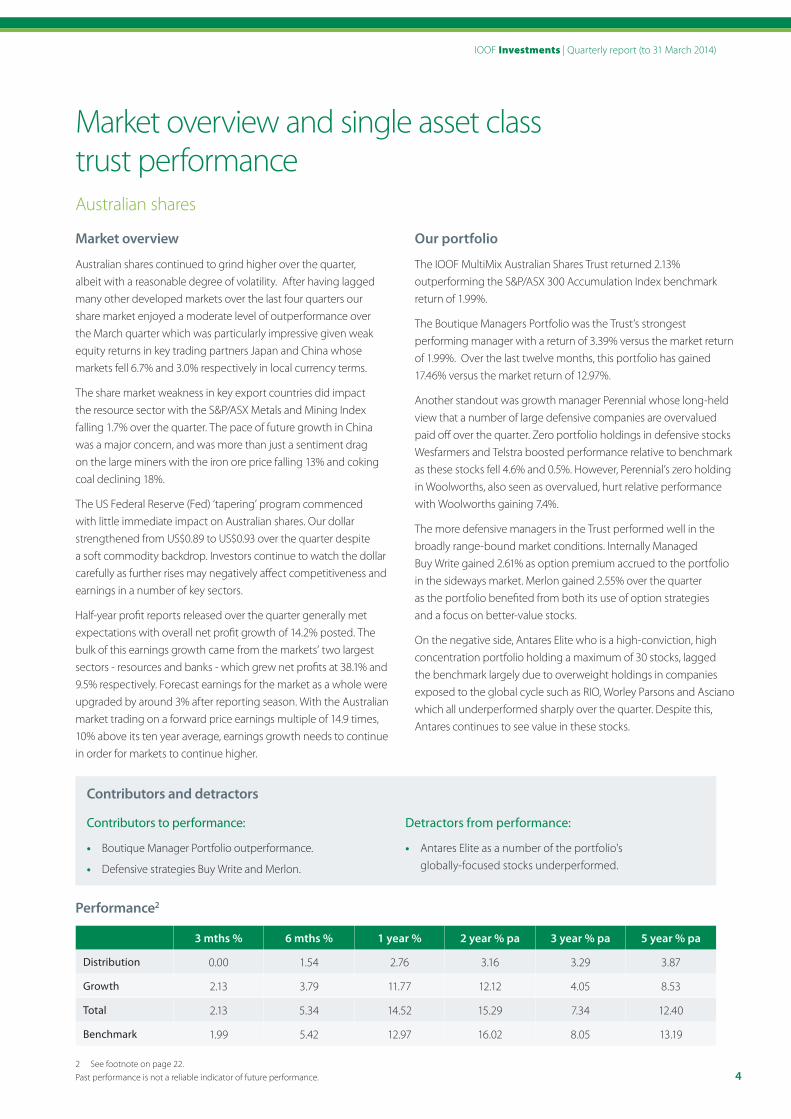
The IOOF MultiMix Australian Shares Trust returned 2.13% outperforming the S&P/ASX 300 Accumulation Index benchmark return of 1.99%.
The Boutique Managers Portfolio was the Trust’s strongest performing manager with a return of 3.39% versus the market return of 1.99%. Over the last twelve months, this portfolio has gained 17.46% versus the market return of 12.97%.
Another standout was growth manager Perennial whose long-held view that a number of large defensive companies are overvalued paid off over the quarter. Zero portfolio holdings in defensive stocks Wesfarmers and Telstra boosted performance relative to benchmark as these stocks fell 4.6% and 0.5%. However, Perennial’s zero holding in Woolworths, also seen as overvalued, hurt relative performance with Woolworths gaining 7.4%.
The more defensive managers in the Trust performed well in the broadly range-bound market conditions. Internally Managed Buy Write gained 2.61% as option premium accrued to the portfolio in the sideways market. Merlon gained 2.55% over the quarter as the portfolio benefited from both its use of option strategies and a focus on better-value stocks.
On the negative side, Antares Elite who is a high-conviction, high concentration portfolio holding a maximum of 30 stocks, lagged the benchmark largely due to overweight holdings in companies exposed to the global cycle such as RIO, Worley Parsons and Asciano which all underperformed sharply over the quarter. Despite this, Antares continues to see value in these stocks.
.
Contributors and detractors
Contributors to performance:
• Boutique Manager Portfolio outperformance.
• Defensive strategies Buy Write and Merlon.
Detractors from performance:
• Antares Elite as a number of the portfolio's globally-focused stocks underperformed.
Performance2
3 mths % 6 mths % 1 year % 2 year % pa 3 year % pa 5 year % pa
Distribution 0.00 1.54 2.76 3.16 3.29 3.87
Growth 2.13 3.79 11.77 12.12 4.05 8.53
Total 2.13 5.34 14.52 15.29 7.34 12.40
Benchmark 1.99 5.42 12.97 16.02 8.05 13.19
5
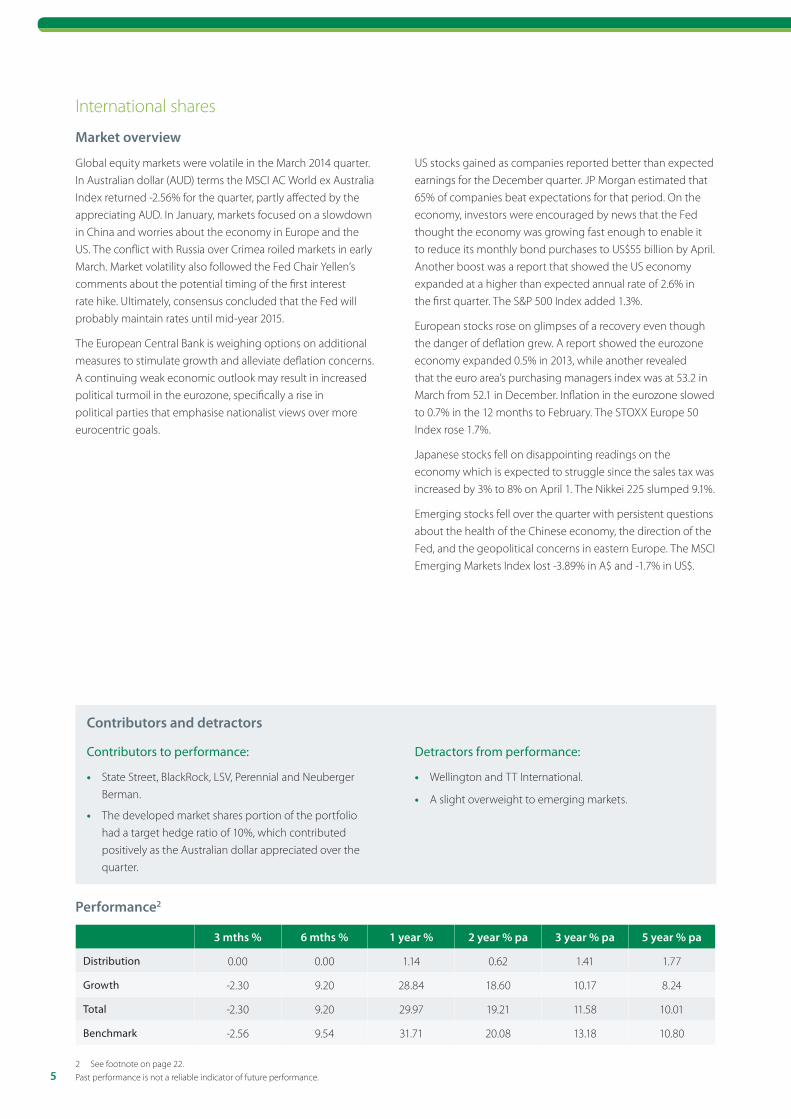
Contributors and detractors
Contributors to performance:
• State Street, BlackRock, LSV, Perennial and Neuberger Berman.
• The developed market shares portion of the portfolio had a target hedge ratio of 10%, which contributed positively as the Australian dollar appreciated over the quarter.
Detractors from performance:
• Wellington and TT International.
• A slight overweight to emerging markets.
Performance2
3 mths % 6 mths % 1 year % 2 year % pa 3 year % pa 5 year % pa
Distribution 0.00 0.00 1.14 0.62 1.41 1.77
Growth -2.30 9.20 28.84 18.60 10.17 8.24
Total -2.30 9.20 29.97 19.21 11.58 10.01
Benchmark -2.56 9.54 31.71 20.08 13.18 10.80
International shares
Market overview
Global equity markets were volatile in the March 2014 quarter. In Australian dollar (AUD) terms the MSCI AC World ex Australia Index returned -2.56% for the quarter, partly affected by the appreciating AUD. In January, markets focused on a slowdown in China and worries about the economy in Europe and the US. The conflict with Russia over Crimea roiled markets in early March. Market volatility also followed the Fed Chair Yellen’s comments about the potential timing of the first interest rate hike. Ultimately, consensus concluded that the Fed will probably maintain rates until mid-year 2015.
The European Central Bank is weighing options on additional measures to stimulate growth and alleviate deflation concerns. A continuing weak economic outlook may result in increased political turmoil in the eurozone, specifically a rise in political parties that emphasise nationalist views over more eurocentric goals.
US stocks gained as companies reported better than expected earnings for the December quarter. JP Morgan estimated that 65% of companies beat expectations for that period. On the economy, investors were encouraged by news that the Fed thought the economy was growing fast enough to enable it to reduce its monthly bond purchases to US$55 billion by April. Another boost was a report that showed the US economy expanded at a higher than expected annual rate of 2.6% in the first quarter. The S&P 500 Index added 1.3%.
European stocks rose on glimpses of a recovery even though the danger of deflation grew. A report showed the eurozone economy expanded 0.5% in 2013, while another revealed that the euro area’s purchasing managers index was at 53.2 in March from 52.1 in December. Inflation in the eurozone slowed to 0.7% in the 12 months to February. The STOXX Europe 50 Index rose 1.7%.
Japanese stocks fell on disappointing readings on the economy which is expected to struggle since the sales tax was increased by 3% to 8% on April 1. The Nikkei 225 slumped 9.1%.
Emerging stocks fell over the quarter with persistent questions about the health of the Chinese economy, the direction of the Fed, and the geopolitical concerns in eastern Europe. The MSCI Emerging Markets Index lost -3.89% in A$ and -1.7% in US$.
2 See footnote on page 22.Past performance is not a reliable indicator of future performance.
6
IOOF Investments | Quarterly report (to 31 March 2014)
Our portfolio
The trust returned -2.30% over the quarter, outperforming its benchmark by 0.26%. The managers that outperformed their respective benchmarks were State Street, BlackRock, LSV, Perennial and Neuberger Berman. The managers that underperformed their respective benchmarks were Wellington and TT International. A slight overweight to emerging markets detracted from performance. The developed market shares portion of the portfolio had a target hedge ratio of 10%, which contributed positively as the AUD appreciated over the quarter.
The State Street Global Index Plus portfolio outperformed its benchmark over the quarter. Valuation became the most rewarded theme over the course of the quarter, with very strong performance in March more than offsetting any weakness seen at the start of the year. The model’s quality factor was also a significant positive contributor but experienced the opposite trajectory, after a strong January it faced weakness in February and March. The model’s growth factor showed predictive power in the Europe and Pacific regions, but was ineffective in North America. Most model components were not successful in differentiating stocks in North America. Similar to last quarter, Europe stood out as the top performing region.
BlackRock outperformed its benchmark over the quarter. From a sector perspective, the highest returns came from information technology and health care. In technology, Microsoft performed well, particularly on the company’s announcement of some executive changes that were well received by investors. Within health care, companies like Roche and Novartis performed well on the back of some solid earnings announcements in the sector. Offsetting these somewhat were lower returns in telecommunications and materials. Within telecom, Rogers Communications had a poor return in the quarter on concerns about consumer spending growth. In materials, BHP Billiton had a difficult quarter due to weaker commodity prices.
LSV outperformed its benchmark as deeper value stocks performed better than growth stocks during the period and stock selection was positive across sectors. The portfolio continues to trade at a significant discount to the benchmark on multiple measures.
Perennial outperformed its benchmark over the quarter due to airlines and technology. A position in American Airlines Group was the biggest positive contributor, rising 45%. A position in General Motors and selective Japanese and energy holdings were the biggest detractors.
The Neuberger Berman emerging markets portfolio outperformed its benchmark over the quarter. On a country basis, Indian holdings aided relative performance. Financial and industrial names helped as investors believe that the reform-minded opposition party may win the current national elections – resulting in greater infrastructure spend.
The Chinese stocks in the portfolio trailed their index constituents with the consumer-related names being sold off. A variety of Brazilian and Indian banks and real estate positions outpaced their Chinese index peers in the financial sector. The portfolio’s information technology and industrial stocks trailed their respective index constituents; in the former, many Chinese internet names that have been strong performers over the last few months corrected recently as investors thought valuations were rich.
The Wellington portfolio underperformed and the largest detractor for the portfolio was due to a company specific situation. China-based Ctrip.com, an online travel facilitator, decided it was time to spend even more aggressively to gain market share at the expense of margins. Wellington has believed that spending would begin to moderate going forward, thereby lifting margins. As a result, the position was eliminated. On a more positive note, shares of Green Mountain soared after an announcement that it will partner with Coca-Cola to produce single serve products for use with Green Mountain’s forthcoming Keurig Cold at-home beverage system. Coca-Cola will help develop and market the new product and is paying $1.25 billion for a 10% stake in Green Mountain.
TT International underperformed the MSCI Emerging Markets Index despite positive stock selection in Taiwan, Korea and Greece, largely as a result of disappointing stock selection in China and Russia. Russia’s intrusive move into Ukraine saw an indiscriminate sell-off in Russian stocks. Unsurprisingly, the portfolio’s Russian names were hit: Yandex (information technology), Sberbank (financials) and Dixy (consumer staples) being the most prominent. In China, three names in particular struggled: China Communications (telecoms), China Galaxy Securities and China Overseas Garden Oceans (both financials). The latter suffered from the market’s fear of a property slowdown especially in tier three cities – the company’s major focus. Strong positive stock selection was achieved in Greece, Taiwan and Korea.
7
Fixed interest
Market overview
Australian bonds returned 1.45% over the quarter as measured by the UBSA Composite Bond Index. International bonds returned 2.67% as measured by the Barclays Capital Global Aggregate Bond Index ($A hedged) during the quarter.
Global markets generally traded favourably over the first quarter of 2014. However, hawkish central bank language and improving economic data elevated medium-term yields in the US and UK. Longer-term expectations were a little pessimistic and influenced by emerging market issues and adverse developments between the Ukraine and Russia.
The Bank of Japan continues with its existing monetary policy, confident that it did not need further stimulus to beat chronic deflation.
European yields fell as markets reacted to further disinflation and priced in a variety of potential easing actions from the European Central Bank. Peripheral eurozone bonds continued to outperform all other markets in March.
Domestically, the Reserve Bank of Australia (RBA) left monetary policy unchanged over the quarter at 2.50%. The RBA signalled a shift from an ‘easing’ to a ‘neutral’ bias. During the March quarter the Australian economy has shown a comfortable growth outlook, a strong recovery in housing investment, a lift in non-mining investment, an improvement in business conditions and growing exports despite a meaningful reduction in mining capital expenditure. Strong economic data increases the probability that the monetary easing cycle will be over by mid 2015.
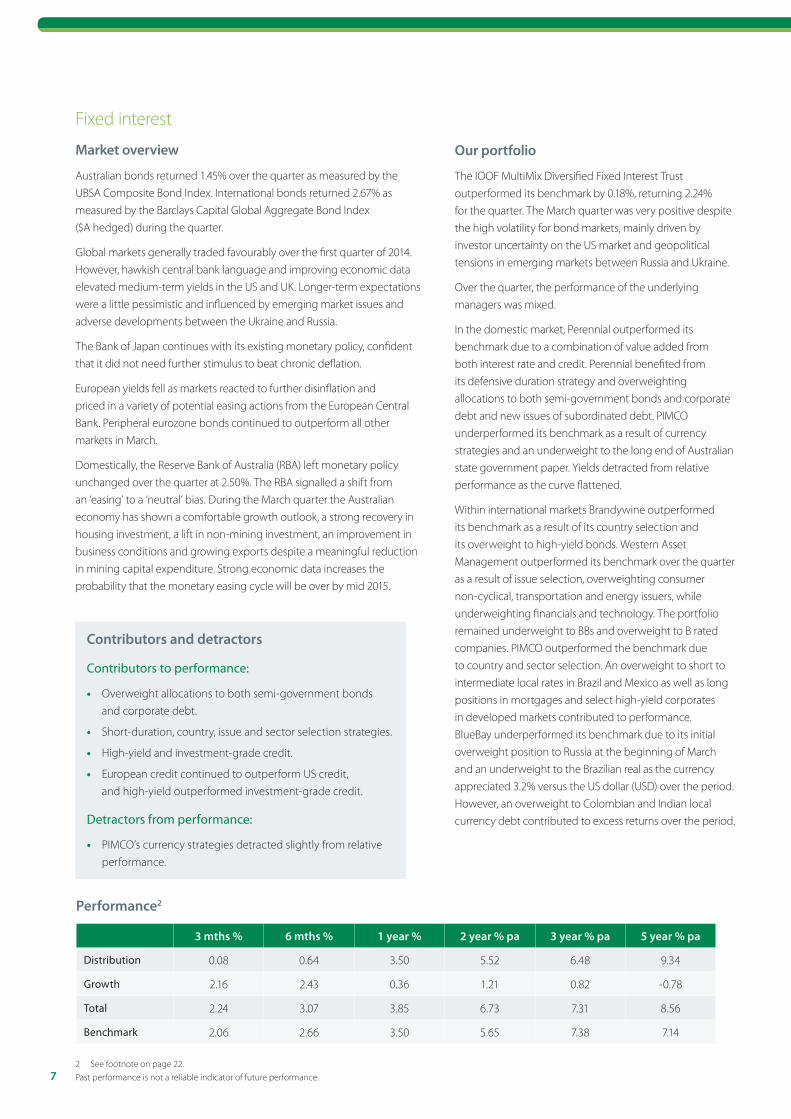
Performance2
3 mths % 6 mths % 1 year % 2 year % pa 3 year % pa 5 year % pa
Distribution 0.08 0.64 3.50 5.52 6.48 9.34
Growth 2.16 2.43 0.36 1.21 0.82 -0.78
Total 2.24 3.07 3.85 6.73 7.31 8.56
Benchmark 2.06 2.66 3.50 5.65 7.38 7.14
Contributors and detractors
Contributors to performance:
• Overweight allocations to both semi-government bonds and corporate debt.
• Short-duration, country, issue and sector selection strategies.
• High-yield and investment-grade credit.
• European credit continued to outperform US credit, and high-yield outperformed investment-grade credit.
Detractors from performance:
• PIMCO’s currency strategies detracted slightly from relative performance.
Our portfolio
The IOOF MultiMix Diversified Fixed Interest Trust outperformed its benchmark by 0.18%, returning 2.24% for the quarter. The March quarter was very positive despite the high volatility for bond markets, mainly driven by investor uncertainty on the US market and geopolitical tensions in emerging markets between Russia and Ukraine.
Over the quarter, the performance of the underlying managers was mixed.
In the domestic market, Perennial outperformed its benchmark due to a combination of value added from both interest rate and credit. Perennial benefited from its defensive duration strategy and overweighting allocations to both semi-government bonds and corporate debt and new issues of subordinated debt. PIMCO underperformed its benchmark as a result of currency strategies and an underweight to the long end of Australian state government paper. Yields detracted from relative performance as the curve flattened.
Within international markets Brandywine outperformed its benchmark as a result of its country selection and its overweight to high-yield bonds. Western Asset Management outperformed its benchmark over the quarter as a result of issue selection, overweighting consumer non-cyclical, transportation and energy issuers, while underweighting financials and technology. The portfolio remained underweight to BBs and overweight to B rated companies. PIMCO outperformed the benchmark due to country and sector selection. An overweight to short to intermediate local rates in Brazil and Mexico as well as long positions in mortgages and select high-yield corporates in developed markets contributed to performance. BlueBay underperformed its benchmark due to its initial overweight position to Russia at the beginning of March and an underweight to the Brazilian real as the currency appreciated 3.2% versus the US dollar (USD) over the period. However, an overweight to Colombian and Indian local currency debt contributed to excess returns over the period.
2 See footnote on page 22.Past performance is not a reliable indicator of future performance.
8
IOOF Investments | Quarterly report (to 31 March 2014)
Cash
Market overview
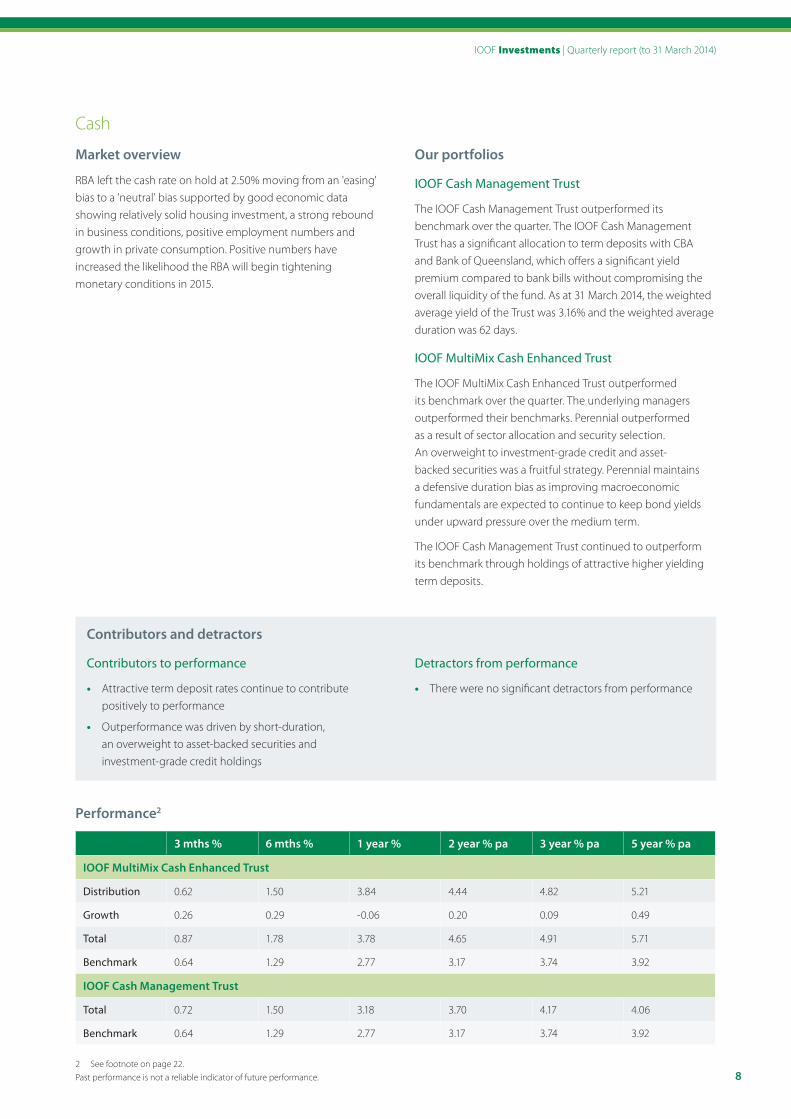
RBA left the cash rate on hold at 2.50% moving from an 'easing' bias to a 'neutral' bias supported by good economic data showing relatively solid housing investment, a strong rebound in business conditions, positive employment numbers and growth in private consumption. Positive numbers have increased the likelihood the RBA will begin tightening monetary conditions in 2015.
Our portfolios
IOOF Cash Management Trust
The IOOF Cash Management Trust outperformed its benchmark over the quarter. The IOOF Cash Management Trust has a significant allocation to term deposits with CBA and Bank of Queensland, which offers a significant yield premium compared to bank bills without compromising the overall liquidity of the fund. As at 31 March 2014, the weighted average yield of the Trust was 3.16% and the weighted average duration was 62 days.
IOOF MultiMix Cash Enhanced Trust
The IOOF MultiMix Cash Enhanced Trust outperformed its benchmark over the quarter. The underlying managers outperformed their benchmarks. Perennial outperformed as a result of sector allocation and security selection. An overweight to investment-grade credit and asset-backed securities was a fruitful strategy. Perennial maintains a defensive duration bias as improving macroeconomic fundamentals are expected to continue to keep bond yields under upward pressure over the medium term.
The IOOF Cash Management Trust continued to outperform its benchmark through holdings of attractive higher yielding term deposits.
Performance2
3 mths % 6 mths % 1 year % 2 year % pa 3 year % pa 5 year % pa
IOOF MultiMix Cash Enhanced Trust
Distribution 0.62 1.50 3.84 4.44 4.82 5.21
Growth 0.26 0.29 -0.06 0.20 0.09 0.49
Total 0.87 1.78 3.78 4.65 4.91 5.71
Benchmark 0.64 1.29 2.77 3.17 3.74 3.92
IOOF Cash Management Trust
Total 0.72 1.50 3.18 3.70 4.17 4.06
Benchmark 0.64 1.29 2.77 3.17 3.74 3.92
Contributors and detractors
Contributors to performance
• Attractive term deposit rates continue to contribute positively to performance
• Outperformance was driven by short-duration, an overweight to asset-backed securities and investment-grade credit holdings
Detractors from performance
• There were no significant detractors from performance
2 See footnote on page 22.Past performance is not a reliable indicator of future performance.
9
Property
Market overview
In broad terms property markets were stable during the quarter ending 31 March 2014. Key drivers for the property sector include interest rates, employment trends, retail spending, manufacturing and consumer confidence. As a result of generally benign level of fundamental changes to these drivers during the quarter the property asset class broadly performed in line with long term averages and expectations.
Our portfolio – Australian listed property
The MultiMix Wholesale Australian Property Trust outperformed in the March 2014 quarter, generating a net wholesale return of 3.36% versus the benchmark S&P/ASX 300 Property Accumulation Index return of 3.04%. Our managers have positioned our portfolio to take advantage of opportunities in the commercial office and residential sectors. Mergers and acquisitions in the office sector combined with a historically high level of demand from institutional and international investors continue to generate growth in selected stocks. Residential markets have broadly continued to improve due to consumer certainty in relation to interest rates and increased investment by self-managed superannuation funds, international investors and developers.
Our portfolio – international listed property
The MultiMix Wholesale International Property Trust underperformed in the March 2014 quarter, generating a net wholesale return of 2.26% versus the UBS Global Real Estate Investors ex-Australia Index ($A hedged) benchmark return of 7.29%.
The portfolio performed in line with long term averages in the quarter after the market endured a flat period in mid to late 2013. Volatility continues to be a feature of the asset class with Europe struggling with its broad recovery, South East Asia’s residential sector being slowed by Government measures and the United States recovery being unspectacular. Our managers have positioned the portfolio so it can take advantage of value growth opportunities as they arise while maintaining a moderate risk profile to match the volatile market. The improvement of the AUD in relation to the USD has adversely affected the fund however it is generally anticipated that this short-term trend will be reversed over time.
Our portfolio – direct property
The MIM Property Plus Trust slightly underperformed over the March 2014 quarter, generating a return after fees of 1.54% versus the benchmark InTech Asset Weighted Australian Unlisted Property Index return of 1.62%. The portfolio continued to provide consistent income returns and enjoys an occupancy rate of 99%. Valuations conducted as at 31 March confirmed that capital growth is fairly flat and broad market net rental growth is not a feature of the market at this time due to various headwinds including white collar unemployment, conservative levels of business confidence and soft manufacturing conditions.
Contributors and detractors
Contributors to performance:
• Both our Australian listed property managers outperformed the Property Index during the quarter and they continue to sustain the long-term track record of outperformance.
• Our funds allocation to high quality commercial office property was generally a contributor as the sector is generating consistent income streams and prime commercial property is highly sought after globally.
Detractors from performance:
• Some of our managers’ geographic allocations generated negative returns in Japan and parts of Europe and an underweight position in Australian listed property was a disadvantage in this outperforming sector.
• The international listed property managers underperformed during the quarter. In contrast, the one and two year performance of the managers has been most pleasing which is a reflection of our managers’ ability to outperform in a very volatile market over the medium term.
• During the quarter, the Australian dollar strongly rebounded in value in comparison to the US dollar which adversely affected the relative performance of the non-hedged portion of the portfolio managed by Perennial.
10
IOOF Investments | Quarterly report (to 31 March 2014)
Alternatives
Our portfolio – growth
Returns for the Alternative Equity Trust were below expectations, returning -0.88% after fees for the quarter. The Trust managed to retain most of its value despite a fall in the global equity markets of -2.56% MSCI AC World ex-Australia ($A) over the same period. The Trust underperformed a resurgent Australian equity market that returned 1.99% (S&P/ASX 300 Accumulation Index) for the period.
Despite a bias to global managers and a strengthening AUD, international private equity still added value. The AUD appreciated 3.1% against the USD detracting from the value of unhedged international assets. Australian private equity was particularly strong for the period benefiting from some recent exits.
The Trust’s exposure to systematic hedge funds continues to disappoint. While the allocation represents less than 20% of the Trust’s assets, it contributed over -2% to returns. The Trust’s allocations to discretionary hedge funds were relatively flat for the period. The Australian exposure kept pace with domestic equity markets while the international exposure managed to retain value in a strong AUD environment.
Our portfolio – defensive
The Alternative Defensive Trust underperformed expectations for the period. The Trust returned 0.33% versus the UBSA Composite Bond Index return of 1.45% and the Barclays Capital Global Aggregate Bond Index ($A hedged) return of 2.67%.
A little over 28% of the Trust is invested in unhedged international assets. In aggregate these assets retained most of their value in local currency terms. Currency accounted for most of the underperformance from this allocation. AUD appreciated over three per cent against the USD detracting from the value of unhedged international assets. The Trust’s 23% allocation to discretionary macro also lost value due to a resurgent AUD and mixed performance in Asia.
The top performers for the period were the allocation to hedged credit and hedged listed infrastructure. The Trust’s small allocation to domestic and hedged subordinated debt also added value.
Contributors and detractors
Contributors from performance:
• Private equity, in particular Australian private equity, in aggregate added value for the growth fund.
• Hedged credit and hedged listed infrastructure added value in the defensive fund.
Detractors from performance:
• Currency detracted from value for both the defensive and growth fund.
• Systematic hedge funds lost most of the value for the growth fund.
• Discretionary macro detracted from value for the defensive fund.
11
Diversified trusts overviewIOOF MultiMix Capital Stable Trust
Trust commentary
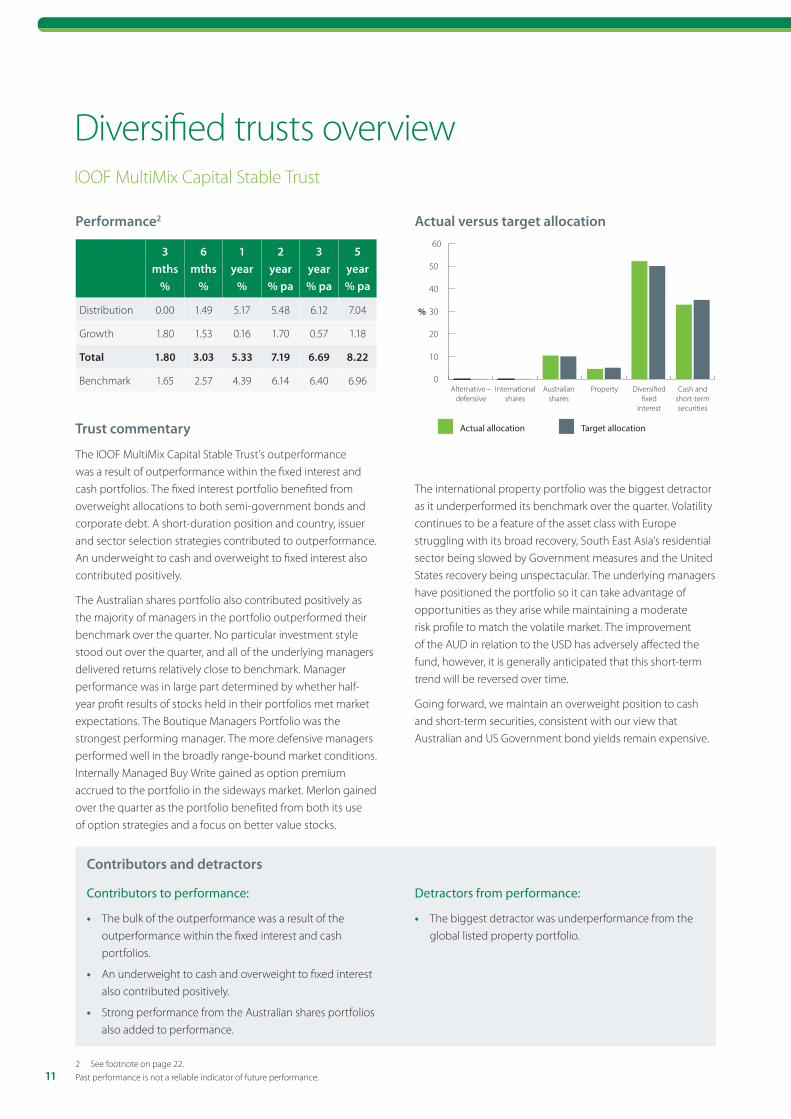
The IOOF MultiMix Capital Stable Trust’s outperformance was a result of outperformance within the fixed interest and cash portfolios. The fixed interest portfolio benefited from overweight allocations to both semi-government bonds and corporate debt. A short-duration position and country, issuer and sector selection strategies contributed to outperformance. An underweight to cash and overweight to fixed interest also contributed positively.
The Australian shares portfolio also contributed positively as the majority of managers in the portfolio outperformed their benchmark over the quarter. No particular investment style stood out over the quarter, and all of the underlying managers delivered returns relatively close to benchmark. Manager performance was in large part determined by whether half-year profit results of stocks held in their portfolios met market expectations. The Boutique Managers Portfolio was the strongest performing manager. The more defensive managers performed well in the broadly range-bound market conditions. Internally Managed Buy Write gained as option premium accrued to the portfolio in the sideways market. Merlon gained over the quarter as the portfolio benefited from both its use of option strategies and a focus on better value stocks.
The international property portfolio was the biggest detractor as it underperformed its benchmark over the quarter. Volatility continues to be a feature of the asset class with Europe struggling with its broad recovery, South East Asia’s residential sector being slowed by Government measures and the United States recovery being unspectacular. The underlying managers have positioned the portfolio so it can take advantage of opportunities as they arise while maintaining a moderate risk profile to match the volatile market. The improvement of the AUD in relation to the USD has adversely affected the fund, however, it is generally anticipated that this short-term trend will be reversed over time.
Going forward, we maintain an overweight position to cash and short-term securities, consistent with our view that Australian and US Government bond yields remain expensive.
Performance2
3 mths
%
6 mths
%
1 year
%
2 year % pa
3 year % pa
5 year % pa
Distribution 0.00 1.49 5.17 5.48 6.12 7.04
Growth 1.80 1.53 0.16 1.70 0.57 1.18
Total 1.80 3.03 5.33 7.19 6.69 8.22
Benchmark 1.65 2.57 4.39 6.14 6.40 6.96
Actual versus target allocation
0
10
20
30
40
50
60
Actual allocation Target allocation
Alternative –defensive
%
Internationalshares
Australianshares
Property Diversi�ed�xed
interest
Cash andshort-termsecurities
Contributors and detractors
Contributors to performance:
• The bulk of the outperformance was a result of the outperformance within the fixed interest and cash portfolios.
• An underweight to cash and overweight to fixed interest also contributed positively.
• Strong performance from the Australian shares portfolios also added to performance.
Detractors from performance:
• The biggest detractor was underperformance from the global listed property portfolio.
2 See footnote on page 22.Past performance is not a reliable indicator of future performance.
12
IOOF Investments | Quarterly report (to 31 March 2014)
IOOF MultiMix Conservative Trust
Performance2
3 mths
%
6 mths
%
1 year
%
2 year % pa
3 year % pa
5 year % pa
Distribution 0.00 1.37 4.36 4.92 5.42 6.51
Growth 1.37 2.15 2.93 3.79 1.80 2.31
Total 1.37 3.52 7.29 8.71 7.22 8.82
Benchmark 1.64 3.50 6.68 8.03 7.43 8.16
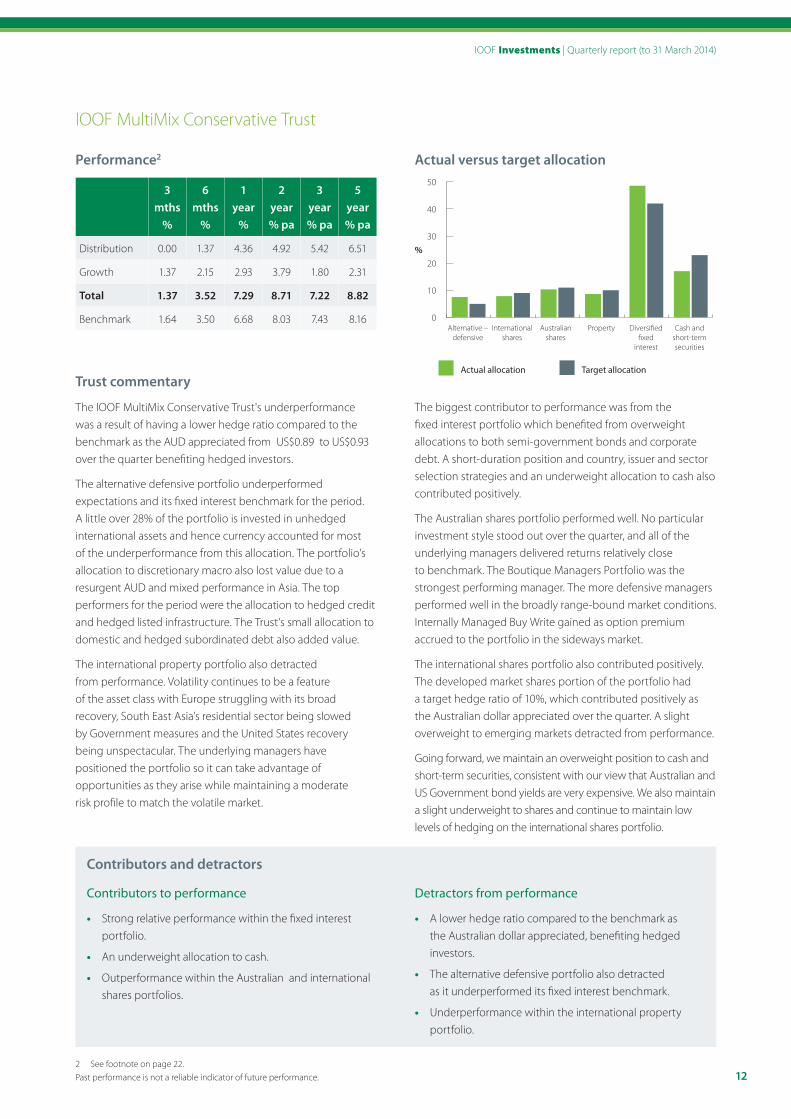
Actual versus target allocation
0
10
20
30
40
50
Actual allocation Target allocation
Alternative –defensive
Internationalshares
Australianshares
Property Diversi�ed�xed
interest
Cash andshort-termsecurities
%
Trust commentary
The IOOF MultiMix Conservative Trust's underperformance was a result of having a lower hedge ratio compared to the benchmark as the AUD appreciated from US$0.89 to US$0.93 over the quarter benefiting hedged investors.
The alternative defensive portfolio underperformed expectations and its fixed interest benchmark for the period. A little over 28% of the portfolio is invested in unhedged international assets and hence currency accounted for most of the underperformance from this allocation. The portfolio’s allocation to discretionary macro also lost value due to a resurgent AUD and mixed performance in Asia. The top performers for the period were the allocation to hedged credit and hedged listed infrastructure. The Trust’s small allocation to domestic and hedged subordinated debt also added value.
The international property portfolio also detracted from performance. Volatility continues to be a feature of the asset class with Europe struggling with its broad recovery, South East Asia’s residential sector being slowed by Government measures and the United States recovery being unspectacular. The underlying managers have positioned the portfolio so it can take advantage of opportunities as they arise while maintaining a moderate risk profile to match the volatile market.
The biggest contributor to performance was from the fixed interest portfolio which benefited from overweight allocations to both semi-government bonds and corporate debt. A short-duration position and country, issuer and sector selection strategies and an underweight allocation to cash also contributed positively.
The Australian shares portfolio performed well. No particular investment style stood out over the quarter, and all of the underlying managers delivered returns relatively close to benchmark. The Boutique Managers Portfolio was the strongest performing manager. The more defensive managers performed well in the broadly range-bound market conditions. Internally Managed Buy Write gained as option premium accrued to the portfolio in the sideways market.
The international shares portfolio also contributed positively. The developed market shares portion of the portfolio had a target hedge ratio of 10%, which contributed positively as the Australian dollar appreciated over the quarter. A slight overweight to emerging markets detracted from performance.
Going forward, we maintain an overweight position to cash and short-term securities, consistent with our view that Australian and US Government bond yields are very expensive. We also maintain a slight underweight to shares and continue to maintain low levels of hedging on the international shares portfolio.
Contributors and detractors
Contributors to performance
• Strong relative performance within the fixed interest portfolio.
• An underweight allocation to cash.
• Outperformance within the Australian and international shares portfolios.
Detractors from performance
• A lower hedge ratio compared to the benchmark as the Australian dollar appreciated, benefiting hedged investors.
• The alternative defensive portfolio also detracted as it underperformed its fixed interest benchmark.
• Underperformance within the international property portfolio.
2 See footnote on page 22.Past performance is not a reliable indicator of future performance.
13
IOOF MultiMix Moderate Trust
Performance2
3 mths
%
6 mths
%
1 year
%
2 year % pa
3 year % pa
5 year % pa
Distribution 0.00 1.29 4.42 4.43 4.53 4.86
Growth 1.01 3.15 6.09 6.05 2.60 4.43
Total 1.01 4.43 10.51 10.48 7.13 9.29
Benchmark 1.40 5.06 11.21 11.59 8.81 10.16
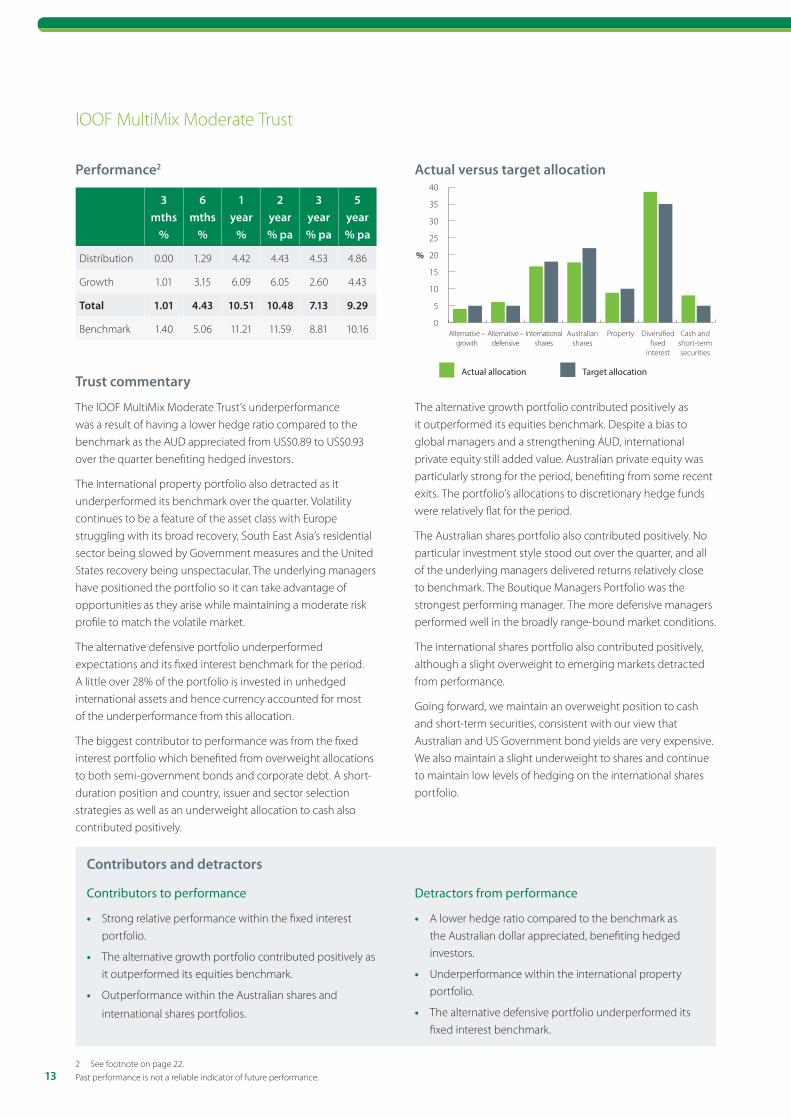
Actual versus target allocation
0
5
10
15
20
25
30
35
40
Actual allocation Target allocation
%
Alternative –growth
Internationalshares
Australianshares
Property Diversi�ed�xed
interest
Cash andshort-termsecurities
Alternative –defensive
Trust commentary
The IOOF MultiMix Moderate Trust’s underperformance was a result of having a lower hedge ratio compared to the benchmark as the AUD appreciated from US$0.89 to US$0.93 over the quarter benefiting hedged investors.
The international property portfolio also detracted as it underperformed its benchmark over the quarter. Volatility continues to be a feature of the asset class with Europe struggling with its broad recovery, South East Asia’s residential sector being slowed by Government measures and the United States recovery being unspectacular. The underlying managers have positioned the portfolio so it can take advantage of opportunities as they arise while maintaining a moderate risk profile to match the volatile market.
The alternative defensive portfolio underperformed expectations and its fixed interest benchmark for the period. A little over 28% of the portfolio is invested in unhedged international assets and hence currency accounted for most of the underperformance from this allocation.
The biggest contributor to performance was from the fixed interest portfolio which benefited from overweight allocations to both semi-government bonds and corporate debt. A short-duration position and country, issuer and sector selection strategies as well as an underweight allocation to cash also contributed positively.
The alternative growth portfolio contributed positively as it outperformed its equities benchmark. Despite a bias to global managers and a strengthening AUD, international private equity still added value. Australian private equity was particularly strong for the period, benefiting from some recent exits. The portfolio’s allocations to discretionary hedge funds were relatively flat for the period.
The Australian shares portfolio also contributed positively. No particular investment style stood out over the quarter, and all of the underlying managers delivered returns relatively close to benchmark. The Boutique Managers Portfolio was the strongest performing manager. The more defensive managers performed well in the broadly range-bound market conditions.
The international shares portfolio also contributed positively, although a slight overweight to emerging markets detracted from performance.
Going forward, we maintain an overweight position to cash and short-term securities, consistent with our view that Australian and US Government bond yields are very expensive. We also maintain a slight underweight to shares and continue to maintain low levels of hedging on the international shares portfolio.
Contributors and detractors
Contributors to performance
• Strong relative performance within the fixed interest portfolio.
• The alternative growth portfolio contributed positively as it outperformed its equities benchmark.
• Outperformance within the Australian shares and
international shares portfolios.
Detractors from performance
• A lower hedge ratio compared to the benchmark as the Australian dollar appreciated, benefiting hedged investors.
• Underperformance within the international property portfolio.
• The alternative defensive portfolio underperformed its fixed interest benchmark.
2 See footnote on page 22.Past performance is not a reliable indicator of future performance.

14
IOOF Investments | Quarterly report (to 31 March 2014)
IOOF MultiMix Balanced Growth Trust
Performance2
3 mths
%
6 mths
%
1 year
%
2 year % pa
3 year % pa
5 year % pa
Distribution 0.00 1.01 3.16 3.29 3.91 4.49
Growth 0.63 4.39 11.79 9.97 4.67 5.80
Total 0.63 5.40 14.95 13.26 8.58 10.28
Benchmark 1.13 5.95 14.15 13.73 9.74 11.08
Actual versus target allocation
0
5
10
15
20
25
30
Actual allocation Target allocation
%
Alternative –growth
Internationalshares
Australianshares
Property Diversi�ed�xed
interest
Cash andshort-termsecurities
Alternative –defensive
Trust commentary
The IOOF MultiMix Balanced Growth Trust’s underperformance was a result of having a lower hedge ratio compared to the benchmark as the AUD appreciated from US$0.89 to US$0.93 over the quarter, benefiting hedged investors.
The international property portfolio underperformed its benchmark over the quarter. Volatility continues to be a feature of the asset class with Europe struggling with its broad recovery, South East Asia’s residential sector being slowed by Government measures and the United States recovery being unspectacular. The underlying managers have positioned the portfolio so it can take advantage of opportunities as they arise while maintaining a moderate risk profile to match the volatile market.
The biggest contributor to performance was the alternative growth portfolio. Despite a bias to global managers and a strengthening AUD, international private equity still added value. Australian private equity was particularly strong for the period, benefiting from some recent exits. Unfortunately however the alternative defensive portfolio also underperformed expectations and its fixed interest benchmark for the period.
The Australian shares portfolio also contributed positively. No particular investment style stood out over the quarter, and all of the underlying managers delivered returns relatively close to benchmark. The Boutique Managers Portfolio was the strongest performing manager. The more defensive managers performed well in the broadly range-bound market conditions.
The international shares portfolio also contributed positively. The developed market shares portion of the portfolio had a target hedge ratio of 10%, which contributed positively as the Australian dollar appreciated over the quarter. A slight overweight to emerging markets detracted from performance.
Strong relative performance within the fixed interest portfolio also contributed positively as it benefited from overweight allocations to both semi-government bonds and corporate debt. A short-duration position and country, issuer and sector selection strategies as well as an underweight allocation to cash also contributed positively.
Going forward, we maintain an overweight position to cash and short-term securities, consistent with our view that Australian and US Government bond yields are very expensive. We also maintain our preference for unhedged international shares over Australian shares. We continue to maintain low levels of hedging on the international shares portfolio.
Contributors and detractors
Contributors to performance
• The alternative growth portfolio outperformed its equities benchmark.
• Outperformance within the Australian shares and international shares portfolios.
• Strong relative performance within the fixed interest portfolio.
Detractors from performance
• A lower hedge ratio compared to the benchmark as the Australian dollar appreciated.
• An overweight to international shares.
• Underperformance within the international property portfolio.
• The alternative defensive portfolio underperformed its fixed interest benchmark.
2 See footnote on page 22.Past performance is not a reliable indicator of future performance.
15
IOOF MultiMix Growth Trust
Performance2
3 mths
%
6 mths
%
1 year
%
2 year % pa
3 year % pa
5 year % pa
Distribution 0.00 0.94 2.65 2.76 3.40 3.53
Growth 0.21 5.41 14.56 11.94 5.50 7.43
Total 0.21 6.35 17.20 14.70 8.90 10.96
Benchmark 0.84 6.86 17.24 15.98 10.43 11.90
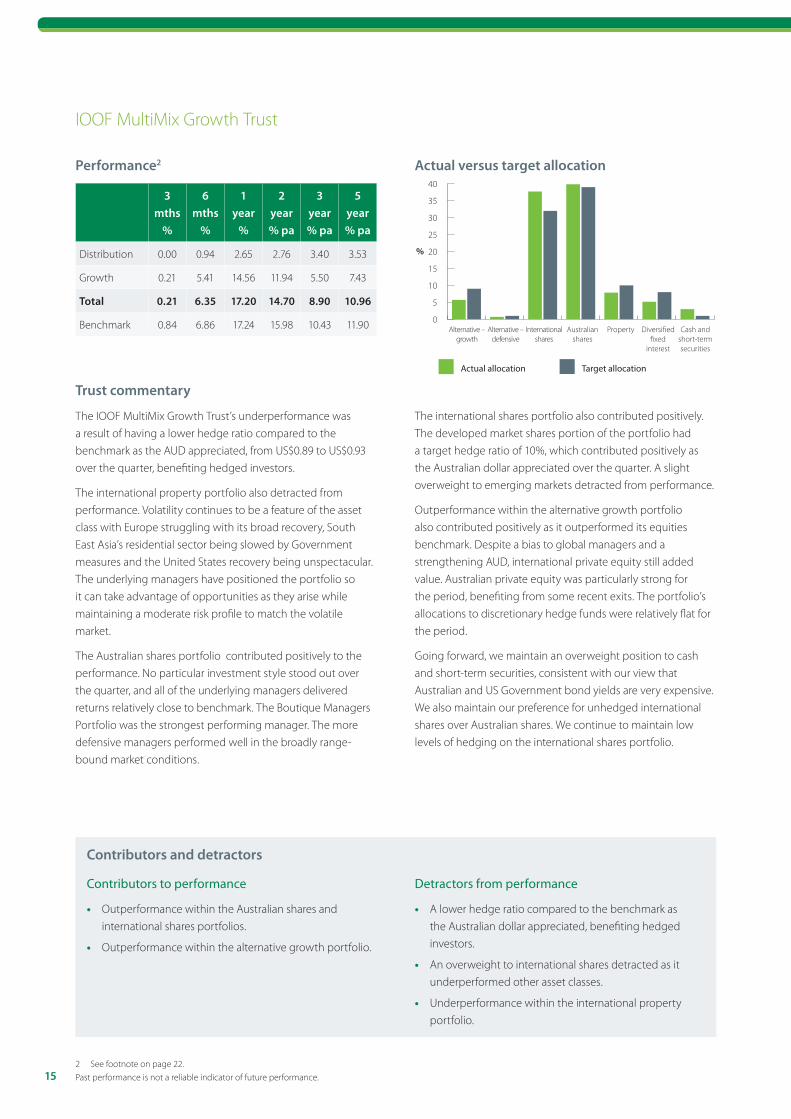
Actual versus target allocation
0
5
10
15
20
25
30
35
40
Actual allocation Target allocation
%
Alternative –growth
Internationalshares
Australianshares
Property Diversi�ed�xed
interest
Cash andshort-termsecurities
Alternative –defensive
Trust commentary
The IOOF MultiMix Growth Trust’s underperformance was a result of having a lower hedge ratio compared to the benchmark as the AUD appreciated, from US$0.89 to US$0.93 over the quarter, benefiting hedged investors.
The international property portfolio also detracted from performance. Volatility continues to be a feature of the asset class with Europe struggling with its broad recovery, South East Asia’s residential sector being slowed by Government measures and the United States recovery being unspectacular. The underlying managers have positioned the portfolio so it can take advantage of opportunities as they arise while maintaining a moderate risk profile to match the volatile market.
The Australian shares portfolio contributed positively to the performance. No particular investment style stood out over the quarter, and all of the underlying managers delivered returns relatively close to benchmark. The Boutique Managers Portfolio was the strongest performing manager. The more defensive managers performed well in the broadly range-bound market conditions.
The international shares portfolio also contributed positively. The developed market shares portion of the portfolio had a target hedge ratio of 10%, which contributed positively as the Australian dollar appreciated over the quarter. A slight overweight to emerging markets detracted from performance.
Outperformance within the alternative growth portfolio also contributed positively as it outperformed its equities benchmark. Despite a bias to global managers and a strengthening AUD, international private equity still added value. Australian private equity was particularly strong for the period, benefiting from some recent exits. The portfolio’s allocations to discretionary hedge funds were relatively flat for the period.
Going forward, we maintain an overweight position to cash and short-term securities, consistent with our view that Australian and US Government bond yields are very expensive. We also maintain our preference for unhedged international shares over Australian shares. We continue to maintain low levels of hedging on the international shares portfolio.
Contributors and detractors
Contributors to performance
• Outperformance within the Australian shares and international shares portfolios.
• Outperformance within the alternative growth portfolio.
Detractors from performance
• A lower hedge ratio compared to the benchmark as the Australian dollar appreciated, benefiting hedged investors.
• An overweight to international shares detracted as it underperformed other asset classes.
• Underperformance within the international property portfolio.
2 See footnote on page 22.Past performance is not a reliable indicator of future performance.
16
IOOF Investments | Quarterly report (to 31 March 2014)
IOOF Multi Series Balanced Trust
Performance2
3 mths
%
6 mths
%
1 year
%
2 year % pa
3 year % pa
5 year % pa
Distribution 0.00 0.82 3.99 3.66 3.68 4.53
Growth 1.46 4.82 8.94 8.85 4.07 5.52
Total 1.46 5.64 12.92 12.51 7.75 10.05
Benchmark 1.26 5.74 13.58 13.83 9.29 10.66
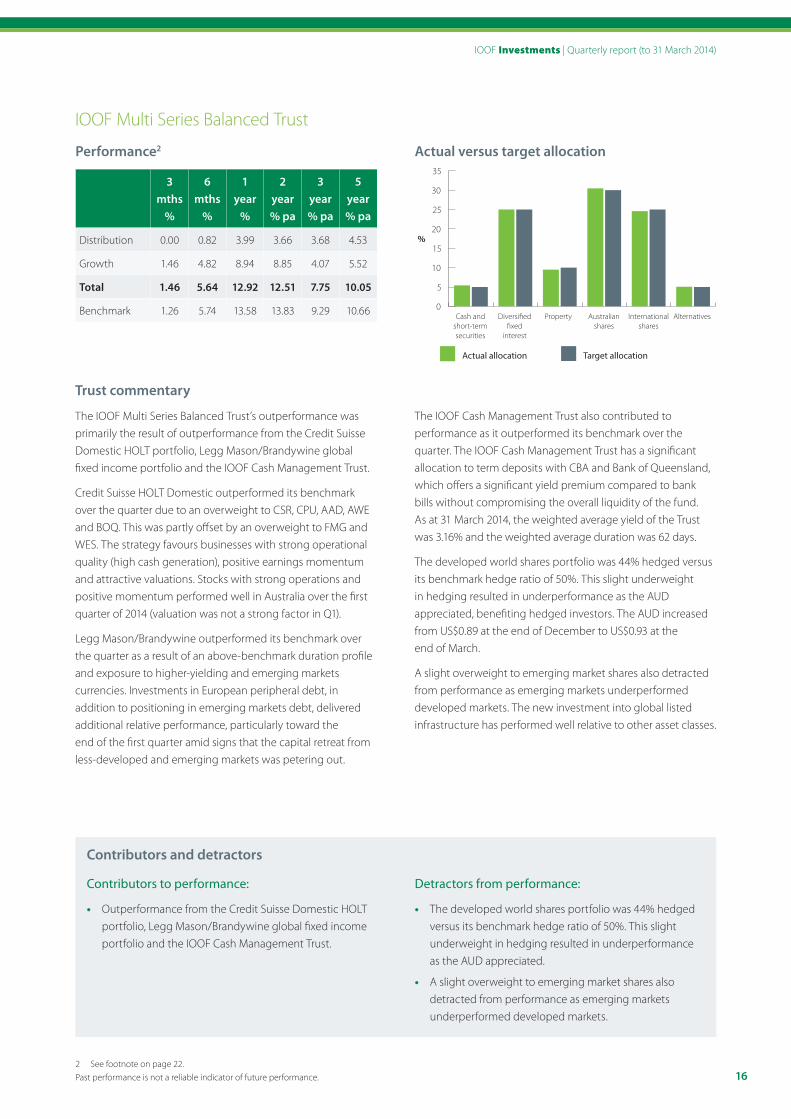
Actual versus target allocation
0
5
10
15
20
25
30
35
Actual allocation Target allocation
Cash andshort-termsecurities
%
Diversi�ed�xed
interest
Property Australianshares
Internationalshares
Alternatives
Trust commentary
The IOOF Multi Series Balanced Trust’s outperformance was primarily the result of outperformance from the Credit Suisse Domestic HOLT portfolio, Legg Mason/Brandywine global fixed income portfolio and the IOOF Cash Management Trust.
Credit Suisse HOLT Domestic outperformed its benchmark over the quarter due to an overweight to CSR, CPU, AAD, AWE and BOQ. This was partly offset by an overweight to FMG and WES. The strategy favours businesses with strong operational quality (high cash generation), positive earnings momentum and attractive valuations. Stocks with strong operations and positive momentum performed well in Australia over the first quarter of 2014 (valuation was not a strong factor in Q1).
Legg Mason/Brandywine outperformed its benchmark over the quarter as a result of an above-benchmark duration profile and exposure to higher-yielding and emerging markets currencies. Investments in European peripheral debt, in addition to positioning in emerging markets debt, delivered additional relative performance, particularly toward the end of the first quarter amid signs that the capital retreat from less-developed and emerging markets was petering out.
The IOOF Cash Management Trust also contributed to performance as it outperformed its benchmark over the quarter. The IOOF Cash Management Trust has a significant allocation to term deposits with CBA and Bank of Queensland, which offers a significant yield premium compared to bank bills without compromising the overall liquidity of the fund. As at 31 March 2014, the weighted average yield of the Trust was 3.16% and the weighted average duration was 62 days.
The developed world shares portfolio was 44% hedged versus its benchmark hedge ratio of 50%. This slight underweight in hedging resulted in underperformance as the AUD appreciated, benefiting hedged investors. The AUD increased from US$0.89 at the end of December to US$0.93 at the end of March.
A slight overweight to emerging market shares also detracted from performance as emerging markets underperformed developed markets. The new investment into global listed infrastructure has performed well relative to other asset classes.
Contributors and detractors
Contributors to performance:
• Outperformance from the Credit Suisse Domestic HOLT portfolio, Legg Mason/Brandywine global fixed income portfolio and the IOOF Cash Management Trust.
Detractors from performance:
• The developed world shares portfolio was 44% hedged versus its benchmark hedge ratio of 50%. This slight underweight in hedging resulted in underperformance as the AUD appreciated.
• A slight overweight to emerging market shares also detracted from performance as emerging markets underperformed developed markets.
2 See footnote on page 22.Past performance is not a reliable indicator of future performance.
17
IOOF Balanced Investor Trust
Performance2
3 mths
%
6 mths
%
1 year
%
2 year % pa
3 year % pa
5 year % pa
Distribution 0.00 - - - - -
Growth 2.14 - - - - -
Total 2.14 - - - - -
Benchmark 1.26 - - - - -
Actual versus target allocation
0
5
10
15
20
25
30
Actual allocation Target allocation
Cash andshort-termsecurities
%
Diversi�ed�xed
interest
Property Australianshares
Internationalshares
Alternatives
Trust commentary
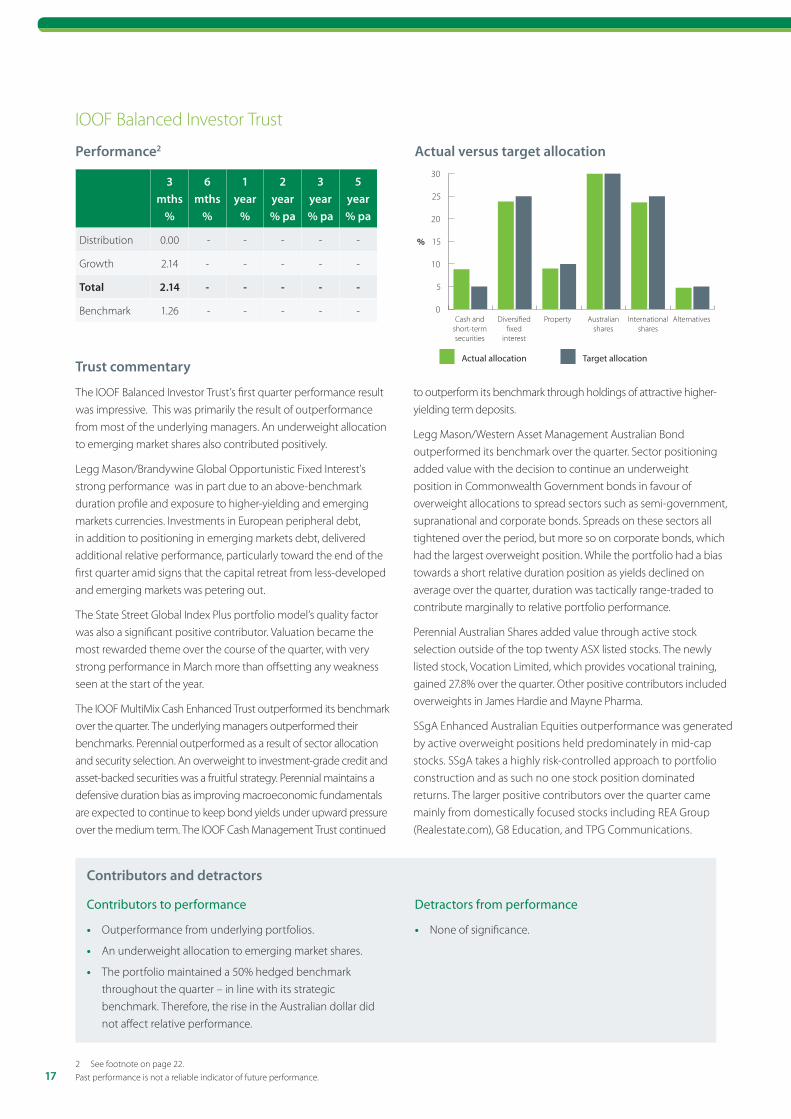
The IOOF Balanced Investor Trust’s first quarter performance result was impressive. This was primarily the result of outperformance from most of the underlying managers. An underweight allocation to emerging market shares also contributed positively.
Legg Mason/Brandywine Global Opportunistic Fixed Interest's strong performance was in part due to an above-benchmark duration profile and exposure to higher-yielding and emerging markets currencies. Investments in European peripheral debt, in addition to positioning in emerging markets debt, delivered additional relative performance, particularly toward the end of the first quarter amid signs that the capital retreat from less-developed and emerging markets was petering out.
The State Street Global Index Plus portfolio model’s quality factor was also a significant positive contributor. Valuation became the most rewarded theme over the course of the quarter, with very strong performance in March more than offsetting any weakness seen at the start of the year.
The IOOF MultiMix Cash Enhanced Trust outperformed its benchmark over the quarter. The underlying managers outperformed their benchmarks. Perennial outperformed as a result of sector allocation and security selection. An overweight to investment-grade credit and asset-backed securities was a fruitful strategy. Perennial maintains a defensive duration bias as improving macroeconomic fundamentals are expected to continue to keep bond yields under upward pressure over the medium term. The IOOF Cash Management Trust continued
to outperform its benchmark through holdings of attractive higher-yielding term deposits.
Legg Mason/Western Asset Management Australian Bond outperformed its benchmark over the quarter. Sector positioning added value with the decision to continue an underweight position in Commonwealth Government bonds in favour of overweight allocations to spread sectors such as semi-government, supranational and corporate bonds. Spreads on these sectors all tightened over the period, but more so on corporate bonds, which had the largest overweight position. While the portfolio had a bias towards a short relative duration position as yields declined on average over the quarter, duration was tactically range-traded to contribute marginally to relative portfolio performance.
Perennial Australian Shares added value through active stock selection outside of the top twenty ASX listed stocks. The newly listed stock, Vocation Limited, which provides vocational training, gained 27.8% over the quarter. Other positive contributors included overweights in James Hardie and Mayne Pharma.
SSgA Enhanced Australian Equities outperformance was generated by active overweight positions held predominately in mid-cap stocks. SSgA takes a highly risk-controlled approach to portfolio construction and as such no one stock position dominated returns. The larger positive contributors over the quarter came mainly from domestically focused stocks including REA Group (Realestate.com), G8 Education, and TPG Communications.
Contributors and detractors
Contributors to performance
• Outperformance from underlying portfolios.
• An underweight allocation to emerging market shares.
• The portfolio maintained a 50% hedged benchmark throughout the quarter – in line with its strategic benchmark. Therefore, the rise in the Australian dollar did not affect relative performance.
Detractors from performance
• None of significance.
2 See footnote on page 22.Past performance is not a reliable indicator of future performance.
18
IOOF Investments | Quarterly report (to 31 March 2014)
Cash and fixed interest
Position
Overweight to cash/short duration strategies, underweight to fixed interest.
Rationale
Our view is that Australian and US Government bond yields are very expensive, despite the recent increase. The US ten-year Government bond yield as at end of March was 2.72% and remains unsustainably low. Enhanced cash and income securities currently have a high running yield with little duration risk, making it more attractive than fixed interest. The main near-term risk of higher yields is that sentiment has moved to an extreme, creating the potential for a market reversal.
Current status
Since inception, the tilt to cash has underperformed as global bonds continue to produce positive returns. The underperformance, however, is somewhat mitigated by strong performance from the underlying cash managers, and strong returns from the IOOF Income Trust.
For the March quarter, the IOOF Income Trust returned 1.52% and the Perennial Enhanced Cash Trust returned 1.05% versus the diversified fixed interest strategic benchmark return of 2.06%.
International shares
Position
Tilt towards unhedged international shares from Australian shares. Tilt only in place for IOOF MultiMix Growth Trust, and has been reduced for IOOF MultiMix Balanced Growth Trust.
Rationale
While both Australian and international shares looked cheap on various valuation metrics, we believed international shares showed better value, particularly in the US. In addition, the high AUD made investing offshore more attractive. Unhedged international shares also provides for a natural hedge. If share markets fall, the Australian dollar tends to fall with it (as it is considered a risk asset), thus providing a hedge to investors.
Current status
Since inception, the tilt to unhedged international shares has outperformed due to both the international share markets outperforming the Australian share market, and a sharp decline in the AUD.
For the March quarter, the unhedged international shares benchmark underperformed the Australian shares benchmark by -4.55% (-2.56% versus 1.99%).
Currency
Position
The hedged benchmark is currently 10% of the developed equities portfolio. This remains below our strategic benchmark of 50%.
Rationale
The key reasons for this continued position are:
• continued and entrenched weakness in the terms of trade and commodity prices – an overarching driver of Australia’s prospects in general and of the currency in particular
• persistent downside risks associated with an end to the resources boom and associated capital investment
• the lagged negative effects of an extended period of currency overvaluation on domestic industries
• the looming prospect of low nominal national income growth meaningfully lagging Australian real GDP.
Current status
An appreciation of the Australian dollar over the March 2014 quarter meant that an unhedged position underperformed versus a hedged position. The hedged benchmark was moved from 0% to 10% of the international shares portfolio at the end of December 2013, but we remain below our 50% strategic benchmark for the reasons described above and are continuously monitoring the tilt.
For the March quarter, the unhedged developed international shares benchmark underperformed the hedged developed international shares benchmark by -3.87% (-2.40% versus 1.47%).
Strategic tilting update
19
Market outlook
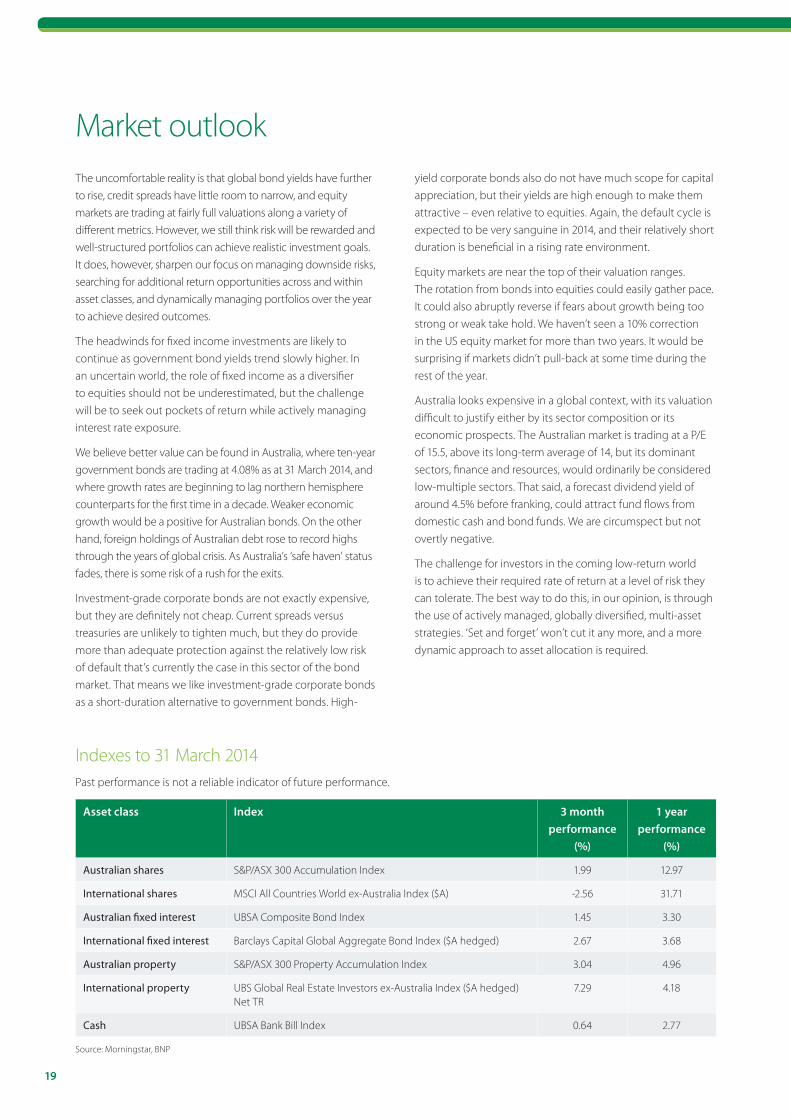
Indexes to 31 March 2014Past performance is not a reliable indicator of future performance.
Asset class Index 3 month performance
(%)
1 year performance
(%)
Australian shares S&P/ASX 300 Accumulation Index 1.99 12.97
International shares MSCI All Countries World ex-Australia Index ($A) -2.56 31.71
Australian fixed interest UBSA Composite Bond Index 1.45 3.30
International fixed interest Barclays Capital Global Aggregate Bond Index ($A hedged) 2.67 3.68
Australian property S&P/ASX 300 Property Accumulation Index 3.04 4.96
International property UBS Global Real Estate Investors ex-Australia Index ($A hedged) Net TR
7.29 4.18
Cash UBSA Bank Bill Index 0.64 2.77
Source: Morningstar, BNP
The uncomfortable reality is that global bond yields have further to rise, credit spreads have little room to narrow, and equity markets are trading at fairly full valuations along a variety of different metrics. However, we still think risk will be rewarded and well-structured portfolios can achieve realistic investment goals. It does, however, sharpen our focus on managing downside risks, searching for additional return opportunities across and within asset classes, and dynamically managing portfolios over the year to achieve desired outcomes.
The headwinds for fixed income investments are likely to continue as government bond yields trend slowly higher. In an uncertain world, the role of fixed income as a diversifier to equities should not be underestimated, but the challenge will be to seek out pockets of return while actively managing interest rate exposure.
We believe better value can be found in Australia, where ten-year government bonds are trading at 4.08% as at 31 March 2014, and where growth rates are beginning to lag northern hemisphere counterparts for the first time in a decade. Weaker economic growth would be a positive for Australian bonds. On the other hand, foreign holdings of Australian debt rose to record highs through the years of global crisis. As Australia’s ‘safe haven’ status fades, there is some risk of a rush for the exits.
Investment-grade corporate bonds are not exactly expensive, but they are definitely not cheap. Current spreads versus treasuries are unlikely to tighten much, but they do provide more than adequate protection against the relatively low risk of default that’s currently the case in this sector of the bond market. That means we like investment-grade corporate bonds as a short-duration alternative to government bonds. High-
yield corporate bonds also do not have much scope for capital appreciation, but their yields are high enough to make them attractive – even relative to equities. Again, the default cycle is expected to be very sanguine in 2014, and their relatively short duration is beneficial in a rising rate environment.
Equity markets are near the top of their valuation ranges. The rotation from bonds into equities could easily gather pace. It could also abruptly reverse if fears about growth being too strong or weak take hold. We haven’t seen a 10% correction in the US equity market for more than two years. It would be surprising if markets didn’t pull-back at some time during the rest of the year.
Australia looks expensive in a global context, with its valuation difficult to justify either by its sector composition or its economic prospects. The Australian market is trading at a P/E of 15.5, above its long-term average of 14, but its dominant sectors, finance and resources, would ordinarily be considered low-multiple sectors. That said, a forecast dividend yield of around 4.5% before franking, could attract fund flows from domestic cash and bond funds. We are circumspect but not overtly negative.
The challenge for investors in the coming low-return world is to achieve their required rate of return at a level of risk they can tolerate. The best way to do this, in our opinion, is through the use of actively managed, globally diversified, multi-asset strategies. ‘Set and forget’ won’t cut it any more, and a more dynamic approach to asset allocation is required.
20
IOOF Investments | Quarterly report (to 31 March 2014)
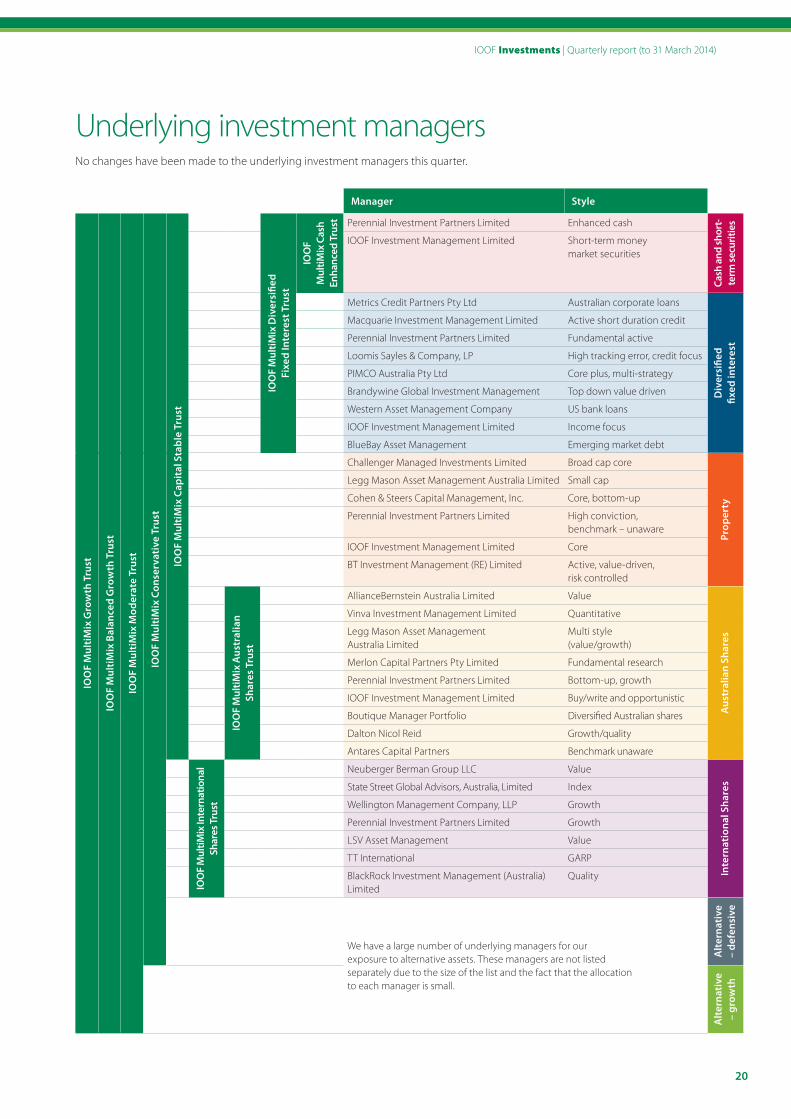
Underlying investment managersNo changes have been made to the underlying investment managers this quarter.
Manager Style
IOO
F M
ulti
Mix
Gro
wth
Tru
st
IOO
F M
ulti
Mix
Bal
ance
d G
row
th T
rust
IOO
F M
ulti
Mix
Mod
erat
e Tr
ust
IOO
F M
ulti
Mix
Con
serv
ativ
e Tr
ust
IOO
F M
ulti
Mix
Cap
ital
Sta
ble
Trus
t
IOO
F M
ultiM
ix D
iver
sifie
d
Fixe
d In
tere
st T
rust
IOO
F
Mul
tiMix
Cas
h En
hanc
ed T
rust Perennial Investment Partners Limited Enhanced cash
Cash
and
shor
t-te
rm se
curit
ies
IOOF Investment Management Limited Short-term money market securities
Metrics Credit Partners Pty Ltd Australian corporate loans
Div
ersi
fied
fixed
inte
rest
Macquarie Investment Management Limited Active short duration credit
Perennial Investment Partners Limited Fundamental active
Loomis Sayles & Company, LP High tracking error, credit focus
PIMCO Australia Pty Ltd Core plus, multi-strategy
Brandywine Global Investment Management Top down value driven
Western Asset Management Company US bank loans
IOOF Investment Management Limited Income focus
BlueBay Asset Management Emerging market debt
Challenger Managed Investments Limited Broad cap core
Prop
erty
Legg Mason Asset Management Australia Limited Small cap
Cohen & Steers Capital Management, Inc. Core, bottom-up
Perennial Investment Partners Limited High conviction, benchmark – unaware
IOOF Investment Management Limited Core
BT Investment Management (RE) Limited Active, value-driven, risk controlled
IOO
F M
ultiM
ix A
ustr
alia
n
Shar
es T
rust
AllianceBernstein Australia Limited Value
Aus
tral
ian
Shar
es
Vinva Investment Management Limited Quantitative
Legg Mason Asset Management Australia Limited
Multi style (value/growth)
Merlon Capital Partners Pty Limited Fundamental research
Perennial Investment Partners Limited Bottom-up, growth
IOOF Investment Management Limited Buy/write and opportunistic
Boutique Manager Portfolio Diversified Australian shares
Dalton Nicol Reid Growth/quality
Antares Capital Partners Benchmark unaware
IOO
F M
ultiM
ix In
tern
atio
nal
Shar
es T
rust
Neuberger Berman Group LLC Value
Inte
rnat
iona
l Sha
resState Street Global Advisors, Australia, Limited Index
Wellington Management Company, LLP Growth
Perennial Investment Partners Limited Growth
LSV Asset Management Value
TT International GARP
BlackRock Investment Management (Australia) Limited
Quality
We have a large number of underlying managers for our exposure to alternative assets. These managers are not listed separately due to the size of the list and the fact that the allocation to each manager is small.
Alt
erna
tive
–
defe
nsiv
eA
lter
nati
ve
– gr
owth
21
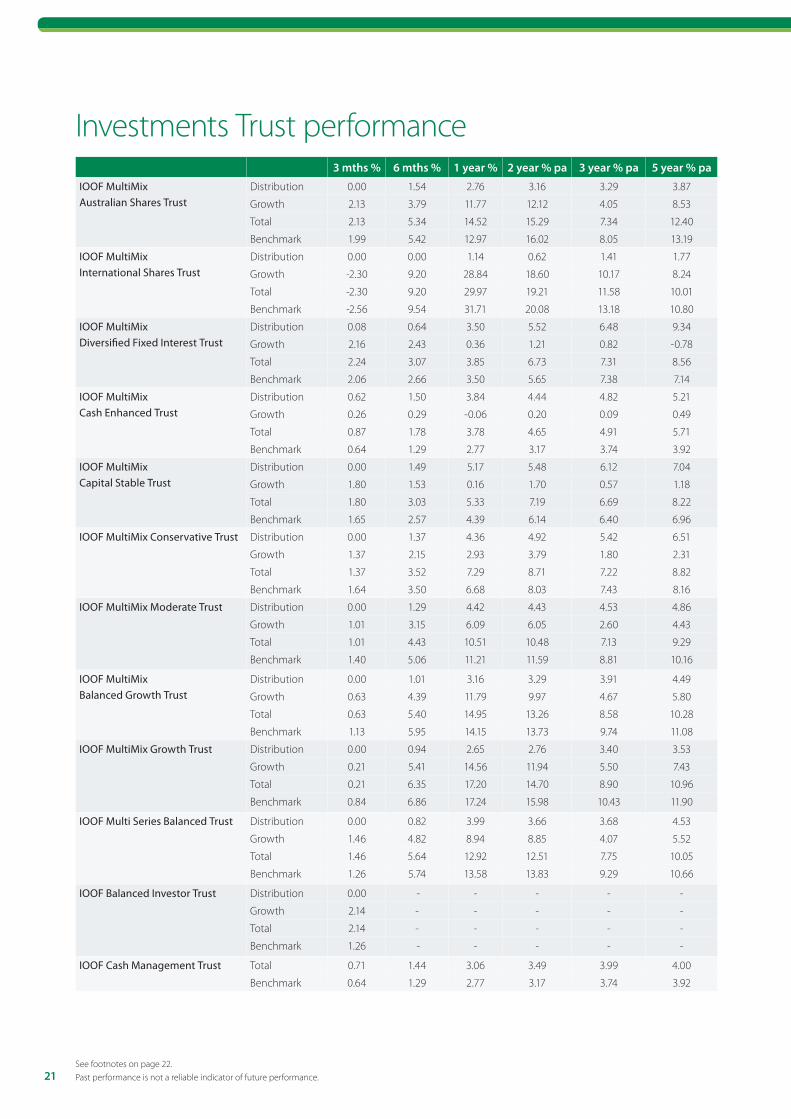
Investments Trust performance3 mths % 6 mths % 1 year % 2 year % pa 3 year % pa 5 year % pa
IOOF MultiMix Australian Shares Trust
Distribution 0.00 1.54 2.76 3.16 3.29 3.87
Growth 2.13 3.79 11.77 12.12 4.05 8.53
Total 2.13 5.34 14.52 15.29 7.34 12.40
Benchmark 1.99 5.42 12.97 16.02 8.05 13.19
IOOF MultiMix International Shares Trust
Distribution 0.00 0.00 1.14 0.62 1.41 1.77
Growth -2.30 9.20 28.84 18.60 10.17 8.24
Total -2.30 9.20 29.97 19.21 11.58 10.01
Benchmark -2.56 9.54 31.71 20.08 13.18 10.80
IOOF MultiMix Diversified Fixed Interest Trust
Distribution 0.08 0.64 3.50 5.52 6.48 9.34
Growth 2.16 2.43 0.36 1.21 0.82 -0.78
Total 2.24 3.07 3.85 6.73 7.31 8.56
Benchmark 2.06 2.66 3.50 5.65 7.38 7.14
IOOF MultiMix Cash Enhanced Trust
Distribution 0.62 1.50 3.84 4.44 4.82 5.21
Growth 0.26 0.29 -0.06 0.20 0.09 0.49
Total 0.87 1.78 3.78 4.65 4.91 5.71
Benchmark 0.64 1.29 2.77 3.17 3.74 3.92
IOOF MultiMix Capital Stable Trust
Distribution 0.00 1.49 5.17 5.48 6.12 7.04
Growth 1.80 1.53 0.16 1.70 0.57 1.18
Total 1.80 3.03 5.33 7.19 6.69 8.22
Benchmark 1.65 2.57 4.39 6.14 6.40 6.96
IOOF MultiMix Conservative Trust
Distribution 0.00 1.37 4.36 4.92 5.42 6.51
Growth 1.37 2.15 2.93 3.79 1.80 2.31
Total 1.37 3.52 7.29 8.71 7.22 8.82
Benchmark 1.64 3.50 6.68 8.03 7.43 8.16
IOOF MultiMix Moderate Trust
Distribution 0.00 1.29 4.42 4.43 4.53 4.86
Growth 1.01 3.15 6.09 6.05 2.60 4.43
Total 1.01 4.43 10.51 10.48 7.13 9.29
Benchmark 1.40 5.06 11.21 11.59 8.81 10.16
IOOF MultiMix Balanced Growth Trust
Distribution 0.00 1.01 3.16 3.29 3.91 4.49
Growth 0.63 4.39 11.79 9.97 4.67 5.80
Total 0.63 5.40 14.95 13.26 8.58 10.28
Benchmark 1.13 5.95 14.15 13.73 9.74 11.08
IOOF MultiMix Growth Trust
Distribution 0.00 0.94 2.65 2.76 3.40 3.53
Growth 0.21 5.41 14.56 11.94 5.50 7.43
Total 0.21 6.35 17.20 14.70 8.90 10.96
Benchmark 0.84 6.86 17.24 15.98 10.43 11.90
IOOF Multi Series Balanced Trust
Distribution 0.00 0.82 3.99 3.66 3.68 4.53
Growth 1.46 4.82 8.94 8.85 4.07 5.52
Total 1.46 5.64 12.92 12.51 7.75 10.05
Benchmark 1.26 5.74 13.58 13.83 9.29 10.66
IOOF Balanced Investor Trust
Distribution 0.00 - - - - -
Growth 2.14 - - - - -
Total 2.14 - - - - -
Benchmark 1.26 - - - - -
IOOF Cash Management Trust Total 0.71 1.44 3.06 3.49 3.99 4.00
Benchmark 0.64 1.29 2.77 3.17 3.74 3.92
See footnotes on page 22. Past performance is not a reliable indicator of future performance.

22
IOOF Investments | Quarterly report (to 31 March 2014)
Notes to the quarterly report
1. This fee currently includes the investment management fee and expense recoveries (excluding any unusual or non-recurrent expenses). Fees paid to underlying investment managers (excluding any applicable performance fees) are currently paid out of the investment management fees and are not an additional charge to investors. Performance fees may be charged by the underlying investment managers of the IOOF MultiMix Trusts from time to time. The management costs for the IOOF MultiMix Trusts (listed on page 3) excludes estimated performance fees. Any performance fees incurred will be an additional cost. Please refer to the IOOF MultiMix Trust RPDS, IOOF Multi Series Balanced Trust PDS and the IOOF Cash Management Trust PDS for full details on fees and costs.
2. Performance is net of management costs and expenses. Performance is based on exit price to exit price for the period and assumes that all distributions are reinvested. Management costs and other expenses are accounted for in the exit price. Past performance is not a reliable indicator of future performance.
Full details of the benchmarks used are provided in the IOOF MultiMix RPDS, IOOF Multi Series PDS and IOOF Cash Management Trust PDS.
Important Note
This document is for financial adviser use only – it is not to be distributed to clients.
Issued by IOOF Investment Management Limited (IIML) ABN 53 006 695 021, AFS Licence No. 230524, as Responsible Entity for the IOOF MultiMix Trusts, IOOF Multi Series Balanced Trust and the IOOF Cash Management Trust. IIML is a company within the IOOF group of companies which consists of IOOF Holdings Ltd ABN 49 100 103 722 and its related bodies corporate. IIML’s contact details can be found on www.ioof.com.au.
A copy of the relevant Product Disclosure Statement should be obtained from us and considered before an investment decision is made. Ratings are only one factor to be taken into account when deciding whether to invest. For more information on the meaning of the credit ratings used, please refer to the Standard & Poor’s website at www.standardandpoors.com. Examples are illustrative only and are subject to the assumptions and qualifications disclosed. Past performance is not a reliable indicator of future performance. This document has been based on information believed to be accurate and reliable at the time of publication, however to the extent permitted by law, no liability is accepted for any loss or damage incurred as a result of any reliance on the information it contains.

IOOF MultiMix
Accelerate with confidence
In today’s world it’s hard enough just maintaining business momentum. How can you accelerate it? And how can you be confident that you’re using your time effectively and still providing a genuine investment solution to your clients? The answer to both questions is IOOF MultiMix: the investment management solution that cuts time not corners. With IOOF’s extensive experience and a premier investment team with a dedicated portfolio manager for each asset class, MultiMix adds value on three fronts – active asset allocation, active management of high quality managers and active risk management. Our processes have been crash-tested and fine-tuned over decades and we undertake rigorous stress-testing. Our outcomes speak for themselves. So if you’re ready to pick up the pace, then pick up the phone.
Call IOOF Adviser Services on 1800 659 634 or go to ioof.com.au/multimix.
For adviser use only – not to be distributed to clients. IOOF Investment Management Limited (IIML), ABN 53 006 695 021, AFS Licence No. 230524 is the issuer and the Responsible Entity of the IOOF MultiMix Trusts. IIML is an entity within the IOOF group of companies. The IOOF group consists of IOOF Holdings Ltd, ABN 49 100 103 722, and its related bodies corporate. Past performance is not a reliable indicator of future performance. IN
V-23
4