
· It draws extensively on joint work with Richard Blundell, ... Richard Freeman, Richard Layard...
39
"# $#%& ’()**+ ’,-&$&’./,0)*& 1/2#3% $/%(&0 4#1),)&’ /"5 0-& 2%)0)’- "&6 5&/1 7#% 0-& +#3"8 3"&$41#+&5 )" ,#"0&90 "#$% &’% ())%)% 0-& )"’0)030& 7#% 7)’,/1 ’035)&’ 64:;<:=
Transcript of · It draws extensively on joint work with Richard Blundell, ... Richard Freeman, Richard Layard...

!!
!"#!$#%&!'()**+!',-&$&'.!/,0)*&!1/2#3%!$/%(&0!4#1),)&'!/"5!0-&!2%)0)'-!"&6!5&/1!
7#%!0-&!+#3"8!3"&$41#+&5!)"!,#"0&90!!!
"#$%!&'%!())%)%!!!!
!0-&!)"'0)030&!7#%!7)',/1!'035)&'!
64:;<:=!
1
No More Skivvy Schemes? Active Labour Market Policies and the British New Deal for the
Young Unemployed in Context
John Van Reenen1
May 5th 2001
Abstract The British New Deal for Young People began in January 1998. After 6 months of unemployment, 18-24 year olds enter a `Gateway’ period where they are given extensive job search assistance. If they are unable to obtain an unsubsidised job, then they can enter one of four New Deal options. One of these is a job subsidy (“employers’ option”), the others involve full-time education and training, government-provided employment (“environmental task force”) or voluntary work. In this paper I evaluate the New Deal in a historical and international context. The toughening of the work search criterion has evolved since the Restart initiative in 1986. Using either the age-related eligibility criteria and/or a comparison of pilot and non-pilot areas results suggest that there has been a significant increase in outflows to employment due to the New Deal. Unemployed young men are now about 20% more likely to get jobs as a result of the policy (the stock of youth employment is about 17,000 higher than it would be without the New Deal). Much of this effect is likely to be because of the take up of the employer wage subsidy, but at least a fifth of the effect is due to enhanced job search. Taken as a whole I conclude that the social benefits of the New Deal outweigh the costs. Keywords: Labour Market Programme evaluation, job search, wage subsidy, Difference in Differences JEL Classifications: J18, J23, J38 Acknowledgements This paper was prepared for the NBER conference “Seeking a Premier League Economy”. It draws extensively on joint work with Richard Blundell, Costas Meghir, Monica Costa Dias. Michal Myck and Tom Clark have both helped with the calculations. Finance came from Leverhulme Trust. The author is very grateful to comments by all participants especially David Card, Paul Gregg, Marty Feldstein, Richard Freeman, Richard Layard and Howard Reed. The usual disclaimer applies. On-line information about the New Deal is available at www.newdeal.gov.uk.
1 University College London and Institute for Fiscal Studies, [email protected]

2
1. Introduction On March 14th 2001 the number of British people claiming unemployment benefit fell below one million for the first time in twenty-five years. To celebrate the event, the Prime Minister Tony Blair, gave a speech on the New Deal. “Nobody says to me they’re on a skivvy scheme. The sort of language used about employment programs in the 1980s is not used about the New Deal” This paper addresses two questions. How does Labour’s flagship employment policy represents a break from the past – and has it worked? In the 1980s and 1990s UK governments introduced major changes in the levels and conditions for receipt of unemployment benefits. I examine the effects of a large labour market programme that was introduced (initially in pilot form) in January 1998, the year after the election of the new Labour Government. The New Deal involves a cluster of different policies designed to getting the young unemployed back to work. Since April 1998 all individuals aged between 18 and 24 who have claimed unemployment benefit (“Job Seekers Allowance”) enter the New Deal program. There are two stages. First there is a `Gateway’ period where the claimant is given intensive help with job search. Those who do not secure an unsubsidised job during this stage go onto the second stage of New Deal options that includes subsidised full-time training/education, a wage subsidy paid to the employer, voluntary work or the Environmental Task Force (government provided employment). It is a mandatory programme - there is no “fifth option” of remaining on benefit. In this paper I focus on evaluating the success of the programme in moving people into jobs. In the short-run this occurs in two main ways. First, there is enhanced job search monitored by a two-weekly meeting with a personal advisor. Job search could be increased by (a) the more credible threat of benefit sanctions, (b) the provision of a greater quality and quantity of information on vacancies, (c) the psychological effect of being “connected” again with the labour market. Secondly, the wage subsidy reduces the cost to the employer of taking on an unemployed person (by about 40-50%). The job search aspect has many antecedents in benefit reforms initiated under the previous Conservative administration. In particular, the RESTART initiative in 1986 began a new era of increased monitoring of the unemployed (see section 3). The New Deal has continued this tightening up of the work search criteria, but combined it with much more generous funding of job search assistance and subsidised options. For young people there is now effectively a time limit on benefit receipt. The wage subsidy element also has antecedents in Britain (and elsewhere) that I discuss briefly in section 3.5. I draw on results using a simple difference in difference approach exploiting two sources of identification. The eligibility for the New Deal is age related, so

3
we can compare outflows by different age groups before and after the New Deal was introduced. Additionally, the New Deal was introduced earlier in some areas, so we can compared young people in these pilot areas to young people in non-pilot areas. There are numerous factors that may bias these estimates that are discussed including selectivity, differential macro trends, job quality, substitution and general equilibrium effects. I have some things to say about the other parts of the New Deal program, but the truth is that it is still early days. The long-run success of the programme will depend on its ability to enhance the productivity and employability of people going through the options (e.g. the training option). Publicly available data at the time of writing ends in mid-1999 so we are only just starting to observe the labour market performance of those leaving the twelve-month education and training options. The results suggest that the reforms have successfully increased net employment for the target group. Young unemployed men are about 20 per cent more likely per period to gain jobs as a result of the New Deal (i.e. the probability of obtaining a job has rose from about 5 per cent a month to 6 per cent a month). A substantial part of the effect is attributed to the wage subsidy option, but there is also some job assistance effect. An initial cost benefit analysis suggests that the programme is worth continuing on efficiency grounds alone. The plan of the paper is as follows. Section 2 gives some background, placing the UK’s labour market in historical and comparative perspective. Section 3 gives the history and details of the reforms. Section 4 offers some results on the evaluation of the New Deal. Section 5 gives the cost benefit calculations and section 6 offers some concluding remarks. 2. General UK Labour Market Background In this section I sketch out some features of the labour market of the UK in historical and comparative perspective. Figure 1 displays the total unemployed claimant count since 1960 and Figure 2 shows the standard ILO unemployment rates from 1978 onwards. In many respects the UK is similar to other European countries. There has been a steady upward drift of unemployment since 1960, with a very large increase post 1979. Until the 1990s, the trough of each recession was associated with higher unemployment than the previous downturn. The current expansion has pushed the number of unemployed below that of the previous cycle to levels not seen since the last Labour government (1974-79). Another feature of UK unemployment is its volatility. The UK has experienced sharp boom-bust cycles. There were deep recessions in the early 1980s and early 1990s and a fast boom in the mid-late 1980s. There was a similar boom in the late 1990s/early 2000s, although the lower levels of wage and price inflation suggest a softer landing.

4
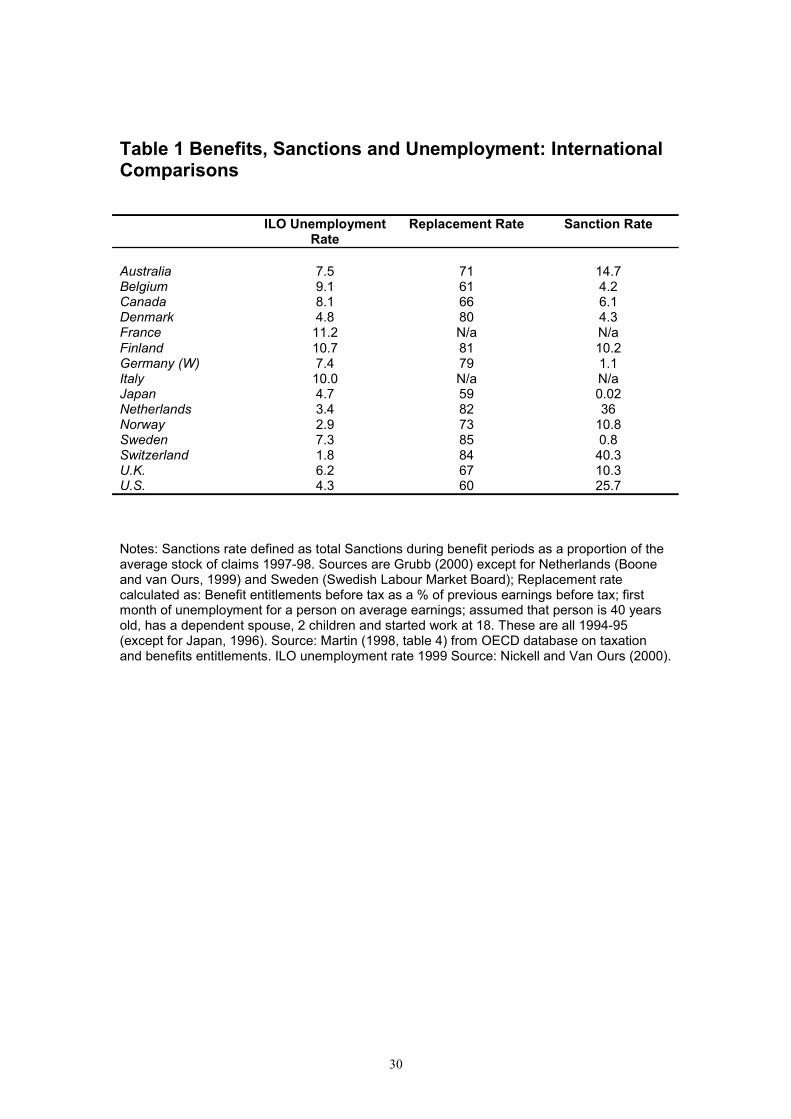
Currently UK unemployment is relatively low by OECD standards (see column 1 Table 1). This has been a relatively recent phenomenon, however. Over the 1983-96 period UK unemployment rates have been above the OECD average, certainly higher than Germany's (which has never fully recovered from the shock of re-unification in 1989) although lower than France's2. Over 1973-1984 UK unemployment was worse than the OECD average. In terms of its long-term unemployment rates, the UK appears much closer to a European country than to the US. Across all countries youth unemployment is higher than unemployment for prime age individuals. There is a relatively high proportion of young Britons in jobs and a low proportion of young people in school. There is also a large proportion of British youth that are neither in school nor in the labour force ("the idle"). The UK has the highest numbers of 18-year-old men in this category and is second (after Italy) for 22-year-old men3. Moreover, the UK has had the largest increase in the proportion of “idle” youth since 1984. Another feature of the youth labour market is its sensitivity to the business cycle. The unemployment rates of the younger group (see Figure 3) broadly mirrors the overall picture, but is more cyclically sensitive. This is also true for the employment rates (see Bell, Blundell and Van Reenen, 1999) Turning to wage rates, it is well known there has been a large increase in earnings inequality in the UK since 1979 (Schmitt, 1992; Gosling et al, 2000). This has occurred between the younger and older age groups, even within gender and skill classes. The uprating of many benefit levels (e.g. the state pension and unemployment benefit) in Britain was pegged to price inflation in 1979-80. Also there were real cuts of about 10 per cent in most means tested benefits. This has lead to a fall in the replacement rate relative to other countries (the second column of Table 1). To summarise this section somewhat boldly. The UK has enjoyed lower than average unemployment rates since the mid-late 1990s than other European countries. Over a longer time frame unemployment has been about average and more volatile than other OECD countries. Youth unemployment is slightly better than average, but there are a surprisingly large number of young people in the UK who are neither in school nor actively seeking work. Wages are relatively low for young British workers, but so are unemployment benefits.
2 Between 1983-96 OECD average unemployment was 8.2%, 9.7% in the UK 6.2% in West Germany and 10.4% in France (Nickell, 1997). 3 The proportion idle was 8.4% in the UK in 1997 compared to 2.3% in 1984. In 1997 the OECD average was 1.8%, with 5.6% in the US, 4.2% in Germany, 3.3% in France and 9.1% in Italy (see Blanchflower and Freeman, 2000)).

5
Figure 1
Claimant unemployment - total and long-term
0
500
1,000
1,500
2,000
2,500
3,000
3,500
1950
1955
1960
1965
1970
1975
1980
1985
1990
1995
Latest(thousands)
Total
Over one year
Source: Labour Market Trends and Employment Gazette, various issues
Figure 2
Unemployment - claimant and ILO measures
0
500,000
1,000,000
1,500,000
2,000,000
2,500,000
3,000,000
3,500,0001978
1980
1982
1984
1986
1988
1990
1992
1994
1996
1998
2000
Claimant unemployment
ILO unemployment
Source: Labour Market Trends and Employment Gazette, various issues

6
Figure 3
0
200,000
400,000
600,000
800,000
1,000,000
1,200,000Ja
n-62
Jan-
64
Jan-
66
Jan-
68
Jan-
70
Jan-
72
Jan-
74
Jan-
76
Jan-
78
Jan-
80
Jan-
82
Jan-
84
Jan-
86
Jan-
88
Jan-
90
Jan-
92
Jan-
94
Jan-
96
Jan-
98
Jan-
00
TotalSix months and over12 months and over
Claimant unemployment amongst 18-24 year olds
Source: Labour Market Trends and Employment Gazette, various issues Notes: Data underlying figures 1-3 is available online from www.dfee.gov.uk/statistics 3. Institutions of UK unemployment benefit regime 3.1 The New Deal in historical context Table 2 displays the evolution of the UK unemployment benefit regime. The network of the labour exchanges was first founded in 1910. They administered the first unemployment benefits from 1912. Worries about the disincentive effects of unemployment benefit persisted from its foundation. The work test was a fundamental part of the labour exchange, but was seen as more humane than the workhouses that preceded it. As Beveridge (1909) put it: “The labour exchange opens the way for `depauperisation’ more humane, less costly and more effective than that of the workhouse test – the way of making the finding of work easy instead of making relief hard” The work test requirement became less pressing during the Post-War “Golden Years” of low unemployment. From the late 1960s, however, there was a shift in attitudes towards unemployment benefits from being a temporary palliative of social insurance towards their being a more permanent redistribution from those with work to the jobless “victims”. Additionally, the Employment Service

7
decided to re-orient its role to be a service provider to employers and employees and attempted to regain a share in the market for filling vacancies. This was due to the fear that employers were losing interest in notifying Job Centres of vacancies. The Employment Service focused less on finding jobs for the difficult to place long-term unemployed. The consequence of these changes was that the work search requirements were less strictly enforced. The function of Job Centres and Benefit Offices were split in 1974 and they were increasingly located on different premises. An indicator of the relaxation in work search is the number of referrals of unemployed people suspected of not searching for work – this stood at 28,270 in 1968 and, despite a big increase in unemployment, fell to 5,603 by 1976. Surprisingly, the advent of Mrs. Thatcher’s administration actually reinforced this trend. In 1982 the compulsion to visit a Job Centre was withdrawn. Cutbacks in public expenditure reduced the numbers of staff to monitor the work search requirements and help match the unemployed with jobs4. These administrative changes plus the huge increase in unemployment in the early 1980s (see Figure 1) swamped the ability of the employment service to enforce work search. In terms of GDP the UK recession troughed in 1981, but despite 5 years of recovery, claimant unemployment only peaked in 1986 A major period of benefit reform began in 1986. The introduction of RESTART made compulsory interviews with the Employment Service a condition of benefit receipt for all those whose unemployment claims had reached a duration of twelve months or more. These were piloted in January and rolled out nationally in July. Also in 1986 the government extended the unemployment insurance disqualification period for those deemed to have left their jobs voluntarily from 6 to 13 weeks (increased to 26 weeks in 1988 and currently 6 months)5. Since this point, there has been a successive tightening of the work search requirement. In October 1986 RESTART interviews were extended to all those unemployed in excess of six months with repeated interviews every subsequent six months. In 1991 mandatory job courses for the very long-term unemployed were introduced. In 1994 the number of sanctions doubled under the “stricter benefit regime”.
4 In the early 1980s large numbers were encouraged to leave the unemployment rolls on to other forms of benefit (and therefore exit the labour market). This gave the appearance of reducing unemployment. For example, the 1983 budget allowed men over 60 to move on to a higher benefit rate if they signed off unemployment benefit and on to long-term supplementary benefit. Supplementary benefit required that the recipients did not look for work (Wells, 2000)! The numbers on invalidity benefit rose by 300,000 between 1984 and 1988. 5 RESTART also gave menu of options to help get people into work – short courses, training, job clubs and a Jobstart subsidy (a £20 bonus to the unemployed person if they took a low paid job).

8
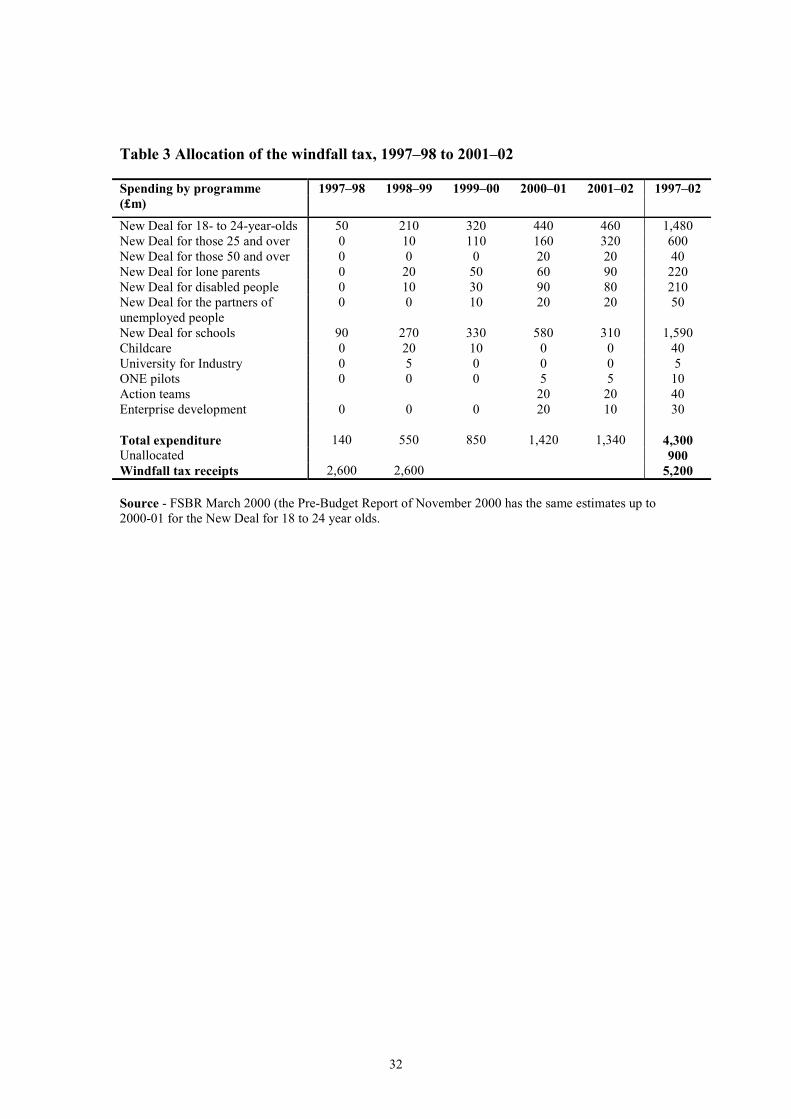
These changes were consolidated in a new legal framework under Job Seekers’ Allowance (JSA) introduced in 1996. A range of measures was introduced to improve job search (e.g. Jobseekers’ agreement, enhanced advisory interventions, the unemployed could not refuse jobs outside their own occupation after 3 months, etc) and there were more checks over eligibility. An indicator of the effect of these cumulative changes has been to reduce the proportion of people seeking work who actually claim benefit. Schmitt and Wadsworth (1999) show that in 1983 90% of ILO unemployed men (i.e. those who had actively sought work within the last two weeks) received unemployment benefit compared to 80% in 1993. Previous UK governments had experimented with wage subsidies. The common feature of these schemes was the payment of a fixed weekly subsidy, typically of around £50 or £60, for the initial months of employment of a long-term unemployed individual. This was sometimes payable to the individual (jobstart allowance and Jobmatch) and sometimes to the to the employer (Workstart). In addition, an employer's National Insurance contributions holiday for the long-term unemployed was introduced in April 1996. Prior to the New Deal none of these schemes were very well funded and all have suffered from low take up. For example, in 1996 only 1% of all UK active labour market funds were spent on wage subsidies compared to a EU average of 10% (Martin, 1998) 3.2 The elements of the New Deal The programme has been targeted at specific groups of the unemployed, with an emphasis on the young (18- to 24-year-olds), long-term unemployed (2 years or more), lone parents and disabled people. Pilots for the New Deal for young people began in January 1998 and the programme took effect at the national level from April 1998. By the end of December 2000, there were 99,200 18- to 24-year-olds on New Deal options and 68,900 young people in the Gateway/Follow through. The windfall tax on the privatised utilities raised £5.2 billion between 1997 and 1999, and all of these funds have been allocated to financing New Deals of some variety. Table 3 shows the government’s estimates of the allocation of windfall tax receipts to different elements of the programme. The New Deal for young people is projected to receive about £1.5 billion by the end of March 2002. So far, total expenditure on the New Deal has been less than initially expected due to the buoyancy of the labour market. It is tempting to simply divide the cost of the New Deal by the estimate number of new jobs in Section 4 (about 17,250) to find a “cost per job created”. This would imply that the scheme was expensive (e.g. using the estimates in section 4 about £18,550 per job in 1999-00). Such a calculation is misleading, however, as participants on the New Deal options would have been

9
claiming Job Seekers Allowance and these costs (and others) must be deducted off the gross costs in Table 4 to get an estimate of the net exchequer cost. We perform an explicit cost -benefit calculation in section 5 to address this issue. This suggests that the actual social cost per additional employee is under £4000 (£68.1m/17250) and, more importantly, that social benefits exceeded social costs.
The programme is composed of several parts, with different options offered to different groups of the unemployed. The New Deal for young people (NDYP) is compulsory for all those aged 18–24 who have been receiving the Jobseekers allowance for more than six months. Figure 4 summarises the treatment in a flow diagram. Initially, individuals enter a ‘Gateway’ period, where they are assigned a personal adviser who gives them extensive assistance with job search. If the unemployed person is still on JSA at the end of the Gateway period (formally, a maximum of four months6), they are offered up to four options:
• Entry into full-time education or training for up to 12 months for those without basic qualifications (without loss of benefits);
• A job for six months with a voluntary sector employer (paid a wage or allowance at least equal to JSA plus £400 spread over the six months);
• A job on the Environmental Task Force (paid a wage or allowance at least equal to JSA plus £400 spread over the six months);
• A subsidy to a prospective employer for six months, with training for at least one day a week (£60 per week plus an additional £750 training subsidy spread over the six months).
6 In practice the Gateway period can last for longer than the official maximum of four months.

10
Notes to figure 4: Individuals can leave the New Deal programs for an unsubsidised job at any time. More details are available online at www.newdeal.gov.uk or in DfEE(1997). If an option is refused, the claimant is liable to suffer a benefits sanction. Initially, sanctions take the form of withdrawal of benefit for two weeks, and further refusals may result in repeated four-weekly withdrawals. Individuals returning to unemployment within thirteen weeks after leaving an option go onto the ‘follow-through’ programme of job assistance, which is essentially the same as the Gateway. Individuals can enter options at any time after the sixth month of JSA. The official guidance was that the first month of the Gateway was confined to unsubsidised employment. The second month would then focus on education and training and the third month on the subsidised job option. The public employment option was only to be used as a last resort in the fourth month. In practice this schema is not rigidly adhered to. Out of the four options, education and training has been the most popular (about 40% of all those who had joined the New Deal options by the end of April 1999 chose education and training). The employer’s option had a much lower take-up than anticipated (only 20% of all those in options). The reasons for this low take-up is uncertain, but it is worth noting that low take-up have often been a problem for wage subsidy schemes in other countries. Possible reasons include: - (1) the UK economy was in a prolonged expansion. The crop of unemployed who fail to get unsubsidised jobs even after the Gateway period may have very poor basic skills making them very unattractive to employers; (2) the requirement to have formal training may impose high costs on employers; (3) the Employment service has had little experience in handling job subsidy schemes; (4) the failure to secure a job during the Gateway might generate a stigma effect on the individuals.
Figure 4: A Simplified Flow Diagram of
the New Deal Program
Jobseekers’ Allowance (6 months)
Gateway (4 months
max)
New Deal options
Follow through
Subsidised Jobs
Education and Training
Environmental Task Force
Voluntary sector
Unsubsidised Jobs
11
3.3 The effectiveness of previous UK reforms In general there has been a paucity of high quality evaluations of UK labour market reforms compared with the United States. Random assignment has encountered serious opposition due to a mixture of political and ethical objections. In this respect the UK is more typical of other European countries7. “Evaluations” typically take the form of surveys of participants. Obviously there is no obvious comparison group so any counterfactual is purely speculative. There are several macro-econometric evaluations where the policy is indicated by a set of time dummies. For example, using a time series model the Employment Service (Sweeney and McMahon, 1998) claimed that the rule changes in JSA reduced claimant unemployment by about 15,000 to 20,000. Large positive effects of RESTART were found by Dicks and Hatch (1989) and Disney et al (1991). More recently Anderson et al (1999b) found moderate effects of the New Deal using a macro approach (youth unemployment was 30,000 lower after a year of the nation-wide introduction of the New Deal). The major problem with these macro approaches is that (aside from conventional aggregation biases) there are many other macro-economic events occurring simultaneously with the introduction of labour market programs. It is extremely difficult to disentangle the programme effect from these macro shocks. For example, the UK economy experienced a very sharp upturn in the late 1980s (see Figure 2) that would have raised employment in the absence of the RESTART program. Fortunately, however, there have been useful evaluations of the RESTART initiative using micro data. In 1989 a sample of just under 9,000 individuals approaching there sixth month of unemployment were identified. Of this set a random control group of 582 were selected who were not obliged to take part in the RESTART interview. These individuals were followed up in surveys three months and nine months after their first RESTART interview (or nine months and thirteen months after the start of their benefit claim in the case of the control group). This information was matched to administrative records using their unique National Insurance (UK Social Security) numbers. Dolton and O’Neill (1996)8 analyse this data and found that the group who were randomised out of RESTART had median unemployment duration one
7 Martin (1998, p.14) recounts one leading European policy maker’s frank explanation for this absence of good evaluations: “Most of our programs are lousy! They were dreamed up quickly to give the Minister some good news to announce at a time when unemployment is rising. We do not want evaluations revealing to the general public how bad our programs are; we know this already”. 8 White and Leakey (1992) using the same data also found that RESTART significantly reduced unemployment duration, increased the probability of finding a job and increased the probability of moving into employment training. They could find no evidence that RESTART reduced the average quality of a job match either through lower wages or deteriorating job length. Surprisingly, however, there was no evidence that this effect was driven by increased job search (as measured by number of job applications, etc).

12
month longer than those who did received RESTART. They also examined the destinations of those leaving the claimant count using a competing risks model. They found that the strongest effects of RESTART came from exits into jobs rather than exits to training or non-participation. This is likely to come through the threat of benefit sanctions (they condition on the individual receiving a job offer)9. Some of the job subsidy schemes have been evaluated, but usually through surveys without a good comparison group. One analysis of the Workstart pilots (where firms received a subsidy) concluded that only 17% of the Workstart vacancies represented new employment that would not have existed without the subsidy and that much of the employment of the long-term unemployed occurred at the expense of the shorter-term unemployed (Atkinson and Meager, 1994) 3.4 The UK in international Context OECD estimates of spending on active labour market policies (ALMP) across countries between 1985 and 1996 are given in Table 4. These include administration of the public employment service (a rough proxy for resources in job assistance and job search monitoring), youth measures, training, public sector job creation, subsidised private sector jobs, and job help for the disabled. The first column simply gives ALMP as a proportion of GDP. We normalise on the unemployment rate, as countries with more unemployed are more likely to spend money on these job creation programs. Despite the rhetoric, there has not been a rise in this measure of ALMP/GDP in the OECD as a whole over this period, if anything there has been a slight decline. There is a clear difference between the main Continental European countries and the UK. France and Germany both have higher spends per unemployed person and both have increased their ALMP. The UK not only spent less, but also saw a decline over this period. Britain appears closer to the USA, Japan and Canada in this respect. The next three columns decompose the spending of ALMP into its three main components – public employment service, youth programs and government jobs. The increased toughening of work search requirements in the UK is born out by column (2) – there has been a large increase in the proportion of resources devoted to the public employment service from 22% in 1985 to 43% in 1996. This has been financed by large cutbacks in the amount spent on job creation in the public sector (from 25% to 2%) and to a lesser extent in Youth programs (from 35% to 26%). The picture is different in Continental Europe. Both France and Germany spend a larger proportion of resources on state job creation and a smaller proportion on the public employment service in 1996. The trends are also in
9 Thus it is unclear from their regressions whether RESTART also improved the arrival rate of job offers, through better information and enhanced search.
13
the opposite direction to the UK. Again the UK is closer to the US who has also increased the resources going to public employment services (25% to 39%). Unfortunately, comparative data post New Deal is not yet available. Overall spending on ALMP in the UK has almost certainly increased after 1997 and is weighted more towards the youth component today than in 1996. The level of UK unemployment benefit is low compared to most other European countries (Table 1). Offsetting this is the fact that the sanctions regime in the UK is only about average by international standards. The Netherlands, for example, has also managed to lower unemployment in the 1990s, but unlike the UK has maintained a high replacement rate. The Dutch introduced a very tough sanctions regime, however, to offset the disincentive effects of high replacement rates (see Nickell and van Ours, 2000, for a discussion). 3.5 What elements of the New Deal might work? Evidence from U.S. research The New Deal Gateway provides both job search assistance and job search monitoring (with accompanying sanctions for non-compliance). The study reported below (in Section 4) identifies a treatment effect over and above the impact of employment subsidy, but is this effect due to the “carrot” of mentoring from the personal advisor or the “stick” of a harsher benefit regime? There is a large literature on the evaluation of the US unemployment insurance (UI) system. The Social Security Act of 1935 created the U.I. system. Each state administers and implements its own system subject to Federal guidelines. In particular there is a requirement for work search monitoring, although the precise way this is implemented varies state by state. There have been several demonstration projects (randomised trials) investigating the impact of variation in the way job search monitoring and assistance impacts on the duration of claims, and recipients’ employment and earnings. Meyer (1995) offers an excellent survey of five experiments10. He finds evidence that job search monitoring and assistance together significantly reduce the duration of claims. There were less clear-cut effects on overall earnings. Unfortunately, however “This combination of additional services and tightened eligibility checks makes it difficult to determine what aspects of the experiments induced the changes in outcomes…” (Meyer, 1995, p.114). Ashenfelter, Ashmore and Dechenes (1999) attempt to tackle this problem by analysing four experiments where the treatment of stricter enforcement and verification of work search behaviour can be separated from job assistance11. They find no significant effects on claim duration from tighter monitoring. They
10 Nevada Claimant Placement Program, Charleston Claimant Placement and Work Test Demonstration, Wisconsin Eligibility Review Pilot Project, New Jersey UI Reemployment Demonstration and the Washington Alternative Work Search Experimentation. 11 These sites were in Connecticut, Massachusetts, Virginia and Tennessee.
14
conclude that although teaching unemployed people how to look better for jobs – job assistance – is effective, tougher monitoring seems ineffective. Anderson (2000) reports three further recent experiments12. Like Ashenfelter et al (1999) the Maryland study allows a distinction between job assistance and monitoring. The most stringent monitoring method wherein each of the normal two contacts a week were verified resulted in a fall in duration of 10% (about 1.5 weeks) compared to dropping of all job search monitoring. The treatments in Ashenfelter et al (1999) may have been more minor than those in the Maryland study. It is hard to generalise on the basis of so few studies, however. In our UK results (section 4), we could not find evidence that individuals were dropping off the rolls as they approached the start of the New Deal Gateway (between fifth and sixth months of an unemployment spell– see Table 7 below). If monitoring were extremely unpleasant we would have expected more claimants to stop (As appeared to happen with RESTART). If anything there is a fall in outflows as the New Deal approaches suggesting some perceived additional benefit from the New Deal (access to better jobs and training?). Thus, we are inclined to believe that it is the “carrot” rather than the “stick” that has been most effective in delivering employment increases, a view shared by the qualitative evaluations of New Deal participants (e.g. Hasluck, 2000)13. Recent work on the impact of benefit sanctions in the Dutch labour market has suggested large effects. Abbring et al (1997) and Van den Berg et al (1998) estimate that job finding rates double after the imposition of a sanction. There is also a more extensive U.S. literature on the use of wage subsidies. Both Katz (1996) and Dickert-Conlin and Holz-Eakin (2000) conclude that employer based subsidies have not proven successful. Katz argues that part of this is due to stigma effects as only the most disadvantaged are typically able to get such subsidies and this acts as a bad signal to potential employers. This may also explain why take-up rates are usually very low. Katz does find some evidence of an effect of the TJTC (targeted job tax credit) for disadvantaged youth in his own work. In section 4 I report results of using a similar methodology to Katz exploiting the age-eligibility criterion to estimate the effect of the New Deal. In this paper I do not examine the impact of the training and public sector job element of the New Deal program, due to lack of post-option data14. There is a large U.S. literature on the impact of training programs for the unemployed
12 Utah Quality Control Programme Improvement Study, Maryland UI Work Search Demonstration and the Job Search Assistance Demonstration in Florida and Washington DC. 13 Only 2% of participants in the New Deal have suffered sanctions 14 Bonjour et al (2001) look at the relative success of different New Deal options using a special survey. They find that eighteen months after entering the New Deal, the employer option had the best outcomes in terms of getting people into work.

15
and a rather smaller literature on the impact of public work programs 15. Generally, the outcomes of evaluations of training programs for young men have been disappointing16. It is worth remembering that the pool of young unemployed men in the UK is proportionately much larger than in the US so there may be greater scope for positive programme effects. The US target group of disadvantaged are more likely to be “hardcore” jobless whose human capital is very difficult to raise. 4. An Empirical Evaluation of the New Deal for Young People It is possible to examine the performance of the Gateway period of job assistance using publicly available micro data.17
We consider the treatment group to be young people with six months unemployment (continuous claims of Job Seekers Allowance). The outcome of greatest interest is the flow of this group into employment over the four months of the Gateway period (months six through ten of JSA). We also examine total outflows from unemployment over the same period (e.g. to training). Note that the New Deal treatment effect considered (the job outflow by month ten of unemployment) comprises of the effects of both the job assistance/monitoring element of the New Deal and the wage subsidy element18. It is possible to estimate a lower bound to the job assistance/subsidy element (unsubsidised jobs) as we know from administrative sources the actual proportion of the unemployed who obtained subsidised jobs (these numbers are presented in the empirical results). By deducting the proportion that flow into the subsidised jobs from the overall treatment effect one can obtain a lower bound of the pure “Gateway” effect. The true effect of job assistance is likely to be higher as some of those obtaining subsidised jobs would have obtained them even in the absence of a subsidy, despite the best efforts of the employment service to minimise this deadweight.
15 For a survey of public service employment and mandatory work see Ellwood and Welty (2000) 16 See the survey in Heckman, Lalonde and Smith (2000). The main argument is that most of these schemes fail to significantly raise the human capital of participants. A similar conclusion is reached about UK public training schemes by Dolton (1992). Previous UK training schemes have included TOPS, YTS, Employment Training and Training for Work. 17 These numbers are based on an analysis of the Joint Unemployment and Vacancies Operating System (JUVOS) data, which contain information over time for a sample of 5% of those claiming unemployment-related benefits in the UK. For more details on the analysis see Blundell, Costa Dias, Meghir and Van Reenen (2000) 18 Originally, I had hoped to deal with this problem by focusing only on the first two months of the New Deal Gateway when no one was supposed to go on the wage subsidy option. Unfortunately, the New Deal Evaluation Database showed that some people went on the employer option even in the first month of the Gateway.
16
In the absence of random assignment there are two possible ways to construct the comparison group. The first method is to exploit the fact that the New Deal was piloted in some areas ahead of the National roll out. We compare 19-24 year olds19 in the pilot areas (“Pathfinders”) to similar 19-24 year olds in non-Pathfinder areas over the same period of time before and after the introduction of the program. The second method is to examine an older age group who are ineligible for the New Deal. We choose to focus on 25-30 year olds who have been unemployed for six months as the comparison group. After the national roll out only the comparison across age groups is possible. There are many potential biases in using either of these comparison groups. Most pressing is the issue of substitution, that the older unemployed will be less likely to gain employment because employers will prefer New Deal participants (for example, firms receive a subsidy for employing a 24 year old but not a 25 year old). Consequently, using the older age group may lead us to overestimate the positive effects of the New Deal. The Pathfinder pilots vs. the non-Pathfinder pilots comparison should be informative in this regard. Substitution effects imply that we should estimate smaller effects when comparing young people in pilot vs. non-pilot areas than when we estimate using young vs. older individuals within the pilot areas. Unlike the older group young people within non-pilot areas are unlikely to be adversely effected by the New Deal. Substitution also implies that we should, ceterus paribus; expect to see the outflow rates of the older group decline in the pilot areas (where they are losing out to the younger group) compared to the non-pilot areas. A second issue is that of equilibrium wage effects. If the New Deal reduces equilibrium wage pressure (for example through increased search) then we will be underestimating the effects of the New Deal in increasing employment. The use of different comparison groups may again be informative in this context. Consider the scenario where there are no substitution effects and only equilibrium wage effects in the local labour market. In this case, comparing young people in the pilot vs. non-pilot areas will reflect some of the positive job effects associated with reduced wage pressure. Comparing young vs. older people within the Pathfinder areas will not capture the equilibrium wage effects as the job chances of both groups is improved. Thus, equilibrium wage effects imply that we should estimate larger effects when comparing young people in pilot vs. non-pilot areas than when we estimate using young vs. older individuals within the pilot areas. The bias is in the opposite direction to that of the substitution effect. Whichever comparison group is chosen, the method is to compare the difference in the outflow rates between these two groups after the New Deal began compared to the difference in the outflow rates before the New Deal started.
19 We drop 18 year olds because there has been a large increase in the participation rate in full time education for this group in recent years.

17
Table 5 contains the raw data on the outflow rates to jobs for the different groups. The data is taken from JUVOS, an administrative longitudinal database. This follows a random 5% of all individuals who have ever claimed unemployment benefits. The upper panel contains data from the pilot period and the lower panel from the national roll out. The pilot period considers those who reached six months on unemployment benefit (JSA) between January 1st 1998 and the end of March 1998 (“after the program”). I follow them fourth months later (i.e. ten months after they become unemployed). This group is compared with the same age group who reached six months on unemployment between January and March 1997 (“before the program”). The national roll out considers individuals who reached six months unemployment between April 1st 1998 and December 31st 1998 (“after the program). They are compared with the same age group between April and December 1997 (“before the program”)20. Focusing on the flows between six and ten months we can see that 19-24 year olds were 8.9 percentage points more likely to obtain jobs in the post New Deal period. In the non-pilot areas 19-24 year olds were actually less likely to get jobs (a fall of 2.1 percentage points). So the difference in difference effect is a full 11 percentage points – an extremely large increase on a pre-treatment base of 25.8 percent. The next two rows compare different possible comparison groups: “matched Pathfinder areas” (where we select areas with similar characteristics to the Pathfinder areas) and 25-30 year olds in the Pathfinder areas. The implied difference-in-difference effects are similar to the first comparison group. The lower panel of the Table 5 examines data from the National-roll out (post April 1998). The magnitude of the New Deal effect is still positive, but about half the size of that estimated for Pathfinder areas. There is an increase of 5.4 percentage points compared to the pre-programme base of 25.8 percentage points (a 5.4/25.8 = 20% increase in the outflow rate). We show below that this is due to return to a big “impact” effect in the first quarter that the New Deal is introduced. The raw difference in difference estimates in Table 5 do not correct for composition. These may be important if the composition of the groups changes systematically over time. In Table 6 we include a set of extra controls – marital status, sought occupation, region, number of past unemployment spells and the proportion of time-spent unemployed in the previous two years. The final column contains our main results. Rows (1) through (6) use data only for the pilot period. In row (1) we compare young people in pilot and non-pilot areas. In row (2) we compare young people to older people within the pilot areas. The results are similar to the raw difference in difference estimates in Table 5. The fact that the point estimates are both about 10-percentage points regardless of whether we use area or age as the comparison group is interesting. It implies that we cannot reject a simple model where there are no substitution or equilibrium wage effects of the
20 An advantage of ceasing to examine any outflows after April 1999 is that the National Minimum Wage was first introduced in April 1999. Minimum wage effects in analyses that cover this later period may confound the New Deal effects.

18
program21. It is reassuring that row (3) shows that the trends for the older groups were statistically identical in Pathfinder areas to non-Pathfinder areas. If young people were being substituted for older age groups in the pilot areas one would have expected worse outcomes for the 25-30 year olds in the pilot areas. We compare the young unemployed to a slightly older age group (31-40) in row (4) and to matched non-Pathfinder areas in row (5). These show, if anything, a slightly larger New Deal effect22. Note that 5.7% of the sample joined the subsidised job option during the programme (row 6). This enables us to put a lower bound on the effect of the job assistance element of the programme of about 5.3 percentage points (i.e. 11 -5.7). Even if none of those who were given subsidised jobs would have obtained them in the absence of the program, there remains a 5.3 percentage point outflow into unsubsidised jobs attributable to the New Deal23. If half of all subsidized jobs are deadweight then the effect of job assistance/monitoring rises to 8.15 percentage points (11-2.85). Row (8) has the results for the whole sample (this includes later time periods from the pilots and all other areas until April 1999). As in Table 5 we see that the magnitude of the New Deal effect is estimated to be half the size. This difference can be explained by an “introduction effect” of the program. If we re-estimate the effect only for the first quarter in the National rollout we find a similar effect to that in the Pathfinders. Thus we can decompose the effect of the New Deal into a first quarter effect of about 7-8 percentage points and a subsequent impact of 2.6 percentage points for (at least) the next two quarters. Other UK labour market programs have also experienced “cleaning out the register” impact effects. But these are usually thought to stem from improved administrative procedures and reductions in fraud. It is more likely that the impact effect of the New Deal came from the energising of Personal advisors in the Employment Service who greeted the New Deal with a lot of enthusiasm. This naturally diminishes over time. It would be unwise, however, to consider the lower figure post first quarter as the “steady state” effect as it is still based only on six months of data. There are many criticisms of these results that are partially taken up in Table 7. First, we examined whether the quality of job matches had deteriorated by using the outflow to jobs that lasted at least thirteen weeks as the outcome variable24. The treatment effect is very close to that for all jobs, so there is no evidence that New Deal jobs are of lower quality, on this measure at least. Secondly, it may be that individuals are delaying their exits from
21 It is also consistent with a more complex model were both of these effects cancel each other out. It may be, of course, that these effects take longer to play out due to lags of adjustment. 22 Other studies have also failed to uncover significant substitution effects in the New Deal programme (e.g. Anderson et al 1999a,b; Riley and Young, 2000) 23 The design of the programme emphasised finding unsubsidised employment when participants first entered the New Deal. So the true effect of job assistance may be close to this lower bound. The greater impact of some US/Dutch assistance schemes may have been because the target group had been employed for shorter periods of time. 24 There is, unfortunately, no information on earnings in JUVOS.

19
unemployment prior to the New Deal in order to take advantage of the generosity of the program. If this was the case one would expect to see a decline in outflows in the month before the programme starts. The third row of Table 7 shows that there are no selectivity effects between month 5 and 6 of JSA. The third experiment we consider uses outflows to all destinations as the outcome variable (row 4). The New Deal effect is much larger – double the effect on employment. But this is to be expected as a much larger proportion of individuals flow onto some kind of option (13.7 per cent of the sample in row 5). Also, the baseline proportion exiting to all destinations is much higher than to jobs alone. The analysis focuses on men because three quarters of all New Deal participants are male. We also found that the pre-New Deal outflow behaviour of 25-30 year old women was trending in a very different way from that of 19-24 year old women whereas it was similar for men. These differential trends relate to changing patterns of participation due to children. Nevertheless we can still examine the pilot vs. non-pilot experiments, as the outflow trends for young women were similar in pilot and non-pilot areas. The results are shown in row 6. The point estimates are smaller than those of men (six per cent compared to ten per cent), although the smaller sample size means that the coefficients are very imprecisely estimated. 5. Cost Benefit Calculation Any cost- benefit analysis must proceed with a large degree of caution due to the uncertainty surrounding key parameters. Nevertheless, it is important to try and put the numbers into perspective, no matter how crudely (see Appendix for more details). The analysis is forward looking – I seek to investigate whether the New Deal would be a programme that would be worth making a permanent feature of the UK labour market. One of the main benefits of the New Deal is the number of jobs (and therefore extra output) created. To estimate the number of jobs a number of assumptions have to be made regarding the counterfactual. I simulate the change in steady state for an economy that broadly matched the UK economy in 1998 when the New Deal was introduced (see Appendix for full details). The estimates from the previous section showed that the effect of the New Deal was to raise the employment outflows (see Table 5) of young men by 5.3 percentage points- an elasticity of about 0.2. I consider three main labour market states only (employment, short-term/under six months unemployment and long-term/over 6 months unemployment). I then simulate a permanent increase in monthly outflow rates from long-term unemployment to employment using this elasticity of 0.2 (keeping all the other outflow rates constant) and solve for the new steady states stocks. The stock of long-term unemployment (including those in the Gateway and on non-job options) falls

20
by about 20,000 a year and the employment level rises by 17,25025. The number of short-term unemployed rises by 2,850 since employment is higher and the outflow rate from employment to short-term unemployment is unchanged (by assumption). I use the estimates of the mean starting wages of workers on the New Deal subsidised job option from the survey in Hales et al (2000) of £3.78 per hour26, average annual earnings are just under £7300. Using this as our measure of output leads to a social benefit of £125m (row 1). On the costs side we have a gross exchequer cost in row (2) of £250m27 (about £100m in allowances for the various New Deal options, £50m for the Gateway and £100m for the resource inputs into the options). We have to deduct off (i) the fact that unemployment and other benefits were already being paid to these individuals, and (ii) those individuals that gain jobs and enjoy higher allowances will be paying some more tax. These items total £150m (row 3). In addition, some of these costs are transfers, so these will contribute only to social costs due to the excess burden of taxation (the deadweight loss involved in a higher level of taxation). Using an excess burden rate of 15% 28 this is about £15m (row 6). On the other hand, the cost of maintaining the Gateway is a real productive cost due to the diversion of resources from other parts of the economy. There are also real resource costs involved in supplying the options, but (following Layard, 2000) I assume the benefits of taking an option (e.g. the increased human capital associated with training) offset these costs. Summing the excess burden and Gateway gives a total social cost of just under £50m. This social cost is much less than social benefits of the extra output generated, so there ends up being an annual net social benefit of the programme of just over £50m. The figure is lower than that of the £100m net benefit in Layard (2000) mainly because I empirically estimate slightly smaller effects of the New Deal on unemployment and employment than those on which Layard bases his calculations. Furthermore, I use actual rather than assumed wage data. Nevertheless, I concur with his conclusion that the social benefits of the New Deal are likely to outweigh its social costs. The other two columns of Table 8 show the sensitivity of these calculations to changes in key assumptions. Column (2) assumes optimistically that average
25 Anderson et al (1999a) estimate an employment impact of 18,000 between January 1998 and October 1999. Riley and Young (2000) estimate that the New Deal for Young people has increased youth employment by 15,000 per year between March 1998 and March 2000. 26 This may be an underestimate, as it does not take into account wage growth over the year and the fact that those on the New Deal subsidy may be less productive than those who left the Gateway for an unsubsidised job. 27 This is lower than the numbers in table 3 because our analysis is in the long run. In steady state the New Deal has reduced the equilibrium number of long-term unemployed, so total costs are lower. 28 The Windfall tax on the privatised utilities may have had a smaller deadweight cost because it was a one off lump sum tax.

21
annual earnings of those getting jobs from the New Deal are £8500. This increases the net benefits to about £80m. The final column makes one change from the first column by pessimistically assume that the employment effect is only 15,800, (one standard error below the estimated effect in Table 6). The net benefit falls to £25m, half of that in column (1). This illustrates the importance of the magnitude of the employment effect in determining overall benefits. If the employment effect fell below 14,000 then the costs and benefits are broadly equal. This analysis probably underestimates the value of the programme for three reasons. First, it does not take into account the social benefits of reduced crime, teenage pregnancy, etc. Secondly, it does not factor in the re-distributive effects from relatively wealthy older taxpayers to the less wealthy young unemployed. Finally, we do not estimate the extent to which the New Deal programme enhances the employability and productivity of individuals who participate in the options. We merely assume that the resource input per New Dealer is not more than the present value of the benefit received. The job assistance element of the New Deal is more cost effective than the New Deal options as there is no subsidy involved. The lower bound of the job assistance/monitoring effect works out to increase steady state employment by about 8,000. Existing U.S. evaluations are rather pessimistic about the ability of temporary government jobs and training schemes to raise the long-term prospects of the young unemployed, especially young men.29 It is worth, remembering, however that the US schemes focus on extremely disadvantaged youth who may be from a comparatively lower part of the ability distribution than the New Deal participants considered here (especially for men). The success of the employment subsidy option will also hinge on the extent to which the experience of work and training will raise productivity, thereby enabling workers to keep their jobs when the subsidy runs out.30 6. Conclusions In this paper I have examined the British New Deal for the Young Unemployed. This is a major programme to enhance the employment rates of 18-24 year olds. The youth labour market is an important issue in most countries, especially in Europe where the unemployment rates of the young are well above the OECD average. In the UK there appears to be a large proportion of the young who are neither in school nor actively seeking work. The main finding is from the analysis of outflow rates to jobs before and after the introduction of the New Deal. The programme appears to have had a significant effect in moving more young people into jobs. According to our estimates, the young unemployed are 20% more likely to find jobs each
29 For a recent survey, see M. White, P. Auspos and J. Richhio (1999) 30 B. Bell, R. Blundell and J. Van Reenen (1999)
22
month. I estimate that the New Deal has lead to an increase in “steady state” youth employment of over 17,000. The New Deal should be seen as the latest step in the progressive moves in Britain to tighten the obligation to search for work whilst claiming unemployment benefit. This process began with the RESTART reform of 1986 that made work-focused interviews compulsory for those on longer unemployment durations. One important difference, however, is that the New Deal is much more generous in providing advice and hard cash (e.g. for wage subsidies and training) than previous reforms. A ‘re-engineered’ New Deal will continue if the Labour party is re-elected. The government has signalled its intention to put greater emphasis on intensifying job search and extending mandatory options for an ever-larger proportion of benefit recipients. The employers’ wage subsidy is the element that is most vulnerable to being cut, due to its low take-up. Such a cut could be premature. As this paper has shown, the wage subsidy appears to have had a significant impact on increasing jobs (at least in the first few months on the programme). The long-term success of the New Deal hinges critically upon improving employment prospects through the acquisition of better job skills, either in the Gateway period or, more likely, during one of the options. It will take some time to monitor the extent to which these dynamic gains in worker productivity really have been boosted by the New Deal. Taken as a whole, though, the programme is judged to be a modest success. Its social benefits appear to outweigh its social costs. It is not a skivvy scheme.
23
References Ashenfelter, Orley. Ashmore, David and Dechenes, Olivier (1999) “Do Unemployment Insurance Recipients actively seek work? Randomized trials in four U.S. States” National Bureau of Economic Research Working Paper 6982 Anderson, Patricia (2000) “Monitoring and Assisting Active Job Search” mimeo Dartmouth College. Anderson, B., R. Riley and G. Young (1999a), The New Deal for Young People: First Year Analysis of the Implications for the Macro-Economy, Employment Service Research and Development Paper No. 33 Anderson, B., R. Riley and G. Young (1999b), The New Deal for Young People: Early Findings from the Pathfinder areas Employment Service Research and Development Paper No. 34, Abbring, J.H., van den Berg,G. and van Ours, J. (1997) “The effect of unemployment insurance sanctions on the transition rate from unemployment to employment’ Working Paper Tinbergen Institute Adnett, N. and A. Dawson, (1996) ‘Wage subsidies and European unemployment: theory and evidence’, Economic Issues, March 1996.) Atkinson,J. and N. Meager, (1994) Evaluation of Workstart Pilots, Institute for Employment Studies, Report no. 279 Bell, B. Blundell, R. and Van Reenen, J. (1999) ‘Getting the unemployed back to work: the role of targeted wage subsidies’, International Tax and Public Finance 6, 339-360 Beveridge, W. (1909) Unemployment, A problem of industry, London: Longman’s Bishop, J. and M. Montgomery, (1993) ‘Does the targeted jobs tax credit create jobs at participating firms?’, Industrial Relations, 32, 2, 289-306 Blanchflower, D. and Freeman, R. (2000) “The declining economic status of Young Workers in OECD countries” in D. Blanchflower and R. Freeman (eds) Youth Unemployment and Joblessness in Advanced Countries, Chicago: University of Chicago Press Blundell, R., Dias, Monica, Meghir, C. and Van Reenen, J. (2000) `Evaluating the New Deal: what has been the effect of the Gateway?’ IFS mimeo

24
Bloom, H. et al., (1994) The National JTPA Study: Overview: Impacts, Benefits and Costs of Title II-A, Abt Associates, January 1994 Bonjour, D. et al (2001) “The New Deal for Young People: National Survey of Participants Stage 2” Employment Service Research and Development Paper No. 67, March. Bryson, A., Knight, G., and White, M. (2000) “New Deal for Young People: National Survey of Participants stage 1” Employment Service Report ESR44 Costa Dias, M. (2000) “A Dynamic General Equilibrium Model of A Labour Market Reform”, Institute for Fiscal Studies mimeo DfEE (1997) Design of the New Deal for 18-24 year olds, Department for Education and Employment, October Dickert-Conlin, S. and Holtz-Eakin, D. (2000) “Employee-based versus employer based subsidies to low wage workers: A Public finance perspective” ?” in Card, D. and Blank, R. Finding Jobs: Work and Welfare Reform, New York: Russell Sage Foundation Dicks, M.J. and Hatch, N. (1989) `The Relationship between employment and unemployment’, Bank of England Discussion Paper No. 39 Disney, R., Bellmann, L, Carruth, A., Franz, W., Jackman, R., Layard, R., Lehmann, H., and Philpott. J. (1991) Helping the Unemployed: Active Labour Market policies in Britain and Germany, London, Anglo-German Foundation Dolton, P. (1992) in Lynch, L . Training in the Private Sector Dolton,P. and O’Neill, D. (1996) `Unemployment Duration and the Restart Effect: Some Experimental evidence’ Economic Journal, 106, 387-400 Ellwood, D. and Welty, E. (2000) “Public Service Employment and Mandatory work: A policy whose time has come and gone and come again?” in Card, D. and Blank, R. Finding Jobs: Work and Welfare Reform, New York: Russell Sage Foundation Finn, D. (1997) Working Nation: Welfare Reform and the Australia Job Compact for the Long Term Unemployed, Unemployment Unit, London, 1997 Gosling, A., Machin, S. and Meghir , C. (2000) `The Evolution of male earnings in Britain 1984-94’ Review of Economic Studies, 67(4), 233, 635-666 Grubb, D. (1999) Making Work Pay: the role of eligibility criteria for unemployment benefits, mimeo OECD Grubb, David (2000) “Eligibility criteria for unemployment benefits” OECD presentation in Prague, July

25
Hales, J., Collins, D., Hasluck, C. and Woodland, S. (2000) “New Deals for Young People and for Long Term Unemployed: Survey of employers” Employment Service Research and Development Paper No. 58 Heckman, J. Lalonde, R. and Smith, J. (2000) “The Economics and econometrics of active labour market policies” in O. Ashenfelter and D.Card (eds) Handbook of Labor Economics Volume III Hollenbeck, K. and R. Willke, (1991) The Employment and Earnings Impact of the Targeted Job Tax Credit, Upjohn Institute for Employment Research, HM Treasury (1999), Stability and Steady Growth for Britain: Pre-Budget Report, November Katz, L. (1996), ‘Wage subsidies for the disadvantaged’, National Bureau of Economic Research, Working Paper no. 5679, July Layard, R. (1997) What Labour Can Do London: Warner Books Layard, R. (2000) “Welfare to Work and the New Deal” The Business Economist 31, 3, 28-40 Martin, John (1998) “What Works among active labour market policies: Evidence from OECD countries’ experience’ OECD mimeo Meyer, B. (1995) `Lessons from US Unemployment Insurance Experiments’ Journal of Economic Literature, 33, 1, 91-131 Nickell, S.J. (1997) “Unemployment and Labour Market Rigidities: Europe vs. North America” Journal of Economic Perspectives Nickell, S.J and van Ours, J. (2000) “The Netherlands and the United Kingdom: A European unemployment Miracle? Economic Policy, 30, 137-180 Organisation for Economic Co-operation and Development (1994), The OECD Jobs Study, Paris, Price, David (2000) Office of Hope: A history of the Employment Service, London: Policy Studies Institute Riley, R. and Young, G. (2000) “The New Deal for Young People: Implications for Employment and the Public Finances” Employment Service Research and Development Paper No. 33, December Schmitt, J. (1995) “The changing distribution of male earnings in Britain 1974-88” in R. Freeman and L. Katz (eds) Differences and changes in wage structures, Chicago: University of Chicago Press

26
Schmitt, J. and Wadsworth, J. (1999) “You won’t feel the benefit: Changing Unemployment benefit entitlements and labour market activity in Britain” Leverhulme Trust Discussion Paper Series on the labour market effects of technical and structural change No. 39 Van der Berg, G., van der Klaauw, B. and van Ours, J. (1998) “Punitive Sanctions and the transition rate from Welfare to Work” Tinbergen Institute mimeo Wells, W. (2000) “From RESTART to the New Deal in the United Kingdom” DfEE mimeo White, M. and Leakey (1992) The Restart Effect, London: Policy Studies Institute White, M. , P. Auspos and J. Richhio (1999), ‘A review of US and European literature on the micro-economic effects of labour market programmes for young people’, Employment Service Report no. 20,

27
Appendix: Cost-Benefit Analysis I perform a forward-looking analysis of the effects of the New Deal for Young people. Assuming the stock of six month plus unemployed people has been eliminated, the NDYP will have its effect on the flow of six month unemployed 18-24 year olds. I begin with our estimates of the effects of the New Deal on increasing outflows. The baseline estimate (Table 6 row 7) is that New Deal has increased the probability of leaving unemployment for a job by 0.205 (=0.053/0.258). We assume that this elasticity is true for all groups (men/women, whatever duration of unemployment over six months, etc). I perform a simulation exercise for a counterfactual economy matched to the features of the UK economy in 1998. There are three states: employment, short-term unemployment (under 6 months) and long-term unemployment (over 6 months). Individuals on the non-employer options are treated as long-term unemployed for the purpose of calculating the stocks. I assume that the labour force for young people is fixed at 1.875m. Initially there are 125,000 long-term unemployed, 250,000 short-term unemployed and 1.5m employed. With an outflow rate of 10% this implies an impact effect of an additional monthly outflow of 2,562 (=0.1*0.205*125) or 31,000 per year. In steady state, however the stocks will adjust to the new outflow rates so the equilibrium flows and stocks will be different. Under the assumption that the New Deal only impacts on the flow rate between long-term unemployment and employment we can solve for the new steady state levels of the three labour market states. Long-term unemployment falls by just over 20,088. 17,250 of these individuals enter the stock of employment and 2,840 become short-term unemployed. To compute the benefits we assume that young people who get jobs as a result of the New Deal produce an amount equal to the corresponding wage. Hales et al, 2000, survey of people on the employer option suggests an average hourly wage of £3.78. Assuming a 37-hour week this implies annual earnings of just over £7,200. So one clear benefit is the increase in employment times the wage (£142m). Other benefits include the gross output of the voluntary and environmental options and the value of training. On the cost side we have to include:
• the resource cost of the Gateway period (although there was already something like this under the previous JSA regime). These are mainly administrative costs, such as the salaries of personal advisors.
• The transfers to individuals and firms involved with New Deal options. These only matter for a social point of view because of the excess burden of taxation. This has to be calculated from the increased additional taxation necessary to finance the New Deal. There are transfer payments to employers through subsidised jobs and to participants through the other options. I assume that in steady state there are 12,000 participants on the subsidised job option. Of the “long

28
term unemployed” 72 per cent are in the Gateway or Follow-Through, 14 per cent are in the Full-Time education and Training option and 14 per cent are in the Environmental Task Force or Voluntary Sector option. These proportions approximate those in 1999. The subsidies given to each of these groups is defined by the programme (see Section 3.2). The sum of these is the gross exchequer cost. We must deduct off this the benefit payments that would have been received by young unemployed people if the New Deal did not exist. Also we should include the additional taxes received by the revenue. This net Exchequer cost is the additional tax that needs to be raised and this will have a deadweight cost associated with it. Note that the transfers themselves are not included in the social costs.
• To calculate the benefit savings one must include the annual cost of JSA (£2080) for all those on New Deal options. For those who are employed as a result of the New Deal there are also potential savings in housing benefit (£2080 on a rent of £40 per week) and council tax benefit (about £468), but not all participants on the New Deal can claim these (e.g. if they live with their parents). I extracted data on 18-24 year olds on JSA using the Family Expenditure Survey. About 40% claimed these benefits, so I weighted the value by this proportion. For the employed group I used the wage (£7,200) to calculate income tax and national insurance (about £472 and £361 respectively for those on £7300 a year). Finally, as net disposable income has risen consumption will rise and there will be a further tax take through VAT and excise duties. Taking all these elements into account implies an average tax and benefit saving of around £3600 for each person who moves off unemployment as a result of the New Deal.
• The resource costs of the options. We make the simplifying assumption that the output of the voluntary and environmental options is equal to the resource costs. One would expect that the output is rather higher. We also assume that the value of training is equal to the resource input. This is controversial as most U.S. studies find little effect of training on unemployed youth. The New Deal courses are, however, typically much longer than those in U.S. programs (up to twelve months in full-time education) so the assumption is not unreasonable.
• We have not put any value on the lost leisure time of those who were unemployed but are now productively engaged in different activities.
These calculations ignore many of the potential benefits of the Dew Deal. First, it does not take into account the social benefits of reduced crime, teenage pregnancy, etc. Secondly, it does not factor in the re-distributive effects from relatively wealthy older taxpayers to the less wealthy young unemployed. Finally, we do not estimate the extent to which the New Deal programme enhances the employability and productivity of individuals who participate in the options. We merely assume that the resource input per New Dealer is not more than the present value of the benefit received.

29
The calculations also assume that there are no substitution effects or general equilibrium effects. The former would increase the costs and the latter would increase the benefits. We did not find strong evidence of substitution or general equilibrium effects in section 4.
30
Table 1 Benefits, Sanctions and Unemployment: International Comparisons
ILO Unemployment Rate
Replacement Rate Sanction Rate
Australia 7.5 71 14.7 Belgium 9.1 61 4.2 Canada 8.1 66 6.1 Denmark 4.8 80 4.3 France 11.2 N/a N/a Finland 10.7 81 10.2 Germany (W) 7.4 79 1.1 Italy 10.0 N/a N/a Japan 4.7 59 0.02 Netherlands 3.4 82 36 Norway 2.9 73 10.8 Sweden 7.3 85 0.8 Switzerland 1.8 84 40.3 U.K. 6.2 67 10.3 U.S. 4.3 60 25.7 Notes: Sanctions rate defined as total Sanctions during benefit periods as a proportion of the average stock of claims 1997-98. Sources are Grubb (2000) except for Netherlands (Boone and van Ours, 1999) and Sweden (Swedish Labour Market Board); Replacement rate calculated as: Benefit entitlements before tax as a % of previous earnings before tax; first month of unemployment for a person on average earnings; assumed that person is 40 years old, has a dependent spouse, 2 children and started work at 18. These are all 1994-95 (except for Japan, 1996). Source: Martin (1998, table 4) from OECD database on taxation and benefits entitlements. ILO unemployment rate 1999 Source: Nickell and Van Ours (2000).

31
Table 2 Timeline of UK Unemployment Benefit Reforms Year Reform 1910, February Labour exchange network founded by Winston Churchill 1912 Unemployment benefit introduced and administered by labour exchanges 1919 All claimants had to prove “normally in employment, genuinely seeking
employment and unable to obtain it” 1946 National Insurance Act 1961 Visit Job Centre once a week (twice a week before) 1974 Benefit Office and Job Centre Split 1979 13% cut in Employment Service Staff 1980 Visit Job Centre only once every two weeks 1982 Visiting Job centre voluntary 1982-85 50 per cent cut back in numbers of staff to enforce work search (fall of 940
to 550 in Unemployment Registration Office) 1986 RESTART RESTART mandatory job-related interview; increases in staff (especially
Fraud); vacancies displayed in benefit office; verification letters sent to unemployed; maximum period of benefit disqualification extended to 13 weeks (was 6 weeks 1913-1986) January – pilots; July – nationwide for those with 1 year+ unemployment; October – extended to all with 6 months unemployment
1988 Maximum period of benefit disqualification extended to 26 weeks 1989 SOCIAL SECURITY ACT
Eligibility requirements increased over “actively seeking work” (must look every week); cannot refuse “unsuitable” jobs paying less than going rate
1990 Employment Service given more independence by being made into an “arms-length agency”; performance targets (e.g. on referrals)
1991 Mandatory one week job course for unemployed >2 years 1994/5 “Stricter benefit regime” doubles number of sanctions/referrals 1996 JOB SEEKERS’ALLOWANCE
JSA (Job Seekers’ Allowance”) – new legal framework based around Job Seekers Agreement: Visit Job Centre once every two weeks; more random checking over search; after 3 months unemployment have to search for other occupations
1997 Various compulsory programmes (1-2-1, Workwise, Project Work) 1998 NEW DEAL New Deal for Young People (pilots in January, nation roll out in April) 1998 New Deal for Long-Term unemployed – all those unemployed for over 2
years (July) 2000 New Deal announced to continue in next Parliament if Labour re-elected Source: Wells (2000), Price (2000) and Labour Market Trends, various issues. Important reforms shaded
32
Table 3 Allocation of the windfall tax, 1997–98 to 2001–02 Spending by programme 1997–98 1998–99 1999–00 2000–01 2001–02 1997–02 (£m)
New Deal for 18- to 24-year-olds 50 210 320 440 460 1,480 New Deal for those 25 and over 0 10 110 160 320 600 New Deal for those 50 and over 0 0 0 20 20 40 New Deal for lone parents 0 20 50 60 90 220 New Deal for disabled people 0 10 30 90 80 210 New Deal for the partners of unemployed people
0 0 10 20 20 50
New Deal for schools 90 270 330 580 310 1,590 Childcare 0 20 10 0 0 40 University for Industry 0 5 0 0 0 5 ONE pilots 0 0 0 5 5 10 Action teams 20 20 40 Enterprise development 0 0 0 20 10 30 Total expenditure 140 550 850 1,420 1,340 4,300 Unallocated 900 Windfall tax receipts 2,600 2,600 5,200 Source - FSBR March 2000 (the Pre-Budget Report of November 2000 has the same estimates up to 2000-01 for the New Deal for 18 to 24 year olds.

33
Table 4 Level and composition of Active Labour Market Policies(a) (ALMP) in the G7 between 1985 and 1996 1. Spending on
ALMP per person unemployed(b)
2. Spending on Public Employment Service as a % of all ALMP
3. Spending on Youth measures as a % of all ALMP
4. Spending on direct job creation in the public sector as a % of all ALMP
1985 1996 1985 1996 1985 1996 1985 1996 Canada 6.2 5.6 37 36 5 5 3 6 France 6.6 10.7 20 12 25 19 0 17 Germany 10 16.1 26 17 6 5 15 21 Italy - 9 - - - - - - Japan 5.8(c) 3 17(c) 26 0(c) 0 6(c) 2 UK 6.4 5 22 43 35 26 25 2 US 3.8 3.2 25 39 12 15 3 3 EU(d) 13.3 11.3 19 19 14 15 16 15 OECD(e) 13 11.4 21 21 11 12 17 14 Source: Martin (1998) Tables 2 and 5. Notes (a) ALMP include public employment service, youth measures, public sector job creation, labour market training (for employed and unemployed adults), wage subsidies to private sector employment and measures for the disabled (last three items not shown above). (b) ALMP/GDP normalised on the ILO unemployment rate (c ) 1987 (d) unweighted average (e) unweighted average excluding Czech Republic, Hungary and Poland

34
Table 5 (MEN): Flows from the claimant count into employment.
Conditional on being on JSA for 6 months.
Flows by the end of the 8th month on JSA Flows by the end of the 10th month on JSA
Before the program
After the program
Difference Before the program
After the program
Difference
Pilot period Treatment group: 19-24s year olds in Pathfinder areas
0.141 0.180 +0.039 0.241 0.330 +0.089
Comparison group: 19-24 year olds in all other areas
0.165 0.146 -0.019 0.271 0.250 -0.021
Difference in differences +0.058 +0.110
Comparison group: 19-24 year olds in matched non-Pathfinder areas
0.149 0.133 -0.016 0.228 0.233 +0.005
Comparison group: 25-30 year olds in Pathfinder areas
0.150 0.153 +0.003 0.276 0.260 -0.016
National Roll Out Treatment group: 19-24 year olds
0.158 0.170 +0.012 0.258 0.281 +0.023
Comparison group: 25-30 year olds
0.138 0.124 -0.014 0.230 0.199 -0.031
Difference in differences +.026 +0.054
Notes:
Estimates used the JUVOS 5% longitudinal sample of JSA claimants. Selected observations are all unemployed individuals completing a 6 month spell on JSA over a predefined time interval. The present table considers those obtaining 6 months of JSA between the 2nd to 4th quarters of 1997 and 1998 for the “National Roll Out” estimates, and the 1st quarters of 1997 and 1998 for the “Pilot period” estimates. Individuals verifying this criterion are then followed up to the end of the 8th and 10th months on JSA to check whether they have found a job. The eligible group (defined by the age or pilot area criterion) is compared with the selected control group.

35
Table 6 (MEN): Gateway employment effects by the end of the 10th month conditional on being on JSA for 6 months. Percentage Point increase in the probability of leaving unemployment.
Treatment group
Comparison group
Observations Estimates based on Difference in difference method
(1) 19-24 year olds living in Pathfinder areas
19-24 year olds living in all non-Pathfinder areas
3,716 0.110** (0.039)
(2) 19-24 year olds living in Pathfinder areas
25-30 year olds living in Pathfinder areas
1,096 0.104* (0.055)
(3) 25-30 year olds living in Pathfinder areas
25-30 year olds living in all other areas
3,180 0.016 (0.042)
(4) 19-24 year olds living in Pathfinder areas
31-40 year olds living in Pathfinder areas
1,169 0.159**
(0.050)
(5) 19-24 year olds living in Pathfinder areas
19-24 year olds living in matched non-Pathfinder areas
1193 0.134**
(0.053)
(6) Outflow into the employment option (affecting 19-24 year olds living in Pathfinder areas). Raw numbers from NDED
4,486 0.057
(7) Overall effect for the sample including the Pilot period and the National Roll Out (first three quarters the ND is operating in each region)
19-24 year olds 25-30 year olds 17,433 0.053** (0.013)
(8)
Outflows to subsidised jobs. Raw numbers from NDED
55,051 0.039
Decomposition of New Deal into impact (First quarter) and medium run (second and third quarter) (9) Baseline effect
(accounting for the first quarter separately)
17,433 0.026* (0.014)
(10) Incremental effect of the first quarter the ND is implemented in Pathfinder areas
0.079** (0.027)
(11) Incremental effect of the first quarter the ND is implemented in non-Pathfinder areas
0.071** (0.014)
(12) Implied overall effect of New Deal in first quarter
0.097

36
Notes:
Estimates used the JUVOS 5% longitudinal sample of JSA claimants. Estimates of the outflows to options in rows (6) and (8) are obtained from the New Deal Evaluation Database (NDED). Selected observations are all unemployed individuals completing a 6-month spell on JSA over a predefined time interval. The present table considers those obtaining 6 months of JSA between the 2nd to 4th quarters of 1997 and 1998 for the “National Roll Out” estimates, The first quarters of 1997 and 1998 are used for the “Pilot period” estimates. Individuals verifying this criterion are then followed up to the end of the 8th and 10th months on JSA to check whether they have found a job. The eligible group (defined by the age or pilot area criterion) is compared with the selected control group. Columns (1) through (6) just use the pilot period. Columns (7) through (12) pool the pilot period with the national roll out. The decompositions are based on allowing the New Deal effect to differ in the first quarter it was introduced (January through March 1998 for pilot period and March through May for National roll out) from the subsequent quarters. All estimates from regressions including a set of other controls, namely marital status, sought occupation, region and some information on the labour market history (comprising the number of JSA spells since 1982 and the proportion of time on JSA over the 2 years that precede the start of the present unemployment spell). Standard errors in parentheses. ** = significant at 0.05 level. * = significant at 0.10 level. Source: Blundell, Costa Dias, Meghir and Van Reenen (2000)
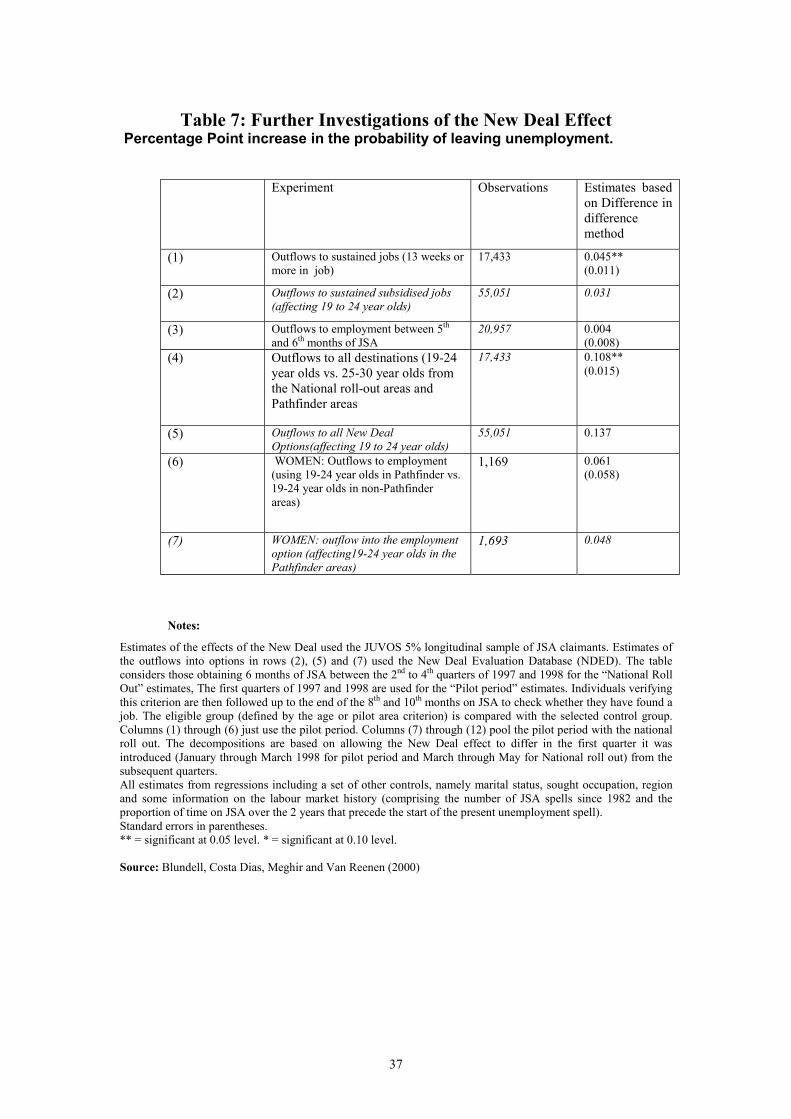
37
Table 7: Further Investigations of the New Deal Effect Percentage Point increase in the probability of leaving unemployment.
Experiment Observations Estimates based on Difference in difference method
(1) Outflows to sustained jobs (13 weeks or more in job)
17,433 0.045** (0.011)
(2) Outflows to sustained subsidised jobs (affecting 19 to 24 year olds)
55,051 0.031
(3) Outflows to employment between 5th and 6th months of JSA
20,957 0.004 (0.008)
(4) Outflows to all destinations (19-24 year olds vs. 25-30 year olds from the National roll-out areas and Pathfinder areas
17,433 0.108** (0.015)
(5) Outflows to all New Deal Options(affecting 19 to 24 year olds)
55,051 0.137
(6) WOMEN: Outflows to employment (using 19-24 year olds in Pathfinder vs. 19-24 year olds in non-Pathfinder areas)
1,169 0.061 (0.058)
(7) WOMEN: outflow into the employment option (affecting19-24 year olds in the Pathfinder areas)
1,693 0.048
Notes:
Estimates of the effects of the New Deal used the JUVOS 5% longitudinal sample of JSA claimants. Estimates of the outflows into options in rows (2), (5) and (7) used the New Deal Evaluation Database (NDED). The table considers those obtaining 6 months of JSA between the 2nd to 4th quarters of 1997 and 1998 for the “National Roll Out” estimates, The first quarters of 1997 and 1998 are used for the “Pilot period” estimates. Individuals verifying this criterion are then followed up to the end of the 8th and 10th months on JSA to check whether they have found a job. The eligible group (defined by the age or pilot area criterion) is compared with the selected control group. Columns (1) through (6) just use the pilot period. Columns (7) through (12) pool the pilot period with the national roll out. The decompositions are based on allowing the New Deal effect to differ in the first quarter it was introduced (January through March 1998 for pilot period and March through May for National roll out) from the subsequent quarters. All estimates from regressions including a set of other controls, namely marital status, sought occupation, region and some information on the labour market history (comprising the number of JSA spells since 1982 and the proportion of time on JSA over the 2 years that precede the start of the present unemployment spell). Standard errors in parentheses. ** = significant at 0.05 level. * = significant at 0.10 level. Source: Blundell, Costa Dias, Meghir and Van Reenen (2000)
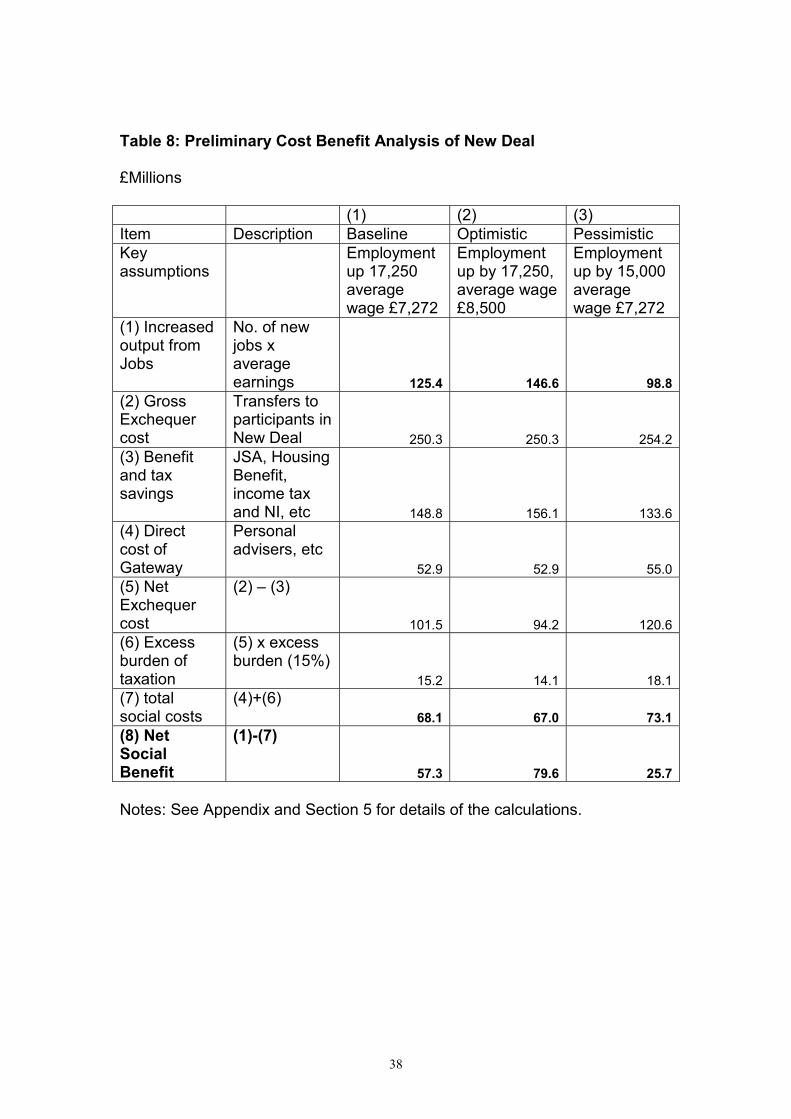
38
Table 8: Preliminary Cost Benefit Analysis of New Deal £Millions (1) (2) (3) Item Description Baseline Optimistic Pessimistic Key assumptions
Employment up 17,250 average wage £7,272
Employment up by 17,250, average wage £8,500
Employment up by 15,000 average wage £7,272
(1) Increased output from Jobs
No. of new jobs x average earnings 125.4 146.6 98.8
(2) Gross Exchequer cost
Transfers to participants in New Deal 250.3 250.3 254.2
(3) Benefit and tax savings
JSA, Housing Benefit, income tax and NI, etc 148.8 156.1 133.6
(4) Direct cost of Gateway
Personal advisers, etc
52.9 52.9 55.0 (5) Net Exchequer cost
(2) – (3)
101.5 94.2 120.6 (6) Excess burden of taxation
(5) x excess burden (15%)
15.2 14.1 18.1 (7) total social costs
(4)+(6) 68.1 67.0 73.1
(8) Net Social Benefit
(1)-(7)
57.3 79.6 25.7 Notes: See Appendix and Section 5 for details of the calculations.


![Richard Layard, La Felicidad[1]](https://static.fdocuments.net/doc/165x107/5571fb4e4979599169948255/richard-layard-la-felicidad1.jpg)


