
- Cover Page 12-13
148
2012 / 13
Transcript of - Cover Page 12-13

2012/13


ASHFORD BOROUGH COUNCIL
BUDGET BOOK 2012/13
CONTENTS Page No. BUDGET INTRODUCTION (ii) STATISTICS 1 PARISH EXPENDITURE 5 GENERAL FUND
General Fund Summary 6 Subjective Analysis 7 Summary Analysis of Budget Movement 8 Analysis of Other Budget Changes 9
Service Budgets and Plans
Corporate Management 10 Internal Audit 19 Communications and Marketing 22 Personnel and Development 27 Legal and Democratic 31 Planning 37 Financial Services 45 Business Change and Technology 58 Customers, Homes and Property 63 Environmental Services 77 Cultural Services 89 Capital Charges and Net Interest 104
HOUSING REVENUE ACCOUNT 105 CAPITAL PROGRAMME 114 REPAIRS AND RENEWALS RESERVE 116 FEES AND CHARGES 117
(i)


ASHFORD BOROUGH COUNCIL
BUDGET 2012/13
Introduction This Budget Book shows the Council’s Revenue estimates for 2012/13, the Capital Programme 2012/13 to 2014/15 plus the Fees and Charges operative from 1st April 2012. All estimates in this book are at estimated outturn levels (all allowances for pay awards and inflation are included in the figures). The Budget book includes the full year effect of all the Budget Reduction Strategy savings; however there is a risk of slippage in delivering all the proposals for 1st April. Any budget pressures resulting from this will need to managed through other compensating measures.
(ii)


2011/12No No % Increase
45,345.5 Tax Base 46,075.6 1.61%
£ Band D Rates: £ % Increase
140.67 Ashford Borough Council 140.67 0.00%1,047.78 Kent County Council (Provisional figure) 1,047.78 0.00%
138.68 Kent Police Authority (Provisional figure) 138.68 0.00%67.95 Kent and Medway Fire Authority (Provisional figure) 67.95 0.00%
1,395.08 1,395.08 0.00%
6,378,751 Ashford Borough Council 6,481,455 1.61%47,512,108 Kent County Council (Provisional figure) 48,277,092 1.61%
6,288,514 Kent Police Authority (Provisional figure) 6,389,764 1.61%3,081,227 Kent and Medway Fire Authority (Provisional figure) 3,130,837 1.61%
816,056 Parish Councils 844,243 3.45%64,076,656 65,123,391 1.63%
Ashford BC Kent CC Kent Police Kent Fire TOTAL
1995/96 55.89 442.35 45.09 n/a 543.331996/97 62.85 476.01 45.81 n/a 584.671997/98 76.32 488.52 51.57 n/a 616.411998/99 78.83 552.77 48.41 n/a 680.011999/00 81.63 602.26 52.48 n/a 736.372000/01 83.70 652.83 55.73 n/a 792.262001/02 88.22 694.19 60.26 n/a 842.672002/03 96.60 758.07 73.64 n/a 928.312003/04 101.43 852.84 94.95 n/a 1,049.222004/05 107.01 845.73 105.66 55.35 1,113.752005/06 112.14 877.05 110.88 57.15 1,157.222006/07 117.63 918.72 116.37 59.40 1,212.122007/08 123.34 964.17 122.18 61.65 1,271.342008/09 129.20 1,001.79 128.25 63.81 1,323.052009/10 135.27 1,026.27 134.65 66.06 1,362.252010/11 140.67 1,047.78 138.68 67.95 1,395.082011/12 140.67 1,047.78 138.68 67.95 1,395.082012/13 140.67 1,047.78 138.68 67.95 1,395.08% Change for year 0.00% 0.00% 0.00% 0.00% 0.00%
COUNCIL TAX STATISTICS
The table gives the make up of the Council Tax for Band D properties for each year since the Council tax was introduced
Council Taxpayers living in parished areas pay additional amounts to provide for the precepts levied by their parish/town council. Expressed as Band D these amounts range from £2.18 (Crundale) to £56.32 (Appledore). The total of all Parish Precepts is £844,243, an increase of 3.45% over 2011/12.
2012/13
COMPARISON WITH PREVIOUS YEARS
PARISH PRECEPTS
COUNCIL TAX
PRECEPTS
1

£ £
Gross Expenditure - General Fund 64,414,100
Gross Expenditure - HRA 25,956,370
Parish Precepts 844,24391,214,713
Less Gross Income (77,947,240)(77,947,240)
NET EXPENDITURE 13,267,473
Add Deficit Distribution from Collection Fund 0Less Formula Grant Allocation which includes Council Tax freeze grant 2011/12 (for 5 years) and Indicative Council Tax Freeze Grant 2012/13 (one off grant)
(5,941,780)
(5,941,780)
BUDGET REQUIREMENT 7,325,693
Less Parish Precepts (844,243)
Council Tax Requirement 6,481,450
Council Tax Base 46,075.60
Band 'D' Council Tax 140.67
Average including Parishes 158.99
AND COUNCIL TAX AT BAND DCALCULATION OF THE BUDGET REQUIREMENT
2

VALUATION BAND A B C D E F G H
1. The Multipliers specified in Section 5(1) of the Local Government Finance Act 1992, to apply to Basic Tax above
6/9 7/9 8/9 1 11/9 13/9 15/9 18/9
2. ABC Council Tax at £140.67 Band D multiplied by item 1 above to give the Council Tax for the year in respect of each valuation band. 93.78 109.41 125.04 140.67 171.93 203.19 234.45 281.34
3. Precepts issued to the Council
1. Kent County Council (provisional figure) 698.52 814.94 931.36 1,047.78 1,280.62 1,513.46 1,746.30 2,095.562. Kent Police Authority 92.45 107.86 123.27 138.68 169.50 200.32 231.13 277.363. Kent and Medway Fire and Rescue Authority (provisional figure) 45.30 52.85 60.40 67.95 83.05 98.15 113.25 135.90
4. The total of items 2 and 3 above, which is the full Council Tax before Parish precepts for 2012/13 930.05 1,085.06 1,240.07 1,395.08 1,705.10 2,015.12 2,325.13 2,790.16
CALCULATION OF COUNCIL TAX FOR DIFFERENT VALUATION BANDS
3

2011/12 2012/13£ £
42.6 Rate in the pound : Rateable Value below £18,000 45
43.3 Rateable Value £18,000 and above 45.8
£112,481,916 Rateable Value } £113,291,011}
3,937 Number of Hereditaments } At previous 31 December (per NNDR 1 Return) 4,025 }
£48,657,431 Gross Yield } £50,980,955
NON- DOMESTIC RATES STATISTICS
Businesses with properties whose total RV is less than £18,000 may apply for Small Business Rate Relief, which reduces the poundage they pay for their properties from 45.8p to 45.0p.
4

2011/2012 2012/2013 2012/2013£ £ £ £ £ £568.50 Aldington & Bonnington 16,640.00 18,000.00 31.66 1,890.00 1,890.00364.00 Appledore 20,500.00 20,500.00 56.32 2,320.00 2,320.00709.80 Bethersden 17,300.00 17,800.00 25.08 1,360.00 1,360.00
1,145.70 Biddenden 47,500.00 47,500.00 41.46 950.00 950.00145.40 Bilsington 2,000.00 2,100.00 14.44 610.00 610.00
1,108.20 Boughton Aluph and Eastwell 18,182.00 18,182.00 16.41 1,750.00 1,750.00608.60 Brabourne 11,311.00 11,311.00 18.59 1,170.00 1,170.00151.00 Brook 5,000.00 5,000.00 33.11 610.00 610.00424.10 Challock 14,000.00 14,000.00 33.01 1,530.00 1,530.00
1,302.10 Charing 47,565.00 49,943.25 38.36 5,840.00 5,840.00769.90 Chilham 16,996.00 16,996.00 22.08 2,280.00 2,280.00
91.80 Crundale (PM) 200.00 200.00 2.18 610.00 300.00526.20 Egerton 14,476.00 14,536.00 27.62 1,460.00 1,590.00170.20 Godmersham 4,000.00 4,000.00 23.50 610.00 610.00
2,556.40 Great Chart with Singleton 44,065.00 52,165.00 20.41 6,100.00 6,100.00115.30 Hastingleigh 3,000.00 3,000.00 26.02 610.00 610.00711.20 High Halden 18,023.00 18,023.00 25.34 1,660.00 1,660.00326.10 Hothfield 9,500.00 9,500.00 29.13 610.00 610.00109.70 Kenardington 3,000.00 3,750.00 34.18 610.00 610.00
4,216.10 Kingsnorth 63,595.00 69,565.00 16.50 1,300.00 1,300.00126.40 Little Chart 4,100.00 5,500.00 43.51 710.00 710.00654.10 Mersham and Sevington 12,500.00 12,500.00 19.11 810.00 810.00116.30 Molash 1,500.00 1,500.00 12.90 610.00 610.00108.40 Newenden 5,000.00 5,000.00 46.13 610.00 610.00571.60 Orlestone 13,500.00 13,500.00 23.62 610.00 610.00494.30 Pluckley 24,000.00 24,000.00 48.55 1,730.00 1,730.00708.80 Rolvenden 21,675.00 21,675.00 30.58 4,200.00 4,200.00340.10 Ruckinge 6,000.00 9,000.00 26.46 610.00 610.00517.90 Shadoxhurst 11,440.00 11,440.00 22.09 900.00 900.00642.50 Smarden 23,600.00 23,600.00 36.73 1,310.00 1,310.00387.10 Smeeth 7,591.00 7,590.00 19.61 820.00 820.00
1,035.20 Stanhope 13,500.00 13,500.00 13.04 610.00 610.00219.00 Stone 4,000.00 4,000.00 18.26 610.00 610.00
3,709.90 Tenterden (TC) 197,020.00 201,590.00 54.34 7,410.00 7,410.00178.90 Warehorne 2,800.00 2,800.00 15.65 610.00 610.00327.80 Westwell 12,170.00 12,170.00 37.13 3,810.00 3,810.00564.60 Wittersham 16,275.00 16,275.00 28.83 3,490.00 3,490.00875.50 Woodchurch 20,000.00 20,000.00 22.84 2,530.00 2,530.00
1,064.00 Wye with Hinxhill 42,532.00 42,532.00 39.97 660.00 660.00
28,762.70 816,056.00 844,243.25 1,094.75 66,530.00 66,350.00
LOCAL TAX BASE
PARISH EXPENDITURE AND PRECEPTS 2012/2013
LOCAL TAX
PRECEPTSPARISH CONCURRENT GRANT
AMOUNT CLAIMED
5

ACTUALS ESTIMATE PROJECTED
OUTTURN DETAIL ESTIMATE2010/11 2011/12 2011/12 2012/13
£ £ £ £
665,730 718,370 804,010 Corporate Management 1,547,720 - 100 470 Internal Audit ( 10)
290,718 155,580 246,770 Communications and Marketing 247,800 83,740 156,920 150,810 Personnel & Development 108,140
1,163,856 1,149,200 1,213,390 Legal and Democratic Services 1,209,410 2,137,482 1,168,120 1,239,150 Planning 744,800
( 1,764,331) 2,006,830 1,740,890 Financial Services 2,088,610 99,568 72,050 127,690 Business Change and Technology 1,820
3,018,439 461,640 343,180 Customers Homes and Property 338,060 5,474,676 6,062,690 5,965,180 Environmental Services 6,323,750 1,617,332 2,161,710 2,236,340 Cultural Services 2,223,370
12,787,210 14,113,210 14,067,880 SERVICE EXPENDITURE 14,833,470 1,496,646 ( 994,320) ( 994,320) Capital Charges ( 1,697,290)( 841,072) ( 430,630) ( 430,630) Net Interest ( 474,500)
77,161 72,520 72,520 Concurrent Functions Grant 66,520 238,701 258,900 258,900 Drainage Board Levies 265,370
- - - Ward Grants Scheme 107,000 - - - New Homes Bonus ( 713,000)
- - - Contribution (from) Balances to fund business plan priorities ( 517,000)
1,025,749 218,920 264,250 Contribution to Balances for slippage 552,660
14,784,393 13,238,600 13,238,600 ABC BUDGET REQUIREMENT 12,423,230
816,056 815,906 Total Parish Precepts 844,243 14,784,393 14,054,656 14,054,506 TOTAL BUDGET REQUIREMENT 13,267,473
INCOME( 8,436,992) ( 6,859,850) ( 6,859,850) Government Grant ( 5,941,780)
- - Collection Fund (Surplus)/Deficit - ( 816,056) ( 815,906) Parish Precepts ( 844,243)
6,347,401 6,378,750 6,378,750 Council Tax 6,481,450
REVENUE BUDGET
SUMMARY
6

Corporate Management Internal Audit Communications
and Marketing Personnel & Development
Legal and Democratic
Services
Planning and Development
Financial Services Sub Total
£ £ £ £ £ £ £ £EXPENDITUREEmployees 324,670 86,160 225,300 316,910 1,088,990 2,291,970 3,385,380 7,719,380 Premises - - - - - - - - Supplies and Services 511,550 46,420 106,830 33,250 481,220 275,040 42,027,730 43,482,040 Transport 12,510 300 - 600 18,980 32,890 15,840 81,120 TOTAL EXPENDITURE 848,730 132,880 332,130 350,760 1,589,190 2,599,900 45,428,950 51,282,540 INCOMEGrants ( 63,640) - ( 37,500) - ( 80,000) ( 555,000) ( 41,378,820) ( 42,114,960) Fees & Charges - - ( 4,180) - ( 139,700) ( 1,591,530) ( 1,689,200) ( 3,424,610) TOTAL INCOME ( 63,640) - ( 41,680) - ( 219,700) ( 2,146,530) ( 43,068,020) ( 45,539,570)
NET CONTROLLABLE EXPENDITURE 785,090 132,880 290,450 350,760 1,369,490 453,370 2,360,930 5,742,970 NON CONTROLLABLE ITEMSRecharged from other Accounts 1,490,520 12,960 63,800 57,680 588,300 1,089,230 903,150 4,205,640 Capital Charges - - 20,020 - 9,530 - - 29,550 Recharged to other Accounts ( 685,590) ( 145,850) ( 126,470) ( 300,300) ( 818,160) ( 760,550) ( 1,175,470) ( 4,012,390) Transfer to/from Reserves ( 42,300) - - - 60,250 ( 37,250) - ( 19,300) TOTAL NON-CONTROLLABLE ITEMS 762,630 ( 132,890) ( 42,650) ( 242,620) ( 160,080) 291,430 ( 272,320) 203,500
NET EXPENDITURE 1,547,720 ( 10) 247,800 108,140 1,209,410 744,800 2,088,610 5,946,470
Sub Total Business
Change and Technology
Customers, Homes and
Property
Environmental Services
Cultural Services
Net Interest and Capital
Charges General Fund Total
£ £ £ £ £ £ £ £EXPENDITUREEmployees 7,719,380 677,510 1,380,680 2,458,420 814,280 - 13,050,270 Premises - - 799,050 2,200,980 500,800 - 3,500,830 Supplies and Services 43,482,040 294,080 933,800 4,928,820 418,310 200,500 438,890 50,696,440 Transport 81,120 4,370 15,160 49,100 19,210 - 168,960 TOTAL EXPENDITURE 51,282,540 975,960 3,128,690 9,637,320 1,752,600 200,500 438,890 67,416,500 INCOME - Grants ( 42,114,960) - ( 95,000) ( 686,570) ( 38,050) - ( 6,654,780) ( 49,589,360) Fees & Charges ( 3,424,610) ( 29,600) ( 1,938,450) ( 3,167,990) ( 226,100) ( 675,000) ( 9,461,750) TOTAL INCOME ( 45,539,570) ( 29,600) ( 2,033,450) ( 3,854,560) ( 264,150) ( 675,000) ( 6,654,780) ( 59,051,110)
- NET CONTROLLABLE EXPENDITURE 5,742,970 946,360 1,095,240 5,782,760 1,488,450 ( 474,500) ( 6,215,890) 8,365,390 NON CONTROLLABLE ITEMSRecharged from other Accounts 4,205,640 108,720 618,840 1,555,750 502,100 - 6,991,050 Capital Charges 29,550 - 505,650 384,510 777,580 ( 1,697,290) - Recharged to other Accounts ( 4,012,390) ( 1,053,260) ( 1,985,380) ( 1,399,270) ( 466,160) - ( 8,916,460) Transfer to/from Reserves ( 19,300) - 103,710 - ( 78,600) - 35,660 41,470 TOTAL NON-CONTROLLABLE ITEMS 203,500 ( 944,540) ( 757,180) 540,990 734,920 ( 1,697,290) 35,660 ( 1,883,940)
NET EXPENDITURE 5,946,470 1,820 338,060 6,323,750 2,223,370 ( 2,171,790) ( 6,180,230) 6,481,450
SUBJECTIVE ANALYSIS - 2012/13 ESTIMATE
7

SERVICE 2011/12 BUDGET Inflation Changes in
CapitalChanges in Recharges
Changes in Transfers To/From Reserves
Other Budget
Changes
2012/13 BUDGET
£ £ £ £ £ £ £Budget ProposalsCorporate Management 718,370 10,970 0 837,110 (16,330) (2,400) 1,547,720Internal Audit 100 590 0 160 0 (860) (10)Communications and Marketing 155,580 500 6,700 (10,510) 0 95,530 247,800Personnel & Development 156,920 1,760 0 (59,200) 0 8,660 108,140Legal and Democratic Services 1,149,200 5,940 3,180 4,990 0 46,100 1,209,410Planning 1,168,120 0 93,280 (336,740) (14,250) (165,610) 744,800Financial Services 2,006,830 155,700 0 80,930 (61,230) (93,620) 2,088,610Business Change and Technology 72,050 5,380 0 (146,150) 0 (34,860) 1,820Customers Homes and Property 461,640 0 239,820 (161,140) 0 (202,260) 338,060Environmental Services 6,062,690 0 225,470 24,620 0 10,970 6,323,750Cultural Services 2,161,710 30,170 228,040 (138,740) (16,800) (41,010) 2,223,370
General Fund (874,610) 6,470 (702,970) 0 (735,920) (103,210) (2,410,240)
ABC BUDGET REQUIREMENT 13,238,600 217,480 93,520 95,330 (844,530) (482,570) 12,423,230
ANALYSIS OF BUDGET VARIATIONS 2011/12 TO 2012/13
8

RESERVE Balance at 31/03/2011
Estimated Movement 2011/12
Balance at 31/03/2012
Estimated Movement 2012/13
Balance at 31/03/2013
£'000 £'000 £'000 £'000 £'000Elections 197 (180) 17 60 77Repairs & Renewals 746 105 851 105 956Insurance 1 0 1 0 1Stour Centre 229 72 301 72 373Community Grant Fund 6 (6) 0 0 0Planning Delivery Grant 511 0 511 0 511Planning Appeals 335 0 335 0 335Valuation of Assets 15 3 18 3 21Pension Fund Actuarial Volatility Reserve 253 0 253 0 253Members’ IT 29 (24) 5 8 13Green Transport Initiatives 30 0 30 0 30Service Pressure Reserve 120 (40) 80 0 80Land Adoption Reserve 398 0 398 0 398Hopewell Twinning Reserve 4 0 4 0 4People Mover (Restricted) 141 0 141 0 141Section 106 Monitoring Fee (Restricted) 46 (23) 23 (23) 0Transport Initiatives (Restricted) 122 0 122 0 122Netball Centre Reserve (Restricted) 18 0 18 0 18Singleton Environment Centre (Restricted) 43 0 43 0 43Building Control Reserve (Restricted) 17 0 17 0 17Land Searches Reserve (Restricted) 76 0 76 0 76St Mary's Church, Little Chart, Ruin (Restricted) 5 0 5 0 5Earmarked Total 3,342 (93) 3,249 225 3,474General Reserve 3,812 (771) 3,041 (435) 2,606Grand Total 7,154 (864) 6,290 (210) 6,080
Analysis of Estimated Reserves
9

ACTUAL ESTIMATE PROJECTED DETAIL ESTIMATEOUTTURN
2010/11 2011/12 2011/12 2012/13£ £ £ £
9,082 - - Ashfords Future - 540,822 284,790 258,000 Corporate Management 330,340
18,953 51,490 158,440 Allocable Corporate Costs 820,990 17,713 - - Performance Improvement Team -
- - (2,960) Management Team (180) 79,160 97,240 95,340 Policy and Performance 99,660
- 284,850 295,190 Single Grant Gateway 296,910
665,730 718,370 804,010 SERVICE EXPENDITURE 1,547,720
REVENUE BUDGET
CORPORATE MANAGEMENT
10

Ashfords Future
Corporate Management
Allocable Corporate
Costs
Performance Improvement
Team
Management Team
Policy and Performance
Single Grant
Gateway Total
£ £ £ £ £ £ £ £
EXPENDITUREEmployees - - ( 137,750) - 305,210 157,210 - 324,670 Premises - - - - - - - - Supplies and Services - 123,900 5,000 - 17,300 - 365,350 511,550 Transport - - - - 9,460 3,050 - 12,510 TOTAL EXPENDITURE - 123,900 ( 132,750) - 331,970 160,260 365,350 848,730 INCOMEGrants - - - - - ( 37,500) ( 26,140) ( 63,640) Fees & Charges - - - - - - - - TOTAL INCOME - - - - - ( 37,500) ( 26,140) ( 63,640)
NET CONTROLLABLE EXPENDITURE - 123,900 ( 132,750) - 331,970 122,760 339,210 785,090 NON CONTROLLABLE ITEMSRecharged from other Accounts - 378,470 1,030,010 - 36,510 45,530 - 1,490,520 Capital Charges - - - - - - - - Recharged to other Accounts - ( 172,030) ( 76,270) - ( 368,660) ( 68,630) - ( 685,590) Transfer to/from Reserves - - - - - - ( 42,300) ( 42,300) TOTAL NON-CONTROLLABLE ITEMS - 206,440 953,740 - ( 332,150) ( 23,100) ( 42,300) 762,630
NET EXPENDITURE - 330,340 820,990 - ( 180) 99,660 296,910 1,547,720
SUBJECTIVE ANALYSIS - 2012/13 ESTIMATECORPORATE MANAGEMENT
11

SERVICE
SERVICE MANAGERBUDGET MANAGER
ACTUAL ESTIMATE PROJECTED DETAIL ESTIMATEOUTTURN
2010/11 2011/12 2011/12 2012/13£ £ £ £
EXPENDITURE42,751 - - Employees -
- - - Premises - 108,517 - - Supplies and Services -
59 - - Transport - 151,327 - - TOTAL EXPENDITURE -
INCOME(54,642) - - Grants -
(108,755) - - Fees and Charges -
(12,070) - - NET CONTROLLABLE
EXPENDITURE - RECHARGES & CAPITAL
CHARGES 21,152 - - Support Services -
- - - Capital Charges - - - - Recharges - - - - Transfers to/from Reserves -
9,082 - - NET EXPENDITURE (Including Recharges and Capital Charges) -
ANALYSIS OF BUDGET VARIATIONS£ COMMENTS
Base Budget 2011/12 - Base Budget 2012/13 -
ANALYSIS OF BUDGET VARIATIONS£ COMMENTS
Base Budget 2011/12 - Outturn 2011/12 (P7 Forecast) -
NOTES
DEPUTY CHIEF EXECUTIVE
Page to be deleted next year
REVENUE BUDGET
Closed budgetASHFORD'S FUTURE
DEPUTY CHIEF EXECUTIVE
SERVICE DESCRIPTION
12

SERVICE
SERVICE MANAGERBUDGET MANAGER
ACTUAL ESTIMATE PROJECTED DETAIL ESTIMATEOUTTURN
2010/11 2011/12 2011/12 2012/13£ £ £ £
EXPENDITURE- - - Employees - - - - Premises -
175,701 153,960 127,170 Supplies and Services 123,900 - - - Transport -
175,701 153,960 127,170 TOTAL EXPENDITURE 123,900 INCOME
(7,684) - - Grants - - - - Fees and Charges -
168,017 153,960 127,170 NET CONTROLLABLE
EXPENDITURE 123,900 RECHARGES & CAPITAL
CHARGES 701,381 273,230 273,230 Support Services 378,470
- - - Capital Charges - (328,576) (142,400) (142,400) Recharges (172,030)
- - - Transfers to/from Reserves -
540,822 284,790 258,000 NET EXPENDITURE (Including Recharges and Capital Charges) 330,340
ANALYSIS OF BUDGET VARIATIONS£ COMMENTS
Base Budget 2011/12 284,790 General Inflation 3,820 Supplies and Services (33,880) Change in support costs 105,240 Change in recharges (29,630) Base Budget 2012/13 330,340
ANALYSIS OF BUDGET VARIATIONS£ COMMENTS
Base Budget 2011/12 284,790 Supplies and Services 1,570 Supplies and Services (28,060) Supplies and Services (300) Outturn 2011/12 (P7 Forecast) 258,000
SERVICE DESCRIPTION
Reduction in external audit fees
Reduction in advertising costs
NOTES
Council tax leaflet costsReduction in external audit fees
REVENUE BUDGET
This cost centre holds the cost of external audit fees and internal recharges related to statutory work such as the production of the council's financial statements and related work that statutory guidance recommends should not be allocated specifically to services. It also holds some miscellaneous corporate costs that are not easily defined to services.
CORPORATE MANAGEMENT
DEPUTY CHIEF EXECUTIVEDEPUTY CHIEF EXECUTIVE
13

SERVICE
SERVICE MANAGERBUDGET MANAGER
ACTUAL ESTIMATE PROJECTED DETAIL ESTIMATEOUTTURN
2010/11 2011/12 2011/12 2012/13£ £ £ £
EXPENDITURE18,272 (137,000) (34,390) Employees (137,750)
- - - Premises - 681 5,000 9,340 Supplies and Services 5,000
- - - Transport - 18,953 (132,000) (25,050) TOTAL EXPENDITURE (132,750)
INCOME- - - Grants - - - - Fees and Charges -
18,953 (132,000) (25,050) NET CONTROLLABLE EXPENDITURE (132,750) RECHARGES & CAPITAL CHARGES
- 275,230 275,230 Support Services 1,030,010 - - - Capital Charges - - (91,740) (91,740) Recharges (76,270) - - - Transfers to/from Reserves -
18,953 51,490 158,440 NET EXPENDITURE (Including Recharges and Capital Charges) 820,990
ANALYSIS OF BUDGET VARIATIONS£ COMMENTS
Base Budget 2011/12 51,490 Pay Award 110
Virement 75,030 Additional savings (42,190)
Virement (13,490)
Virement (10,900)
Virement (15,380)
Virement 17,720 Virement 89,750
Saving Target (101,400) 754,780
Change to recharges 15,470 Base Budget 2012/13 820,990
ANALYSIS OF BUDGET VARIATIONS£ COMMENTS
Base Budget 2011/12 51,490 Salaries (35,150) Virement 75,030
Virement (13,490)
Virement (10,900)
Virement (15,380)
Virement 60,000 Virement 37,000 Virement 10,000 Supplies and services (160) Outturn 2011/12 (P7 Forecast) 158,440
Change to support costs
Change in employer contribution rate
To Strategy, Partnerships and Communications service to fund salary costs not included in base budget
To Legal and Democratic services to fund agreed regrade of posts within service
Change in employer contribution rate and mayoral budget saving
REVENUE BUDGET
These budgets are initially held centrally, but will are then transferred to services as required during the year. Similarly, salary savings resulting from vacancies will be vired from individual services as they are identified during the year.
This is due to Corporate projects being recharged here within the Organisation
ALLOCABLE CORPORATE COSTS
DEPUTY CHIEF EXECUTIVEDEPUTY CHIEF EXECUTIVE
Mayor budget saving
SERVICE DESCRIPTION
NOTES
From Executive Support
Customer, homes and property for required saving
Change in employer contribution rate Additional savings identified during saving exercises
To Personnel and Development service to fund salary costs not included in base budget
Customer, homes and property for required saving From Planning
To Strategy, Partnerships and Communications service to fund salary costs not included in base budget
Proposed saving target from freezing vacant posts
To Legal and Democratic services to fund agreed regrade of posts within service
To Personnel and Development service to fund salary costs not included in base budget
14

SERVICE
SERVICE MANAGERBUDGET MANAGER
ACTUAL ESTIMATE PROJECTED DETAIL ESTIMATEOUTTURN
2010/11 2011/12 2011/12 2012/13£ £ £ £
EXPENDITURE46,075 - - Employees -
- - - Premises - 11,640 - - Supplies and Services - 3,978 - - Transport -
61,693 - - TOTAL EXPENDITURE - INCOME
(4,706) - - Grants - - - - Fees and Charges -
56,987 - - NET CONTROLLABLE
EXPENDITURE - RECHARGES & CAPITAL
CHARGES 34,328 - - Support Services -
- - - Capital Charges - (73,602) - - Recharges -
- - - Transfers to/from Reserves -
17,713 - - NET EXPENDITURE (Including Recharges and Capital Charges) -
ANALYSIS OF BUDGET VARIATIONS£ COMMENTS
Base Budget 2011/12 - Base Budget 2012/13 -
ANALYSIS OF BUDGET VARIATIONS£ COMMENTS
Base Budget 2011/12 - Outturn 2011/12 (P7 Forecast) -
REVENUE BUDGET
Closed budgetPERFORMANCE AND IMPROVEMENT TEAM
DEPUTY CHIEF EXECUTIVE
SERVICE DESCRIPTION
Budget page to be removed in 2013/14 budgetNOTES
DEPUTY CHIEF EXECUTIVE
15
SERVICE
SERVICE MANAGERBUDGET MANAGER
ACTUAL ESTIMATE PROJECTED DETAIL ESTIMATEOUTTURN
2010/11 2011/12 2011/12 2012/13£ £ £ £
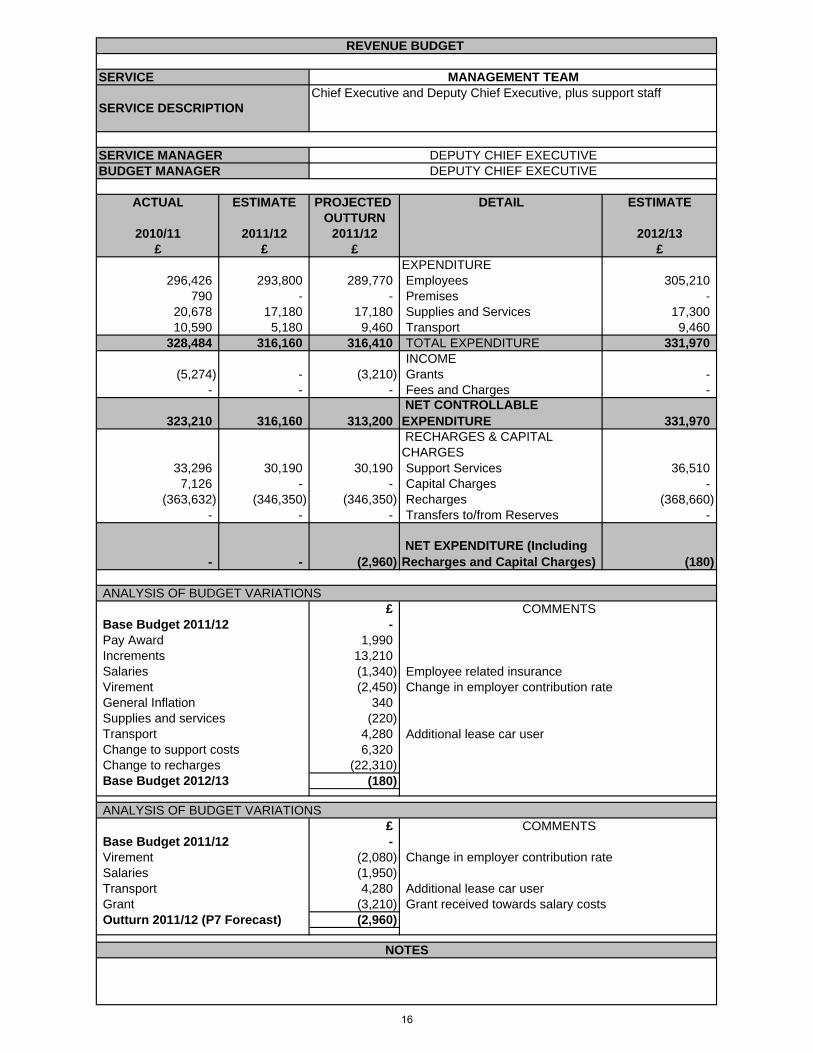
EXPENDITURE296,426 293,800 289,770 Employees 305,210
790 - - Premises - 20,678 17,180 17,180 Supplies and Services 17,300 10,590 5,180 9,460 Transport 9,460
328,484 316,160 316,410 TOTAL EXPENDITURE 331,970 INCOME
(5,274) - (3,210) Grants - - - - Fees and Charges -
323,210 316,160 313,200 NET CONTROLLABLE EXPENDITURE 331,970 RECHARGES & CAPITAL CHARGES
33,296 30,190 30,190 Support Services 36,510 7,126 - - Capital Charges -
(363,632) (346,350) (346,350) Recharges (368,660) - - - Transfers to/from Reserves -
- - (2,960) NET EXPENDITURE (Including Recharges and Capital Charges) (180)
ANALYSIS OF BUDGET VARIATIONS£ COMMENTS
Base Budget 2011/12 - Pay Award 1,990 Increments 13,210 Salaries (1,340) Virement (2,450) General Inflation 340 Supplies and services (220) Transport 4,280 Change to support costs 6,320 Change to recharges (22,310) Base Budget 2012/13 (180)
ANALYSIS OF BUDGET VARIATIONS£ COMMENTS
Base Budget 2011/12 - Virement (2,080) Salaries (1,950) Transport 4,280 Grant (3,210) Outturn 2011/12 (P7 Forecast) (2,960)
Change in employer contribution rate
DEPUTY CHIEF EXECUTIVEDEPUTY CHIEF EXECUTIVE
NOTES
Change in employer contribution rate
REVENUE BUDGET
Chief Executive and Deputy Chief Executive, plus support staffMANAGEMENT TEAM
SERVICE DESCRIPTION
Employee related insurance
Additional lease car userGrant received towards salary costs
Additional lease car user
16

SERVICE
SERVICE MANAGERBUDGET MANAGER
ACTUAL ESTIMATE PROJECTED DETAIL ESTIMATEOUTTURN
2010/11 2011/12 2011/12 2012/13£ £ £ £
EXPENDITURE78,669 162,030 160,130 Employees 157,210
- - - Premises - - - - Supplies and Services -
467 3,050 3,050 Transport 3,050 79,136 165,080 163,180 TOTAL EXPENDITURE 160,260
INCOME- (37,500) (37,500) Grants (37,500) - - - Fees and Charges -
79,136 127,580 125,680 NET CONTROLLABLE EXPENDITURE 122,760 RECHARGES & CAPITAL CHARGES
24 36,960 36,960 Support Services 45,530 - - - Capital Charges - - (67,300) (67,300) Recharges (68,630) - - - Transfers to/from Reserves -
79,160 97,240 95,340 NET EXPENDITURE (Including Recharges and Capital Charges) 99,660
ANALYSIS OF BUDGET VARIATIONS£ COMMENTS
Base Budget 2011/12 97,240 Pay Award 930 Salaries (10,850) Virement (230)
Virement 5,330
Changes to support costs 8,570 Changes to recharges (1,330) Base Budget 2012/13 99,660
ANALYSIS OF BUDGET VARIATIONS£ COMMENTS
Base Budget 2011/12 97,240 Virement (230)
Virement 5,330
Salaries (7,000) Outturn 2011/12 (P7 Forecast) 95,340
DEPUTY CHIEF EXECUTIVE
REVENUE BUDGET
Responsible for development and oversight of business planning, corporate strategy, policy and performance management, corporate partnerships and voluntary and community sector grants.
POLICY & PERFORMANCE
DEPUTY CHIEF EXECUTIVE
SERVICE DESCRIPTION
Change in employer contribution rate
Additional saving identified during budget monitoring
Employee leaving pension scheme
NOTES
Change in employer contribution rate
From Allocable Corporate Costs Budget to correct base budget
From Allocable Corporate Costs Budget to correct base budget
17

SERVICE
SERVICE MANAGERBUDGET MANAGER
ACTUAL ESTIMATE PROJECTED DETAIL ESTIMATEOUTTURN
2010/11 2011/12 2011/12 2012/13£ £ £ £
EXPENDITURE- - 40 Employees - - - - Premises - - 336,960 372,260 Supplies and Services 365,350 - - - Transport - - 336,960 372,300 TOTAL EXPENDITURE 365,350
INCOME- (26,140) (28,140) Grants (26,140) - - - Fees and Charges -
- 310,820 344,160 NET CONTROLLABLE EXPENDITURE 339,210 RECHARGES & CAPITAL CHARGES
- - - Support Services - - - - Capital Charges - - - - Recharges - - (25,970) (48,970) Transfers to/from Reserves (42,300)
- 284,850 295,190 NET EXPENDITURE (Including Recharges and Capital Charges) 296,910
ANALYSIS OF BUDGET VARIATIONS£ COMMENTS
Base Budget 2011/12 284,850 General Inflation 3,780
20,000 4,610
Change in transfers from reserve (16,330) Base Budget 2012/13 296,910
ANALYSIS OF BUDGET VARIATIONS£ COMMENTS
Base Budget 2011/12 284,850 4,540
5,000
3,800
2,000
Virement 20,000 Virement (2,000) Virement (18,000)
Change in transfers from reserve
(5,000)
Outturn 2011/12 (P7 Forecast) 295,190
Supplies and services
Supplies and services Funding for grant payment for Charing Playing Fields from reserves
Supplies and services 25 year funding agreement towards Willesborough Windmill trust (agreement dated 2002)
Supplies and services Agreed overspend by cabinet in regards to grant payments
REVENUE BUDGET
Council grants to support voluntary and community sector organisations in the borough.
SINGLE GRANTS GATEWAY
DEPUTY CHIEF EXECUTIVEDEPUTY CHIEF EXECUTIVE
Supplies and services
NOTES
Handy Man scheme
Payment towards pilot handyman scheme
SERVICE DESCRIPTION
Increase in discretionary rate relief Supplies and services
Increase in organisations claiming discretionary rate relief
Funding towards handyman scheme from HRAFunding towards handyman scheme from Reserves
Funding for grant payment for Charing Playing Fields from reserves
18

REVENUE BUDGET
AUDIT PARTNERSHIP
ACTUAL ESTIMATE PROJECTED DETAIL ESTIMATEOUTTURN
2010/11 2011/12 2011/12 2012/13£ £ £ £
- 100 470 Audit Partnership (10)
- 100 470 SERVICE EXPENDITURE (10)
19

SUBJECTIVE ANALYSIS - 2012/13 ESTIMATEAUDIT PARTNERSHIP
Audit Partnership Total
£ £
EXPENDITUREEmployees 86,160 86,160 Premises - - Supplies and Services 46,420 46,420 Transport 300 300 TOTAL EXPENDITURE 132,880 132,880 INCOMEGrants - - Fees & Charges - - TOTAL INCOME - -
NET CONTROLLABLE EXPENDITURE 132,880 132,880 NON CONTROLLABLE ITEMSRecharged from other Accounts 12,960 12,960 Capital Charges - - Recharged to other Accounts ( 145,850) ( 145,850) Transfer to/from Reserves - - TOTAL NON-CONTROLLABLE ITEMS ( 132,890) ( 132,890)
NET EXPENDITURE ( 10) ( 10)
20

REVENUE BUDGET
SERVICE AUDIT PARTNERSHIP
SERVICE DESCRIPTIONThe four-way Audit Partnership with Maidstone, Swale and Tunbridge Wells is responsible for internal audit within the four councils. The total cost of the cost centre is fully allocated to services
SERVICE MANAGER DEPUTY CHIEF EXECUTIVEBUDGET MANAGER HEAD OF INTERNAL AUDIT
ACTUAL ESTIMATE PROJECTED DETAIL ESTIMATEOUTTURN
2010/11 2011/12 2011/12 2012/13£ £ £ £
EXPENDITURE84,884 86,650 86,660 Employees 86,160
- - - Premises - 55,330 46,200 46,610 Supplies and Services 46,420
58 300 250 Transport 300 140,272 133,150 133,520 TOTAL EXPENDITURE 132,880
INCOME- - - Grants -
(2,000) - - Fees and Charges -
138,272 133,150 133,520 NET CONTROLLABLE EXPENDITURE 132,880 RECHARGES & CAPITAL CHARGES
14,160 11,520 11,520 Support Services 12,960 - - - Capital Charges -
(152,432) (144,570) (144,570) Recharges (145,850) - - - Transfers to/from Reserves -
0 100 470 NET EXPENDITURE (Including Recharges and Capital Charges) (10)
ANALYSIS OF BUDGET VARIATIONS£ COMMENTS
Base Budget 2011/12 100 Pay Award 590 Virement (590) Change in employer contribution rateSalaries (1,180) Employee related insurance Salaries 690 Full year effect of regrading of posts within structureSupplies and Services 220 Increased payment to Audit PartnershipChange in support costs 1,440 Change in recharges (1,280) Base Budget 2012/13 (10)
ANALYSIS OF BUDGET VARIATIONS£ COMMENTS
Base Budget 2011/12 100 Salaries 600 Virement (590) Change in employer contribution rateSupplies and Services 410 Required computer software upgradeTransport (50) Outturn 2011/12 (P7 Forecast) 470
NOTES
21

REVENUE BUDGET
COMMUNICATIONS AND MARKETING
ACTUAL ESTIMATE PROJECTED DETAIL ESTIMATEOUTTURN
2010/11 2011/12 2011/12 2012/13£ £ £ £
245,024 149,560 240,330 Communications & Marketing 241,840 36,829 6,000 6,000 Ashford Voice 6,000
8,865 20 440 Printing (40)
290,718 155,580 246,770 SERVICE EXPENDITURE 247,800
22

SUBJECTIVE ANALYSIS - 2012/13 ESTIMATECOMMUNICATIONS AND MARKETING
Communications and Marketing
Ashford Voice Printing Total
£ £ £ £
EXPENDITUREEmployees 201,130 - 24,170 225,300 Premises - - - - Supplies and Services 38,450 6,000 62,380 106,830 Transport - - - - TOTAL EXPENDITURE 239,580 6,000 86,550 332,130 INCOMEGrants ( 37,500) - - ( 37,500) Fees & Charges - - ( 4,180) ( 4,180) TOTAL INCOME ( 37,500) - ( 4,180) ( 41,680)
NET CONTROLLABLE EXPENDITURE 202,080 6,000 82,370 290,450 NON CONTROLLABLE ITEMSRecharged from other Accounts 34,740 - 29,060 63,800 Capital Charges 20,020 - - 20,020 Recharged to other Accounts ( 15,000) - ( 111,470) ( 126,470) Transfer to/from Reserves - - - - TOTAL NON-CONTROLLABLE ITEMS 39,760 - ( 82,410) ( 42,650)
NET EXPENDITURE 241,840 6,000 ( 40) 247,800
23

REVENUE BUDGET
SERVICE COMMUNICATIONS AND MARKETING
SERVICE DESCRIPTION
To provide marketing and communications services internally and externally to promote and protect the reputation of the Council and the growth of Ashford. This includes responsibility for the web-site design and content management, media management, marketing and publications (hard copy and on-line)
SERVICE MANAGER HEAD OF BUSINESS CHANGE and TECHNOLOGYBUDGET MANAGER COMMUNICATIONS and MARKETING MANAGER
ACTUAL ESTIMATE PROJECTED DETAIL ESTIMATEOUTTURN
2010/11 2011/12 2011/12 2012/13£ £ £ £
EXPENDITURE263,944 173,870 189,640 Employees 201,130
45 40 40 Premises - 40,233 42,900 60,600 Supplies and Services 38,450
790 - - Transport - 305,012 216,810 250,280 TOTAL EXPENDITURE 239,580
INCOME(6,000) (37,500) (37,500) Grants (37,500)
(130,674) (71,000) 4,000 Fees and Charges -
168,338 108,310 216,780 NET CONTROLLABLE
EXPENDITURE 202,080 RECHARGES & CAPITAL CHARGES
82,073 53,340 53,340 Support Services 34,740 20,021 13,320 13,320 Capital Charges 20,020
(25,408) (25,410) (25,410) Recharges (15,000) - - (17,700) Transfers to/from Reserves -
245,024 149,560 240,330 NET EXPENDITURE (Including Recharges and Capital Charges) 241,840
ANALYSIS OF BUDGET VARIATIONS£ COMMENTS
Base Budget 2011/12 149,560 Pay Award 1,150 Increments 2,050 Salaries (1,860) Decrease in employee related insuranceSalaries 21,440 Post added into structureVirement (1,090) Change in employer contribution rate
Virement 5,570 From Allocable Corporate Costs Budget to correct base budget
Supplies and Services (3,490) Additional saving identified during budget buildGrant 70,000 Removal of New Homes Bonus Grant double countChange in support costs (18,600) Change in recharges 10,410 Change in capital charges 6,700 Base Budget 2012/13 241,840
ANALYSIS OF BUDGET VARIATIONS£ COMMENTS
Base Budget 2011/12 149,560 Virement (1,090) Change in employer contribution rate
Virement 5,570 From Allocable Corporate Costs Budget to correct base budget
Salaries 11,290 Post added into structureFees and changes 70,000 Removal of New Homes Bonus Grant double countFees and changes 5,000 Removal of Wrap income forecastOutturn 2011/12 (P7 Forecast) 240,330
NOTES
24
REVENUE BUDGET
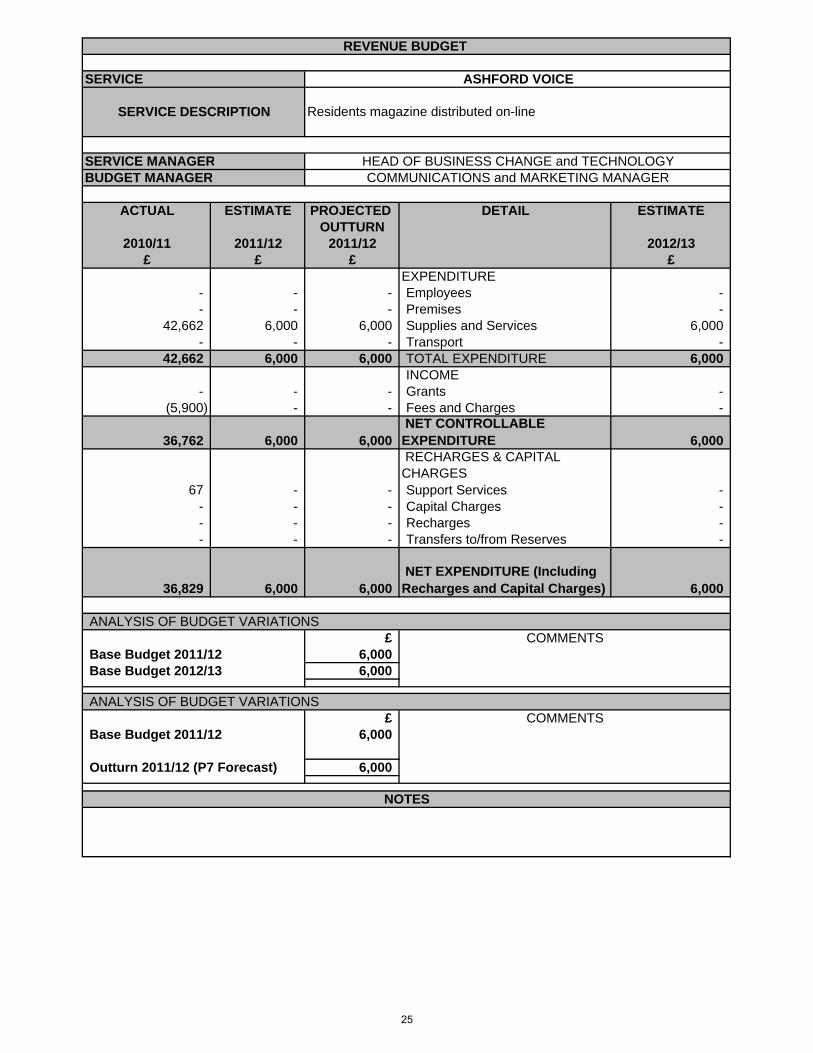
SERVICE ASHFORD VOICE
SERVICE DESCRIPTION Residents magazine distributed on-line
SERVICE MANAGER HEAD OF BUSINESS CHANGE and TECHNOLOGYBUDGET MANAGER COMMUNICATIONS and MARKETING MANAGER
ACTUAL ESTIMATE PROJECTED DETAIL ESTIMATEOUTTURN
2010/11 2011/12 2011/12 2012/13£ £ £ £
EXPENDITURE- - - Employees - - - - Premises -
42,662 6,000 6,000 Supplies and Services 6,000 - - - Transport -
42,662 6,000 6,000 TOTAL EXPENDITURE 6,000 INCOME
- - - Grants - (5,900) - - Fees and Charges -
36,762 6,000 6,000 NET CONTROLLABLE
EXPENDITURE 6,000 RECHARGES & CAPITAL
CHARGES 67 - - Support Services -
- - - Capital Charges - - - - Recharges - - - - Transfers to/from Reserves -
36,829 6,000 6,000 NET EXPENDITURE (Including Recharges and Capital Charges) 6,000
ANALYSIS OF BUDGET VARIATIONS£ COMMENTS
Base Budget 2011/12 6,000 Base Budget 2012/13 6,000
ANALYSIS OF BUDGET VARIATIONS£ COMMENTS
Base Budget 2011/12 6,000
Outturn 2011/12 (P7 Forecast) 6,000
NOTES
25

REVENUE BUDGET
SERVICE PRINTING
SERVICE DESCRIPTION The provision of the in-house printing service
SERVICE MANAGER HEAD OF BUSINESS CHANGE and TECHNOLOGYBUDGET MANAGER CORPORATE DESIGN WEB and PRINT MANAGER
ACTUAL ESTIMATE PROJECTED DETAIL ESTIMATEOUTTURN
2010/11 2011/12 2011/12 2012/13£ £ £ £
EXPENDITURE47,050 21,030 24,090 Employees 24,170
- - - Premises - 69,053 60,080 60,080 Supplies and Services 62,380
- - - Transport - 116,103 81,110 84,170 TOTAL EXPENDITURE 86,550
INCOME- - - Grants -
(1,475) (1,000) (3,640) Fees and Charges (4,180)
114,628 80,110 80,530 NET CONTROLLABLE
EXPENDITURE 82,370 RECHARGES & CAPITAL CHARGES
12,687 14,890 14,890 Support Services 29,060 11,599 - - Capital Charges -
(130,049) (94,980) (94,980) Recharges (111,470) - - - Transfers to/from Reserves -
8,865 20 440 NET EXPENDITURE (Including Recharges and Capital Charges) (40)
ANALYSIS OF BUDGET VARIATIONS£ COMMENTS
Base Budget 2011/12 20 Pay Award 160 Increments 630 Salaries 2,700 Regrading of post within structureVirement (350) Change in employer contribution rateGeneral Inflation 1,320 Supplies and services 980 Predicted Increase in paper costs
Income (3,180) Sale of canvas prints
Change in support costs 14,170 Change in recharges (16,490) Base Budget 2012/13 (40)
ANALYSIS OF BUDGET VARIATIONS£ COMMENTS
Base Budget 2011/12 20 Virement (350) Change in employer contribution rateVirement 2,640 Movement of budget from income budgetSalaries 770 Regrading of post within structureVirement (2,640) Movement of budget to salary budgetOutturn 2011/12 (P7 Forecast) 440
NOTES
26

REVENUE BUDGET
PERSONNEL and DEVELOPMENT
ACTUAL ESTIMATE PROJECTED DETAIL ESTIMATEOUTTURN
2010/11 2011/12 2011/12 2012/13£ £ £ £
- 51,920 65,810 Personnel & Development 3,140 83,740 105,000 85,000 Centralised Training Budget 105,000
83,740 156,920 150,810 SERVICE EXPENDITURE 108,140
27

SUBJECTIVE ANALYSIS - 2012/13 ESTIMATEPERSONNEL and DEVELOPMENT
Personnel & Development
Centralised Training Total
£ £ £
EXPENDITUREEmployees 211,910 105,000 316,910 Premises - - - Supplies and Services 33,250 - 33,250 Transport 600 - 600 TOTAL EXPENDITURE 245,760 105,000 350,760 INCOMEGrants - - - Fees & Charges - - - TOTAL INCOME - - -
NET CONTROLLABLE EXPENDITURE 245,760 105,000 350,760 NON CONTROLLABLE ITEMSRecharged from other Accounts 57,680 - 57,680 Capital Charges - - - Recharged to other Accounts ( 300,300) - ( 300,300) Transfer to/from Reserves - - - TOTAL NON-CONTROLLABLE ITEMS ( 242,620) - ( 242,620)
NET EXPENDITURE 3,140 105,000 108,140
28

REVENUE BUDGET
SERVICE PERSONNEL & DEVELOPMENT
SERVICE DESCRIPTIONThe Personnel and Development team is responsible for personnel and training procedures, payroll, personnel policy and employee relations. These costs are recharged to services on a per head basis.
SERVICE MANAGER DEPUTY CHIEF EXECUTIVEBUDGET MANAGER HEAD OF PERSONNEL & DEVELOPMENT
ACTUAL ESTIMATE PROJECTED DETAIL ESTIMATEOUTTURN
2010/11 2011/12 2011/12 2012/13£ £ £ £
EXPENDITURE233,738 209,190 223,080 Employees 211,910
- - - Premises - 24,069 25,550 25,550 Supplies and Services 33,250 14,220 600 600 Transport 600
272,027 235,340 249,230 TOTAL EXPENDITURE 245,760 INCOME
- - - Grants - (19,628) - - Fees and Charges -
252,399 235,340 249,230 NET CONTROLLABLE
EXPENDITURE 245,760 RECHARGES & CAPITAL CHARGES
70,174 76,970 76,970 Support Services 57,680 - - - Capital Charges -
(322,573) (260,390) (260,390) Recharges (300,300) - - - Transfers to/from Reserves -
- 51,920 65,810 NET EXPENDITURE (Including Recharges and Capital Charges) 3,140
ANALYSIS OF BUDGET VARIATIONS£ COMMENTS
Base Budget 2011/12 51,920 15% Saving (20,000) Learning and development saving
Pay Award 1,530 Increments 2,210 Salaries 5,090 Identified base build error from 2011/12 budgetVirement (1,490) Change in employer contribution rate Virement 15,380 Movement of budget from Allocable Corporate CostsGeneral Inflation 230
Supplies and Services 7,470 Increase in subscriptions costs due to new payroll system installation
Change in support costs (19,290) Change in recharges (39,910) Base Budget 2012/13 3,140
ANALYSIS OF BUDGET VARIATIONS£ COMMENTS
Base Budget 2011/12 51,920 Virement (1,490) Change in employer contribution rate Virement 15,380 Movement of budget from Allocable Corporate CostsOutturn 2011/12 (P7 Forecast) 65,810
NOTES
29

REVENUE BUDGET
SERVICE CENTRALISED TRAINING BUDGET
SERVICE DESCRIPTIONThe training budget for the whole authority is held centrally
SERVICE MANAGER DEPUTY CHIEF EXECUTIVEBUDGET MANAGER HEAD OF PERSONNEL & DEVELOPMENT
ACTUAL ESTIMATE PROJECTED DETAIL ESTIMATEOUTTURN
2010/11 2011/12 2011/12 2012/13£ £ £ £
EXPENDITURE84,992 105,000 85,000 Employees 105,000
- - - Premises - 108 - - Supplies and Services -
1,510 - - Transport - 86,610 105,000 85,000 TOTAL EXPENDITURE 105,000
INCOME- - - Grants -
(2,870) - - Fees and Charges -
83,740 105,000 85,000 NET CONTROLLABLE
EXPENDITURE 105,000 RECHARGES & CAPITAL
CHARGES - - - Support Services - - - - Capital Charges - - - - Recharges - - - - Transfers to/from Reserves -
83,740 105,000 85,000 NET EXPENDITURE (Including Recharges and Capital Charges) 105,000
ANALYSIS OF BUDGET VARIATIONS£ COMMENTS
Base Budget 2011/12 105,000 Base Budget 2012/13 105,000
ANALYSIS OF BUDGET VARIATIONS£ COMMENTS
Base Budget 2011/12 105,000 Training costs (20,000) Reduction in predicted spend on staff training costsOutturn 2011/12 (P7 Forecast) 85,000
NOTES
30

REVENUE BUDGET
LEGAL and DEMOCRATIC SERVICES
ACTUAL ESTIMATE PROJECTED DETAIL ESTIMATEOUTTURN
2010/11 2011/12 2011/12 2012/13£ £ £ £
- (80,060) 4,680 Legal (50) 57,750 67,920 52,750 Mayor 54,100
320,558 340,800 341,550 Electoral Services 349,580 785,548 820,540 814,410 Democratic Representation 805,780
1,163,856 1,149,200 1,213,390 SERVICE EXPENDITURE 1,209,410
31

SUBJECTIVE ANALYSIS - 2012/13 ESTIMATELEGAL and DEMOCRATIC SERVICES
Legal Mayor Electoral Services
Democratic Representation Total
£ £ £ £ £
EXPENDITUREEmployees 725,090 16,770 154,370 192,760 1,088,990 Premises - - - - - Supplies and Services 45,080 13,500 85,900 336,740 481,220 Transport 3,350 12,050 400 3,180 18,980 TOTAL EXPENDITURE 773,520 42,320 240,670 532,680 1,589,190 INCOMEGrants ( 80,000) - - - ( 80,000) Fees and Charges ( 131,700) - ( 2,300) ( 5,700) ( 139,700) TOTAL INCOME ( 211,700) - ( 2,300) ( 5,700) ( 219,700)
NET CONTROLLABLE EXPENDITURE 561,820 42,320 238,370 526,980 1,369,490 NON CONTROLLABLE ITEMSRecharged from other Accounts 112,200 11,780 50,960 413,360 588,300 Capital Charges - - - 9,530 9,530 Recharged to other Accounts ( 674,070) - - ( 144,090) ( 818,160) Transfer to/from Reserves - - 60,250 - 60,250 TOTAL NON-CONTROLLABLE ITEMS ( 561,870) 11,780 111,210 278,800 ( 160,080)
NET EXPENDITURE ( 50) 54,100 349,580 805,780 1,209,410
32

REVENUE BUDGET
SERVICE LEGAL SERVICES
SERVICE DESCRIPTIONProviding Legal Services to all departments and ensuring full compliance with Member Code of Conduct and Monitoring Officer duties.
SERVICE MANAGER HEAD OF LEGAL AND DEMOCRATIC SERVICESBUDGET MANAGER PRINCIPAL SOLICITOR (PROPERTY AND PROJECTS)
ACTUAL ESTIMATE PROJECTED DETAIL ESTIMATEOUTTURN
2010/11 2011/12 2011/12 2012/13£ £ £ £
EXPENDITURE660,594 706,210 688,760 Employees 725,090
- - - Premises - 75,481 46,400 74,590 Supplies and Services 45,080 3,639 3,550 3,550 Transport 3,350
739,714 756,160 766,900 TOTAL EXPENDITURE 773,520 INCOME
- (80,000) (80,000) Grants (80,000) (220,512) (201,860) (127,860) Fees and Charges (131,700)
519,202 474,300 559,040 NET CONTROLLABLE
EXPENDITURE 561,820 RECHARGES & CAPITAL CHARGES
96,814 93,450 93,450 Support Services 112,200 - - - Capital Charges -
(616,016) (647,810) (647,810) Recharges (674,070) - - - Transfers to/from Reserves -
- (80,060) 4,680 NET EXPENDITURE (Including Recharges and Capital Charges) (50)
ANALYSIS OF BUDGET VARIATIONS£ COMMENTS
Base Budget 2011/12 (80,060) Pay Award 4,860 Increment 2,770 Salaries 2,210 Virement (4,650) Change in employer contribution rate
Virement 13,490 From Allocable Corporate Costs budget to cover regrading within service
Supplies and Services (1,330) Reduction in books and publications budgetInflation (3,830) Fees and charges 74,000 Removal of New Homes Bonus Grant double countChange in support costs 18,750 Change in recharges (26,260) Base Budget 2012/13 (50)
ANALYSIS OF BUDGET VARIATIONS£ COMMENTS
Base Budget 2011/12 (80,060) Virement (4,650) Change in employer contribution rate
Virement 13,490 From Allocable Corporate Costs budget to cover regrading within service
Salaries 1,710 Staff advertising costsSupplies and services 190 Fees and charges 74,000 Removal of New Homes Bonus Grant double countOutturn 2011/12 (P7 Forecast) 4,680
NOTES
33

REVENUE BUDGET
SERVICE MAYOR
SERVICE DESCRIPTIONMayoral Costs
SERVICE MANAGER HEAD OF LEGAL AND DEMOCRATIC SERVICESBUDGET MANAGER MEMBER SERVICES AND SCRUTINY MANAGER
ACTUAL ESTIMATE PROJECTED DETAIL ESTIMATEOUTTURN
2010/11 2011/12 2011/12 2012/13£ £ £ £
EXPENDITURE16,449 60,100 15,910 Employees 16,770
- - - Premises - 9,034 - 15,330 Supplies and Services 13,500
20,642 - 13,690 Transport 12,050 46,125 60,100 44,930 TOTAL EXPENDITURE 42,320
INCOME- - - Grants - - - - Fees and Charges -
46,125 60,100 44,930 NET CONTROLLABLE
EXPENDITURE 42,320 RECHARGES & CAPITAL
CHARGES 11,625 7,820 7,820 Support Services 11,780
- - - Capital Charges - - - - Recharges - - - - Transfers to/from Reserves -
57,750 67,920 52,750 NET EXPENDITURE (Including Recharges and Capital Charges) 54,100
ANALYSIS OF BUDGET VARIATIONS£ COMMENTS
Base Budget 2011/12 67,920 Pay Award 200 Virement (280) Change in employer contribution rateVirement (17,720) Reduction in cost of Mayoralty (O&S review)General Inflation 20 Change in support costs 3,960 Base Budget 2012/13 54,100
ANALYSIS OF BUDGET VARIATIONS£ COMMENTS
Base Budget 2011/12 67,920 Virement (280) Change in employer contribution rateVirement (10,600) Reduction in cost of Mayoralty (O&S review)Salaries (1,930) Identified saving during budget monitoringTransport (2,360) Reduction in hire lease car paymentsOutturn 2011/12 (P7 Forecast) 52,750
NOTES
34

REVENUE BUDGET
SERVICE ELECTORAL SERVICES
SERVICE DESCRIPTIONThe administration of the elections and the maintenance of the electoral role. The cost of the KCC and Parliamentary elections are recovered
SERVICE MANAGER HEAD OF LEGAL AND DEMOCRATIC SERVICESBUDGET MANAGER ELECTORAL SERVICES MANAGER
ACTUAL ESTIMATE PROJECTED DETAIL ESTIMATEOUTTURN
2010/11 2011/12 2011/12 2012/13£ £ £ £
EXPENDITURE188,138 154,070 154,130 Employees 154,370
- - 24,300 Premises - 88,156 87,720 88,170 Supplies and Services 85,900
190 100 340 Transport 400 276,484 241,890 266,940 TOTAL EXPENDITURE 240,670
INCOME(753) - - Grants -
(2,283) (2,300) (26,600) Fees and Charges (2,300)
273,448 239,590 240,340 NET CONTROLLABLE
EXPENDITURE 238,370 RECHARGES & CAPITAL
CHARGES 47,110 40,960 40,960 Support Services 50,960
- - - Capital Charges - - - - Recharges - - 60,250 60,250 Transfers to/from Reserves 60,250
320,558 340,800 341,550 NET EXPENDITURE (Including Recharges and Capital Charges) 349,580
ANALYSIS OF BUDGET VARIATIONS£ COMMENTS
Base Budget 2011/12 340,800 Pay Award 1,050 Increments 1,480 Salaries (1,230) Saving identified during budget buildVirement (1,000) Change in employer contribution rateSupplies and Services (1,820) Reduction in Canvassers FeesTransport 300 Increase in Public transport travel budgetChange in support costs 10,000 Base Budget 2012/13 349,580
ANALYSIS OF BUDGET VARIATIONS£ COMMENTS
Base Budget 2011/12 340,800 Virement (1,000) Change in employer contribution rateSalaries 1,060 Identified pressure during budget monitoringSupplies and Services 690 Increase in off-site billing costsOutturn 2011/12 (P7 Forecast) 341,550
NOTES
35

REVENUE BUDGET
SERVICE DEMOCRATIC REPRESENTATION
SERVICE DESCRIPTIONMember support and administration of the Council's committees
SERVICE MANAGER HEAD OF LEGAL AND DEMOCRATIC SERVICESBUDGET MANAGER MEMBER SERVICES AND SCRUTINY MANAGER
ACTUAL ESTIMATE PROJECTED DETAIL ESTIMATEOUTTURN
2010/11 2011/12 2011/12 2012/13£ £ £ £
EXPENDITURE204,261 207,120 202,860 Employees 192,760
- 200 200 Premises - 318,736 338,760 357,160 Supplies and Services 336,740
3,198 3,080 3,080 Transport 3,180 526,195 549,160 563,300 TOTAL EXPENDITURE 532,680
INCOME- - - Grants -
(6,089) (5,700) (3,500) Fees and Charges (5,700)
520,106 543,460 559,800 NET CONTROLLABLE
EXPENDITURE 526,980 RECHARGES & CAPITAL CHARGES
406,814 415,520 415,520 Support Services 413,360 9,528 6,350 6,350 Capital Charges 9,530
(150,900) (144,790) (144,790) Recharges (144,090) - - (22,470) Transfers to/from Reserves -
785,548 820,540 814,410 NET EXPENDITURE (Including Recharges and Capital Charges) 805,780
ANALYSIS OF BUDGET VARIATIONS£ COMMENTS
Base Budget 2011/12 820,540 15% Saving (7,850) Civic Engagement Officer - reduction in hours
Salaries (5,010) Replacement Clerical Officer on less hours than previous post holder
Virement (1,500) Change in employer contribution rateSupplies and Services (2,120) Saving identified during budget buildChange in support costs (2,160) Change in capital charges 3,180 Change in recharges 700 Base Budget 2012/13 805,780
ANALYSIS OF BUDGET VARIATIONS£ COMMENTS
Base Budget 2011/12 820,540 Virement (1,500) Change in employer contribution rate
Salaries (2,990) Replacement Clerical Officer on less hours than previous post holder
Supplies and Services (3,840) One cabinet member not claiming allowanceFees and charges 2,200 Outturn 2011/12 (P7 Forecast) 814,410
NOTES
36

ACTUAL ESTIMATE PROJECTED DETAIL ESTIMATEOUTTURN
2010/11 2011/12 2011/12 2012/13£ £ £ £
852,159 298,810 329,430 Strategic Planning 256,800 985,929 620,380 692,980 Development Control 228,040 53,756 68,020 65,420 Building Control 57,740
(72,467) (21,520) (19,680) Land Charges (2,410) (2,078) - (30,760) Planning Administration (10)
320,183 202,430 201,760 Economic Development 204,640
2,137,482 1,168,120 1,239,150 SERVICE EXPENDITURE 744,800
REVENUE BUDGET
PLANNING
37
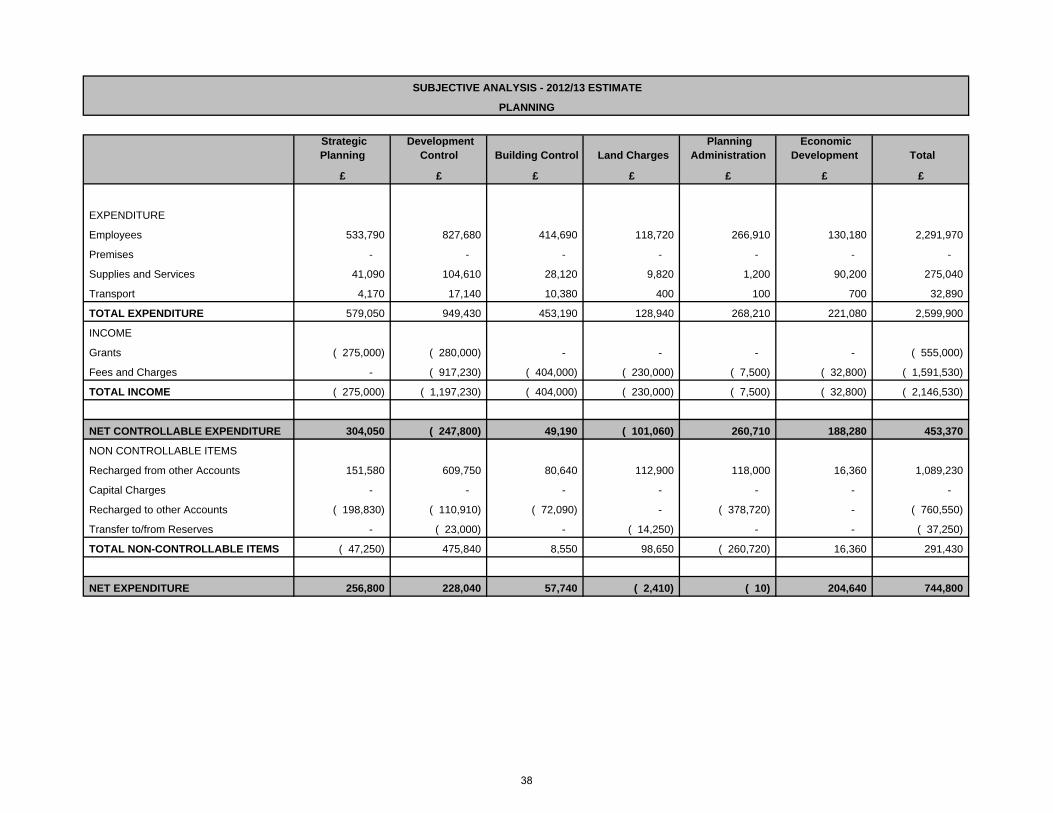
Strategic Planning
Development Control Building Control Land Charges
Planning Administration
Economic Development Total
£ £ £ £ £ £ £
EXPENDITURE
Employees 533,790 827,680 414,690 118,720 266,910 130,180 2,291,970
Premises - - - - - - -
Supplies and Services 41,090 104,610 28,120 9,820 1,200 90,200 275,040
Transport 4,170 17,140 10,380 400 100 700 32,890
TOTAL EXPENDITURE 579,050 949,430 453,190 128,940 268,210 221,080 2,599,900
INCOME
Grants ( 275,000) ( 280,000) - - - - ( 555,000)
Fees and Charges - ( 917,230) ( 404,000) ( 230,000) ( 7,500) ( 32,800) ( 1,591,530)
TOTAL INCOME ( 275,000) ( 1,197,230) ( 404,000) ( 230,000) ( 7,500) ( 32,800) ( 2,146,530)
NET CONTROLLABLE EXPENDITURE 304,050 ( 247,800) 49,190 ( 101,060) 260,710 188,280 453,370
NON CONTROLLABLE ITEMS
Recharged from other Accounts 151,580 609,750 80,640 112,900 118,000 16,360 1,089,230
Capital Charges - - - - - - -
Recharged to other Accounts ( 198,830) ( 110,910) ( 72,090) - ( 378,720) - ( 760,550)
Transfer to/from Reserves - ( 23,000) - ( 14,250) - - ( 37,250)
TOTAL NON-CONTROLLABLE ITEMS ( 47,250) 475,840 8,550 98,650 ( 260,720) 16,360 291,430
NET EXPENDITURE 256,800 228,040 57,740 ( 2,410) ( 10) 204,640 744,800
SUBJECTIVE ANALYSIS - 2012/13 ESTIMATE
PLANNING
38

SERVICESERVICE DESCRIPTION
SERVICE MANAGERBUDGET MANAGER
ACTUAL ESTIMATE PROJECTED DETAIL ESTIMATEOUTTURN
2010/11 2011/12 2011/12 2012/13£ £ £ £
EXPENDITURE391,851 377,220 407,440 Employees 533,790
- - - Premises - 55,300 32,090 31,840 Supplies and Services 41,090
5,264 4,150 4,800 Transport 4,170 452,415 413,460 444,080 TOTAL EXPENDITURE 579,050
INCOME(29,240) (215,000) (215,000) Grants (275,000)
(560) - - Fees and Charges - 422,615 198,460 229,080 NET CONTROLLABLE
EXPENDITURE 304,050
RECHARGES & CAPITAL CHARGES
122,884 142,390 142,390 Support Services 151,580 348,400 - - Capital Charges - (41,740) (42,040) (42,040) Recharges (198,830)
- - - Transfers to/from Reserves - 852,159 298,810 329,430 NET EXPENDITURE (Including
Recharges and Capital Charges) 256,800
ANALYSIS OF BUDGET VARIATIONS£
298,810 78,000 £60k CIL post, £14k increase in hours, £4k NI11,060
Superannuation virement (2,490) 70,000
9,000 (60,000)
9,210 (156,790) 256,800
ANALYSIS OF BUDGET VARIATIONS£
Base Budget 2011/12 298,810 30,220
(250) 650
329,430
Budget 2012/13
BUSINESS MANAGER and HEAD of BUILDING CONTROL
From Development Control
COMMENTS
Salary virement Core Strategy Review & Development Plan Document
Support ServicesGrant received from the DCLG
Advertising Community Infrastructure Levy
£19.4k virement from Planning Admin, £8k virement
Outturn 2011/12 (P7 Forecast)
Recharges
COMMENTS
EmployeesSupplies and Services
NOTES
Transport
EmployeesIncrements
REVENUE BUDGET
Producing the Local Development Framework for the Borough and taking forward Ashford growth proposals
STRATEGIC PLANNING
Base Budget 2011/12
HEAD of PLANNING and DEVELOPMENT
39

SERVICE
ACTUAL ESTIMATE PROJECTED DETAIL ESTIMATEOUTTURN
2010/11 2011/12 2011/12 2012/13£ £ £ £
EXPENDITURE 956,875 955,240 872,040 Employees 827,680 - - 1,900 Premises - 255,759 121,250 99,950 Supplies and Services 104,610 24,029 16,940 16,940 Transport 17,140 1,236,663 1,093,430 990,830 TOTAL EXPENDITURE 949,430
INCOME (231,601) (280,000) (284,800) Grants (280,000) (702,923) (894,000) (714,000) Fees and Charges (917,230) 302,139 (80,570) (7,970) NET CONTROLLABLE
EXPENDITURE (247,800)
RECHARGES & CAPITAL CHARGES
725,526 756,590 756,590 Support Services 609,750 - - - Capital Charges - (41,736) (55,640) (55,640) Recharges (110,910) - - - Transfers to/from Reserves (23,000) 985,929 620,380 692,980 NET EXPENDITURE (Including
Recharges and Capital Charges) 228,040
ANALYSIS OF BUDGET VARIATIONS £
620,380 (55,000) (37,000) 16,950
Superannuation virement (5,510) (70,000)
23,000 (21,200)
Counsels Fees 4,760 (10,230) (13,000) (146,840) (55,270)
Transfer from S106 Monitoring Reserve (23,000) Budget 2012/13 228,040
ANALYSIS OF BUDGET VARIATIONS £
620,380 (32,700) (8,000) (37,000) (5,500) 1,900 (21,300) (4,800) 180,000 692,980
SERVICE DESCRIPTION
COMMENTS
Salary Virement
15% Savings Target Support Services
To Strategic Planning Principal Strategic Sites Officer. Fixed term contract to August 2012
Government delay in amending Planning Fees
SERVICE MANAGER
Planning Compliance Officer post - deleted
Recharges
Supplies and Services Reduction in Scanning £15k & Legal costs £6k Pre application advice incomeFees and Charges
Employees
COMMENTS
BUSINESS MANAGER and HEAD of BUILDING CONTROL
MTFP 15% Saving Target MTFP 15% saving target
DEVELOPMENT CONTROL
BUDGET MANAGER
Planning Officer Vacancy Base Budget 2011/12
HEAD of PLANNING and DEVELOPMENT
Savings in Benchmarking
Increments/National Insurance
Hours reduced by 1 FTEPlanning Compliance Officer deleted post
NOTES
Outturn 2011/12 (P7 Forecast)
REVENUE BUDGET
Processing Planning Applications ranging from Extensions to Major Sites, plus Enforcement and Conservation
Base Budget 2011/12
External scanning/Docs to Parishes
Section 106 Monitoring Income
MTFP 15% Saving Target Virement - SuperannuationPremises
15% Savings Target
15% Savings Target
Salary transfer to Strategic Planning
40

SERVICE
ACTUAL ESTIMATE PROJECTED DETAIL ESTIMATEOUTTURN
2010/11 2011/12 2011/12 2012/13£ £ £ £
EXPENDITURE 417,002 423,450 404,850 Employees 414,690 362 - - Premises - 52,430 48,110 48,110 Supplies and Services 28,120 16,262 15,650 15,650 Transport 10,380 486,056 487,210 468,610 TOTAL EXPENDITURE 453,190
INCOME - - - Grants - (464,373) (458,000) (442,000) Fees and Charges (404,000) 21,683 29,210 26,610 NET CONTROLLABLE
EXPENDITURE 49,190
RECHARGES & CAPITAL CHARGES
110,497 110,900 110,900 Support Services 80,640 - - - Capital Charges - (78,424) (72,090) (72,090) Recharges (72,090) - - - Transfers to/from Reserves - 53,756 68,020 65,420 NET EXPENDITURE (Including
Recharges and Capital Charges) 57,740
£ 68,020 (30,010) 23,970
Superannuation virement (2,720) (5,270) 34,010 (30,260) 57,740
£ 68,020 (18,600) 16,000 65,420
BUDGET MANAGER
COMMENTS
BUSINESS MANAGER and HEAD of BUILDING CONTROL
Base Budget 2011/12
ANALYSIS OF BUDGET VARIATIONS
Reduction in staff hoursAdministration Restructuring
Fees and ChargesSupport Services
Budget 2012/13
Transport Based on current figures and economic trends
Hours reduced by 0.7 full time equivalent Transfer from Planning Administration
REVENUE BUDGET
Undertake the Strategic Duties of the Building RegulationsBUILDING CONTROL
HEAD of PLANNING and DEVELOPMENT
SERVICE DESCRIPTION
SERVICE MANAGER
Fees and Charges
COMMENTS
Vacant Building Control Officer post Employees
ANALYSIS OF BUDGET VARIATIONS
NOTES
Outturn 2011/12 (P7 Forecast)
Base Budget 2011/12
Based on income received to date, to be reviewed
41

SERVICESERVICE DESCRIPTION
SERVICE MANAGERBUDGET MANAGER
ACTUAL ESTIMATE PROJECTED DETAIL ESTIMATEOUTTURN
2010/11 2011/12 2011/12 2012/13£ £ £ £
EXPENDITURE86,859 95,230 97,070 Employees 118,720
- - - Premises - 25,235 10,460 10,460 Supplies and Services 9,820
(130) 400 400 Transport 400 111,964 106,090 107,930 TOTAL EXPENDITURE 128,940
INCOME(34,356) - - Grants -
(210,728) (185,500) (225,000) Fees and Charges (230,000) (133,120) (79,410) (117,070) NET CONTROLLABLE
EXPENDITURE (101,060)
RECHARGES & CAPITAL CHARGES
60,653 57,890 57,890 Support Services 112,900 - - - Capital Charges - - - - Recharges - - - 39,500 Transfers to/from Reserves (14,250)
(72,467) (21,520) (19,680) NET EXPENDITURE (Including Recharges and Capital Charges)
(2,410)
ANALYSIS OF BUDGET VARIATIONS£
(21,520) 24,180
(690) (640)
(44,500) 55,010
(14,250) (2,410)
ANALYSIS OF BUDGET VARIATIONS£
(21,520) 1,840
(39,500) 39,500
Outturn 2011/12 (P7 Forecast) (19,680)
BUSINESS MANAGER and HEAD of BUILDING CONTROL
Base Budget 2011/12COMMENTS
Transfer from Planning Admin
REVENUE BUDGET
Responding to Land Charges Search EnquiriesLAND CHARGES
HEAD of PLANNING and DEVELOPMENT
COMMENTS
Employees
Transfers to/from ReservesFees and Charges Increase based on current trend
Base Budget 2011/12
NOTES
Budget 2012/13
Support ServicesTransfers to/from Reserves
Department restructure
Supplies and ServicesIncrease based on current trendFees and Charges
Superannuation virement
42

SERVICESERVICE DESCRIPTION
SERVICE MANAGERBUDGET MANAGER
ACTUAL ESTIMATE PROJECTED DETAIL ESTIMATEOUTTURN
2010/11 2011/12 2011/12 2012/13£ £ £ £
EXPENDITURE345,625 344,740 316,680 Employees 266,910
5,849 - - Premises - 15,083 2,400 1,200 Supplies and Services 1,200
56 100 100 Transport 100 366,613 347,240 317,980 TOTAL EXPENDITURE 268,210
INCOME(47,110) - - Grants - (27,653) (7,500) (9,000) Fees and Charges (7,500) 291,850 339,740 308,980 NET CONTROLLABLE
EXPENDITURE 260,710
RECHARGES & CAPITAL CHARGES
142,840 132,260 132,260 Support Services 118,000 - - - Capital Charges -
(436,768) (472,000) (472,000) Recharges (378,720) - - - Transfers to/from Reserves -
(2,078) - (30,760) NET EXPENDITURE (Including Recharges and Capital Charges)
(10)
ANALYSIS OF BUDGET VARIATIONS£
- (33,090) (21,250) (21,070)
Superannuation virement (2,420) (1,200)
(14,260) 93,280
(10)
ANALYSIS OF BUDGET VARIATIONS£
Base Budget 2011/12 - (28,060) (1,200) (1,500)
Outturn 2011/12 (P7 Forecast) (30,760)
£19.4K transfer to Strategic Planning
Fees and ChargesSupplies and ServicesEmployees
COMMENTS
COMMENTS
Capital ChargesSupport ServicesPremises
Staff transfer to Land ChargesStaff transfer to Building ControlMTFP 15% savings target Deleted post
BUSINESS MANAGER and HEAD of BUILDING CONTROL
REVENUE BUDGET
Holding Account for the costs of the administration for Planning and Building Control Service, this budget is recharged to those services
Planning Administration
HEAD of PLANNING and DEVELOPMENT
NOTES
Base Budget 2011/12
Budget 2012/13
43

SERVICESERVICE DESCRIPTION
SERVICE MANAGERBUDGET MANAGER
ACTUAL ESTIMATE PROJECTED DETAIL ESTIMATEOUTTURN
2010/11 2011/12 2011/12 2012/13£ £ £ £
EXPENDITURE171,563 97,630 96,960 Employees 130,180
- - - Premises - 74,415 90,200 90,200 Supplies and Services 90,200
900 700 700 Transport 700 246,878 188,530 187,860 TOTAL EXPENDITURE 221,080
INCOME(90,075) - - Grants - (2,856) - - Fees and Charges (32,800)
153,948 188,530 187,860 NET CONTROLLABLE
EXPENDITURE 188,280 RECHARGES & CAPITAL CHARGES
27,488 13,900 13,900 Support Services 16,360 138,747 - - Capital Charges -
- - - Recharges - - - - Transfers to/from Reserves -
320,183 202,430 201,760 NET EXPENDITURE (Including
Recharges and Capital Charges) 204,640
ANALYSIS OF BUDGET VARIATIONS£
202,430 33,220
Superannuation virement (670) (32,800)
2,460 204,640
ANALYSIS OF BUDGET VARIATIONS£
Base Budget 2011/12 202,430 Employees (670) Outturn 2011/12 (P7 Forecast) 201,760
COMMENTS
REVENUE BUDGET
Planning and supporting growth in the area for both local and incoming business
Economic Development
HEAD of PLANNING and DEVELOPMENT
NOTES
Fees and ChargesSupport Services
Base Budget 2011/12
Budget 2012/13
BUSINESS MANAGER and HEAD of BUILDING CONTROL
COMMENTS
Greenov Project (1 FTE)
Greenov Grant
Employees
44

ACTUAL ESTIMATE PROJECTED DETAIL ESTIMATEOUTTURN
2010/11 2011/12 2011/12 2012/13£ £ £ £
- (16,250) (21,190) Accountancy (120) - (40) 7,450 Exchequer Services - - (10) (1,210) Debtors/Debt Collection (10)
(117,856) (93,500) (93,760) Business Rate Collection (79,410) 457,805 459,900 446,360 Council Tax Collection 480,420 426,157 370,460 346,690 Housing Benefit Administration 433,170
(200,287) (250,000) (250,000) Housing Benefit Payments (237,290) (1,818) (490) (490) Housing Advances (700)
820,624 - (175,260) Concessionary Fares - 57,314 (1,320) (64,670) Miscellaneous Expenditure 2,650
(3,206,270) 1,538,080 1,546,970 Non Distributed Costs (NDC) 1,489,900
(1,764,331) 2,006,830 1,740,890 SERVICE EXPENDITURE 2,088,610
REVENUE BUDGET
FINANCIAL SERVICES
45

SUBJECTIVE ANALYSIS - 2012/13 ESTIMATEFINANCIAL SERVICES
Accountancy Exchequer Services
Debtors/Debt Collection
Business Rate Collection
Council Tax Collection
Housing Benefit Administration Sub Total
EXPENDITUREEmployees 351,940 115,700 50,930 17,560 395,510 636,140 1,567,780 Premises - - - - - - - Supplies and Services 65,830 21,080 2,020 48,390 112,100 136,000 385,420 Transport 1,600 - 150 350 4,270 9,470 15,840 TOTAL EXPENDITURE 419,370 136,780 53,100 66,300 511,880 781,610 1,969,040 INCOMEGrants - - - ( 166,070) - ( 675,000) ( 841,070) Fees & Charges ( 7,000) - - ( 32,000) ( 325,000) ( 6,000) ( 370,000) TOTAL INCOME ( 7,000) - - ( 198,070) ( 325,000) ( 681,000) ( 1,211,070)
NET CONTROLLABLE EXPENDITURE 412,370 136,780 53,100 ( 131,770) 186,880 100,610 757,970 NON CONTROLLABLE ITEMSRecharged from other Accounts 130,830 45,820 40,520 52,360 293,540 332,560 895,630 Capital Charges - - - - - - - Recharged to other Accounts ( 543,320) ( 182,600) ( 93,630) - - - ( 819,550) Transfer to/from Reserves - - - - - - - TOTAL NON-CONTROLLABLE ITEMS ( 412,490) ( 136,780) ( 53,110) 52,360 293,540 332,560 76,080
NET EXPENDITURE ( 120) - ( 10) ( 79,410) 480,420 433,170 834,050
Sub Total Housing Benefit
Payments
Housing Advances
Concessionary Fares
Miscellaneous Expenditure
Non Distributed Costs (NDC) Total
EXPENDITUREEmployees 1,567,780 - - - - 1,817,600 3,385,380 Premises - - - - - - - Supplies and Services 385,420 41,599,810 500 - 42,000 - 42,027,730 Transport 15,840 - - - - - 15,840 TOTAL EXPENDITURE 1,969,040 41,599,810 500 - 42,000 1,817,600 45,428,950 INCOMEGrants ( 841,070) ( 40,500,000) - - ( 37,750) - ( 41,378,820) Fees & Charges ( 370,000) ( 1,337,100) ( 1,700) - 19,600 - ( 1,689,200) TOTAL INCOME ( 1,211,070) ( 41,837,100) ( 1,700) - ( 18,150) - ( 43,068,020)
- - NET CONTROLLABLE EXPENDITURE 757,970 ( 237,290) ( 1,200) - 23,850 1,817,600 2,360,930 NON CONTROLLABLE ITEMSRecharged from other Accounts 895,630 - 500 - 7,020 - 903,150 Capital Charges - - - - - - - Recharged to other Accounts ( 819,550) - - - ( 28,220) ( 327,700) ( 1,175,470) Transfer to/from Reserves - - - - - - - TOTAL NON-CONTROLLABLE ITEMS 76,080 - 500 - ( 21,200) ( 327,700) ( 272,320)
NET EXPENDITURE 834,050 ( 237,290) ( 700) - 2,650 1,489,900 2,088,610
46
SERVICE
SERVICE MANAGERBUDGET MANAGER
ACTUAL ESTIMATE PROJECTED DETAIL ESTIMATEOUTTURN
2010/11 2011/12 2011/12 2012/13£ £ £ £
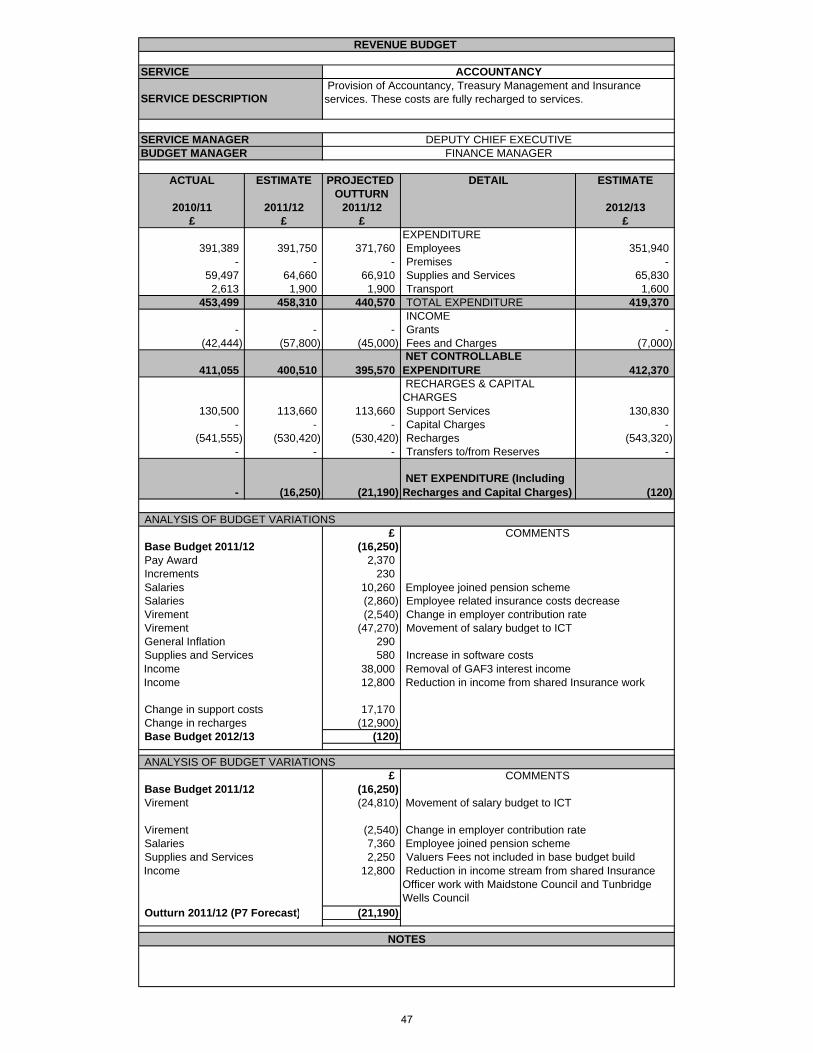
EXPENDITURE391,389 391,750 371,760 Employees 351,940
- - - Premises - 59,497 64,660 66,910 Supplies and Services 65,830 2,613 1,900 1,900 Transport 1,600
453,499 458,310 440,570 TOTAL EXPENDITURE 419,370 INCOME
- - - Grants - (42,444) (57,800) (45,000) Fees and Charges (7,000)
411,055 400,510 395,570 NET CONTROLLABLE
EXPENDITURE 412,370 RECHARGES & CAPITAL CHARGES
130,500 113,660 113,660 Support Services 130,830 - - - Capital Charges -
(541,555) (530,420) (530,420) Recharges (543,320) - - - Transfers to/from Reserves -
- (16,250) (21,190) NET EXPENDITURE (Including Recharges and Capital Charges) (120)
ANALYSIS OF BUDGET VARIATIONS£ COMMENTS
Base Budget 2011/12 (16,250) Pay Award 2,370 Increments 230 Salaries 10,260 Salaries (2,860) Virement (2,540) Virement (47,270) General Inflation 290 Supplies and Services 580
Income 38,000 Income 12,800
Change in support costs 17,170 Change in recharges (12,900) Base Budget 2012/13 (120)
ANALYSIS OF BUDGET VARIATIONS£ COMMENTS
Base Budget 2011/12 (16,250) Virement (24,810)
Virement (2,540) Salaries 7,360 Supplies and Services 2,250
Income 12,800
Outturn 2011/12 (P7 Forecast) (21,190)
Valuers Fees not included in base budget build
Change in employer contribution rate
Employee related insurance costs decrease
Movement of salary budget to ICT
Increase in software costs
NOTES
Reduction in income stream from shared Insurance Officer work with Maidstone Council and Tunbridge Wells Council
Removal of GAF3 interest income Reduction in income from shared Insurance work
Movement of salary budget to ICT
REVENUE BUDGET
Provision of Accountancy, Treasury Management and Insurance services. These costs are fully recharged to services.
ACCOUNTANCY
DEPUTY CHIEF EXECUTIVE
SERVICE DESCRIPTION
FINANCE MANAGER
Employee joined pension scheme
Employee joined pension scheme
Change in employer contribution rate
47

SERVICE
SERVICE MANAGERBUDGET MANAGER
ACTUAL ESTIMATE PROJECTED DETAIL ESTIMATEOUTTURN
2010/11 2011/12 2011/12 2012/13£ £ £ £
EXPENDITURE106,461 107,860 114,800 Employees 115,700
- - - Premises - 20,554 19,940 20,490 Supplies and Services 21,080
- - - Transport - 127,015 127,800 135,290 TOTAL EXPENDITURE 136,780
INCOME- - - Grants -
(65) - - Fees and Charges -
126,950 127,800 135,290 NET CONTROLLABLE EXPENDITURE 136,780 RECHARGES & CAPITAL CHARGES
46,199 40,450 40,450 Support Services 45,820 - - - Capital Charges -
(173,149) (168,290) (168,290) Recharges (182,600) - - - Transfers to/from Reserves -
- (40) 7,450 NET EXPENDITURE (Including Recharges and Capital Charges) -
ANALYSIS OF BUDGET VARIATIONS£ COMMENTS
Base Budget 2011/12 (40) Pay Award 790 Salaries (800) Salaries (90) Virement (760) Virement 8,700 General Inflation 280 Supplies and Services 860 Change in support costs 5,370 Change in recharges (14,310) Base Budget 2012/13 -
ANALYSIS OF BUDGET VARIATIONS£ COMMENTS
Base Budget 2011/12 (40) Virement (760) Virement 8,010 Other 240 Outturn 2011/12 (P7 Forecast) 7,450
Employee related insurance costs decrease
Predicted increase in cash collection service costs
Change in employer contribution rateMovement of budget from Council Tax Collection
NOTES
Movement of budget from Council Tax CollectionChange in employer contribution rate
Additional saving identified during budget build
SERVICE DESCRIPTION
REVENUE BUDGET
Provision for Creditors and income management functions. The costs are fully recharged to services.
EXCHEQUER SERVICES
DEPUTY CHIEF EXECUTIVEEXCHEQUER MANAGER
48

SERVICE
SERVICE MANAGERBUDGET MANAGER
ACTUAL ESTIMATE PROJECTED DETAIL ESTIMATEOUTTURN
2010/11 2011/12 2011/12 2012/13£ £ £ £
EXPENDITURE55,888 52,660 51,460 Employees 50,930
- - - Premises - 1,127 1,920 1,920 Supplies and Services 2,020
- 150 150 Transport 150 57,015 54,730 53,530 TOTAL EXPENDITURE 53,100
INCOME- - - Grants - - - - Fees and Charges -
57,015 54,730 53,530 NET CONTROLLABLE
EXPENDITURE 53,100 RECHARGES & CAPITAL
CHARGES 33,270 28,310 28,310 Support Services 40,520
- - - Capital Charges - (90,285) (83,050) (83,050) Recharges (93,630)
- - - Transfers to/from Reserves -
- (10) (1,210) NET EXPENDITURE (Including Recharges and Capital Charges) (10)
ANALYSIS OF BUDGET VARIATIONS£ COMMENTS
Base Budget 2011/12 (10) Pay Award 360 Salaries (510) Salaries (1,130) Virement (450) Supplies and Services 100 Change in support costs 12,210 Change in recharges (10,580) Base Budget 2012/13 (10)
ANALYSIS OF BUDGET VARIATIONS£ COMMENTS
Base Budget 2011/12 (10) Virement (450) Salaries (750) Additional saving identified during budget monitoringOutturn 2011/12 (P7 Forecast) (1,210)
NOTES
REVENUE BUDGET
DEBTORS/DEBT RECOVERY
DEPUTY CHIEF EXECUTIVEREVENUES AND BENEFITS MANAGER
Change in employer contribution rate
Collection of sundry debtors due to ABC
SERVICE DESCRIPTION
Change in employer contribution rate
Employee related insurance costs decreaseAdditional saving identified during budget build
49

REVENUE BUDGET
SERVICE
SERVICE MANAGERBUDGET MANAGER
ACTUAL ESTIMATE PROJECTED DETAIL ESTIMATEOUTTURN
2010/11 2011/12 2011/12 2012/13£ £ £ £
EXPENDITURE17,522 18,170 18,810 Employees 17,560
- - - Premises - 38,924 47,290 48,390 Supplies and Services 48,390
350 350 350 Transport 350 56,796 65,810 67,550 TOTAL EXPENDITURE 66,300
INCOME(180,448) (166,070) (166,070) Grants (166,070)
(29,973) (30,000) (32,000) Fees and Charges (32,000)
(153,625) (130,260) (130,520) NET CONTROLLABLE EXPENDITURE (131,770) RECHARGES & CAPITAL CHARGES
35,769 36,760 36,760 Support Services 52,360 - - - Capital Charges - - - - Recharges - - - - Transfers to/from Reserves -
(117,856) (93,500) (93,760) NET EXPENDITURE (Including Recharges and Capital Charges) (79,410)
ANALYSIS OF BUDGET VARIATIONS£ COMMENTS
Base Budget 2011/12 (93,500) Pay Award 120 Virement (130) Salaries (600) Additional saving identified during budget buildGeneral Inflation 120 Supplies and Services 980 Legal feesIncome (2,000) Court costs recoveredChange in support costs 15,600 Base Budget 2012/13 (79,410)
ANALYSIS OF BUDGET VARIATIONS£ COMMENTS
Base Budget 2011/12 (93,500) Virement (130) Salaries 770 Supplies and Services 1,100
Income (2,000)
Outturn 2011/12 (P7 Forecast) (93,760)
NOTES98% Collection Rate
4,000 Business Rate PropertiesEstimated Annual Receipts £41m
Increase in Legal Fees income to offset increase in legal fees due to more cases going to court
BUSINESS RATE COLLECTION
DEPUTY CHIEF EXECUTIVE
Collection on behalf of Central Government of the National Non-Domestic Rates
REVENUES AND BENEFITS MANAGER
SERVICE DESCRIPTION
Change in employer contribution rate
Change in employer contribution rate
Legal fees predicted increase offset by increase in income due to more cases going to court
50

SERVICE
SERVICE MANAGERBUDGET MANAGER
ACTUAL ESTIMATE PROJECTED DETAIL ESTIMATEOUTTURN
2010/11 2011/12 2011/12 2012/13£ £ £ £
EXPENDITURE404,342 424,370 413,300 Employees 395,510
- - - Premises - 81,519 113,800 135,610 Supplies and Services 112,100 3,255 4,460 3,960 Transport 4,270
489,116 542,630 552,870 TOTAL EXPENDITURE 511,880 INCOME
- - - Grants - (295,714) (325,000) (348,780) Fees and Charges (325,000)
193,402 217,630 204,090 NET CONTROLLABLE
EXPENDITURE 186,880 RECHARGES & CAPITAL CHARGES
264,403 242,270 242,270 Support Services 293,540 - - - Capital Charges - - - - Recharges - - - - Transfers to/from Reserves -
457,805 459,900 446,360 NET EXPENDITURE (Including Recharges and Capital Charges) 480,420
ANALYSIS OF BUDGET VARIATIONS£ COMMENTS
Base Budget 2011/12 459,900 Pay Award 2,830 Virement (3,060) Salaries (19,930)
Virement (8,700) General Inflation 50 Supplies and Services (1,750) Transport (190) Change in support costs 51,270 Base Budget 2012/13 480,420
ANALYSIS OF BUDGET VARIATIONS£ COMMENTS
Base Budget 2011/12 459,900 Virement (3,060) Virement (8,010) Supplies and Services (3,700) Savings delivered in year
25,510 Transport (500) Reduction in car miles allowanceFees and charges (23,780) Grant paid for single persons discount reviewOutturn 2011/12 (P7 Forecast) 446,360
Supplies and Services
NOTES
REVENUE BUDGET
Collection and administration of Council Tax COUNCIL TAX COLLECTION
DEPUTY CHIEF EXECUTIVEREVENUES AND BENEFITS MANAGER
98.7% Collection Rate50,000 Council Tax Accounts
Estimated Annual Receipts of £56.0m (£64.0m less £8.0m benefits)
Change in employer contribution rate Reallocation of salaries between revenue and benefits budgets Movement of budget to Exchequer Services
SERVICE DESCRIPTION
Increase due to single persons discount review
Movement of budget to Exchequer ServicesChange in employer contribution rate
Additional saving identified during budget buildReduction in external printing costs
51

SERVICE
SERVICE MANAGERBUDGET MANAGER
ACTUAL ESTIMATE PROJECTED DETAIL ESTIMATEOUTTURN
2010/11 2011/12 2011/12 2012/13£ £ £ £
EXPENDITURE728,207 663,030 639,960 Employees 636,140
- - - Premises - 178,105 127,100 141,000 Supplies and Services 136,000 12,916 10,110 8,810 Transport 9,470
919,228 800,240 789,770 TOTAL EXPENDITURE 781,610 INCOME
(819,574) (720,910) (755,210) Grants (675,000) (5,772) (26,000) (5,000) Fees and Charges (6,000)
93,882 53,330 29,560 NET CONTROLLABLE
EXPENDITURE 100,610 RECHARGES & CAPITAL CHARGES
312,275 317,130 317,130 Support Services 332,560 20,000 - - Capital Charges -
- - - Recharges - - - - Transfers to/from Reserves -
426,157 370,460 346,690 NET EXPENDITURE (Including Recharges and Capital Charges) 433,170
ANALYSIS OF BUDGET VARIATIONS£
Base Budget 2011/12 370,460 Pay Awards 4,210 Increments 5,330 Salaries 9,870
Salaries (4,460) Virement (37,530) Virement (4,310) Inflation 570 Supplies and Services 7,510 Grants 46,090 Income 20,000 Change in support costs 15,430 Base Budget 2012/13 433,170
ANALYSIS OF BUDGET VARIATIONS£
Base Budget 2011/12 370,460 Virement (4,310) Virement (22,060)
Salaries (5,500)
Supplies and Services 8,400 Increase in predicted off-site billing costsTransport (1,300) Income 1,000 Reduction in predicted legal fees recoveredOutturn 2011/12 (P7 Forecast) 346,690
Proposed fraud shared services saving not achieved
Employee related insurance costs decreaseMovement of salary budget to ICT
Reduction in admin grant
Average 8 days to process new benefit claims and change of circumstances
Change in employer contribution rate
9,900 Benefit ClaimantsNOTES
Movement of salary budget to ICT from Sept 1st
COMMENTS
Reallocation of salaries between revenue and benefits budgets
Identified saving during budget monitoring
REVENUE BUDGET
Administration of Housing and Council Tax Benefit on behalf of the Department of Works and Pensions
HOUSING BENEFIT ADMINISTRATION
DEPUTY CHIEF EXECUTIVEREVENUES AND BENEFITS MANAGER
SERVICE DESCRIPTION
Increase in off-site billing costs
Change in employer contribution rate
COMMENTS
52

SERVICE
SERVICE MANAGERBUDGET MANAGER
ACTUAL ESTIMATE PROJECTED DETAIL ESTIMATEOUTTURN
2010/11 2011/12 2011/12 2012/13£ £ £ £
EXPENDITURE- - - Employees - - - - Premises -
38,422,346 39,016,210 41,587,100 Supplies and Services 41,599,810 - - - Transport -
38,422,346 39,016,210 41,587,100 TOTAL EXPENDITURE 41,599,810 INCOME
(37,543,949) (38,530,000) (40,500,000) Grants (40,500,000) (1,079,251) (736,210) (1,337,100) Fees and Charges (1,337,100)
(200,854) (250,000) (250,000) NET CONTROLLABLE
EXPENDITURE (237,290) RECHARGES & CAPITAL CHARGES
567 - - Support Services - - - - Capital Charges - - - - Recharges - - - - Transfers to/from Reserves -
(200,287) (250,000) (250,000) NET EXPENDITURE (Including Recharges and Capital Charges) (237,290)
ANALYSIS OF BUDGET VARIATIONS£ COMMENTS
Base Budget 2011/12 (250,000) Benefits Inflation 12,910
2,570,690
(1,970,000)
(600,890)
Base Budget 2012/13 (237,290)
ANALYSIS OF BUDGET VARIATIONS£ COMMENTS
Base Budget 2011/12 (250,000) Supplies and Services
2,570,890
Grants (1,970,000)
Fees and Charges (600,890)
Outturn 2011/12 (P7 Forecast) (250,000)
Increase in payments of benefits due to various of reasons including: rent increases, increase in l i t Increase in reimbursement due to increase in
payments, overpayments are only reimbursed at a maximum of 40p in the pound Increase in predicted amount to be received back from
claimants, due to higher payments will result in higher overpayments
REVENUE BUDGET
Payment of Housing Benefits to Private Tenants (Rent Allowances) to Council Tenants (Rent Rebates) and Council Tax Benefits
HOUSING BENEFIT PAYMENTS
DEPUTY CHIEF EXECUTIVE
SERVICE DESCRIPTION
9,900 Benefit Claimants
Increase in payments of benefits due to various of reasons including: rent increases, increase in claimants
Increase in predicted amount to be received back from claimants, due to higher payments will result in higher overpayments
NOTES
REVENUES AND BENEFITS MANAGER
Increase in reimbursement due to increase in payments, overpayments are only reimbursed at a maximum of 40p in the pound
Grants
Supplies and Services
Fees and Charges
53

SERVICE
SERVICE MANAGERBUDGET MANAGER
ACTUAL ESTIMATE PROJECTED DETAIL ESTIMATEOUTTURN
2010/11 2011/12 2011/12 2012/13£ £ £ £
EXPENDITURE- - - Employees - - - - Premises -
500 500 500 Supplies and Services 500 - - - Transport -
500 500 500 TOTAL EXPENDITURE 500 INCOME
- - - Grants - (2,477) (1,700) (1,700) Fees and Charges (1,700)
(1,977) (1,200) (1,200) NET CONTROLLABLE
EXPENDITURE (1,200) RECHARGES & CAPITAL
CHARGES 159 710 710 Support Services 500
- - - Capital Charges - - - - Recharges - - - - Transfers to/from Reserves -
(1,818) (490) (490) NET EXPENDITURE (Including Recharges and Capital Charges) (700)
ANALYSIS OF BUDGET VARIATIONS£ COMMENTS
Base Budget 2011/12 (490) Change in support costs (210) Base Budget 2012/13 (700)
ANALYSIS OF BUDGET VARIATIONS£ COMMENTS
Base Budget 2011/12 (490) Outturn 2011/12 (P7 Forecast) (490)
NOTES
SERVICE DESCRIPTION
REVENUE BUDGET
Residual mortgage repayments in respect of Council properties sold under the Right to Buy scheme
HOUSING ADVANCES
DEPUTY CHIEF EXECUTIVEFINANCE MANAGER
54

SERVICE
SERVICE MANAGERBUDGET MANAGER
ACTUAL ESTIMATE PROJECTED DETAIL ESTIMATEOUTTURN
2010/11 2011/12 2011/12 2012/13£ £ £ £
EXPENDITURE3,850 - - Employees -
- - - Premises - 954,662 - (175,260) Supplies and Services -
- - - Transport - 958,512 - (175,260) TOTAL EXPENDITURE -
INCOME(168,931) - - Grants -
(1,196) - - Fees and Charges -
788,385 - (175,260) NET CONTROLLABLE
EXPENDITURE - RECHARGES & CAPITAL
CHARGES 32,239 - - Support Services -
- - - Capital Charges - - - - Recharges - - - - Transfers to/from Reserves -
820,624 - (175,260) NET EXPENDITURE (Including Recharges and Capital Charges) -
ANALYSIS OF BUDGET VARIATIONS£ COMMENTS
Base Budget 2011/12 - Base Budget 2012/13 -
ANALYSIS OF BUDGET VARIATIONS£ COMMENTS
Base Budget 2010/11 - Supplies and Services
(175,260)
Outturn 2010/11 (P6 Forecast) (175,260)
REVENUE BUDGET
The cost of the Concessionary bus pass scheme - For 2011/12 the administration of this scheme is to be changed to Kent County Council
Concessionary Fares
DEPUTY CHIEF EXECUTIVE
SERVICE DESCRIPTION
From 2011/12 the administration of this scheme was changed to Kent County CouncilNOTES
One off saving against accrual set aside for legal fees against Stagecoach claim
FINANCE MANAGER
55

SERVICE
SERVICE MANAGERBUDGET MANAGER
ACTUAL ESTIMATE PROJECTED DETAIL ESTIMATEOUTTURN
2010/11 2011/12 2011/12 2012/13£ £ £ £
EXPENDITURE14,796 - - Employees -
- - - Premises - 373,037 32,000 (25,000) Supplies and Services 42,000
- - - Transport - 387,833 32,000 (25,000) TOTAL EXPENDITURE 42,000
INCOME(40,098) (29,400) (37,750) Grants (37,750)
(288,042) 15,600 17,600 Fees and Charges 19,600
59,693 18,200 (45,150) NET CONTROLLABLE EXPENDITURE 23,850 RECHARGES & CAPITAL CHARGES
10,349 8,700 8,700 Support Services 7,020 - - - Capital Charges -
(12,728) (28,220) (28,220) Recharges (28,220) - - - Transfers to/from Reserves -
57,314 (1,320) (64,670) NET EXPENDITURE (Including Recharges and Capital Charges) 2,650
ANALYSIS OF BUDGET VARIATIONS£ COMMENTS
Base Budget 2011/12 (1,320) General Inflation 800 Supplies and Services 9,200
Grant (8,350) Income 4,000 Change in support costs (1,680) Base Budget 2012/13 2,650
ANALYSIS OF BUDGET VARIATIONS£ COMMENTS
Base Budget 2011/12 (1,320) Supplies and Services 10,000 Increase in predicted bank charges
(67,000)
Income (8,350) Increase in second homes fundingFees and charges (2,000) Increase in Credit Card Handling ChargesFees and charges 4,000 Increase in brokers & Treasury Advisors feesOutturn 2011/12 (P7 Forecast) (64,670)
Supplies and Services
NOTES
Release of accrual for outstanding VAT consultant fees
REVENUE BUDGET
Includes bank charges and treasury management fees MISCELLANEOUS EXPENDITURE
DEPUTY CHIEF EXECUTIVE
Increase in second home discount funding Increase in Treasury Management Advisor costs
Increase in bank charges
FINANCE MANAGER
SERVICE DESCRIPTION
56

SERVICE
SERVICE MANAGERBUDGET MANAGER
ACTUAL ESTIMATE PROJECTED DETAIL ESTIMATEOUTTURN
2010/11 2011/12 2011/12 2012/13£ £ £ £
EXPENDITURE1,705,532 1,808,110 1,841,000 Employees 1,817,600
- - - Premises - - - - Supplies and Services - - - - Transport -
1,705,532 1,808,110 1,841,000 TOTAL EXPENDITURE 1,817,600 INCOME
- - - Grants - - - - Fees and Charges -
1,705,532 1,808,110 1,841,000 NET CONTROLLABLE
EXPENDITURE 1,817,600 RECHARGES & CAPITAL CHARGES
- - - Support Services - (4,628,622) - - Capital Charges -
(283,180) (331,260) (331,260) Recharges (327,700) - 61,230 37,230 Transfers to/from Reserves -
(3,206,270) 1,538,080 1,546,970 NET EXPENDITURE (Including Recharges and Capital Charges) 1,489,900
ANALYSIS OF BUDGET VARIATIONS£ COMMENTS
Base Budget 2010/11 1,538,080 15% saving (43,000)
(12,510)
65,000 Increase in amount for Superannuation Backfunding 3,560
Transfer to reserve (61,230)Base Budget 2011/12 1,489,900
ANALYSIS OF BUDGET VARIATIONS£ COMMENTS
Base Budget 2011/12 1,538,080 32,890
Transfer from reserves (24,000) Outturn 2011/12 (P7 Forecast) 1,546,970
Increase in payments towards pension scheme for early retirement of officers
Early Retirement Officers Pension payments
Additional saving for payments towards pension scheme for early retirement of officers
Change in recharges Superannuation Backfunding
Increase in amount recharged to HRA
NOTES
Transfer not required
The Triennial valuation of the Pension fund was completed during 2010/11 resulting in a new employer rates from 2011/12. ABC moved to a fixed deficit contribution rate from 2011/12 for 3 years, removing the impact of any structural changes in the establishment and providing certainty for the next 3 years.
Increase in amount drawdown from reserve
Early Retirement Officers Pension payments
Retired officer pension saving
FINANCE MANAGER
REVENUE BUDGET
DEPUTY CHIEF EXECUTIVE
Those costs that are specifically excluded (by CIPFA's Code of Practice) from full allocation to individual services because to include them would distort the true cost of those services within the accounting year.
NON - DISTRIBUTED COSTS (NDC)
SERVICE DESCRIPTIONThe only costs that this Council can presently treat as NDC are pension costs relating to Retired Officers Pensions and Back funding of the Superannuation Scheme (i.e. the recovery of the pension fund deficit).
57

REVENUE BUDGET
BUSINESS CHANGE and TECHNOLOGY TEAM
ACTUAL ESTIMATE PROJECTED DETAIL ESTIMATEOUTTURN
2010/11 2011/12 2011/12 2012/13£ £ £ £
- - (14,490) Telephones (40) 55,956 72,070 94,190 Business Transformation Team 16,790 43,612 (20) 47,990 Information Technology (14,930)
99,568 72,050 127,690 SERVICE EXPENDITURE 1,820
58

SUBJECTIVE ANALYSIS - 2012/13 ESTIMATEBUSINESS CHANGE and TECHNOLOGY TEAM
Telephones Business
Transformation Team
Information Technology Total
£ £ £ £
EXPENDITUREEmployees 27,110 118,690 531,710 677,510 Premises - - - - Supplies and Services 68,530 - 225,550 294,080 Transport - 320 4,050 4,370 TOTAL EXPENDITURE 95,640 119,010 761,310 975,960 INCOMEGrants - - - - Fees & Charges ( 2,100) - ( 27,500) ( 29,600) TOTAL INCOME ( 2,100) - ( 27,500) ( 29,600)
NET CONTROLLABLE EXPENDITURE 93,540 119,010 733,810 946,360 NON CONTROLLABLE ITEMSRecharged from other Accounts 3,930 11,680 93,110 108,720 Capital Charges - - - - Recharged to other Accounts ( 97,510) ( 113,900) ( 841,850) ( 1,053,260) Transfer to/from Reserves - - - - TOTAL NON-CONTROLLABLE ITEMS ( 93,580) ( 102,220) ( 748,740) ( 944,540)
NET EXPENDITURE ( 40) 16,790 ( 14,930) 1,820
59

REVENUE BUDGET
SERVICE TELEPHONESSERVICE DESCRIPTION This is the budget for all the organisations telephones and is recharged
to individual services.
SERVICE MANAGER HEAD OF BUSINESS CHANGE and TECHNOLOGY TEAMBUDGET MANAGER IT OPERATIONS MANAGER
ACTUAL ESTIMATE PROJECTED DETAIL ESTIMATEOUTTURN
2010/11 2011/12 2011/12 2012/13£ £ £ £
EXPENDITURE26,761 27,690 26,500 Employees 27,110
- - - Premises - 68,366 70,210 56,910 Supplies and Services 68,530
- - - Transport - 95,127 97,900 83,410 TOTAL EXPENDITURE 95,640
INCOME- - - Grants -
(1,951) (2,100) (2,100) Fees and Charges (2,100)
93,176 95,800 81,310 NET CONTROLLABLE
EXPENDITURE 93,540 RECHARGES & CAPITAL
CHARGES 8,067 7,930 7,930 Support Services 3,930
- - - Capital Charges - (101,243) (103,730) (103,730) Recharges (97,510)
- - - Transfers to/from Reserves -
- - (14,490) NET EXPENDITURE (Including Recharges and Capital Charges) (40)
ANALYSIS OF BUDGET VARIATIONS£ COMMENTS
Base Budget 2011/12 - Pay Award 190 Salaries (150) Employee related insurance costsSalaries (420) Virement (200) Change in employer contribution rateSupplies and Services (1,680) Saving identified during budget buildChange in support costs (4,000) Change in recharges 6,220 Base Budget 2012/13 (40)
ANALYSIS OF BUDGET VARIATIONS£ COMMENTS
Base Budget 2011/12 - Virement (200) Change in employer contribution rateSalaries (990) Virement (13,300) Movement of budget to customer services Outturn 2011/12 (P7 Forecast) (14,490)
NOTES
60

REVENUE BUDGET
SERVICE BUSINESS CHANGE TEAMSERVICE DESCRIPTION The Business Change function provides a central management point
for all projects that are considered to be of corporate importance; ensuring that they are consistent with the aims of the Business Plan, that they are tracked effectively and that progress is reported in a timely and effective way
SERVICE MANAGER HEAD OF BUSINESS CHANGE and TECHNOLOGY TEAMBUDGET MANAGER HEAD OF BUSINESS CHANGE and TECHNOLOGY TEAM
ACTUAL ESTIMATE PROJECTED DETAIL ESTIMATEOUTTURN
2010/11 2011/12 2011/12 2012/13£ £ £ £
EXPENDITURE55,948 97,050 145,870 Employees 118,690
- - - Premises - - - - Supplies and Services - 8 3,370 3,370 Transport 320
55,956 100,420 149,240 TOTAL EXPENDITURE 119,010 INCOME
- - - Grants - - - - Fees and Charges -
55,956 100,420 149,240 NET CONTROLLABLE
EXPENDITURE 119,010 RECHARGES & CAPITAL CHARGES
- 7,680 7,680 Support Services 11,680 - - - Capital Charges - - (36,030) (36,030) Recharges (113,900) - - (26,700) Transfers to/from Reserves -
55,956 72,070 94,190 NET EXPENDITURE (Including Recharges and Capital Charges) 16,790
ANALYSIS OF BUDGET VARIATIONS£ COMMENTS
Base Budget 2011/12 72,070 Pay Award 880 Increments 340 Virement (320) Change in employer contribution rateVirement 20,600 Member of staff moved from Executive SupportSalaries (180) Employee related insurance costsSalaries 320 Transport (3,050) Change in support costs 4,000 Change in recharges (77,870) Base Budget 2012/13 16,790
ANALYSIS OF BUDGET VARIATIONS£ COMMENTS
Base Budget 2011/12 72,070 Virement (320) Change in employer contribution rateVirement 20,600 Member of staff moved from Executive SupportSalaries 1,840 Outturn 2011/12 (P7 Forecast) 94,190
NOTES
61

REVENUE BUDGET
SERVICE INFORMATION TECHNOLOGYSERVICE DESCRIPTION Provision of IT support to all services and to lead in the development of
new applications. This budget includes GIS
SERVICE MANAGER HEAD OF BUSINESS CHANGE and TECHNOLOGY TEAMBUDGET MANAGER IT OPERATIONS MANAGER
ACTUAL ESTIMATE PROJECTED DETAIL ESTIMATEOUTTURN
2010/11 2011/12 2011/12 2012/13£ £ £ £
EXPENDITURE466,661 439,820 500,980 Employees 531,710
889 - - Premises - 237,349 254,450 242,300 Supplies and Services 225,550
6,980 4,050 4,050 Transport 4,050 711,879 698,320 747,330 TOTAL EXPENDITURE 761,310
INCOME(16,086) - - Grants - (23,763) (24,100) (25,100) Fees and Charges (27,500)
672,030 674,220 722,230 NET CONTROLLABLE
EXPENDITURE 733,810 RECHARGES & CAPITAL CHARGES
80,241 74,600 74,600 Support Services 93,110 73,738 - - Capital Charges -
(782,397) (748,840) (748,840) Recharges (841,850) - - - Transfers to/from Reserves -
43,612 (20) 47,990 NET EXPENDITURE (Including Recharges and Capital Charges) (14,930)
ANALYSIS OF BUDGET VARIATIONS£ COMMENTS
Base Budget 2011/12 (20) 15% Saving (6,000) Software savingPay Award 3,580 Virement (3,160) Change in employer contribution rate
Virement 84,800 From financial services due to movement of staff
Salaries 7,610 Regrading of post within structure Salaries (940) Employee related insurance costs decrease
General Inflation 790 Supplies and Services (16,820) Multi funcitional devices budget built based on current
lease arrangements, current print charges, and recent historical usage for future trend
Supplies and Services (7,590) Contract costs Fees and Charges (2,680) Support to external organisation Changes in support costs 18,510 Virement (15,000) To Allocable Corporate Costs for required saving within
GIS budget Changes in recharges (78,010) Base Budget 2012/13 (14,930)
ANALYSIS OF BUDGET VARIATIONS£ COMMENTS
Base Budget 2011/12 (20) Virement (3,160) Change in employer contribution rateVirement 46,870 From financial services due to internal movement of
two employees Salaries 4,300 Regrading of post within structure Outturn 2011/12 (P7 Forecast) 47,990
NOTES
62

ACTUAL ESTIMATE PROJECTED DETAIL ESTIMATEOUTTURN
2010/11 2011/12 2011/12 2012/13£ £ £ £
1,091,614 116,030 116,240 Private Sector Housing 121,020 1,842,839 118,560 127,200 Housing Strategy and Enabling 65,840
605,075 553,900 539,850 Housing Options 439,850 26,764 (4,590) (4,680) Chilmington Travellers Site (4,750)
(87,065) (166,310) (150,220) Private Sector Leasing (PSL) (153,240) 19,015 20 14,730 Visitor and Call Centre (27,780)
- 10 (21,310) Executive Support 20 (225,302) 10 (36,420) Corporate Property 55,580
1,006 (34,980) 33,520 Property Management and Maintenance 10 (198,403) (195,320) (209,810) Industrial Estates (223,520)
45,846 39,320 28,350 Commercial Properties 9,900 (102,950) 34,990 (94,270) Council Offices 55,130
3,018,439 461,640 343,180 SERVICE EXPENDITURE 338,060
REVENUE BUDGET
CUSTOMERS, HOMES and PROPERTY SERVICES
63

PRIVATE SECTOR HOUSING
HOUSING STRATEGY AND
ENABLING
HOUSING OPTIONS
CHILMINGTON TRAVELLERS
SITE
PRIVATE SECTOR
LEASING (PSL)
VISITOR AND CALL CENTRE
EXECUTIVE SUPPORT
£ £ £ £ £ £ £
EXPENDITUREEmployees 77,880 105,970 307,030 12,240 41,410 498,120 49,830 Premises - - 2,500 46,600 60,000 - - Supplies and Services 16,600 1,790 288,600 - 480,600 34,530 11,700 Transport 400 2,790 4,230 - 700 5,000 - TOTAL EXPENDITURE 94,880 110,550 602,360 58,840 582,710 537,650 61,530 INCOMEGrants - - ( 50,000) - - ( 45,000) - Fees & Charges ( 3,500) - ( 181,770) ( 73,680) ( 747,270) ( 14,770) - TOTAL INCOME ( 3,500) - ( 231,770) ( 73,680) ( 747,270) ( 59,770) - NET CONTROLLABLE EXPENDITURE 91,380 110,550 370,590 ( 14,840) ( 164,560) 477,880 61,530 Recharged from other Accounts 29,640 21,080 69,260 5,780 11,320 96,380 31,060 Capital Charges - 1,350 - 4,310 - 19,000 - Recharged to other Accounts - ( 67,140) - - - ( 621,040) ( 92,570) Transfer to/from Reserves - - - - - - - TOTAL NON-CONTROLLABLE ITEMS 29,640 ( 44,710) 69,260 10,090 11,320 ( 505,660) ( 61,510)
NET EXPENDITURE 121,020 65,840 439,850 ( 4,750) ( 153,240) ( 27,780) 20
CORPORATE PROPERTY
PROPERTY MANAGEMENT
& MAINTENANCE
INDUSTRIAL ESTATES
COMMERCIAL PROPERTIES
COUNCIL OFFICES Total
£ £ £ £ £ £
EXPENDITUREEmployees 199,170 - - - 89,030 1,380,680 Premises - 131,100 10,820 3,900 544,130 799,050 Supplies and Services 650 1,080 3,320 4,500 90,430 933,800 Transport 2,040 - - - - 15,160 TOTAL EXPENDITURE 201,860 132,180 14,140 8,400 723,590 3,128,690 INCOMEGrants - - - - - ( 95,000) Fees & Charges ( 500) - ( 380,000) ( 88,410) ( 448,550) ( 1,938,450) TOTAL INCOME ( 500) - ( 380,000) ( 88,410) ( 448,550) ( 2,033,450) NET CONTROLLABLE EXPENDITURE 201,360 132,180 ( 365,860) ( 80,010) 275,040 1,095,240 Recharged from other Accounts 56,990 24,870 80,790 57,560 134,110 618,840 Capital Charges - - 61,550 32,350 387,090 505,650 Recharged to other Accounts ( 202,770) ( 157,040) - - ( 844,820) ( 1,985,380) Transfer to/from Reserves - - - - 103,710 103,710 TOTAL NON-CONTROLLABLE ITEMS ( 145,780) ( 132,170) 142,340 89,910 ( 219,910) ( 757,180)
NET EXPENDITURE 55,580 10 ( 223,520) 9,900 55,130 338,060
SUBJECTIVE ANALYSIS - 2012/13 ESTIMATECUSTOMERS, HOMES and PROPERTY SERVICES
64

SERVICESERVICE DESCRIPTION
SERVICE MANAGERBUDGET MANAGER
ACTUAL ESTIMATE PROJECTED OUTTURN
DETAIL ESTIMATE
2010/11 2011/12 2011/12 2012/13£ £ £ £
EXPENDITURE59,885 68,560 66,770 Employees 77,880
26 - - Premises - 34,883 12,450 14,450 Supplies and Services 16,600
274 - - Transport 400 95,068 81,010 81,220 TOTAL EXPENDITURE 94,880
INCOME- - - Grants -
(2,530) (1,500) (1,500) Fees and Charges (3,500) 92,538 79,510 79,720 NET CONTROLLABLE
EXPENDITURE 91,380
RECHARGES & CAPITAL CHARGES 50,163 36,520 36,520 Support Services 29,640
948,913 - - Capital Charges - - - - Recharges - - - - Transfers to/from Reserves -
1,091,614 116,030 116,240 NET EXPENDITURE (Including Recharges and Capital Charges)
121,020
ANALYSIS OF BUDGET VARIATIONS£
116,030 600
9,510 Superannuation virement (790)
4,150 400
(2,000) (6,880)
121,020 ANALYSIS OF BUDGET VARIATIONS
£116,030
(1,790) 2,000
116,240
NOTES
REVENUE BUDGET
PRIVATE SECTOR HOUSING
HEAD OF CUSTOMERS, HOMES and PROPERTYHOUSING OPERATIONS MANAGER
Employees
To improve the quality of private sector housing stock and to provide services to private sector landlords, as well as the administration of disabled facilities grants
Increase in HMO licenses
Supplies and Services
Fees & ChargesSupport Services
Base Budget 2011/12
Outturn 2011/12 (P7 Forecast)
COMMENTS
EmployeesSupplies and Services
Transport
Budget 2012/13
15% Savings target not fully achieved
Emergency Remedial action/Accreditation fee
Base Budget 2011/12COMMENTS
65

SERVICESERVICE DESCRIPTION
SERVICE MANAGERBUDGET MANAGER
ACTUAL ESTIMATE PROJECTED OUTTURN
DETAIL ESTIMATE
2010/11 2011/12 2011/12 2012/13£ £ £ £
EXPENDITURE91,947 82,950 100,520 Employees 105,970
- - - Premises - 22,379 9,710 3,360 Supplies and Services 1,790 3,521 2,880 1,300 Transport 2,790
117,847 95,540 105,180 TOTAL EXPENDITURE 110,550 INCOME
- - - Grants - (297) - (1,000) Fees and Charges -
117,550 95,540 104,180 NET CONTROLLABLE EXPENDITURE
110,550
RECHARGES & CAPITAL CHARGES 14,759 23,020 23,020 Support Services 21,080
1,710,530 - - Capital Charges 1,350 - - - Recharges (67,140) - - - Transfers to/from Reserves -
1,842,839 118,560 127,200 NET EXPENDITURE (Including Recharges and Capital Charges)
65,840
ANALYSIS OF BUDGET VARIATIONS£
118,560 23,450
Superannuation virement (430) (7,920)
(90) (1,940) 1,350
(67,140) 65,840
ANALYSIS OF BUDGET VARIATIONS£
118,560 17,570 (6,350) (1,580) (1,000)
127,200
Employees
COMMENTS
Capital Charges
Staff time moved from HRA To GF Base Budget 2011/12
Action with Communities Grant/Printing/Equipment
Staff time moved from HRA To GF
Recharges
Action with Communities GrantEmployees
NOTES
REVENUE BUDGET
To encourage the provision of social housing outside of the HRAHOUSING STRATEGY AND ENABLING
HEAD OF CUSTOMERS, HOMES and PROPERTYSTRATEGIC HOUSING AND PROPERTY MANAGER
Corporate Projects
Base Budget 2011/12
Outturn 2011/12 (P7 Forecast)
Supplies and ServicesTransportFees & Charges
Supplies and ServicesTransport
COMMENTS
Support Services
Budget 2012/13
66

SERVICESERVICE DESCRIPTION
SERVICE MANAGERBUDGET MANAGER
ACTUAL ESTIMATE PROJECTED OUTTURN
DETAIL ESTIMATE
2010/11 2011/12 2011/12 2012/13£ £ £ £
EXPENDITURE394,741 330,730 328,680 Employees 307,030
(3,824) 2,600 2,600 Premises 2,500 313,093 288,140 318,140 Supplies and Services 288,600
1,048 910 910 Transport 4,230 705,058 622,380 650,330 TOTAL EXPENDITURE 602,360
INCOME(32,050) (31,000) (50,000) Grants (50,000)
(113,961) (130,000) (153,000) Fees and Charges (181,770) 559,047 461,380 447,330 NET CONTROLLABLE
EXPENDITURE 370,590
RECHARGES & CAPITAL CHARGES 46,028 91,210 91,210 Support Services 69,260
- 1,310 1,310 Capital Charges - - - - Recharges - - - - Transfers to/from Reserves -
605,075 553,900 539,850 NET EXPENDITURE (Including Recharges and Capital Charges)
439,850
ANALYSIS OF BUDGET VARIATIONS£
553,900 Housing employment officer 14,770 Offset by income from partner organisations
(36,420)
Superannuation virement (2,050) (100) 460
3,320 (19,000)
Additional income from HRA (17,000) Key handlingShared service income (14,770) Housing Employment Officer
(20,000) (21,950)
(1,310) 439,850
ANALYSIS OF BUDGET VARIATIONS£
553,900 (2,050) 30,000
(19,000) (23,000) 539,850
HEAD OF CUSTOMERS, HOMES and PROPERTY
Premises
Employees
HOUSING OPERATIONS MANAGER
Improvement & Strategy Development Officer moved from GF to HRA
REVENUE BUDGET
HOUSING OPTIONSThe administration of the homeless service including B & B, providing housing advice and maintenance of the housing register
NOTES
Outturn 2011/12 (P7 Forecast)
Support Services
Homelessness grant
COMMENTSBase Budget 2011/12
Budget 2012/13Capital Charges
Supplies and ServicesTransport
Bed and Breakfast income
Increase in Government Grant
Increased Government GrantBed and Breakfast Accommodation
Base Budget 2011/12COMMENTS
Bed and Breakfast Accommodation ChargeFees & Charges
EmployeesSupplies and ServicesGrants
67

SERVICESERVICE DESCRIPTION
SERVICE MANAGERBUDGET MANAGER
ACTUAL ESTIMATE PROJECTED OUTTURN
DETAIL ESTIMATE
2010/11 2011/12 2011/12 2012/13£ £ £ £
EXPENDITURE13,306 12,500 12,410 Employees 12,240 45,070 46,080 46,080 Premises 46,600
318 - - Supplies and Services - 849 - - Transport -
59,543 58,580 58,490 TOTAL EXPENDITURE 58,840 INCOME
- - - Grants - (40,204) (71,600) (71,600) Fees and Charges (73,680) 19,339 (13,020) (13,110) NET CONTROLLABLE
EXPENDITURE (14,840)
RECHARGES & CAPITAL CHARGES 3,117 4,240 4,240 Support Services 5,780 4,308 4,190 4,190 Capital Charges 4,310
- - - Recharges - - - - Transfers to/from Reserves -
26,764 (4,590) (4,680) NET EXPENDITURE (Including Recharges and Capital Charges)
(4,750)
ANALYSIS OF BUDGET VARIATIONS£
(4,590) (170)
Superannuation virement (90) 520
(2,080) 1,540
120 (4,750)
ANALYSIS OF BUDGET VARIATIONS£
(4,590) (90)
(4,680) Employees
NOTES
Outturn 2011/12 (P7 Forecast)
HOUSING IMPROVEMENT MANAGER
Fees & ChargesSupport Services
Employees
Premises
Base Budget 2011/12COMMENTS
REVENUE BUDGET
Provision of the Travellers site at ChilmingtonCHILMINGTON TRAVELLERS SITE
HEAD OF CUSTOMERS, HOMES and PROPERTY
COMMENTS
Capital Charges
Base Budget 2011/12
Budget 2012/13
68
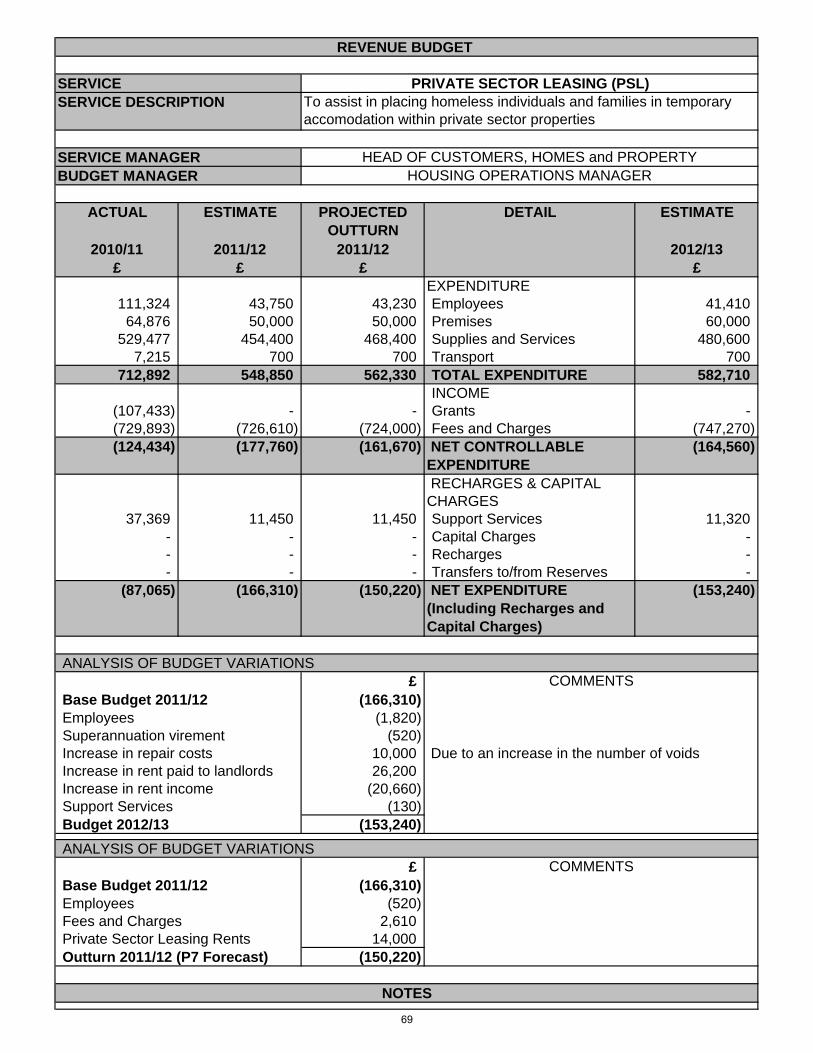
SERVICESERVICE DESCRIPTION
SERVICE MANAGERBUDGET MANAGER
ACTUAL ESTIMATE PROJECTED OUTTURN
DETAIL ESTIMATE
2010/11 2011/12 2011/12 2012/13£ £ £ £
EXPENDITURE111,324 43,750 43,230 Employees 41,410
64,876 50,000 50,000 Premises 60,000 529,477 454,400 468,400 Supplies and Services 480,600
7,215 700 700 Transport 700 712,892 548,850 562,330 TOTAL EXPENDITURE 582,710
INCOME(107,433) - - Grants - (729,893) (726,610) (724,000) Fees and Charges (747,270) (124,434) (177,760) (161,670) NET CONTROLLABLE
EXPENDITURE (164,560)
RECHARGES & CAPITAL CHARGES
37,369 11,450 11,450 Support Services 11,320 - - - Capital Charges - - - - Recharges - - - - Transfers to/from Reserves -
(87,065) (166,310) (150,220) NET EXPENDITURE (Including Recharges and Capital Charges)
(153,240)
ANALYSIS OF BUDGET VARIATIONS£
(166,310) (1,820)
Superannuation virement (520) 10,000 26,200
(20,660) (130)
(153,240) ANALYSIS OF BUDGET VARIATIONS
£(166,310)
(520) Fees and Charges 2,610
14,000 (150,220)
Employees
Increase in repair costsIncrease in rent paid to landlordsIncrease in rent income
NOTES
REVENUE BUDGET
To assist in placing homeless individuals and families in temporary accomodation within private sector properties
PRIVATE SECTOR LEASING (PSL)
HEAD OF CUSTOMERS, HOMES and PROPERTYHOUSING OPERATIONS MANAGER
Due to an increase in the number of voids
Base Budget 2011/12COMMENTS
Outturn 2011/12 (P7 Forecast)Private Sector Leasing Rents
Employees
Budget 2012/13
Base Budget 2011/12
Support Services
COMMENTS
69

SERVICESERVICE DESCRIPTION
SERVICE MANAGERBUDGET MANAGER
ACTUAL ESTIMATE PROJECTED OUTTURN
DETAIL ESTIMATE
2010/11 2011/12 2011/12 2012/13£ £ £ £
EXPENDITURE446,299 500,990 511,430 Employees 498,120
- - - Premises - (12,519) 38,270 53,790 Supplies and Services 34,530
4,140 5,000 5,000 Transport 5,000 437,920 544,260 570,220 TOTAL EXPENDITURE 537,650
INCOME(47,162) (45,000) (56,250) Grants (45,000)
(7,118) - - Fees and Charges (14,770) 383,640 499,260 513,970 NET CONTROLLABLE
EXPENDITURE 477,880
RECHARGES & CAPITAL CHARGES 176,375 125,850 125,850 Support Services 96,380
18,999 5,550 5,550 Capital Charges 19,000 (559,999) (630,640) (630,640) Recharges (621,040)
- - - Transfers to/from Reserves - 19,015 20 14,730 NET EXPENDITURE (Including
Recharges and Capital Charges) (27,780)
ANALYSIS OF BUDGET VARIATIONS£
20 Employee costs 440 Superannuation virement (3,310) Contribution to PCSO (1,180) (Police Community Support Officer)
(2,560) Income from Surestart (14,770)
(29,470) 13,450
9,600 (27,780)
ANALYSIS OF BUDGET VARIATIONS£
20 10,440 15,520
(11,250) 14,730
Employees
Outturn 2011/12 (P7 Forecast)
Recharges
Temporary member of Staff funded from Recession grant Virement from ICT re Mitel telephone system £13.3k, Contribution to PCSO £2.2k To cover costs of a temporary member of Staff
Supplies and Services
Recession Grant
COMMENTS
Budget 2012/13
Support Services
NOTES
Supplies and Services
COMMENTSBase Budget 2011/12
Base Budget 2011/12
Capital Charges
re officer time
REVENUE BUDGET
VISITOR AND CALL CENTRE
HEAD OF CUSTOMERS, HOMES and PROPERTYCUSTOMER SERVICE MANAGER
The provision of the customer contact and call centres, including the Gateway +
Equipment Maintenance and Stationery
70

SERVICESERVICE DESCRIPTION
SERVICE MANAGERBUDGET MANAGER
ACTUAL ESTIMATE PROJECTED OUTTURN
DETAIL ESTIMATE
2010/11 2011/12 2011/12 2012/13£ £ £ £
EXPENDITURE104,217 44,030 22,710 Employees 49,830
- - - Premises - 14,435 11,300 11,300 Supplies and Services 11,700
- - - Transport - 118,652 55,330 34,010 TOTAL EXPENDITURE 61,530
INCOME- - - Grants - - - - Fees and Charges -
118,652 55,330 34,010 NET CONTROLLABLE EXPENDITURE
61,530
RECHARGES & CAPITAL CHARGES 28,539 26,930 26,930 Support Services 31,060
- - - Capital Charges - (147,191) (82,250) (82,250) Recharges (92,570)
- - - Transfers to/from Reserves - - 10 (21,310) NET EXPENDITURE (Including
Recharges and Capital Charges) 20
ANALYSIS OF BUDGET VARIATIONS£
10 Virement to Business Change Team (20,600) 15% Savings target not achieved 32,720
Reduction of hours (2,940) Employee costs (2,660) Superannuation virement (720)
400 4,130
(10,320) 20
ANALYSIS OF BUDGET VARIATIONS£
10 (21,320) (21,310)
Base Budget 2011/12
Budget 2012/13
COMMENTS
Phase 2 of the Admin Review is underway by the Deputy Chief Executive
REVENUE BUDGET
EXECUTIVE SUPPORT
HEAD OF CUSTOMERS, HOMES and PROPERTYCUSTOMER SERVICE MANAGER
To provide administrative support to all services as required, including word processing, document design and production, and electronic data imaging
NOTES
Supplies and Services
Outturn 2011/12 (P7 Forecast)Employees
Support Services
Savings target from Administration review unlikely to be Base Budget 2011/12
COMMENTS
Recharges
71

SERVICESERVICE DESCRIPTION
SERVICE MANAGERBUDGET MANAGER
ACTUAL ESTIMATE PROJECTED OUTTURN
DETAIL ESTIMATE
2010/11 2011/12 2011/12 2012/13£ £ £ £
EXPENDITURE233,657 235,090 203,460 Employees 199,170
13 - (80) Premises - 497 2,430 53,710 Supplies and Services 650
1,201 1,500 510 Transport 2,040 235,368 239,020 257,600 TOTAL EXPENDITURE 201,860
INCOME- - - Grants -
(54,133) (31,000) (2,720) Fees and Charges (500) 181,235 208,020 254,880 NET CONTROLLABLE
EXPENDITURE 201,360
RECHARGES & CAPITAL CHARGES 82,720 80,180 80,180 Support Services 56,990
(232,010) - - Capital Charges - (257,247) (288,190) (318,190) Recharges (202,770)
- - (53,290) Transfers to/from Reserves - (225,302) 10 (36,420) NET EXPENDITURE (Including
Recharges and Capital Charges) 55,580
ANALYSIS OF BUDGET VARIATIONS£
10 15% Salary Savings (67,430) Transfer from HRA 34,530 Employees (1,390) Superannuation virement (1,630)
(1,780) 540
30,500 (23,190) 85,420 55,580
ANALYSIS OF BUDGET VARIATIONS£
10 (31,630)
(80) 51,280
(990) 28,280
(30,000) (53,290) (36,420)
Ashford/Swale Property Partnership
Holding account for the salaries and other associated costs for the staff responsible for the upkeep and maintenance of the Council Property Assets, these costs are fully allocated to services
Fees & Charges
Base Budget 2011/12Employees
Premises Supplies and Services
Ashford/Swale Property Partnership
Supplies and Services
Base Budget 2011/12COMMENTS
Transfers to/(from) ReservesRecharges
Outturn 2011/12 (P7 Forecast)
NOTES
£60k 15% Salary Savings target, less the £31k redundancy payment
Sustainable Energy Project financed from Reserves
COMMENTS
REVENUE BUDGET
CORPORATE PROPERTY
HEAD OF CUSTOMERS, HOMES and PROPERTYSTRATEGIC HOUSING AND PROPERTY MANAGER
RechargesSupport Services
Transport
Fees & Charges
Budget 2012/13
Transport
72
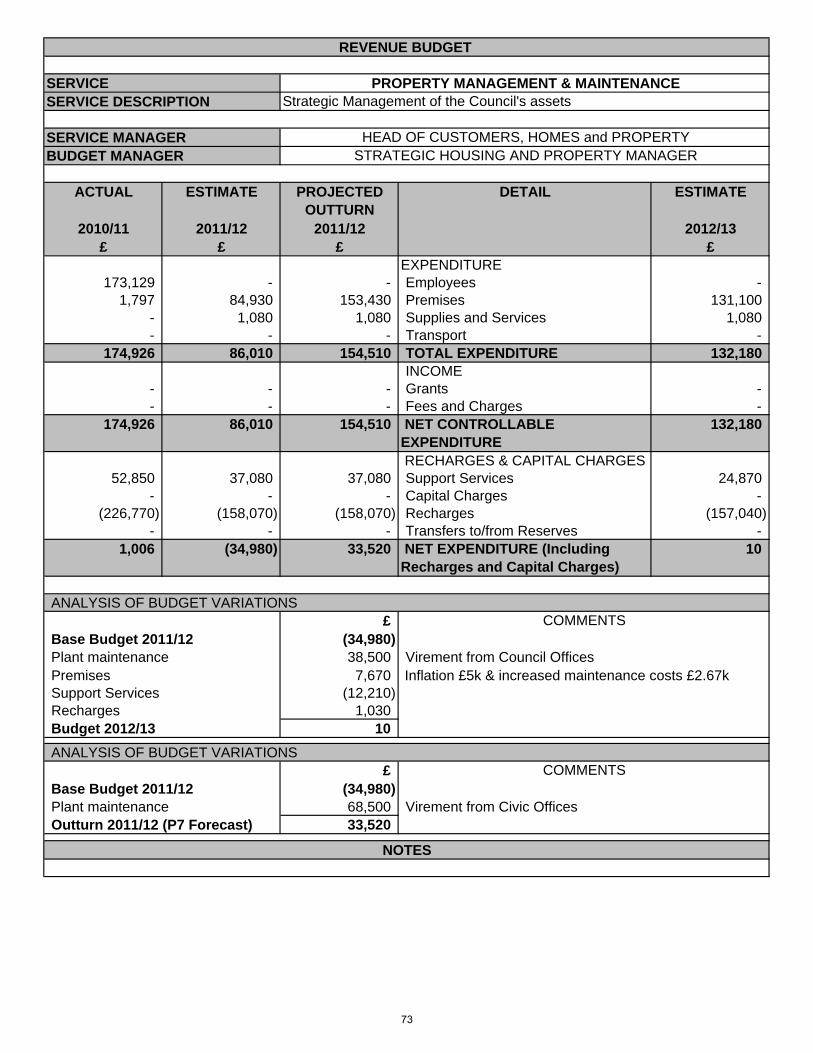
SERVICESERVICE DESCRIPTION
SERVICE MANAGERBUDGET MANAGER
ACTUAL ESTIMATE PROJECTED OUTTURN
DETAIL ESTIMATE
2010/11 2011/12 2011/12 2012/13£ £ £ £
EXPENDITURE173,129 - - Employees -
1,797 84,930 153,430 Premises 131,100 - 1,080 1,080 Supplies and Services 1,080 - - - Transport -
174,926 86,010 154,510 TOTAL EXPENDITURE 132,180 INCOME
- - - Grants - - - - Fees and Charges -
174,926 86,010 154,510 NET CONTROLLABLE EXPENDITURE
132,180
RECHARGES & CAPITAL CHARGES 52,850 37,080 37,080 Support Services 24,870
- - - Capital Charges - (226,770) (158,070) (158,070) Recharges (157,040)
- - - Transfers to/from Reserves - 1,006 (34,980) 33,520 NET EXPENDITURE (Including
Recharges and Capital Charges) 10
ANALYSIS OF BUDGET VARIATIONS£
(34,980) Plant maintenance 38,500 Virement from Council Offices
7,670 (12,210)
1,030 10
ANALYSIS OF BUDGET VARIATIONS£
(34,980) 68,500 33,520
REVENUE BUDGET
Strategic Management of the Council's assetsPROPERTY MANAGEMENT & MAINTENANCE
HEAD OF CUSTOMERS, HOMES and PROPERTYSTRATEGIC HOUSING AND PROPERTY MANAGER
Inflation £5k & increased maintenance costs £2.67k
NOTES
Virement from Civic Offices
RechargesSupport Services
Base Budget 2011/12
Budget 2012/13
Base Budget 2011/12
Outturn 2011/12 (P7 Forecast)
COMMENTS
COMMENTS
Premises
Plant maintenance
73

SERVICESERVICE DESCRIPTION
SERVICE MANAGERBUDGET MANAGER
ACTUAL ESTIMATE PROJECTED OUTTURN
DETAIL ESTIMATE
2010/11 2011/12 2011/12 2012/13£ £ £ £
EXPENDITURE- - - Employees -
12,138 7,240 12,430 Premises 10,820 7,535 3,000 3,620 Supplies and Services 3,320
- - - Transport - 19,673 10,240 16,050 TOTAL EXPENDITURE 14,140
INCOME- - - Grants -
(356,798) (356,000) (376,300) Fees and Charges (380,000) (337,125) (345,760) (360,250) NET CONTROLLABLE
EXPENDITURE (365,860)
RECHARGES & CAPITAL CHARGES 77,169 90,650 90,650 Support Services 80,790 61,553 59,790 59,790 Capital Charges 61,550
- - - Recharges - - - - Transfers to/from Reserves -
(198,403) (195,320) (209,810) NET EXPENDITURE (Including Recharges and Capital Charges)
(223,520)
ANALYSIS OF BUDGET VARIATIONS£
(195,320) 3,580
320 (24,000) (9,860) 1,760
(223,520) ANALYSIS OF BUDGET VARIATIONS
£(195,320)
5,190 Electricity £3.6k & Business Rates £1.5k620
(20,300) (209,810)
Supplies and Services
Outturn 2011/12 (P7 Forecast)
Budget 2012/13
Base Budget 2011/12Premises Supplies and Services
Increased rent income based on latest occupation levels
NOTES
Capital Charges
Fees & Charges
STRATEGIC HOUSING AND PROPERTY MANAGER
REVENUE BUDGET
Management of the Council's Industrial EstatesINDUSTRIAL ESTATES
HEAD OF CUSTOMERS, HOMES and PROPERTY
COMMENTS
COMMENTS
Fees & ChargesSupport Services
Base Budget 2011/12
Increased rental income based on higher occupation
Electricity costsPremises
74

SERVICESERVICE DESCRIPTION
SERVICE MANAGERBUDGET MANAGER
ACTUAL ESTIMATE PROJECTED OUTTURN
DETAIL ESTIMATE
2010/11 2011/12 2011/12 2012/13£ £ £ £
EXPENDITURE- - - Employees -
15,409 10,830 4,450 Premises 3,900 9,084 6,390 6,390 Supplies and Services 4,500
- - - Transport - 24,493 17,220 10,840 TOTAL EXPENDITURE 8,400
INCOME(1,000) - - Grants -
(77,530) (89,860) (87,710) Fees and Charges (88,410) (54,037) (72,640) (76,870) NET CONTROLLABLE
EXPENDITURE (80,010)
RECHARGES & CAPITAL CHARGES 67,534 80,530 73,790 Support Services 57,560 32,349 31,430 31,430 Capital Charges 32,350
- - - Recharges - - - - Transfers to/from Reserves -
45,846 39,320 28,350 NET EXPENDITURE (Including Recharges and Capital Charges)
9,900
ANALYSIS OF BUDGET VARIATIONS£
39,320 Business Rates (4,900) Council Tax (2,300) Mobile Phones 270
(1,890) 1,450
(22,970) 920
9,900 ANALYSIS OF BUDGET VARIATIONS
£39,320 (6,380) 2,150
(6,740) 28,350
COMMENTS
STRATEGIC HOUSING AND PROPERTY MANAGER
REVENUE BUDGET
Management of the Council's Commercial PropertiesCOMMERCIAL PROPERTIES
HEAD OF CUSTOMERS, HOMES and PROPERTY
Base Budget 2011/12
NOTES
Outturn 2011/12 (P7 Forecast)
Rent IncomeSupport Services
Management Fees
Budget 2012/13
Rent Income Support Services
Base Budget 2011/12
Capital Charges
Business Rates
COMMENTS
75
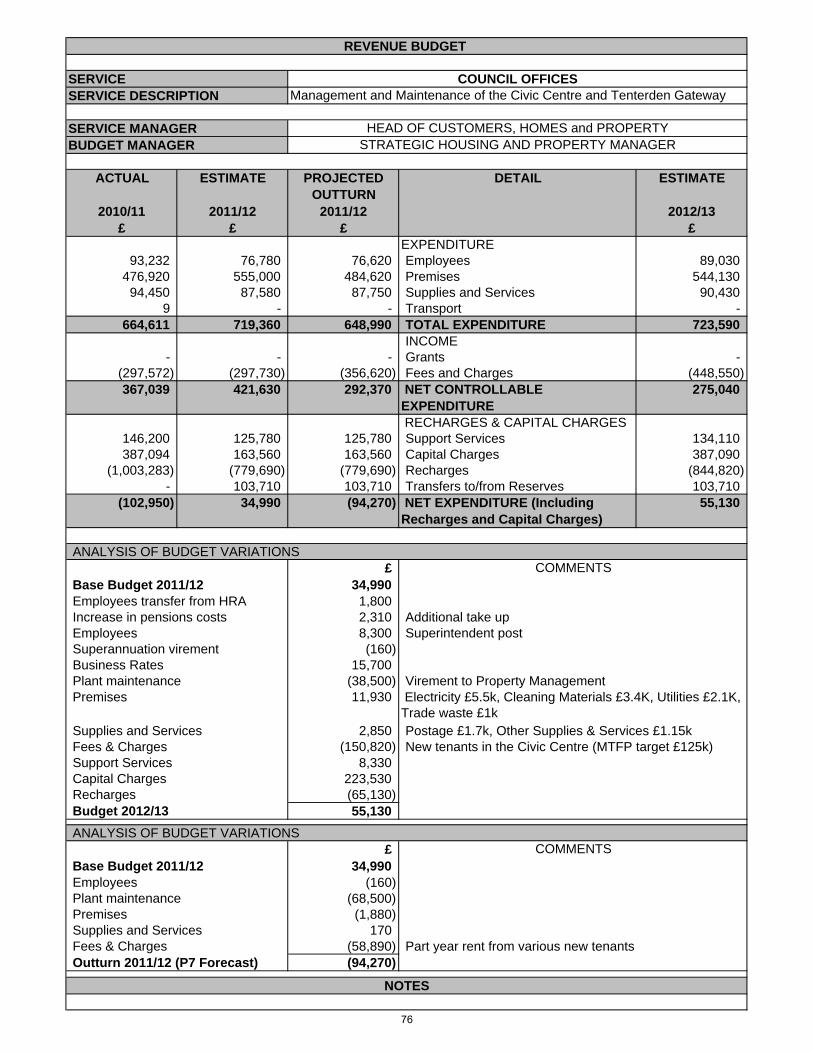
SERVICESERVICE DESCRIPTION
SERVICE MANAGERBUDGET MANAGER
ACTUAL ESTIMATE PROJECTED OUTTURN
DETAIL ESTIMATE
2010/11 2011/12 2011/12 2012/13£ £ £ £
EXPENDITURE93,232 76,780 76,620 Employees 89,030
476,920 555,000 484,620 Premises 544,130 94,450 87,580 87,750 Supplies and Services 90,430
9 - - Transport - 664,611 719,360 648,990 TOTAL EXPENDITURE 723,590
INCOME- - - Grants -
(297,572) (297,730) (356,620) Fees and Charges (448,550) 367,039 421,630 292,370 NET CONTROLLABLE
EXPENDITURE 275,040
RECHARGES & CAPITAL CHARGES 146,200 125,780 125,780 Support Services 134,110 387,094 163,560 163,560 Capital Charges 387,090
(1,003,283) (779,690) (779,690) Recharges (844,820) - 103,710 103,710 Transfers to/from Reserves 103,710
(102,950) 34,990 (94,270) NET EXPENDITURE (Including Recharges and Capital Charges)
55,130
ANALYSIS OF BUDGET VARIATIONS£
34,990 Employees transfer from HRA 1,800 Increase in pensions costs 2,310
8,300 Superannuation virement (160) Business Rates 15,700 Plant maintenance (38,500)
11,930
2,850 (150,820)
8,330 223,530 (65,130) 55,130
ANALYSIS OF BUDGET VARIATIONS£
34,990 (160)
(68,500) (1,880)
170 (58,890) Part year rent from various new tenants(94,270)
Premises
COMMENTS
Employees
Base Budget 2011/12
Fees & ChargesSupport ServicesCapital Charges
Electricity £5.5k, Cleaning Materials £3.4K, Utilities £2.1K, Trade waste £1k
New tenants in the Civic Centre (MTFP target £125k)
NOTES
Recharges
Postage £1.7k, Other Supplies & Services £1.15kSupplies and Services
REVENUE BUDGET
COUNCIL OFFICES
HEAD OF CUSTOMERS, HOMES and PROPERTYSTRATEGIC HOUSING AND PROPERTY MANAGER
Management and Maintenance of the Civic Centre and Tenterden Gateway
Additional take up
Base Budget 2011/12
Outturn 2011/12 (P7 Forecast)
Employees
Premises Supplies and ServicesFees & Charges
Plant maintenance
Budget 2012/13
COMMENTS
Superintendent post
Virement to Property Management
76

ACTUAL ESTIMATE PROJECTED DETAIL ESTIMATEOUTTURN
2010/11 2011/12 2011/12 2012/13£ £ £ £
4,750,371 5,195,320 4,996,490 Street Scene 5,437,130 800,071 799,140 894,350 Environmental Health 812,800
(5,739) 83,040 53,260 Licencing 55,510 (10,431) (2,970) 11,080 Street Markets 1,710 238,234 148,040 144,140 Monitoring Centre 215,060 112,288 85,470 98,510 Community Safety 84,900
(605,640) (544,950) (559,080) Car Parks (550,550) 130,735 230,400 230,150 Engineering Services 208,720 64,787 69,180 68,730 Emergency Planning 58,450
- 20 27,550 Environmental Services 20
5,474,676 6,062,690 5,965,180 SERVICE EXPENDITURE 6,323,750
REVENUE BUDGET
ENVIRONMENTAL SERVICES
77

Street Scene Environmental
Health Licensing Street Markets Monitoring Centre
Community Safety Car Parks Engineering
Services Emergency
Planning Environmental Mgt & Admin Total
£ £ £ £ £ £ £ £ £ £ £EXPENDITUREEmployees 544,540 611,300 166,230 16,820 370,830 53,890 455,270 33,270 63,900 142,370 2,458,420 Premises 1,551,900 250 - 6,000 24,800 6,130 478,060 133,840 - - 2,200,980 Supplies and Services 4,496,460 67,130 16,040 2,460 145,950 1,660 165,100 26,170 7,300 550 4,928,820 Transport 13,990 12,240 1,120 190 700 5,900 10,190 1,020 3,750 - 49,100 TOTAL EXPENDITURE 6,606,890 690,920 183,390 25,470 542,280 67,580 1,108,620 194,300 74,950 142,920 9,637,320 INCOMEGrants ( 645,700) - - - - ( 40,870) - - - - ( 686,570) Fees & Charges ( 822,470) ( 22,210) ( 188,370) ( 31,000) ( 100,000) ( 500) ( 1,975,160) - ( 28,280) - ( 3,167,990) TOTAL INCOME ( 1,468,170) ( 22,210) ( 188,370) ( 31,000) ( 100,000) ( 41,370) ( 1,975,160) - ( 28,280) - ( 3,854,560)
NET CONTROLLABLE EXPENDITURE 5,138,720 668,710 ( 4,980) ( 5,530) 442,280 26,210 ( 866,540) 194,300 46,670 142,920 5,782,760 NON CONTROLLABLE ITEMSRecharged from other Accounts 797,850 144,090 60,490 7,240 131,340 58,690 290,620 14,420 11,780 39,230 1,555,750 Capital Charges 339,430 - - - 19,710 - 25,370 - - - 384,510 Recharged to other Accounts ( 838,870) - - - ( 378,270) - - - - ( 182,130) ( 1,399,270) Transfer to/from Reserves - - - - - - - - - - - TOTAL NON-CONTROLLABLE ITEMS 298,410 144,090 60,490 7,240 ( 227,220) 58,690 315,990 14,420 11,780 ( 142,900) 540,990
NET EXPENDITURE 5,437,130 812,800 55,510 1,710 215,060 84,900 ( 550,550) 208,720 58,450 20 6,323,750
SUBJECTIVE ANALYSIS - 2012/13 ESTIMATEENVIRONMENTAL SERVICES
78

SERVICE
ACTUAL ESTIMATE PROJECTED DETAIL ESTIMATEOUTTURN
2010/11 2011/12 2011/12 2012/13£ £ £ £
EXPENDITURE 526,207 541,890 536,050 Employees 544,540 1,453,895 1,572,900 1,459,550 Premises 1,551,900 4,004,710 4,191,900 4,323,650 Supplies and Services 4,496,460 22,268 13,380 28,070 Transport 13,990 6,007,079 6,320,070 6,347,320 TOTAL EXPENDITURE 6,606,890
INCOME (597,001) (477,000) (593,650) Grants (645,700) (1,186,434) (799,360) (814,350) Fees and Charges (822,470) 4,223,644 5,043,710 4,939,320 NET CONTROLLABLE EXPENDITURE 5,138,720
RECHARGES & CAPITAL CHARGES 848,458 893,710 799,270 Support Services 797,850 519,385 124,160 124,160 Capital Charges 339,430 (841,116) (866,260) (866,260) Recharges (838,870) - - - Transfers to/from Reserves - 4,750,371 5,195,320 4,996,490 NET EXPENDITURE (Including Recharges
and Capital Charges) 5,437,130
ANALYSIS OF BUDGET VARIATIONS
£ 5,195,320 99,450 80,000 180,000 (79,950) (85,000) (96,000) (24,000) (6,000) (22,700) (36,000) 78,000
7,000 210 (95,860) 27,390 215,270 5,437,130
£ 5,195,320
(5,840) (293,350)
85,000 Partially offset by a £95k grant from KCC 26,000 Increased adoptions
105,750
14,690 (21,650) (14,990) (94,440)
4,996,490
Reduced 3rd party recycling credits following KCC changes
COMMENTS
Head of Environmental Services
Base Budget 2011/12
SERVICE MANAGERBUDGET MANAGER
Recycling credits Contract savings
REVENUE BUDGET
Provision of services such as Parks and Open Spaces, Pest Control, Grounds Maintenance, ABC owned trees, Public Conveniences, Street Cleansing, Waste and Recycling, Bulk Refuse, Allotments, Cemeteries, Control of Dogs
STREET SCENE
Street Scene & Open Spaces Manager
SERVICE DESCRIPTION
NOTES
Scheduled and non scheduled works reduced in Parks (£79k), Cemeteries (£6k), St Cleansing (£17K) and Allotments (£5k)
COMMENTS Base Budget 2011/12
Payment of Recycling Grant
Fees and Charges Commuted Sums
Weed Control £38k, Bulk Refuse £10k, Woodland Burials £20k, Composite Burial fee £5k, Management & Admin fee £5k
Woodland Burials and Composite Burial fee
Refuse Collection £25k, Bulk Refuse £17k and Street Cleansing £38k
Premises
Grant Income Reduction in unscheduled works
ANALYSIS OF BUDGET VARIATIONS
Employees
Other minor variances
Outturn 2011/12 (P7 Forecast)
Expansion of Blue Box scheme
Contract savings
TransportTipping away paymentsFee IncomeSupport Costs
Street Cleansing contract
Blue box Inflation Growth £20k refuse, £2.3k bulk, £25.9k recycling, £51.2k Street Cleansing
£61k refuse, £19k Street Cleansing Cost of expanding the scheme £25k refuse, £16.9k bulk, £38.4k Street Cleansing
Base Budget 2012/13 Change in capital Change in recharges Change in support costs
KCC Grant re Blue Box Scheme
Software Licence
As a result of the extended blue box scheme
Tipping away payments
79

SERVICESERVICE DESCRIPTION
SERVICE MANAGERBUDGET MANAGER
ACTUAL ESTIMATE PROJECTED DETAIL ESTIMATEOUTTURN
2010/11 2011/12 2011/12 2012/13£ £ £ £
EXPENDITURE577,790 607,060 632,740 Employees 611,300
- 760 2,160 Premises 250 43,957 70,450 64,880 Supplies and Services 67,130 14,747 10,680 13,310 Transport 12,240
636,494 688,950 713,090 TOTAL EXPENDITURE 690,920 INCOME
- - - Grants - (50,670) (23,390) (24,310) Fees and Charges (22,210) 585,825 665,560 688,780 NET CONTROLLABLE EXPENDITURE 668,710
RECHARGES & CAPITAL CHARGES 189,299 133,580 205,570 Support Services 144,090
24,948 - - Capital Charges - - - - Recharges - - - - Transfers to/from Reserves -
800,071 799,140 894,350 NET EXPENDITURE (Including Recharges and Capital Charges)
812,800
ANALYSIS OF BUDGET VARIATIONS£
Base Budget 2011/12 799,140 Transport 1,560 Other Supplies & Services (3,320) Employees 4,240 Premises (510) Fees and Charges 1,180 Change in support costs 10,510 Base Budget 2012/13 812,800
ANALYSIS OF BUDGET VARIATIONS£
Base Budget 2011/12 799,140 Employees 25,680 Virement from Licencing £25.4KPremises 1,400 Supplies & Services (5,570) Transport 2,630 Fee Income (920) Support Costs 71,990 Outturn 2011/12 (P7 Forecast) 894,350
Environmental Health Manager (Commercial) & Environmental Health Manager
COMMENTS
REVENUE BUDGET
Food safety, Infectious Disease Control, Health and Safety, Animal Welfare, Environmental Nuisance, Air Quality, Contaminated Land, Drainage, Planning Assessments.
Environmental Health
Head of Environmental Services
NOTES
COMMENTS
80

SERVICESERVICE DESCRIPTION
SERVICE MANAGERBUDGET MANAGER
ACTUAL ESTIMATE PROJECTED DETAIL ESTIMATEOUTTURN
2010/11 2011/12 2011/12 2012/13£ £ £ £
EXPENDITURE186,250 205,750 163,820 Employees 166,230
395 - - Premises - 17,953 17,860 17,300 Supplies and Services 16,040
83 1,170 1,170 Transport 1,120 204,681 224,780 182,290 TOTAL EXPENDITURE 183,390
INCOME- - - Grants -
(234,423) (189,170) (193,790) Fees and Charges (188,370) (29,742) 35,610 (11,500) NET CONTROLLABLE EXPENDITURE (4,980)
RECHARGES & CAPITAL CHARGES 24,003 47,430 64,760 Support Services 60,490
- - - Capital Charges - - - - Recharges - - - - Transfers to/from Reserves -
(5,739) 83,040 53,260 NET EXPENDITURE (Including Recharges and Capital Charges)
55,510
ANALYSIS OF BUDGET VARIATIONS£
Base Budget 2011/12 83,040 Payments to ContractorTransport (50) Other Supplies & Services (1,820) Employees (34,520) Salary Savings (5,000) 15% Savings Target Fees and Charges 800 Change in support costs 13,060 Base Budget 2012/13 55,510
ANALYSIS OF BUDGET VARIATIONS£
Base Budget 2011/12 83,040 Employees (41,930) Supplies & Services (560) Fee Income (4,620) Support Costs 17,330 Outturn 2011/12 (P7 Forecast) 53,260
Licensing Manager
COMMENTS
REVENUE BUDGET
Provision and enforcement of licences including Gambling/Liquor/Hackney CarriageLicencing
Head of Environmental Services
NOTES
£-16.8k Virement to St Market, £-8.3K Virement to Environmental
£-14.7k Virement to St Market, £-25.4K Virement to Environmental
COMMENTS
81

SERVICESERVICE DESCRIPTION
SERVICE MANAGERBUDGET MANAGER
ACTUAL ESTIMATE PROJECTED DETAIL ESTIMATEOUTTURN
2010/11 2011/12 2011/12 2012/13£ £ £ £
EXPENDITURE- - 14,740 Employees 16,820
(3,040) 12,140 5,620 Premises 6,000 16,683 18,400 12,190 Supplies and Services 2,460
47 100 100 Transport 190 13,690 30,640 32,650 TOTAL EXPENDITURE 25,470
INCOME- - - Grants -
(25,457) (37,000) (30,000) Fees and Charges (31,000) (11,767) (6,360) 2,650 NET CONTROLLABLE EXPENDITURE (5,530)
RECHARGES & CAPITAL CHARGES 1,336 3,390 8,430 Support Services 7,240
- - - Capital Charges - - - - Recharges - - - - Transfers to/from Reserves -
(10,431) (2,970) 11,080 NET EXPENDITURE (Including Recharges and Capital Charges)
1,710
ANALYSIS OF BUDGET VARIATIONS£
Base Budget 2011/12 (2,970)
Employees 16,820 (6,140)
Other Supplies & Services (15,940) Payment to Street Market contractorTransport 90 Fees and Charges 6,000 Change in support costs 3,850 Base Budget 2012/13 1,710
ANALYSIS OF BUDGET VARIATIONS£
Base Budget 2011/12 (2,970) Employees 14,740 Virement from Licencing
(6,520) Supplies & Services (6,210) Fee Income 7,000 Support Costs 5,040 Outturn 2011/12 (P7 Forecast) 11,080
Estimated reduction in costs following reassessment. Reduced Street Market costs - Barrier
REVENUE BUDGET
Provision of Street Markets in Ashford and TenterdenStreet Markets
Head of Environmental ServicesLicensing Manager
COMMENTS
National Non Domestic Rates
Trading conditions resulting in fewer stalls.
COMMENTS
Reallocation of salaries from LicencingEstimated reduction in costs.
NOTES
National Non Domestic Rates
Trading conditions resulting in fewer stalls.
82

SERVICESERVICE DESCRIPTION
SERVICE MANAGERBUDGET MANAGER
ACTUAL ESTIMATE PROJECTED DETAIL ESTIMATEOUTTURN
2010/11 2011/12 2011/12 2012/13£ £ £ £
EXPENDITURE435,726 387,680 389,180 Employees 370,830
23,774 24,200 24,200 Premises 24,800 224,605 167,220 167,220 Supplies and Services 145,950
687 1,500 1,500 Transport 700 684,792 580,600 582,100 TOTAL EXPENDITURE 542,280
INCOME- - - Grants -
(161,650) (128,000) (133,400) Fees and Charges (100,000) 523,142 452,600 448,700 NET CONTROLLABLE EXPENDITURE 442,280
RECHARGES & CAPITAL CHARGES 103,657 88,930 88,930 Support Services 131,340
19,705 14,780 14,780 Capital Charges 19,710 (408,270) (408,270) (408,270) Recharges (378,270)
- - - Transfers to/from Reserves - 238,234 148,040 144,140 NET EXPENDITURE (Including Recharges and
Capital Charges) 215,060
ANALYSIS OF BUDGET VARIATIONS£
Base Budget 2011/12 148,040 Employees (16,850) Other Supplies & Services (6,270) Other Operational Equipment (15,000) 15% Savings Target Premises 600 Transport (800) Fees and Charges 28,000 Change in support costs 42,410 Capital Charges 4,930 Recharges 30,000 Recharge to Housing Revenue AccountBase Budget 2012/13 215,060
ANALYSIS OF BUDGET VARIATIONS£
Base Budget 2011/12 148,040 Employees 1,500 Fee Income (5,400) Outturn 2011/12 (P7 Forecast) 144,140
NOTES
REVENUE BUDGET
Provision of the CCTV monitoring system, the Telecare service, social and intruder alarms and lone worker and duty officer scheme
Monitoring Centre
Head of Environmental ServicesMonitoring Centre Manager
COMMENTS
COMMENTS
Reduced revenue from private lifeline clients & the sale of lifeline
15% Savings Target - Monitoring Officer (Post 3036) Subscriptions and Professional Fees
83

SERVICESERVICE DESCRIPTION
SERVICE MANAGERBUDGET MANAGER
ACTUAL ESTIMATE PROJECTED DETAIL ESTIMATEOUTTURN
2010/11 2011/12 2011/12 2012/13£ £ £ £
EXPENDITURE65,889 53,930 53,560 Employees 53,890
5,325 2,850 2,850 Premises 6,130 26,559 32,940 12,940 Supplies and Services 1,660
7,334 10,760 10,760 Transport 5,900 105,108 100,480 80,110 TOTAL EXPENDITURE 67,580
INCOME(103,868) (104,000) (70,590) Grants (40,870)
(1,240) - - Fees and Charges (500) (1) (3,520) 9,520 NET CONTROLLABLE EXPENDITURE 26,210
RECHARGES & CAPITAL CHARGES 112,289 88,990 88,990 Support Services 58,690
- - - Capital Charges - - - - Recharges - - - - Transfers to/from Reserves -
112,288 85,470 98,510 NET EXPENDITURE (Including Recharges and Capital Charges)
84,900
ANALYSIS OF BUDGET VARIATIONS£
Base Budget 2011/12 85,470 Transport (4,860)
(31,280)Employees (40) Premises 3,280 Grant Income 63,130 Fees and Charges (500) Change in support costs (30,300) Base Budget 2012/13 84,900
ANALYSIS OF BUDGET VARIATIONS£
Base Budget 2011/12 85,470 Employees (370) Supplies & Services (20,000) Grant Income 33,410 Outturn 2011/12 (P7 Forecast) 98,510
Other Supplies & Services
KCC Grant CCTV camera purchase and maintenance
REVENUE BUDGET
Costs relating to the Community Safety Team and CSPCommunity Safety
Head of Environmental ServicesCommunity Safety Manager
COMMENTS
KCC Grant Contribution to PCSO and Community Safety Unit operations
COMMENTS
NOTES
Contribution to PCSO and Community Safety Unit operations deleted.
84

SERVICESERVICE DESCRIPTION
SERVICE MANAGERBUDGET MANAGER
ACTUAL ESTIMATE PROJECTED DETAIL ESTIMATEOUTTURN
2010/11 2011/12 2011/12 2012/13£ £ £ £
EXPENDITURE424,702 465,400 432,570 Employees 455,270 330,235 456,510 475,210 Premises 478,060 162,186 149,790 149,790 Supplies and Services 165,100
11,445 10,040 10,040 Transport 10,190 928,567 1,081,740 1,067,610 TOTAL EXPENDITURE 1,108,620
INCOME- - - Grants -
(1,920,184) (1,946,010) (1,946,010) Fees and Charges (1,975,160) (991,616) (864,270) (878,400) NET CONTROLLABLE EXPENDITURE (866,540)
RECHARGES & CAPITAL CHARGES 334,125 299,220 299,220 Support Services 290,620
51,851 20,100 20,100 Capital Charges 25,370 - - - Recharges - - - - Transfers to/from Reserves -
(605,640) (544,950) (559,080) NET EXPENDITURE (Including Recharges and Capital Charges)
(550,550)
ANALYSIS OF BUDGET VARIATIONS£
Base Budget 2011/12 (544,950) Transport 150 Other Supplies & Services 15,310 Employees (10,130)
21,550 Fine Income (29,150) Change in support costs (8,600) Capital Charges 5,270 Base Budget 2012/13 (550,550)
ANALYSIS OF BUDGET VARIATIONS£
Base Budget 2011/12 (544,950) Temporary vacant posts (32,830)
18,700 Outturn 2011/12 (P7 Forecast) (559,080)
Insurance £-4.5k, Superannuation and National Insurance Virements £21k Gate Keeper contract vired from Engineering Services
COMMENTS
Operations Manager Parking Services/Engineering Services Manager
COMMENTS
REVENUE BUDGET
Provision, maintenance and enforcement of On-Street, Off Street Parking and Abandoned Vehicles
Car Parks
Head of Environmental Services
Edinburgh Road & Dover Place revaluation
Edinburgh Road & Dover Place revaluation
Trend shows an increase in the number of PCN's issued. National Non Domestic Rates
National Non Domestic Rates
4 Civil Enforcement Officers and 1 Administration Officer, used to offset Savings Target (See Environmental Services Management)
NOTES
85

SERVICESERVICE DESCRIPTION
SERVICE MANAGERBUDGET MANAGER
ACTUAL ESTIMATE PROJECTED DETAIL ESTIMATEOUTTURN
2010/11 2011/12 2011/12 2012/13£ £ £ £
EXPENDITURE27,348 34,660 34,410 Employees 33,270 82,623 128,000 128,000 Premises 133,840 14,069 44,310 44,310 Supplies and Services 26,170
- 1,020 1,020 Transport 1,020 124,039 207,990 207,740 TOTAL EXPENDITURE 194,300
INCOME- - - Grants -
(2,290) - - Fees and Charges - 121,749 207,990 207,740 NET CONTROLLABLE EXPENDITURE 194,300
RECHARGES & CAPITAL CHARGES 35,986 22,410 22,410 Support Services 14,420
(27,000) - - Capital Charges - - - - Recharges - - - - Transfers to/from Reserves -
130,735 230,400 230,150 NET EXPENDITURE (Including Recharges and Capital Charges)
208,720
ANALYSIS OF BUDGET VARIATIONS£
Base Budget 2011/12 230,400 Employees (1,390) Other Supplies & Services (18,140) Premises 5,840 Change in support costs (7,990) Base Budget 2012/13 208,720
ANALYSIS OF BUDGET VARIATIONS£
Base Budget 2011/12 230,400 Employees (250) Outturn 2011/12 (P7 Forecast) 230,150
Engineering Services Manager
REVENUE BUDGET
General maintenance of footway and festive lighting, street furniture and name plates within the borough
Engineering Services
Head of Environmental Services
Footway Lighting and Bus Shelter Maintenance £21k Gate Keeper contract vired to Car Parks
COMMENTS
COMMENTS
NOTES
86

SERVICESERVICE DESCRIPTION
SERVICE MANAGERBUDGET MANAGER
ACTUAL ESTIMATE PROJECTED DETAIL ESTIMATEOUTTURN
2010/11 2011/12 2011/12 2012/13£ £ £ £
EXPENDITURE65,123 65,870 65,420 Employees 63,900
- - - Premises - 5,020 7,300 7,300 Supplies and Services 7,300 3,483 3,750 3,750 Transport 3,750
73,626 76,920 76,470 TOTAL EXPENDITURE 74,950 INCOME
- - - Grants - (25,287) (28,280) (28,280) Fees and Charges (28,280) 48,339 48,640 48,190 NET CONTROLLABLE EXPENDITURE 46,670
RECHARGES & CAPITAL CHARGES 16,448 20,540 20,540 Support Services 11,780
- - - Capital Charges - - - - Recharges - - - - Transfers to/from Reserves -
64,787 69,180 68,730 NET EXPENDITURE (Including Recharges and Capital Charges)
58,450
ANALYSIS OF BUDGET VARIATIONS£
Base Budget 2011/12 69,180 (1,970) (8,760)
Base Budget 2012/13 58,450
ANALYSIS OF BUDGET VARIATIONS£
Base Budget 2011/12 69,180 (450)
Outturn 2011/12 (P7 Forecast) 68,730
Resilience Partnership Manager
COMMENTS
REVENUE BUDGET
Preparing for and responding to emergencies, including business continuity and resilienceEmergency Planning
Head of Environmental Services
NOTES
EmployeesChange in support costs
Employees
Training budget reduced.
COMMENTS
87

SERVICESERVICE DESCRIPTION
SERVICE MANAGERBUDGET MANAGER
ACTUAL ESTIMATE PROJECTED DETAIL ESTIMATEOUTTURN
2010/11 2011/12 2011/12 2012/13£ £ £ £
EXPENDITURE231,787 189,250 217,840 Employees 142,370
- - - Premises - 9,767 2,580 1,520 Supplies and Services 550
264 - - Transport - 241,818 191,830 219,360 TOTAL EXPENDITURE 142,920
INCOME- - - Grants -
(5,000) - - Fees and Charges - 236,818 191,830 219,360 NET CONTROLLABLE EXPENDITURE 142,920
RECHARGES & CAPITAL CHARGES 43,388 38,410 38,410 Support Services 39,230
- - - Capital Charges - (280,206) (230,220) (230,220) Recharges (182,130)
- - - Transfers to/from Reserves - - 20 27,550 NET EXPENDITURE (Including Recharges and
Capital Charges) 20
ANALYSIS OF BUDGET VARIATIONS£
Base Budget 2011/12 20 (46,880)
(2,030) 820
48,090 Base Budget 2012/13 20
ANALYSIS OF BUDGET VARIATIONS£
Base Budget 2011/12 20 28,590 (1,060)
Outturn 2011/12 (P7 Forecast) 27,550
REVENUE BUDGET
Business planning, Performance and Financial Monitoring, Service Administration and Management, Project Development
Environmental Services Management & Administration
Head of Environmental ServicesBusiness Manager
NOTES
15% Savings target (£40K) & Salary Savings £5kEmployeesOther Supplies & ServicesChange in support costsRecharges
COMMENTS
COMMENTS
Savings Target met with vacancy savings within Car ParksEmployeesSupplies & Services
88

ACTUAL ESTIMATE PROJECTED DETAIL ESTIMATEOUTTURN
2010/11 2011/12 2011/12 2012/13£ £ £ £
495,684 199,700 278,190 Management 194,970 95,882 32,470 32,470 Neighbourhood Engagement 13,030
193,227 93,390 117,080 Sports Development 80,280 92,460 121,120 114,620 Youth Development 66,970
834,316 94,970 132,780 The Arts 93,180 81,375 87,980 - Community Planning -
(1,257,646) 854,340 855,140 Stour Centre Client Costs 1,071,020 276,039 177,430 177,430 Tenterden Recreation Centre 185,130 233,992 197,550 190,680 Julie Rose Stadium 201,210 120,573 143,470 138,470 Conservation 129,710 241,167 163,200 162,710 Tourism 153,810 172,230 (48,180) (7,500) Project Office - 38,033 44,270 44,270 Land Drainage 34,060
1,617,332 2,161,710 2,236,340 SERVICE EXPENDITURE 2,223,370
REVENUE BUDGET
CULTURAL SERVICES
89

CULTURAL SERVICES
MANAGEMENT
NEIGHBOURHOOD ENGAGEMENT
SPORTS DEVELOPMENT
YOUTH DEVELOPMENT THE ARTS COMMUNITY
PLANNING
STOUR CENTRE (Client)
Sub Total
EXPENDITUREEmployees 178,820 - 127,180 42,950 50,680 - - 399,630 Premises 150 - 48,900 - 10,150 - 416,500 475,700 Supplies and Services 8,760 - 44,760 12,000 44,800 - 6,710 117,030 Transport 6,590 - 1,540 920 1,220 - - 10,270 TOTAL EXPENDITURE 194,320 - 222,380 55,870 106,850 - 423,210 1,002,630 INCOMEGrants - - ( 28,300) - ( 9,750) - - ( 38,050) Fees and Charges - - ( 182,500) - - - - ( 182,500) TOTAL INCOME - - ( 210,800) - ( 9,750) - - ( 220,550)
NET CONTROLLABLE EXPENDITURE 194,320 - 11,580 55,870 97,100 - 423,210 782,080 NON CONTROLLABLE ITEMSRecharged from other Accounts 97,700 8,310 31,700 12,370 15,650 - 89,340 255,070 Capital Charges 21,290 4,720 60,480 - - - 486,370 572,860 Recharged to other Accounts ( 118,340) - ( 25,980) ( 1,270) ( 1,570) - - ( 147,160) Transfer to/from Reserves - - 2,500 - ( 18,000) - 72,100 56,600 TOTAL NON-CONTROLLABLE ITEMS 650 13,030 68,700 11,100 ( 3,920) - 647,810 737,370
NET EXPENDITURE 194,970 13,030 80,280 66,970 93,180 - 1,071,020 1,519,450
Sub Total TENTERDEN
LEISURE CENTRE - CLIENT
JULIE ROSE STADIUM -
CLIENT CONSERVATION TOURISM &
HERITAGE PROJECT
OFFICE LAND
DRAINAGE Total
EXPENDITUREEmployees 399,630 2,560 - 56,450 63,800 291,840 - 814,280 Premises 475,700 2,400 800 18,000 3,900 - - 500,800 Supplies and Services 117,030 16,300 88,920 24,620 30,140 141,300 - 418,310 Transport 10,270 - - 3,610 1,530 3,800 - 19,210 TOTAL EXPENDITURE 1,002,630 21,260 89,720 102,680 99,370 436,940 - 1,752,600 INCOME
- ( 38,050) - - - - - - ( 38,050) - ( 182,500) - - - ( 13,600) ( 30,000) - ( 226,100)
TOTAL INCOME ( 220,550) - - - ( 13,600) ( 30,000) - ( 264,150)
NET CONTROLLABLE EXPENDITURE 782,080 21,260 89,720 102,680 85,770 406,940 - 1,488,450 NON CONTROLLABLE ITEMSRecharged from other Accounts 255,070 18,470 56,730 25,440 60,270 52,060 34,060 502,100 Capital Charges 572,860 145,400 54,760 1,590 2,970 - - 777,580 Recharged to other Accounts ( 147,160) - - - - ( 319,000) - ( 466,160) Transfer to/from Reserves 56,600 - - - 4,800 ( 140,000) - ( 78,600) TOTAL NON-CONTROLLABLE ITEMS 737,370 163,870 111,490 27,030 68,040 ( 406,940) 34,060 734,920
NET EXPENDITURE 1,519,450 185,130 201,210 129,710 153,810 - 34,060 2,223,370
SUBJECTIVE ANALYSIS - 2012/13 ESTIMATECULTURAL SERVICES
90

SERVICESERVICE DESCRIPTION
SERVICE MANAGERBUDGET MANAGER
ACTUAL ESTIMATE PROJECTED DETAIL ESTIMATEOUTTURN
2010/11 2011/12 2011/12 2012/13£ £ £ £
EXPENDITURE113,393 118,250 183,220 Employees 178,820
121 150 - Premises 150 43,615 9,720 13,120 Supplies and Services 8,760
3,801 3,540 6,590 Transport 6,590 160,930 131,660 202,930 TOTAL EXPENDITURE 194,320
INCOME- - - Grants -
(297) - - Fees and Charges -
160,633 131,660 202,930 NET CONTROLLABLE EXPENDITURE 194,320 RECHARGES & CAPITAL CHARGES
152,683 120,580 127,800 Support Services 97,700 235,508 600 600 Capital Charges 21,290 (53,140) (53,140) (53,140) Recharges (118,340)
- - - Transfers to/from Reserves -
495,684 199,700 278,190 NET EXPENDITURE (Including Recharges and Capital Charges) 194,970
ANALYSIS OF BUDGET VARIATIONS£ COMMENTS
Base Budget 2011/12 199,700 15% Saving (2,500) 15% Saving (15,000) Pay Award 1,250 Salaries 410 Inflation 200 Supplies and services (1,130) Virement (1,330) Virement 80,760
Change in support costs (22,880) Change in capital charges 20,690 Change in recharges (65,200) Base Budget 2012/13 194,970
ANALYSIS OF BUDGET VARIATIONS£ COMMENTS
Base Budget 2011/12 199,700 Virement (1,330)
Virement 87,980
(8,160)
Outturn 2011/12 (P7 Forecast) 278,190
Budget from Community Planning to minimise number of budgets
Change in employer contribution rate
-
Saving identified during budget monitoring to cover pressure within Courtside/Pitchside (Sports Budget)
Supplies and services
Reduction in support for Kingsnorth Recreation centre
Change in employer contribution rate Salary and project budget moved from Community Planning to minimise number of budgets
NOTES
HEAD OF CULTURAL SERVICESHEAD OF CULTURAL SERVICES
Employee related insurance costs increase
Towards required £35k saving
REVENUE BUDGET
Management function of the Cultural Services Team, including administration and safeguarding children co-ordination
CULTURAL SERVICES MANAGEMENT
91

SERVICESERVICE DESCRIPTION
SERVICE MANAGERBUDGET MANAGER
ACTUAL ESTIMATE PROJECTED DETAIL ESTIMATEOUTTURN
2010/11 2011/12 2011/12 2012/13£ £ £ £
EXPENDITURE75,098 - - Employees - (1,524) - - Premises -
125,358 - - Supplies and Services - 2,540 - - Transport -
201,472 - - TOTAL EXPENDITURE - INCOME
(10,000) - - Grants - - - - Fees and Charges -
191,472 - - NET CONTROLLABLE
EXPENDITURE - RECHARGES & CAPITAL
CHARGES 18,633 29,300 29,300 Support Services 8,310 4,736 3,170 3,170 Capital Charges 4,720
- - - Recharges - (118,959) - - Transfers to/from Reserves -
95,882 32,470 32,470 NET EXPENDITURE (Including Recharges and Capital Charges) 13,030
ANALYSIS OF BUDGET VARIATIONS£ COMMENTS
Base Budget 2011/12 32,470 Change in support costs (20,990) Change in capital charges 1,550 Base Budget 2012/13 13,030
ANALYSIS OF BUDGET VARIATIONS£ COMMENTS
Base Budget 2011/12 32,470 Outturn 2011/12 (P7 Forecast) 32,470
REVENUE BUDGET
Budget closed NEIGHBOURHOOD ENGAGEMENT
Head Of Cultural Services
NOTESRecharges to be moved as not appropriate here in 2012. Budget page to be removed from 2013/14
-
Voluntary Sector Manager and Re-generation Projects Co-ordinator
92

SERVICESERVICE DESCRIPTION
SERVICE MANAGERBUDGET MANAGER
ACTUAL ESTIMATE PROJECTED DETAIL ESTIMATEOUTTURN
2010/11 2011/12 2011/12 2012/13£ £ £ £
EXPENDITURE186,625 173,190 147,760 Employees 127,180 47,393 55,200 48,350 Premises 48,900
137,784 23,150 38,310 Supplies and Services 44,760 3,823 1,670 2,520 Transport 1,540
375,625 253,210 236,940 TOTAL EXPENDITURE 222,380 INCOME
(158,926) (34,830) (49,610) Grants (28,300) (127,831) (221,380) (176,770) Fees and Charges (182,500)
88,868 (3,000) 10,560 NET CONTROLLABLE
EXPENDITURE 11,580 RECHARGES & CAPITAL CHARGES
43,223 37,640 37,640 Support Services 31,700 61,136 58,750 58,750 Capital Charges 60,480
- - - Recharges (25,980) - - 10,130 Transfers to/from Reserves 2,500
193,227 93,390 117,080 NET EXPENDITURE (Including Recharges and Capital Charges) 80,280
ANALYSIS OF BUDGET VARIATIONS£ COMMENTS
Base Budget 2011/12 93,390 Pay Award 1,180 Virement (930) Salaries (1,730) Inflation 2,130 Transport (70) Virement 10,000 From Conservation budget to cover Courtside Virement 4,000 From Tourism and Heritage to cover CourtsideChange in support costs (5,940) Change in capital charges 1,730 Change in recharges (25,980) Change in transfers to reserve 2,500 Base Budget 2012/13 80,280
ANALYSIS OF BUDGET VARIATIONS£ COMMENTS
Base Budget 2011/12 93,390 Virement (930) Supplies and services (1,510) Fees and Charges 16,000
Change in transfers to reserve 10,130 Outturn 2011/12 (P7 Forecast) 117,080
NOTES
Change in employer contribution rateEmployee related insurance costs decrease
-
Removal of unattainable profit margin for Courtside/Pitchside
Change in employer contribution rate
Recharge to Corporate Projects
REVENUE BUDGET
This includes the costs that are associated with the Mini soccer centre, Courtside Netball Centre and the Operations Sports Officer.
Head Of Cultural ServicesCultural Operations and Projects Manager
SPORTS DEVELOPMENT
93

SERVICESERVICE DESCRIPTION
SERVICE MANAGERBUDGET MANAGER
ACTUAL ESTIMATE PROJECTED DETAIL ESTIMATEOUTTURN
2010/11 2011/12 2011/12 2012/13£ £ £ £
EXPENDITURE68,893 68,890 56,390 Employees 42,950
166 - - Premises - 8,435 6,000 12,000 Supplies and Services 12,000 3,481 920 920 Transport 920
80,975 75,810 69,310 TOTAL EXPENDITURE 55,870 INCOME
(2,000) - - Grants - (50) - - Fees and Charges -
78,925 75,810 69,310 NET CONTROLLABLE
EXPENDITURE 55,870 RECHARGES & CAPITAL
CHARGES 13,710 45,310 45,310 Support Services 12,370
- - - Capital Charges - (175) - - Recharges (1,270)
- - - Transfers to/from Reserves -
92,460 121,120 114,620 NET EXPENDITURE (Including Recharges and Capital Charges) 66,970
ANALYSIS OF BUDGET VARIATIONS£ COMMENTS
Base Budget 2011/12 121,120 15% Saving (20,000) Salaries (5,910)Pay Award 470 Virement (500) Supplies and services 6,000 Change to support costs (32,940) Change to recharges (1,270) Base Budget 2012/13 66,970
ANALYSIS OF BUDGET VARIATIONS£ COMMENTS
Base Budget 2011/12 121,120 Virement (500) Salaries (12,000) Supplies and services 6,000 Outturn 2011/12 (P7 Forecast) 114,620
REVENUE BUDGET
Youth project delivery including youth engagement and play YOUTH DEVELOPMENT
Annual contribution to Pipeline for House worker
Deletion of Youth Co-ordinators posts
Annual contribution to Pipeline for House worker
Head Of Cultural ServicesCultural Operations and Projects Manager
Change in employer contribution rate
Saving identifed during build process
NOTES
-
Change in employer contribution rateDeletion of Youth Co-ordinators posts
94

SERVICESERVICE DESCRIPTION
SERVICE MANAGERBUDGET MANAGER
ACTUAL ESTIMATE PROJECTED DETAIL ESTIMATEOUTTURN
2010/11 2011/12 2011/12 2012/13£ £ £ £
EXPENDITURE45,359 51,720 51,360 Employees 50,680 8,567 - 1,800 Premises 10,150
38,933 27,500 65,870 Supplies and Services 44,800 180 920 920 Transport 1,220
93,039 80,140 119,950 TOTAL EXPENDITURE 106,850 INCOME
(29,320) - (1,700) Grants (9,750) (2,300) - - Fees and Charges -
61,419 80,140 118,250 NET CONTROLLABLE EXPENDITURE 97,100 RECHARGES & CAPITAL CHARGES
16,205 14,830 14,830 Support Services 15,650 782,017 - - Capital Charges -
- - - Recharges (1,570) (25,325) - (300) Transfers to/from Reserves (18,000)
834,316 94,970 132,780 NET EXPENDITURE (Including Recharges and Capital Charges) 93,180
ANALYSIS OF BUDGET VARIATIONS£ COMMENTS
Base Budget 2011/12 94,970 Pay Award 350 Virement (360) Salaries (280) Salaries (750)
18,000
Premises 9,750
Income (9,750) Change in support costs 820 Change in recharges (1,570)
(18,000)
Base Budget 2012/13 93,180
ANALYSIS OF BUDGET VARIATIONS£ COMMENTS
Base Budget 2011/12 94,970 Virement (360)
Premises 100 Supplies and Services 38,370 Change in transfer from reserves (300) Outturn 2011/12 (P7 Forecast) 132,780
Cross district partnership working (Ashford, Canterbury and Shepway) joint Arts events - funded from ringfenced reserve
Create Festival funding from private sector
Grant received in 2010/11 not rolled forward
Change in employer contribution rate
Change in transfer from reserves
Change in employer contribution rateEmployee related insurance costs decreaseSaving identified during budget build
-
NOTES
REVENUE BUDGET
Support to the Arts include the costs of the Create Festival and other events, arts projects, and Arts at St Marys project.
THE ARTS
Head Of Cultural ServicesCultural Operation and Projects Manager
Additional Create Festival expenditure funded from the private sector
See comment above for Cross district partnership working
Supplies and Services
95

SERVICESERVICE DESCRIPTION
SERVICE MANAGERBUDGET MANAGER
ACTUAL ESTIMATE PROJECTED DETAIL ESTIMATEOUTTURN
2010/11 2011/12 2011/12 2012/13£ £ £ £
EXPENDITURE67,440 66,300 - Employees -
- - - Premises - 206 11,410 - Supplies and Services -
3,879 3,050 - Transport - 71,525 80,760 - TOTAL EXPENDITURE -
INCOME(2,500) - - Grants -
420 - - Fees and Charges -
69,445 80,760 - NET CONTROLLABLE
EXPENDITURE - RECHARGES & CAPITAL
CHARGES 11,930 7,220 - Support Services -
- - - Capital Charges - - - - Recharges - - - - Transfers to/from Reserves -
81,375 87,980 - NET EXPENDITURE (Including Recharges and Capital Charges) -
ANALYSIS OF BUDGET VARIATIONS£ COMMENTS
Base Budget 2011/12 87,980 Virement (80,760)
Change in support costs (7,220) Base Budget 2012/13 -
ANALYSIS OF BUDGET VARIATIONS£ COMMENTS
Base Budget 2011/12 87,980 Virement (87,980)
Outturn 2011/12 (P7 Forecast) -
REVENUE BUDGET
Closed budget
Head Of Cultural Services
COMMUNITY PLANNING
Deputy Head of Cultural Services
To Service Management to minimise number of budgets.
To Service Management to minimise number of budgets.
NOTESBudget page to be deleted from 2013/14
-
96

SERVICESERVICE DESCRIPTION
SERVICE MANAGERBUDGET MANAGER
ACTUAL ESTIMATE PROJECTED DETAIL ESTIMATEOUTTURN
2010/11 2011/12 2011/12 2012/13£ £ £ £
EXPENDITURE- - - Employees -
345,410 396,790 397,590 Premises 416,500 (139) 5,300 5,300 Supplies and Services 6,710
- - - Transport - 345,271 402,090 402,890 TOTAL EXPENDITURE 423,210
INCOME- - - Grants -
3,858 - - Fees and Charges -
349,129 402,090 402,890 NET CONTROLLABLE
EXPENDITURE 423,210 RECHARGES & CAPITAL
CHARGES 100,326 80,170 80,170 Support Services 89,340
(1,707,101) 299,980 299,980 Capital Charges 486,370 - - - Recharges - - 72,100 72,100 Transfers to/from Reserves 72,100
(1,257,646) 854,340 855,140 NET EXPENDITURE (Including Recharges and Capital Charges) 1,071,020
ANALYSIS OF BUDGET VARIATIONS£ COMMENTS
Base Budget 2011/12 854,340 15% Saving (6,000) Inflation 23,130 Premises 3,990 Change in support costs 9,170 Change in Capital Charges 186,390 Base Budget 2012/13 1,071,020
ANALYSIS OF BUDGET VARIATIONS£ COMMENTS
Base Budget 2011/12 854,340 Premises 800 Outturn 2011/12 (P7 Forecast) 855,140
REVENUE BUDGET
The Client costs of the operation of the Stour Centre for utilise and insurance.
Head Of Cultural ServicesHead Of Cultural Services
STOUR CENTRE (Client)
Reduction in utilities costs
Insurance costs
NOTES
- Increase in utilities costs
97

SERVICESERVICE DESCRIPTION
SERVICE MANAGERBUDGET MANAGER
ACTUAL ESTIMATE PROJECTED DETAIL ESTIMATEOUTTURN
2010/11 2011/12 2011/12 2012/13£ £ £ £
EXPENDITURE2,400 2,400 2,400 Employees 2,560
57,697 1,900 1,900 Premises 2,400 53,998 13,300 13,300 Supplies and Services 16,300
- - - Transport - 114,095 17,600 17,600 TOTAL EXPENDITURE 21,260
INCOME- - - Grants - - - - Fees and Charges -
114,095 17,600 17,600 NET CONTROLLABLE
EXPENDITURE 21,260 RECHARGES & CAPITAL
CHARGES 16,549 18,590 18,590 Support Services 18,470
145,395 141,240 141,240 Capital Charges 145,400 - - - Recharges - - - - Transfers to/from Reserves -
276,039 177,430 177,430 NET EXPENDITURE (Including Recharges and Capital Charges) 185,130
ANALYSIS OF BUDGET VARIATIONS£ COMMENTS
Base Budget 2011/12 177,430 Pay Award 20 Increments 420 Salaries (280) Premises 500 Contractual Inflation 260
2,740
Change in support costs (120) Change in Capital Charges 4,160 Base Budget 2012/13 185,130
ANALYSIS OF BUDGET VARIATIONS£ COMMENTS
Base Budget 2011/12 177,430 Outturn 2011/12 (P7 Forecast) 177,430 -
Increase in contribution as per draft funding agreement
Insurance costs
NOTES
Supplies and services
REVENUE BUDGET
Client costs of insuring building and support Trust.
Head Of Cultural ServicesHead Of Cultural Services
TENTERDEN LEISURE CENTRE - CLIENT
98

SERVICESERVICE DESCRIPTION
SERVICE MANAGERBUDGET MANAGER
ACTUAL ESTIMATE PROJECTED DETAIL ESTIMATEOUTTURN
2010/11 2011/12 2011/12 2012/13£ £ £ £
EXPENDITURE- - - Employees -
1,132 11,500 1,630 Premises 800 126,422 101,050 101,050 Supplies and Services 88,920
- - - Transport - 127,554 112,550 102,680 TOTAL EXPENDITURE 89,720
INCOME- - - Grants -
(13,968) (14,000) (11,000) Fees and Charges -
113,586 98,550 91,680 NET CONTROLLABLE
EXPENDITURE 89,720 RECHARGES & CAPITAL
CHARGES 65,646 57,630 57,630 Support Services 56,730 54,760 41,370 41,370 Capital Charges 54,760
- - - Recharges - - - - Transfers to/from Reserves -
233,992 197,550 190,680 NET EXPENDITURE (Including Recharges and Capital Charges) 201,210
ANALYSIS OF BUDGET VARIATIONS£ COMMENTS
Base Budget 2011/12 197,550 15% Saving (5,000)
(10,700) Inflation 3,910
2,960 Change in support costs (900) Change in Capital Charges 13,390 Base Budget 2012/13 201,210
ANALYSIS OF BUDGET VARIATIONS£ COMMENTS
Base Budget 2011/12 197,550 Premises (6,870)
Outturn 2011/12 (P7 Forecast) 190,680
REVENUE BUDGET
The Client costs of the operation of the Julie Rose Stadium including the managing contractors fee for ALT.
Head Of Cultural ServicesHead Of Cultural Services
JULIE ROSE STADIUM - CLIENT
Reduction in Julie Rose stadium subsidy Budget for grounds maintenance no longer required
Agreed contribution for Podplus utilities costs
NOTES
New agreement entered into - reduction in payments for maintenance to support pressure in Courtside/Pitchside (Sports Budget)
Supplies and services
Supplies and services
-
99

SERVICESERVICE DESCRIPTION
SERVICE MANAGERBUDGET MANAGER
ACTUAL ESTIMATE PROJECTED DETAIL ESTIMATEOUTTURN
2010/11 2011/12 2011/12 2012/13£ £ £ £
EXPENDITURE31,873 57,640 57,220 Employees 56,450 21,772 18,000 18,000 Premises 18,000 29,796 34,620 30,040 Supplies and Services 24,620 2,078 3,610 3,610 Transport 3,610
85,519 113,870 108,870 TOTAL EXPENDITURE 102,680 INCOME
- - - Grants - (41,267) - - Fees and Charges -
44,252 113,870 108,870 NET CONTROLLABLE
EXPENDITURE 102,680 RECHARGES & CAPITAL CHARGES
31,695 28,060 28,060 Support Services 25,440 44,976 1,540 1,540 Capital Charges 1,590
(350) - - Recharges - - - - Transfers to/from Reserves -
120,573 143,470 138,470 NET EXPENDITURE (Including Recharges and Capital Charges) 129,710
ANALYSIS OF BUDGET VARIATIONS£ COMMENTS
Base Budget 2011/12 143,470 Pay Award 390 Salaries (320) Salaries (840) Virement (420)
(10,000)
580 (580)
Change in support costs (2,620) Change in capital charges 50 Base Budget 2012/13 129,710
ANALYSIS OF BUDGET VARIATIONS£ COMMENTS
Base Budget 2011/12 143,470 Virement (420)
(4,580)
Outturn 2011/12 (P7 Forecast) 138,470
Contractual Inflation
Reduced spend in Singleton Environment Centre to support overspend in Courtside/Pitchside
Change in employer contribution rate
Employee related insurance costs decrease
Supplies and Services
-
Saving identified during budget buildChange in employer contribution rate
NOTES
Supplies and services
Virement Grant ended for Singleton Environment Centre, budget moved to Sports for Courtside/Pitchside
REVENUE BUDGET
This budget includes grants to various conservation projects, including Singleton Environment Centre and the costs for the Hothfield Warden.
Head Of Cultural ServicesTourism, Nature Conservation & Heritage Manager
CONSERVATION
100

SERVICESERVICE DESCRIPTION
SERVICE MANAGERBUDGET MANAGER
ACTUAL ESTIMATE PROJECTED DETAIL ESTIMATEOUTTURN
2010/11 2011/12 2011/12 2012/13£ £ £ £
EXPENDITURE117,909 70,130 81,310 Employees 63,800
9,888 11,190 5,890 Premises 3,900 82,542 29,650 38,350 Supplies and Services 30,140 3,370 1,530 1,530 Transport 1,530
213,709 112,500 127,080 TOTAL EXPENDITURE 99,370 INCOME
- - - Grants - (64,481) (13,600) (13,600) Fees and Charges (13,600)
149,228 98,900 113,480 NET CONTROLLABLE
EXPENDITURE 85,770 RECHARGES & CAPITAL CHARGES
85,887 55,310 55,310 Support Services 60,270 2,973 2,890 2,890 Capital Charges 2,970
- - - Recharges - 3,079 6,100 (8,970) Transfers to/from Reserves 4,800
241,167 163,200 162,710 NET EXPENDITURE (Including Recharges and Capital Charges) 153,810
ANALYSIS OF BUDGET VARIATIONS£ COMMENTS
Base Budget 2011/12 163,200 15% Saving (9,000) Pay Award 510
120 Virement (680) Salaries 720 Virement (4,000) Supplies and services (1,330) General Inflation 530 Change in support costs 4,960 Change in Capital Charges 80 Change in transfer to reserve (1,300) Base Budget 2012/13 153,810
ANALYSIS OF BUDGET VARIATIONS£ COMMENTS
Base Budget 2011/12 163,200 Virement (680)
Salaries 6,860 100
Change in transfer to reserve
(6,770)
Outturn 2011/12 (P7 Forecast) 162,710
REVENUE BUDGET
This budget covers the provision of the Tourist information offices at Tenterden and Ashford and the wider tourism activities. This budget also includes twinning costs and museum grants.
Head Of Cultural ServicesTourism & Heritage Manager
TOURISM & HERITAGE
Reduction in costs due to move to Gateway Plus
NOTES
Redundancy payments
Increments
To Sports budget to support Courtside/Pitchside
Change in employer contribution rate
Saving identified
Funding towards redundancy payments
-
Change in employer contribution rate
Supplies and services
101

SERVICESERVICE DESCRIPTION
SERVICE MANAGERBUDGET MANAGER
ACTUAL ESTIMATE PROJECTED DETAIL ESTIMATEOUTTURN
2010/11 2011/12 2011/12 2012/13£ £ £ £
EXPENDITURE367,671 289,640 287,610 Employees 291,840
- - - Premises - 110,189 143,650 143,650 Supplies and Services 141,300
3,152 6,010 6,010 Transport 3,800 481,012 439,300 437,270 TOTAL EXPENDITURE 436,940
INCOME- - - Grants -
19,955 (40,000) - Fees and Charges -
500,967 399,300 437,270 NET CONTROLLABLE
EXPENDITURE 436,940 RECHARGES & CAPITAL CHARGES
84,629 36,190 36,190 Support Services 52,060 - - - Capital Charges -
(413,366) (343,670) (340,960) Recharges (349,000) - (140,000) (140,000) Transfers to/from Reserves (140,000)
172,230 (48,180) (7,500) NET EXPENDITURE (Including Recharges and Capital Charges) -
ANALYSIS OF BUDGET VARIATIONS£ COMMENTS
Base Budget 2011/12 (48,180) Pay Award 1,970 Increments 660 Virement (2,030) Salaries (610)
(2,380) Inflation (1,170) Fees and charges 41,200 Change in support costs 15,870 Change in recharges (5,330) Base Budget 2012/13 -
ANALYSIS OF BUDGET VARIATIONS£ COMMENTS
Base Budget 2011/12 (48,180) Virement (2,030) Fees and charges 40,000 Change in recharges 2,710 Outturn 2011/12 (P7 Forecast) (7,500)
Change in employer contribution rate
NOTES
-
Reduction in income from Ashford Future projectsChange in employer contribution rate
REVENUE BUDGET
Provides professional skills and services such as Project Management, building design, quantity surveying and drainage engineering for council projects including corporate and operational across capital and revenue budgets
PROJECT OFFICE
Head Of Cultural ServicesProject Office Manager
Increase in general fund projects
Removal of land drainage advice budget Supplies and services
Moved into recharges
102

SERVICESERVICE DESCRIPTION
SERVICE MANAGERBUDGET MANAGER
ACTUAL ESTIMATE PROJECTED DETAIL ESTIMATEOUTTURN
2010/11 2011/12 2011/12 2012/13£ £ £ £
EXPENDITURE- - - Employees -
273 3,610 3,610 Premises - 28 - - Supplies and Services -
- - - Transport - 301 3,610 3,610 TOTAL EXPENDITURE -
INCOME- - - Grants - - - - Fees and Charges -
301 3,610 3,610 NET CONTROLLABLE
EXPENDITURE - RECHARGES & CAPITAL
CHARGES 37,732 40,660 40,660 Support Services 34,060
- - - Capital Charges - - - - Recharges - - - - Transfers to/from Reserves -
38,033 44,270 44,270 NET EXPENDITURE (Including Recharges and Capital Charges) 34,060
ANALYSIS OF BUDGET VARIATIONS£ COMMENTS
Base Budget 2011/12 44,270 Premises (3,610) Change in support costs (6,600) Base Budget 2012/13 34,060
ANALYSIS OF BUDGET VARIATIONS£ COMMENTS
Base Budget 2011/12 44,270 Outturn 2011/12 (P7 Forecast) 44,270
REVENUE BUDGET
Statutory function giving advice to Planning and partners and Housing on drainage, flooding and sewage treatment and pumping stations.
Head Of Cultural ServicesProject Office Manager
LAND DRAINAGE
Removal of budget for sandbags
-
NOTES
103

SERVICESERVICE DESCRIPTION
SERVICE MANAGERBUDGET MANAGER
ACTUAL ESTIMATE PROJECTED DETAIL ESTIMATEOUTTURN
2010/11 2011/12 2011/12 2012/13£ £ £ £
EXPENDITURE358 500 500 Leasing 500
12,236 Debt Premiums(86,024) (127,640) (127,640) Item 8 Credit (240,000) 64,862 96,390 96,390 Item 8 Debit 120,000 80,787 210,000 210,000 Interest Paid 235,000
220,143 65,120 65,120 MRP 85,000 292,362 244,370 244,370 TOTAL EXPENDITURE 200,500
INCOMEGrants
(511,227) (675,000) (675,000) Fees and Charges (675,000)
(218,865) (430,630) (430,630) NET CONTROLLABLE
EXPENDITURE (474,500) RECHARGES & CAPITAL
CHARGES Support Services
874,439 (994,320) (994,320) Capital Charges (1,697,290) RechargesTransfers to/from Reserves
655,574 (1,424,950) (1,424,950) NET EXPENDITURE (Including Recharges and Capital Charges) (2,171,790)
ANALYSIS OF BUDGET VARIATIONS£ COMMENTS
Base Budget 2011/12 (1,424,950) Change in Investment Income - Change in Item 8 (88,750) Change in Interest paid and MRP 44,880 Change in support costs - Change in Capital Charges (702,970) Change in recharges - Budget 2012/13 (2,171,790)
ANALYSIS OF BUDGET VARIATIONS£ COMMENTS
Base Budget 2011/12 (1,424,950) Outturn 2011/12 (1,424,950)
NOTES
-
REVENUE BUDGET
Includes the Income earned on investments and the reversal of Capital Charges (contra entries)
Net Interest and Capital Charges
Deputy Chief ExecutiveFinance Manager
104

ACTUAL ESTIMATE PROJECTED DETAIL ESTIMATEOUTTURN
2010/11 2011/12 2011/12 2012/13£ £ £ £
(20,294,636) (21,299,110) (21,327,050) HRA Income (22,563,950) (119,667,638) 3,999,390 3,973,790 HRA Administration Costs 3,800,360
7,194,573 7,997,500 7,911,450 HRA Repairs & Maintenance 8,399,000 130,503,950 8,923,930 8,954,560 HRA Other Expenditure 10,143,840
1,782,060 297,010 292,650 HRA New Build 216,540
(481,691) (81,280) (194,600) SERVICE EXPENDITURE (4,210)
REVENUE BUDGET
HOUSING REVENUE ACCOUNT
105

HRA Income HRA
Administration Costs
HRA Repairs & Maintenance
HRA Other Expenditure New Build Total
£ £ £ £ £ £
EXPENDITURE Employees - 2,037,600 - 104,860 2,142,460 Premises - 709,560 8,434,000 - - 9,143,560 Supplies and Services - 387,650 592,700 100,000 1,080,350 Transport - 48,830 - 670 49,500 TOTAL EXPENDITURE - 3,183,640 8,434,000 592,700 205,530 12,415,870 INCOME Grants ( 333,250) - - ( 2,999,850) - ( 3,333,100) Rent and Other Income ( 22,230,700) ( 91,000) ( 35,000) ( 270,780) - ( 22,627,480) TOTAL INCOME ( 22,563,950) ( 91,000) ( 35,000) ( 3,270,630) - ( 25,960,580)
NET CONTROLLABLE EXPENDITURE ( 22,563,950) 3,092,640 8,399,000 ( 2,677,930) 205,530 ( 13,544,710) NON CONTROLLABLE ITEMS Recharged from other Accounts - 1,070,540 - 851,470 - 1,922,010 Capital Charges - ( 271,680) - 9,654,030 11,010 9,393,360 Recharged to other Accounts - ( 91,140) - - - ( 91,140) Transfer to/from Reserves - - - 2,316,270 - 2,316,270 TOTAL NON-CONTROLLABLE ITEMS - 707,720 - 12,821,770 11,010 13,540,500
NET EXPENDITURE ( 22,563,950) 3,800,360 8,399,000 10,143,840 216,540 ( 4,210)
SUBJECTIVE ANALYSIS - 2012/13 ESTIMATE HOUSING REVENUE ACCOUNT
106

SERVICESERVICE DESCRIPTION
SERVICE MANAGERBUDGET MANAGER
ACTUAL ESTIMATE PROJECTED DETAIL ESTIMATEOUTTURN
2010/11 2011/12 2011/12 2012/13£ £ £ £
INCOME(19,364,780) (20,352,500) (20,404,500) Rents (21,619,500)
(332,587) (356,120) (333,250) Government Grant (333,250) (597,269) (590,490) (589,300) Other Income (611,200)
(20,294,636) (21,299,110) (21,327,050) NET EXPENDITURE (22,563,950)
ANALYSIS OF BUDGET VARIATIONS£
(21,299,110) (1,267,000)
22,870 (20,710)
(22,563,950)
ANALYSIS OF BUDGET VARIATIONS£
(21,299,110) Increased rent income (52,000) Supporting people charges 22,870 Other service charges 1,190
(21,327,050)
The 6.7% increase on dwelling rents includes rent for affordable housing, at 80% of market rent this is higher than the social housing rents thereby increasing the average annual rent. Social housing rents have been calculated using CLG guidance
6.7% provisional increase on dwelling rents as per the Draft Determination from CLG
NOTES
Outturn 2011/12 (P7 Forecast)
Dwelling and garage rent
Based on latest income figuresBase Budget 2011/12
REVENUE BUDGET
Income collected from Council Tenants, Garage Rents, Service Charges, Supporting People income and Investment Income
HRA Income
HEAD OF CUSTOMER, HOMES and PROPERTY SERVICESHOUSING RESOURCE MANAGER
COMMENTS
COMMENTS
Supporting People grant Increased service charges
Base Budget 2011/12
Budget 2012/13
107

SERVICESERVICE DESCRIPTION
SERVICE MANAGERBUDGET MANAGER
ACTUAL ESTIMATE PROJECTED DETAIL ESTIMATEOUTTURN
2010/11 2011/12 2011/12 2012/13£ £ £ £
EXPENDITURE1,797,365 2,041,340 1,986,380 Employees 2,037,600
940,700 671,710 642,660 Premises 709,560 485,696 358,690 358,280 Supplies and Services 387,650 61,358 47,630 45,910 Transport 48,830
3,285,119 3,119,370 3,033,230 TOTAL EXPENDITURE 3,183,640 INCOME
(850) - - Grants - (163,728) (112,570) (82,030) Fees and Charges (91,000)
3,120,541 3,006,800 2,951,200 NET CONTROLLABLE EXPENDITURE 3,092,640
RECHARGES & CAPITAL CHARGES 802,176 1,021,810 1,021,810 Support Services 1,070,540
(123,590,355) 240 240 Capital Charges (271,680) - (29,460) 540 Recharges (91,140)
- - Transfers to/from Reserves -
(119,667,638) 3,999,390 3,973,790 NET EXPENDITURE (Including Recharges and Capital Charges) 3,800,360
ANALYSIS OF BUDGET VARIATIONS£
Base Budget 2011/12 3,999,390 (3,740)
5,200 20,000 26,000
(13,350) 17,000 11,960
1,200 21,570 48,730
(271,920) (61,680)
Budget 2012/13 3,800,360
ANALYSIS OF BUDGET VARIATIONS£
Base Budget 2011/12 3,999,390 (54,960)
Supplies and services 1,080 Transport (1,720) Recharges 30,000 Outturn 2011/12 (P7 Forecast) 3,973,790
Supplies and services
COMMENTS
REVENUE BUDGET
Estate managementHRA Administration Costs
HEAD OF CUSTOMER, HOMES and PROPERTY SERVICESHOUSING RESOURCE MANAGER
Virement from Housing Options £29.5k, virement from New Build £22k, employers insurance £17k, supported housing officer reduced hours £15k & deleted trainee post (3118) £24k
Proportionately lower, in line with costs
NOTES
Office equipment maintenance £9,500 & other operational equipment £3,000
Premises insurance
Malicious damage
Management fees
Voids at Little Hill
Employees
Support services Capital charges Recharges
Transport
Sheltered accommodation Water supply Council tax
Ashford Gateway+ HRA share of GF costs
Saving of £50k due to the Building Surveyors vacancy and delay in filling other vacancies
COMMENTS
Employees
108

SERVICESERVICE DESCRIPTION
SERVICE MANAGERBUDGET MANAGER
ACTUAL ESTIMATE PROJECTED DETAIL ESTIMATEOUTTURN
2010/11 2011/12 2011/12 2012/13£ £ £ £
EXPENDITURE2,012,021 2,084,000 2,079,000 Housing Repairs Responsive 2,079,000
820,030 1,185,000 1,055,000 Kitchen Refurbishments 935,900 1,060,789 1,172,200 1,172,200 Central Heating 1,200,450
755,325 762,000 774,000 Bathroom Refurbishment 550,700 701,352 834,600 834,600 Gas Heating 856,000 252,435 341,700 463,000 Re-Roofing 483,000 302,140 252,000 252,000 Rewiring 497,700
1,464,434 1,381,000 1,407,650 Other Repairs 1,831,250 7,368,526 8,012,500 8,037,450 TOTAL EXPENDITURE 8,434,000
INCOME(173,953) (15,000) (126,000) Fees and Charges (35,000)
7,194,573 7,997,500 7,911,450 NET EXPENDITURE (Including Recharges and Capital Charges)
8,399,000
ANALYSIS OF BUDGET VARIATIONS£
7,997,500 81,000
(3,000) 67,550 21,400
254,550
(20,000) 8,399,000
ANALYSIS OF BUDGET VARIATIONS£
7,997,500 (86,050)
7,911,450
HOUSING RESOURCE MANAGER
Disabled Adaptations £100,000, Remodelling £100,000 & Luckley House extension £50,000
REVENUE BUDGET
HRA Repairs & Maintenance
HEAD OF CUSTOMER, HOMES and PROPERTY SERVICES
Periodic electrical inspections Cyclical works
Recovery of repair costs
NOTES
Gas heating maintenance
Income from rechargeable works
Budget 2012/13
Base Budget 2011/12
Outturn 2011/12 (P7 Forecast)
COMMENTS
Disabled adaptations/remodelling sheltered accommodation Fees and charges
Base Budget 2011/12COMMENTS
Area planning & communal areas
Sanctuary works
Cyclical works
One off works in 11/12
109

SERVICESERVICE DESCRIPTION
SERVICE MANAGERBUDGET MANAGER
ACTUAL ESTIMATE PROJECTED DETAIL ESTIMATEOUTTURN
2010/11 2011/12 2011/12 2012/13£ £ £ £
EXPENDITURE247 - - Employees -
7,618 - - Premises - 745,138 378,000 399,340 Supplies and Services 392,700
7,058,278 7,751,910 7,751,910 Housing Subsidy - - 200,000 200,000 Provision for Bad Debts 200,000
382 - - Transport - 7,811,663 8,329,910 8,351,250 TOTAL EXPENDITURE 592,700
INCOME(2,999,845) (2,999,850) (2,999,850) Grants (2,999,850)
(556,151) (280,610) (280,730) Fees and Charges (270,780) 4,255,667 5,049,450 5,070,670 NET CONTROLLABLE EXPENDITURE (2,677,930)
RECHARGES & CAPITAL CHARGES
788,526 846,730 846,730 Support Costs 851,470 - - Contribution to Reserves 2,316,270
125,459,757 3,027,750 3,037,160 Capital Charges 9,654,030 130,503,950 8,923,930 8,954,560 NET EXPENDITURE (Including
Recharges and Capital Charges) 10,143,840
ANALYSIS OF BUDGET VARIATIONS£
Base Budget 2011/12 8,923,930 (7,751,910)
14,700
Interest payable 4,774,000
Contribution to reserves 2,316,270 9,830 4,740
Increase in depreciation 1,704,730
147,550 Budget 2012/13 10,143,840
ANALYSIS OF BUDGET VARIATIONS£
Base Budget 2011/12 8,923,930 Stanhope amenities handover 21,340 Fees and charges (120) Capital charges 9,410 Outturn 2011/12 (P7 Forecast) 8,954,560
* The budget has been prepared on the basis that the subsidy system ends on 1 April 2012
£10,000 increase in legal fees for the handover of amenity areas at Stanhope, plus Home Loss payment £4,700
NOTES
Housing SubsidyStanhope
Interest is payable on the debt taken on as a result of the end of the subsidy system
REVENUE BUDGET
The subsidy system is due to end on 1 April 2012
HRA Other Expenditure
HEAD OF CUSTOMER, HOMES and PROPERTY SERVICES
COMMENTS
HOUSING RESOURCE MANAGER
COMMENTS
Investment interestChange in support costs
Change in capital charges Inflation increase on PFI contract
The settlement from the HRA reform has resulted in higher Major Repairs contributions
110

SERVICESERVICE DESCRIPTION
SERVICE MANAGERBUDGET MANAGER
ACTUAL ESTIMATE PROJECTED DETAIL ESTIMATEOUTTURN
2010/11 2011/12 2011/12 2012/13£ £ £ £
EXPENDITURE195,051 197,010 192,650 Employees 104,860
25,237 - - Premises - 153,493 100,000 100,000 Supplies and Services 100,000
8 - - Transport 670
373,788 297,010 292,650 NET CONTROLLABLE EXPENDITURE 205,530
RECHARGES & CAPITAL CHARGES 23,845 - - Support Services -
1,466,012 - - Capital Charges 11,010 (81,585) - - Recharges -
1,782,060 297,010 292,650 NET EXPENDITURE (Including Recharges and Capital Charges) 216,540
ANALYSIS OF BUDGET VARIATIONS£
Base Budget 2011/12 297,010 (92,150)
Transport 670 Capital Charges 11,010 Budget 2012/13 216,540
ANALYSIS OF BUDGET VARIATIONS£
Base Budget 2011/12 297,010 Salary virement from HRA Admin (4,360) Outturn 2011/12 (P7 Forecast) 292,650
Virement to Corporate Property £34.5k, virement to Housing Strategy & Enabling £23.5K, virement to Council Offices £1.8k, virement to HRA Administration £22k, superannuation rate reduction £7.3k, NI adjustment £3k
NOTES
STRATEGIC HOUSING AND PROPERTY MANAGER
COMMENTS
COMMENTS
Reallocation of staff time
REVENUE BUDGET
New Build
HEAD OF CUSTOMER, HOMES and PROPERTY SERVICES
111

2010-11 HRA Income and Expenditure Account 2011-12 Original Budget
2011-12 Projected Outturn
2012-13 Original Budget
£ £ £ £Expenditure
2,971,575 Repairs and maintenance 3,536,600 3,321,600 3,553,5504,635,657 Supervision and management 4,157,390 4,278,650 4,269,170
43,275 Rents, rates, taxes and other charges 14,000 14,000 40,0002,969,555 PFI Contractor 4,142,590 4,150,950 4,251,9806,997,788 Negative HRA Subsidy payable 7,751,910 7,751,910 05,005,851 Depreciation and impairment of non current assets 3,667,740 3,667,740 5,460,460
107,635,783 Exceptional Item – (Revaluation Gain)/Impairment of HRA assets 0 0 044,387 Debt management costs 52,920 52,920 52,920
0 Movement in the allowance for bad debts 200,000 200,000 200,000130,303,870 Total Expenditure 23,523,150 23,437,770 17,828,080
Income(18,867,520) Dwelling rents (19,792,500) (19,934,400) (21,147,800)
(526,246) Non-dwelling rents (575,700) (485,800) (485,800)(568,283) Charges for services and facilities (574,790) (573,600) (597,100)(332,587) Contributions towards expenditure (356,120) (333,250) (333,250)
(26,999,845) PFI Subsidy receivable (2,999,850) (2,999,850) (2,999,850)(23,294,481) Total Income (24,298,960) (24,326,900) (25,563,800)107,009,389 (775,810) (889,130) (7,735,720)
486,038 HRA services' share of Corporate and Democratic Core 510,480 510,480 517,880289,345 HRA share of other amounts included in the whole authority Cost of Services but not
allocated to specific services331,260 331,260 327,700
107,784,773 Net (Income)/Cost for HRA Services 65,930 (47,390) (6,890,140)
HRA share of the operating income and expenditure included in the Comprehensive Income and Expenditure Statement:
14,779,150 (Gain)/Loss on sale of HRA non-current assets 0 0 01,025,351 Interest payable and similar charges 242,690 242,690 4,960,740
(64,862) Interest and investment income (129,230) (129,230) (119,400)0 Repayment of Debt 0 0 190,000
278,981 Pensions interest cost and expected return on pensions assets 378,620 378,620 378,620123,803,394 (Surplus) or deficit for the year on HRA services 558,010 444,690 (1,480,180)
2010-11 Movement on the Housing Revenue Account Statement 2011-12 Original Budget
2011-12 Projected Outturn
2012-13 Original Budget
£ £ £ £(1,670,237) Balance on the HRA at the end of the previous year (1,460,417) (2,151,928) (2,339,968)
123,803,394 (Surplus)/Deficit for the year on the HRA Income and Expenditure Statement 558,010 444,690 (1,480,180)(124,285,084) Adjustments between accounting basis under statute (639,290) (639,290) 1,475,970
(481,691) Net (increase)/decrease in year on the HRA (81,280) (194,600) (4,210)(2,151,928) Balance on the HRA at the end of the current year (1,541,697) (2,346,528) (2,344,178)
2010-11 Note on Statement of Movement on the Housing Revenue Account Balance 2011-12 Original Budget
2011-12 Projected Outturn
2012-13 Original Budget
£ £ £ £Items included in the HRA Income and Expenditure Account but excluded from the movement on HRA Balance for the year
(43,764) Difference between interest payable and similar charges (including amortisation of premiums and discounts)
(109,103,493) Difference between any other item of income and expenditure determined in accordance with the code
(260,670) (260,670) (271,680)
(14,779,150) (Gain) or loss on sale of HRA non-current assets 0 0 036,190 Capital expenditure funded by the HRA 0 0 0
(205,465) HRA Share of contributions to or from the pension reserve (378,620) (378,620) (378,620)(189,402) Transfer to/(from) Reserves 0 0 2,126,270
(124,285,084) (639,290) (639,290) 1,475,970
Net Cost of HRA Services as included in the Comprehensive Income and Expenditure Statement
112

HRA Capital Works Summary
Description 2010/11 Actuals
2011/12 Original Budget
2011/12 Current
Estimate
2012/13 Estimate
Insulation 5,913 10,000 10,000 10,000Central heating 1,060,789 1,172,200 1,172,200 1,200,450Structural works/underpinning 0 20,000 20,000 40,000Adaptations for the disabled 128,203 200,000 200,000 300,000Re-roofing 252,435 341,700 463,000 483,000P.V.C.U. gutters/fascias/soffits 111,051 134,000 114,000 297,600Water mains replacement 0 0 0 68,600Kitchen refurbishments 820,030 1,185,000 1,055,000 935,900Rewiring 302,141 253,000 252,000 497,700Bathroom refurbishments 755,325 762,000 774,000 550,700Environmental improvements 76,444 80,000 80,000 80,000Remodelling sheltered accommodation 109,071 50,000 115,000 200,000External walls 129,819 34,000 0 91,500Fire safety works 156,631 50,000 50,000 30,000Garage works 35,672 100,000 100,000 50,000Major regeneration works 153,592 0 0 0Brookfield court renovation 78,770 0 0 0Digital TV upgrades 12,810 200,000 200,000 10,000
4,188,694 4,591,900 4,605,200 4,845,450
Financed by:Major Repairs Allowance (MRA) 3,348,739 3,407,070 3,407,070 4,845,450Major Repairs Reserve (MRR) 839,955 1,184,830 1,198,130 0Revenue Contribution 0 0 0 0
4,188,694 4,591,900 4,605,200 4,845,450
113

Original Budget
Current Budget
Previous years 2011/12 2012/13 2013/14 2014/15
£ £ £ £ £ £ £Customers, Homes & PropertyRepairs and renewals funded from capital 300,000 300,000 0 75,000 75,000 75,000 75,000Mandatory Disabled Facility Grants
Expenditure 1,684,000 1,684,000 0 496,000 396,000 396,000 396,000External Funding -1,224,000 -1,224,000 0 -306,000 -306,000 -306,000 -306,000
460,000 460,000 0 190,000 90,000 90,000 90,000
Total - Customers, Homes & Property 1,984,000 1,984,000 0 571,000 471,000 471,000 471,000
Business Change & TechnologyWebsite Content Management 40,000 40,000 0 30,000 10,000 0 0
Total Business Change & Technology 40,000 40,000 0 30,000 10,000 0 0
Personnel and DevelopmentHR System 50,000 50,000 0 25,000 25,000 0 0
Total Personnel and Development 50,000 50,000 0 25,000 25,000 0 0
Environmental ServicesHythe Road Recreation Ground
Expenditure 60,000 60,000 1,820 0 58,180 0 0External Funding -60,000 -60,000 -1,820 0 -58,180 0 0
0 0 0 0 0 0 0Beaver Ward Play Area
Expenditure 138,250 138,250 135,050 3,200 0 0External Funding -78,200 -78,200 -78,200 0 0 0 0
60,050 60,050 56,850 0 3,200 0 0
Total Environmental Services 198,250 198,250 136,870 0 61,380 0 0
Strategy, Partnerships & CommunicationsSingle Grants Gateway Fund 300,000 300,000 0 75,000 75,000 75,000 75,000
Total - Strategy, Partnerships & Communications 300,000 300,000 0 75,000 75,000 75,000 75,000
Cultural ServicesTenterden Leisure Centre 1,100,000 1,100,000 0 550,000 550,000 0 0St Mary's Church
Expenditure 369,500 1,794,400 910,700 868,700 15,000 0 0External Funding -269,500 -1,694,400 -908,450 -785,950 0 0 0
100,000 100,000 2,250 82,750 15,000 0 0
Conningbrook Lakes Scoping 25,000 85,000 900 84,100 0 0 0Singleton Village Hall
Expenditure 250,000 357,000 1,210 0 10,000 172,895 172,895External Funding -250,000 -357,000 -1,210 0 -10,000 -172,895 -172,895
0 0 0 0 0 0 0Singleton Open Space
Expenditure 15,000 350,000 4,900 8,000 40,000 297,100 0External Funding -15,000 -350,000 -4,900 -8,000 -40,000 -297,100 0
0 0 0 0 0 0 0Great Chart Pavilion
Expenditure 66,000 66,000 3,300 35,000 27,700 0 0External Funding -66,000 -66,000 -3,300 -35,000 -27,700 0 0
0 0 0 0 0 0 0Repton Park
Expenditure 10,000 60,000 300 3,000 56,700 0 0External Funding -10,000 -60,000 -300 -3,000 -56,700 0 0
0 0 0 0 0 0 0Bushy Royds (Sports Facilities)
Expenditure 60,000 60,000 0 0 60,000 0 0External Funding -60,000 -60,000 0 0 -60,000 0 0
0 0 0 0 0 0 0Brisley Farm - Community Leisure
Expenditure 5,000 5,000 0 0 5,000 0 0External Funding -5,000 -5,000 0 0 -5,000 0 0
0 0 0 0 0 0 0
Total Cultural Services 1,900,500 3,877,400 921,310 1,548,800 764,400 469,995 172,895
General Fund Total 4,472,750 6,449,650 1,058,180 2,249,800 1,406,780 1,015,995 718,895
HRA Capital WorksProgrammed Works 0 0 0 4,341,900 4,339,910 5,049,940 5,937,570HRA New Build
Expenditure 9,338,237 10,138,237 3,296,960 6,841,277 0 3,297,720 3,297,720External Funding -5,170,000 -5,170,000 -1,520,000 -3,650,000 0 -692,520 -692,520
4,168,237 4,968,237 1,776,960 3,191,277 0 2,605,200 2,605,200
Total HRA 9,338,237 10,138,237 3,296,960 11,183,177 4,339,910 8,347,660 9,235,290
Total Capital Spend 13,810,987 16,587,887 4,355,140 13,432,977 5,746,690 9,363,655 9,954,185
CAPITAL PROGRAMME
114

Original Budget
Current Budget
Previous years 2011/12 2012/13 2013/14 2014/15
£ £ £ £ £ £ £
CAPITAL PROGRAMME
CAPITAL SUMMARYCustomers, Homes & Property 1,984,000 1,984,000 0 571,000 471,000 471,000 471,000Business Change & Technology 40,000 40,000 0 30,000 10,000 0 0Personnel and Development 50,000 50,000 0 25,000 25,000 0 0Environmental Services 198,250 198,250 136,870 0 61,380 0 0Strategy, Partnerships & Communications 300,000 300,000 0 75,000 75,000 75,000 75,000Cultural Services 1,900,500 3,877,400 921,310 1,548,800 764,400 469,995 172,895GENERAL FUND 4,472,750 6,449,650 1,058,180 2,249,800 1,406,780 1,015,995 718,895
HOUSING REVENUE ACCOUNT 9,338,237 10,138,237 3,296,960 11,183,177 4,339,910 8,347,660 9,235,290
13,810,987 16,587,887 4,355,140 13,432,977 5,746,690 9,363,655 9,954,185
Funding StatementCapital Receipts 1,745,050 2,105,050 60,000 1,047,850 366,200 225,000 225,000Borrowing HRA 4,168,237 4,668,237 1,776,960 2,891,277 0 2,605,200 2,605,200Borrowing GF 0 0 0 9,000 142,000 15,000 15,000External grants & contributions HRA 5,170,000 5,170,000 1,520,000 3,650,000 0 692,520 692,520External grants & contributions GF 2,037,700 3,954,600 998,180 1,137,950 563,580 775,995 478,895Major Repairs Reserve HRA 0 0 0 4,341,900 4,339,910 5,049,940 5,937,570Other Reserve HRA 0 0 0 0 0 0 0Other Reserve GF 690,000 690,000 0 355,000 335,000 0 0
13,810,987 16,587,887 4,355,140 13,432,977 5,746,690 9,363,655 9,954,185
External GrantsGrowth Area Funding 269,500 1,349,400 797,450 551,950 0 0 0Section 106 466,000 958,000 11,530 46,000 257,580 469,995 172,895Disabled Facility Grants 1,224,000 1,224,000 0 306,000 306,000 306,000 306,000Interreg 0 234000 0 234,000 0 0 0Big lottery Fund 78,200 78,200 78,200 0 0 0 0Other smaller grants (St Mary's Church) 0 111,000 111,000 0 0 0 0Homes & Community Agency 5,170,000 5,170,000 1,520,000 3,650,000 0 692,520 692,520
7,207,700 9,124,600 2,518,180 4,787,950 563,580 1,468,515 1,171,415
115

Repairs and Renewals 2011/12 2012/13 2013/14 2014/15 2015/16£ £ £ £ £
Opening Position 1st April 745,973 495,273 374,273 253,273 132,273
Capital Commitments
ICT Replacement Programme (80,000) (80,000) (80,000) (80,000) (80,000)Feasibility Studies (25,000) (50,000) (50,000) (50,000) (50,000)Repairs and Renewals Programme (27,200) (70,000) (70,000) (70,000) (70,000)Other works approved (222,500) (25,000) (25,000) (25,000) (25,000)Land disposal expenditure 0 0 0 0 0
Receipts ForecastCivic Centre Rent 104,000 104,000 104,000 104,000 104,000
Forecast Capital Resources 495,273 374,273 253,273 132,273 11,273
Net Movement (250,700) (121,000) (121,000) (121,000) (121,000)
PLANNED MAINTENANCE PROGRAMME FUNDING - SUMMARY
116

LICENSING FEES
Item Statutory or Discretionary Description/Comments VAT
IndicatorCharge 2010/11
Charge 2011/12
Proposed Charge 2012/13
Increase / Decrease
on 2011/12
£ £ £ %
Licensing Act Statutory Fee band - A NB 100.00 100.00 100.00 0.00%
Fee band - B NB 190.00 190.00 190.00 0.00%Fee band - C NB 315.00 315.00 315.00 0.00%Fee band - D - if exclusively or primarily for supply, sale or consumption of alcohol double the fee NB 450.00 450.00 450.00 0.00%Fee band - E - if exclusively or primarily for supply, sale or consumption of alcohol triple the fee NB 635.00 635.00 635.00 0.00%Premises allowing 5000+ people attract additional feesPremises where only licensable activity is regulated entertainment & premises is education, church hall, village hall or similar
Statutory Fee band - A NB 70.00 70.00 70.00 0.00%Fee band - B NB 180.00 180.00 180.00 0.00%Fee band - C NB 295.00 295.00 295.00 0.00%Fee band - D - if exclusively or primarily for supply, sale or consumption of alcohol double the fee NB 320.00 320.00 320.00 0.00%Fee band - E - if exclusively or primarily for supply, sale or consumption of alcohol triple the fee NB 350.00 350.00 350.00 0.00%
Premises allowing 5000+ people attract additional fees 0.00 0.00 0.00 0.00%Personal Statutory NB 37.00 37.00 37.00 0.00%Temporary Event Notice Statutory NB 21.00 21.00 21.00 0.00%Change of address notification Statutory NB 10.50 10.50 10.50 0.00%loss/theft etc) Statutory NB 10.50 10.50 10.50 0.00%Designated premises supervisor Statutory NB 23.00 23.00 23.00 0.00%Premises licence transfer Statutory NB 23.00 23.00 23.00 0.00%Club registration change Statutory NB 10.50 10.50 10.50 0.00%Club name or rules notification Statutory NB 10.50 10.50 10.50 0.00%Interim Authority Notice Statutory NB 23.00 23.00 23.00 0.00%Provisional Statement Statutory NB 315.00 315.00 315.00 0.00%Freeholder notification of licensing Statutory NB 21.00 21.00 21.00 0.00%Minor Variation Statutory NB 89.00 89.00 89.00 0.00%Animal Welfare and Public Health Licences
DISCRETIONARY & STATUTORY FEES 2012/13
Premises - new applicationPremises - annual fee
See regulations for details
No fee payable
117

LICENSING FEES
Item Statutory or Discretionary Description/Comments VAT
IndicatorCharge 2010/11
Charge 2011/12
Proposed Charge 2012/13
Increase / Decrease
on 2011/12
£ £ £ %
DISCRETIONARY & STATUTORY FEES 2012/13
Discretionary New Licence NB 133.00 200.00 511.00 155.50%Discretionary Renewal NB 108.00 120.00 127.00 5.83%Discretionary Variation NB 108.00 120.00 127.00 5.83%Discretionary Concurrent 2nd application NB 23.00 60.00 63.00 5.00%Discretionary New Licence NB 133.00 200.00 511.00 155.50%Discretionary Renewal NB 108.00 120.00 127.00 5.83%Discretionary Variation NB 108.00 120.00 127.00 5.83%Discretionary Concurrent 2nd application NB 23.00 60.00 63.00 5.00%Discretionary New Licence NB 67.00 75.00 79.00 5.33%Discretionary Renewal NB 52.00 58.00 61.00 5.17%Discretionary New Licence NB 133.00 200.00 511.00 155.50%Discretionary Renewal NB 108.00 120.00 127.00 5.83%Discretionary Variation NB 108.00 120.00 127.00 5.83%Discretionary Concurrent 2nd application NB 23.00 60.00 63.00 5.00%Discretionary New Licence NB 133.00 200.00 511.00 155.50%Discretionary Renewal NB 46.00 65.00 369.00 467.69%Discretionary Variation NB 46.00 65.00 69.00 6.15%Discretionary Concurrent 2nd application NB 23.00 30.00 32.00 6.67%Discretionary New Licence (2 year licence) NB 390.00 410.00 844.00 105.85%Discretionary Renewal (2 year licence) NB 267.00 281.00 578.00 105.69%Discretionary Variation NB 267.00 281.00 297.00 5.69%Discretionary Concurrent 2nd application NB 67.00 71.00 75.00 5.63%Discretionary Consideration NB 943.00 994.00 1,051.00 5.73%Discretionary Licence (4 year licence) NB 1,558.00 1,640.00 1,733.00 5.67%Discretionary Renewal (6 year licence) NB 2,337.00 2,460.00 2,600.00 5.69%Discretionary Dispensation - 14(1)(a) NB 379.00 400.00 423.00 5.75%
Public Health LicencesDiscretionary Initial registration practitioner/premises NB 144.00 149.00 157.00 5.37%Discretionary Additional practitioner/premises NB 62.00 91.00 96.00 5.49%Discretionary Minor variation NB 88.00 25.00 26.00 4.00%Discretionary Initial registration practitioner/premises NB 277.00 287.00 303.00 5.57%Discretionary Additional practitioner/premises NB 62.00 91.00 96.00 5.49%Discretionary Minor variation NB 88.00 25.00 26.00 4.00%
Electrolysis Discretionary Initial registration practitioner/premises NB 144.00 149.00 157.00 5.37%Discretionary Additional practitioner/premises NB 62.00 91.00 96.00 5.49%
Dangerous Wild Animals
Zoos
Acupuncture
Tattooing (including semi-permanent skin-colouring)
Animal Boarding Establishments
Home Boarding
Pet Shops
Riding Establishments
Dog Breeding Establishments
118

LICENSING FEES
Item Statutory or Discretionary Description/Comments VAT
IndicatorCharge 2010/11
Charge 2011/12
Proposed Charge 2012/13
Increase / Decrease
on 2011/12
£ £ £ %
DISCRETIONARY & STATUTORY FEES 2012/13
Discretionary Minor variation NB 88.00 25.00 26.00 4.00%Discretionary Initial registration practitioner/premises NB 277.00 287.00 303.00 5.57%Discretionary Additional practitioner/premises NB 62.00 91.00 96.00 5.49%Discretionary Minor variation NB 88.00 25.00 26.00 4.00%Discretionary Initial registration practitioner/premises NB 144.00 149.00 157.00 5.37%Discretionary Additional practitioner/premises NB 62.00 91.00 96.00 5.49%Discretionary Minor variation NB 88.00 25.00 26.00 4.00%
Hairdressing Statutory RegistrationSex Establishments Licence
Discretionary Grant NB 2,737.00 2,832.80 2,994.00 5.69%Discretionary Renewal NB 500.00 517.00 546.00 5.61%Discretionary Transfer NB 1,867.10 517.00 546.00 5.61%
Street Trading and ConsentsPublicity Displays StatutoryStreet Collection Permit StatutoryStreet Trading Licence Discretionary Yearly NB 67.00 67.00 67.00 0.00%Casual Street Trading Licence for Market Discretionary Monthly NB 23.00 23.00 23.00 0.00%Street Trading Consent Discretionary Yearly NB 67.00 67.00 67.00 0.00%New Site Street Trading Consent Discretionary Grant NB 0.00 0.00 300.00 100.00%Street Trading Consent Rents Furners Wood Lay-by - cherry stall Discretionary Monthly rents NB 72.00 72.00 76.00 5.56%Great Chart - A28 Tenterden bound - Food Discretionary Monthly rents NB 148.00 148.00 156.00 5.41%Non Food Discretionary Monthly rents NB 50.00 52.00 55.00 5.77%Great Chart - A28 Ashford bound - Food Discretionary Monthly rents NB 142.00 148.00 156.00 5.41%Food Discretionary Monthly rents NB 50.00 52.00 55.00 5.77%Food Discretionary Monthly rents NB 69.00 72.00 76.00 5.56%Hothfield - A20 Maidstone bound - Food Discretionary Monthly rents NB 142.00 148.00 156.00 5.41%Hothfield - A20 Ashford bound - Non Food Discretionary Monthly rents NB 69.00 72.00 76.00 5.56%
Hothfield - A20 Ashford bound - Food Discretionary Monthly rents NB 142.00 148.00 156.00 5.41%
Cosmetic Piercing (excluding ear piercing)
Ear Piercing
Sex Shops, Sex Cinemas and Sexual Entertainment Venue Licences
No fee payable
No fee payableNo fee payable
119

LICENSING FEES
Item Statutory or Discretionary Description/Comments VAT
IndicatorCharge 2010/11
Charge 2011/12
Proposed Charge 2012/13
Increase / Decrease
on 2011/12
£ £ £ %
DISCRETIONARY & STATUTORY FEES 2012/13
Henwood Discretionary Monthly rents NB 169.00 176.00 186.00 5.68%Recreation Ground Road car park Discretionary Monthly rents NB 211.00 220.00 232.00 5.45%Potters Corner, Hothfield Discretionary Monthly rents NB 142.00 148.00 156.00 5.41%Brunswick Road Discretionary Monthly rents NB 142.00 148.00 156.00 5.41%Hall Avenue, Sevington Discretionary Max 28 days use per year NB 190.00 200.00 211.00 5.50%Chilham Mill Discretionary NB 142.00 148.00 156.00 5.41%Henwood Car park Discretionary Monthly rents NB 325.00 408.00 431.00 5.64%Council LandCharity Discretionary
Commercial (e.g. circuses and funfairs) Discretionary per operating day NB 210.00 220.00 233.00 5.91%Discretionary per non-operating day NB 149.00 155.00 163.00 5.16%
Food HygieneLevel 2 course Discretionary EX 59.00 62.00 66.00 6.45%Block booking - weekday per day Discretionary EX 387.00 426.00 450.00 5.63%Block booking - weekday per person Discretionary EX 27.00 30.00 32.00 6.67%Block booking - weekend per day Discretionary EX 598.00 665.00 703.00 5.71%Block booking - weekend per person Discretionary EX 27.00 30.00 32.00 6.67%Re-sit (at time of next course) Discretionary EX 15.00 16.00 17.00 6.25%Re-sit (oral) Discretionary EX 36.00 38.00 40.00 5.26%Food Safety ChargesFood Surrender Certificate Discretionary NB 70.00 75.00 88.00 17.33%Inspection (Voluntary Surrender) or Discretionary Per hour NB 75.00 81.00 86.00 6.17%plus tipping charge at cost Charged by tip NA NA NA NA
Export Certificate for food manufacture Discretionary NB 116.00 125.00 145.00 16.00%MiscellaneousScrap Metal Dealer Registration StatutoryReplacement certificates if not specifically set Discretionary NB 10.50 11.00 11.50 4.55%Gambling Act New small casino Statutory New application NB 6,285.00 6,285.00 6,285.00 0.00%
Annual fee NB 3,575.00 3,575.00 3,575.00 0.00%Variation NB 2,580.00 2,580.00 2,580.00 0.00%Transfer NB 1,500.00 1,500.00 1,500.00 0.00%
No fee payable
No fee payable
120

LICENSING FEES
Item Statutory or Discretionary Description/Comments VAT
IndicatorCharge 2010/11
Charge 2011/12
Proposed Charge 2012/13
Increase / Decrease
on 2011/12
£ £ £ %
DISCRETIONARY & STATUTORY FEES 2012/13
Re-instatement NB 1,260.00 1,260.00 1,260.00 0.00%Provisional statement NB 6,285.00 6,285.00 6,285.00 0.00%Provisional statement holders NB 2,240.00 2,240.00 2,240.00 0.00%Copy licence NB 25.00 25.00 25.00 0.00%Notification of change NB 50.00 50.00 50.00 0.00%New application NB 7,540.00 7,540.00 7,540.00 0.00%Annual fee NB 7,215.00 7,215.00 7,215.00 0.00%Variation NB 3,410.00 3,410.00 3,410.00 0.00%Transfer NB 1,760.00 1,760.00 1,760.00 0.00%Re-instatement NB 1,985.00 1,985.00 1,985.00 0.00%Provisional statement NB 7,540.00 7,540.00 7,540.00 0.00%Provisional statement holders NB 3,700.00 3,700.00 3,700.00 0.00%Copy licence NB 25.00 25.00 25.00 0.00%Notification of change NB 50.00 50.00 50.00 0.00%New application NB 11,880.00 11,880.00 11,880.00 0.00%Annual fee NB 11,140.00 11,140.00 11,140.00 0.00%Variation NB 5,570.00 5,570.00 5,570.00 0.00%Transfer NB 4,055.00 4,055.00 4,055.00 0.00%Re-instatement NB 4,055.00 4,055.00 4,055.00 0.00%Provisional statement NB 11,880.00 11,880.00 11,880.00 0.00%Provisional statement holders NB 5,785.00 5,785.00 5,785.00 0.00%Copy licence NB 25.00 25.00 25.00 0.00%Notification of change NB 50.00 50.00 50.00 0.00%New application NB 2,160.00 2,160.00 2,160.00 0.00%Annual fee NB 670.00 670.00 670.00 0.00%Variation NB 1,475.00 1,475.00 1,475.00 0.00%Transfer NB 820.00 820.00 820.00 0.00%Re-instatement NB 820.00 820.00 820.00 0.00%Provisional statement NB 2,160.00 2,160.00 2,160.00 0.00%Provisional statement holders NB 890.00 890.00 890.00 0.00%Copy licence NB 25.00 25.00 25.00 0.00%Notification of change NB 50.00 50.00 50.00 0.00%
Betting Premises (excluding tracks) Statutory New application NB 2,160.00 2,160.00 2,160.00 0.00%Annual fee NB 430.00 430.00 430.00 0.00%Variation NB 1,245.00 1,245.00 1,245.00 0.00%
New large casino Statutory Maximum
Regional casino Statutory Maximum
Bingo club Statutory Maximum
121

LICENSING FEES
Item Statutory or Discretionary Description/Comments VAT
IndicatorCharge 2010/11
Charge 2011/12
Proposed Charge 2012/13
Increase / Decrease
on 2011/12
£ £ £ %
DISCRETIONARY & STATUTORY FEES 2012/13
Transfer NB 820.00 820.00 820.00 0.00%Re-instatement NB 820.00 820.00 820.00 0.00%Provisional statement NB 2,160.00 2,160.00 2,160.00 0.00%Provisional statement holders NB 890.00 890.00 890.00 0.00%Copy licence NB 25.00 25.00 25.00 0.00%Notification of change NB 50.00 50.00 50.00 0.00%New application NB 1,690.00 1,690.00 1,690.00 0.00%Annual fee NB 670.00 670.00 670.00 0.00%Variation NB 1,130.00 1,130.00 1,130.00 0.00%Transfer NB 820.00 820.00 820.00 0.00%Re-instatement NB 820.00 820.00 820.00 0.00%Provisional statement NB 1,690.00 1,690.00 1,690.00 0.00%Provisional statement holders NB 890.00 890.00 890.00 0.00%Copy licence NB 25.00 25.00 25.00 0.00%Notification of change NB 50.00 50.00 50.00 0.00%New application NB 1,690.00 1,690.00 1,690.00 0.00%Annual fee NB 580.00 580.00 580.00 0.00%Variation NB 760.00 760.00 760.00 0.00%Transfer NB 820.00 820.00 820.00 0.00%Re-instatement NB 820.00 820.00 820.00 0.00%Provisional statement NB 1,690.00 1,690.00 1,690.00 0.00%Provisional statement holders NB 735.00 735.00 735.00 0.00%Copy licence NB 25.00 25.00 25.00 0.00%Notification of change NB 50.00 50.00 50.00 0.00%New application NB 1,690.00 1,690.00 1,690.00 0.00%Annual fee NB 670.00 670.00 670.00 0.00%Variation NB 670.00 670.00 670.00 0.00%Transfer NB 820.00 820.00 820.00 0.00%Re-instatement NB 820.00 820.00 820.00 0.00%Provisional statement NB 1,690.00 1,690.00 1,690.00 0.00%Provisional statement holders NB 890.00 890.00 890.00 0.00%Copy licence NB 25.00 25.00 25.00 0.00%Notification of change NB 25.00 25.00 25.00 0.00%New application NB 200.00 200.00 200.00 0.00%Copy licence NB 25.00 25.00 25.00 0.00%
Tracks Statutory Maximum
Family Entertainment Centres Statutory Maximum
Adult Gaming Centre Statutory Maximum
Temporary Use Notices Statutory Maximum
122

LICENSING FEES
Item Statutory or Discretionary Description/Comments VAT
IndicatorCharge 2010/11
Charge 2011/12
Proposed Charge 2012/13
Increase / Decrease
on 2011/12
£ £ £ %
DISCRETIONARY & STATUTORY FEES 2012/13
Licensed Premises Gaming Machine Statutory Grant NB 150.00 150.00 150.00 0.00%Existing operator grant NB 100.00 100.00 100.00 0.00%Variation NB 100.00 100.00 100.00 0.00%Transfer NB 25.00 25.00 25.00 0.00%Annual Fee NB 50.00 50.00 50.00 0.00%Change of name NB 25.00 25.00 25.00 0.00%Copy of permit NB 15.00 15.00 15.00 0.00%
Licensed Premises Automatic Notification Process
Statutory Maximum Notification NB 50.00 50.00 50.00 0.00%
Grant NB 200.00 200.00 200.00 0.00%Grant (Club Premises Certificate holder) NB 100.00 100.00 100.00 0.00%Existing operator grant NB 100.00 100.00 100.00 0.00%Variation NB 100.00 100.00 100.00 0.00%Renewal NB 200.00 200.00 200.00 0.00%Renewal (Club Premises Certificate holder) NB 100.00 100.00 100.00 0.00%Annual Fee NB 50.00 50.00 50.00 0.00%Copy of permit NB 15.00 15.00 15.00 0.00%Grant NB 200.00 200.00 200.00 0.00%Grant (Club Premises Certificate holder) NB 100.00 100.00 100.00 0.00%Existing operator grant NB 100.00 100.00 100.00 0.00%Variation NB 100.00 100.00 100.00 0.00%Renewal NB 200.00 200.00 200.00 0.00%Renewal (Club Premises Certificate holder) NB 100.00 100.00 100.00 0.00%Annual Fee NB 50.00 50.00 50.00 0.00%Copy of permit NB 15.00 15.00 15.00 0.00%Grant NB 300.00 300.00 300.00 0.00%Renewal NB 300.00 300.00 300.00 0.00%Existing operator grant NB 100.00 100.00 100.00 0.00%Change of name NB 25.00 25.00 25.00 0.00%Copy of permit NB 15.00 15.00 15.00 0.00%Grant NB 300.00 300.00 300.00 0.00%Renewal NB 300.00 300.00 300.00 0.00%Existing operator grant NB 100.00 100.00 100.00 0.00%Change of name NB 25.00 25.00 25.00 0.00%Copy of permit NB 15.00 15.00 15.00 0.00%Annual Fee NB 20.00 20.00 20.00 0.00%
Prize Gaming Permits Statutory Maximum
Club Machine Permits Statutory Maximum
Family Entertainment Centre Gaming Machine Permit
Statutory Maximum
Club Gaming Permits Statutory Maximum
123

LICENSING FEES
Item Statutory or Discretionary Description/Comments VAT
IndicatorCharge 2010/11
Charge 2011/12
Proposed Charge 2012/13
Increase / Decrease
on 2011/12
£ £ £ %
DISCRETIONARY & STATUTORY FEES 2012/13
Hackney Carriage/Private HireFor 1 year NB 49.00 49.00 49.00 0.00%For 3 years NB NA NA 75.00 NA
Vehicle Licence Discretionary New NB 290.00 290.00 290.00 0.00%Renewal NB NA NA 270.00 NA
Additional Hackney Carriage & Private Hire Drivers licence Discretionary NB 16.00 16.00 20.00 25.00%
1-3 Vehicles NB 73.00 73.00 73.00 0.00%4-10 Vehicles NB 310.00 310.00 310.00 0.00%11-20 Vehicles NB 620.00 620.00 620.00 0.00%
Drivers Badge (replacement) Discretionary NB 15.00 15.00 15.00 0.00%Vehicle Plates or Brackets Discretionary NB 17.00 17.00 20.00 17.65%Internal Vehicle Plate Discretionary NB 15.00 15.00 15.00 0.00%Knowledge Test & Re-test Discretionary NB 30.00 30.00 30.00 0.00%Fee for Returned (Bounced) Cheques Discretionary NB 16.00 16.00 16.00 0.00%Transfer of vehicle licence (including plate) Discretionary NB 16.00 25.00 20.00 -20.00%Transfer of vehicle licence (without plate or badge) Discretionary NB 16.00 20.00 20.00 0.00%
Discretionary Category 1-3 to 4-10 NB NA NA 237.00 NADiscretionary Category 4-10 to 11-20 NB NA NA 310.00 NA
Replacement Licence Discretionary NB 16.00 16.00 20.00 25.00%
CRBSet by Home Office NB 36.00 44.00 44.00 0.00%
VAT Indicator:NB = Non Business no VAT
Additional Vehicle under an Operators Licence
Private Hire Operators Discretionary
Hackney Carriage & Private Hire Drivers Licence
Discretionary
124

Parking Charges
Item Description/Comments VAT Indicator
Charge 2010/11
Charge 2011/12
Proposed Charge 2012/13
Increase / Decrease
on 2011/12£ £ £ %
Season Tickets (Ashford)Edinburgh Road Reserved 12 months VT 1,520.00 1,520.00 1,520.00 0.00%Flour Mills Car Park 1 month VT 61.00 68.00 68.00 0.00%Flour Mills Car Park 3 months VT 173.00 191.00 191.00 0.00%Flour Mills Car Park 6 months VT 325.00 360.00 360.00 0.00%Flour Mills Car Park 12 months VT 610.00 675.00 675.00 0.00%Town Centre 1 month VT 76.00 76.00 76.00 0.00%Town Centre 3 Months VT 215.00 215.00 215.00 0.00%Town Centre 6 Months VT 405.00 405.00 405.00 0.00%Town Centre 12 Months VT 760.00 760.00 760.00 0.00%
Season Tickets (Tenterden)Bridewell Lane Car Park 1 month VT 68.00 76.00 76.00 0.00%Bridewell Lane Car Park 3 months VT 191.00 215.00 215.00 0.00%Bridewell Lane Car Park 6 months VT 360.00 405.00 405.00 0.00%Bridewell Lane Car Park 12 months VT 675.00 760.00 760.00 0.00%Bridewell Lane Reserved 12 months VT 1,350.00 1,520.00 1,520.00 0.00%*Season Tickets issued for Bridewell Lane car park are also valid in the rear car park at Tenterden Leisure Centre
Admin Charge for loss of season ticket VT 10.00 10.00 10.00 0.00%Admin Charge for refund of Season ticket VT 10.00 10.00 10.00 0.00%
Residents PermitsZone A Annual EX 100.00 100.00 100.00 0.00%Zone B Annual EX 40.00 40.00 40.00 0.00%Zone D Annual EX 25.00 25.00 25.00 0.00%Zone E Annual EX 25.00 25.00 25.00 0.00%Zone F Annual EX 25.00 25.00 25.00 0.00%Zone G Annual EX 25.00 25.00 25.00 0.00%Admin Charge for loss of permit EX 5.00 5.00 5.00 0.00%
Other PermitsVisitor's permits each EX 1.00 1.00 1.00 0.00%
DISCRETIONARY & STATUTORY FEES 2012/13
125

Parking Charges
Item Description/Comments VAT Indicator
Charge 2010/11
Charge 2011/12
Proposed Charge 2012/13
Increase / Decrease
on 2011/12£ £ £ %
DISCRETIONARY & STATUTORY FEES 2012/13
Staff (decrementing) card per day VT 1.00 1.00 1.00 0.00%Staff permit per month VT 18.00 18.00 18.00 0.00%Admin Charge for loss of card/permit VT 10.00 10.00 10.00 0.00%HPA parking permit annual VT N/A 760.00 760.00 0.00%DSA parking permit annual VT N/A 760.00 760.00 0.00%
Misc ChargesWaivers VT 15.00 15.00 15.00 0.00%Additional Charge for occupying on street pay and display bay, per bay per day
VT 5.00 5.00 5.00 0.00%
Additional Charge for occupying on street pay and display bay, per bay per week
VT 15.00 15.00 15.00 0.00%
Bay Suspensions VT 30.00 30.00 30.00 0.00%Replacement of lost cones per cone VT 10.00 10.00 10.00 0.00%Locked Car park-vehicle release fee VT 55.00 55.00 55.00 0.00%Printing Charges Up to 5 pages per page VT 0.50 0.50 0.50 0.00%Printing Charges more than 5 pages per page VT 0.10 0.10 0.10
Car Park Charges (Ashford)Civic Centre and Stour Centre car park minimum charge up to 2 hours
VT 0.60 0.80 0.80 0.00%
Civic Centre and Stour Centre car park per hour over 2 hours. Linear Charge in 5p increments
VT 0.90 1.00 1.00 0.00%
Civic Centre and Stour Centre car park charge over 4 hours Mon-Fri
VT 10.00 10.00 10.00 0.00%
Civic Centre and Stour Centre car park charge over 4 hours Sat and Sun
VT 4.50 4.50 4.50 0.00%
Civic Centre and Stour Centre car park per hour Coach Charge (Linear Charge in 5p increments)
VT 1.30 1.50 1.50 0.00%
Civic Centre and Stour Centre car park Coach charge over 4 hours
VT 10.00 10.00 10.00 0.00%
Dover Place Car Park per hour VT 0.90 1.00 1.00 0.00%Dover Place Car Park charge over 4 hours VT 4.50 4.50 4.50 0.00%
126

Parking Charges
Item Description/Comments VAT Indicator
Charge 2010/11
Charge 2011/12
Proposed Charge 2012/13
Increase / Decrease
on 2011/12£ £ £ %
DISCRETIONARY & STATUTORY FEES 2012/13
Edinburgh Road Car Park per hour VT 0.90 1.00 1.00 0.00%Edinburgh Road Car Park charge over 4 hours VT 4.50 4.50 4.50 0.00%Flour Mills Car Park per hour VT 0.90 1.00 1.00 0.00%Flour Mills Car Park charge over 4 hours VT 3.60 4.00 4.00 0.00%Henwood Car Park per hour VT 0.90 1.00 0.80 -20.00%
Henwood Car Park charge over 4 hours VT 3.60 4.00 3.20 -20.00%Station Road Ashford Car park per hour VT 0.90 1.00 1.00 0.00%Station Road Ashford Car park charge over 4 hours VT 4.50 4.50 4.50 0.00%Vicarage Lane Car Park per hour VT 0.90 1.00 1.00 0.00%Vicarage Lane Car Park charge over 4 hours VT 10.00 10.00 10.00 0.00%
Car Park Charges (Tenterden)Bridewell Lane Car Park per hour VT 0.80 1.00 1.00 0.00%Bridewell Lane Car Park charge over 4 hours VT 4.00 4.50 4.50 0.00%Recreation Ground Road Car Park per hour VT 0.80 1.00 1.00 0.00%Recreation Ground Road Car Park charge over 4 hours VT 10.00 10.00 10.00 0.00%Station Road Car Park Tenterden per hour VT 0.80 1.00 1.00 0.00%Station Road Car Park Tenterden charge over 4 hours VT 10.00 10.00 10.00 0.00%Station Road Car Park Tenterden per hour Coach charge
VT 1.30 1.50 1.50 0.00%
Station Road Car Park Tenterden charge over 4 hours VT 10.00 10.00 10.00 0.00%Tenterden Leisure Centre Car Park per hour VT 0.80 1.00 1.00 0.00%Tenterden Leisure Centre Car Park charge over 4 hours VT 10.00 10.00 10.00 0.00%
Tenterden Leisure Centre Car Park Coach charge per hour
VT 1.30 1.50 1.50 0.00%
Tenterden Leisure Centre Car Park Coach charge over 4 hours
VT 10.00 10.00 10.00 0.00%
On Street Parking ChargesCharge per hour before 6pm EX 0.90 1.00 1.00 0.00%Charge after 6pm for parking up to 1 hour EX 0.90 1.00 1.00 0.00%
127

Parking Charges
Item Description/Comments VAT Indicator
Charge 2010/11
Charge 2011/12
Proposed Charge 2012/13
Increase / Decrease
on 2011/12£ £ £ %
DISCRETIONARY & STATUTORY FEES 2012/13
Charge after 6pm for parking over one hour EX 2.40 2.70 2.70 0.00%
Penalty Charge NoticesLower level EX 50.00 50.00 50.00 0.00%Higher level EX 70.00 70.00 70.00 0.00%
VAT Indicator:EX = Exempt from VATVT = Inclusive of VAT
Where an actual recharge (based on hours worked) exceeds minimum figures above, the actual charge is to be levied unless commercial in which case an uplift of a minimum of 50% should be considered with Team Leader or Head of Service.
128

Charge for the Supply of Information and Photocopies of Documents
Item Description/Comments VAT Indicator
Charge 2010/11
Charge 2011/12
Proposed Charge 2012/13
Increase / Decrease
on 2011/12
£ £ £ %General Photocopying Per sheet of photocopy (for the first 10 sheets) VT 0.31 0.32 0.34 6.25%
Further Copies VT 0.15 0.16 0.17 6.25%
Fax First Page VT 1.18 1.22 1.29 5.74%
Each page thereafter VT 0.62 0.64 0.68 6.25%Notices and Extracts
VT 6.66 6.89 7.28 5.66%
Architects Plans (A3 & A4) VT 0.31 0.32 0.34 6.25%
Architects Plans (A2+) VT 5.23 5.41 5.72 5.73%
Fact sheets VT 1.44 1.49 1.57 5.37%
All other fact sheets (per page) VT 0.31 0.32 0.34 6.25%
Requests for Planning Information* VT 46.13 47.74 50.46 5.70%
Requests for Building Control Information* VT 46.13 47.74 50.46 5.70%
Inspection of approved Building Regulation Plans* VT 46.13 47.74 50.46 5.70%
Gas and Pipeline Extracts* VT 5.64 5.84 6.17 5.65%
VT 146.58 151.71 160.36 5.70%
Postage and Packing VT 0.31 0.32 0.34 6.25%
*Fee for addition work on information that is freely available on website)
Sale of Documents and Room Hire
Item Description/Comments VAT Indicator
Charge 2010/11
Charge 2011/12
Proposed Charge 2012/13
Increase / Decrease
on 2011/12
£ £ £ %Minutes Council and Committees - per annum VT 150.01 155.26 164.11 5.70%
( excluding the Planning Committee) - per cycle VT 30.34 31.40 33.19 5.70%Cabinet only - per annum VT 99.43 102.91 108.78 5.70%
DISCRETIONARY & STATUTORY FEES 2012/13
Hard Copy Provision of Weekly List
Authenticated Building Control Regulation Approval or Completion Certificate (photocopy - copying charge only)
Major Development Proposals in Ashford (per page)
129

DISCRETIONARY & STATUTORY FEES 2012/13
- per cycle VT 20.35 21.06 22.26 5.70%Planning Committee only - per annum VT 99.43 102.91 108.78 5.70% - per cycle VT 20.35 21.06 22.26 5.70%A single committee and its Sub- Committee - per annum VT 50.43 52.20 55.18 5.71%( excluding the Planning Committee) - per cycle VT 10.46 10.83 11.45 5.72%
Agendas and Reports Council and Committees - per annum VT 268.55 277.95 293.79 5.70%( excluding the Planning Committee) - per cycle VT 54.17 56.07 59.27 5.71%Cabinet only - per annum VT 502.25 519.83 549.46 5.70% - per cycle VT 21.53 22.28 23.55 5.70%
Planning Committee only - per annum VT 502.25 519.83 549.46 5.70% - per cycle VT 21.53 22.28 23.55 5.70%A single committee and its Sub- Committee - per annum VT 54.17 56.07 59.27 5.71%( excluding the Planning Committee) - per cycle VT 11.28 11.67 12.34 5.74%
Retrieval of Minutes & Agendas for third parties - per hour VT 81.18Other Publications Annual Budget Book / Statement of Accounts
- requested by individuals VT 7.28 7.53 7.96 5.71%VT 35.77 37.02 39.13 5.70%
Council Year Book VT 2.92 3.02 3.19 5.63%Copy of Lease, Order etc VT 6.41 6.63 7.01 5.73%Copy of Byelaws - Statutory Fee VT 0.21 0.22 0.23 4.55%
Room Hire Council Chamber - Up to 4 hours VT 137.86 142.69 150.82 5.70% - Full Day VT 242.00 250.47 264.75 5.70% - Evening after 5pm VT 221.91 229.68 242.77 5.70%Committee Rooms - Up to 4 hours VT 72.26 74.79 79.05 5.70% - Full Day VT 129.77 134.31 141.97 5.70% - Evening after 5pm VT 124.90 129.27 136.64 5.70%
VAT Indicator:VT = Inclusive of VAT
- requested by commercial bodies
charge where the Agenda and Reports are in excess of 200 pagesNB Head of Legal and Democratic Services may determine a higher
130

Cemetery Charges
Item Description/Comments VAT Indicator
Charge 2010/11
Charge 2011/12
Proposed Charge 2012/13
Increase / Decrease
on 2011/12£ £ £ %
Cemetery Charges - Bybrook and Willesborough CemeteriesCOMPOSITE BURIAL FEE FOR (1) Single Grave Depth EX 938.00 971.00 1,026.00 5.66%
NEW GRAVES (2) Double Grave Depth EX 1,035.00 1,071.00 1,132.00 5.70%
(Includes Digging Fee, Purchase of (3) Triple Grave Depth EX 1,210.00 1,252.00 1,323.00 5.67%
Right of Burial for 30 years and (4) Child up to and including 16 years
wooden cross) (NB If grave required to be reopened to enable further
family burial(s) the fees in (2) and (3) apply(5) Cremated Remains - Garden of Remembrance Willesborough EX 336.00 348.00 368.00 5.75%
REOPENING OF EXISTING GRAVES/ (1) Single Grave Depth EX 543.00 562.00 594.00 5.69%
OPENING OF PRE-PURCHASED (2) Double Grave Depth EX 446.00 462.00 488.00 5.63%
GRAVES (3) Cremated Remains EX 93.00 96.00 101.00 5.21%
Additional fee for Saturday interments (consideration will be given in special circumstances
Non standard grave sizes may incur an additional charge
NB: A SURCHARGE OF 100% ON THE ABOVE SCALE OF CHARGES IS MADE FOR PERSONSWHO LIVE OUTSIDE ASHFORD BOROUGH. (THIS IS COMMON PRACTICE WITH OTHER AUTHORITIES)
Cemetery Charges - Tenterden CemeteryCOMPOSITE BURIAL FEE FOR (1) Single Grave Depth EX 994.00 1,029.00 1,088.00 5.73%NEW GRAVES (2) Single Grave Depth (plus purchase of right of burial in
adjoining grave) (i.e. single depth charge plus purchase charge) EX 1,420.00 1,470.00 1,554.00 5.71%
(Includes Digging Fee, Purchase of (3) Child up to and including 16 years EX
Right of Burial for 30 years and (4) Cremated Remains - Garden of Remembrance - Small Plot EX 281.00 291.00 308.00 5.84%
DISCRETIONARY & STATUTORY FEES 2012/13
FREE
By negotiation
FREE
131
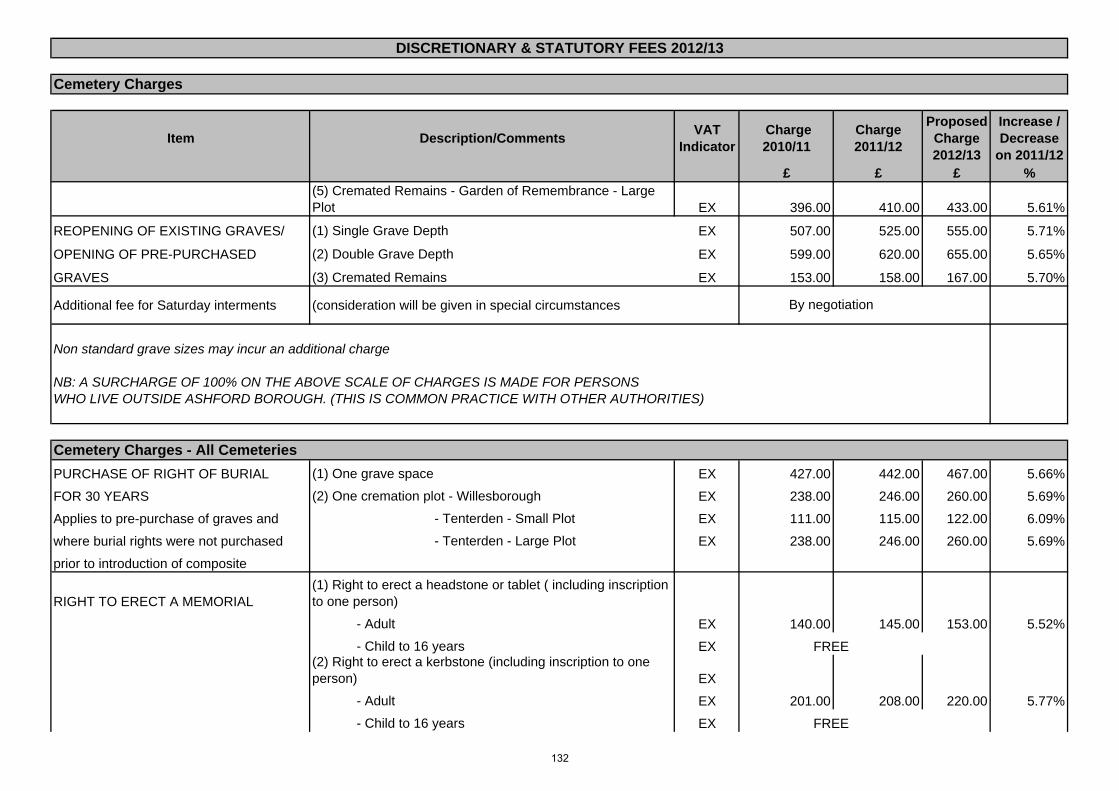
Cemetery Charges
Item Description/Comments VAT Indicator
Charge 2010/11
Charge 2011/12
Proposed Charge 2012/13
Increase / Decrease
on 2011/12£ £ £ %
DISCRETIONARY & STATUTORY FEES 2012/13
(5) Cremated Remains - Garden of Remembrance - Large Plot EX 396.00 410.00 433.00 5.61%
REOPENING OF EXISTING GRAVES/ (1) Single Grave Depth EX 507.00 525.00 555.00 5.71%
OPENING OF PRE-PURCHASED (2) Double Grave Depth EX 599.00 620.00 655.00 5.65%
GRAVES (3) Cremated Remains EX 153.00 158.00 167.00 5.70%
Additional fee for Saturday interments (consideration will be given in special circumstances
Non standard grave sizes may incur an additional charge
NB: A SURCHARGE OF 100% ON THE ABOVE SCALE OF CHARGES IS MADE FOR PERSONSWHO LIVE OUTSIDE ASHFORD BOROUGH. (THIS IS COMMON PRACTICE WITH OTHER AUTHORITIES)
Cemetery Charges - All CemeteriesPURCHASE OF RIGHT OF BURIAL (1) One grave space EX 427.00 442.00 467.00 5.66%
FOR 30 YEARS (2) One cremation plot - Willesborough EX 238.00 246.00 260.00 5.69%
Applies to pre-purchase of graves and - Tenterden - Small Plot EX 111.00 115.00 122.00 6.09%
where burial rights were not purchased - Tenterden - Large Plot EX 238.00 246.00 260.00 5.69%
prior to introduction of composite
RIGHT TO ERECT A MEMORIAL(1) Right to erect a headstone or tablet ( including inscription to one person)
- Adult EX 140.00 145.00 153.00 5.52%
- Child to 16 years EX(2) Right to erect a kerbstone (including inscription to one person) EX
- Adult EX 201.00 208.00 220.00 5.77%
- Child to 16 years EX
By negotiation
FREE
FREE
132

Cemetery Charges
Item Description/Comments VAT Indicator
Charge 2010/11
Charge 2011/12
Proposed Charge 2012/13
Increase / Decrease
on 2011/12£ £ £ %
DISCRETIONARY & STATUTORY FEES 2012/13
(3) Additional inscription (per person after first) EX 46.00 48.00 51.00 6.25%
PURCHASE OF WOODEN CROSS (Ashford Borough Cemeteries only) EX 34.00 35.00 37.00 5.71%
INCLUDING PLAQUE EX
FAMILY MANAGED BURIALS Additional administrative cost of this option EX 139.00 144.00 152.00 5.56%
FAMILY HISTORY SEARCH Per Name EX 21.00 22.00 23.00 4.55%
Over 4 Names EX 67.00 69.00 73.00 5.80%
MAINTENANCE OF GRAVES(1) Maintenance and Planting twice yearly with plants supplied by the Council NB 130.00 135.00 143.00 5.93%
(2) Cleaning of kerbstone (per annum) NB 77.00 80.00 85.00 6.25%
(3) Cleaning of headstone or memorial (per annum) NB 129.00 134.00 142.00 5.97%
WOODLAND BURIALS
BYBROOK CEMETERY Composite Woodland Burial Fee including coffin and tree * - one grave space EX 738.00 764.00 808.00 5.76% - two adjacent grave spaces EX 1,391.00 1,440.00 1,522.00 5.69%Woodland Burial Fee excluding coffin, but including tree EX - one grave EX 604.00 625.00 661.00 5.76% - two adjacent graves EX 1,128.00 1,167.00 1,234.00 5.74%Interment of cremated remains (in grave space) including casket and tree* EX 519.00 537.00 568.00 5.77%Selection of grave space EX 73.00 76.00 80.00 5.26%(* These fees may be prepaid)
TENTERDEN CEMETERY Composite Woodland Burial Fee including coffin and tree * - one grave space EX 793.00 821.00 868.00 5.72% - two adjacent grave spaces EX 1,445.00 1,496.00 1,581.00 5.68%Woodland Burial Fee excluding coffin, but including tree EX
NB A SURCHARGE OF 100% ON THE ABOVE SCALE OF CHARGES IS MADE FOR PERSONS WHO LIVE OUTSIDE ASHFORD BOROUGH
133

Cemetery Charges
Item Description/Comments VAT Indicator
Charge 2010/11
Charge 2011/12
Proposed Charge 2012/13
Increase / Decrease
on 2011/12£ £ £ %
DISCRETIONARY & STATUTORY FEES 2012/13
- one grave EX 658.00 681.00 720.00 5.73% - two adjacent graves EX 1,185.00 1,226.00 1,296.00 5.71%Interment of cremated remains (in grave space) including casket and tree* EX 579.00 599.00 633.00 5.68%Selection of grave space EX 73.00 76.00 80.00 5.26%(* These fees may be prepaid)
ALL CEMETERIES Further interment of cremated remains including casket - Ashford EX 108.00 112.00 118.00 5.36% - Tenterden EX 163.00 169.00 179.00 5.92%
Interment of a child to 16 years (NOT including coffin or tree) EXGrave reservation EX 146.00 151.00 160.00 5.96%Selection of grave space EX 73.00 76.00 80.00 5.26%
MEMORIAL BENCH WITH EX 533.00 552.00 583.00 5.62%DEDICATION INSCRIPTION(Subject to space being available)
VAT Indicator:NB = Non Business no VATEX = Exempt from VAT
FREE
NB: A SURCHARGE OF 100% ON THE ABOVE SCALE OF CHARGES IS MADE FOR PERSONS WHO LIVE OUTSIDE ASHFORD BOROUGH
134

Planning Services
Item VAT Indicator
Charge 2010/11
Charge 2011/12
Proposed Charge 2012/13
Increase / Decrease
on 2011/12
£ £ £ %
Pre-Application Advice VT 67.00 67.00
VT 133.00 133.00
per hour or part thereof VT 335.00 335.00
Amendments to Planning Permissions
Statutory Fee NB 67.00 67.00 67.00 0.00%
Per submission for all mayor applicationsStatutory
Fee NB 133.00 133.00 133.00 0.00%
Statutory Fee
Compliance Check For domestic Development VT 67.00 69.00 73.00 5.80%( Confirmation that a development has been built in accordance with the approved plans For a Domestic proposal that requires a site visit VT 133.00 138.00 146.00 5.80%
Research of Planning History VT 34.00 35.00 37.00 5.71%
(Copies of Decision Notices are charged extra)Formal Complaint under High Hedges Legalisation
VT 400.00 400.00 400.00 0.00%
VAT Indicator:NB = Non Business no VAT
VT = Inclusive of VAT
Awaiting Government Guidance
DISCRETIONARY & STATUTORY FEES 2012/13
EX = Exempt from VAT
Description/Comments
Per Submission for all minor and other applications
Payment will be refunded if the amendments are considered too significant and a fresh application is required
To confirm whether or not permitted development rights have been removed from a dwelling
Level 1 will be charged for written advice on all proposals that will require consent from the Local Planning Authority under the Planning Acts, other than those listed above and in levels 2 and 3
Level 2 will be charged for written advice on all minor developments
Level 3 will be charged for meetings with officers (If the meeting is on site then travelling time will be included in the assessment)
135

SPORTING CHARGES
Item Description/Comments VAT Indicator
Charge 2010/11
Charge 2011/12
Proposed Charge 2012/13
Increase / Decrease on
2011/12£ £ £ %
SPORTING HIRE CHARGESFootball Grass Pitch at Spearpoint/Pitchside Adult Per season VT 415.00 420.00 430.00 2.38%Football Grass Pitch at Spearpoint/Pitchside Junior Per season VT 194.00 224.00 230.00 2.68%Football pitch at Hythe Road Per season VT 221.00 229.00 242.00 5.68%3G Pitchside Seasonal Full Pitch Hire Adult Per season VT 560.00 592.00 5.71%3G Pitchside Seasonal Full Pitch Hire Junior Per season VT 392.00 400.00 2.04%3G Pitchside Season Mini Soccer Pitch Hire Jun Per season VT 224.00 230.00 2.68%3G Pitchside Training Full Pitch Junior Clubs (W) Per Hour VT 70.00 75.00 7.14%3G Pitchside Training Full Pitch Junior Clubs (S) Per Hour VT 55.00 55.00 0.00%3G Pitchside Training Full Pitch Adult & Com (W) Per Hour VT 90.00 95.00 5.56%3G Pitchside Training Full Pitch Adult & Com (S) Per Hour VT 55.00 55.00 0.00%3G Pitchside Training Half Pitch Junior Clubs (W) Per Hour VT 55.00 58.00 5.45%3G Pitchside Training Half Pitch Junior Clubs (S) Per Hour VT 35.00 35.00 0.00%3G Pitchside Training Half Pitch Adult & Com (W) Per Hour VT 60.00 63.00 5.00%3G Pitchside Training Half Pitch Adult & Com (S) Per Hour VT 45.00 45.00 0.00%3G Pitchside Training Third Pitch Junior Clubs (W) Per Hour VT 30.00 32.00 6.67%3G Pitchside Training Third Pitch Junior Clubs (S) Per Hour VT 25.00 25.00 0.00%3G Pitchside Training Third Pitch Adult & Com (W) Per Hour VT 37.50 40.00 6.67%3G Pitchside Training Third Pitch Adult & Com (S) Per Hour VT 30.00 30.00 0.00%All Training rates quoted are for casual use. Affiliated and constituted clubs making block bookings of minimum 10 weeks reduced by £5 per hireW = Winter - Sept 1 to Mar 31 S = Summer - Apr 1 to Aug 31
Football Pitch Hire Sandyacres At discretion of Ernie Warren (Leaseholder)Courtside Large hard court Per Hour VT 30.00 31.00 30.00 -3.23%Courtside Small hard court Per Hour VT 15.00Courtside Netball show courts Per Hour VT 28.00 29.00 20.00 -31.03%Courtside All courts Per Hour VT 83.00 86.00 65.00 -24.42%Courtside contract court hire tennis Per Hour VT 6.00 6.25 6.50 4.00%Courtside casual court hire tennis Per Hour VT 6.00 6.50 7.00 7.69%Courtside casual court hire netball Per Hour VT 17.00 18.00 15.00 -16.67%Meeting Room hire Per Hour VT 17.00 18.00 18.00 0.00%Meeting Room and kitchen hire Per Hour VT 25.00Table tennis Per Hour VT 4.00 4.50 5.00 11.11%All price changes effective September 1st 2012 subject to approval.
DISCRETIONARY & STATUTORY FEES 2012/13
136

SPORTING CHARGES
Item Description/Comments VAT Indicator
Charge 2010/11
Charge 2011/12
Proposed Charge 2012/13
Increase / Decrease on
2011/12£ £ £ %
DISCRETIONARY & STATUTORY FEES 2012/13
SPORTING ACTIVITY CHARGESBrazilian Soccer School:School Breakfast Club Per Term EX 18.00 18.00 18.00 0%After School Club Per Term EX 35.00 36.00 38.00 6%Evening/Saturday sessions Per 6 week Term EX 50.00 30.00 30.00 0%Evening/Saturday sessions Half Term EX 30.00 31.00 33.00 6%Membership One off to include kit EX 40.00 40.00 0%Socatots:Sessions Per 6 week Term EX 50.00 30.00 30.00 0%Membership One off to include kit & skills booklets EX 33.00 35.00 35.00 0%Courtside:BSS Holiday courses Per 3 hour course EX 3.00 5.00
All price changes effective September 1st 2012 subject to approval.
VAT Indicator:NB = Non Business no VATEX = Exempt from VATVT = Inclusive of VAT
137

Monitoring Centre
Item Description/Comments VAT Indicator
Charge 2010/11 Charge 2011/12
Proposed Charge 2012/13
Increase / Decrease on
2011/12£ £ £ %
Telecare/LifelineTelecare Lifeline Installation One Off Payment per client VT 26.00 27.00 28.50 5.56%Telecare Lifeline Installation (Equipment postal service) One Off Payment per client VT 15.00 16.00 16.90 5.62%
} Monthly Fee per client VT 11.00} Annual Fee per client VT 133.00 137.60 137.60 0.00%
Telecare Lifeline Monitoring and Equipment Hire including TES - new customers Annual Fee per client
VT142.95 147.95 147.95 0.00%
Telecare Monitoring Fee only - for purchased equipment - from 01/04/11 Annual
VT78.00 82.40 5.64%
Supply of Second Pendant sensor One off payment per client VT 57.00 59.00 62.40 5.76%Supply of Key safe One Off Payment per client VT 42.00Supply of Key safe - new style One Off Payment per client VT 62.94 66.50 5.66%Supply of Key release Door Chain One off Payment per client VT 20.00Supply of Key release Door Chain - new style One Off Payment per client VT 24.58 26.00 5.78%Purchase Unit Equipment Maintenance Annual (Year 2 onwards) VT 25.00 26.40 5.60%Telecare/Lifeline Equipment Replacement of Equipment due to Damage/Non Return VT 165.00 171.00 180.70 5.67%Lone worker (external only)Lone worker Registration Fee One off Payment per client VT 13.00 14.00 14.80 5.71%Lone worker Monitoring Monthly Fee per client VT 10.00 10.50 11.10 5.71%Optyma Intruder Alarms 0.00Guardian Staff Safety Monthly Fee VT 59.00 61.00 64.50 5.74%Optyma Social Alarms Monthly Monitoring Fee per Client VT 1.00 1.00 1.10 10.00%
VAT Indicator:NB = Non Business no VATEX = Exempt from VATVT = Exclusive of VAT
Telecare Lifeline Monitoring and Equipment Hire - existing
DISCRETIONARY & STATUTORY FEES 2012/13
138
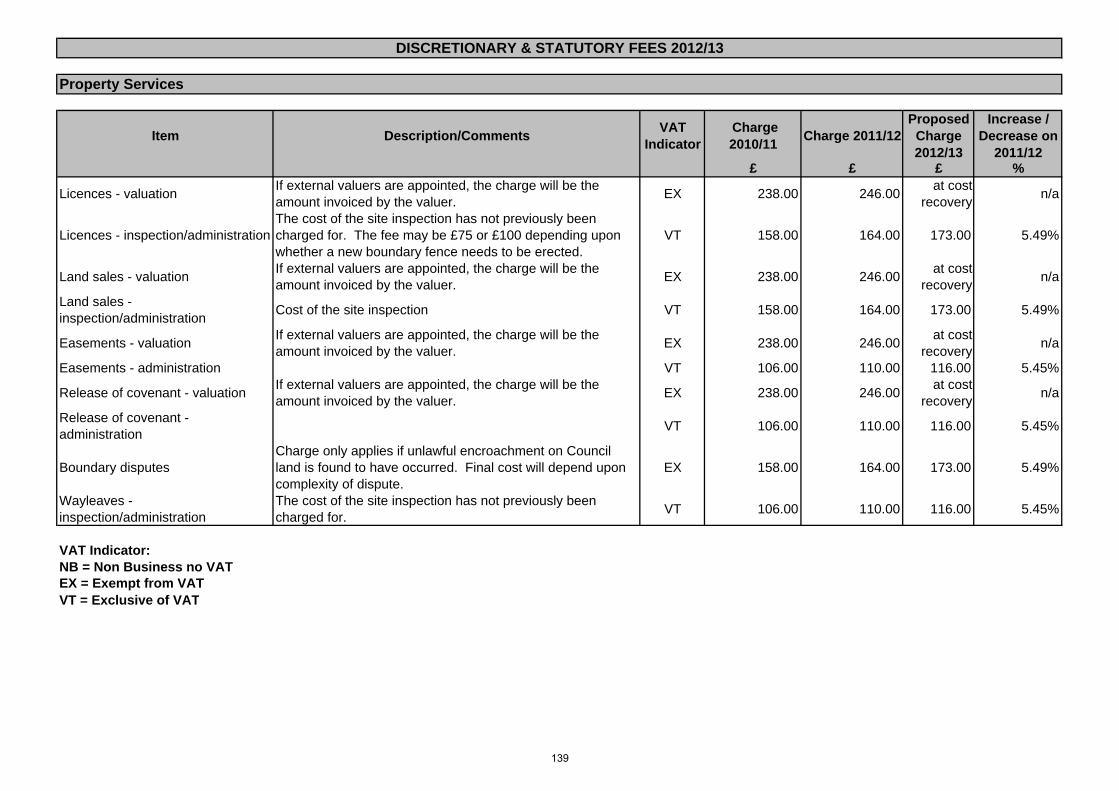
Property Services
Item Description/Comments VAT Indicator
Charge 2010/11 Charge 2011/12
Proposed Charge 2012/13
Increase / Decrease on
2011/12£ £ £ %
Licences - valuation If external valuers are appointed, the charge will be the amount invoiced by the valuer. EX 238.00 246.00 at cost
recovery n/a
Licences - inspection/administrationThe cost of the site inspection has not previously been charged for. The fee may be £75 or £100 depending upon whether a new boundary fence needs to be erected.
VT 158.00 164.00 173.00 5.49%
Land sales - valuation If external valuers are appointed, the charge will be the amount invoiced by the valuer. EX 238.00 246.00 at cost
recovery n/a
Land sales - inspection/administration Cost of the site inspection VT 158.00 164.00 173.00 5.49%
Easements - valuation If external valuers are appointed, the charge will be the amount invoiced by the valuer. EX 238.00 246.00 at cost
recovery n/a
Easements - administration VT 106.00 110.00 116.00 5.45%
Release of covenant - valuation If external valuers are appointed, the charge will be the amount invoiced by the valuer. EX 238.00 246.00 at cost
recovery n/a
Release of covenant - administration VT 106.00 110.00 116.00 5.45%
Boundary disputes Charge only applies if unlawful encroachment on Council land is found to have occurred. Final cost will depend upon complexity of dispute.
EX 158.00 164.00 173.00 5.49%
Wayleaves - inspection/administration
The cost of the site inspection has not previously been charged for. VT 106.00 110.00 116.00 5.45%
VAT Indicator:NB = Non Business no VATEX = Exempt from VATVT = Exclusive of VAT
DISCRETIONARY & STATUTORY FEES 2012/13
139

Legal Fees
Item Description/Comments VAT Indicator
Charge 2010/11
Charge 2011/12
Proposed Charge 2012/13
Increase / Decrease on
2011/12£ £ £ %
S9 Agreements (including caution/note on Register) NB 250.00 260.00 275.00 5.77%S9 Transfers Plus Land Registry Fees NB 210.00 220.00 275.00 25.00%S106 agreements NB 326.00 750.00 800.00 6.67%Grazing Licences NB 82.00 85.00 100.00 17.65%Licences to Assign NB 164.00 170.00 180.00 5.88%Sales or Easements Up to £2,500 in value NB 218.00 250.00 265.00 6.00%Sales or Easements over £2,500 in value - Basic Fee of £300.00 plus 1% of sale price NB 272.00 285.00 300.00 5.26%Ellingham Leases NB 272.00 285.00 300.00 5.26%Ellingham lease renewals 195.00 200.00 2.56%Surrenders NB 164.00 170.00 180.00 5.88%Landlord consent etc NB 55.00 60.00 75.00 25.00%Transfer of Equity (mortgage) NB 175.00 185.00 195.00 5.41%Redemptions NB 55.00 95.00 100.00 5.26%Mortgagees Enquiries NB 71.00 75.00 85.00 13.33%Release of expired Statutory Charge NB 82.00 85.00 90.00 5.88%Waiver (Improvement Grant) NB 82.00 85.00 90.00 5.88%Notice of Charge NB 50.00 52.00 55.00 5.77%Counterpart Lease NB 44.00 46.00 55.00 19.57%Engross Transfer/conveyance NB 28.00 30.00 45.00 50.00%Notice to Assign NB 50.00 52.00 55.00 5.77%Wayleaves NB 130.00 135.00 145.00 7.41%The above represent a minimum level of charge, not a fixed level of charge.
Electoral ServicesConfirmation of Registration letters Letters required due to the credit reference agencies not updating their information VT 10.00 10.00 10.00 0.00%Postal votes pack Postal votes pack (Charge to Parish Councils for by-elections) VT 1.00 1.00 1.05 5.00%Poll Cards Poll card (Charge to Parish Councils for by-elections) VT 0.40 0.40 0.41 2.50%
Statutory Charges (restricted availability for full register and Overseas lists)Sales of full and edited register Data £20 plus £1.50 per 1,000 entries or part of 1,000 NB 21.50Sales of full and edited register Printed £10 plus £5 per 1,000 or part of 1,000 NB 15.00Overseas electors List Data £20 plus £1.50 per 100 entries or part of 100 NB 21.50Overseas electors List Printed £10 plus £1.50 per 100 or part of 100 NB 11.50
VAT Indicator:NB = Non Business no VATEX = Exempt from VATVT = Inclusive of VAT
Where the value of the time worked on a matter exceeds the proposed charge stated above, the value of the time will be charged unless it is deemed by the Head of Legal Services to not be commercial or reasonable to charge the full cost.
DISCRETIONARY & STATUTORY FEES 2012/13
140

Other Charges
Item Description/Comments VAT Indicator
Charge 2010/11
Charge 2011/12
Proposed Charge 2012/13
Increase / Decrease on
2011/12£ £ £ %
Land ChargesStandard Search Fee Domestic Properties NB
Non-Domestic Properties NB
Extra Questions NB
All Land Charges Fees are to be set at on full cost recovery Basis - these need to be reviewed periodically throughout the year to ensure that this is achieved.
Street AdministrationStreet Naming and numbering 1 Unit (£45) NB 37.95 40.00 45.00 12.50%
2-10 units (£38 per unit) NB 38.00 38.00 0.00%Over 10 units (£34 per unit) NB 34.00 34.00 0.00%
New Street Name NB 100.00 106.00 6.00%
Rename Existing Street NB 150.00 159.00 6.00%
Address Change per property NB 59.95 62.00 66.00 6.45%Building Control
Discretionary Works Including Party Wall surveying, Fire Risk assessments, Access audits, SBEM, SAP ratings and other surveying activities
VT
Exempt Letters VT 32.75 34.00 36.00 5.88%Waste CollectionBulk Collection Base Charge VT 21.00 22.54 22.54 0.00%
Rent Charge per week NB 37.86 39.52 41.93 6.10%
Service Charge Charge per week NB 15.75 16.49 17.41 5.60%Allotment RentsRent EX 4.00 4.00 4.20 5.00%Council Tax CollectionCourt costs Summons costs NB 30.00 60.00 60.00 0.00%
Liability orders NB 90.00 60.00 60.00 0.00%
Chilmington Road Travellers Site
At cost recovery
DISCRETIONARY & STATUTORY FEES 2012/13
At Cost Recovery
New Fee
141

Other Charges
Item Description/Comments VAT Indicator
Charge 2010/11
Charge 2011/12
Proposed Charge 2012/13
Increase / Decrease on
2011/12£ £ £ %
DISCRETIONARY & STATUTORY FEES 2012/13
Business RatesCourt costs Summons costs NB 0.00 0.00 0.00 0.00%
Liability orders NB 175.00 175.00 175.00 0.00%HomelessnessCopy of File VT 11.05 12.00 12.70 5.83%Private Sector Housing
Charge for service of enforcement notices Housing Act 2004
Incorporating improvement notices, prohibition orders, emergency remedial action, emergency prohibition orders, demolition orders
NB 300.00 per notice n/a
Charge to carry out inspections in respect of a UK entry application NB 80.00 n/a
Tourist Information ServiceTicket Sales - Charitable Organisations Pet ticket VAT charged on commission VT 5% 5% + VAT 10% 100.00%
Ticket Sales - Commercial Pet ticket VAT charged on commission VT 10% 10% 10% 0.00%Ticket Sales - Revelations St. Mary's Per Ticket 10% charge of face value to customers VT n/a 10% 10% 0.00%
Accommodation Booking Fees 10% 1st night serviced accommodation (absorbed by accommodation provider) VT 10% 1st
Night10% 1st
Night10% 1st
Night 0.00%
Accommodation Booking Fees 5% self catering (absorbed by accommodation provider) VT 5% of stay 5% of stay 5% of stay 0.00%Accommodation Booking Fees Set fee paid by customer VT 3.50 3.50 3.50 0.00%Ticket Sales - Leas Cliff Hall Per ticket (no commission paid by organisations) VT 1.00 1.00 1.25 25.00%Credit Card Payments Charge per booking on Agency Sales VT 0.00 1.50 1.50 0.00%
VAT Indicator:NB = Non Business no VAT EX = Exempt from VATVT = Exclusive of VAT
142


