coPz · coPz N GALVANIC CORROSION OF ALUMINUM-MATRIX COMPOSITES.; : ... Proton reduction played a...
33
coPz N GALVANIC CORROSION OF ALUMINUM-MATRIX COMPOSITES .; :-.-. . , I. by L.H. Hihara and R.M. Latanision Technical Report No. 2 to Office of Naval Research Grant No. N00014-89-J-1588 Reproduction in whole or in part is permitted for any purpose of the United States Government The H.H. Uhlig Corrosion Laboratory Department of Materials Science and Engineering Massachusetts Institute of Technology Cambridge, Massachusetts 02139 February 1991 91 2 12 081
Transcript of coPz · coPz N GALVANIC CORROSION OF ALUMINUM-MATRIX COMPOSITES.; : ... Proton reduction played a...

coPz
N
GALVANIC CORROSION OF
ALUMINUM-MATRIX COMPOSITES
.; :-.-. . ,
I. by
L.H. Hihara and R.M. Latanision
Technical Report No. 2
to
Office of Naval Research
Grant No. N00014-89-J-1588
Reproduction in whole or in part is
permitted for any purpose of the
United States Government
The H.H. Uhlig Corrosion LaboratoryDepartment of Materials Science and Engineering
Massachusetts Institute of TechnologyCambridge, Massachusetts 02139
February 1991
91 2 12 081

SECURITY CLASSIFtCATION OF THIS PAGE
Form ApprovedREPORT DOCUMENTATION PAGE 0M No 0.704-0188
9 la REPORT SECURITY CLASSIFICATION lb RESTRICTIVE MARKINGS
Unclassified2a SECURITY CLASSIFICATION AUTHORITY 3 DiSTRIBUTIONIAVAILABILITY OF REPORT
2b DECLASSIFICATION / DOWNGRADING SCHEDULE
4 PERFORMING ORGANIZATION REPORT NUMPrR(S) 5 MONITORING ORGANIZATION REPORT N.UMBER(S)
6a NAME OF PE'RFORMING ORGANIZATION 6b OFFICE ,'MBOL 7a NAME OF MONITORING ORGANIZATION
Massachusetts Institute of (if applicable) Office of Naval ResearchTechnology IOfficeofNavalResearch
6c ADDRESS (City, State, and ZIP Code) 7b ADDRESS(City, State, and ZIP Code)
Room 8-202, 77 Massachusetts Avenue 800 N. Quincy StreetCambridge, MA 02139 Arlington, VA 22217-5000
8a NAME OF FUNDING SPONSORING 8b OFFICE SYMBOL 9 PROCUREMEN7 INSTRUMENT IDFNT!FICATION NUMBERORGANIZATION (If applicable)
Office of Naval Research8c. ADDRESS (City, State, and ZIP Code) 10 SOUR(c OF FUNDING NUMBERS
PROGRAM PROJECT TASK vWORK UNITArlington VA 22217-5000 ELEMENT NO NO NO ACCESSION NOA 89-J-1588 Ior5523-02
11 TITLE (Include Security Classification)
Galvanic Corrosion of Aluminum-Matrix Composites
12 PERSONAL AUTHOR(S)L.H. Hihara and R.M. Latanision
13a TYPE OF REPORT 13b TIME COVERED 14 DATE OF REPORT (Year, Month, Day) 15 PAGE COUNTTechnical Report FROM 1 Mar90 To31De_90 February 1991 33
16 SUPPLEMENTARY NOTATION
17 COSATI CODES 18 SUBJECT TERMS (Continue on reverse if necessary and identify by block number)
FIELD GROUP SUB-GROUP Corrosion, Aluminum-Matrix Composites
19 ABSTRACT (Continue on reverse if hecessary and identify by block number)
Galvanic-corrosiotu rates of Al-matrix composites were high in aeratedchloride-containing solutions. Oxygen reduction was found to be the primary cathodicreaction. Aluminum corroded by pitting. The type of noble constituent (i.e.,graphite, SiC, or TiB ) also affected galvanic-corrosion rates. For example, resultsindicated that the galvanic-corrosion rate of Al should be about 30 times greaterwhen coupled to graphite than when coupled to SiC or TiB In dearated solutions,galvanic corrosion was negligible even if chlorides were present. Thegalvanic-corrosion rates were determined using the zero-resistance ammeter techniqueand from potentiodynamic polarization diagrams of ultrapure Al, 6061-T6 Al, graphitefiber, SiC, TiB 2, and a commercial graphite fiber/6061-T6 Al metal-matrix composite.
20 DISrRIBUTION/AVAILABQITY OF ABSTRACT 21 ABSTRACT SECURITY CI 4rSSCATIONJ
(AUNCLASSIFIED/UNLIMiTED El SAME AS RPT E] DTIC USERS Unrestricted2a NAME OF RESPONSIBLE INDIVIDUAL 22b TELEPHONE (Include Area Code) 22L OFIEI( 1YM30'* .J. Sedriks (202) 696-4401 1131 M
DD Form 1473, JUN 86 Previous editions are obsolete _ CUP! TY ..
S/N 0102-LF-014-6603

Galvanic Corrosion of Aluminum-Matrix Composites
L.H. Hihara' and RM. Latanision 2
'Department of Mechanical Engineering
University of Hawaii at Manoa
Honolulu, Hawaii 96822
2 The H.H. Uhlig Corrosion Laboratory
Department of Materials Science and Engineering
Massachusetts Institute of Technology
Cambridge, MA 02139
Abstract
Galvanic-corrosion rates of Al-matrix composites were
high in aerated chloride-containing solutions. Oxygen reduction
was found to be the primary cathodic reaction. Aluminum
corroded by pitting. The type of noble constituent (i.e.,graphite, SiC, or TiB 2) also affected galvanic-corrosion rates. For
example, results indicated that the galvanic-corrosion rate of Al
should be about 30 times greater when coupled to graphite thanwhen coupled to SiC or TiB 2. In deaerated solutions, galvanic
corrosion was negligible even if chlorides were present. The
galvanic-corrosion rates were determined using the zero-
resistance ammeter technique and from potentiodynamicpolarization diagrams of ultrapure Al. 606 1l-T6 Al, graphite fiber,SiC, TIB 2 , and a commercial graphite fiber/6061-T6 Al metal-
matrix composite.
Introduction - '
Galvanic corrosion is a concern in Al-matrix composites ................
because Al, which is an active metal, is coupled to noble
Statement"A" per telecon Dr.JohntSedriks. ONR/Code 1131M.
VHG 2/20/91____

reinforcement constituents such as graphite and SIC. Thedifference between the reversible potentials E~w (at 250C, unitactivities, except pH set to 7) of 02 + 4H + 4e = 2H 20 (ERv =
0.82 Vs) and A13 + 3e' = Al (ER-v = -1.66 VsH) is 2.48 V. andthat between 2H + 2e- = H 2 (Emv = -0.41 Vi,) and A13+ + 3e =Al is 1.25 V 1. Therefore, a galvanic couple will form between Aland the reinforcement constituents, which are inert electrodesupon which 02 and H reduction may occur. Accordingly, someauthors speculate that galvanic corrosion is responsible for thehigher corrosion rates observed in graphite fiber/aluminum(G/AI) and SiC/Al metal-matrix composites (MMCs) incomparison to their monolithic matrix alloys 2 - 8. The galvanic-corrosion rate, however, cannot be obtained from thethermodynamic data. Therefore, kinetic studies wereperformed in this investigation to obtain information on thegalvanic-corrosion rates of G/A and SiC/Al MMCs.
The effect of 02 reduction, H reduction, and Al passivity
on galvanic-corrosion rates in chloride-free and chloride-containing solutions was investigated. Experiments wereperformed in neutral, deaerated and aerated 0.5 M Na 2SO4 and3.15 wt% NaCl solutions at 300C. Polarization diagrams weregenerated for ultrapure Al of 99.999% metallic purity (m5N Al),606 1-T6 Al, high-modulus graphite (P 100 G) fiber, SiC, TiB 2,and a commercial G/6061-T6 Al MMC. TiB 2 was included inthis study because it Is sometimes used as a fiber coating toenhance the wettability of graphite fibers in molten Al alloys.Galvanic-corrosion rates were estimated from the polarizationdiagrams using the mixed-electrode theory. In addition, thezero-resistance ammeter (ZRA) technique was used to measuregalvanic-corrosion rates of couples consisting of P100 G fiberand 6061-T6 Al.
2

Galvanic corrosion was severe in aerated 3.15 wt% NaCI.Oxygen reduction on the surface of reinforcement constituentsaccelerated pitting of the Al matrix. The corrosion rate of6061-T6 Al increased by about 80 times when coupled toP100 G fiber of equal area. The type of reinforcementconstituent also affected the galvanic-corrosion rate. It wasestimated that the galvanic-corrosion rate of m5N Al and606 1-T6 Al would be about 30 times greater when coupled toP100 G than when coupled to SiC or TIB 2. In deaerated
3.15 wt% NaCl, galvanic corrosion was negligible. Protonreduction played a minimal role in galvanic corrosion.
Materialsm5N Al and 6061-T6 Al Electrodes:
Planar m5N Al and 6061-T6 Al electrodes were fabricatedby coating specimens with either an epoxy paint (AMERCOAT 90
RESIN, Ameron) or an epoxy adhesive (EPOXY-PATCH, The DexterCorporation). Following the coating procedure, one side of thespecimens was ground flat- This removed the epoxy from onesurface and exposed a planar electrode face. Electrodes were
fabricated with either a 0.0233 cm 2 or a 0.811 cm 2 surface area.Both types of electrodes were used in potentiodynamic
polarization experiments. The 0.0233 cm 2 electrode was alsoused in galvanic-couple experiments, in which the 606 1-T6 Alelectrode was coupled to a P100 G electrode of equal surfacearea. The 0.0233 cm 2 size was governed by the size of thegraphite electrode (discussed below).
Graphite Electrodes:
Planar graphite electrodes were fabricated from ThornelP100 fibers, which are unidirectional, continuous, about 10 pnIn diameter, and pitch-based with an elastic modulus equal to
3

690 GPa. Fifteen tows of the fiber (about 2000 fibers/tow) werealigned unidirectionally and infiltrated with an epoxy resin (EPON
828 RESIN, Miller-Stephenson Chemical Co., Inc.). The resultingproduct. a graphite/epoxy composite rod, was made into
electrodes by sectioning the rod perpendicular to the axis of thefibers. The total cross-sectional surface area of the graphitefibers was about 0.0233 cm2 .
SIC and TIB 2 Electrodes:
Planar electrodes were fabricated from bars of SIC andTIB 2 that were purchased from Ceradyne, Inc. The SIC and TiB2
were hot-pressed to near theoretical densities (>98%) without
sintering aids or binders. The sides of the specimens werecoated with EPOXY-PATCH. A planar electrode face was exposedby grinding the epoxy from one surface.
Special precautions were taken to make the SiC electrodesdue to the high electrical resistivity of SIC. The SIC bars werefirst cut into 9 x 9 mm-square wafers about 1 mm thick. Then,
to make electrodes, the entire back side of the SiC wafers was
silver painted to make electricai contact. This procedure wasfollowed to ensure that the IR drop through the SIC wafer wasuniform over the electrode fce during polarization experiments.Note that the polarization diagrams in this document have been
corrected for the IR drop. The resistance through thethickness of the SIC wafers was about 103 ohm.
G/6061-T6 Al MMC Electrodes:
G/6061 Al MMC precursor wires were produced byMaterial Concept, Inc. The wires consisted of a tow of ThornelP100 graphite fibers infiltrated with 6061 Al to a volume
fraction of about 0.5. Six-ply plates were consolidated by DWAComposite Specialties, Inc. by diffusion bonding six layers of
4

precursor wires between surface 6061 Al foils. The G/6061 AlMMCs were heat treated to the T6 condition by solution-treatingat 5300C for 50 min, water quenching, and artificially aging at1600C for 18 h.
Planar electrodes were made from G/6061-T6 Al MMCsix-ply plates. The surface foils of the six-ply plate were groundaway prior to making electrodes. The specimens were coatedwith AMERCOAT 90 RESIN and then mounted in EPON 828 RESIN.
Following the coating procedure, a planar electrode face wasexposed by grinding away the epoxy from one surface. Thegraphite fibers were oriented perpendicular to the electrode
face.
Aqueous Solutions:Neutral 0.5 M Na 2SO4 and 3.15 wt% NaCl solutions were
prepared from 18 x 106 ohm-cm water, and analytical gradeNa 2SO4 (< 0.0002% Cl) and NaCl, respectively. The solutionswere kept at 30 ± 0. 1°C, and deaerated with pre-purifiedhydrogen or aerated with 19.5 to 23.5 % oxygen balanced withnitrogen. Gas pressure was 1 atm.
Instrumentation and ProcedureThe surface of all planar electrodes was polished to a
0.05 jrm finish with gamma alumina powder, kept wet, andrinsed with 18 x 106 ohm-cm water about 5 minutes prior toimmersion in the aqueous solutions.
Potentiodynamic Polarization Experiments:Potentiodynamic polarization experiments were conducted
with either a Model 273 EG&G Princeton Applied Research(PAR) potentiostat/galvanostat or a Model 173 EG&G PARpotentlostat/galvanostat equipped with a Model 376 EG&G PAR
5

logarithmic current converter. When measuring currents in the
nA range, the accuracy of the instruments were measured to bebetter than 10%.
In generating potentiodynamic polarization diagrams, the
electrodes were allowed to stabilize at their corrosion potential
EcoR before subsequently polarizing at a rate of 0.1 mV/s. Three
or more polarization curves were generated for each
experimental condition. The logarithm of the current density
(CD) was averaged and plotted as a function of potential to
generate the polarization diagrams In this document. The
standard deviation of log I was also calculated. Standard-
deviation bars of log I. however, were omitted from polarization
diagrams for clarity because numerous diagrams were plotted in
the same figure. Consequently, the reader may refer to Hihara 9to view individually plotted polarization diagrams containing the
standard-deviation bars.
ZRA Experiments:
The galvanic current IGALv and galvanic potential EGALv were
measured with a self-built ZRA and electrometer. Field-effect
transistor (FET1 operational amplifiers with high input
impedance (1015 ohm) and low offset voltage (< 0.5 mV) (OPA104 CM, Burr-Brown), and high-precision resistors (103 to 109
ohm, tolerance better than 2%) were used to build the ZRA.
The electrometer was built with the OPA 104 CM operational
amplifier. The circuitry can be obtained from Hlhara .
Saturated Calomel or saturated mercury-mercurous sulfate
reference electrodes were used to measure EcAv. To preventchloride contamination in 0.5 M Na 2SO4 during lengthy
experiments, the mercury-mercurous sulfate electrode was used
instead of the Calomel electrode. Values of lLAv and EGALV were
6

measured from galvanic couples consisting of P100 G fibers and606 1-T6 Al of equal surface areas.
ResultsTo identify galvanic couples using the mixed-electrode
theory, collections of cathodic polarization diagrams of P100 G.SiC, and TiB2 were plotted with anodic polarization diagrams ofm5N Al and 6061-T6 Al in Figure 1 (for deaerated0.5 M Na 2SO4), Figure 2 (for aerated 0.5 M Na 2SO4), Figure 3(for deaerated 3.15 wt% NaCl). and Figure 4 (for aerated3.15 wt% NaCl). Compared in Figure 5 are the anodicpolarization diagrams of the 0.0233 cm 2 and the 0.811 cm 2
6061-T6 Al electrodes exposed to 0.5 M Na 2SO4 .
The galvanic-corrosion rate IGAL, (Figure 6) and potentialEGALv (Figure 7) were monitored over 100-h periods for couplesconsisting of equal areas of P100 G fiber and 6061-T6 Alexposed to deaerated and aerated 0.5 M Na 2SO4 and 3.15 wt%
NaCl. The galvanic-corrosion rate iGAv is normalized withrespect to the 6061 -T6 Al electrode area.
By using three different experimental methods (seeDiscussion), the galvanic-corrosion rate icAv was determined forgalvanic couples consisting of equal areas of P100 G fiber and6061-T6 Al. Results are tabulated in Table 1.
DiscussionCorrosion mechanisms of G-Al, SIC-Al, and TB 2-Al galvanic
couples are discussed in the first section. The second sectioncompares galvanic-corrosion rates of G-Al couples that weredetermined using three different experimental methods.Finally, in the last section, Al corrosion rates are graphically
7

represented as functions of the area fraction of P100 G, SIC, andTIB 2.
Corrosion MechanismsThe effect of deaeration, aeration, and chloride on
galvanic-corrosion behavior was studied. Polarization behaviorwas examined in deaerated and aerated 0.5 M Na 2SO4 and3.15 wt% NaCI. The galvanic-corrosion rate of couples formedbetween Al (i.e., m5N Al and 601-T6 Al) and the nobleconstituents (i.e., P100 G, SIC, and TiB2) can be predicted byusing the mixed-electrode theory. Cathodic polarizationdiagrams of the noble constituents were plotted together withthe anodic polarization diagrams of m5N Al and 6061-T6 Al.The point of intersection between the cathodic and anodiccurves gives the coordinates of the galvanic-corrosion rate iGALv
and potential EGALV. Since the polarization curves are plotted asa function of CD, the galvanic-corrosion rate iGALv and potentialEGA will correspond to couples that have equal surface areas ofAl and noble constituent.
Figure 1 shows the case for deaerated 0.5 M Na 2SO4. The
shapes of the cathodic polarization curves of the nobleconstituents are not very similar. The curve for TiB2 is Tafel-like, whereas; the curves for P100G and SiC show aconcentration-polarization-like regime followed by a Tafel-likeregime. The Tafel-like behavior observed for TIB 2 and thatwhich emerges at the higher CDs for SIC and P100G should bedue to H* reduction. The anodic curves of m5N Al and6061-T6 Al were similar and showed that the ultrapure metaland the alloy were passive. The passive CD was about 10-6
A/cm 2 . One can predict using the mixed-electrode theory thatthe galvanic-corrosion rate should not exceed the passive Al CD.
8
Therefore, galvanic corrosion should be negligible in deaerated
chloride-free environments.
There was a significant increase in the cathodic CDs ofP100 G, SiC and TIB 2 in aerated 0.5 M Na 2SO4 (Figure 2) as
compared to deaerated 0.5 M Na 2SO4 (Figure 1). The increasein cathodic CD was a result of 02 reduction. Aeration did not
have significant effects on the passivation of m5N Al and
6061 -T6 Al. and therefore, the galvanic-corrosion rate should besimilar to that in deaerated 0.5 M Na 2SO4.
In deaerated 3.15 wt% NaCI (Figure 3). the cathodic
curves of the noble constituents were similar to those indeaerated 0.5 M Na 2SO4 (Figure 1). However, both m5N Al and
606 1-T6 Al were susceptible to pitting at potentials greater thanabout -0.7 VscE. As shown in Figure 3, the cathodic curves of thenoble constituents intersect the anodic curves of m5N Al and
6061-T6 Al in the passive regime (i.e., at potentials below thepitting potential). Therefore, the galvanic-corrosion rate is
limited to the passive CD (about 10-6 A/cm2).
In aerated 3.15 wt% NaCl (Figure 4), the cathodic curves
of the noble constituents are similar to those in aerated0.5 M Na 2SO4 (Figure 2). The m5N Al and 606 1-T6 Al pitted at
potentials greater than about -0.7 VSCE. The mixed-electrode
theory indicates that the noble constituents will polarize m5N Al
and 6061-T6 Al into the pitting regime. Galvanic-corrosionrates can be expected to be significant in aerated chloride-
containing environments.
A few comments on the resistivity of SIC and its effect on
galvanic corrosion are due. The resistivity of SiC can range from
10-5 to I0 +13 ohm-cm depending on its purity 10. When a
9

cathodic reaction occurs on an SiC particle of high resistivity,
a large IR drop can develop by the flow of current through the
particle. Galvanic-corrosion rates would be significantly reduced
by a large IR drop. The IR drop through a particle is
approximately equal to ipL. as a first approximation (Figure 8).
where I is the cathodic CD through the particle. p is the
resistivity of the particle, and 1 is roughly the size of the particle.
In SIC/Al MMCs, very small SIC particles are used. and
therefore, the IR drop could be insignificant. For example, an
IR drop of only 4 mV would result from a 40 im particle of
105 ohm-cm resistivity upon which 02 reduction occurred at a
rate of 10 A/cm 2 . A 4 mV IR drop would essentially have no
effect on galvanic corrosion.
Comparison of Galvanic-Corrosion Rates Determined by DifferentExperimental Methods
The galvanic-corrosion rate for a couple consisting of equal
areas of P 100 G and 606 1-T6 Al was determined from three
different methods for deaerated and aerated 0.5 M Na 2 SO 4 and
3.15 wt% NaCI solutions. The galvanic-corrosion rates are
tabulated in Table I.
In the first method, 1 ALV was read from polarization
diagrams of P 100 G and 606 1-T6 Al in Figures 1 through 4 using
the mixed-electrode theory. Values of iGALv were also obtained
from the ZRA technique. The values that are listed in Table 1
correspond to measurements taken at 100 hours from the
curves in Figure 6. In the last method, IGALV was derived from
the corrosion rate icom that was extrapolated from polarization
diagrams (not shown) of a commercial G/6061-T6 Al MMC that
contained 50 vol.% of fibers. The value of iGLv is twice that of
icoR because iALv is normalized with respect to the 606 1-T6 Al
10

matrix area; whereas, kcoR is normalized with respect to thecomposite area.
The values of iciLy, determined from the three methods,were in good agreement for deaerated 0.5 M Na 2SO4 and
3.15 wt% NaCl. All values (see Table 1) were within an order ofmagnitude of the 6061-T6 Al passive CD (about 10-6 A/cm 2).Excellent agreement among the three methods also prevailedfor aerated 3.15 wt% NaCl. The corrosion rate ranged from1 x 10-4 to 3 x 10⁻⁴ A/cm 2 . See Table 1.
In aerated 0.5 M Na 2SO4 , the value of icLy from the ZRAtechnique was about 10 to 100 times greater than that from themixed-electrode theory (about 10-6 A/cm 2). That discrepancycould have been caused by a change in the dissolution behavior of6061-T6 Al over the duration of the ZRA experiment, and anedge effect of the 6061-T6 Al electrodes. During the ZRAexperiment, iGALV increased with time in two out of threeexperiments (Figure 6); whereas, EOALV decreased with time(Figure 7). An increasing iGALv accompanied by a decreasingEALv indicates that the anodic polarization curve of 6061-T6 Alshifted to the right (to larger CDs) on a log i-E diagram. Inaddition, the 6061-T6 Al electrodes used in the ZRA
experiments had larger edge-to-surface area ratios than theelectrodes used for the mixed-electrode theory. It is possiblethat large edge-to-surface area ratio is associated with highdissolution rates. Notice in Figure 5 that the anodic CD of606 1-T6 Al is about five times higher for the 0.0233 cm 2
electrodes that were used in the ZRA experiments compared tothe 0.811 cm 2 electrodes that were used to generate thepolarization diagrams for the mixed-electrode theory. The small
11
electrode has an edge-to-surface area ratio that is greater thanthat of the large electrode.
The value of vLv that was derived from the commercialG/6061-T6 Al MMC exposed to aerated 0.5 M Na 2SO4 was not
compared to tGALv from the ZRA experiment or the mixed-
electrode theory. The composite Is contaminated withmicrostructural chloride that induces pitting of the 6061-T6 Almatrix in aerated 0.5 M Na 2SO4 11; thus, the value of ic.LV does
not truly correspond to that from an aerated chloride-freeenvironment. In the previous cases (i.e. deaerated0.5 M Na 2 SO4 and 3.15 wt% NaCl), however, the value of iGALV
derived from the commercial composite was considered validfor the following reasons. In deaerated 0.5 M Na 2SO4, the
6061-T6 Al matrix was passive in the open-circuit condition(polarization diagram not shown), showing that microstructuralchloride had negligible effects on corrosion behavior. In3.15 wt% NaCI, the effects of rnicrostructural chloride shouldnot be pronounced because the solution contains high levels of
chloride.
Graphical Representation of Galvanic-Corrosion RatesResults have indicated that galvanic corrosion will be
severe in aerated chloride-containing environments. Therefore,a graph (Figure 9) was generated from which the galvanic-corrosion rate of an m5N Al or 606 1-T6 Al matrix can beobtained as a function the P100 G, SIC, or TIB 2 area fraction.
The mixed-electrode theory was used to develop thegraph. In a galvanic couple, the current that flows from thecathode Ic is equal to the current that flows to the anode IA. Thesubscripts "c" and "a" refer to cathode and anode, respectively,
12

and will also apply to other parameters. Both Ic and IA areequivalent to the galvanic current IGLr:
IC = IA = IGALV )
The cathodic and anodic currents can be written in terms of
current density i and electrode area A:
Ic = ic* Ac (2)
and
IA = iA * AA (3).
Substituting (2) and (3) into (1), gives
ico Ac= iA* AA (4).
Equation (4) can be written in terms of area fractions Xc and XA,
by dividing both sides of (4) by Ac + AA:
ic* Xc = i* XA (5)
Since Xc + XA = 1, Equation (5) can be simplified to
i^ = iC * (XC / l-Xc) (6).
The parameter iA (the dissolution rate of the anode) is the
galvanic-corrosion rate IALv.
When the value of ic is known, equation 6 shows that (IcNv
can be plotted as a function of the cathode area fraction Xc to
generate the Xc-log lALy plot in Figure 9. Examination of
Figure 4 shows that the value of ic should be equal to the CD of
the cathodic constituents in the pitting regime of m5N Al and606 1-T6 Al. Read from Figure 4, the value of Ic for P100 G is
13

about 3.2 x 10⁻⁴ A/cm2 , and about 1.0 x 10⁵ A/cm 2 for SIC andTIB2 . Since the anodic polarization curves of m5N Al and
606 1-T6 Al are almost identical in the pitting regime, the
ultrapure metal and alloy should have similar galvanic-corrosion
behavior. Thus, it will not be advantageous to use m5N Al in
place of 6061-T6 Al for the purpose of improving resistance to
galvanic corrosion. There is an exception. however, when Xc is
small. This is demonstrated in Figure 10, which shows that for
a critical value of Xc less than 0.003, the cathodic P100 G curve
intersects the anodic m5N Al curve in the passive regime. Note
that there is no passive regime for 6061-T6 Al; thus, the
galvanic-corrosion behavior of m5N Al and 6061-T6 deviates at
Xc less than 0.003. For SiC and TIB2, the critical value of Xc is
0.08. Also note that cathodic partial reactions occurring on the
anode cannot be accounted for; thus, the true dissolution rate of
the matrix is greater than the value of icily.
The Xc-log iGALV plot in Figure 9 shows that iGALV is about 30times greater for G-Al couples compared to SiC-Al couples. The
graphs also show that iaALy of 606 1-T6 Al coupled to an equal
area of PI00 G is about 80 times the corrosion rate of uncoupled
606 1-T6 Al. In contrast, iGALv of 6061-T6 Al coupled to SiC orTiB2 is only about 2.5 times the corrosion rate of the uncoupled
alloy. Thus, the corrosion resistance of SIC/Al MMCs should be
significantly greater than that of G/A MMCs.
Conclusions
Galvanic corrosion of G/Al and SIC/Al MMCs can be
expected to be significant in aerated chloride-containing
environments. Experiments have shown that the corrosion ratewas controlled by th'! rate of 02 reduction, which was
significantly greater on P100 G than on SIC. Therefore, G/Al
14

MMCs should corrode many times faster than SiC/Al MMCs.
Results also indicate that resistance to galvanic corrosion cannot
be improved by using m5N Al for matrix material in place of
6061-T6 Al. In the absence of dissolved 02, galvanic corrosion
should be negligible.
Acknowledgements
We are grateful for the financial support provided by the
Shell Companies Foundation and the Office of Naval Research
(grant # N00014-89-J-1588). We are particularly grateful to
Dr. A.J. Sedriks of the Office of Naval Research.
References
1) M. Pourbaix, Atlas of Electrochemical Equilibria in Aqueous
Solutions, National Association of Corrosion Engineers,
1974.
2) E.G. Kendall, D.L. Dull, "Salt Water Corrosion Behavior of
Aluminum-Graphite Composite," National Technical
Information Service, U.S. Department of Commerce,
AD-777 160, 1974.
3) D.L. Dull, W.C. Harrigan, Jr., M.F. Amateau, Aerospace
Corporation, AD- A011 761, 1975.
4) W.H. Pfeifer, in Hybrid and Select Metal-Matrix Composites,
Ed. W.J. Renton, American Institute of Aeronautics and
Astronautics, 1977, p. 2 3 1 .
5) D.M. Aylor, R.M. Kain, in Recent Advances in Composites in
the United States and Japan, Ed. J.R Vinson, M. Taya,
ASTM Special Technical Publication 864, 1983, p.632.
15

6) M.G. Vassilaros, D.A. Davis, G.L. Steckel, J.P. Gudas, in
Mechanical Behavior of Metal-Matrix Composites, Ed. J.E.
Hack, M.F. Amateau, The Metallurgical Society of the AIME,
1983, p.335.
7) W.F. Czyrklis, Corrosion/85, Paper No. 196, National
Association of Corrosion Engineers. Houston, Texas, 1985.
8) K.D. Lore, J.S. Wolf, Extended Abstracts, Vol. 81-2, The
Electrochemical Society, Denver, Colorado, 1981, p.387.
9) L.H. Hihara, "Corrosion of Aluminum-Matrix Composites,"Ph.D. Thesis, Massachusetts Institute of Technology, 1989.
10) N. Ichinose, Ed., Introduction to Fine Ceramics, John Wiley
and Sons Ltd., 1987, p. 52.
11) L.H. Hihara, R.M. Latanision, Corrosion, in press.
List of FiguresFigure 1: A collection of polarization diagrams for calculation of
galvanic-corrosion rates using the mixed-electrode theory.Deaerated 0.5 M Na 2 SO4 of pH 7 at 30C. Scan rate = 0.1 mV/s.
Figure 2: A collection of polarization diagrams generated in
aerated 0.5 M Na 2 SO4 of pH 7 at 30C. Scan rate = 0.1 mV/s.
Figure 3: A collection of polarization diagrams generated in
deaerated 3.15 wt% NaCI of pH 7 at 30*C. Scanrate = 0.1 mV/s.
Figure 4: A collection of polarization diagrams generated in
aerated 3.15 wt% NaCl of pH 7 at 300C. Scan rate = 0.1 mV/s.
16

Figure 5: Anodic polarization diagrams of 6061-T6 Al electrodes
of two different sizes. The anodic CDs of the 0.0233 cm 2
electrode are about five times greater than that of the 0.811 cm 2
electrode. Aerated 0.5 M Na 2 SO 4 of pH 7 at 300C. Scan
rate = 0.1 mV/s.
Figure 6: Galvanic-corrosion rate ICALv of galvanic couplesconsisting of P100 G and 6061-T6 Al of equal areas exposed toneutral solutions at 30*C.
Figure 7: Galvanic-corrosion potentials EAv of couples
consisting of P100 G and 6061-T6 Al of equal areas exposed toneutral solutions at 30°C.
Figure 8: A first approximation of the IR drop through an SiCparticle, assuming one-dimensional current flow through theparticle. I = tj2, R = pl/ 2 , IR = ipl.
Figure 9: Graphs showing the galvanic-corrosion rate iCALy ofm5N Al and 606 1-T6 Al as a function of area fraction XC ofP 100 G, SiC, and TIB2 in aerated 3.15 wt% NaCI of pH 7 at 300C.
Figure 10: A collection of polarization diagrams to show the
effect of P100 G area fraction Xc on galvanic-corrosion behaviorin aerated 3.15 wt% NaCl of pH 7 at 300C. Note that galvanic-corrosion behavior of m5N Al and 6061-T6 Al deviates for Xc lessthan 0.003 due to passivation of m5N Al. Polarization currentsare based on the given areas.
17

0.0
-0.5
4)U Titanium DiborideO -0---Silicon Carbide
-1.0
-9 -8 -7 -6 -5 -4 -3log i [A/cm2]
FIgure 1: A coilection of polarization diagrams for calculation ofgalvanic-corrosion rates using the mixed-electrode theory. Deaerated0.5 M Na 2SO4 of pH 7 at 300C. Scan rate = 0.1 mV/s.

1.0- -- P1O0 G
Titanium Diboride0.5- Silicon Carbide
0- 6061 -T6 Al. m5N Al
0.0
-0.5
LU
-1.0
-1.5
-2.0-9 -8 -7 -6 -5 -4 -3
log i [A/cm 2]
Figure 2: A collection of polarization diagrams generated In aerated0.5 M Na 2SO4 of pH 7 at 30C. Scan rate = 0.1 mV/s.

0.0.........
-U-- Titanium DiborideSilicon Carbide
0- 6061 -T6 Al-0.5 -0 mNA
LU
-1.0
-1.5-9 -8 -7 -6 -5 -4 -3
log i [A/cm2]
Figure 3: A collection of polarization diagrams generated in deaerated3.15 wt% NaCI of pH 7 at 30*C. Scan rate = 0. 1 mV/s.

-0.5
P10
w .1- Titanium Dibcride ioro-1.0o Silicon Carbide604 T
-H--6061 -T6 Al, Cathodic A0~ 6061 -T6 Al, Anodic
-a-- m.N Al
-1.5 1. . . . . . . . .-9 -8 -7 -6 -5 -4 -3
log i[A/cm 2-]
Figure 4: A collection of polarization diagrams generated in aerated3.15 wt%/ NaCI of pH 7 at 300C. Scan rate = 0. 1 mV/s.

1.0
0.5
0.0US - - 0.811 sq cmI-
0.0233 sq cmWu -0.5
-1.0
-1.5-8 -7 -6 -5 -4 -3
log i [A/cm]
Figure 5: Anodic polarization diagrams of 6061-T6 Al electrodes oftwo different sizes. The anodic CDs of the 0.0233 cm 2 electrode areabout five times greater than that of the 0.811 cm 2 electrode. Aerated0.5 M Na 2SO4 of pH 7 at 300C. Scan rate = 0. 1 mV/s.

-3
Aerated 3.15 wt%/ Sodium Chloride
--5 Aerated 0.5 M Sodium Sulfate
ca
0-J-6
~Deaerated 0.5 M Sodium Sulfate
Deaerated 3.15 wt% Sodium Chloride-70 10 20 30 40 50 60 70 80 90 100
Time (h)
Figure 6: Galvanic-corrosion rate i,,v of galvanic couples consisting ofP 100 G and 606 I-T6 Al of equal areas exposed to neutral solutions at300C.

-0.3 Aerated 0.5 M Sodium Sulfate
-0.5
-0.7Aerated 3.15 wt% Sodium Chloride
-0.9l
w -1.1 Deaerated 0.5 M Sodium Sulfate
-1.3 a
Deaerated 3.15 wt% Sodium Chloride-1 5 -'- I ' ' ' ' - I. .. ".. . . ... I" . .'" ' 1 ' ' . I ... I ' I" .. L"
0 10 20 30 40 50 60 70 80 90 100
Time (h)
Figure 7: Galvanic-corrosion potentials E.,, of couples consisting ofP 100 G and 6061-T6 Al of equal areas exposed to neutral solutions at
30C.

Cathodic CurrentDensity i Cathodic Surface
Particle ofResistivity pf1
IR Drop Current Flow
Figure 8: A first approximation of the IR drop through an SIC particle,
assuming one-dimensional current flow through the particle. I = IF. R= pli/. IR = IpL

-Al ACoupled to P1l00G-2 - Ai Coupled to SiC or Titanium Dibonide
-3E
-5
o -6------- -- ----- - _ _ _
-7 Corrosion Rate of Uncoupled Corrosion Rate ofm5N A)Uncoupled 6061-T6 A)
u.0 0.1 0.2 0.3 0.4 0.5 0.6 0.7 0.8 0.9 1.0XC
FIgure 9: Graphs showing the galvanic-corrosion rate ICLv of m5N Aland 6061-T6 Al as a function of area fraction Xc of P100 G. SIC, andTIB2 in aerated 3.15 wtA NaCI of pH17 at 30*C.

0.0PlO0 G
-0.2 0.111 sq CM, Xc -0.1
-0.429 sq cm, XC - 0.3-0.4I •lsq cm, Xc- 0.5
-0.6
u -0.86061-T6 Al,.1._Wl>c Xc :x 0.003
• 0.002 sq cm,
-1.2 Xc 0.002
-1.4-1.6 m5N Al, 1 sq cm-1.8 .
-8 -7 -6 -5 -4 -3 -2
Log I [A]
Figure 10: A collection of polarization diagrams to show the effect ofP100 G area fraction Xc on galvanic-corrosion behavior in aerated3.15 wt% NaCI of pH 7 at 30°C. Note that galvanic-corrosion behaviorof m5N Al and 6061-T6 Al deviates for Xc less than 0.003 due topassivation of m5N Al. Polarization currents are based on the givenareas.

RE/1131/88/75
4315 (036)
Supplemental Distribution List Feb 1990
Profs. G.H. Meier and F.S.Pettit Dr. G. D. DavisDept. of Metallurgical and Martin Marietta LaboratoriesMaterials Eng. 1450 South Rolling Rd.University of Pittsburgh Baltimore, MD 21227-3898Pittsburgh, PA 15261
Prof. H.K. Birnbaum Prof. P.J. MoranDept. of Metallurgy & Mining Enq. Dept. of Materials Science & Eng.University of Illinnis Thp Johns Hopkins UniversityUrbana, Ill 61801 Baltimore, MD 21218
Prof. H.W. Pickering Prof. J. KrugerDept. of Materials Science and Eng. Dept. of Materials Science & Eng.The Pennsylvania State University The Johns Hopkins UniversityUniversity Park, PA 16802 Baltimore, MD 21218
Prof. D.J. Duquette Dr. B.G. PoundDept. of Metallurgical Eng. SRI InternationalRensselaer Polytechnic Inst. 333 Ravenswood Ave.Troy, NY 12181 Menlo Park, CA 94025
Prof. D. Tomanek Prof. C.R. ClaytonMichigan State University Department of Materials ScienceDept. of Physics and Astronomy & EngineeringEast Lansing, MI 48824-1116 State University of New York
Stony BrookDr. M. W. Kendig Long Island, NY 11794Rockwell International Science Center1049 Camino Dos Rios Dr. J. W. OldfieldP.O. Box 1085 Cortest Laboratories LtdThousand Oaks, CA 91360 23 Shepherd Street
Sheffield, S3 7BA, EnglandProf. R. A. RappDept. of Metallurgical Eng. Prof. Boris D. CahanThe Ohio State University Dept. of Chemistry116 West 19th Avenue Case Western Reserve Univ.Columbus, OH 43210-1179 Cleveland, Ohio 44106
Dr. R. W. Drisko Prof. G. SimkovichCode L-52 Dept. of Materials Science & Eng.Naval Civil Engineering Laboratory The Pennsylvania State UniversityPort Hueneme, CA 93043-5003 University Park, PA 16802
Dr. R.D. Granata Prof. M.E. OrazemZettlemoyer Center for Surface Studies Dept. of Chemical EngineeringSinclair Laboratory, Bld. No. 7 University of FloridaLehigh University Gainesville, FL 32611Bethlehem, PA 18015

Dr. P. S. Pao Prof. J. O'M. BockrisCode 6303 Dept. of ChemistryNaval Research Laboratory Texas A & M UniversityWashingtCn, D.C. 20375 College Station, TX 77843.
Dr. N. S. Bornstein Dr. V. S. AgarwalaUnited Technologies Research Center Code 6062East Hartford, CT 06108 Naval Air Development Center
Warminster, PA 18974-5000Prof. R. M. LatanisionMassachusetts Institute of Technology Prof. Harovel G. WheatRoom 8-202 Dept. of Mechanical EngineeringCambridge, MA 02129 The University of Texas
ETC 11 5.160Dr. R. E. Ricker Austin, TX 78712-1063National institute of Standards andTechnology
Metallurgy Division Prof. S. C. DexterBldg. 223, Room B-266 College of Marine StudiesGaithersburg, MD 20899 University of Delaware
700 Pilottown Rd.Dr. F. B. Mansfeld Lewes, DE 19958Dept. of Materials ScienceUniversity of Southern CaliforniaUniversity ParkLos Angeles, CA 90089
Dr. W. R. BitlerDept. of Materials Sci. and Eng.115 Steidle BuildingThe Pennsylvania State UniversityUniversity Park, PA 16802
Dr. S. SmialowskaDept. of Metallurgical EngineeringThe Ohio State University116 West 19th AvenueColumbus, OH 43210-1179
Dr. R. V. SaraUnion Carbide CorporationUCAR Carbon Company Inc.Parma Technical Center12900 Snow RoadParma, Ohio 44130
Prof. G.R. St. PierreDept. of Metallurgical Eng.The Ohio State University116 West 19th AvenueColumbus, Oh 43210-1179
Dr. E. McCaffertyCode 6322Naval Research LaboratoryWashington, D. C. 20375
2
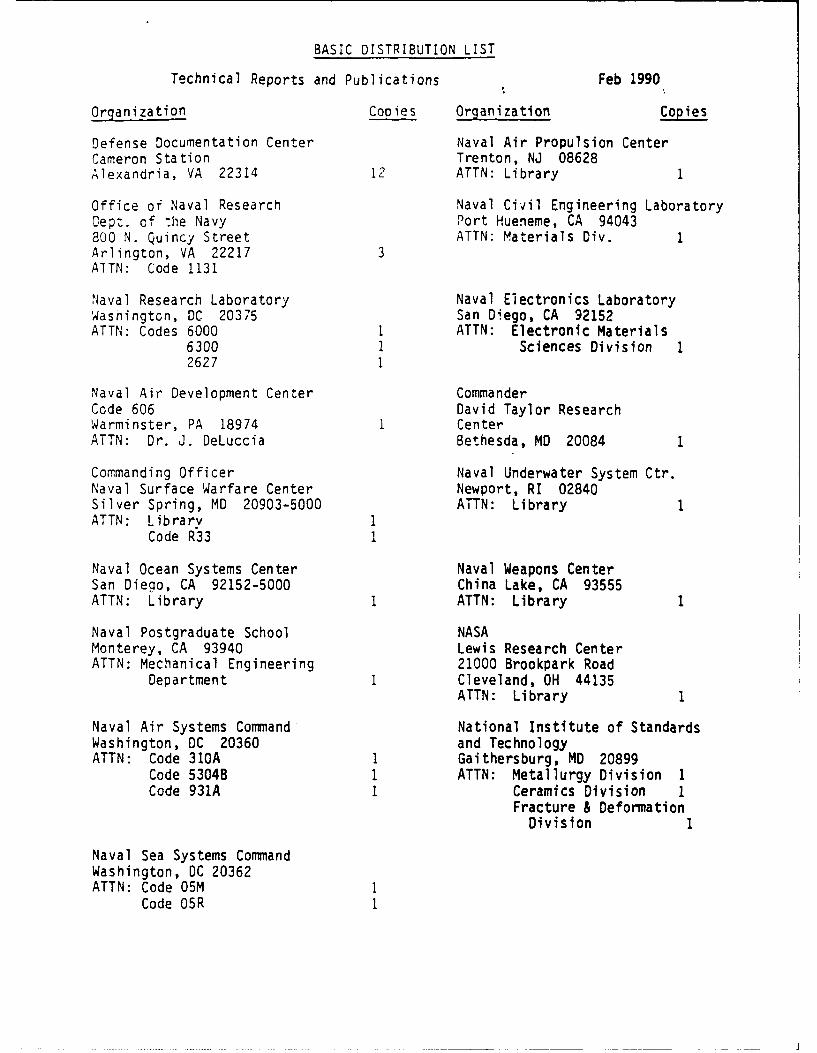
BASIC DISTRIBUTION LIST
Technical Reports and Publications Feb 1990
Organization Copies Organization Copies
Defense Documentation Center Naval Air Propulsion CenterCameron Station Trenton, NJ 08628Alexandria, VA 22314 12 ATTN: Library 1
Office of Naval Research Naval Civil Engineering LaboratoryDept. of the Navy Port Hueneme, CA 94043800 N. Quincy Street ATTN: Materials Div. 1Arlington, VA 22217 3ATTN: Code 1131
Naval Research Laboratory Naval Electronics LaboratoryWasnington, DC 20375 San Diego, CA 92152ATTN: Codes 6000 1 ATTN: Electronic Materials
6300 1 Sciences Division 12627 1
Naval Air Development Center CommanderCode 606 David Taylor ResearchWarminster, PA 18974 1 CenterATTN: Dr. J. DeLuccia Bethesda, MD 20084 1
Commanding Officer Naval Underwater System Ctr.Naval Surface Warfare Center Newport, RI 02840Silver Spring, MD 20903-5000 ATTN: LibraryATTN: Library 1
Code R33 I
Naval Ocean Systems Center Naval Weapons CenterSan Diego, CA 92152-5000 China Lake, CA 93555ATTN: Library 1 ATTN: Library
Naval Postgraduate School NASAMonterey, CA 93940 Lewis Research CenterATTN: Mechanical Engineering 21000 Brookpark Road
Department 1 Cleveland, OH 44135ATTN: Library
Naval Air Systems Command National Institute of StandardsWashington, DC 20360 and TechnologyATTN: Code 310A I Gaithersburg, MD 20899
Code 5304B 1 ATTN: Metallurgy Division 1Code 931A 1 Ceramics Division I
Fracture & DeformationDivision 1
Naval Sea Systems CommandWashington, DC 20362ATTN: Code 05M I
Code 05R 1

Naval Facilities Engineering Defense Metals & CeramicsCommand Information Center
Alexandria, VA 22331 Battelle Memorial Inst.ATTN: Code 03 1 505 King Avenue
Columbus, OH 43201 1
Commandant of the Marine Corps 1 Oak Ridge National LaboratoryScientific Advisor Metals and Ceramics Div.Washington, DC 20380 P.O. Box XAITN: Code AX Oak Ridge, TN 37380 1
Oak Ridge, TN 37380 1
Army Research Office Los Alamos Scientific Lab.P.O. Box 12211 P.O. Box 1663Research Triangle Park, NC 27709 Los Alamos, NM 87544ATTN: Metallurgy & Ceramics ATTN: Report Librarian 1
Program 1
Army Materials Technology Laboratory Argonne National LaboratoryWatertown, MA 02172-0001 Metallurgy DivisionATTN: Research Program Office I P.O. Box 229
Lemont, IL 60439 1
Air Force Office of Scientific Brookhaven National LaboratoryResearch Technical Information Division
Building 410 Upton, Long IslandBolling Air Force Base New York 11973Washington, DC 20332 ATTN: Research Library 1ATTN: Electronics & Materials
Science Directorate 1
NASA Headquarters Lawrence Berkeley Lab.Washington, DC 20546 1 Cyclotron RdATTN: Code RM 1 Berkeley, CA 94720
ATTN: Library
David Taylor Research CtrAnnapolis, MD 21402-5067ATTN: Code 281 1
Code 2813 1Code 0115 1