Classify SBU & products ◦ Determine future cash contributions Positive cashflow (+ve) ◦...
18
-
Upload
gwen-clarke -
Category
Documents
-
view
224 -
download
0
Transcript of Classify SBU & products ◦ Determine future cash contributions Positive cashflow (+ve) ◦...


Classify SBU & products
◦Determine future cash contributions Positive cashflow (+ve)
◦Determine future cash requirements Negative cashflow (-ve)
2
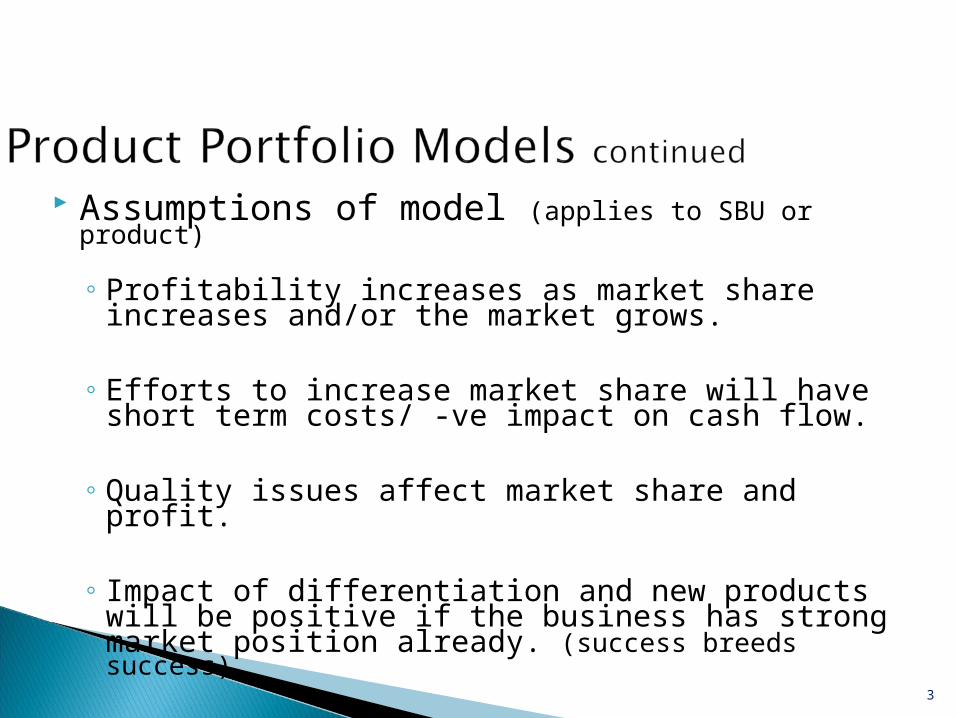
Assumptions of model (applies to SBU or product)
◦ Profitability increases as market share increases and/or the market grows.
◦ Efforts to increase market share will have short term costs/ -ve impact on cash flow.
◦ Quality issues affect market share and profit.
◦ Impact of differentiation and new products will be positive if the business has strong market position already. (success breeds success)
3

◦BCG Growth-Share matrix model
Uses market share and market growth
◦Business Screen (General Electric)
Use indexes made up of a number of factors
4

SBU / product can be classified by two factors: ◦ market share relative to competitors, ◦ growth rate of the market in which the SBU
operates. These factors are divided into high and
low categories. The resulting 2 x 2 grid has 4
categories of SBU / product.
5
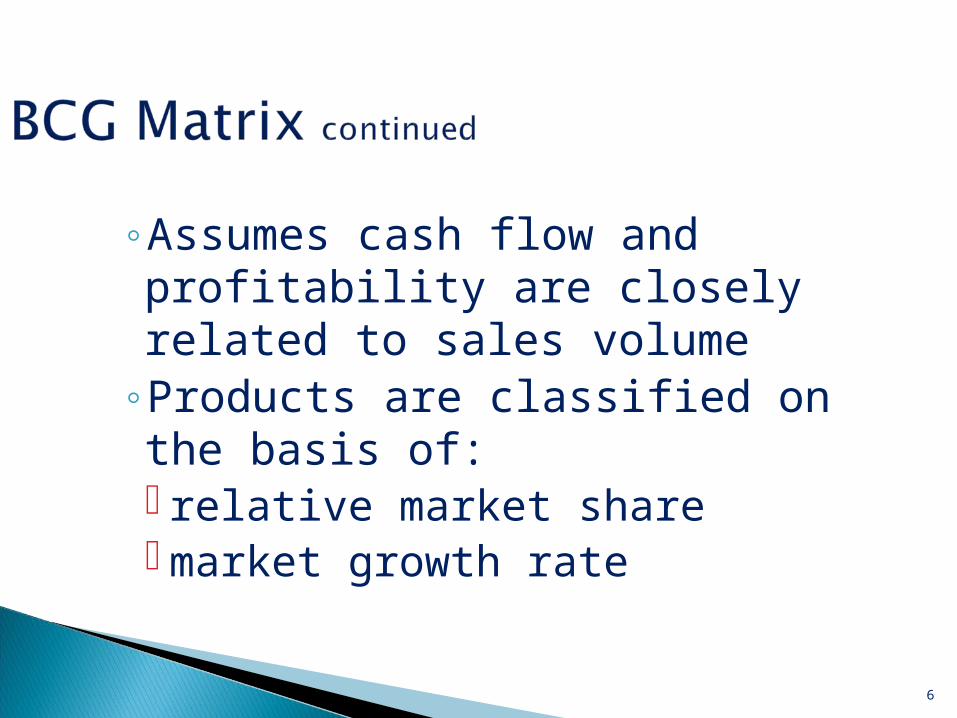
◦Assumes cash flow and profitability are closely related to sales volume
◦Products are classified on the basis of: relative market share market growth rate
6

◦Relative market share Is the ratio of it’s market share to that of the
largest competitor.
◦Any value > 1 shows strong position Found by dividing product share by
market share of next largest competitor. Eg Coca-Cola = 37% / Pepsi = 22% Coca-Cola relative market share =37/22 = 1.68.
7
◦Growth rate – Can be interpreted as reflecting the four stages of the Product Life Cycle (PLC). High growth reflects introduction (1) & growth (2) stages.
Low growth shakeout(3) & mature(4) stages.
8

9
Stars
Cash Cows
Question Marks
Dogs
????
?? ????
Mar
ket
Gro
wth
Rat
e
Relative Market Share
High Low
Hig
hL
ow
10
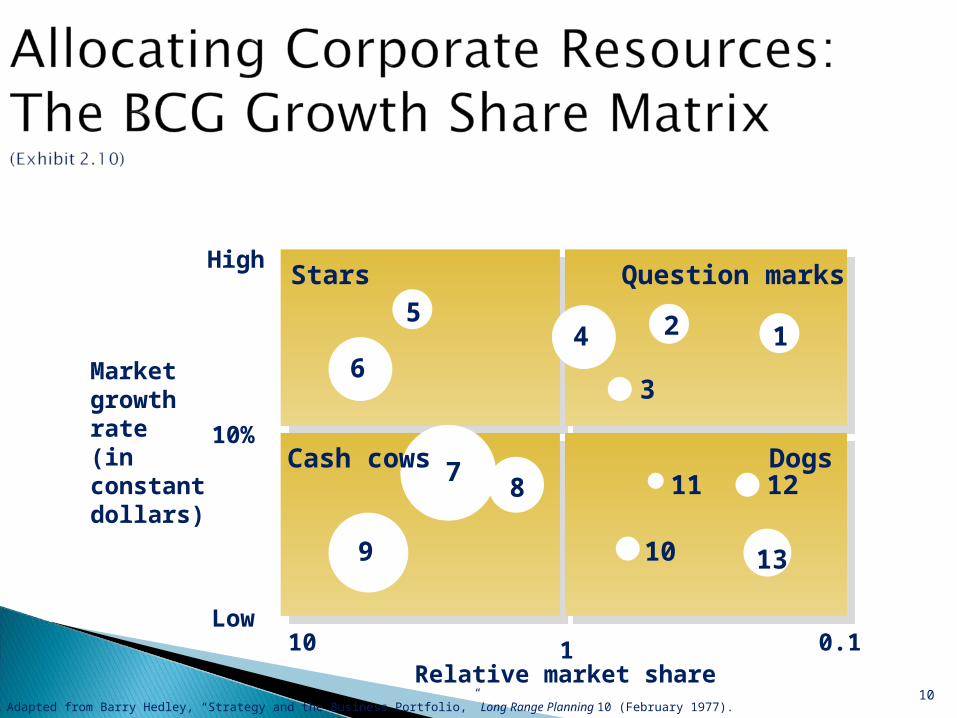
High
Low
Stars
Dogs
Question marks
10 0.1Relative market share
Marketgrowthrate(inconstantdollars)
10%
1
Source: Adapted from Barry Hedley, “Strategy and the Business Portfolio,” Long Range Planning 10 (February 1977).
5
6
9
87Cash cows
4
10 13
12
3
11 12
STAR = high relative share in high growth market
◦ High sales & high cash flows◦ Attractive to competitors◦ Need high promotion to protect market share◦ High market growth means high investments in
production facilities & inventory are needed◦ Cash from a star needs to be reinvested in back into
the star
11

Cash Cow= high relative share in low growth market
◦ High sales & high market share & high cash flow◦ Market leader product◦ High profits◦ Low growth markets◦ Cash investments are low◦ Primary source of cash to the firm
12
Question marks / Problem Child = low relative share in high growth market
◦ Have great potential (as in a growth market) ◦ Need high investment to build market share◦ Large negative impact on cashflow
13

Dog= low market share and low market growth
◦ Weak cash providers.◦ If there is a loyal core market, consistent profits are
possible.◦ Relatively small share of company resources are
invested.
14

A balanced portfolio of SBUs with a mix of stars, cash cows, and questions marks, but hopefully no dogs is desirable.
Why not all cash cows?
15

Far too simplistic◦Suggests market share and industry
growth are the best predictors of profitability
◦Strict reliance of these two dimensions may not be appropriate
Some products cannot be classified as high or low on one of the factors.
16

Present market share does not show possibility of increasing/decreasing it in the future.
Some high growth markets may not be attractive because of their small size and/or long term stability
17
Criticism of BCG Model …Continued

18
Gro
wth
rat
e (c
ash
use
)
High
Low
Stars
Cash cows
Dogs
Questionmarks
High LowRelative market share
$
PLCStage
1
2
3
4