· PDF file400 600 800 1000 Wavelength, nm
18
Isolation of a chiral anthracene cation radical: X-ray crystallography and computational interrogation of its racemization Maxim V. Ivanov, Khushabu Thakur, Anshul Bhatnagar, and Rajendra Rathore* Department of Chemistry, Marquette University, P.O. Box 1881, Milwaukee, WI 53201-1881 Supporting Information Table of Content S1. SYNTHESIS 2 S2. GENERATION OF CATION RADICALS 3 S3. X-RAY CRYSTALLOGRAPHY 5 S4. DENSITY FUNCTIONAL THEORY CALCULATIONS 6 Computational Details 6 Isomerization Pathways 7 S5. KINETIC MODELING 14 S6. REFERENCES 18 Electronic Supplementary Material (ESI) for ChemComm. This journal is © The Royal Society of Chemistry 2017
Transcript of · PDF file400 600 800 1000 Wavelength, nm

Isolation of a chiral anthracene cation radical: X-ray crystallography and
computational interrogation of its racemization
Maxim V. Ivanov, Khushabu Thakur, Anshul Bhatnagar, and Rajendra Rathore*
Department of Chemistry, Marquette University, P.O. Box 1881, Milwaukee, WI 53201-1881
Supporting Information
Table of Content
S1.SYNTHESIS 2
S2.GENERATIONOFCATIONRADICALS 3
S3.X-RAYCRYSTALLOGRAPHY 5
S4.DENSITYFUNCTIONALTHEORYCALCULATIONS 6
ComputationalDetails 6
IsomerizationPathways 7
S5.KINETICMODELING 14
S6.REFERENCES 18
Electronic Supplementary Material (ESI) for ChemComm.This journal is © The Royal Society of Chemistry 2017
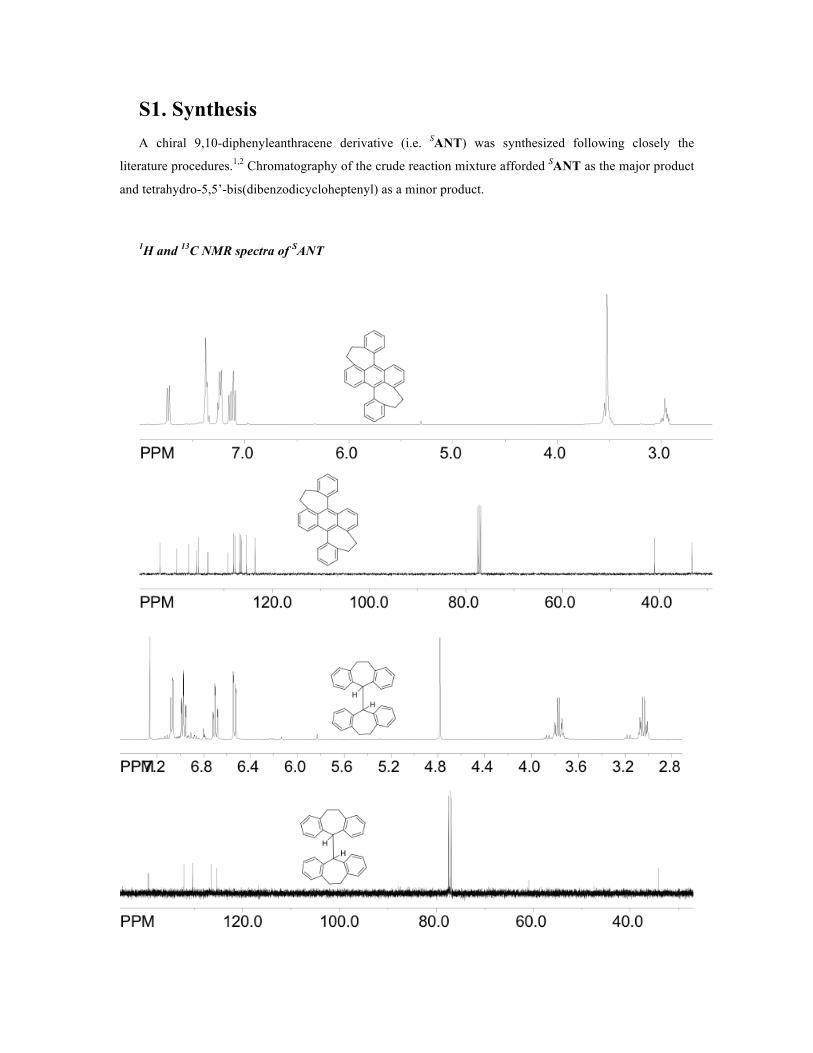
S1. Synthesis A chiral 9,10-diphenyleanthracene derivative (i.e. SANT) was synthesized following closely the
literature procedures.1,2 Chromatography of the crude reaction mixture afforded SANT as the major product
and tetrahydro-5,5’-bis(dibenzodicycloheptenyl) as a minor product.
1H and 13C NMR spectra of SANT

UV-vis absorption spectroscopy
Figure S1. UV-vis absorption spectra of 9,10-diphenyle anthracene and doubly bridged 9,10-diphenyl anthracene in the range of 250-500 nm (left) and expanded to 300-500 nm range (right).
S2. Generation of Cation Radicals Reproducible spectra of doubly bridged 9,10-diphenyl anthracene (SANT) and 9,10-diphenyl anthracene
cation radicals were obtained in CH2Cl2 solution at 22 ºC by quantitative redox titrations using
THEO+•SbCl6– (Ered1 = 0.67 V vs Fc/Fc+, λmax = 518 nm, εmax = 7300 cm-1 M-1),3 and NAP+•SbCl6
– (Ered1 =
0.94 V vs Fc/Fc+, λmax = 672 nm, εmax = 9300 cm-1 M-1)4-6 as oxidants.
Figure S2. Chemical structures and names of the aromatic oxidants used in redox titrations.
Each redox titration experiment was carried out by an incremental addition of sub-stoichiometric
amounts of neutral electron donor (D) to the solution of an oxidant cation radical (Ox+•). The 1-e- oxidation
of D to D +• and reduction of Ox+• to Ox can be described by an equilibrium shown in eq. 1.
Ox+• + D ⇄ Ox + D +• (eq. 1)
Numerical deconvolution7,8 of the UV-VIS absorption spectrum at each increment produced the
individual spectra of D+• and Ox+• (Figures S3-S5).
O
O
THEONAP
TRUX

Figure S3. A: Spectral changes observed upon the reduction of 0.049 mM THEO+• (3 mL) by incremental addition (4 µL) of 3.6 mM solution of SANT0 in CH2Cl2. B, C, D: Showing the component spectra of THEO+• (burgundy), SANT+• (blue), and SANT (grey), obtained from the deconvolution of spectrum at each titration point from figure A. E: Sum of
the individual spectra of THEO+•, SANT+• and SANT0.
Figure S4. Spectral changes observed upon the reduction of 0.056 mM NAP +• (3 mL) by incremental addition (10 µL) of 3.0 mM solution of 9,10-diphenyl anthracene (DPA) in CH2Cl2. B, C, D: Showing the component spectra of NAP+• (burgundy), DPA+• (blue), and DPA (grey), obtained from the deconvolution of spectrum at each titration point from
figure A.. E: Sum of the individual spectra of NAP+•, DPA+• and DPA.
Figure S5. Comparison of the absorption spectra of DPA+• and SANT+•.
0
10000
0.000.100.190.290.390.510.630.750.870.991.111.231.471.962.68
500250 750 1000Wavelength, nm
500250 750 1000Wavelength, nm
500250 750 1000Wavelength, nm
500250 750 1000Wavelength, nm
500250 750 1000Wavelength, nm
Titration course
Sum of deconvoluted spectra
THEO+.+.
A B C D E
500250 750 1000Wavelength, nm
500250 750 1000Wavelength, nm
500250 750 1000Wavelength, nm
500250 750 1000Wavelength, nm
500250 750 1000Wavelength, nm
0.000.110.290.470.650.831.011.08
1.261.441.802.883.96
0
20000
Titration courseSum of
deconvoluted spectraNAP+.
+.A B C D E
400 600 800 1000Wavelength, nm
ε(1
04M
cm
-1-1
(
1
0
2
3
4
doubly bridgedno bridge
+. +.

S3. X-Ray Crystallography Preparation of [SANT+•SbCl6
-] single crystals using NO+SbCl6-. A Schlenk tube fitted with a
Schlenk adaptor was charged with nitrosonium hexachloroantimonate (92 mg, 0.25 mmol) and anhydrous
dichloromethane (20 mL) under an argon atmosphere. Solid SANT (96 mg, 0.25 mmol) was added under
an argon atmosphere at ~0 oC. The solution immediately took on a dark-red coloration, which was stirred
(while slowly bubbling argon through the solution to entrain gaseous NO) for 20-30 min to yield a dark-
colored solution of cation radical [QP+• SbCl6-], vide infra. The solution was carefully layered with dry
toluene (30 mL) and placed in a refrigerator (-10 oC) which after 2 days, produced a well-formed crop of
single crystals of the [SANT+•SbCl6-] suitable for X-ray structure analysis.
Table S1. Oxidation-induced C-C bond length changes of SANT obtained using X-ray crystallography. Correlation plots between experimental and calculate changes is shown below with error bars corresponding to the standard deviation (σ = 0.008 Å, left) and 3σ (right), computed from the precisions of the neutral (0.0016 Å) and cation radical (0.0078 Å) structures.
bond X-ray (SANT) X-ray (SANT+•) DFT (SANT) DFT (SANT+•) Δ (DFT), pm Δ (X-ray), pm
a 1.4045 1.416 1.401 1.405 0.4 1.15
b 1.3875 1.375 1.387 1.385 -0.2 -1.25
c 1.387 1.389 1.39 1.39 0.0 0.2
d 1.386 1.397 1.388 1.39 0.2 1.1
e 1.3965 1.382 1.393 1.39 -0.3 -1.45
f 1.4015 1.394 1.399 1.403 0.4 -0.75
g 1.4965 1.5 1.498 1.498 0.0 0.35
h 1.5325 1.535 1.532 1.526 -0.6 0.25
i 1.514 1.514 1.52 1.514 -0.6 0.0
j 1.453 1.43 1.448 1.424 -2.4 -2.3
k 1.415 1.437 1.414 1.431 1.7 2.2
l 1.497 1.475 1.493 1.476 -1.7 -2.2
m 1.368 1.391 1.369 1.39 2.1 2.3
n 1.408 1.385 1.41 1.389 -2.1 -2.3
o 1.3585 1.363 1.358 1.376 1.8 0.45
p 1.431 1.412 1.429 1.409 -2.0 -1.9
q 1.4455 1.447 1.446 1.44 -0.6 0.15
r 1.425 1.428 1.416 1.431 1.5 0.3
abc
d
ef
g
hi
j
kl
m
op q
n

S4. Density Functional Theory Calculations
Computational Details
The electronic structure calculations were performed using density functional theory (DFT) as
implemented in Gaussian 09 package, revision D.019 using B1LYP-40/6-31G(d)+PCM(CH2Cl2)10,11 level
of theory.12 Solvent effects were included using the implicit integral equation formalism polarizable
continuum model (IEF-PCM)13-17 with dichloromethane solvent parameters (ε = 8.93). In all DFT
calculations, ultrafine Lebedev’s grid was used with 99 radial shells per atom and 590 angular points in
each shell. Tight cutoffs on forces and atomic displacement were used to determine convergence in
geometry optimization procedure. Harmonic vibrational frequency calculations were performed for the
optimized structures to confirm absence of imaginary frequencies for equilibrium geometries and presence
of one imaginary frequency for transition state geometries. For each transition state a reaction path along
the intrinsic reaction coordinate (IRC)18 was calculated. For cation radicals, wavefunction stability tests19
were performed to ensure absence of solutions with lower energy. The values of <S2> operator after spin
annihilation were confirmed to be close to the expectation value of 0.75.

Isomerization Pathways
Figure S6. IRC (Intrinsic reaction coordinate) pathway of the M(R) ⇄ M(S) racemization, the structures, isovalue plots of HOMOs (or spin-density) and Gibbs free energies (in kcal/mol) of transition states (TS1, TS2) and intermediates (I) along the pathway for both neutral (left) and cation radical (right).
Table S2. Thermodynamic data for IRC pathway showed in Figure S8 for neutral M.
M(S) TS1 I TS2 M(R)
ΔEelec, kcal/mol 0.0 23.9 9.6 11.8 0.0
ΔG, kcal/mol 0.0 24.5 9.4 12.0 0.0
ΔH, kcal/mol 0.0 23.4 9.5 11.2 0.0
ΔS, cal/mol/K 0.0 -3.6 0.3 -2.6 0.0
Table S3. Thermodynamic data for IRC pathway showed in Figure S8 for M+•.
M(S) TS1 I TS2 M(R)
ΔEelec, kcal/mol 0.0 22.4 7.4 10.7 0.0
ΔG, kcal/mol 0.0 22.8 7.3 11.0 0.0
ΔH, kcal/mol 0.0 21.8 7.3 10.2 0.0
ΔS, cal/mol/K 0.0 -3.4 0.2 -2.8 0.0
Intermediate (I)
I
TS1
TS2
M(S)
M(R)M(S)
I
TS1
TS2
M(R)M(S)
M(R)
0.0 kcal/mol
9.6 kcal/mol
0.0 kcal/mol
Intermediate (I)
M(S)
M(R)
0.0 kcal/mol
7.4 kcal/mol
0.0 kcal/mol
A
B
C
D

Figure S7. IRC (Intrinsic reaction coordinate) pathway of the SANT(R,R) ⇄ SANT(S,S) racemization, the structures, isovalue plots of HOMOs (or spin-density) and Gibbs free energies (in kcal/mol) of transition states (TS1, TS2) and intermediates (I) along the pathway for both neutral (left) and cation radical (right).
Table S4. Thermodynamic data for IRC pathway showed in Figure S9 for neutral SANT.
Syn TS1 I TS2 Anti
ΔEelec, kcal/mol 0.0 26.7 12.3 13.8 2.6
ΔG, kcal/mol 0.0 27.6 12.3 14.3 2.8
ΔH, kcal/mol 0.0 26.1 12.2 13.2 2.6
ΔS, cal/mol/K 0.0 -4.8 -0.4 -3.6 -0.4
Table S5. Thermodynamic data for IRC pathway showed in Figure S9 for SANT +•.
Syn TS1 I TS2 Anti
ΔEelec, kcal/mol 0.0 25.6 10.5 12.8 2.2
ΔG, kcal/mol 0.0 26.4 10.4 13.4 2.4
ΔH, kcal/mol 0.0 24.9 10.4 12.3 2.2
ΔS, cal/mol/K 0.0 -5.0 -0.3 -3.8 -0.8
I
I I
S
S A S
A
0.0 kcal/mol
12.3 kcal/mol
2.6 kcal/mol
S A S
TS1 TS1
TS2 TS2
I I
TS1 TS1
TS2 TS2
A
B
C
D
A2.2 kcal/mol
I10.5 kcal/mol
S0.0 kcal/mol

Figure S8. IRC (Intrinsic reaction coordinate) pathway of the A(R,R) ⇄ A(S,S) racemization, the structures, isovalue plots of HOMOs (or spin-density) and Gibbs free energies (in kcal/mol) of transition states (TS1, TS2) and intermediates (I) along the pathway for both neutral (left) and cation radical (right).
Table S6. Thermodynamic data for IRC pathway showed in Figure S10 for neutral A.
Syn TS1 I TS2 Anti
ΔEelec, kcal/mol 0.0 26.3 12.1 13.7 2.4
ΔG, kcal/mol 0.0 26.9 12.1 14.2 2.5
ΔH, kcal/mol 0.0 25.7 12 13.1 2.4
ΔS, cal/mol/K 0.0 -3.9 -0.2 -3.6 -0.4
Table S7. Thermodynamic data for IRC pathway showed in Figure S10 for A+•
Syn TS1 I TS2 Anti
ΔEelec, kcal/mol 0.0 25.3 10.5 12.8 1.9
ΔG, kcal/mol 0.0 26.0 10.5 13.7 2.1
ΔH, kcal/mol 0.0 24.6 10.5 12.3 1.9
ΔS, cal/mol/K 0.0 -4.9 0.0 -4.6 -0.6
0.0 kcal/mol
12.1 kcal/mol
2.4 kcal/mol
0.0 kcal/mol
10.5 kcal/mol
1.9 kcal/mol
A
B
C
D
I
I I
S
S A S
A
S A S
TS1 TS1
TS2 TS2
I I
TS1 TS1
TS2 TS2
A
I
S
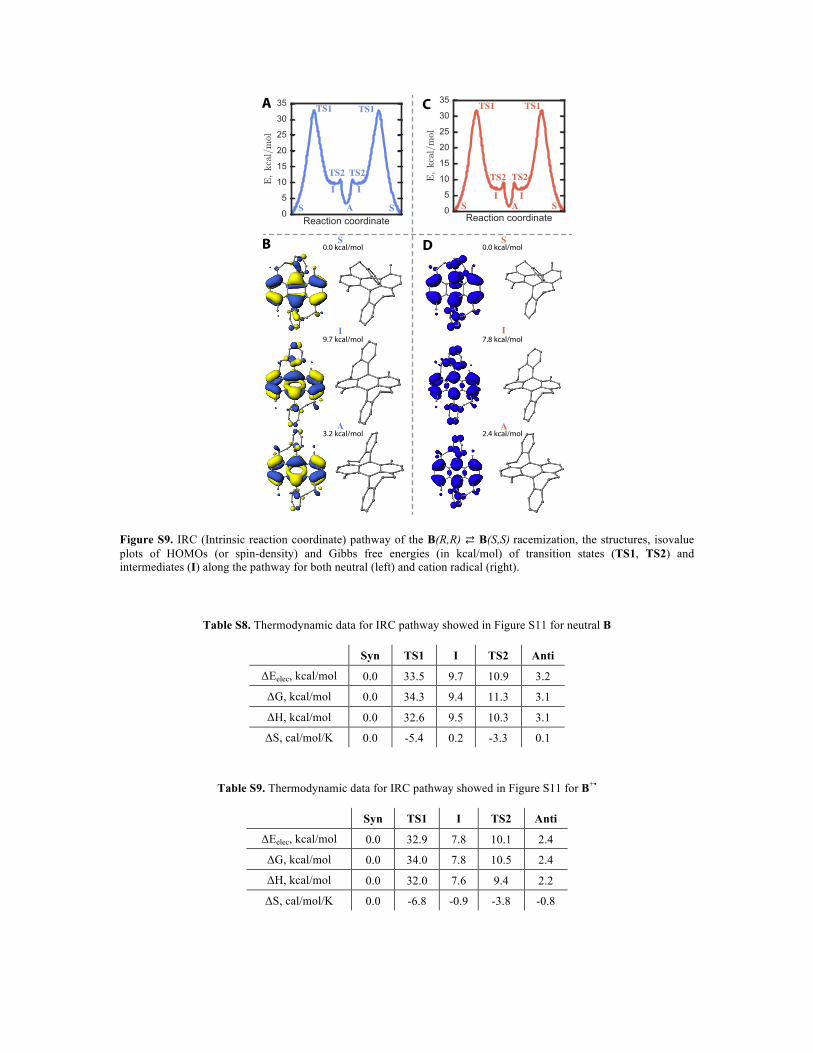
Figure S9. IRC (Intrinsic reaction coordinate) pathway of the B(R,R) ⇄ B(S,S) racemization, the structures, isovalue plots of HOMOs (or spin-density) and Gibbs free energies (in kcal/mol) of transition states (TS1, TS2) and intermediates (I) along the pathway for both neutral (left) and cation radical (right).
Table S8. Thermodynamic data for IRC pathway showed in Figure S11 for neutral B
Syn TS1 I TS2 Anti
ΔEelec, kcal/mol 0.0 33.5 9.7 10.9 3.2
ΔG, kcal/mol 0.0 34.3 9.4 11.3 3.1
ΔH, kcal/mol 0.0 32.6 9.5 10.3 3.1
ΔS, cal/mol/K 0.0 -5.4 0.2 -3.3 0.1
Table S9. Thermodynamic data for IRC pathway showed in Figure S11 for B+•
Syn TS1 I TS2 Anti
ΔEelec, kcal/mol 0.0 32.9 7.8 10.1 2.4
ΔG, kcal/mol 0.0 34.0 7.8 10.5 2.4
ΔH, kcal/mol 0.0 32.0 7.6 9.4 2.2
ΔS, cal/mol/K 0.0 -6.8 -0.9 -3.8 -0.8
0.0 kcal/mol 0.0 kcal/mol
A
B
C
D
9.7 kcal/mol 7.8 kcal/mol
2.4 kcal/mol3.2 kcal/mol
I
I I
S
S A S
A
S A S
TS1 TS1
TS2 TS2
I I
TS1 TS1
TS2 TS2
A
I
S

Figure S10. IRC (Intrinsic reaction coordinate) pathway of the C(R,R) ⇄ C(S,S) racemization, the structures, isovalue plots of HOMOs (or spin-density) and Gibbs free energies (in kcal/mol) of transition states (TS1, TS2) and intermediates (I) along the pathway for both neutral (left) and cation radical (right).
Table S10. Thermodynamic data for IRC pathway showed in Figure S12 for neutral C
Syn TS1 I TS2 Anti
ΔEelec, kcal/mol 0.0 50.3 18.6 18.7 3.9
ΔG, kcal/mol 0.0 51.2 18.6 19.4 4.1
ΔH, kcal/mol 0.0 49.3 18.5 18.1 3.9
ΔS, cal/mol/K 0.0 -6.2 -0.4 -4.3 -0.6
Table S11. Thermodynamic data for IRC pathway showed in Figure S12 for C+•
Syn TS1 I TS2 Anti
ΔEelec, kcal/mol 0.0 41.7 17.0 17.7 3.2
ΔG, kcal/mol 0.0 42.2 16.6 18.3 3.0
ΔH, kcal/mol 0.0 40.5 16.8 17.1 3.1
ΔS, cal/mol/K 0.0 -5.8 0.5 -3.9 0.3
17.0 kcal/mol
0.0 kcal/mol 0.0 kcal/mol
A
B
C
D
18.6 kcal/mol
3.9 kcal/mol 3.2 kcal/mol
I
I I
S
S A S
A
S A S
TS1 TS1
TS2TS2
I I
TS1 TS1
TS2 TS2
A
I
S
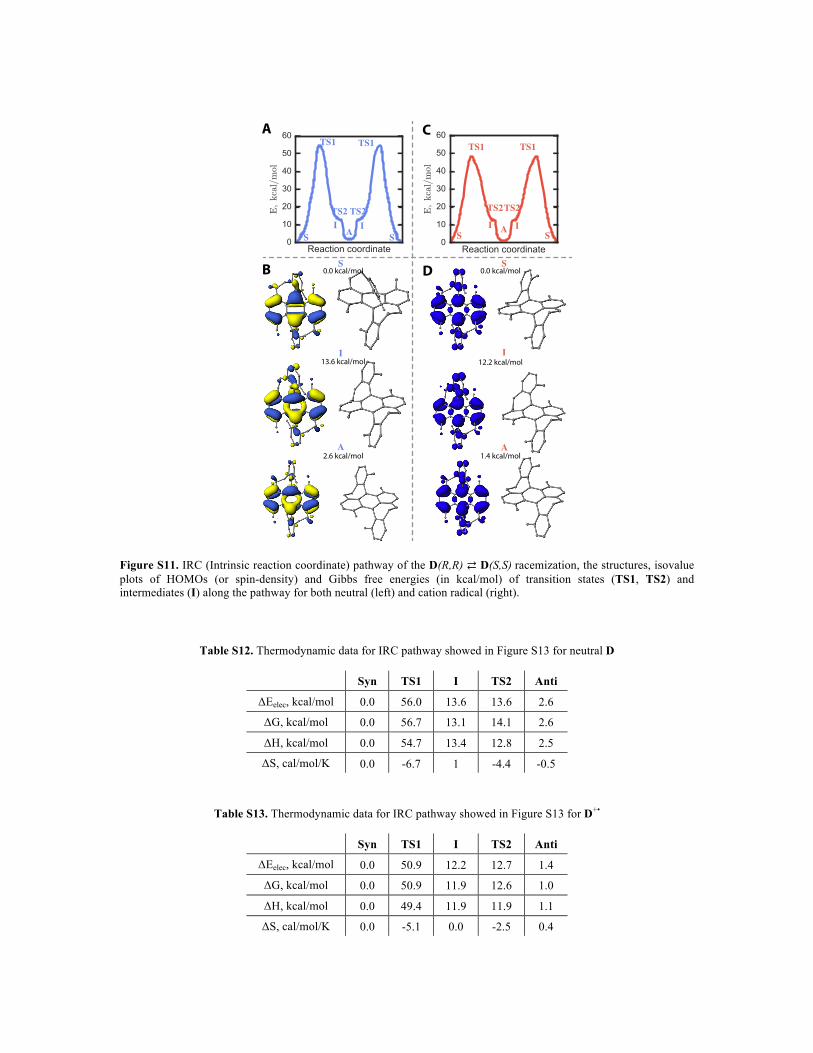
Figure S11. IRC (Intrinsic reaction coordinate) pathway of the D(R,R) ⇄ D(S,S) racemization, the structures, isovalue plots of HOMOs (or spin-density) and Gibbs free energies (in kcal/mol) of transition states (TS1, TS2) and intermediates (I) along the pathway for both neutral (left) and cation radical (right).
Table S12. Thermodynamic data for IRC pathway showed in Figure S13 for neutral D
Syn TS1 I TS2 Anti
ΔEelec, kcal/mol 0.0 56.0 13.6 13.6 2.6
ΔG, kcal/mol 0.0 56.7 13.1 14.1 2.6
ΔH, kcal/mol 0.0 54.7 13.4 12.8 2.5
ΔS, cal/mol/K 0.0 -6.7 1 -4.4 -0.5
Table S13. Thermodynamic data for IRC pathway showed in Figure S13 for D+•
Syn TS1 I TS2 Anti
ΔEelec, kcal/mol 0.0 50.9 12.2 12.7 1.4
ΔG, kcal/mol 0.0 50.9 11.9 12.6 1.0
ΔH, kcal/mol 0.0 49.4 11.9 11.9 1.1
ΔS, cal/mol/K 0.0 -5.1 0.0 -2.5 0.4
0.0 kcal/mol
2.6 kcal/mol
0.0 kcal/mol
1.4 kcal/mol
A
B
C
D
13.6 kcal/mol 12.2 kcal/molI
I I
S
S A S
A
SA
S
TS1 TS1
TS2 TS2I I
TS1 TS1
TS2TS2
A
I
S

Figure S12. Structures of the transition states (TS1) of various SANT derivatives shown in Figure 7 in the manuscript in neutral and cation radical states
A B C D
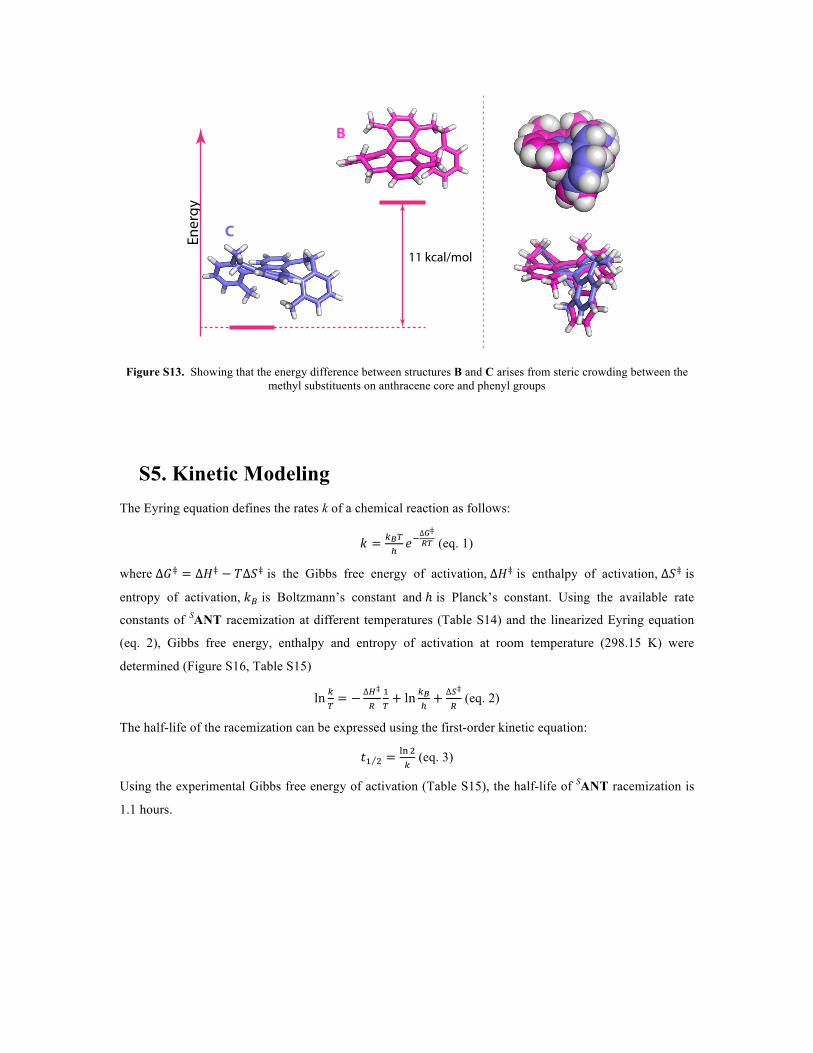
Figure S13. Showing that the energy difference between structures B and C arises from steric crowding between the methyl substituents on anthracene core and phenyl groups
S5. Kinetic Modeling The Eyring equation defines the rates k of a chemical reaction as follows:
𝑘 = !!!!𝑒!
∆!‡!" (eq. 1)
where ∆𝐺‡ = ∆𝐻‡ − 𝑇∆𝑆‡ is the Gibbs free energy of activation, ∆𝐻‡ is enthalpy of activation, ∆𝑆‡ is
entropy of activation, 𝑘! is Boltzmann’s constant and ℎ is Planck’s constant. Using the available rate
constants of SANT racemization at different temperatures (Table S14) and the linearized Eyring equation
(eq. 2), Gibbs free energy, enthalpy and entropy of activation at room temperature (298.15 K) were
determined (Figure S16, Table S15)
ln !!= − ∆!‡
!!!+ ln !!
!+ ∆!‡
! (eq. 2)
The half-life of the racemization can be expressed using the first-order kinetic equation:
𝑡! ! =!"!!
(eq. 3)
Using the experimental Gibbs free energy of activation (Table S15), the half-life of SANT racemization is
1.1 hours.
11 kcal/mol
C
B
Ener
gy
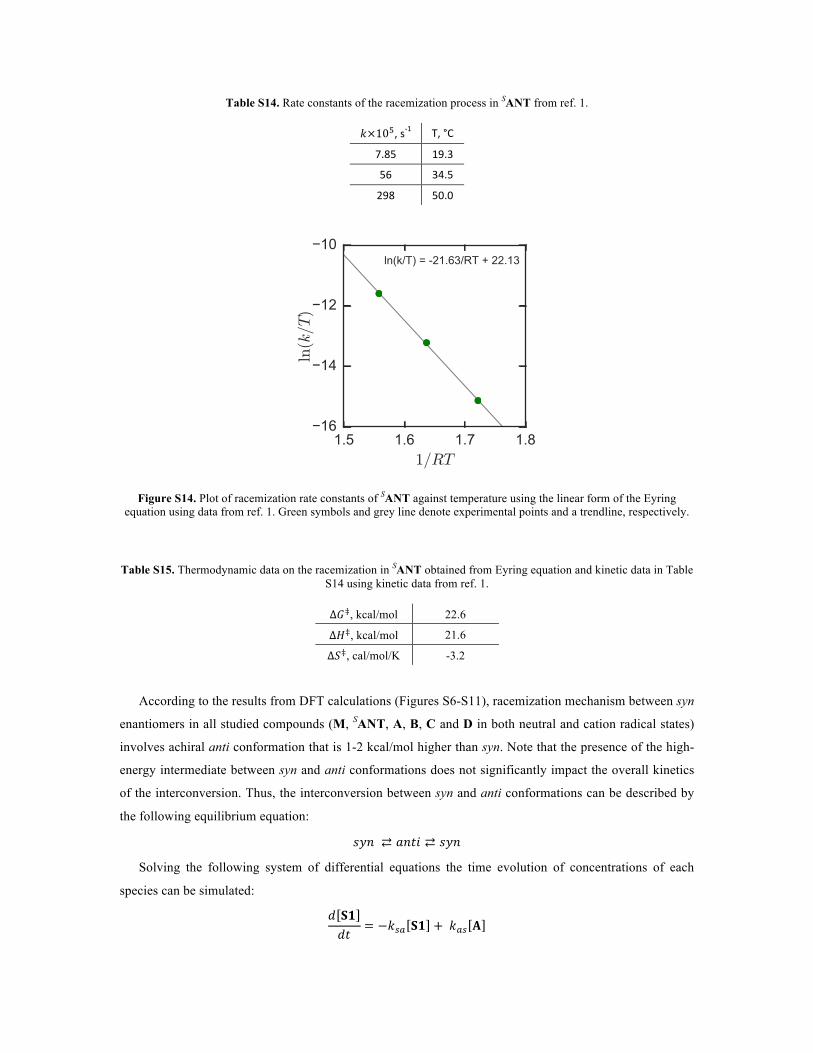
Table S14. Rate constants of the racemization process in SANT from ref. 1.
𝑘×10!,s-1 T,°C
7.85 19.3
56 34.5
298 50.0
Figure S14. Plot of racemization rate constants of SANT against temperature using the linear form of the Eyring equation using data from ref. 1. Green symbols and grey line denote experimental points and a trendline, respectively.
Table S15. Thermodynamic data on the racemization in SANT obtained from Eyring equation and kinetic data in Table S14 using kinetic data from ref. 1.
∆𝐺‡, kcal/mol 22.6
∆𝐻‡, kcal/mol 21.6
∆𝑆‡, cal/mol/K -3.2
According to the results from DFT calculations (Figures S6-S11), racemization mechanism between syn
enantiomers in all studied compounds (M, SANT, A, B, C and D in both neutral and cation radical states)
involves achiral anti conformation that is 1-2 kcal/mol higher than syn. Note that the presence of the high-
energy intermediate between syn and anti conformations does not significantly impact the overall kinetics
of the interconversion. Thus, the interconversion between syn and anti conformations can be described by
the following equilibrium equation:
𝑠𝑦𝑛 ⇄ 𝑎𝑛𝑡𝑖 ⇄ 𝑠𝑦𝑛
Solving the following system of differential equations the time evolution of concentrations of each
species can be simulated:
𝑑 𝐒𝟏𝑑𝑡
= −𝑘!" 𝐒𝟏 + 𝑘!" 𝐀

𝑑 𝐀𝑑𝑡
= 𝑘!" 𝐒𝟏 − 2 𝑘!" 𝐀 + 𝑘!" 𝐒𝟐
𝑑 𝐒𝟐𝑑𝑡
= −𝑘!" 𝐒𝟐 + 𝑘!" 𝐀
where rate constants 𝑘!" and 𝑘!" between syn and anti conformations can be determined from the Eyring
equation at room temperature.
Figure S15. Effect of the intermediates on the kinetics of the racemization process in SANT.
Table S16. Computed activation energies of racemization (ΔG‡, kcal/mol) and racemization half-lives (t1/2) of SANT derivatives scaled to reproduce experimentally observed activation energy of SANT (ref. 1).
Compound ΔG‡, kcal/mol t1/2 SANT 22.6 1.1 h
M 19.5 22 s
A 21.9 0.4 h
B 29.3 10.6 y
C 46.2 2.6×10¹³ y
D 51.7 2.8×10²¹ y
Mol
e Fr
actio
n
synsyn
synsyn
antianti int. int.
Mol
e Fr
actio
n
with intermediates without intermediates

Figure S16. Interplanar angles between phenylene moieties (shaded green) of the anthracene cores in SANT and SANT
+• crystal structures.
Table S17. Imaginary frequencies (cm-1) of the transition states of various ANT derivatives
Neutral Cation radical
TS1 TS2 TS1 TS2
M -112.5 -143.9 -133.5 -155
ANT -75.3 -127.4 -89.7 -141.4
A -70.3 -128.5 -91.2 -141.7
B -55.1 -113.3 -54.8 -129
C -55 -82.5 -45.3 -116.7
D -32.4 -40.3 -49.1 -114.4
S6. References (1) I. Agranat, M. R. Suissa, S. Cohen, R. Isaksson, J. Sandström, J. Dale, and D. Grace, Chem. Comm.
1987, 381.
(2) I. Agranat, S. Cohen, R. Isaksson, J. Sandstroem, and M. R. Suissa, J. Org. Chem. 1990, 55, 4943.
(3) R. Rathore, C. L. Burns, and M. I. Deselnicu, Org. Synth. 2005, 1.
(4) R. Rathore and J. K. Kochi, Acta. Chem. Scand. 1998, 52, 114.
(5) R. Rathore, C. L. Burns, and M. I. Deselnicu, Org. Lett. 2001, 3, 2887.
(6) R. Rathore and J. K. Kochi, Acta. Chem. Scand. 1998, 52, 114.
(7) M. R. Talipov, A. Boddeda, M. M. Hossain, and R. Rathore, J. Phys. Org. Chem. 2015, 29, 227.
(8) M. R. Talipov, M. M. Hossain, A. Boddeda, K. Thakur, and R. Rathore, Org. Biomol. Chem. 2016,
14, 2961.
(9) Frisch, M. J.; Trucks, G. W.; Schlegel, H. B.; Scuseria, G. E.; Robb, M. A.; Cheeseman, J. R.;
Scalmani, G.; Barone, V.; Mennucci, B.; Petersson, G. A.; Nakatsuji, H.; Caricato, M.; Li, X.; Hratchian,
H. P.; Izmaylov, A. F.; Bloino, J.; Zheng, G.; Sonnenberg, J. L.; Hada, M.; Ehara, M.; Toyota, K.; Fukuda,
R.; Hasegawa, J.; Ishida, M.; Nakajima, T.; Honda, Y.; Kitao, O.; Nakai, H.; Vreven, T.; Montgomery, J.
A.; Peralta, J. E.; Ogliaro, F.; Bearpark, M.; Heyd, J. J.; Brothers, E.; Kudin, K. N.; Staroverov, V. N.;
Kobayashi, R.; Normand, J.; Raghavachari, K.; Rendell, A.; Burant, J. C.; Iyengar, S. S.; Tomasi, J.; Cossi,
M.; Rega, N.; Millam, J. M.; Klene, M.; Knox, J. E.; Cross, J. B.; Bakken, V.; Adamo, C.; Jaramillo, J.;
Gomperts, R.; Stratmann, R. E.; Yazyev, O.; Austin, A. J.; Cammi, R.; Pomelli, C.; Ochterski, J. W.;
Martin, R. L.; Morokuma, K.; Zakrzewski, V. G.; Voth, G. A.; Salvador, P.; Dannenberg, J. J.; Dapprich,
S.; Daniels, A. D.; Farkas; Foresman, J. B.; Ortiz, J. V.; Cioslowski, J.; Fox, D. J. Gaussian, Inc.,
Wallingford CT, 2009.
(10) W. J. Hehre, R. Ditchfield, and J. A. Pople, J. Chem. Phys. 1972, 56, 2257.
(11) C. Adamo and V. Barone, Chem. Phys. Lett. 1997, 274, 242.
(12) M. R. Talipov, A. Boddeda, Q. K. Timerghazin, and R. Rathore, J. Phys. Chem. C. 2014, 118,
21400.
(13) J. Tomasi, B. Mennucci, and R. Cammi, Chem. Rev. 2005, 105, 2999.
(14) S. Miertu\vs, E. Scrocco, and J. Tomasi, Chem. Phys. 1981, 55, 117.
(15) M. Cossi, V. Barone, B. Mennucci, and J. Tomasi, Chem. Phys. Lett. 1998, 286, 253.
(16) E. Cances, B. Mennucci, and J. Tomasi, J. Chem. Phys. 1997, 107, 3032.
(17) R. F. Ribeiro, A. V. Marenich, C. J. Cramer, and D. G. Truhlar, J. Phys. Chem. B. 2011, 115,
14556.
(18) K. Fukui, Acc. Chem. Res. 1981, 14, 363.
(19) R. Bauernschmitt and R. Ahlrichs, J. Chem. Phys. 1996, 104, 9047.