Contentsjkpdd.gov.in/pdf/yearbookpdd2013.pdf · 3.3 Details of 132/33 kV 7UDQVIRUPDWLRQ&DSDFLW\LQ...
151
Transcript of Contentsjkpdd.gov.in/pdf/yearbookpdd2013.pdf · 3.3 Details of 132/33 kV 7UDQVIRUPDWLRQ&DSDFLW\LQ...

Contents
CHAPTER-1
An Account of Growth of Power Sector in J&K State.
1.1 Chronology of important events in J&K State…………………………............................................................6-13
CHAPTER-2 Organizational Structure, Profile and Details of Manpower
2.1 Organizational Structure……………………………………………………………………………………………...14
2.2 Profile of Various Wings of Power Development Department……………………………………………………15-16
2.3 Organizational Structure of M&RE Wing, Kashmir…………………………................................................... .17
2.4 Organizational Structure of M&RE Wing, Jammu………………...………………………………….……………18
2.5 Organizational Structure of M&RE Wing, Ladakh………………...………………………………….…………… 18 (a)
2.6 Organizational Structure of S&O Wing, Kashmir……………………………………………………..……………19
2.7 Organizational Structure of S&O Wing, Jammu ……………………………………………………..…………….20
2.8 Organizational Structure of Planning & Design Wing, Jammu…………………………………………………....20
2.9 Organizational Structure of Procurement & Material Management Wing………………………………………..21
2.10 Organizational Structure of Commercial & Survey wing …………………………………………………..……..21
2.11 Organizational Structure of Director TTIC………………………………………………………………………… 22 2.12 Year Wise Statement of No. of Employees………………………………………………...................................23 2.13 Category Wise Sanctioned/Existing Strength of PDD Employees..………………………….………………….24-26
CHAPTER-3 Infrastructure Available 3.1 Abstract of Transformation Capacity & Line Length in J&K State……………………………………………… 27
3.2 Details of 220/132kV Transformation Capacity in Jammu & Kashmir Regions………………………….…… 28
3.3 Details of 132/33kV Transformation Capacity in Kashmir Region……………………………………………. 29-30
3.4 Details of 132/33kV Transformation Capacity in Jammu Region………………………………………………31-32
3.5 Details of Transmission Lines at 220kV Level in Jammu & Kashmir Regions…………………………………33
3.6 Details of Transmission Lines at 132kV Level in Kashmir Region…………..………….……………….……… 34
3.7 Details of Transmission Lines at 132kV Level in Jammu Region………………………………………………...35 3.8Assets of Power Grid Corporation of India under operation in J&K……………..…………………………… 36-38
Page 2
3.9 Circle-wise HL/LT Ratio at Distribution Level ………………….…………….....................................................39
3.8 Capacity Wise list of 66/ 33/11/6.6 kV R/Stations of M&RE Wing Jammu……………………………………. .40-49
3.9 Capacity Wise list of 33/11/6.6kV Sub Stations in EM&RE Wing, Kashmir…………………………………….50-58
CHAPTER-4
Electric Power- Installed Capacity, Its Availability & Consumption 4.1 Electric Power-Installed Generating Capacity & Hydel Projects in Operation under
State & Central Sector........................ …………………………………………………………………………..59-60
4.2 Upcoming Power Plants under State and Central Sector…………………………………………………….61-62
4.3 Generation in Ladakh Region (Owned by JKPDD)……………………………………………………………..63
4.4 List of the DG Sets with Installed Capacities in Leh District………………………………………. ………….64-65
4.5 List of the DG Sets with Installed Capacities in Kargil District…………………………………………………66-67
4.6 List of the DG Sets with Installed Capacities in Keran, Gurez& Machil……………………………………..…68
4.7 Entitlement from CPSUs and Other External Sources………………………… ……………………………....69-70
4.8 Demand and Availability Scenario (POWER)………………………………... ……………………………….. 10
4.9 Demand and Availability Scenario (ENERGY)……………………………….................................................72
4.10 Seasonal Power Deficit…………………………………………………………………………….......................73
4.11 Year-wise Statement of Energy Consumption…………………………………………………………………...74
4.12 Year-wise Statement of Energy Purchased from Northern Grid …………………………………………….…75
4.13 Year-wise Statement of Self Generated Energy of State available to PDD……………………………… ….76
4.14 Gross Per Capita Power Consumption of J&K…………………………………………………………………...77
4.15 Average Cost of Supply (ACS), Average Revenue Realized (ARR) and AT&C Losses ……………………78-79
4.16 Bifurcation of Transmission and Distribution Losses for 2010-11………………………………………………80
Page 3

CHAPTER-5
Electricity Consumers, Connected Load and Revenue Realization and Arrears 5.1 Category wise Number of Consumers as on 31-3-2012.………………………………………………………...81
5.2 Category wise Consumption for 2010-12…………………………………………………………………………..82
5.3 Category wise Connected Load (in MWs) ………………….…………………………………………………….83
5.4 Metering Status upto 31-3-2012.…………………………………………………………………………………....84
5.5 Year wise Revenue Realization……………………………………………………………………………………..85
5.6 Category wise Revenue Realized for the period 2009-10 to 2011-12 in J&K..………………………………...86
5.7 Category wise Revenue Realized for 2009-10 to 2011-12 in respect of EM&RE wing Jammu …………….87
5.8 Category wise Revenue Realized for 2009-10 to 2011-12 in respect of EM&RE wing Kashmir …………….88
5.9 Category wise Subsidy Component 2011 12....................................................................... .89
5.10 Arrears of Non Govt. and Govt. Consumers from 2002-03 to 11-12 ……………………….…………………… 90
CHAPTER-6
Schemes under Implementation 6.1 RGGY Schemes……………………………………………………………………………………………………….91
6.2 Districts wise REC Sanctioned/Approved Cost, Amount Released By REC, Expenditure under RGGVY....92
6.3 Physical Progress report ending 3/2012 under RGGVY ………………………………………………………….93
6.4 Restructured Accelerated Power Development and Reforms Programme (APDRP)………………………..94-96
6.5 Progress of R- APDRP ………………………………....……………………………………………………… ..97-100
6.6 Hon’ble Prime Ministers Reconstruction Programme………………………………………………..… ……….101
6.7 New / Augmentation of Grid Station in Jammu & Kashmir Divisions…………………………….………... …..102
6.8 Achievement Ending 03/2012……………………………………………………………………………………….103-104
Page 4
CHAPTER-7
Power Sector Reforms 7.1 Performance of Distribution Sector…………………………………..…………………………..……………106-106
7.2 Performance Report 2012-13……………………………………………………………………….…. ……..107-108
CHAPTER-8
STANDARD CONSTRUCTION PRACTICES & TECHNICAL DATA FOR SUB-TRANSMISSION & DISTRIBUTION WORK
8.1 Recommended Type & Size of Multi core Cables/Single Core Cables ……………………………………...110-111
8.2 Current Rating of Distribution & Power transformers………………………………………………..…….…….112
8.3 Fuse ratings………………………………………………………………………………………………….. ….….113
8.4 CT Ratios applicable for HT/LT Metering………………………………………………………………………….114
8.5 Economic Design for Pre stressed Concrete Poles……………………………………………………….……...115
8.6 Specification of Swaged Type Steel Tubular Poles(IS 2713)……………………………………...…………….116-117
8.7 Weight per meter for various types of steel…………………………………………………………....................118
8.8 Rating of Capacitors for KVAR Compensation…………………………………………………………………….119
8.9 Extract from Record Note of meetings of KEECC………………………………………….. ……………………120-123
8.10 General guide Lines for execution of electrical works………………………………………………………124-136
8.11 Construction Drawings for X arms, Substation-frame etc……………………………………….…………… 137-150
Page 5

Chapter-1
An Account of Growth of Power Sector in J&K State.
The State of Jammu & Kashmir is located in the Extreme North of India and is bound on the North by China and on the
South by Himachal Pradesh and Punjab and on the west by Pakistan. The State has a Population of 1,25,48,926with
20,15,088 households (14,97,920 rural and 5,17,168 urban)as per 2011 Census.
The state is traversed by three main rivers i.e. Indus, Jhelum and Chenab. The Indus traverses through Ladakh, while
the Jehlum flows through Kashmir and Chenab drains Jammu.
The average rainfall is about 100 Cms.
There are huge Glaciers in the state and the existence of high mountains with glaciers and rainfall makes it haven for
hydel generation.
As per preliminary survey an estimated potential of 16400 MWs of power has already been identified while the actual
potential is much more.
The state of Jammu and Kashmir was the second, next only to the state of Mysore State in having Hydro Power, as far
back as the 1st decade of this Century.
Page 6

1.1 CHRONOLOGY OF IMPORTANT EVENTS IN J&K POWER SYSTEM
1905
4×1 MVA,2.3KV, 25 Hz Mohra Power Project commissioned
Head 430 feet (131 mtrs.), Pelton Wheel Turbine.
2nd in India after Mysore
Constructed by General Electric (GE), America
Commissioned in 1905, Moharra Power Station served to light thousands of Kashmiri homes besides a small number of
small industrial units comprising rice huskers, flour and oil grinders, bandsaws, silk reeling, weaving, spinning and the like. The
only available route to KashmirValley those days was Jhelum Valley road ( Muzzafarabad road) along the banks of river
Jhelum. Heavy equipments could be easily transported to Mohra on this road. No formal transport was available other than
some horse driven carts and the only navigable area at that time was from Khannabal to Khadinyar.
25 Hz, AC power generated at 2300 Volts was stepped upto 30 kV for its transmission to Sopore, Braramulla and Srinagar.
30/2.3 kV Receiving Sub Stations were in operation at Silk Factory and Narwara in Srinagar, at Amargarh in Sopore and in
Baramulla. 2.3 kV Supply was also available at Pampore, Pattan, Tangmarg and Gulmarg.
Mohra was the only source of power supply in Kashmir Valley till the year 1955. In June,1955, 2x3 MW Ganderbal Hydel
Project was Commissioned. The Mohora however continued generating till July 1959 when it was struck by the unprecedented
floods in Jhelum. The flood waters hit thepower plant, shearing its building longitudinally into two halves.
1948
Work started for construction of Ganderbal Power Plant
The Sindh Valley Multipurpose Project with its power plant at Ganderbal had been investigated in the forties. Civil works were
entrusted to the Irrigation Department while its electric works were to be done by the then Electrical and Mechanical
Department. Construction of Civil Works had been taken in hand in 1948. The electro-mechanical plant of 2x3 MW Capacity
was ordered from M/s Associated Electrical IndustriesCalcutta who supplied theElectrical Equipment of M/s Metropolitan
Vickers and matching Hydro Equipment made by Escherwyss, Switzerland.
Page 7

1954
Electrification in Anantnag, Khanabal, Bijbehara and Awantipora town started.
Extension of 33 kV transmission line from Srinagar to Anantnag.
66 kV line (on wooden poles) from Pathankote (Punjab) Grid station to Canal (Jammu) sub station was commissioned.
A real boost to power availability in the state.
1955
Ganderbal Project commissioned by the then President of India, Dr Rajendra Prasad.
Srinagar city was divided into two Zones , Zone 1 receiving 25 Hz, 230 V, 3Ø supply from Mohra and zone 2 receiving 50
Hz, 400-230 V, 3Ø supply from Ganderbal .
1957
A project report for adding 9 MW to Ganderbal Project was approved.
Mohra Power project was revived and its frequency was changed from 25 Hz to 50 Hz in order to meet the problem of
severe over loading .
1961
Additional 9 MW Units of Ganderbal project commissioned.
Old Mohra closed and abandoned.
Ganderbal was the lone source of power
1962
New Mohra (9MW) commissioned and synchronized through 66 kV over headline (on wooden poles) with Ganderbal.
Local Grid to which two sources were connected came into existence for the first time in the state. (It was an extremely
exciting event for the Engineers).
New 66kV transmission line from Sarna (Punjab) to Canal Sub Station (Jammu) on steel poles was commissioned.
New transmission line from Samba to Gladni
Page 8
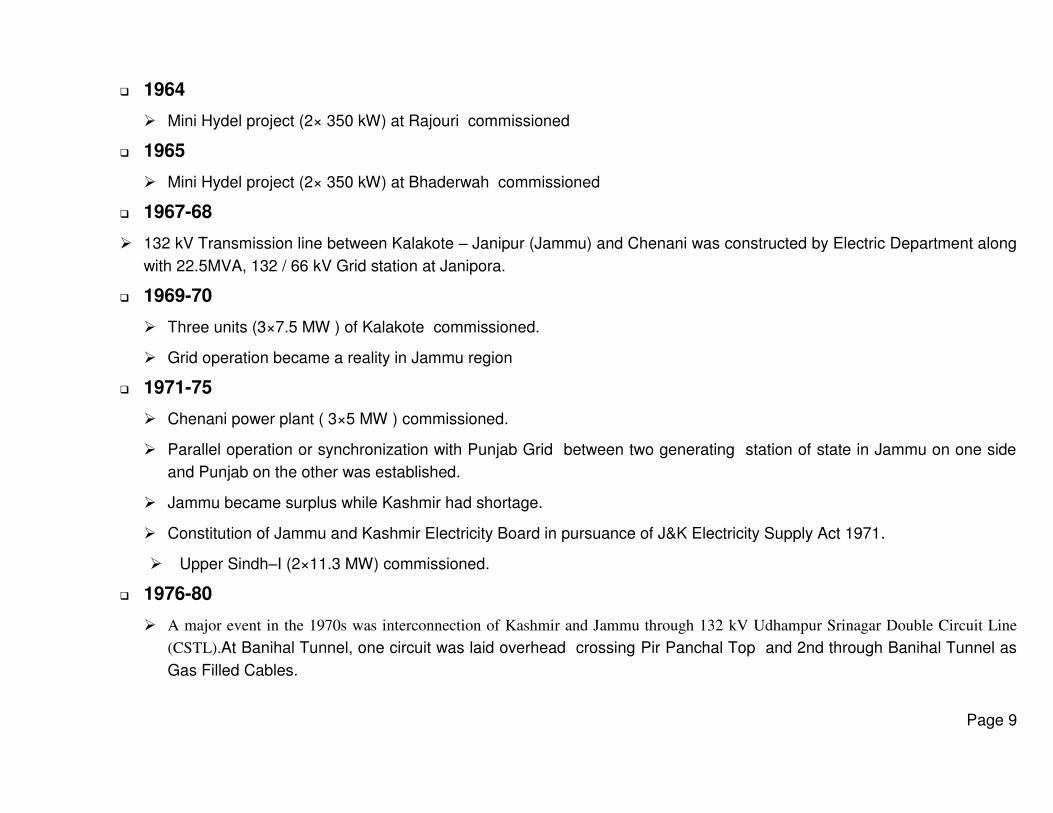
1964
Mini Hydel project (2× 350 kW) at Rajouri commissioned
1965
Mini Hydel project (2× 350 kW) at Bhaderwah commissioned
1967-68
132 kV Transmission line between Kalakote – Janipur (Jammu) and Chenani was constructed by Electric Department along
with 22.5MVA, 132 / 66 kV Grid station at Janipora.
1969-70
Three units (3×7.5 MW ) of Kalakote commissioned.
Grid operation became a reality in Jammu region
1971-75
Chenani power plant ( 3×5 MW ) commissioned.
Parallel operation or synchronization with Punjab Grid between two generating station of state in Jammu on one side
and Punjab on the other was established.
Jammu became surplus while Kashmir had shortage.
Constitution of Jammu and Kashmir Electricity Board in pursuance of J&K Electricity Supply Act 1971.
Upper Sindh–I (2×11.3 MW) commissioned.
1976-80
A major event in the 1970s was interconnection of Kashmir and Jammu through 132 kV Udhampur Srinagar Double Circuit Line
(CSTL).At Banihal Tunnel, one circuit was laid overhead crossing Pir Panchal Top and 2nd through Banihal Tunnel as
Gas Filled Cables.
Page 9

Advantages resulting from this interconnection:
Boosted generation Capability.
Stabilized the supply frequency.
Reliable Power Supply.
Increased efficiency of the system.
Faults reduced to a large extent.
Formation of POWER DEVELOPMENT DEPARTMENT headed by the Commissioner and Secretary to Govt.
1981-84
2X120 MVA, 220/132kV Grid Sub Station at Udhampur Commissioned.
1985-1990
120MVA, 220/132kV and 2X20 MVA, 132/33kV Grid Sub Station at Gladni (Jammu) commissioned on energization of
single circuit Sarna – Gladni Transmission Line.
Salal HEP (Phase-I) of 345 MW commissioned in 1987.
Stakna (4 MW) at Leh commissioned.
Salal - Gladni 220 kV Single Circuit Transmission line no. 1 and line no. 2 energized.
Gladni - Miran Sahib 132 kV Double Circuit line and Grid Sub Station at Bari Brahamna and Miran Saheb
commissioned.
35 MVAR Shunt at Pampore (supplied by Crompton & Greaves).
Series Capacitor Bank at Wanpoh (supplied by BHEL). These measures were taken to increase the transmission
capacity of 132 kV CSTL from 60 MW to 155 MW.
With the Commissioning of Salal( HEP) which was thought to make up for the power deficit of the Kashmir Valley also,
department felt handicapped because in spite of surplus power in Jammu region there was no adequate transmission
facilities to Kashmir Valley in addition to Udhampur-Bemina 132-KV line, which could not carry more than 70 MW , while
as deficit in the valley was around 300 MW.
Page 10

To overcome this problem, various options were considered like
Reactive compensation (installation of 33 kV shunt capacitors at various Grid Stations and Series compensation
(Installation of Series Capacitor bank) of the line.
Changing this Double Circuit line to HVDC link, a study was undertaken by the Department and the choice fell on
Compensation.
To manage the peak load by reviving Bemina Diesel or Gas Turbine.
Lower Jhelum Hydel Project (105 MW ) was commissioned.
1990-2000
Karnah HEP (2 MW) commissioned in 1991.
220kV Double Circuit Kishenpore – Pampore Transmission Line (KPTL) commissioned in 1996 to overcome
constraints in power transmission to Kashmir Valley.
345 MW Salal-II, commissioned in 1998.
220 kV Double Circuit Kishenpore – Pampore Transmission Line (KPTL) commissioned in 1996 to overcome
constraints in Power Transmission to Kashmir Valley. 220/132 kV Pampore Grid Station Commissioned in 1996.
220/132/33 kV Grid station at Zainakote commissioned in 1998.
480 MW, Uri-I alongwith its transmission system viz. 630MVA, 400/220 kV Wagoora Grid Sub Station and 400kV Uri-
Wagoora line commissioned in 1997.
2001-2011
USHP-II, 105 MW Power Project commissioned at Kangan
400 kV Inter-regional Transmission Line between Kishenpur and Srinagar commissioned by PGCIL
First ever Tariff Order for electricity determined and issued by JKSERC in March 2007.
J&K PDD launched its website under URL:in 2007.
Page 11

390 MW Dulhasti Power Plant commissioned in 2007.
450 MW Baglihar HEP commissioned in October, 2008.
Computerized billing of consumers of Jammu & Srinagar city completed in 2007-08.
160 MVA,220/132 kV Barn Grid Sub Station commissioned in 2008.
100MVA 132/33KV Grid station Bari-Brahmana-II Commissioned in 2008
20 MVA , 132/33 kV Draba Grid Station commissioned in 2008.
50MVA132/33 kV Grid Station Khanmoh Commissioned in April-2009
50 MVA 132/33 kV Gangyal Grid Station Commissioned in March-2009
50MVA132/33 kV Grid Station Tethar Commissioned in Oct -2009
50MVA132/33 kV Grid Station Mahanpur Commissioned in Aug -2009
Second Tariff Order for electricity issued by JKSERC in Sep.2009.
Third Tariff Order issued by SERC in April 2010
Electricity Act 2010 notified by GoJ&K in April 2010
120 MWs HEP SEWA II on Ravi Basin commissioned in September 2010.
2011-2013
320 MVA,220/132 Grid station Mirbazzar commissioned in 12/2011
320 MVA+100MVA,220/132/33 Grid station Budgam commissioned in 12/2011
320 MVA+100MVA,220/132/33 Grid station Bishnah commissioned in 2011
120 MVA+20MVA,220/132/33 Grid station Ramban commissioned in 2011
50MVA 132/33kV Grid station Lissar commissioned in 5/12/-2011
50MVA 132/33kV Grid station Vilgam commissioned in 02/2011
50MVA 132/33kV Grid station Magam commissioned in 02/2012
Page 12

50MVA 132/33kV Grid station Katra commissioned in 2011
20MVA 132/33 kVGrid station Chandak commissioned in 2/2012
50MVA 132/33kV Grid station Pounichak commissioned in 2/2012
1.26 MWHEP Sanjak on Indus Basin commissioned in September 2011.
4thTariff Order issued by SERC in April 2012
20MVA 132/33kVJourianGrid Sub Station Commissioned in 2012
50MVA 132/33kV Shopian Grid Sub Station Commissioned in 3/2013
3-year Multiyear tariff from 2013-14 to FY2015-16 filed and tariff order for 2013-14 (5thTariff Order)
issued by SERC in April 2013
Page13
Chapter-2
Organizational Structure, profileand Details of Manpower
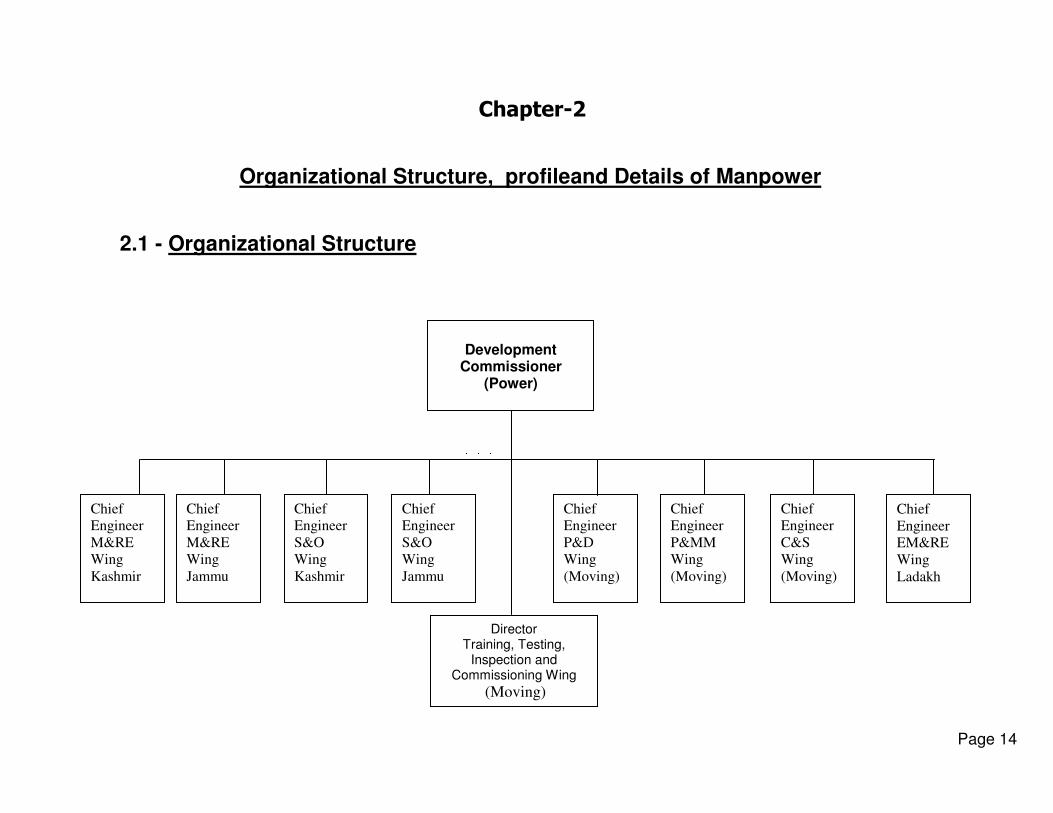
2.1 - Organizational Structure
Page 14
Chief
Engineer
M&RE
Wing
Kashmir
Chief
Engineer
M&RE
Wing
Jammu
Chief
Engineer
S&O
Wing
Kashmir
Chief
Engineer
P&MM
Wing
(Moving)
Chief
Engineer
C&S
Wing
(Moving)
Chief
Engineer
S&O
Wing
Jammu
Chief
Engineer
P&D
Wing
(Moving)
Director Training, Testing,
Inspection and Commissioning Wing
(Moving)
Development
Commissioner (Power)
Chief
Engineer
EM&RE
Wing
Ladakh
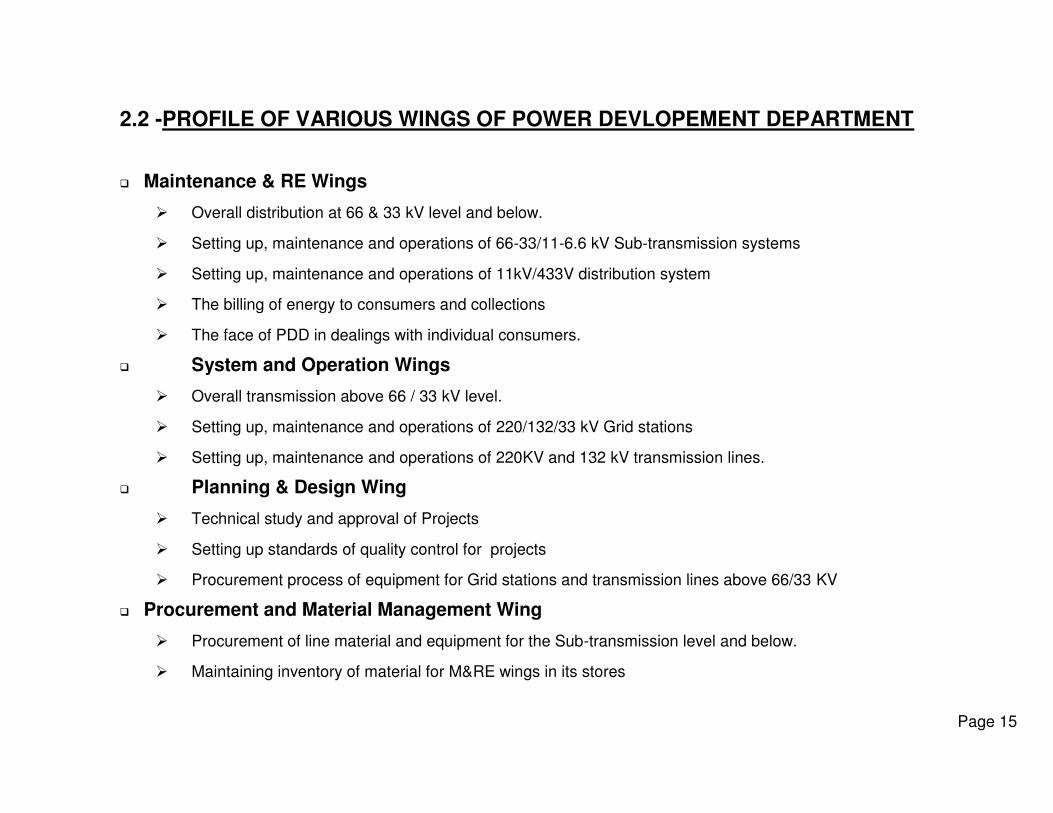
2.2 -PROFILE OF VARIOUS WINGS OF POWER DEVLOPEMENT DEPARTMENT
Maintenance & RE Wings
Overall distribution at 66 & 33 kV level and below.
Setting up, maintenance and operations of 66-33/11-6.6 kV Sub-transmission systems
Setting up, maintenance and operations of 11kV/433V distribution system
The billing of energy to consumers and collections
The face of PDD in dealings with individual consumers.
System and Operation Wings
Overall transmission above 66 / 33 kV level.
Setting up, maintenance and operations of 220/132/33 kV Grid stations
Setting up, maintenance and operations of 220KV and 132 kV transmission lines.
Planning & Design Wing
Technical study and approval of Projects
Setting up standards of quality control for projects
Procurement process of equipment for Grid stations and transmission lines above 66/33 KV
Procurement and Material Management Wing
Procurement of line material and equipment for the Sub-transmission level and below.
Maintaining inventory of material for M&RE wings in its stores
Page 15

Commercial and Survey Wing
Power Purchases
Scheduling at merit order
Power arrangements under exchange with other states and agencies.
Setting up, maintenance and operations of Communication network between different Grids and power plant
Enforcement of power curtailments as per schedule for strict grid discipline
Managing operations of the SLDC and Sub LDC
Testing of Electric Protection for all electric installations
Training, Testing, Inspection and Commissioning Wing
Arranging training for the staff
Technical Inspection of all new electric installations before their commissioning
Setting Standards for Electric Contractors and issuing licenses after assessing their abilities
Technical Investigation of all electric accidents
Electrical testing and commissioning .
Page 16
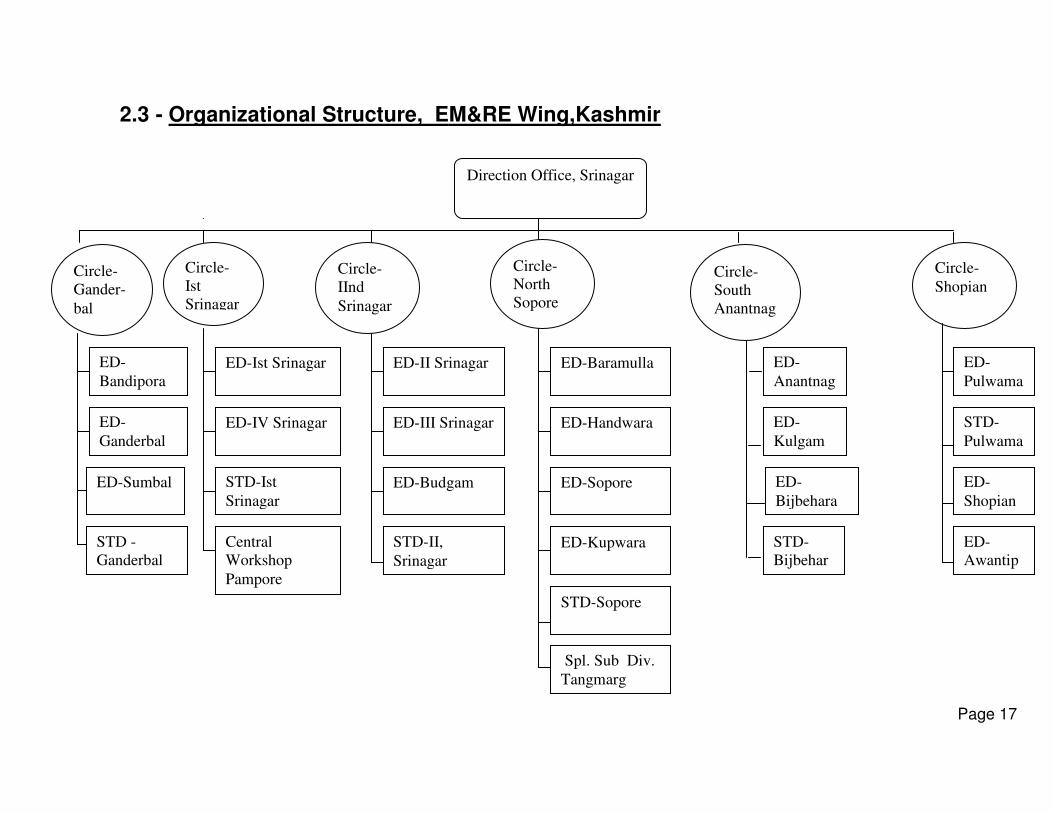
2.3 - Organizational Structure, EM&RE Wing,Kashmir
Page 17
Circle-
Ist
Srinagar
Circle-
IInd
Srinagar
Circle-
North
Sopore
ED-Ist Srinagar
ED-IV Srinagar
STD-Ist
Srinagar
Central
Workshop
Pampore
ED-II Srinagar
ED-III Srinagar
ED-Budgam
STD-II,
Srinagar
ED-Baramulla
Circle-
South
Anantnag
ag
ED-Handwara
ED-Sopore
STD -
Ganderbal
STD-Sopore
ED-
Anantnag
ED-
Kulgam
ED-
Bijbehara
STD-
Bijbehar
a
Direction Office, Srinagar
Circle-
Shopian
ED-
Pulwama
STD-
Pulwama
ED-
Shopian
ED-
Awantip
oooraa
Circle-
Gander-
bal
ED-
Bandipora
ED-
Ganderbal
ED-Sumbal
ED-Kupwara
Spl. Sub Div.
Tangmarg
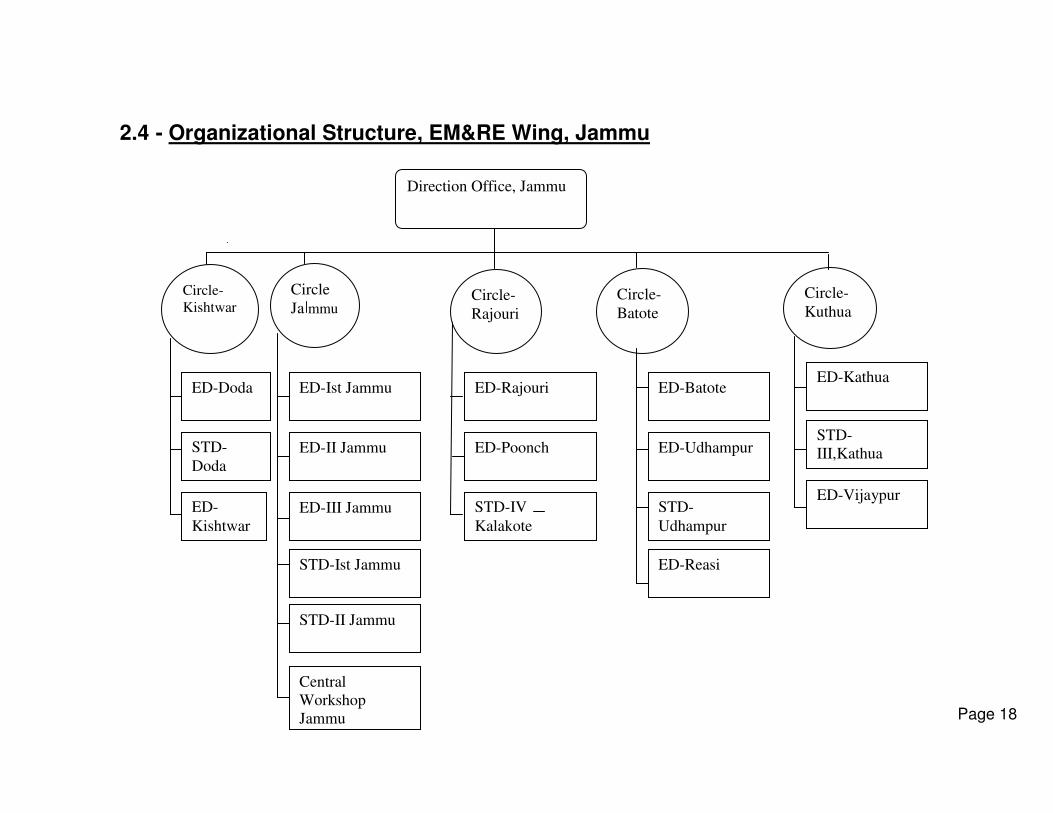
2.4 - Organizational Structure, EM&RE Wing, Jammu
Page 18
Circle
Ja mmu Circle-
Rajouri
Circle-
Batote
ED-Ist Jammu
ED-II Jammu
ED-III Jammu
STD-Ist Jammu
ED-Rajouri
ED-Poonch
ED-Batote
ED-Udhampur
STD-
Udhampur
STD-II Jammu
STD-IV
Kalakote
Direction Office, Jammu
Circle-
Kuthua
ED-Vijaypur
STD-
III,Kathua
ED-Kathua
Circle-
Kishtwar
ED-Doda
STD-
Doda
ED-
Kishtwar
ED-Reasi
Central
Workshop
Jammu

Organizational Structure, EM&RE Wing, Ladakh
Page 18 (a)
ED, Leh
STD Leh
ED Kargil
STD Kargil
Chief Engineer Ladakh
Circle-
Leh
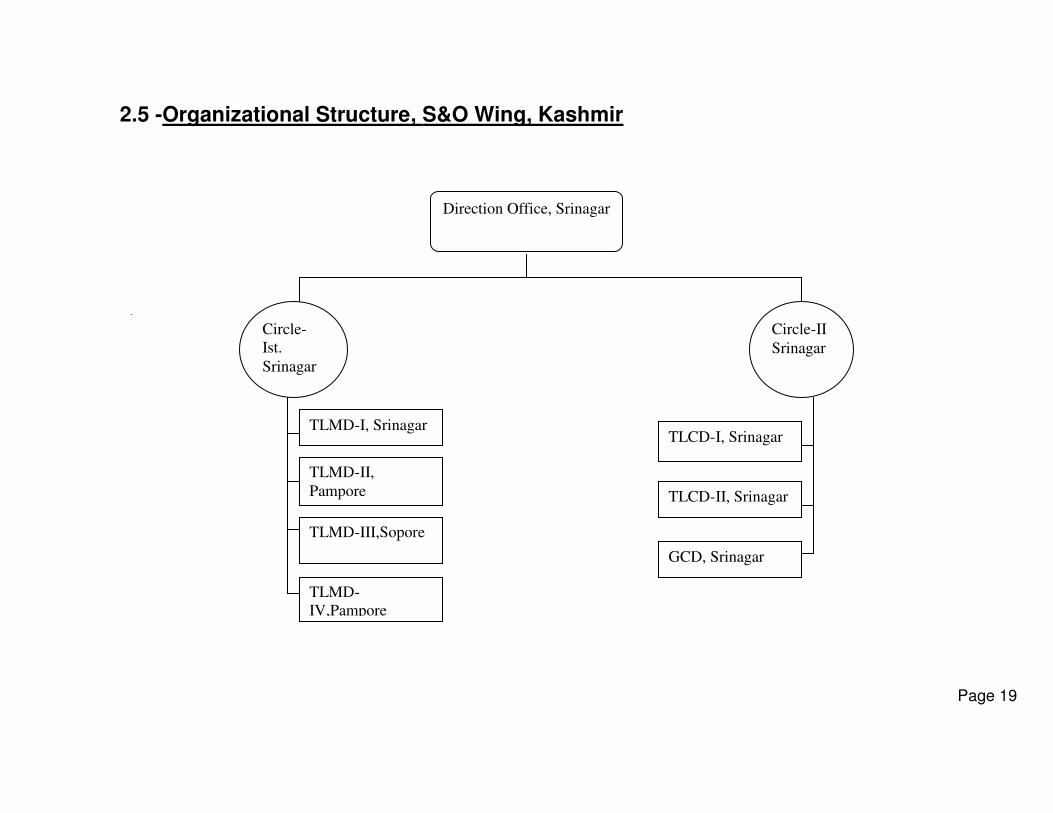
2.5 -Organizational Structure, S&O Wing, Kashmir
Page 19
Circle-
Ist.
Srinagar
Circle-II
Srinagar
TLMD-I, Srinagar
TLMD-II,
Pampore
TLMD-III,Sopore
TLCD-I, Srinagar
TLCD-II, Srinagar
GCD, Srinagar
TLMD-
IV,Pampore
Direction Office, Srinagar
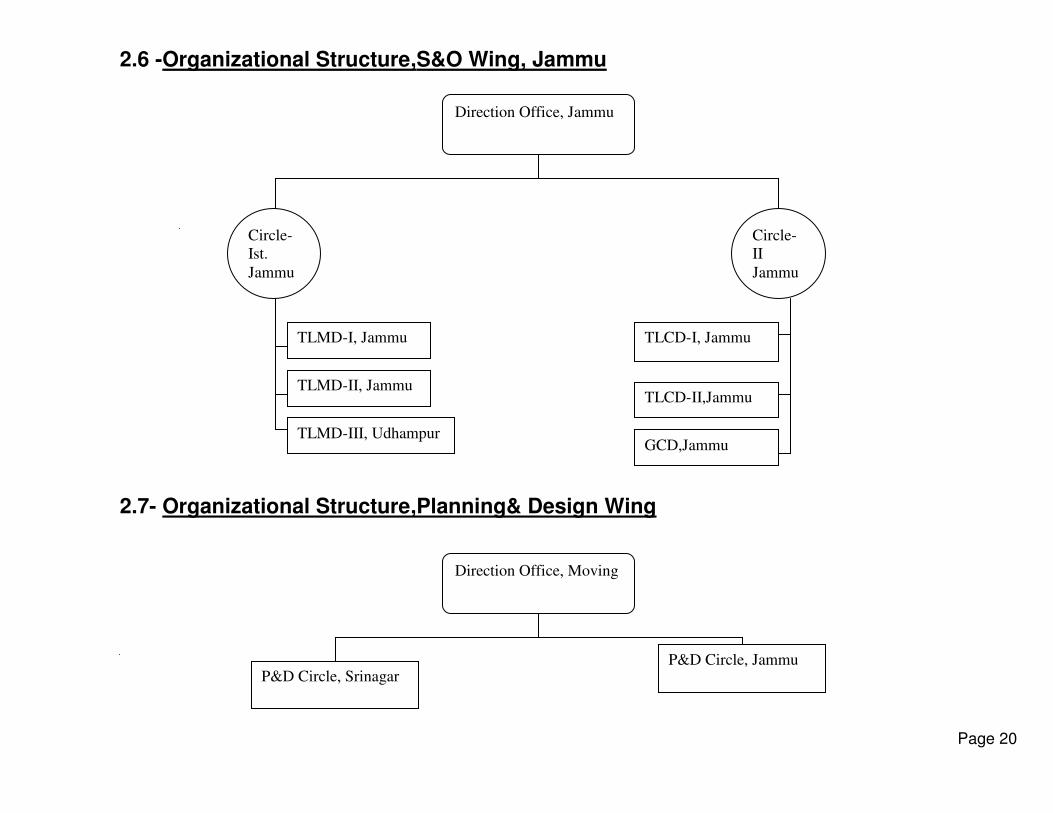
2.6 -Organizational Structure,S&O Wing, Jammu
2.7- Organizational Structure,Planning& Design Wing
Page 20
Circle-
Ist.
Jammu
Circle-
II
Jammu
TLMD-I, Jammu
TLMD-II, Jammu
TLMD-III, Udhampur
TLCD-I, Jammu
TLCD-II,Jammu
GCD,Jammu
P&D Circle, Srinagar P&D Circle, Jammu
Direction Office, Jammu
Direction Office, Moving

2.8 - Organizational Structure, Procurement& Material Management Wing
2.9- Organizational Structure, Commercial& Survey Wing, Jammu
Page 21
Purchase Circle, Srinagar Purchase Circle, Jammu
Elect. Central Store
Pampore
Elect. Central Store
Jammu
Survey Division, Srinagar
Commercial Division,
Srinagar
LDM&T Division ,
Srinagar
Survey Division, Jammu
Commercial Division,
Jammu
LDM&T Division, Jammu
Direction Office, Moving
Direction Office, Jammu
Circle Office-Srinagar

2.10- Organizational Structure, Training, Testing, Inspection and Commissioning Wing
Page 22
Inspection Division,
Srinagar
Inspection Division,
Jammu
Director
TTIC Wing Moving

2.11 - Year Wise Statement of No. of Employees
S.No
. Year
No. of Employees
1 1998-99 20500
2 1999-2000 20700
3 2000-01 20925
4 2001-02 21010
5 2002-03 21300
6 2003-04 21500
7 2004-05 22600
8 2005-06 22600
9 2006-07 23274
10 2007-08 23816
*11 2008-09 23285
*12 2009-10 23112
*13 2010-11 31010
14 2011-12 29116
15 2012-13 28648 * This includes 13325 No daily wagers as well
Page 23
20500
20700
20925
21010
21300
21500
22600
22600
23274
23816
23285
23112
31010
29116
28648
0
5000
10000
15000
20000
25000
30000
35000
199
8-9
9
199
9-2
00
0
200
0-0
1
200
1-0
2
200
2-0
3
200
3-0
4
200
4-0
5
200
5-0
6
200
6-0
7
200
7-0
8
200
8-0
9
200
9-1
0
201
0-1
1
201
1-1
2
201
2-1
3
No
. o
f E
mp
loye
es
Year

2.12 STATEMENT SHOWING CATEGORYWISE SANCTIONED/EXISTING STRENGTH(GAZETTED/NON-GAZETTED) OF VARIOUS WINGS OF J&K PDD AS ON 31-08-2013
SN
o
Category of Post
DCP
Office
M&RE
Wing Kmr.
M&RE
Wing
Jammu
S&O
Wing
Kmr.
S&O
wing
Jammu
P&MM
Wing
Jammu
C/S wing
J&K
P&D
Wing
Jammu
Director
TTIC
Wing
Jammu
Total Total
S E S E S E S E S E S E S E S E S E S E
1
Development
Commissioner Power
J&K 1 0 0 0 0 0 0 0 0 0 0 0 0 0 0 0 0 0 1 0
2 Chief Engineer 0 0 1 1 1 1 1 1 1 1 1 0 1 1 1 0 0 0 7 5
3 Superintending
Engineer 0 0 7 7 5 5 2 2 2 2 2 2 1 1 2 2 1 1 22 22
4 Executive Engineer 2 2 30 26 20 21 8 8 7 6 8 8 6 6 7 6 2 2 90 85
5 Special Mobile
Magistrate 0 0 3 3 3 3 0 0 0 0 0 0 0 0 0 0 0 0 6 6
6 Asstt. Ex. Engineer C/
E /M 2 2 124 110 100 98 29 27 28 28 25 26 25 24 15 13 7 7 355 335
7 Asstt. Engineer (E /
C/M) 0 0 102 19 88 37 20 15 18 18 1 0 13 8 0 0 4 4 246 101
8 Jr. Engineer including
contractual. 3 3 459 341 328 310 130 130 132 101 35 32 94 78 25 18 4 5 1210 1018
9 Jr. Engineer Civil 1 0 8 3 8 4 8 3 7 3 0 0 0 0 0 0 0 0 32 13
10 Senior Foreman 0 0 31 12 24 15 12 7 6 1 0 0 0 0 0 0 0 0 73 35
11 Tech-I 0 0 114 41 82 82 28 13 29 15 0 0 11 4 0 0 4 1 268 156
12 Tech-II 0 0 223 89 122 122 26 18 28 8 0 0 11 0 0 0 6 0 416 237
13 Tech-III 0 0 2035 1537 1272 1013 222 201 265 115 0 0 44 33 0 0 38 22 3876 2921
14 Tracer 0 0 1 0 0 0 0 0 0 0 0 0 1 0 0 0 0 0 2 0
15
Tech-IV/ Helper /
Lineman /S BA/ Bill
Distributor/ Tech-V/
Gate Keeper / Store
Attendant
0 0 3231 1530 1893 1666 419 213 440 348 0 0 71 35 0 0 0 0 6054 3792
16 Attendant 0 0 164 101 1469 1237 0 0 0 0 0 0 4 4 0 0 0 0 1637 1342
17 Meter Reader 0 0 497 361 158 134 1 1 1 0 0 0 0 0 0 0 0 0 657 496
18 workssupervisor 0 0 0 0 0 0 0 0 0 0 0 0 1 1 0 0 0 0 1 1
Page 24

SN
o
Category of Post
DCP
Office
M&RE
Wing
Kmr.
M&RE
Wing
Jammu
S&O
Wing
Kmr.
S&O
wing
Jammu
P&MM
Wing
Jammu
C/S wing
J&K
P&D
Wing
Jammu
Director
TTIC
Wing
Jammu
Total Total
S E S E S E S E S E S E S E S E S E S E
19 Sr. Surveyour 0 0 0 0 0 0 0 0 0 0 0 0 2 2 0 0 0 0 2 2
20 Survey Supervisor 0 0 0 0 0 0 0 0 0 0 0 0 6 1 0 0 0 0 6 1
21 Jr. Survey Supervisor 0 0 0 0 0 0 0 0 0 0 0 0 2 1 0 0 0 0 2 1
22 Survey Asstt. 0 0 0 0 0 0 0 0 0 0 0 0 2 2 0 0 0 0 2 2
23 Electric Ministry 0 0 0 0 0 0 0 0 0 0 0 0 1 0 0 0 0 0 1 0
24 Centrifuge driver 0 0 0 0 0 0 0 0 0 0 0 0 2 1 0 0 0 0 2 1
25 Diesel Engine Driver 0 0 0 0 0 0 0 0 0 0 0 0 2 0 0 0 0 0 2 0
26 Engine Mechanic 0 0 0 0 0 0 0 0 0 0 0 0 2 1 0 0 0 0 2 1
27 Geological Asstt. 0 0 0 0 2 0 1 0 0 0 0 0 0 0 0 0 0 0 3 0
28 Chief Accounts Officer 0 0 1 1 1 1 0 0 1 1 1 1 0 0 0 0 0 0 4 4
29
Sr. Law Officer/Law
Officer/Legal Asstt. 0 0 1 1 1 1 0 0 0 0 0 0 0 0 0 0 0 0 2 2
30 Adm. Officer 1 1 1 0 1 1 0 0 0 0 0 0 0 0 0 0 0 0 3 2
31
Accounts Officer /Rev.
Officer 1 1 3 2 3 2 1 1 0 0 3 3 2 2 1 1 0 0 14 12
32 Head Computer 1 1 1 1 1 1 1 0 1 1 1 1 0 0 1 1 1 1 8 7
33 Dy. Director 1 1 1 1 1 1 1 0 1 1 0 0 0 0 0 0 0 0 5 4
34 Asstt. Director 0 0 0 0 0 0 0 0 0 0 0 0 0 0 0 0 0 0 0 0
35 Pvt. Secretary 1 1 0 0 0 0 0 0 0 0 0 0 0 0 0 0 0 0 1 1
36 Asstt. Accounts Officer
1 0 30 25 20 20 8 6 7 6 7 5 3 3 1 0 0 0 77 65
37 Section Officer 1 1 4 2 4 2 1 1 1 1 1 1 2 2 1 0 0 0 15 10
38 Sr. Stenographer 1 0 1 2 1 1 1 0 1 1 1 1 0 1 0 0 0 0 6 6
39 Statistical Officer 1 1 1 1 1 1 1 1 0 0 0 0 0 0 0 0 0 0 4 4
40 Jr. Stenographer 1 1 8 0 6 4 3 2 2 2 4 2 1 0 3 1 1 1 29 13
41 Head Asstt. 3 4 27 22 26 26 11 7 10 7 7 3 14 12 3 3 3 3 104 87
42 Rev. Superintendent 0 0 21 12 16 15 0 0 0 0 0 0 0 0 0 0 0 0 37 27
Page 25

SN
o
Category of Post
DCP
Office
M&RE
Wing Kmr.
M&RE
Wing
Jammu
S&O
Wing
Kmr.
S&O
wing
Jammu
P&MM
Wing
Jammu
C/S wing
J&K
P&D
Wing
Jammu
Director
TTIC
Wing
Jammu
Total Total
S E S E S E S E S E S E S E S E S E S E
43 Sr. Asstt. 7 7 215 162 95 93 36 31 32 32 31 22 34 17 24 14 6 6 480 384
44 St. Asstt. 1 1 1 1 1 1 1 1 1 0 0 0 0 0 0 0 0 0 5 4
45 Accounts Asstt. 1 0 23 3 19 19 7 3 7 7 12 4 1 0 1 0 0 0 71 36
46 Jr. Asstt. 15 10 431 319 288 260 53 29 45 25 52 28 62 26 34 18 11 9 991 724
47 Rev. Examiner 0 0 0 0 45 45 0 0 0 0 0 0 0 0 0 0 0 0 45 45
48 Head Draftsman 1 1 5 1 20 20 2 2 7 6 3 3 1 1 1 1 1 1 41 36
49 Draftsman 0 0 33 12 23 21 10 2 9 9 17 2 8 2 9 4 3 2 112 54
50 Driver / Chauffer 2 2 67 40 60 60 25 19 26 17 9 4 16 4 3 3 3 1 211 150
51
Orderlies /
Chowkidar / Jamadar
/ Dak Runner
16 15 530 267 340 300 61 22 73 62 77 49 54 15 38 21 12 6 1201 757
52 Computer Operator 0 0 5 4 10 9 0 0 1 2 1 1 13 8 0 0 0 0 30 24
53 Computer Assistants 0 0 0 0 0 0 0 0 0 0 0 0 35 1 0 0 0 0 35 1
54 Cleaner 0 0 53 25 22 22 6 2 5 2 4 1 1 0 0 0 0 0 91 52
55 Lineman Grade I 0 0 398 349 0 0 21 18 0 0 0 0 0 0 0 0 0 0 419 367
56 Lineman Grade II 0 0 2877 1871 0 0 0 0 0 0 0 0 0 0 0 0 0 0 2877 1871
57 Land Collector 0 0 0 0 0 0 0 0 1 1 0 0 0 0 0 0 0 0 1 1
58 Naib Tehsildar 0 0 0 0 0 0 0 0 1 0 0 0 0 0 0 0 0 0 1 0
59 Patwari 0 0 0 0 0 0 0 0 2 0 0 0 0 0 0 0 0 0 2 0
DRW/CL/Need basis 0 0 0 7571 0 4254 0 1227 0 257 0 9 0 7 0 0 0 0 0 13325
Total 21897 28648
Page 26

Chapter-3
INFRASTRUCTURE AVILABLE AS ON 31-03-2013
3.1- Abstract of Transformation capacity in J&K State
Description Jammu Kashmir Total
No MVA No MVA No MVA
220/132 kV Grid Sub Stations 6 2030.00 4 1540 10 3570.00
132/66-33 kV Grid Sub Stations 28 1862.00 25 2211.00 53 4073.0
a) 66/33 /11kV Sub Station 2 60.00 ….. ….. 2 60.0
b) 66/11 kV Sub Station 34 349.45 ….. ….. 34 349.45
c) 66/6.6 kV Sub Station 2 20.0 ….. ….. 2 20.0
a) 33/11 kV Sub Stations 211 1697.55 215 2461.35 426 4158.90
b) 33/6.6 kV Sub Stations 6 37.90 7 77.6 13 115.50
c)33/0.4 kV Sub Stations 1 5 7 62.55 8 67.55
d)11/0.43 kV Sub Stations 21754 2310.824 20479 2918.33 42233 5229.154
e)6.6/0.43 KV Sub-Stations 91 9.39 526 81.9 617 91.29
f)No of 11/6.6 KV feeders 865
753
1618
Abstract of Line Length of Transmission lines in J&K state
Description Jammu Kashmir Total
Ckt.Km Ckt. Km Ckt.Km
220 kV Line Length (Km) 516.10 205.00 721.10
132 kV Line Length (Km) 1134.07 820.66 1954.73
66 kV Line Length (Km) 227.80 ….. 227.8
33 kV Line Length (Km) 2328.030 1827.6 4155.63
11 kV Line Length (Km) 18632.954 13401.5 32034.45
6.6 kV Line Length 158.570 276.6 435.17
LT Line Length(Km) 40729.977 29748.8 70478.78
Page 27

3.2 - Details of 220/132kV Transformation Capacity in Jammu & Kashmir
a) Kashmir Region
Total MVA =1540 b) Jammu Region
S No.
Name of the 220/132 KV Grid
sub station
Capacity Date of commissioning of Grid Station
Name of the scheme under which substation
constructed
No. of outgoing 132 KV feeders
Remarks
No. MVA / X-
MVA Total MVA
1 Gladni 3+1 spare 133.33 400 1985 State Sector
7
#2 160+150 310 2008
2 Udhampur 6+1 spare 40 240 1981 State Sector 5
3 Hira Nagar 3+1 spare 66.67 200 2001
State Sector 4 3+1 spare 40 120 1996
4 Barn 2(3Ph) 160 320 2008 PMRP 2
5 Bishnah 2(3ph) 160 320 2011 PMRP 1
6 Ramban 3+1 spare 40 120 2011 PMRP 2
Total MVA 2030
S. No.
Name of the Grid Sub Station
Transformation Capacity Date of
Commissioning
Name of the scheme under which Sub Station
Constructed
No.of outgoing 132 kV feeders
Remarks No
MVA / Tfm.
Total (MVA)
1 Pampore 9 +1
50
450 +50 (spare
Jully-1996 220 kV Kishanpur-
Pampore Transmission Line Project
4
2 Zainakote 9+1 50 450 +50 (spare)
Dec.1998
300 MVA 220/132 kV Grid Station at Zainkote with 220 kV D/C Wagoora-Zainkote Transmission Line
6 The Sub Station is having 33kV level
also
3 Mir Bazzar 6+1 53.33 320+53.33 Dec,2011 PMRP 8
4 Budgam 6+1 53.33 320+53.33 Dec,2011 PMRP 0 The Sub Station is having 33kV level
also
Page 28

3.3 - Details of 132/33 kV Transformation Capacity in Kashmir Region
S.No
Name of the Grid Sub Station
Transformation Capacity TOTAL (MVA)
Date of Commissioning / Name of the scheme under
which Sub Station Constructed
No.of 33 kV
feeders Remarks
No MVA / Tfm.
Total (MVA)
1
Bemina 3 50 150
150 1973 6 6x5.94MVA Taken
out 6 5.94 35.64
2 Wanpoh
1 50 50
120 1973 6 2 20 40
2 15 30
3 Amargarh
1 50 50
95 1977 6 1 20 20
2 12.5 25
4 Habak 2 50 100
120 1981 6 1 20 20
5 Pampore 9+1 16.66 150+16.66
200 1982 10 50MVA capacity
added during 2007-08 1 50 50
6 Pattan 3 2x50+1x20
100+20 120 1987 4 60MVA added during 2011-12
RE sector
7 Cheshmashahi
1 50 50
105 1987 4 2 20 40
1 15 15
8 Rawalpora 1 50 50
110 1993 6 3 20 60
9 Arampora 2 1
20 50
40 50
90 1995
50MVA added in 2009-10 3
Page 29

10 Wanganpora 6+1
1 25 50
200+25 200 1996 5
11 Zainkote 3 +1 25 75 +25 75 Dec.1998/Const.of 300 MVA 220/132kV Grid Stn Zainkote
3
12 Awantipora 3+1
1 25 50
75+25 50
125 1999/Const.of 75 MVA 50MVAadded in 2009
6 Added by virtue of
Deposit contribution.
13 Lassipora 3+1 25 75+25 75
05.04.2003/Const.of 75 MVA 132/33 kV G/Stn.Lassipora
4
14 Badampora
1 50 50
66 16.10.2004/Const.of 36 MVA 132/33kV G/Stn.Badampora
1
Augmented to 66MVA replacing
20MVA transformer by 50MVA
transformer during 2007-08
1 16 16
15 Kangan 1 20 20 20 29.04.2006/Const. of 20
MVA 132/33kV G/ Stn.Kangan
3
16 Sheree 1 50 50 50 06.05.2006/Const.of 50 MVA
132/33 kV G/ Stn. Sheree 3
17 Mattan
1 50 50 50 23.09.2006/Const. of 50 MVA 132/33 kV G/Stn.
Mattan 2
18 Kulgam 2 20 40 40 02.12.2006/Const. of 40 MVA 132/33 kV G/Stn.
Kulgam 1
19 Khonmoh 1 50 50 50 2-10-2009 3 Under PMRP
20 Tethar 1 50 50 50 28-05-2009 3 Under PMRP
21 Budgam
2 50 100 100 PMRP- 12/2011 4 Under PMRP
22 Lissar 1 50 50 50 PMRP- 5/12/2011 3 Under PMRP
23 Vilgam
1 50 50 50 PMRP- 22/12/2011 3 Under PMRP
24 Magam 1 50 50 50 PMRP- 21/12/2011 4 Under PMRP
25 Shopian 1 50 50 50 PMRP- 30/03/2011 4 Under PMRP
Total 2211.00MVA
Page 30
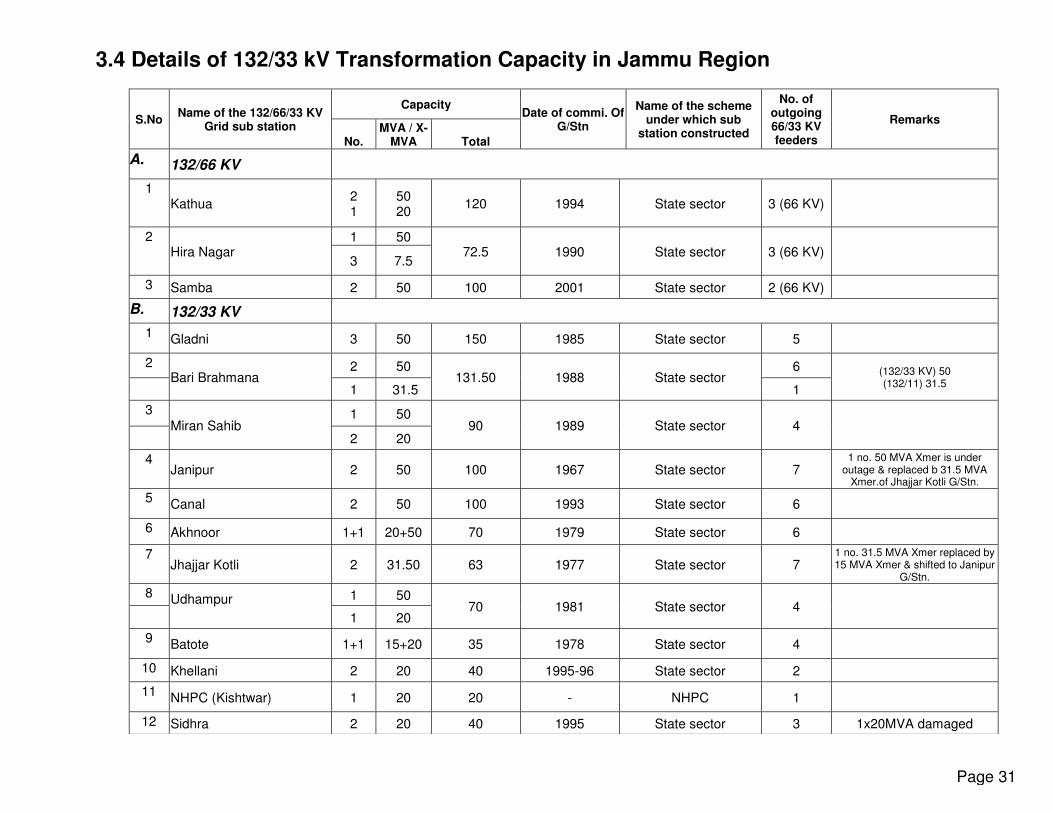
3.4 Details of 132/33 kV Transformation Capacity in Jammu Region
S.No Name of the 132/66/33 KV
Grid sub station
Capacity Date of commi. Of
G/Stn
Name of the scheme under which sub
station constructed
No. of outgoing 66/33 KV feeders
Remarks
No. MVA / X-
MVA Total
A. 132/66 KV 1
Kathua 2 1
50 20
120 1994 State sector 3 (66 KV)
2 Hira Nagar
1 50 72.5 1990 State sector 3 (66 KV)
3 7.5
3 Samba 2 50 100 2001 State sector 2 (66 KV)
B. 132/33 KV
1 Gladni 3 50 150 1985 State sector 5
2 Bari Brahmana
2 50 131.50 1988 State sector
6 (132/33 KV) 50 (132/11) 31.5 1 31.5 1
3 Miran Sahib
1 50 90 1989 State sector 4
2 20
4 Janipur 2 50 100 1967 State sector 7
1 no. 50 MVA Xmer is under outage & replaced b 31.5 MVA
Xmer.of Jhajjar Kotli G/Stn.
5 Canal 2 50 100 1993 State sector 6
6 Akhnoor 1+1 20+50 70 1979 State sector 6
7 Jhajjar Kotli 2 31.50 63 1977 State sector 7
1 no. 31.5 MVA Xmer replaced by 15 MVA Xmer & shifted to Janipur
G/Stn.
8 Udhampur
1 50 70 1981 State sector 4
1 20
9 Batote 1+1 15+20 35 1978 State sector 4
10 Khellani 2 20 40 1995-96 State sector 2
11 NHPC (Kishtwar) 1 20 20 - NHPC 1
12 Sidhra 2 20 40 1995 State sector 3 1x20MVA damaged
Page 31

Total MVA 1862.00
Page 32
13 Barn 1+1 20+50 70 2005 PMRP 2
14 Rajouri 3 20 60 1994-95 State sector 5
15 Kalakote 1 50 50 1987 State sector 1
16 Bari-Brahmana-II 2 50 100 2008 PMRP 2
17 Draba (Poonch) 1 20 20 2008 State sector 1
18 Gangyal 1 50 50 2009 PMRP 3
19 Mahanpur 1 50 50 2009 State sector 3
20 Bishnah 2 50 100 2011 PMRP 2
21 Ramban 1 20 20 2011 PMRP 3
22 Katra 1 50 50 2011 PMRP 3
23 Chandak 1 20 20 2011 PMRP 2
24 Pounichak 1 50 50
2011 PMRP 1
25
Jourian 1 20 20 2012 REC 1
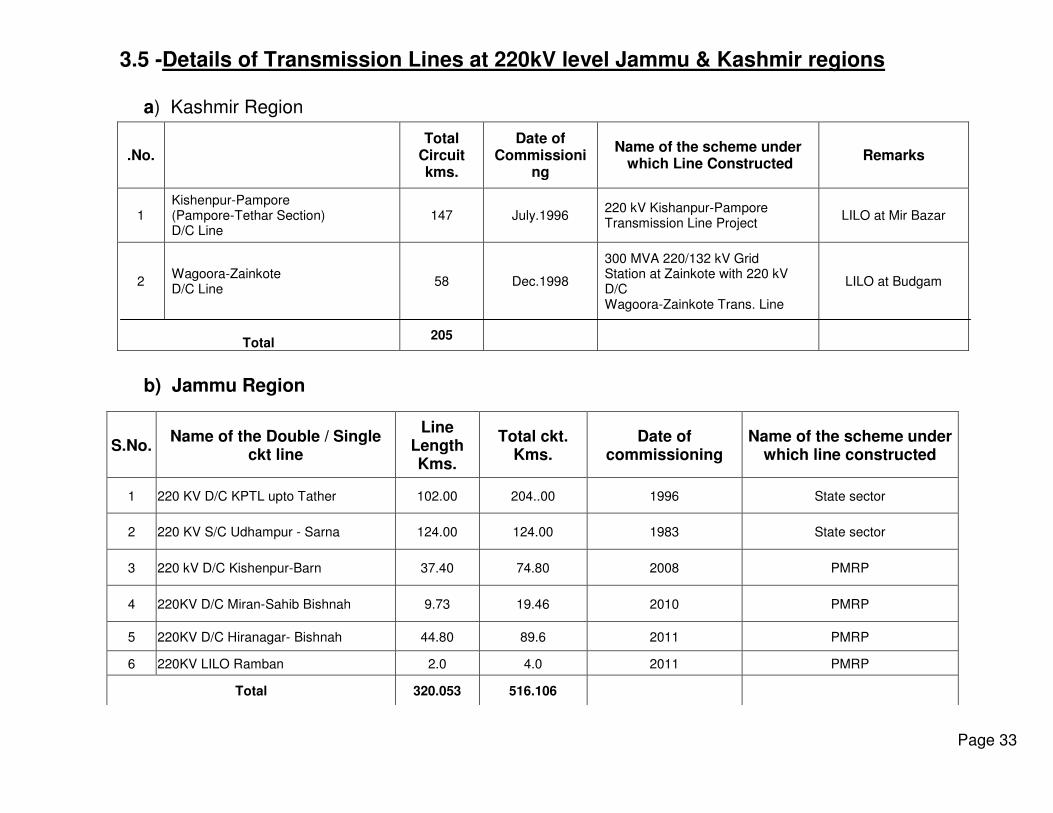
3.5 -Details of Transmission Lines at 220kV level Jammu & Kashmir regions
a) Kashmir Region
b) Jammu Region
Page 33
.No. Total
Circuit kms.
Date of Commissioni
ng
Name of the scheme under which Line Constructed
Remarks
1 Kishenpur-Pampore (Pampore-Tethar Section) D/C Line
147 July.1996 220 kV Kishanpur-Pampore Transmission Line Project
LILO at Mir Bazar
2 Wagoora-Zainkote D/C Line
58 Dec.1998
300 MVA 220/132 kV Grid Station at Zainkote with 220 kV D/C Wagoora-Zainkote Trans. Line
LILO at Budgam
Total
205
S.No. Name of the Double / Single
ckt line
Line Length Kms.
Total ckt. Kms.
Date of commissioning
Name of the scheme under which line constructed
1 220 KV D/C KPTL upto Tather 102.00 204..00 1996 State sector
2 220 KV S/C Udhampur - Sarna 124.00 124.00 1983 State sector
3 220 kV D/C Kishenpur-Barn 37.40 74.80 2008 PMRP
4 220KV D/C Miran-Sahib Bishnah 9.73 19.46 2010 PMRP
5 220KV D/C Hiranagar- Bishnah 44.80 89.6 2011 PMRP
6 220KV LILO Ramban 2.0 4.0 2011 PMRP
Total 320.053 516.106
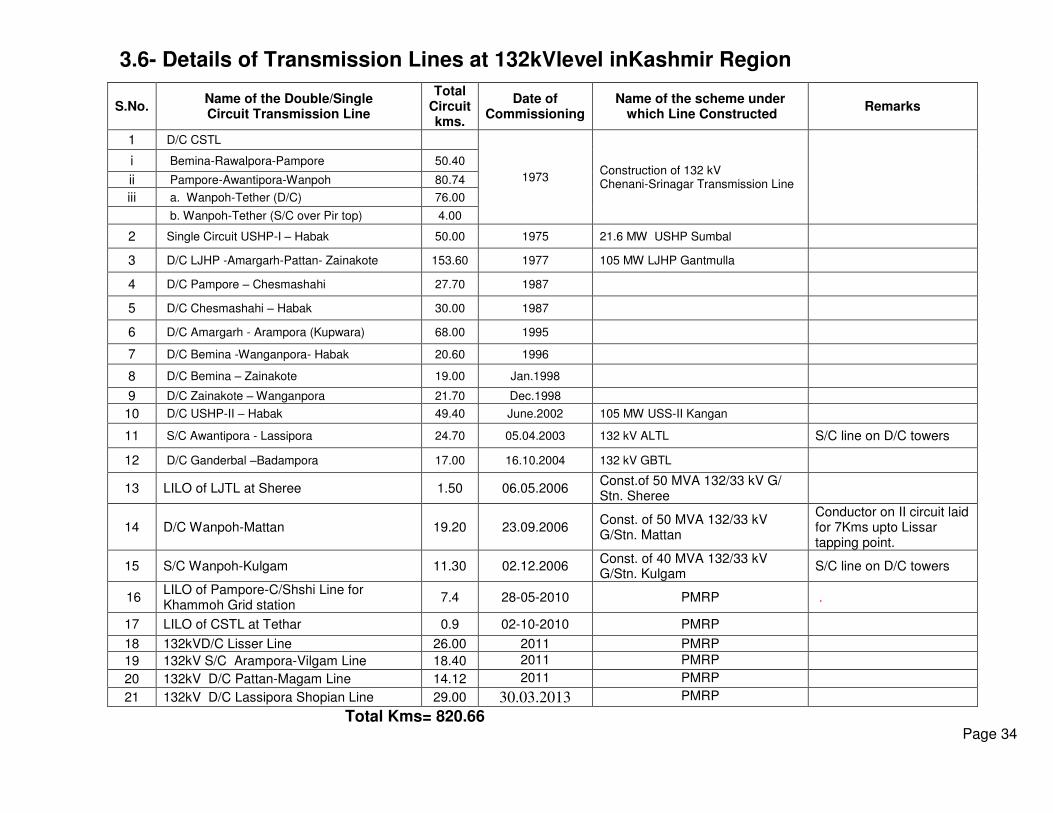
3.6- Details of Transmission Lines at 132kVlevel inKashmir Region
S.No. Name of the Double/Single Circuit Transmission Line
Total Circuit kms.
Date of Commissioning
Name of the scheme under which Line Constructed
Remarks
1 D/C CSTL
1973 Construction of 132 kV Chenani-Srinagar Transmission Line
i Bemina-Rawalpora-Pampore 50.40
ii Pampore-Awantipora-Wanpoh 80.74
iii a. Wanpoh-Tether (D/C) 76.00
b. Wanpoh-Tether (S/C over Pir top) 4.00
2 Single Circuit USHP-I – Habak 50.00 1975 21.6 MW USHP Sumbal
3 D/C LJHP -Amargarh-Pattan- Zainakote 153.60 1977 105 MW LJHP Gantmulla
4 D/C Pampore – Chesmashahi 27.70 1987
5 D/C Chesmashahi – Habak 30.00 1987
6 D/C Amargarh - Arampora (Kupwara) 68.00 1995
7 D/C Bemina -Wanganpora- Habak 20.60 1996
8 D/C Bemina – Zainakote 19.00 Jan.1998 9 D/C Zainakote – Wanganpora 21.70 Dec.1998
10 D/C USHP-II – Habak 49.40 June.2002 105 MW USS-II Kangan
11 S/C Awantipora - Lassipora 24.70 05.04.2003 132 kV ALTL S/C line on D/C towers
12 D/C Ganderbal –Badampora 17.00 16.10.2004 132 kV GBTL
13 LILO of LJTL at Sheree 1.50 06.05.2006 Const.of 50 MVA 132/33 kV G/ Stn. Sheree
14 D/C Wanpoh-Mattan 19.20 23.09.2006 Const. of 50 MVA 132/33 kV G/Stn. Mattan
Conductor on II circuit laid for 7Kms upto Lissar tapping point.
15 S/C Wanpoh-Kulgam 11.30 02.12.2006 Const. of 40 MVA 132/33 kV G/Stn. Kulgam
S/C line on D/C towers
16 LILO of Pampore-C/Shshi Line for Khammoh Grid station
7.4 28-05-2010 PMRP .
17 LILO of CSTL at Tethar 0.9 02-10-2010 PMRP
18 132kVD/C Lisser Line 26.00 2011 PMRP
19 132kV S/C Arampora-Vilgam Line 18.40 2011 PMRP
20 132kV D/C Pattan-Magam Line 14.12 2011 PMRP
21 132kV D/C Lassipora Shopian Line 29.00 30.03.2013 PMRP
Total Kms= 820.66 Page 34
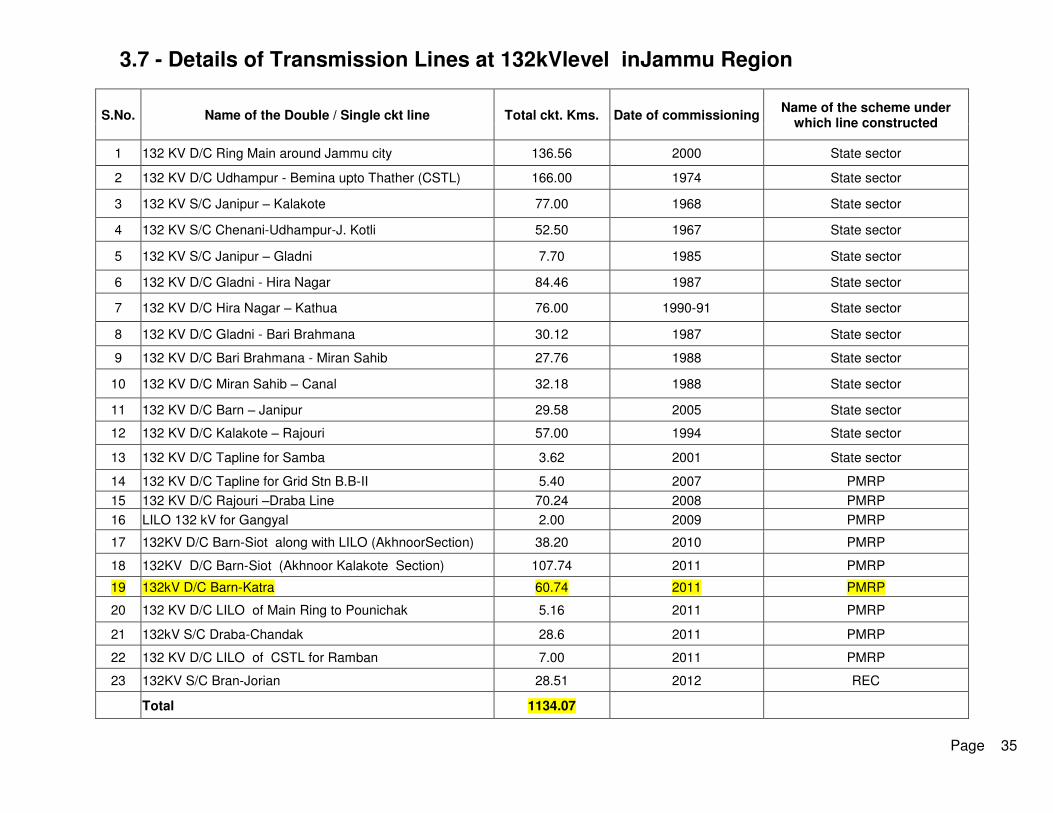
3.7 - Details of Transmission Lines at 132kVlevel inJammu Region
Page 35
S.No. Name of the Double / Single ckt line Total ckt. Kms. Date of commissioning Name of the scheme under
which line constructed
1 132 KV D/C Ring Main around Jammu city 136.56 2000 State sector
2 132 KV D/C Udhampur - Bemina upto Thather (CSTL) 166.00 1974 State sector
3 132 KV S/C Janipur – Kalakote 77.00 1968 State sector
4 132 KV S/C Chenani-Udhampur-J. Kotli 52.50 1967 State sector
5 132 KV S/C Janipur – Gladni 7.70 1985 State sector
6 132 KV D/C Gladni - Hira Nagar 84.46 1987 State sector
7 132 KV D/C Hira Nagar – Kathua 76.00 1990-91 State sector
8 132 KV D/C Gladni - Bari Brahmana 30.12 1987 State sector
9 132 KV D/C Bari Brahmana - Miran Sahib 27.76 1988 State sector
10 132 KV D/C Miran Sahib – Canal 32.18 1988 State sector
11 132 KV D/C Barn – Janipur 29.58 2005 State sector
12 132 KV D/C Kalakote – Rajouri 57.00 1994 State sector
13 132 KV D/C Tapline for Samba 3.62 2001 State sector
14 132 KV D/C Tapline for Grid Stn B.B-II 5.40 2007 PMRP
15 132 KV D/C Rajouri –Draba Line 70.24 2008 PMRP
16 LILO 132 kV for Gangyal 2.00 2009 PMRP
17 132KV D/C Barn-Siot along with LILO (AkhnoorSection) 38.20 2010 PMRP
18 132KV D/C Barn-Siot (Akhnoor Kalakote Section) 107.74 2011 PMRP
19 132kV D/C Barn-Katra 60.74 2011 PMRP
20 132 KV D/C LILO of Main Ring to Pounichak 5.16 2011 PMRP
21 132kV S/C Draba-Chandak 28.6 2011 PMRP
22 132 KV D/C LILO of CSTL for Ramban 7.00 2011 PMRP
23 132KV S/C Bran-Jorian 28.51 2012 REC
Total 1134.07

3.8 (A) Assets of Power Grid Corporation of India under operation in J&K.
1 400/220KV KISHENPUR SUBSTATION
ICTs MVA Total
KISHENPUR, 315MVA ICT-I (3 x 10⁵MVA) 315
630
KISHENPUR, 315MVA ICT-II (3 x 10⁵MVA) 315
BUS REACTORs MVAR
1X 63 MVAR BUS REACTOR 63
143
1X 80 MVAR BUS REACTOR 80
2 400/220KV WAGOORA SUBSTATION
ICTs MVA
WAGOORA, 315MVA ICT-I (3 x 10⁵MVA) 315
1260
WAGOORA, 315MVA ICT-II (3 x 10⁵MVA) 315
WAGOORA, 315MVA ICT-III (3 x 10⁵MVA) 315
WAGOORA, 315MVA ICT-IV (3 x 10⁵MVA) 315
BUS REACTORs MVAR
1X 50 MVAR BUS REACTOR 50
3. 400/220KV SUBSTATION SAMBA JAMMU(2x315MVA) 630 630
Page 36
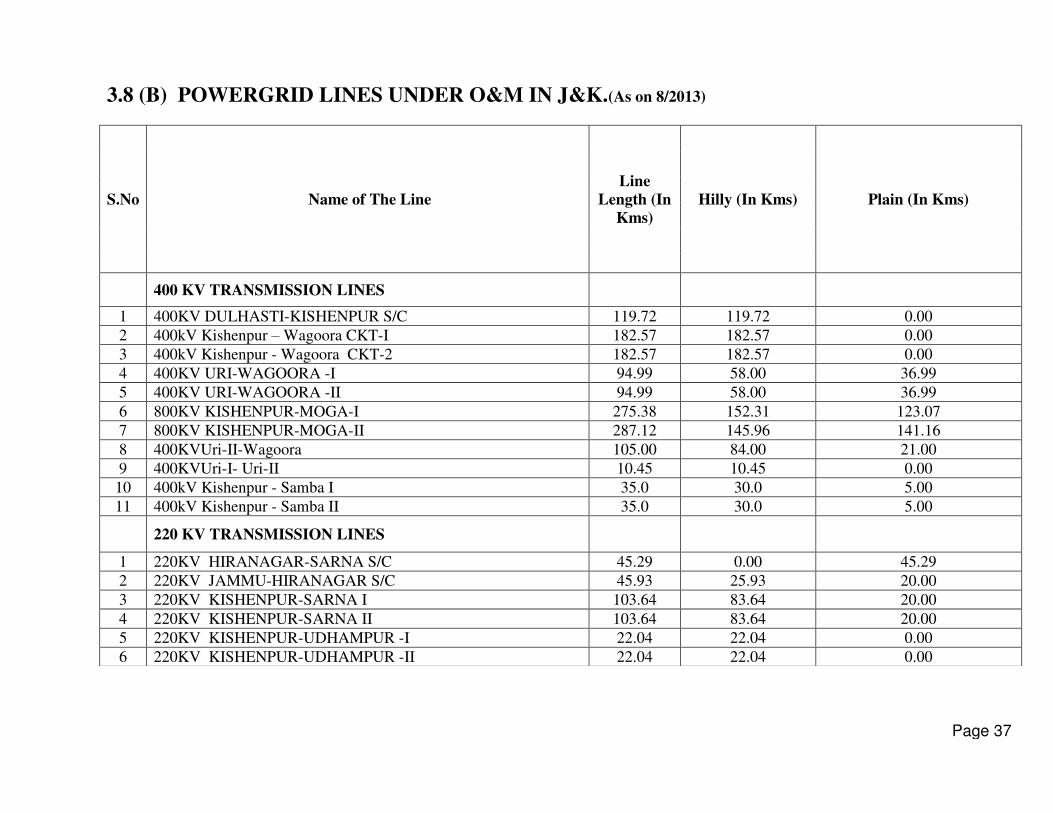
3.8 (B) POWERGRID LINES UNDER O&M IN J&K.(As on 8/2013)
S.No Name of The Line
Line
Length (In
Kms)
Hilly (In Kms) Plain (In Kms)
400 KV TRANSMISSION LINES
1 400KV DULHASTI-KISHENPUR S/C 119.72 119.72 0.00
2 400kV Kishenpur – Wagoora CKT-I 182.57 182.57 0.00
3 400kV Kishenpur - Wagoora CKT-2 182.57 182.57 0.00
4 400KV URI-WAGOORA -I 94.99 58.00 36.99
5 400KV URI-WAGOORA -II 94.99 58.00 36.99
6 800KV KISHENPUR-MOGA-I 275.38 152.31 123.07
7 800KV KISHENPUR-MOGA-II 287.12 145.96 141.16
8 400KVUri-II-Wagoora 105.00 84.00 21.00
9 400KVUri-I- Uri-II 10.45 10.45 0.00
10 400kV Kishenpur - Samba I 35.0 30.0 5.00
11 400kV Kishenpur - Samba II 35.0 30.0 5.00
220 KV TRANSMISSION LINES
1 220KV HIRANAGAR-SARNA S/C 45.29 0.00 45.29
2 220KV JAMMU-HIRANAGAR S/C 45.93 25.93 20.00
3 220KV KISHENPUR-SARNA I 103.64 83.64 20.00
4 220KV KISHENPUR-SARNA II 103.64 83.64 20.00
5 220KV KISHENPUR-UDHAMPUR -I 22.04 22.04 0.00
6 220KV KISHENPUR-UDHAMPUR -II 22.04 22.04 0.00
Page 37

Page 38
7 220KV SALAL-JAMMU-I S/C 56.33 56.33 0.00
8 220KV SALAL-JAMMU-II S/C 62.42 62.42 0.00
9 220KV SALAL-KISHENPUR-I 56.80 56.80 0.00
10 220KV SALAL-KISHENPUR-II 56.80 56.80 0.00
11 220KV SALAL-KISHENPUR-III 58.70 58.70 0.00
12 220KV SALAL-KISHENPUR-IV 58.70 58.70 0.00
13 220KV WAGOORA-PAMPORE-I 10.29 0.00 10.29
14 220KV WAGOORA-PAMPORE-II 10.29 0.00 10.29
132 KV TRANSMISSION LINES
1 132 KV Sewa-II - Hiranagar ckt-I 78.48 78.48 0.00
132 KV Sewa-II - Hiranagar ckt-II 78.48 78.48 0.00
2 132 KV Sewa-II - Mahanpur ckt-II 31.25 31.25 0.00
3 132kV Mahanpur - Kathua 21.50 21.50 0.00
4 132kV Sewa -II - Kathua 53.00 53.00 0.00
TOTAL FOR T/LS 2398.40 1903.33 495.07
Page 39
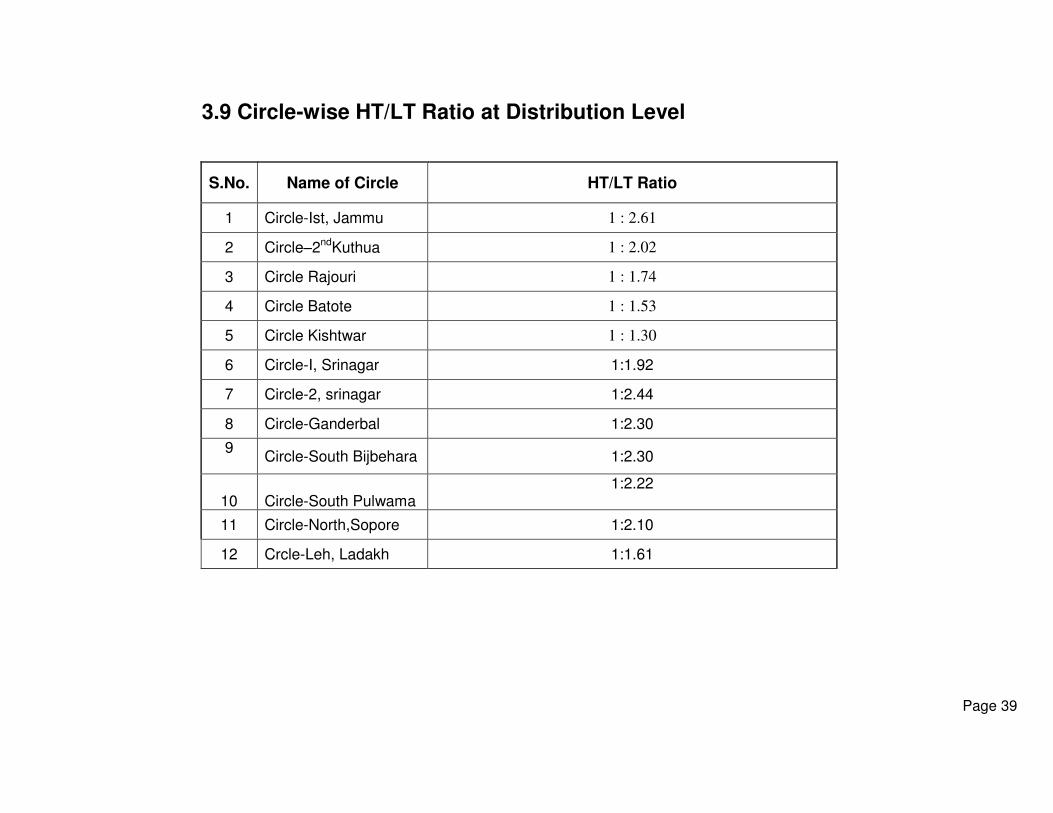
8 3.9 Circle-wise HT/LT Ratio at Distribution Level
S.No. Name of Circle HT/LT Ratio
1 Circle-Ist, Jammu 1 : 2.61
2 Circle–2ndKuthua 1 : 2.02
3 Circle Rajouri 1 : 1.74
4 Circle Batote 1 : 1.53
5 Circle Kishtwar 1 : 1.30
6 Circle-I, Srinagar 1:1.92
7 Circle-2, srinagar 1:2.44
8 Circle-Ganderbal 1:2.30
9
Circle-South Bijbehara 1:2.30
10 Circle-South Pulwama 1:2.22
11 Circle-North,Sopore 1:2.10
12 Crcle-Leh, Ladakh 1:1.61

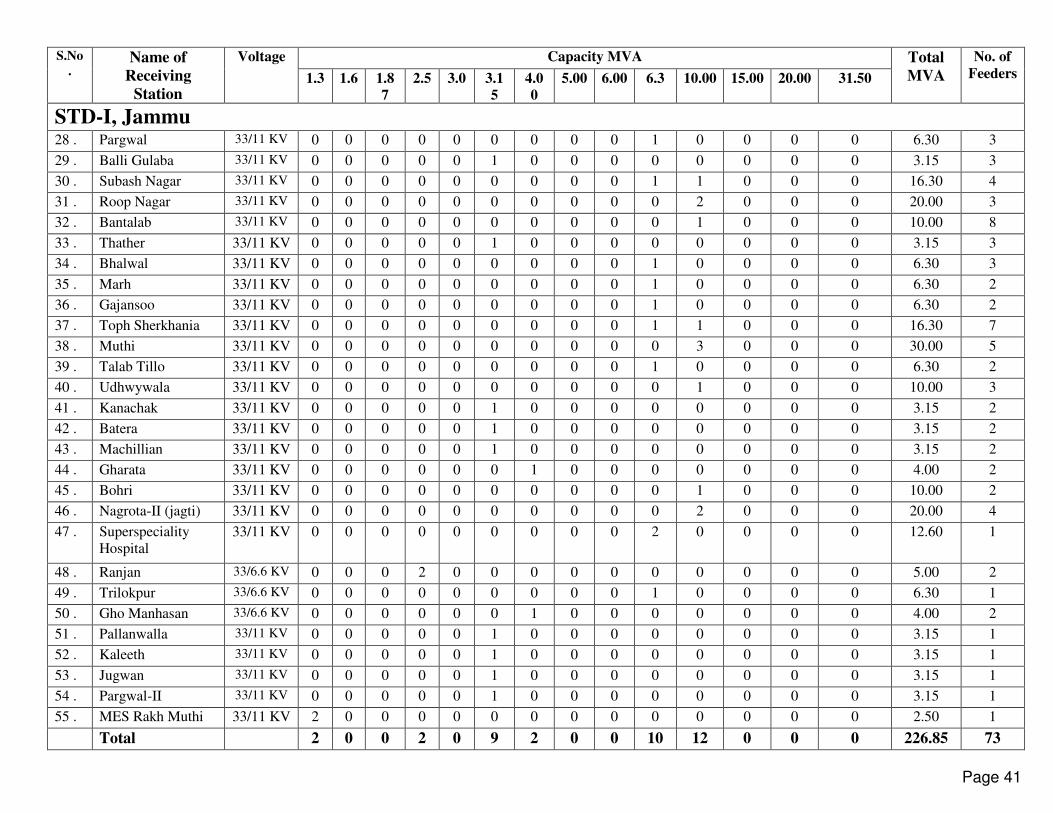
3.8 Capacity wise List of 66/33/11/6.6 KVA Sub-Station of Elect. Maintt. & RE Wing, Jammu. S.No
. Name of
Receiving
Station
Voltage Capacity MVA Total
MVA
No. of
Feeder
s 1.3 1.6 1.87 2.5 3.0 3.15 4.00 5.00 6.00 6.3 10.00 15.00 20.00 31.50
STD-I, Jammu 1 . New Sectetarait 33/11 KV 0 0 0 0 0 0 0 0 0 0 2 0 0 0 20.00 9
2 . Residency 33/11 KV 0 0 0 0 0 0 0 0 0 1 1 0 0 0 16.30 6
3 . Wazarat 33/11 KV 0 0 0 0 0 0 0 0 0 0 1 0 0 0 10.00 3
4 . Medical 33/11 KV 0 0 0 0 0 0 0 0 0 1 2 0 0 0 26.30 8
5 . Parade 33/11 KV 0 0 0 0 0 0 0 0 0 0 1 0 0 0 10.00 2
6 . Canal 33/11 KV 0 0 0 0 0 0 0 0 0 0 2 0 0 0 20.00 6
7 . Company Bagh 33/11 KV 0 0 0 0 0 0 0 0 0 0 2 0 0 0 20.00 4
8 . Sheetli 33/11 KV 0 0 0 0 0 0 0 0 0 3 2 0 0 0 38.90 7
9 . Nagrota 33/11 KV 0 0 0 0 0 0 0 0 0 1 0 0 0 0 6.30 3
10 . Dhounthaly 33/11 KV 0 0 0 0 0 0 0 0 0 1 1 0 0 0 16.30 6
11 . Jindhrah 33/11 KV 0 0 0 0 0 0 0 0 0 1 0 0 0 0 6.30 6
12 . Jajjar Kotli 33/11 KV 0 0 0 0 0 1 0 0 0 0 0 0 0 0 3.15 3
13 . Dansal 33/11 KV 0 0 0 0 0 1 0 0 0 0 0 0 0 0 3.15 2
14 . Janipur 33/11 KV 0 0 0 0 0 0 0 0 0 0 3 0 0 0 30.00 14
15 . Denis gate 33/11 KV 0 0 0 0 0 0 0 0 0 0 1 0 0 0 10.00 2
16 . Purkhoo 33/11 KV 0 0 0 0 0 0 0 0 0 2 0 0 0 0 12.60 4
17 . Shamachak 33/11 KV 0 0 0 0 0 0 0 0 0 1 0 0 0 0 6.30 1
18 . Akhnoor 33/11 KV 0 0 0 0 0 0 0 0 0 2 0 0 0 0 12.60 8
19 . Jourian 33/11 KV 0 0 0 0 0 0 0 0 0 0 1 0 0 0 10.00 3
20 . Pahariwala 33/11 KV 0 0 0 0 0 0 0 0 0 1 0 0 0 0 6.30 2
21 . Khour 33/11 KV 0 0 0 0 0 0 0 0 0 1 0 0 0 0 6.30 2
22 . Barmal 33/11 KV 0 0 0 0 0 0 1 0 0 0 0 0 0 0 4.00 2
23 . Sohal Bhalwal 33/11 KV 0 0 0 0 0 1 0 0 0 0 1 0 0 0 13.15 3
24 . Sarote 33/11 KV 0 0 0 0 0 1 0 0 0 0 0 0 0 0 3.15 2
25 . Tanda 33/11 KV 0 0 0 0 0 0 0 1 0 0 0 0 0 0 5.00 3
26 . Maira Mandrian 33/11 KV 0 0 0 0 0 1 0 0 0 0 0 0 0 0 3.15 2
27 . Chowki Choura 33/11 KV 0 0 0 0 0 0 0 0 0 1 0 0 0 0 6.30 2
Page 40
S.No
. Name of
Receiving
Station
Voltage Capacity MVA Total
MVA
No. of
Feeders 1.3 1.6 1.8
7
2.5 3.0 3.1
5
4.0
0
5.00 6.00 6.3 10.00 15.00 20.00 31.50
STD-I, Jammu 28 . Pargwal 33/11 KV 0 0 0 0 0 0 0 0 0 1 0 0 0 0 6.30 3
29 . Balli Gulaba 33/11 KV 0 0 0 0 0 1 0 0 0 0 0 0 0 0 3.15 3
30 . Subash Nagar 33/11 KV 0 0 0 0 0 0 0 0 0 1 1 0 0 0 16.30 4
31 . Roop Nagar 33/11 KV 0 0 0 0 0 0 0 0 0 0 2 0 0 0 20.00 3
32 . Bantalab 33/11 KV 0 0 0 0 0 0 0 0 0 0 1 0 0 0 10.00 8
33 . Thather 33/11 KV 0 0 0 0 0 1 0 0 0 0 0 0 0 0 3.15 3
34 . Bhalwal 33/11 KV 0 0 0 0 0 0 0 0 0 1 0 0 0 0 6.30 3
35 . Marh 33/11 KV 0 0 0 0 0 0 0 0 0 1 0 0 0 0 6.30 2
36 . Gajansoo 33/11 KV 0 0 0 0 0 0 0 0 0 1 0 0 0 0 6.30 2
37 . Toph Sherkhania 33/11 KV 0 0 0 0 0 0 0 0 0 1 1 0 0 0 16.30 7
38 . Muthi 33/11 KV 0 0 0 0 0 0 0 0 0 0 3 0 0 0 30.00 5
39 . Talab Tillo 33/11 KV 0 0 0 0 0 0 0 0 0 1 0 0 0 0 6.30 2
40 . Udhwywala 33/11 KV 0 0 0 0 0 0 0 0 0 0 1 0 0 0 10.00 3
41 . Kanachak 33/11 KV 0 0 0 0 0 1 0 0 0 0 0 0 0 0 3.15 2
42 . Batera 33/11 KV 0 0 0 0 0 1 0 0 0 0 0 0 0 0 3.15 2
43 . Machillian 33/11 KV 0 0 0 0 0 1 0 0 0 0 0 0 0 0 3.15 2
44 . Gharata 33/11 KV 0 0 0 0 0 0 1 0 0 0 0 0 0 0 4.00 2
45 . Bohri 33/11 KV 0 0 0 0 0 0 0 0 0 0 1 0 0 0 10.00 2
46 . Nagrota-II (jagti) 33/11 KV 0 0 0 0 0 0 0 0 0 0 2 0 0 0 20.00 4
47 . Superspeciality
Hospital
33/11 KV 0 0 0 0 0 0 0 0 0 2 0 0 0 0 12.60 1
48 . Ranjan 33/6.6 KV 0 0 0 2 0 0 0 0 0 0 0 0 0 0 5.00 2
49 . Trilokpur 33/6.6 KV 0 0 0 0 0 0 0 0 0 1 0 0 0 0 6.30 1
50 . Gho Manhasan 33/6.6 KV 0 0 0 0 0 0 1 0 0 0 0 0 0 0 4.00 2
51 . Pallanwalla 33/11 KV 0 0 0 0 0 1 0 0 0 0 0 0 0 0 3.15 1
52 . Kaleeth 33/11 KV 0 0 0 0 0 1 0 0 0 0 0 0 0 0 3.15 1
53 . Jugwan 33/11 KV 0 0 0 0 0 1 0 0 0 0 0 0 0 0 3.15 1
54 . Pargwal-II 33/11 KV 0 0 0 0 0 1 0 0 0 0 0 0 0 0 3.15 1
55 . MES Rakh Muthi 33/11 KV 2 0 0 0 0 0 0 0 0 0 0 0 0 0 2.50 1
Total 2 0 0 2 0 9 2 0 0 10 12 0 0 0 226.85 73
Page 41
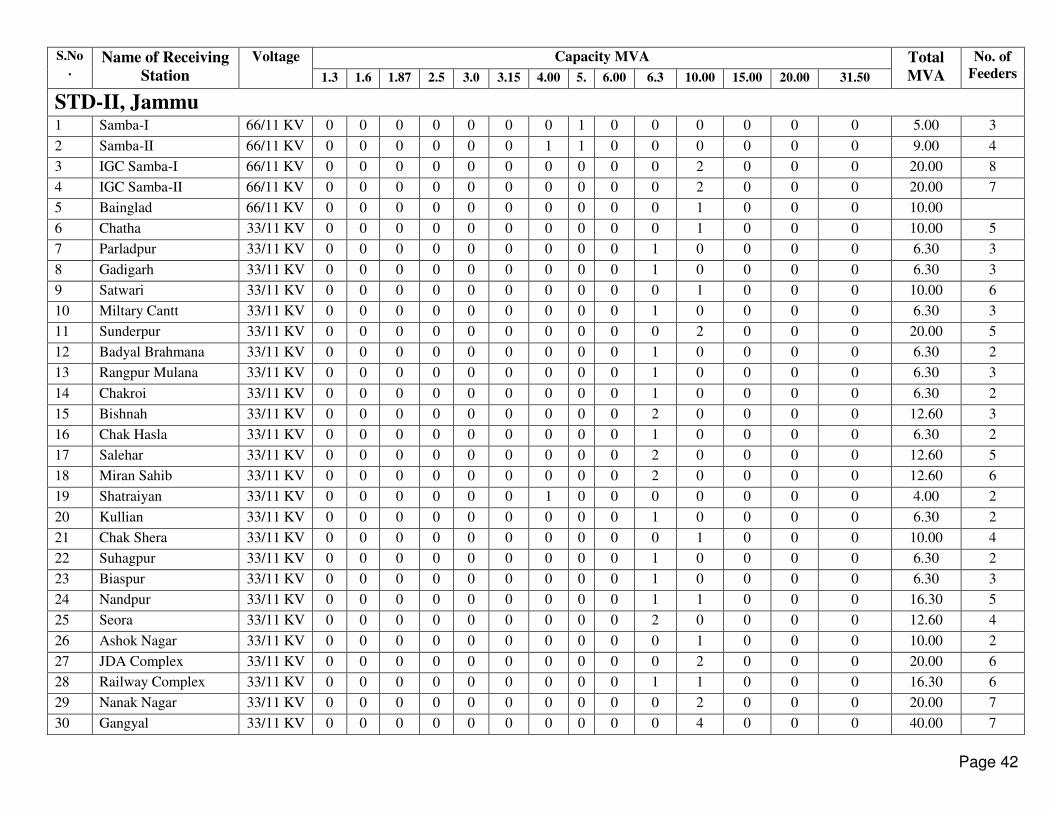
S.No
. Name of Receiving
Station
Voltage Capacity MVA Total
MVA
No. of
Feeders 1.3 1.6 1.87 2.5 3.0 3.15 4.00 5. 6.00 6.3 10.00 15.00 20.00 31.50
STD-II, Jammu 1 Samba-I 66/11 KV 0 0 0 0 0 0 0 1 0 0 0 0 0 0 5.00 3
2 Samba-II 66/11 KV 0 0 0 0 0 0 1 1 0 0 0 0 0 0 9.00 4
3 IGC Samba-I 66/11 KV 0 0 0 0 0 0 0 0 0 0 2 0 0 0 20.00 8
4 IGC Samba-II 66/11 KV 0 0 0 0 0 0 0 0 0 0 2 0 0 0 20.00 7
5 Bainglad 66/11 KV 0 0 0 0 0 0 0 0 0 0 1 0 0 0 10.00
6 Chatha 33/11 KV 0 0 0 0 0 0 0 0 0 0 1 0 0 0 10.00 5
7 Parladpur 33/11 KV 0 0 0 0 0 0 0 0 0 1 0 0 0 0 6.30 3
8 Gadigarh 33/11 KV 0 0 0 0 0 0 0 0 0 1 0 0 0 0 6.30 3
9 Satwari 33/11 KV 0 0 0 0 0 0 0 0 0 0 1 0 0 0 10.00 6
10 Miltary Cantt 33/11 KV 0 0 0 0 0 0 0 0 0 1 0 0 0 0 6.30 3
11 Sunderpur 33/11 KV 0 0 0 0 0 0 0 0 0 0 2 0 0 0 20.00 5
12 Badyal Brahmana 33/11 KV 0 0 0 0 0 0 0 0 0 1 0 0 0 0 6.30 2
13 Rangpur Mulana 33/11 KV 0 0 0 0 0 0 0 0 0 1 0 0 0 0 6.30 3
14 Chakroi 33/11 KV 0 0 0 0 0 0 0 0 0 1 0 0 0 0 6.30 2
15 Bishnah 33/11 KV 0 0 0 0 0 0 0 0 0 2 0 0 0 0 12.60 3
16 Chak Hasla 33/11 KV 0 0 0 0 0 0 0 0 0 1 0 0 0 0 6.30 2
17 Salehar 33/11 KV 0 0 0 0 0 0 0 0 0 2 0 0 0 0 12.60 5
18 Miran Sahib 33/11 KV 0 0 0 0 0 0 0 0 0 2 0 0 0 0 12.60 6
19 Shatraiyan 33/11 KV 0 0 0 0 0 0 1 0 0 0 0 0 0 0 4.00 2
20 Kullian 33/11 KV 0 0 0 0 0 0 0 0 0 1 0 0 0 0 6.30 2
21 Chak Shera 33/11 KV 0 0 0 0 0 0 0 0 0 0 1 0 0 0 10.00 4
22 Suhagpur 33/11 KV 0 0 0 0 0 0 0 0 0 1 0 0 0 0 6.30 2
23 Biaspur 33/11 KV 0 0 0 0 0 0 0 0 0 1 0 0 0 0 6.30 3
24 Nandpur 33/11 KV 0 0 0 0 0 0 0 0 0 1 1 0 0 0 16.30 5
25 Seora 33/11 KV 0 0 0 0 0 0 0 0 0 2 0 0 0 0 12.60 4
26 Ashok Nagar 33/11 KV 0 0 0 0 0 0 0 0 0 0 1 0 0 0 10.00 2
27 JDA Complex 33/11 KV 0 0 0 0 0 0 0 0 0 0 2 0 0 0 20.00 6
28 Railway Complex 33/11 KV 0 0 0 0 0 0 0 0 0 1 1 0 0 0 16.30 6
29 Nanak Nagar 33/11 KV 0 0 0 0 0 0 0 0 0 0 2 0 0 0 20.00 7
30 Gangyal 33/11 KV 0 0 0 0 0 0 0 0 0 0 4 0 0 0 40.00 7
Page 42

S.No. Name of
Receiving Station
Voltage Capacity MVA Total
MVA
No. of
Feeders 1.3 1.6 1.87 2.5 3.0 3.15 4.00 5.00 6.00 6.3 10.00 15.00 20.00 31.50
STD-II, Jammu 31 Trikuta Nagar 33/11 KV 0 0 0 0 0 0 0 0 0 0 1 0 0 0 10.00 3
32 Channi Himmat 33/11 KV 0 0 0 0 0 0 0 0 0 0 2 0 0 0 20.00 7
33 Transport Nagar 33/11 KV 0 0 0 0 0 0 0 0 0 0 1 0 0 0 10.00 4
34 Bathindi 33/11 KV 0 0 0 0 0 0 0 0 0 0 1 0 0 0 10.00 4
35 Babliana 33/11 KV 0 0 0 0 0 0 0 0 0 0 1 0 0 0 10.00 5
36 Sainik Colony 33/11 KV 0 0 0 0 0 0 0 0 0 1 0 0 0 0 6.30 3
37 Sidhra 33/11 KV 0 0 0 0 0 0 0 0 0 1 0 0 0 0 6.30 2
38 Malhori Jagir 33/11 KV 0 0 0 0 0 0 0 0 0 1 0 0 0 0 6.30 1
39 Greater Kailash 33/11 KV 0 0 0 0 0 0 0 0 0 1 0 0 0 0 6.30 4
40 BB-II 33/11 KV 0 0 0 0 0 0 0 0 0 2 0 0 0 20.00 5
41 BB-I 33/11 KV 0 0 0 0 0 0 0 0 0 0 3 0 0 1 61.50 15
42 Raya 33/11 KV 0 0 0 0 0 0 0 1 0 0 0 0 0 0 5.00 3
43 Birpur Complex 33/11 KV 0 0 0 0 0 0 0 0 0 0 1 0 0 0 10.00 3
44 Smailpur 33/11 KV 0 0 0 0 0 0 1 0 0 0 0 0 0 0 4.00 3
45 Ramgarh 33/11 KV 0 0 0 0 0 0 0 0 0 0 1 0 0 0 10.00 4
46 Vijaypur 33/11 KV 0 0 0 0 0 0 0 0 0 2 0 0 0 0 12.60 3
47 Gurha 33/11 KV 0 0 0 0 0 1 0 0 0 0 0 0 0 0 3.15 3
48 Mandal 33/11 KV 0 0 0 0 0 1 0 0 0 0 0 0 0 0 3.15 2
49 Kartholi 33/11 KV 0 0 0 0 0 0 0 0 0 0 1 0 0 0 10.00 4
50 Rangoor 33/11 KV 0 0 0 0 0 0 0 0 0 1 0 0 0 0 6.30 3
51 Jakh 33/11 KV 0 0 0 0 0 0 0 0 0 0 1 0 0 0 10.00 3
52 Sarore 33/11 KV 0 0 0 0 0 0 0 0 0 1 0 0 0 0 6.30 3
53 Birpur RatnuChak 33/11 KV 0 0 0 0 0 0 0 0 0 1 0 0 0 0 6.30 2
54 D.C Raya 33/11 KV 0 0 0 2 0 0 0 0 0 0 0 0 0 0 5.00 2
55 Sai Kala 33/11 KV 0 0 0 0 0 0 0 0 0 1 0 0 0 0 6.30 1
56 Makwal 33/11 KV 0 0 0 0 0 0 0 0 0 1 0 0 0 0 6.30 1
57 Boria 33/11 KV 0 0 0 0 0 2 0 0 0 0 0 0 0 0 6.30 1
58 Bahu Fort 33/6.6 KV 0 0 0 0 0 0 0 0 0 2 0 0 0 0 12.60 5
59 MES Samba 66-33/11Kv 0 0 0 0 0 0 0 1 0 0 0 0 0 0 5.00 1
60 Ghagwal 66/11Kv 0 0 0 0 0 0 0 0 0 0 1 0 0 0 10.00 1
Total 0 0 0 2 0 4 1 2 0 13 16 0 0 1 305 101
Page 43

S.No
. Name of
Receiving
Station
Voltage Capacity MVA Total
MVA
No. of
Feeders 1.3 1.6 1.8
7
2.5 3.0 3.1
5
4.0
0
5.0
0
6.0
0
6.3 10.0
0
15.0
0
20.0
0
31.50
STD-III, Kathua 1 Hatli Village 66/33/11
KV 0 0 0 0 0 0 0 0 0 0 2 0 0 0 20.00 2
2 Hiranagar 66/33/11
KV 0 0 0 0 0 0 0 0 0 0 2 0 1 0 40.00 3
3 Hiranagar-II 66/11 KV 0 0 0 0 0 0 0 0 0 0 1 0 0 0 10.00 3
4 Hatlimore 66/11 KV 0 0 0 0 0 1 0 0 0 0 1 0 1 0 33.15 11
5 Keerian Gandyal 66/11 KV 0 0 0 0 0 0 0 0 0 0 1 0 0 0 10.00 2
6 Lakhanpur 66/11 KV 0 0 0 0 0 0 0 1 0 0 0 0 0 0 5.00 3
7 Basantpur 66/11 KV 0 0 0 0 0 0 0 0 0 0 1 0 0 0 10.00 2
8 C.T.M 66/11 KV 0 0 0 0 0 0 0 0 0 0 1 1 0 0 25.00 1
9 Knit Fab 66/11 KV 0 0 0 0 0 0 0 1 0 0 0 0 0 0 5.00 1
10 Industry 66/11 KV 0 0 0 0 0 0 0 0 0 2 0 0 0 20.00 2
11 Nagri 66/11 KV 0 0 0 0 0 0 0 1 0 0 0 0 0 0 5.00 5
12 Palli 66/11 KV 0 0 0 0 0 0 0 1 0 0 0 0 0 0 5.00 4
13 Nanan 66/11 KV 0 0 0 0 0 0 0 1 0 0 0 0 0 0 5.00 2
14 Changran 66/11 KV 0 0 0 0 0 0 0 1 0 0 1 0 0 0 15.00 3
15 Taraf Pajwal 66/11 KV 0 0 0 0 0 0 0 0 0 0 1 0 0 0 10.00 4
16 Ghagwal 66/11 KV 0 0 0 0 0 0 0 0 0 0 1 0 0 0 10.00 3
17 Chann Arorian 66/11 KV 0 0 0 0 0 0 0 0 0 0 1 0 0 0 10.00 2
18 Marheen 66/11 KV 0 0 0 0 0 0 0 0 0 0 1 0 0 0 10.00 4
19 Nichila 66/11 KV 0 0 0 0 0 0 0 0 0 1 0 0 0 0 6.30 3
20 Rajpura 66/11 KV 0 0 0 0 0 0 0 0 0 0 1 0 0 0 10.00 3
21 Sherpur 66/11 KV 0 0 0 0 0 0 0 1 0 0 0 0 0 0 5.00 1
22 Pharpur 66/11 KV 0 0 0 0 0 0 0 0 0 0 1 0 0 0 10.00 3
23 Hatlimore-II
(Khrote More)
66/11 KV 0 0 0 0 0 0 0 1 0 0 0 0 0 0 5.00 4
24 Barnoti 66/11 KV 0 0 0 0 0 0 0 0 0 0 1 0 0 0 10.00 2
25 Lift Irrigation,
Lakhanpur (RTIC)
66/6.6
KV
0 0 0 0 0 0 0 2 0 0 0 0 0 0 10.00 1
Page 44

S.No. Name of
Receiving Station
Voltage Capacity MVA Total
MVA
No. of
Feeders 1.3 1.6 1.87 2.5 3.0 3.15 4.00 5.00 6.00 6.3 10.00 15.00 20.00 31.50
26 Lift Irrigation,
Basantpur (RTIC)
66/6.6
KV
0 0 0 0 0 0 0 2 0 0 0 0 0 0 10.00 1
27 Challan Prajali 33/11 KV 0 0 0 0 0 1 0 0 0 0 0 0 0 0 3.15 2
28 Phinter 33/11 KV 0 0 0 0 0 0 0 1 0 1 0 0 0 0 11.30 6
29 Ramkot 33/11 KV 0 0 0 0 0 0 0 0 0 1 0 0 0 0 6.30 3
30 Kalyal 33/11 KV 0 0 0 0 0 1 0 0 0 0 0 0 0 0 3.15 4
31 Mahanpur 33/11 KV 0 0 0 0 0 1 0 0 0 0 0 0 0 0 3.15 2
32 Basohli 33/11 KV 0 0 0 0 0 0 0 0 0 1 0 0 0 0 6.30 4
33 Bhoond 33/11 KV 0 0 0 1 0 0 0 0 0 0 0 0 0 0 2.50 3
34 Bani 33/11 KV 0 0 0 0 0 1 0 0 0 0 0 0 0 0 3.15 3
35 Bagan 33/11 KV 0 0 0 0 0 1 0 0 0 0 0 0 0 0 3.15 1
36 Machaddi 33/11 KV 0 1 0 0 0 0 0 0 0 0 0 0 0 0 1.60 2
37 Martha Nagrota 33/11 KV 0 0 0 0 0 1 0 0 0 0 0 0 0 0 3.15 1
38 Balaji Pigments 66/11 KV 0 0 0 0 0 0 0 1 0 0 0 0 0 0 5.00 1
39 Bharat Paper 66/11 KV 0 0 0 0 0 0 0 1 0 0 0 0 0 0 5.00 1
40 K.P.Paper 66/11 KV 0 0 0 0 1 0 0 0 0 0 0 0 0 0 3.00 1
41 IIND Centre
Govindsar
66/11 KV 0 0 0 0 0 0 0 0 0 0 0 0 1 0 20.00 1
42 Komal Paper 66/11 KV 0 0 0 0 1 0 0 0 0 0 0 0 0 0 3.00 1
43 Gura Kalyal 33/11 KV 0 0 0 0 0 0 0 0 0 0 0 0 0 0 0.00 1
Total 0 1 0 1 2 6 0 5 0 3 0 0 1 0 92.90 38
STD-IV, Kalakote 1 Kalakote 33/11 KV 0 0 0 0 0 0 0 0 0 1 0 0 0 0 6.30 3
2 Siot 33/11 KV 0 0 0 0 0 0 0 0 0 1 0 0 0 0 6.30 2
3 Sunderbani 33/11 KV 0 0 0 0 0 0 0 0 0 1 0 0 0 0 6.30 5
4 Phall 33/11 KV 0 0 0 0 0 0 0 0 0 1 0 0 0 0 6.30 2
5 Sunderbani-II
(Phall)
33/11 KV 2 0 0 0 0 0 0 0 0 0 0 0 0 0 2.50 2
6 Nowshera 33/11 KV 0 0 0 0 0 0 0 0 0 1 0 0 0 0 6.30 9
7 Chowki-Hundan 33/11 KV 0 0 0 0 0 0 0 0 0 1 0 0 0 0 6.30 2
8 Kangri 33/11 KV 0 0 0 1 0 0 0 0 0 0 0 0 0 0 2.50 3
Page 45

S.No Name of
Receiving Station
Voltage Capacity MVA Total
MVA
No. of
Feeders 1.3 1.6 1.87 2.5 3.0 3.15 4.00 5.00 6.00 6.3 10.00 15.00 20.00 31.50
9 Marchola 33/11 KV 0 0 0 0 0 1 0 0 0 0 0 0 0 0 3.15 2
10 Mogla 33/11 KV 0 1 0 0 0 0 0 0 0 0 0 0 0 0 1.60 2
11 Kheora 33/11 KV 0 0 0 0 0 0 0 0 0 0 1 0 0 0 10.00 7
12 Thudi 33/11 KV 0 0 0 0 0 0 0 1 0 1 0 0 0 0 11.30 11
13 Darhal 33/11 KV 0 0 0 0 0 0 0 0 0 1 0 0 0 0 6.30 2
14 Manjakote 33/11 KV 0 0 0 0 0 0 0 0 0 1 0 0 0 0 6.30 4
15 Thannamandi 33/11 KV 0 0 0 0 0 0 0 0 0 0 1 0 0 0 10.00 4
16 Dhanwan 33/11 KV 0 0 0 0 0 1 0 0 0 0 0 0 0 0 3.15 3
17 Dhangri 33/11 KV 0 0 0 0 0 1 0 0 0 0 0 0 0 0 3.15 1
18 Kotranka 33/11 KV 0 0 0 0 0 0 0 0 0 1 0 0 0 0 6.30 3
19 Darhali Bridge 33/11 KV 0 0 0 0 0 0 0 0 0 1 0 0 0 0 6.30 2
20 Palma 33/11 KV 0 0 0 0 0 1 0 0 0 0 0 0 0 0 3.15 3
21 Sial Sui 33/11 KV 0 0 0 0 0 1 0 0 0 0 0 0 0 0 3.15 2
22 Kamsar 33/11 KV 0 0 0 0 0 0 0 0 0 1 1 0 0 0 16.30 5
23 Haveli 33/11 KV 0 0 0 0 0 0 0 1 0 0 0 0 0 0 5.00 3
24 Gulpur 33/11 KV 0 2 0 0 0 0 0 0 0 0 0 0 0 0 3.20 3
25 Jhallas 33/11 KV 0 1 0 0 0 0 0 0 0 0 0 0 0 0 1.60 4
26 Chandak 33/11 KV 0 0 0 0 0 1 0 0 0 0 0 0 0 0 3.15 2
27 Mandi 33/11 KV 0 0 0 1 0 0 0 0 0 0 0 0 0 0 2.50 4
28 Lassana 33/11 KV 0 0 0 0 0 1 0 0 0 0 0 0 0 0 3.15 2
29 J.W.G 33/11 KV 0 0 0 1 0 0 0 0 0 0 0 0 0 0 2.50 2
30 Draba 33/11 KV 0 0 0 0 0 0 0 0 0 1 0 0 0 0 6.30 2
31 B.G 33/11 KV 0 1 0 0 0 0 0 0 0 0 0 0 0 0 1.60 3
32 Mendhar 33/11 KV 0 0 0 0 0 2 0 0 0 0 0 0 0 0 6.30 3
33 Mankote 33/11 KV 0 0 0 0 0 1 0 0 0 0 0 0 0 0 3.15 2
34 Jhallas-II 33/11 KV 0 0 0 0 0 1 0 0 0 0 0 0 0 0 3.15 2
35 Budhal 33/11 KV 0 0 0 0 0 1 0 0 0 0 0 0 0 0 3.15 3
36 Bandi Chechian 33/11 KV 0 0 0 0 0 1 0 0 0 0 0 0 0 0 3.15 2
37 Solki 33/11 KV 0 0 0 0 0 1 0 0 0 0 0 0 0 0 3.15 3
38 Loran 33/11 KV 0 0 0 0 0 1 0 0 0 0 0 0 0 0 3.15 2
39 Chatral 33/11 KV 0 0 0 0 0 1 0 0 0 0 0 0 0 0 3.15 2
Page 46

S.No. Name of
Receiving Station
Voltage Capacity MVA Total
MVA
No. of
Feeders 1.3 1.6 1.87 2.5 3.0 3.15 4.00 5.00 6.00 6.3 10.00 15.00 20.00 31.50
40 Rajal 33/11 KV 0 0 0 0 0 0 0 0 0 1 0 0 0 0 6.30 1
41 Qila Dharal 33/11 KV 0 0 0 0 0 1 0 0 0 0 0 0 0 0 3.15 2
42 Lift Irr. Rajal 33/6.6
KV
0 0 0 2 0 0 0 0 0 0 0 0 0 0 5.00 1
43 Jhulla (LC Fence) 33/11 KV 0 2 0 0 0 0 0 0 0 0 0 0 0 0 3.20 1
44 MES Rajouri 33/11 KV 0 0 0 1 0 0 0 0 0 0 0 0 0 0 2.50 1
45 Baba Ghulam Shah
(University)
33/11 KV 0 0 0 0 0 0 0 0 0 1 0 0 0 0 6.30 1
46 Kalakote-II 33/6.6
KV
0 0 0 0 0 0 0 1 0 0 0 0 0 0 5.00 2
47 Potha 33/11 KV 0 0 0 0 0 0 0 0 0 1 0 0 0 0 6.30 1
48 JWG-II 33/11 KV 0 0 0 0 0 1 0 0 0 0 0 0 0 0 3.15 1
Total 0 2 0 3 0 2 0 1 0 3 0 0 0 0 40.90 11
STD-V Udhampur 1 Dairy farm 33/11 KV 0 0 0 0 0 0 0 0 0 1 1 0 0 0 16.30 11
2 Devik 33/11 KV 0 0 0 0 0 0 0 0 0 2 0 0 0 0 12.60 7
3 Dhar Road 33/11 KV 0 0 0 0 0 0 0 0 0 2 0 0 0 0 12.60 6
4 Ramnagar 33/11 KV 0 0 0 1 0 0 0 0 0 1 0 0 0 0 8.80 6
5 Phalatta 33/11 KV 0 0 0 0 0 0 0 0 0 1 0 0 0 0 6.30 6
6 Jakhani 33/11 KV 0 0 0 0 0 0 0 0 0 1 0 0 0 0 6.30 3
7 Battal Ballian 33/11 KV 0 0 0 0 0 0 0 0 0 1 1 0 0 0 16.30 6
8 Staney 33/11 KV 0 0 0 0 0 1 1 0 0 1 0 0 0 0 13.45 5
9 Chenani 33/11 KV 0 0 0 0 0 0 0 1 0 0 0 0 0 0 5.00 5
10 Pathi 33/11 KV 0 0 0 0 0 1 0 0 0 0 0 0 0 0 3.15 3
11 Battal 33/11 KV 0 0 0 0 0 0 0 1 0 0 0 0 0 0 5.00 4
12 Dhuna 33/11 KV 0 1 0 0 0 0 0 0 0 0 0 0 0 0 1.60 2
13 Jib 33/11 KV 0 0 0 0 0 1 0 0 0 0 0 0 0 0 3.15 3
14 Katra 33/11 KV 0 0 0 0 0 0 0 0 0 0 2 0 0 0 20.00 9
15 Tarakote 33/11 KV 0 0 0 0 0 0 0 0 0 2 0 0 0 0 12.60 4
Page 47

S.No. Name of
Receiving
Station
Voltage Capacity MVA Total
MVA
No. of
Feeders 1.3 1.6 1.87 2.5 3.0 3.15 4.00 5.00 6.00 6.3 10.00 15.00 20.00 31.50
16 Reasi 33/11 KV 0 0 0 0 0 0 0 0 0 2 0 0 0 0 12.60 7
17 Pouni 33/11 KV 0 0 0 0 0 0 0 0 0 1 0 0 0 0 6.30 3
18 Panthal 33/11 KV 0 0 0 0 0 0 0 0 0 1 0 0 0 0 6.30 6
19 Dharmari 33/11 KV 0 0 0 0 0 1 0 0 0 0 0 0 0 0 3.15 4
20 SMVD University 33/11 KV 0 0 0 0 0 1 0 0 0 0 0 0 0 0 3.15 3
21 Dharmound 33/11 KV 0 0 0 0 0 0 0 0 0 1 0 0 0 0 6.30 4
22 Meetra (Ramban) 33/11 KV 0 0 0 0 0 1 0 0 0 1 0 0 0 0 9.45 7
23 Ramsoo 33/11 KV 0 0 0 0 0 1 0 0 0 0 0 0 0 0 3.15 3
24 Banihal 33/11 KV 0 0 0 0 0 0 0 0 0 1 0 0 0 0 6.30 8
25 Assar 33/11 KV 0 0 0 0 0 1 0 0 0 0 0 0 0 0 3.15 3
26 Patnitop 33/11 KV 0 0 0 0 0 1 0 0 0 0 0 0 0 0 3.15 3
27 Tethar 33/11 KV 0 0 0 0 0 0 1 0 0 0 0 0 0 0 4.00 3
28 Sangaldan 33/11 KV 0 0 0 0 0 1 0 0 0 0 0 0 0 0 3.15 4
29 Sarhbaga 33/11 KV 0 0 0 1 0 0 0 0 0 0 0 0 0 0 2.50 3
30 Johnu 33/11 KV 0 0 0 0 0 1 0 0 0 0 0 0 0 0 3.15 3
31 Chowki 33/11 KV 0 0 0 0 0 1 0 0 0 0 0 0 0 0 3.15 4
32 Basantgarh 33/11 KV 0 0 0 0 0 1 0 0 0 0 0 0 0 0 3.15 4
33 Gool 33/11 KV 0 0 0 1 0 0 0 0 0 0 0 0 0 0 2.50 2
34 Kali Mata Mandir 33/11 KV 0 0 0 0 0 0 0 0 0 1 0 0 0 0 6.30 1
Total 0 0 0 2 0 10 1 0 0 8 0 0 0 0 90.90 75
STD-VI Doda
1 Doda 33/11 KV 0 0 0 0 0 0 0 0 0 2 0 0 0 0 12.60 8
2 Thathri 33/11 KV 0 0 0 0 0 0 0 0 0 1 0 0 0 0 6.30 4
3 Prem Nagar 33/11 KV 0 0 0 0 0 1 0 0 0 0 0 0 0 0 3.15 4
Page 48

S.No. Name of
Receiving Station
Voltage Capacity MVA Total
MVA
No. of
Feeders 1.3 1.6 1.87 2.5 3.0 3.15 4.00 5.00 6.00 6.3 10.00 15.00 20.00 31.50
4 Bhalla 33/11 KV 0 0 0 0 0 1 0 0 0 0 0 0 0 0 3.15 3
5 Gandoh 33/11 KV 0 0 0 0 0 0 0 1 0 0 0 0 0 0 5.00 4
6 Bhaderwah 33/11 KV 0 0 0 0 0 0 0 1 0 1 0 0 0 0 11.30 6
7 Ganika 33/11 KV 0 0 0 1 0 0 0 0 0 0 0 0 0 0 2.50 3
8 Changa 33/11 KV 0 0 0 0 0 1 0 0 0 0 0 0 0 0 3.15 2
9 Bhatyas 33/11 KV 0 0 0 0 0 1 0 0 0 0 0 0 0 0 3.15 3
10 Dallian
(Bhaderwah)
33/11 KV 0 0 0 0 0 0 1 0 0 0 0 0 0 0 4.00 3
11 Sappa (Army) 33/11 KV 0 0 0 0 0 1 0 0 0 0 0 0 0 0 3.15 1
12 Kishtwar 33/11 KV 0 0 0 0 0 0 0 0 0 0 2 0 0 0 20.00 6
13 Mandal 33/11 KV 0 0 0 0 0 0 0 0 0 1 0 0 0 0 6.30 4
14 Dedpeth 33/11 KV 0 0 0 0 0 1 0 0 0 0 0 0 0 0 3.15 3
15 Doda-II (Behli
Ghat)
33/11 KV 0 0 0 0 0 0 1 0 0 0 0 0 0 0 4.00 4
Total 0 0 0 1 0 5 2 2 0 2 2 0 0 0 68.85 42
Page 49

3.10 Capacity wise List of 33/11/6.6 KVA Sub-Station of Elect. Maintt. & RE Wing, Kashmir
STD - Ist Srinagar
S # Sub Station Capacity (MVA) Total MVA No. of Out-going
feeders
2.5 3.15 4 5 6.3 10
1 Ahmad Nagar 0 0 0 0 1 0 6.3 2
2 Awanta Bhawan 0 0 0 0 2 0 12.6 2
3 B.A.M. Khan 0 0 0 0 3 0 18.9 4
4 Bagwanpora 0 0 0 0 0 2 20 2
5 Balhama 0 0 0 0 1 0 6.3 4
6 Barbarshah 0 0 0 0 0 2 20 2
7 Brane 0 0 0 0 0 2 20 3
8 Buchwara 0 0 0 0 0 2 20 2
9 Centaur 0 0 0 0 2 0 12.6 4
10 Fateh kadal 0 0 0 0 0 2 20 4
11 Habak 0 0 0 0 3 0 18.9 3
12 Harwan 0 0 0 0 3 0 18.9 2
13 Illahi Bagh 0 0 0 0 2 0 12.6 2
14 Kathidarwaza 0 0 0 0 3 0 18.9 4
15 Kawdara 0 0 0 0 0 2 20 3
16 Khanyar 0 0 0 0 1 2 26.3 5
17 Khayam 0 0 0 0 0 2 20
18 Lal Bazar 0 0 0 1 0 1 15 3
19 Mughal Masjid 0 0 0 0 0 2 20 11
20 Nedous 0 0 0 0 2 0 12.6 2
21 Nishat 0 0 0 0 0 2 20 4
22 Basantbagh 0 0 0 0 0 2 20 3
23 Omer Hair 0 0 0 0 2 0 12.6 2
24 Rainawari 0 0 0 0 0 2 20 4
25 Shalimar 0 0 0 0 2 0 12.6 3
26 Sidco Food Park Sidco Khunmoh 0 0 0 0 1 0 6.3 2
27 Sonwar 0 0 0 0 0 2 20 4
Page 50

S # Sub Station Capacity (MVA) Total MVA No. of Out-going
feeders
2.5 3.15 4 5 6.3 10
28 Soura 0 0 1 0 1 2 30.3 5
29 T.R.C. 0 0 0 0 0 2 20 6
30 Tailbal (Burzahama) 0 0 0 1 1 0 11.3 1
31 Zakoora 0 0 0 1 0 1 15 3
32 Zoonimar 0 0 0 0 1 0 6.3 1
33 Hazratbal 0 0 0 0 2 0 12.6 3
34 Khanmoh phase III 0 0 0 0 0 1 10 2
Total 0 0 1 3 33 33 556.9 111
STD - IInd Srinagar
1 B.K.Pora 0 0 0 0 2 0 12.6 3
2 Baghi-Mehtab 0 0 0 0 2 0 12.6 4
3 Batmalloo 0 0 0 0 0 2 20 2
4 Beerwah 0 0 0 1 1 0 11.3 6
5 Bemina-IInd 0 0 0 0 1 2 26.3 4
6 Bemina-Ist 0 0 0 0 2 0 12.6 5
7 Bone & Joint Hospital 0 0 0 0 2 0 12.6 4
8 Brenwar 0 0 0 0 1 0 6.3 2
9 Budgam 0 0 1 0 0 2 24 7
10 Chadoora 0 0 0 0 2 1 22.6 5
11 Chanapora 0 0 0 0 0 2 20 5
12 Chari Shareef 0 0 0 0 2 0 12.6 6
13 Danderkhah 0 0 0 0 2 0 12.6 3
14 Exhibition 0 0 0 0 0 2 20 4
15 Ichgam 0 0 0 0 1 0 6.3 2
16 J V C (Bemina III) 0 0 0 0 1 0 6.3 2
17 Jawaharnagar 0 0 0 0 0 2 20 2
18 K.P.Bagh 0 0 0 0 2 0 12.6 4
19 Karan Nagar 0 0 0 0 0 2 20 7
20 Khag 0 0 0 0 1 0 6.3 3
Page 51
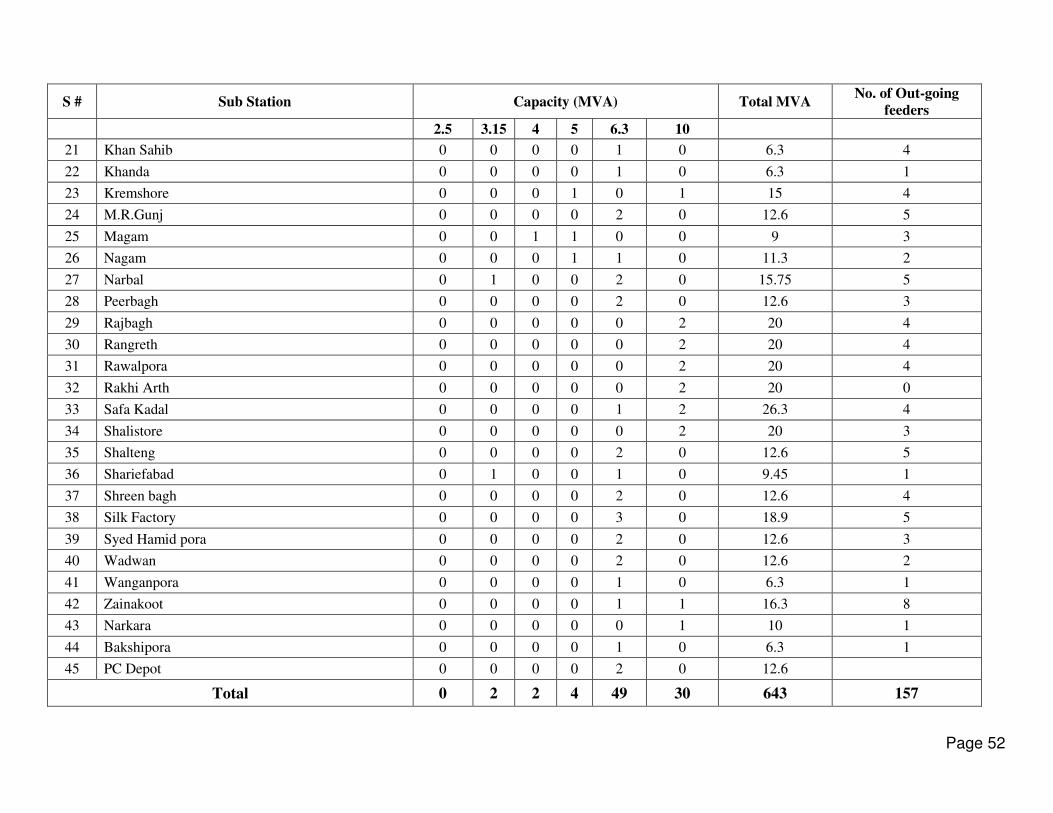
S # Sub Station Capacity (MVA) Total MVA No. of Out-going
feeders
2.5 3.15 4 5 6.3 10
21 Khan Sahib 0 0 0 0 1 0 6.3 4
22 Khanda 0 0 0 0 1 0 6.3 1
23 Kremshore 0 0 0 1 0 1 15 4
24 M.R.Gunj 0 0 0 0 2 0 12.6 5
25 Magam 0 0 1 1 0 0 9 3
26 Nagam 0 0 0 1 1 0 11.3 2
27 Narbal 0 1 0 0 2 0 15.75 5
28 Peerbagh 0 0 0 0 2 0 12.6 3
29 Rajbagh 0 0 0 0 0 2 20 4
30 Rangreth 0 0 0 0 0 2 20 4
31 Rawalpora 0 0 0 0 0 2 20 4
32 Rakhi Arth 0 0 0 0 0 2 20 0
33 Safa Kadal 0 0 0 0 1 2 26.3 4
34 Shalistore 0 0 0 0 0 2 20 3
35 Shalteng 0 0 0 0 2 0 12.6 5
36 Shariefabad 0 1 0 0 1 0 9.45 1
37 Shreen bagh 0 0 0 0 2 0 12.6 4
38 Silk Factory 0 0 0 0 3 0 18.9 5
39 Syed Hamid pora 0 0 0 0 2 0 12.6 3
40 Wadwan 0 0 0 0 2 0 12.6 2
41 Wanganpora 0 0 0 0 1 0 6.3 1
42 Zainakoot 0 0 0 0 1 1 16.3 8
43 Narkara 0 0 0 0 0 1 10 1
44 Bakshipora 0 0 0 0 1 0 6.3 1
45 PC Depot 0 0 0 0 2 0 12.6
Total 0 2 2 4 49 30 643 157
Page 52

STD - Sopore
S # Sub Station Capacity (MVA) Total MVA No. of Out-going
feeders
3.15 4 5 6.3 10
1 Arampora 0 0 0 2 0 12.6 2
2 Audoora 0 0 0 1 0 6.3 4
3 Baramulla-II 0 0 0 1 1 16.3 3
4 Baramulla-Ist 0 0 0 0 2 20 7
5 Chakloo Rafiabad 0 0 0 1 0 6.3 2
6 Chandoosa 0 0 0 1 0 6.3 3
7 Chogul 0 0 0 1 0 6.3 3
8 Cable car 1 0 0 0 0 3.15 2
9 Delina 0 0 0 2 0 12.6 3
10 Dhobiwan 1 1 0 0 0 7.15 3
11 Dooru Sopore 0 0 0 1 0 6.3 2
12 Drugmulla 0 0 0 1 0 6.3 3
13 Drungbal 0 0 0 1 0 6.3 2
14 Ganapora 0 0 0 1 0 6.3 3
15 Gulmarg 0 1 0 0 0 4 4
16 Hadipora 1 0 0 0 0 3.15 1
17 Hamray 0 1 0 1 0 10.3 4
18 Handwara 0 0 1 0 1 15 6
19 HardIchloo 0 0 0 1 0 6.3 2
20 Kangamdar (Pattan) 0 0 0 1 0 6.3 3
21 Kanilbagh 0 0 0 1 0 6.3 3
22 Khumriyal 0 0 0 1 0 6.3 4
23 Kralpora 0 0 0 0 1 10 4
24 Kreeri 0 0 0 1 0 6.3 1
25 Krusan 0 0 0 0 1 10 4
26 Kunzar 0 0 0 1 1 16.3 3
Page 53

S # Sub Station Capacity (MVA) Total MVA No. of Out-going
feeders
3.15 4 5 6.3 10
27 Ladoora 2 0 0 0 0 6.3 4
28 Malpora Narwah 0 0 0 1 0 6.3 3
29 Nowpora 0 0 0 1 0 6.3 3
30 Nowshera 0 1 0 0 0 4 2
31 Panzipora Tarzoo,Sopore 0 0 0 1 0 6.3 3
32 Pattan 0 0 0 0 2 20 6
33 Rampora Uri 0 0 0 1 0 6.3 2
34 Rohama 0 0 0 1 0 6.3 3
35 Sangrama 0 0 0 1 0 6.3 3
36 Seeloo 0 0 0 0 1 10 5
37 Sheeri 0 0 1 0 0 5 3
38 Singhpora 0 0 0 1 0 6.3 3
39 Sopore- 2nd 0 0 0 1 1 16.3 5
40 Sopore-1st 0 0 0 0 2 20 7
41 Tangdar 0 0 0 1 0 6.3 4
42 Tangmarg 1 0 0 0 1 13.15 5
43 Tikker Kupwara 0 0 0 0 2 20 8
44 Trehgam 0 0 0 1 0 6.3 2
45 Uri Salamabad 0 0 0 0 1 10 5
46 Wagoora 1 0 1 0 0 8.15 5
47 Watlab 0 0 0 1 0 6.3 3
48 Watrigam 1 0 0 1 0 9.45 5
49 Willgam (Doolipora) 0 1 0 1 0 10.3 3
50 Zachaldara 1 0 0 1 0 9.45 3
Total 9 5 3 34 17 447.55 176
Page 54

STD - Ganderbal
S # Sub Station Capacity (MVA) Total MVA No. of Out-going feeders
2.5 3.15 4 5 6.3 10
1 Ajas 0 0 0 1 0 0 5 3
2 Aloosa 0 0 0 0 1 0 6.3 2
3 Ajar Bandipora 0 0 0 0 2 1 22.6 6
4 Panzigam Bandipora 0 0 0 0 1 0 6.3 3
5 Mansbal 0 0 0 0 1 0 6.3 3
6 Markundal 0 0 0 0 2 0 12.6 5
7 Nadihal 0 1 1 0 0 0 7.15 2
8 Shadipora 0 0 1 0 1 0 10.3 3
9 Hajin 0 3 0 0 0 0 9.45 4
10 Ganderbal 1 0 0 0 2 0 15.1 5
11 Manigam 0 0 0 0 1 0 6.3 4
12 Mansbal 0 0 0 0 1 0 6.3 3
13 Nagbal 0 0 0 0 1 0 6.3 1
14 Alesteng 0 0 0 0 1 0 6.3 2
15 Tulla Bagh 0 0 0 0 1 0 6.3 3
16 Ganda Singh 0 1 0 0 0 0 3.15 2
17 Lar 0 0 0 1 1 0 11.3 4
18 Kheer Bhawani 0 1 0 0 0 0 3.15 2
19 Doderhama 0 0 0 0 3 0 18.9 5
20 Khurhama 0 0 0 0 2 0 12.6 4
21 Kangan 0 0 0 0 0 1 10 4
22 Wussan 0 0 0 0 0 1 10 3
23 Surfraw 0 0 0 1 0 0 5 2
24 Gagangeer 0 1 0 0 0 0 3.15 1
25 Naidkhai 0 0 0 0 1 0 6.3 3
26 Preng Madwan 0 0 0 0 1 0 6.3 3
Total 1 7 2 3 23 3 222.45 79
Page 55

STD Pulwama
S# Name of R. Station Capacity (MVA) Total Capacity (in
MVA) No. of o/g Feeders
2.5 3.15 4 5 6.3 10
1 Lassipora 0 0 0 0 0 1 10 3
2 Pulwama 0 0 0 0 0 2 20 7
3 Keegam 0 0 0 0 1 0 6.3 2
4 Shadimargh 0 0 0 1 1 0 11.3 4
5 Mitrigam 0 1 0 0 1 0 9.45 3
6 Reshipora 0 0 0 0 2 0 12.6 4
7 Landoora 0 0 0 0 1 0 6.3 4
8 Shopian(Gagren) 0 0 0 0 2 0 12.6 4
9 Pinjoora 0 0 1 0 0 0 4 2
10 Batpora 0 0 0 0 1 0 6.3 3
11 Chowdrigund 0 0 0 0 1 0 6.3 3
12 Konibal 0 0 1 0 1 0 10.3 4
13 Lethpora 0 0 1 1 0 0 9 3
14 Kakapora 0 0 0 0 1 0 6.3 2
15 Newa 0 0 1 0 1 0 10.3 3
16 Tral 0 0 0 0 0 2 20 5
17 Lurgam 0 1 0 0 1 0 9.45 3
18 Lalgam 1 1 0 0 0 0 5.65 2
19 Chewa 0 0 0 0 1 0 6.3 3
20 Awantipora 0 0 0 0 2 0 12.6 7
21 Naroo 0 1 0 0 1 0 9.45 3
22 KachachKoot 0 0 1 0 1 0 10.3 3
23 Nowgam Panzgam 0 2 0 0 0 0 6.3 3
Total 1 6 5 2 19 5 221.1 80
Page 56
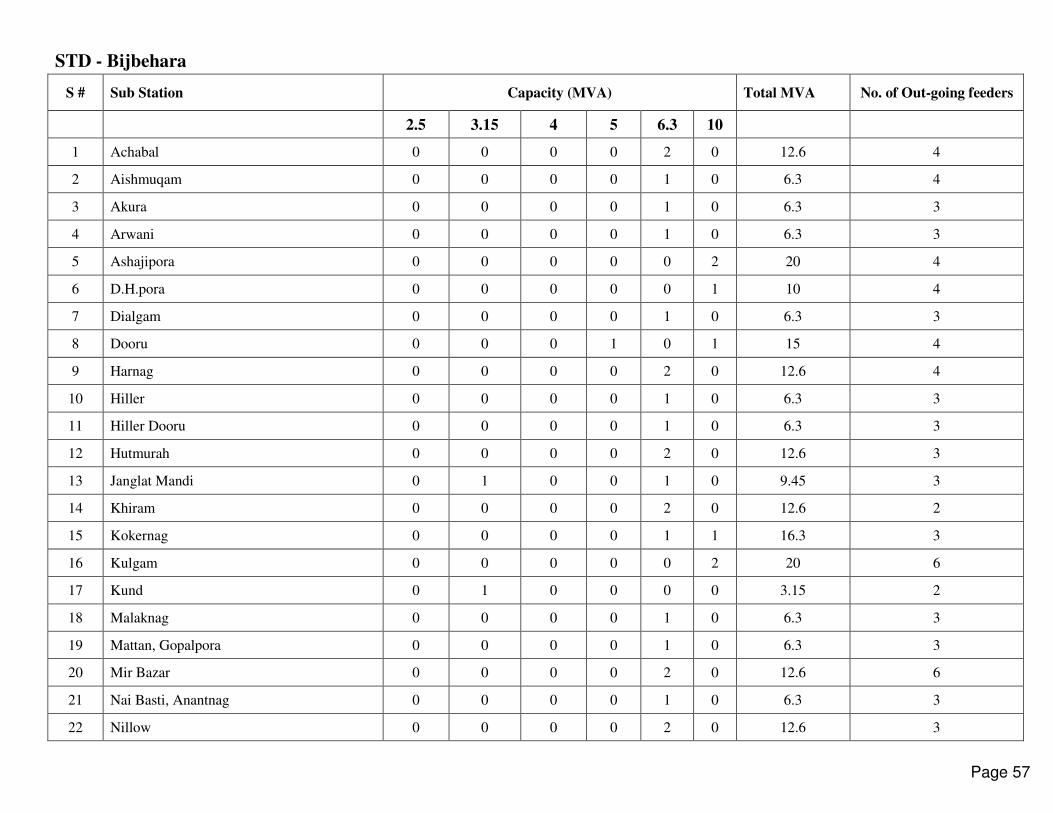
STD - Bijbehara
S # Sub Station Capacity (MVA) Total MVA No. of Out-going feeders
2.5 3.15 4 5 6.3 10
1 Achabal 0 0 0 0 2 0 12.6 4
2 Aishmuqam 0 0 0 0 1 0 6.3 4
3 Akura 0 0 0 0 1 0 6.3 3
4 Arwani 0 0 0 0 1 0 6.3 3
5 Ashajipora 0 0 0 0 0 2 20 4
6 D.H.pora 0 0 0 0 0 1 10 4
7 Dialgam 0 0 0 0 1 0 6.3 3
8 Dooru 0 0 0 1 0 1 15 4
9 Harnag 0 0 0 0 2 0 12.6 4
10 Hiller 0 0 0 0 1 0 6.3 3
11 Hiller Dooru 0 0 0 0 1 0 6.3 3
12 Hutmurah 0 0 0 0 2 0 12.6 3
13 Janglat Mandi 0 1 0 0 1 0 9.45 3
14 Khiram 0 0 0 0 2 0 12.6 2
15 Kokernag 0 0 0 0 1 1 16.3 3
16 Kulgam 0 0 0 0 0 2 20 6
17 Kund 0 1 0 0 0 0 3.15 2
18 Malaknag 0 0 0 0 1 0 6.3 3
19 Mattan, Gopalpora 0 0 0 0 1 0 6.3 3
20 Mir Bazar 0 0 0 0 2 0 12.6 6
21 Nai Basti, Anantnag 0 0 0 0 1 0 6.3 3
22 Nillow 0 0 0 0 2 0 12.6 3
Page 57
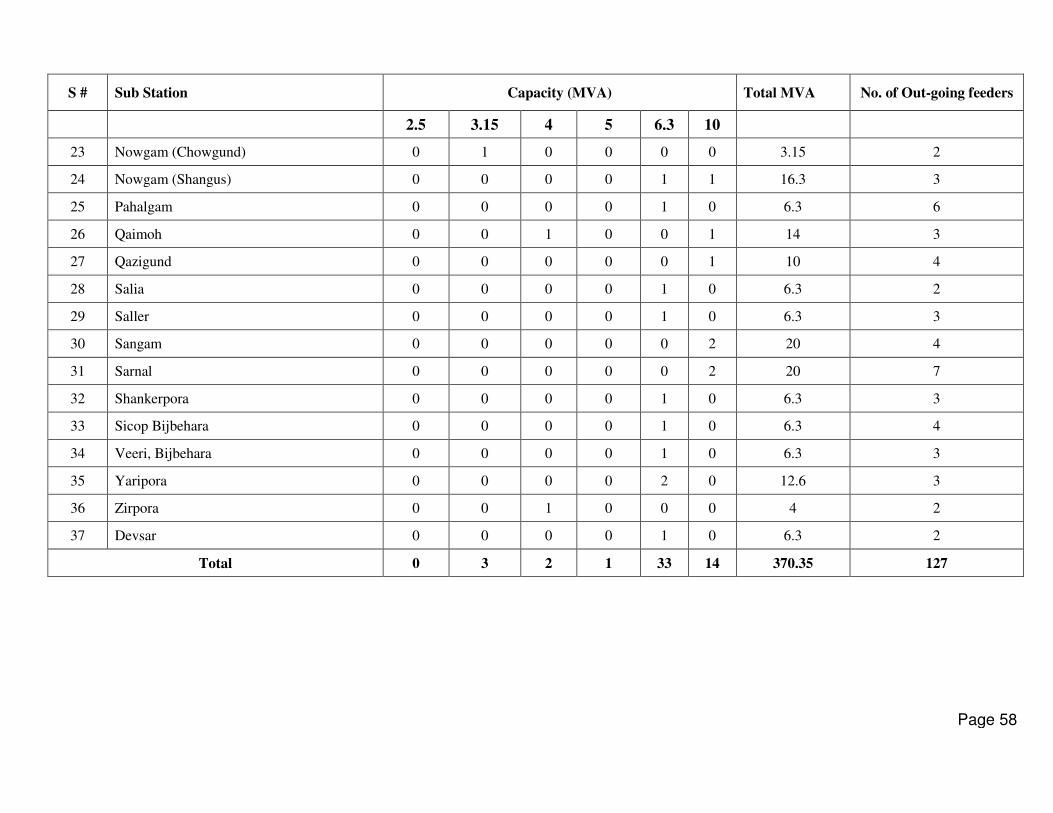
S # Sub Station Capacity (MVA) Total MVA No. of Out-going feeders
2.5 3.15 4 5 6.3 10
23 Nowgam (Chowgund) 0 1 0 0 0 0 3.15 2
24 Nowgam (Shangus) 0 0 0 0 1 1 16.3 3
25 Pahalgam 0 0 0 0 1 0 6.3 6
26 Qaimoh 0 0 1 0 0 1 14 3
27 Qazigund 0 0 0 0 0 1 10 4
28 Salia 0 0 0 0 1 0 6.3 2
29 Saller 0 0 0 0 1 0 6.3 3
30 Sangam 0 0 0 0 0 2 20 4
31 Sarnal 0 0 0 0 0 2 20 7
32 Shankerpora 0 0 0 0 1 0 6.3 3
33 Sicop Bijbehara 0 0 0 0 1 0 6.3 4
34 Veeri, Bijbehara 0 0 0 0 1 0 6.3 3
35 Yaripora 0 0 0 0 2 0 12.6 3
36 Zirpora 0 0 1 0 0 0 4 2
37 Devsar 0 0 0 0 1 0 6.3 2
Total 0 3 2 1 33 14 370.35 127
Page 58

CHAPTER 4
4.1 ELECTRIC POWER-INSTALLED CAPACITY STATE SECTOR UNDER POWER DEVELOPMENT CORPORATION
HYDRO 759.96MW
TOTAL NO. OF HYDEL PROJECTS 20
THERMAL 175MW
TOTAL NO. OF THERMAL PROJECTS(Operated only in case of emergency in view of high per unit generation cost) 2
UNDER POWER DEVELOPMENT DEPARTMENT
DIESEL 33.290 MW
CENTRAL SECTOR
HYDRO 1680 MW
TOTAL NO. OF HYDEL PROJECTS 4
INDEPENDENT POWER PRODUCERS Hydro 17.5 Total No of Hydel Projects 2
POWER PLNTS UNDER OPERATION IN THE STATE
Name of Power Plant Configuration Installed Capacity in MW
STATE SECTOR
Jhelum River Basin
Lower Jhelum 3 x 35 105
Upper Sindh-I 2x11.3 22.6
Ganderbal 2x3+2x4.5 15
Upper Sindh-II 3x35 105
Pahalgam 2 x 1.5 3
Karnah 2x1 2
Total 252.60
ChenabBasin
Chenani-I 5x4.66 23.3
Chennai-II 2x1 2 Page 59
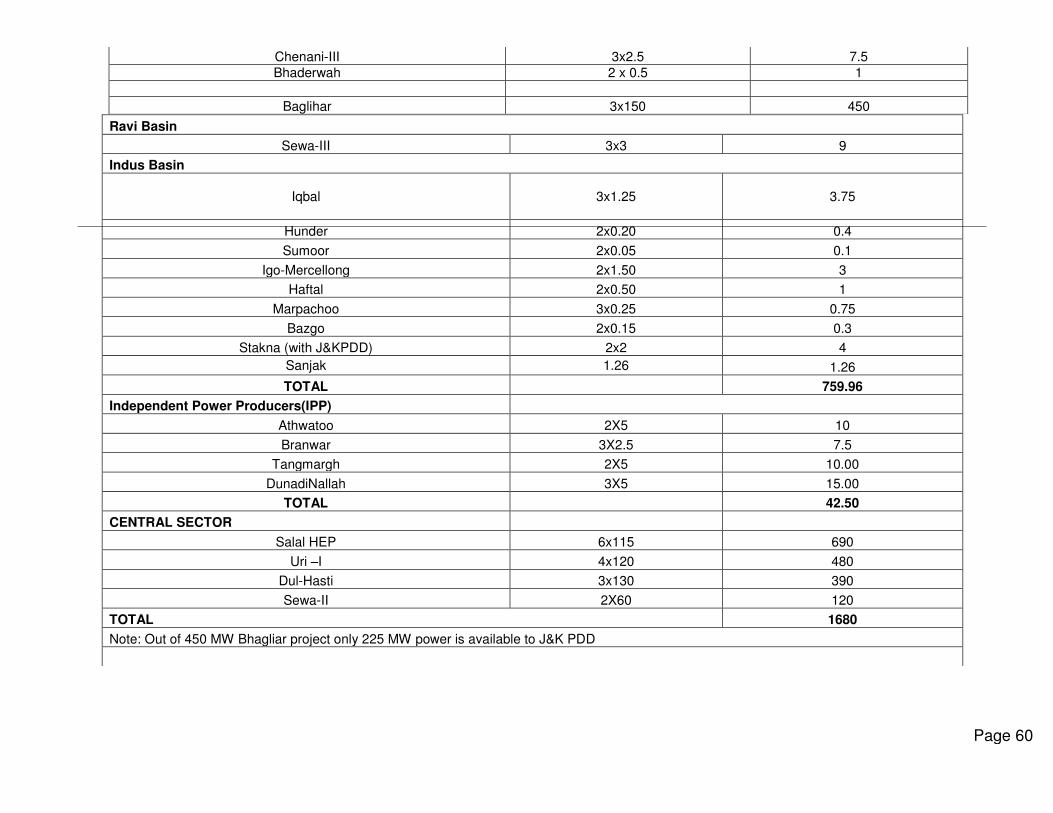
Chenani-III 3x2.5 7.5 Bhaderwah 2 x 0.5 1
Baglihar 3x150 450
Ravi Basin
Sewa-III 3x3 9
Indus Basin
Iqbal 3x1.25
3.75
Hunder 2x0.20 0.4
Sumoor 2x0.05 0.1
Igo-Mercellong 2x1.50 3
Haftal 2x0.50 1
Marpachoo 3x0.25 0.75
Bazgo 2x0.15 0.3
Stakna (with J&KPDD) 2x2 4
Sanjak 1.26 1.26
TOTAL 759.96
Independent Power Producers(IPP)
Athwatoo 2X5 10
Branwar 3X2.5 7.5
Tangmargh 2X5 10.00
DunadiNallah 3X5 15.00
TOTAL 42.50
CENTRAL SECTOR
Salal HEP 6x115 690
Uri –I 4x120 480
Dul-Hasti 3x130 390
Sewa-II 2X60 120
TOTAL 1680
Note: Out of 450 MW Bhagliar project only 225 MW power is available to J&K PDD
Page 60
Page 61
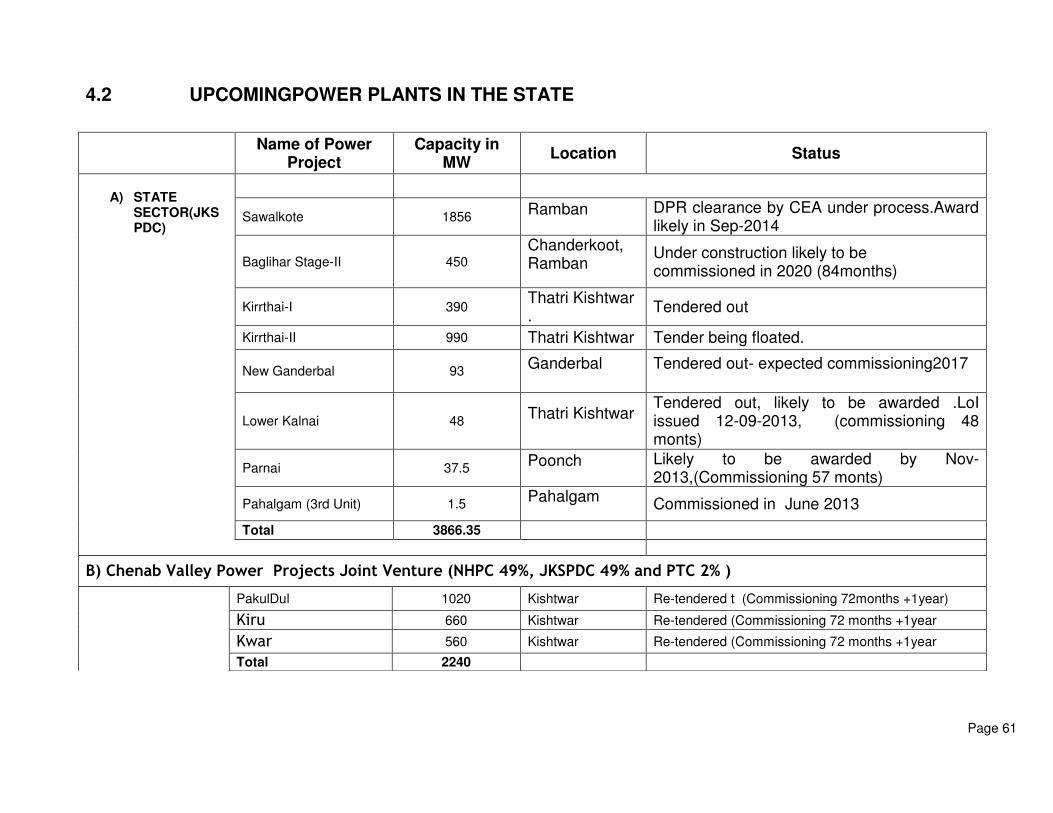
4.2 UPCOMINGPOWER PLANTS IN THE STATE
Name of Power
Project Capacity in
MW Location Status
A) STATE
SECTOR(JKSPDC)
Sawalkote 1856 Ramban
DPR clearance by CEA under process.Award likely in Sep-2014
Baglihar Stage-II 450 Chanderkoot, Ramban
Under construction likely to be commissioned in 2020 (84months)
Kirrthai-I 390 Thatri Kishtwar .
Tendered out
Kirrthai-II 990 Thatri Kishtwar Tender being floated.
New Ganderbal 93 Ganderbal
Tendered out- expected commissioning2017
Lower Kalnai 48 Thatri Kishtwar
Tendered out, likely to be awarded .LoI issued 12-09-2013, (commissioning 48 monts)
Parnai 37.5 Poonch
Likely to be awarded by Nov-2013,(Commissioning 57 monts)
Pahalgam (3rd Unit) 1.5 Pahalgam
Commissioned in June 2013
Total 3866.35
B) Chenab Valley Power Projects Joint Venture (NHPC 49%, JKSPDC 49% and PTC 2% )
PakulDul 1020 Kishtwar Re-tendered t (Commissioning 72months +1year)
Kiru 660 Kishtwar Re-tendered (Commissioning 72 months +1year
Kwar 560 Kishtwar Re-tendered (Commissioning 72 months +1year
Total 2240
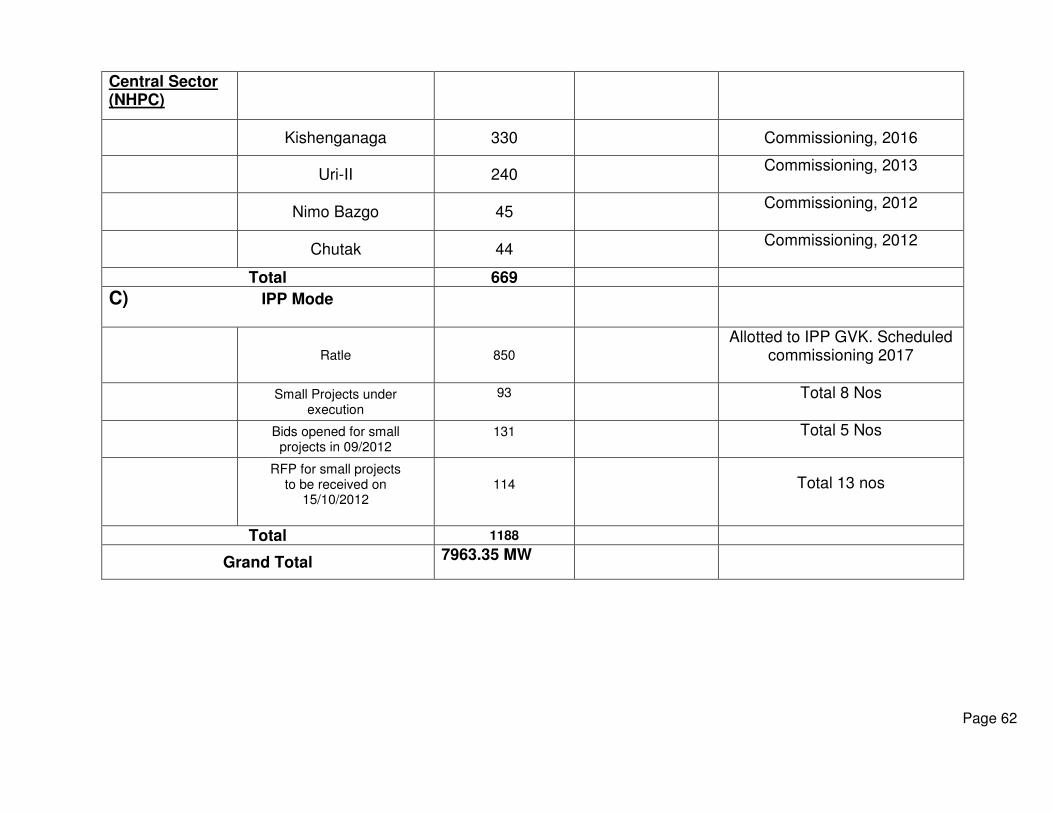
Central Sector (NHPC)
Kishenganaga 330 Commissioning, 2016
Uri-II 240 Commissioning, 2013
Nimo Bazgo 45 Commissioning, 2012
Chutak 44 Commissioning, 2012
Total 669
C) IPP Mode
Ratle 850
Allotted to IPP GVK. Scheduled commissioning 2017
Small Projects under execution
93
Total 8 Nos
Bids opened for small projects in 09/2012
131
Total 5 Nos
RFP for small projects to be received on
15/10/2012
114
Total 13 nos
Total 1188
Grand Total 7963.35 MW
Page 62
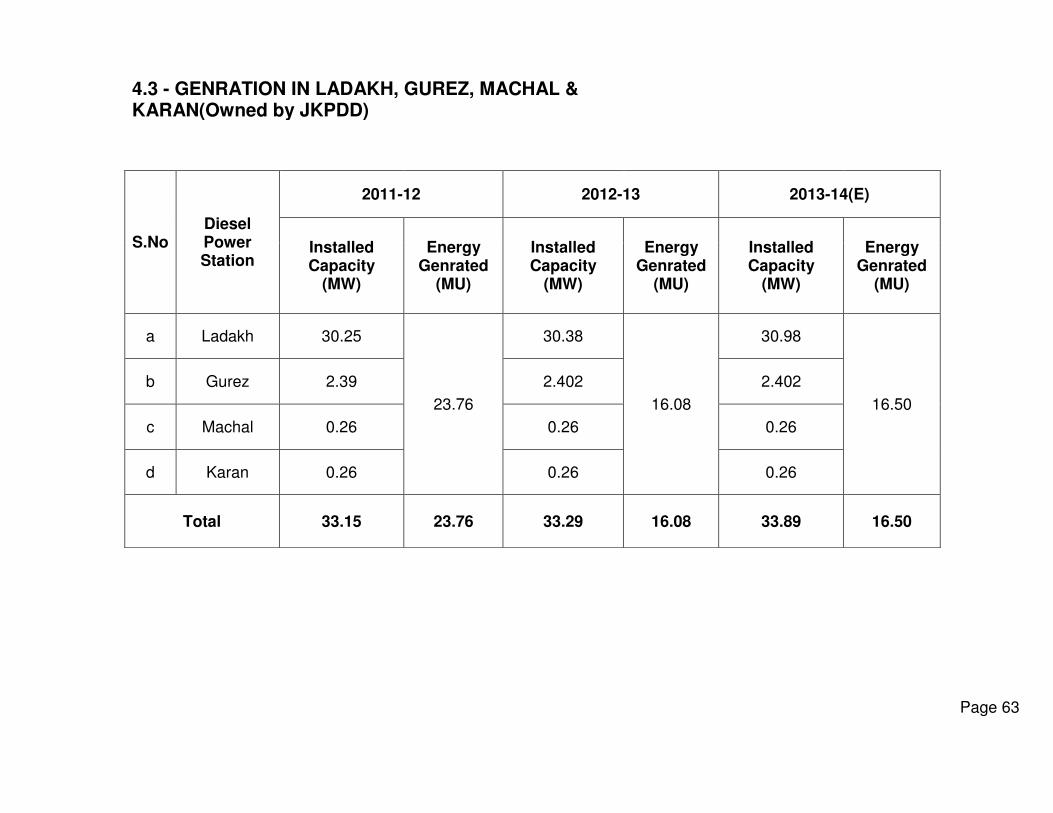
4.3 - GENRATION IN LADAKH, GUREZ, MACHAL & KARAN(Owned by JKPDD)
S.No Diesel Power Station
2011-12 2012-13 2013-14(E)
Installed Capacity
(MW)
Energy Genrated
(MU)
Installed Capacity
(MW)
Energy Genrated
(MU)
Installed Capacity
(MW)
Energy Genrated
(MU)
a Ladakh 30.25
23.76
30.38
16.08
30.98
16.50
b Gurez 2.39 2.402 2.402
c Machal 0.26 0.26 0.26
d Karan 0.26 0.26 0.26
Total 33.15 23.76 33.29 16.08 33.89 16.50
Page 63

4.4 LIST OF THE DG SETS WITH INSTALLED CAPACITIES IN LEH DISTRICT AS ON 31-03-2013
S # Name of the D.G station/Location
No. of Units (Nos.) Capacity of each Unit
(KVA)
Total Installed Capacity (KVA)
1 4.5 MVA Choglamsar 3 1500 4500 Aux DG at P/H II 1 40 40
2 4 MW Choglamsar
5 750 3750 3 1500 4500
Aux DG at 4.5 MVA 1 40 40 3 1 MW Leh 2 750 1500 4 Nyoma 1 160 160 5 Tangtse 1 250 250 6 Chumathang 1 160 160 7 Kungiam 1 160 160 8 Hemis 1 75 75 9 Anlay 1 160 160
10 Rongo 1 75 75 11 Tsaga 1 75 75 12 Korzok 1 82.5 82.5 13 Kharu 1 750 750 14 Puga 1 40 40 15 Chushul 1 160 160 16 Saspol 1 160 160 17 Temisgam 1 160 160 18 Alchi 1 160 160 19 Tia 1 160 160 20 Khalsi 1 250 250 21 Lamayuru 1 160 160 22 Domkhar 1 160 160 23 Skurbuchan 1 250 250 24 Hemisshukpachan 1 160 160 25 Achinathang 1 200 200 26 Wanla 1 320 320
Page 64

S # Name of the D.G station/Location
No. of Units (Nos.) Capacity of each Unit
(KVA)
Total Installed Capacity (KVA)
27 Mangue 1 100 100 28 Sku Kaya 1 30 30 29 Rumbak 1 10 10 30 Hanu 1 125 125 31 Bema 1 75 75 32 Nemo 1 750 750 33 Deskit-I 1 750 750 34 Deskit-II 1 250 250 35 Deskit-III 1 160 160 36 Turtuk 1 125 125 37 Bogdang 1 75 75 38 Panamik 1 160 160 39 Chamshain 1 75 75 40 Tigger 1 320 320 41 Tyakshi 1 160 160 42 Charasa 1 30 30 43 Kuri 1 30 30 44 Murgi 1 15 15 45 Tongsted 1 30 30 46 Khemi 1 15 15 47 Gonbo 1 12.5 12.5 48 Burma 1 15 15 49 Chulungkha 1 35 35 50 Hundri 1 35 35 51 Udmaroo 1 30 30 52 Tangyar 1 35 35 53 Khalsar 1 25 25 54 Khardong 1 125 125 55 Waris 1 15 15 56 Tsati 1 1 1
Total 30 3613.5
Page 65

4.5 LIST OF THE DG SETS WITH INSTALLED CAPACITIES IN KARGIL DISTRICT AS ON 31-03-2013
S.No. Name of the Power House No.of Units(Nos.) Capacity of each
Unit (KVA)
Total Installed
Capacity (KVA)
1
New DG Stn. Khurbathang 2 750 1500
New DG Stn. Khurbathang 3 1500 4500
Auxillary 1 40 40
2 Mulbeck 1 250 250
3 Shargole 1 250 250
4 Khangral 1 320 320
5 Haniskot 1 75 75
6 Chiktan 1 160 160
7 Hagnis 1 250 250
8 Shakar 1 320 320
9 Y-Kharboo 1 75 75
10 Sanjak 1 75 75
11 Garkone 1 75 75
12 Batalik 1 160 160
1 75 75
13 Silmoo 1 200 200
14 Padum 1 250 250
1 250 250
15 Junkhore 1 160 160
16 Sani 1 160 160
17 Karsha 1 320 320
18 Parkachik 1 160 160
19 Panikhar 1 250 250
20 Nam-Suru 1 250 250
Page 66

S.No. Name of the Power House No.of Units(Nos.) Capacity of each Unit
(KVA)
Total Installed
Capacity (KVA)
21 Purtikchey 1 160 160
22 Sangrah 1 250 250
23 Sankoo 1 320 320
1 250 250
24 Lankarchey 1 320 320
25 Stakpa 1 125 125
26 Saliskote 1 250 250
27 Trespone 1 250 250
1 250 250
28 Shakar Rong 1 30 30
29 Drass
1 250 250
1 320 320
1 250 250
1 250 250
30 Thasgam 1 160 160
31 Pandrass 1 75 75
32 Matayeen 1 75 75
33 Tanbis 1 320 320
34 Barsoo 1 160 160
35 Phey 1 320 320
36 Kharboo 1 200 200
37 Choskore 1 250 250
38 Khar chey Khar 1 200 200
39 Zangla 1 200 200
40 Abran 1 380 380
Total 25 5615
Page 67

4.6 - LIST OF THE DG SETS WITH INSTALLED CAPACITIES IN GUREZ,MACHIL AND KERAN
as on 31-03-2013
S.No.
Name of the D.G station/Location
No. of Units (Nos.)
Capacity of each Unit (KVA)
Total Installed Capacity (KVA)
A Gurez
1 Kanzalwan 1 320 320
2 Dawar 1+1 250+320 570
3 Wanpora 1 250 250
4 Tarbal 1 100 100
5 Bagtoor 1 100 100
6 Nayal 1 75 75
7 Achoora 1 82.5 82.5
8 Churwan 1 200 200
9 Burnai 1 82.5 82.5
10 Bodugam 1 200 200
11 Gujran 1 75 75
12 Zedgay 1 25 25
13 Koragbal 1 62.5 62.5
14 Khprihaijin 1 20 20
15 Hassangam 1 100 100
16 Purana Tulal/Sheikhpora 1 320 320
17 Buglender 1 320 320
18 Neeru 1 100 100
Total 3002.5
B Machil
Machil 1 320 320
C Keran
Keran 1 320 320
Toal 3642.5
Page 68
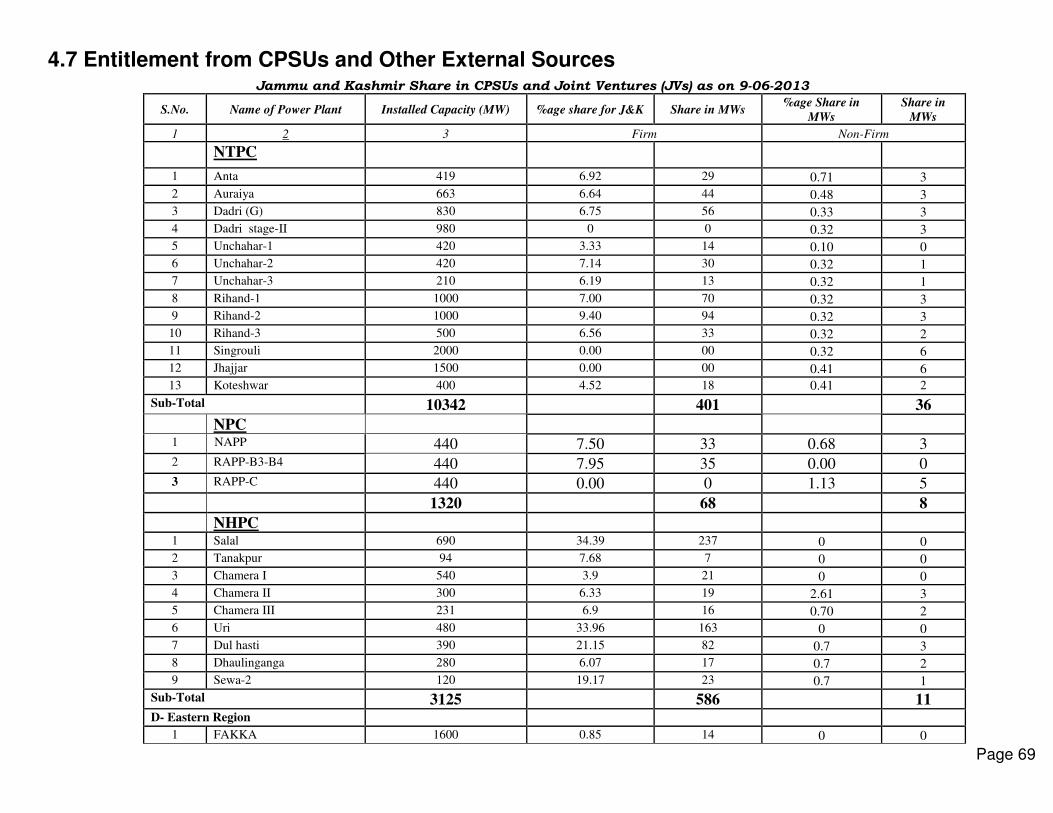
4.7 Entitlement from CPSUs and Other External Sources
Jammu and Kashmir Share in CPSUs and Joint Ventures (JVs) as on 9-06-2013
S.No. Name of Power Plant Installed Capacity (MW) %age share for J&K Share in MWs %age Share in
MWs
Share in
MWs
1 2 3 Firm Non-Firm
NTPC
1 Anta 419 6.92 29 0.71 3
2 Auraiya 663 6.64 44 0.48 3
3 Dadri (G) 830 6.75 56 0.33 3
4 Dadri stage-II 980 0 0 0.32 3
5 Unchahar-1 420 3.33 14 0.10 0
6 Unchahar-2 420 7.14 30 0.32 1
7 Unchahar-3 210 6.19 13 0.32 1
8 Rihand-1 1000 7.00 70 0.32 3
9 Rihand-2 1000 9.40 94 0.32 3
10 Rihand-3 500 6.56 33 0.32 2
11 Singrouli 2000 0.00 00 0.32 6
12 Jhajjar 1500 0.00 00 0.41 6
13 Koteshwar 400 4.52 18 0.41 2
Sub-Total 10342 401 36 NPC
1 NAPP 440 7.50 33 0.68 3 2 RAPP-B3-B4 440 7.95 35 0.00 0 3 RAPP-C 440 0.00 0 1.13 5 1320 68 8
NHPC
1 Salal 690 34.39 237 0 0
2 Tanakpur 94 7.68 7 0 0
3 Chamera I 540 3.9 21 0 0
4 Chamera II 300 6.33 19 2.61 3
5 Chamera III 231 6.9 16 0.70 2
6 Uri 480 33.96 163 0 0
7 Dul hasti 390 21.15 82 0.7 3
8 Dhaulinganga 280 6.07 17 0.7 2
9 Sewa-2 120 19.17 23 0.7 1
Sub-Total 3125 586 11 D- Eastern Region
1 FAKKA 1600 0.85 14 0 0
Page 69

2 KHLGN-I 840 3.68 31 0 0
3 KHLGN-II 1500 2.87 43 2.69 40
4 TECHR 1000 0.00 0 0.00 0
5 MEHA-6 250 7.08 18 0 0
Sub-total 5190 106 40
TEHRI 1000 4.80 48 0.46 5
Tala 1020 0.00 0 1.77 18
SJVNNL
N-JHAKHARI 1500 7.00 105 0.46 7
Sub total 3520 153 30
Additional Power Allocated by Hon’ble PM w.e.f 9-07-2013. 1 KAPP 440 0.00 0.00 0.89 3.92
2 KORBA 2100 0.00 0.00 1.02 21.46
3 KORBA-3 500 0.00 0.00 1.58 7.91
4 MOUDAI-1 500 0.00 0.00 1.58 7.91
5 SIPATI 1 1980 0.00 0.00 1.58 31.33
6 SIPATI 2 1000 0.00 0.00 1.31 13.11
7 TAPP-3&4 1080 0.00 0.00 1.33 14.34
8 VINDRACHAL-1 1260 0.00 0.00 1.27 16.05
9 VINDRACHAL-2 1000 0.00 0.00 1.29 12.95
10 VINDRACHAL-3 1000 0.00 0.00 1.31 13.11
11 VINDRACHAL-4 500 0.00 0.00 1.58 7.91
Sub total 11360 150 0.00 0
G.Total 34857 1313 275
Page 70
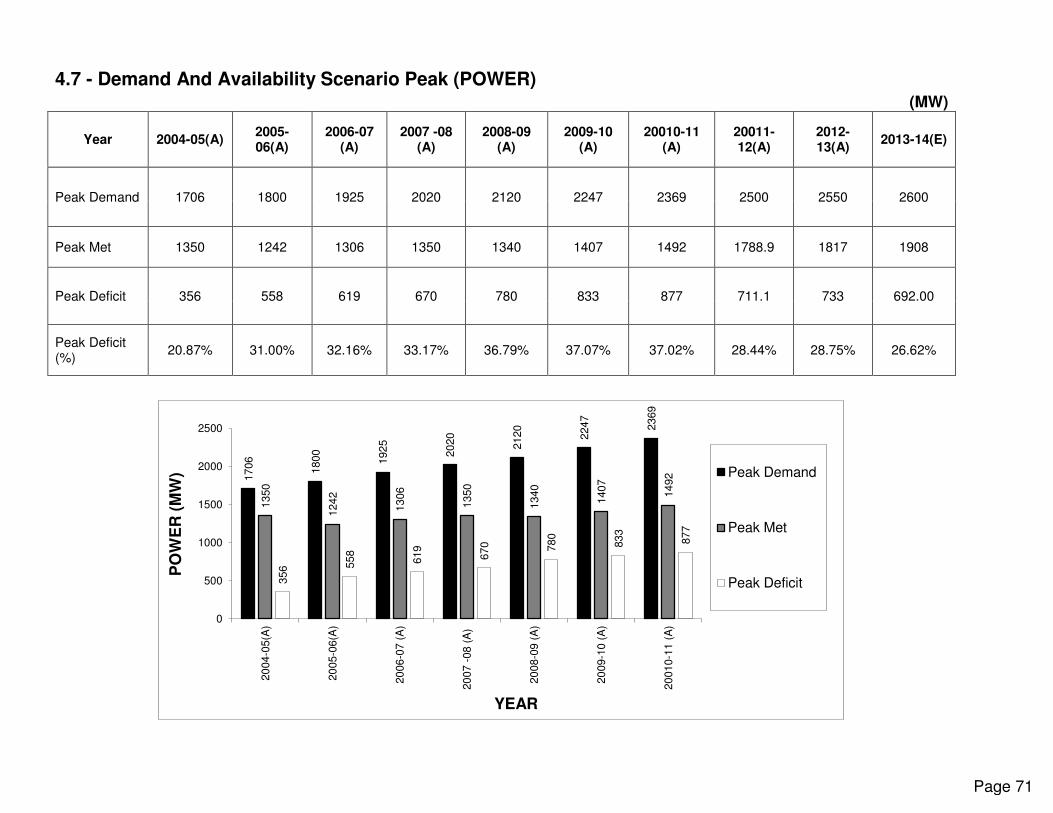
4.7 - Demand And Availability Scenario Peak (POWER) (MW)
Year 2004-05(A) 2005-06(A)
2006-07 (A)
2007 -08 (A)
2008-09 (A)
2009-10 (A)
20010-11 (A)
20011-12(A)
2012-13(A)
2013-14(E)
Peak Demand 1706 1800 1925 2020 2120 2247 2369 2500 2550 2600
Peak Met 1350 1242 1306 1350 1340 1407 1492 1788.9 1817 1908
Peak Deficit 356 558 619 670 780 833 877 711.1 733 692.00
Peak Deficit (%)
20.87% 31.00% 32.16% 33.17% 36.79% 37.07% 37.02% 28.44% 28.75% 26.62%
1706
1800
1925
2020
2120
2247
2369
1350
1242
1306
1350
1340
1407
1492
356 558
619
670
780
833
877
0
500
1000
1500
2000
2500
20
04-0
5(A
)
20
05-0
6(A
)
20
06-0
7 (
A)
20
07 -
08 (
A)
20
08-0
9 (
A)
20
09-1
0 (
A)
20
010-1
1 (
A)
PO
WE
R (
MW
)
YEAR
Peak Demand
Peak Met
Peak Deficit
Page 71

4.8 - Demand And Availability Scenario (ENERGY)
MU
YEAR 2004-05(A)
2005-06(A)
2006-07 (A)
2007 -08 (A)
2008-09(A)
2009-10(A)
2010-11 (A)
2011-12 (A)
2012-13 2013-14(E)
Energy Requirment
9640.00 10503.00 11343.00 14037.00 14750.00 15656.00 16544.00 17323.00 17669.46 18022.38
Restricted Energy
Availability 7306.00 7916.38 8236.53 8743.96 9147.21 10238.00 10667.00 11115.41 12120.025 12714.00
Energy Deficit
2334.00 2586.62 3106.47 5293.04 5602.79 5418.00 5877.00 6207.59 5560.96 5308.38
Energy Deficit (%)
24.21% 24.63% 27.39% 37.71% 37.99% 34.61% 35.52% 35.83% 31.47% 29.45%
9640.0
0
10503.0
0
11343.0
0
14037.0
0
14750.0
0
15656.0
0
16544.0
0
17323.0
0
17669.4
6
18022.3
8
7306.0
0
7916.3
8
8236.5
3
8743.9
6
9147.2
1
10238.0
0
10667.0
0
11115.4
1
12108.5
0
12714.0
0
2334.0
0
2586.6
2
3106.4
7
5293.0
4
5602.7
9
5418.0
0
5877.0
0
6207.5
9
5560.9
6
5308.3
8
0.00
2000.00
4000.00
6000.00
8000.00
10000.00
12000.00
14000.00
16000.00
18000.00
20000.00
200
4-0
5(A
)
200
5-0
6(A
)
200
6-0
7 (
A)
200
7 -
08
(A
)
200
8-0
9(A
)
200
9-1
0(A
)
201
0-1
1 (
A)
201
1-1
2 (
A)
201
2-1
3
201
3-1
4(E
)
EN
ER
GY
(M
U)
YEAR
Restricted EnergyAvailability
Energy Deficit
Energy Requirement
Page 72

Seasonal Power Deficit (Minimum-Maximum) (MWs)
S.No. Particular Year 2011-12 (A) Year 2012-13(A) Year 20 13-14(E)
Summer Winter Summer Winter Summer Winter
I. Unrestricted Demand 2200 2500 2400 2550 2520 2600
II. Restricted Demand 1560 1789 1712 1817 1798 1908
III.
Power Availability
(i) Self Generated 300-450 150-250 250-425 100-350 250-425 100-350
(ii) CPSUs 700-1250 650-1100 850-1350 750-1250 850-1350 750-1250
Total (i+ii) 1000-1700 650-1200 1100-1775 850-1600 1100-1775 850-1600
IV. Deficit(-) +140 to -560 -439 to -989 +63 to-612 -217 to-967 -23 to -698 -308 to-1058
*Summer = 8 hours curtailment Winter = 10 hours curtailment
Page 73

4.9 - Year Wise Statement of Energy Consumption
MU
S.No Year Energy
Purchased
1 1998-99 5429.57
2 1999-2000 4978.65
3 2000-01 5374.65
4 2001-02 5606.04
5 2002-03 6280.38
6 2003-04 7148.29
7 2004-05 7306.36
8 2005-06 7916.38
9 2006-07 8236.53
10 2007-08 8743.96
11 2008-09 9147.21
12 2009-10 10370.65
13 2010-11 10667.23
14 2011-12 11115.41
15 2012-13 12120.025
16 2013-14(E) 12714.00
54
29
.57
49
78
.65
53
74
.65
56
06
.04
62
80
.38
71
48
.29
73
06
.36
79
16
.38
82
36
.53
87
43
.96
91
47
.21
10
37
0.6
5
10
66
7.2
3
11
11
5.4
1
12
10
8.5
7
12
71
4.0
0
0
2000
4000
6000
8000
10000
12000
14000
19
98-9
9
19
99-2
000
20
00-0
1
20
01-0
2
20
02-0
3
20
03-0
4
20
04-0
5
20
05-0
6
20
06-0
7
20
07-0
8
20
08-0
9
20
09-1
0
20
10-1
1
20
11-1
2
20
12-1
3
20
13-1
4(E
)
En
erg
y C
on
su
mp
tio
n (
MU
)
Year
Page 74

4.10 - Year Wise Statement of Energy Purchased from Northern Grid12120.025
MU
S.No Year Energy Purchased
1 1997-98 3966.53
2 1998-99 4723.38
3 1999-2000 2637.69
4 2000-01 4808.30
5 2001-02 4989.48
6 2002-03 5778.65
7 2003-04 6232.70
8 2004-05 6560.71
9 2005-06 7045.91
10 2006-07 7265.19
11 2007-08 7873.40
12 2008-09 7488.62
13 2009-10 8269.424
14 2010-11 8356.41
15 2011-12 8534.57
16 2012-13 9600.85
16 2013-14 (E) 10154.00
39
66
.53
47
23
.38
26
37
.69
48
08
.30
49
89
.48
57
78
.65
62
32
.70
65
60
.71
70
45
.91
72
65
.19
78
73
.40
74
88
.62
82
69
.42
4
83
56
.41
85
34
.57
95
87
.17
10
15
4.0
0
0.00
2000.00
4000.00
6000.00
8000.00
10000.00
12000.00
19
97
-98
19
98
-99
19
99
-20
00
20
00
-01
20
01
-02
20
02
-03
20
03
-04
20
04
-05
20
05
-06
20
06
-07
20
07
-08
20
08
-09
20
09
-10
20
10
-11
20
11
-12
20
12
-13
20
13
-14
(E
)
En
erg
y P
urc
ha
se
d(M
U)
Year
Page 75

4.11 - Year Wise Statement of Self-Generated Energy of State Available to PDD
S.No Year Energy (MU)
1 1997-98 951.36
2 1998-99 713.32
3 1999-2000 638.34
4 2000-01 572.07
5 2001-02 622.78
6 2002-03 506.80
7 2003-04 924.84
8 2004-05 745.66
9 2005-06 870.47
10 2006-07 971.34
11 2007-08 879.34
12 2008-09 1658.58
13 2009-10 2101.23
14 2010-11 2310.82
15 2011-12 2580.838
16 2012-13 2519.94
17 2013-14(E) 2560.00
951.3
6
713.3
2
638.3
4
572.0
7
622.7
8
506.8
0
924.8
4
745.6
6
870.4
7
971.3
4
879.3
4
1658.5
8
2101.2
3
2310.8
2
2580.8
38
2521.4
0
2560.0
0
0.00
500.00
1000.00
1500.00
2000.00
2500.00
3000.00
1997-9
8
1998-9
9
1999-2
000
2000-0
1
2001-0
2
2002-0
3
2003-0
4
2004-0
5
2005-0
6
2006-0
7
2007-0
8
2008-0
9
2009-1
0
2010-1
1
2011-1
2
2012-1
3
En
erg
y (
MU
)
Year
Page 76

4.12 - Gross Per Capita Power Consumption of Jammu & Kashmir State
S.No Year
Consumption (MU)
Population (Million)
Per Capita Consumption
(kWHr)
4 2001-02 5606.04 10.14 552.66
5 2002-03 6280.38 10.41 603.22
6 2003-04 7148.29 10.68 669.37
7 2004-05 7306.36 10.95 667.44
8 2005-06 7916.38 11.25 703.80
9 2006-07 8236.53 11.52 715.24
10 2007-08 8752.75 11.78 742.80
11 2008-09 9147.217 12.05 759.03
12 2009-10 10370.65 12.32 841.85
13 2010-11 10667.229 12.55 849.98
14 2011-12 11115.41 12.80 868.39
15 2012-13 12120.025 13.05 927.86
16 2013-14(E) 12592.84 13.31 946.12
*Population source: www.censusindia.gov.in
552.66
603.22
669.37 667.44 703.80 715.24
742.80 759.03
841.85 849.98 868.39
927.86 946.12
0.00
100.00
200.00
300.00
400.00
500.00
600.00
700.00
800.00
900.00
1000.00
2001-0
2
2002-0
3
2003-0
4
2004-0
5
2005-0
6
2006-0
7
2007-0
8
2008-0
9
2009-1
0
2010-1
1
2011-1
2
2012-1
3
2013-1
4(E
)
Per
Cap
ita C
on
su
mp
tio
n (
Us)
Year
Page 77

Calculation of Gap between Average Cost of Supply(ACS) and Average Revenue Realised (ARR) and AT&C Losses
S.NO ITEM Unit 2002-
03 2003-
04 2004-
05 2005-
06 2006-
07 2007-
08 2008-
09 2009-10
2010-11
2011-12 2012-13
1 Self-Generation in State MU 506.8 924.84 745.66 870.47 971.34 870.56 1649.07 2101.23 2310.816 2580.838 2519.94
2 Import from CPSUs MU 5778.65 6232.7 6560.71 7045.91 7265.19 7873.4 7776.5 8269.424 8356.413 8534.570 9600.085
3 Total Energy (1+2) MU 6285.45 7157.54 7306.37 7916.38 8236.53 8743.96 9425.57 10370.65 10667.2 11115.408 12120.025
4 Billed Energy MU 3326 3718.8 3856 4188.55 4030.84 3331.6 3478 3833 4041.1 4267.000 5163.02
5 Billing Efficiency
(4/3x100) 52.92 51.96 52.78 52.91 48.94 38.10 36.90 36.96 37.88 38.39 42.64
6 Energy Costs
7 i. Power Purchased from
CPSUs incl U.I &RE Cr. 1267.85 1343.15 1339.62 1671.51 1415.45 1744.34 1459.5 1996.712 2157.629 3051.022 3489.75
8 ii. Power Purchased from
State Cr. 103.99 107.72 103.88 124.76 129.86 81.43 324.18 546.697 639.532 710.75 592.233
9 Total Power Purchase
Cost (6+7) Cr. 1371.84 1450.87 1443.5 1796.27 1545.31 1825.77 1783.68 2543.409 2797.161 3761.772 4081.983
10 I. O&M Cr. 18.12 26.27 32.43 28.28 28.78 41.27 43.34 55.35 48.72 58.96 55.32
11 ii. Establishment Cr. 105.8 115.07 155.59 123.93 211.52 288.95 237.58 339.04 410.82 536.385 515.98
12 iii. Depreciation Cr. 48.07 49.1 55.1 57.15 58.52 62.58 68.94 82.73 87.85 105.14 179.6
13 iv. Intrest Cr. 32.87 22 32.89 22.67 21.46 16.97 14.37 14.97 11.2 15.76 25.88
14 Total Cost of
Supply(9+10+11+12+13) Cr. 1576.7 1663.31 1719.51 2028.3 1865.59 2235.53 2147.91 3035.499 3355.751 4478.012 4858.763
Page 78

S.NO ITEM Unit 2002-
03 2003-04 2004-05 2005-06
2006-07
2007-08 2008-09 2009-10 2010-11 2011-12 2012-13
15
Cost of Supply* (After
losses I,e on billed
energy) (14/4)
Paisa/U
474.05 447.27 445.93 484.25 462.83 671.01 606.97 791.94 830.41 1049.45 941.07
16
Average Cost of
Supply** (Before
Losses i,e on input
energy) ACS (14/3)
*100
Paisa/ Unit
250.85 232.39 235.34 256.22 226.5 255.67 235.06 292.70 314.59 402.87 401.27
17 Pure Revenue Billed
or Assessed (Gross) Cr. 446.44 549 543.70 590.59 592.53 816.24 829.50 928.00 1180.65 1428.68 1682.44
18 Average Revenue
Realised (ARR) (17/3)
Paisa/U
71 77 74 74 72 971 90.99 89.48 110.68 128.53 138.95
19 Gap between ACS
and ARR (16-18)
Paisa/
Unit 179.82 155.68 161.1 181.79 154.44 158.59 144.07 203.22 203.90 274.33 262.32
20 Revenue Realised
(without ED) Cr. 293.65 308.67 341.47 371.54 393.41 591.97 628 702.30 802.82 1014.16 1419.29
21 Average Tariff Rs./Unit 1.34 1.41 1.41 1.41 1.47 2.45 2.385 2.42 2.53 3.35 3.86
22 Energy Realised
(4x23)/100 MU 2191.42 2189.15 2421.77 2635.04 2676.26 2416.20 2633.12 2902.07 3173.20 3027.34 4355.47
23 Collection Efficiency
(20/17*100) % 65.78 56.22 62.95 63.06 66.28 69.74 75.71 75.68 68.00 70.99 84.36
24 T&D Losses ((3-
4)/3*100) % 47.08 48.04 47.22 47.09 51.06 61.90 63.10 63.04 62.12 61.61 57.40
25 AT&C Losses
(3-22)/3*100) % 65.14 69.41 66.85 66.71 67.51 72.37 72.06 72.02 70.25 72.76 64.14
Page 79
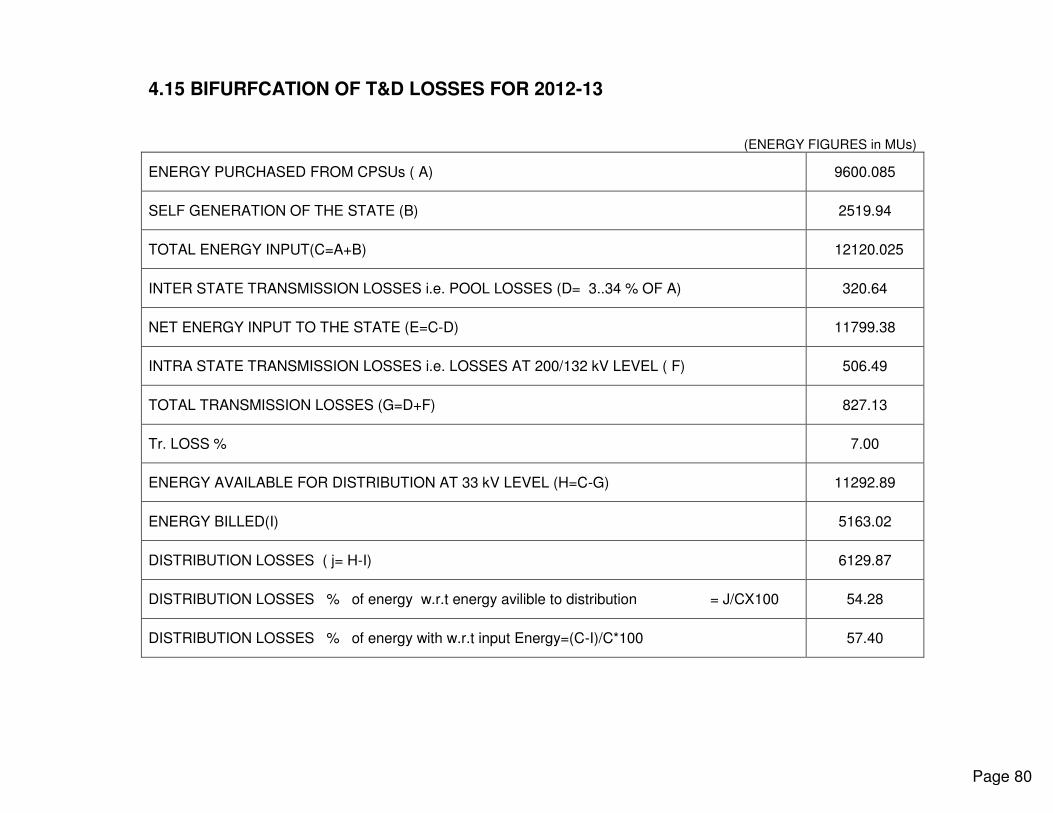
4.15 BIFURFCATION OF T&D LOSSES FOR 2012-13
(ENERGY FIGURES in MUs)
ENERGY PURCHASED FROM CPSUs ( A) 9600.085
SELF GENERATION OF THE STATE (B) 2519.94
TOTAL ENERGY INPUT(C=A+B) 12120.025
INTER STATE TRANSMISSION LOSSES i.e. POOL LOSSES (D= 3..34 % OF A) 320.64
NET ENERGY INPUT TO THE STATE (E=C-D) 11799.38
INTRA STATE TRANSMISSION LOSSES i.e. LOSSES AT 200/132 kV LEVEL ( F) 506.49
TOTAL TRANSMISSION LOSSES (G=D+F) 827.13
Tr. LOSS % 7.00
ENERGY AVAILABLE FOR DISTRIBUTION AT 33 kV LEVEL (H=C-G) 11292.89
ENERGY BILLED(I) 5163.02
DISTRIBUTION LOSSES ( j= H-I) 6129.87
DISTRIBUTION LOSSES % of energy w.r.t energy avilible to distribution = J/CX100 54.28
DISTRIBUTION LOSSES % of energy with w.r.t input Energy=(C-I)/C*100 57.40
Page 80
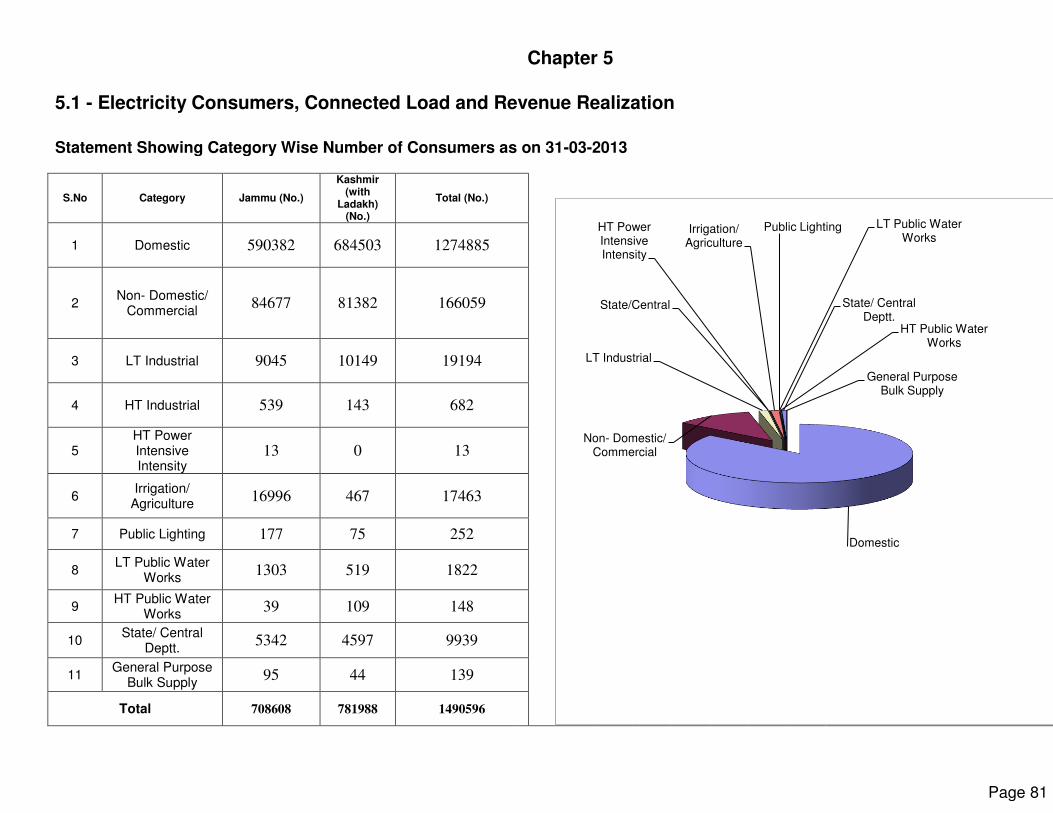
Chapter 5
5.1 - Electricity Consumers, Connected Load and Revenue Realization
Statement Showing Category Wise Number of Consumers as on 31-03-2013
S.No Category Jammu (No.)
Kashmir (with
Ladakh) (No.)
Total (No.)
1 Domestic 590382 684503 1274885
2 Non- Domestic/
Commercial 84677 81382 166059
3 LT Industrial 9045 10149 19194
4 HT Industrial 539 143 682
5 HT Power Intensive Intensity
13 0 13
6 Irrigation/
Agriculture 16996 467 17463
7 Public Lighting 177 75 252
8 LT Public Water
Works 1303 519 1822
9 HT Public Water
Works 39 109 148
10 State/ Central
Deptt. 5342 4597 9939
11 General Purpose
Bulk Supply 95 44 139
Total 708608 781988 1490596
Domestic
Non- Domestic/ Commercial
LT Industrial
State/Central
HT Power Intensive Intensity
Irrigation/ Agriculture
Public Lighting LT Public Water Works
HT Public Water Works
State/ Central Deptt.
General Purpose Bulk Supply
Page 81

5.2 - Category-wise Consumption for 2012-13
S.No Category
Jammu (MU)
Kashmir (MU)
Total (MUs)
%age
1 Domestic 750.389 1719 2469.39 47.83
2 Non- Domestic/ Commercial
230.359 91.61 321.97 6.24
3 Industrial 817.504 137.52 955.02 18.50
6 Irrigation/ Agriculture
205.055 91.68 296.74 5.75
7 Public Lighting
33.09 4.58 37.67 0.01
9 Public Water Works
435.619 45.84 481.46 9.33
10 State/ Central Deptt.
273.914 169.69 443.60 8.59
11 General Purpose Bulk Supply
125.087 32.08 157.17 3.04
Total 2871.017 2292.00 5163.02
Domestic
Non- Domestic/ Commercial
Industrial
S/Central
Pu
blic
L
igh
tin
g
Public Water Works
State/ Central Deptt.
General Purpose Bulk Supply
Page 82
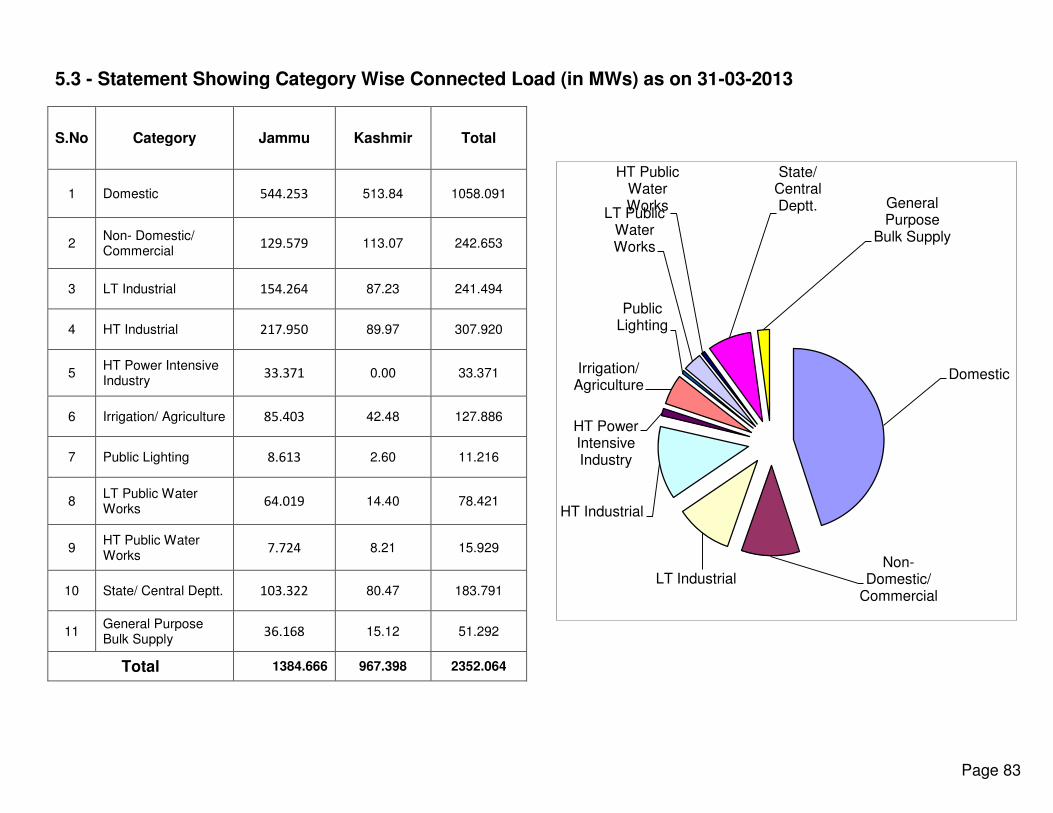
5.3 - Statement Showing Category Wise Connected Load (in MWs) as on 31-03-2013
S.No Category Jammu Kashmir Total
1 Domestic 544.253 513.84 1058.091
2 Non- Domestic/ Commercial
129.579 113.07 242.653
3 LT Industrial 154.264 87.23 241.494
4 HT Industrial 217.950 89.97 307.920
5
HT Power Intensive Industry
33.371 0.00 33.371
6 Irrigation/ Agriculture 85.403 42.48 127.886
7 Public Lighting 8.613 2.60 11.216
8
LT Public Water Works
64.019 14.40 78.421
9
HT Public Water Works
7.724 8.21 15.929
10 State/ Central Deptt. 103.322 80.47 183.791
11
General Purpose Bulk Supply
36.168 15.12 51.292
Total 1384.666 967.398 2352.064
Domestic
Non- Domestic/
Commercial LT Industrial
HT Industrial
HT Power Intensive Industry
Irrigation/ Agriculture
Public Lighting
LT Public Water Works
HT Public Water Works
State/ Central Deptt. General
Purpose Bulk Supply
Page 83
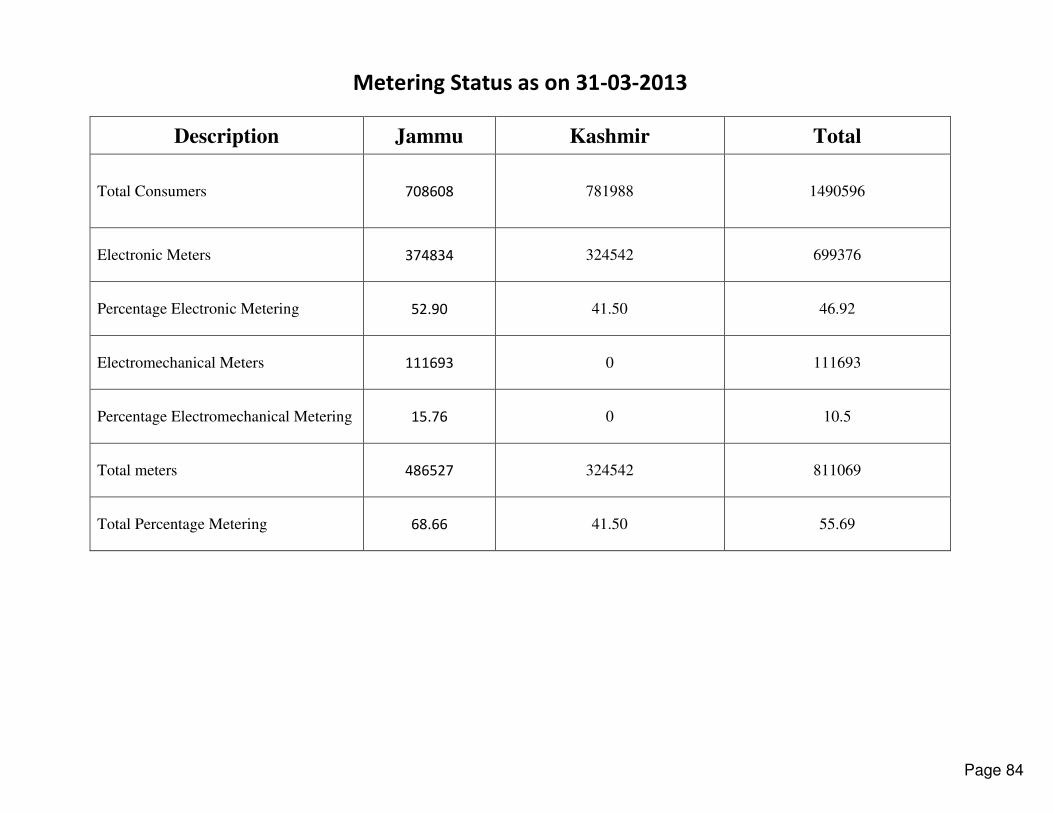
Metering Status as on 31-03-2013
Description Jammu Kashmir Total
Total Consumers 708608 781988 1490596
Electronic Meters 374834 324542 699376
Percentage Electronic Metering 52.90 41.50 46.92
Electromechanical Meters 111693 0 111693
Percentage Electromechanical Metering 15.76 0 10.5
Total meters 486527 324542 811069
Total Percentage Metering 68.66 41.50 55.69
Page 84

5.5 - Statement showing year wise Revenue Realization
S.No Year
Total Revenue
Realization (Rs in
Crores)
ED (Crs) Rev.
Pure(Crs)+Misc.
1 2010-11 267.39 27.54 239.85
2 2002-03 323.19 29.14 294.05
3 2003-04 342.62 33.1 309.52
4 2004-05 398.77 54.75 344.02
5 2005-06 436.20 64.46 371.74
6 2006-07 455.47 60.21 395.26
7 2007-08 693.24 99.31 593.93
8 2008-09 737.51 108.00 629.51
9 2009-10 823.53 120.32 703.21
9 2010-11 950.40 147.58 802.82
10 2011-12 1200.14 183.7 1016.45
11 2012-13 1697.17 277.88 1415.63
10 2013-14(E) 1870.02 291.05 1563.78
267.39 323.19 342.62
398.77 436.20 455.47
693.24 737.51
823.53
950.40
1200.14
1697.17
1870.02
0.00
200.00
400.00
600.00
800.00
1000.00
1200.00
1400.00
1600.00
1800.00
2000.00
201
0-1
1
200
2-0
3
200
3-0
4
200
4-0
5
200
5-0
6
200
6-0
7
200
7-0
8
200
8-0
9
200
9-1
0
201
0-1
1
201
1-1
2
201
2-1
3
201
3-1
4(E
)
Re
ve
nu
e R
ea
liza
tio
n(C
rore
s)
Year
Page 85

5.5 a Category-wise Revenue Realized for the year 2010-11 to 2013 in respect of Elect. Maintt. & RE Wings.
(Amount inCrores)
S.No. Category of Consumres
2010-11 2011-12 2012-13
Pure Revenue
ED Total Pure
Revenue ED Total
Pure Revenue
ED Total
1 . Domestic 170.52 38.48 209.00 245.21
52.56 297.38
325.55 73.75 399.30
2 . N. Domestic/ Commercial
80.07 18.25 98.32 104.75 22.61
128.15 144.39 32.60
176.99
3 . Irri/Agriculture 31.47 7.24 38.71 35.24
7.89 42.97 56.08 9.04 65.12
4 . State/Central 208.38 11.82 220.20 237.9
14.13 232.8 409.25 54.45 463.70
5 . Public Lighting 0.11 0.03 0.14 0.06
0.01 0.07
0.19 0.04 0.23
6 . L.T Industrial 39.00 9.02 48.02 45.04
9.71 54.73
55.85 12.76 68.61
7 . H.T Industrial 132.60 30.61 163.21 167.02
27.42 205.85
209.95 47.07 257.03
8 . Power Intensive Industries
24.17 7.70 31.87 30.18 9.73
36.87 34.13 7.59
41.72
9 . L. T Public Water Works
68.18 16.67 84.85 92.36 19.05
113.31 108.30 24.17
132.47
10 . H. T Public Water Works
15.82 2.19 18.01 19.93 12.53
23.63 27.43 6.28
33.71
11 . Gen. Purpose Bulk Supply
30.59 5.57 36.16 36.53 8.07
62.09 44.51 10.13
54.64
Total:- 800.91 147.58 948.49 1014.22 183.71 1197.85 1415.63 277.88 1693.51
Rev. Miscl. 2.29
3.66
Grand Total 1200.14
1697.17
Page 86
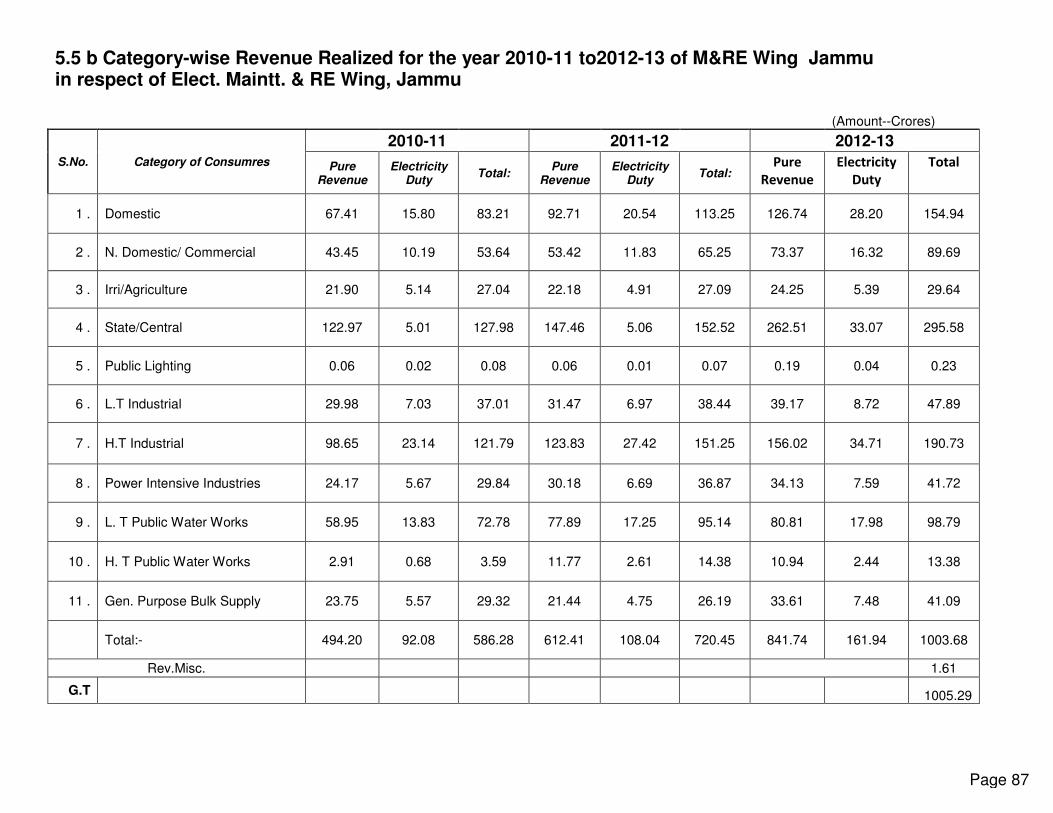
5.5 b Category-wise Revenue Realized for the year 2010-11 to2012-13 of M&RE Wing Jammu in respect of Elect. Maintt. & RE Wing, Jammu
(Amount--Crores)
S.No. Category of Consumres
2010-11 2011-12 2012-13
Pure Revenue
Electricity Duty
Total: Pure
Revenue Electricity
Duty Total:
Pure
Revenue
Electricity
Duty
Total
1 . Domestic 67.41 15.80 83.21 92.71 20.54 113.25 126.74 28.20 154.94
2 . N. Domestic/ Commercial 43.45 10.19 53.64 53.42 11.83 65.25 73.37 16.32 89.69
3 . Irri/Agriculture 21.90 5.14 27.04 22.18 4.91 27.09 24.25 5.39 29.64
4 . State/Central 122.97 5.01 127.98 147.46 5.06 152.52 262.51 33.07 295.58
5 . Public Lighting 0.06 0.02 0.08 0.06 0.01 0.07 0.19 0.04 0.23
6 . L.T Industrial 29.98 7.03 37.01 31.47 6.97 38.44 39.17 8.72 47.89
7 . H.T Industrial 98.65 23.14 121.79 123.83 27.42 151.25 156.02 34.71 190.73
8 . Power Intensive Industries 24.17 5.67 29.84 30.18 6.69 36.87 34.13 7.59 41.72
9 . L. T Public Water Works 58.95 13.83 72.78 77.89 17.25 95.14 80.81 17.98 98.79
10 . H. T Public Water Works 2.91 0.68 3.59 11.77 2.61 14.38 10.94 2.44 13.38
11 . Gen. Purpose Bulk Supply 23.75 5.57 29.32 21.44 4.75 26.19 33.61 7.48 41.09
Total:- 494.20 92.08 586.28 612.41 108.04 720.45 841.74 161.94 1003.68
Rev.Misc.
1.61
G.T 1005.29
Page 87
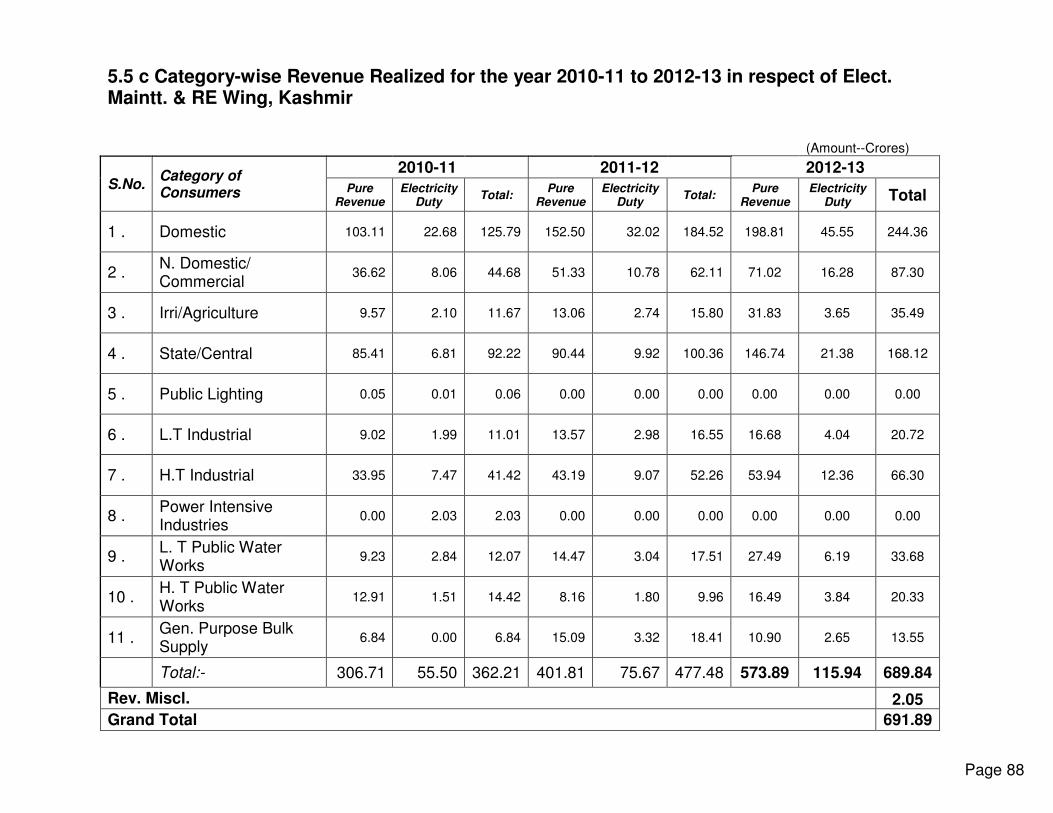
5.5 c Category-wise Revenue Realized for the year 2010-11 to 2012-13 in respect of Elect. Maintt. & RE Wing, Kashmir
(Amount--Crores)
S.No. Category of Consumers
2010-11 2011-12 2012-13
Pure Revenue
Electricity Duty
Total: Pure
Revenue Electricity
Duty Total:
Pure Revenue
Electricity Duty Total
1 . Domestic 103.11 22.68 125.79 152.50 32.02 184.52 198.81 45.55 244.36
2 . N. Domestic/ Commercial
36.62 8.06 44.68 51.33 10.78 62.11 71.02 16.28 87.30
3 . Irri/Agriculture 9.57 2.10 11.67 13.06 2.74 15.80 31.83 3.65 35.49
4 . State/Central 85.41 6.81 92.22 90.44 9.92 100.36 146.74 21.38 168.12
5 . Public Lighting 0.05 0.01 0.06 0.00 0.00 0.00 0.00 0.00 0.00
6 . L.T Industrial 9.02 1.99 11.01 13.57 2.98 16.55 16.68 4.04 20.72
7 . H.T Industrial 33.95 7.47 41.42 43.19 9.07 52.26 53.94 12.36 66.30
8 . Power Intensive Industries
0.00 2.03 2.03 0.00 0.00 0.00 0.00 0.00 0.00
9 . L. T Public Water Works
9.23 2.84 12.07 14.47 3.04 17.51 27.49 6.19 33.68
10 . H. T Public Water Works
12.91 1.51 14.42 8.16 1.80 9.96 16.49 3.84 20.33
11 . Gen. Purpose Bulk Supply
6.84 0.00 6.84 15.09 3.32 18.41 10.90 2.65 13.55
Total:- 306.71 55.50 362.21 401.81 75.67 477.48 573.89 115.94 689.84
Rev. Miscl. 2.05
Grand Total 691.89
Page 88
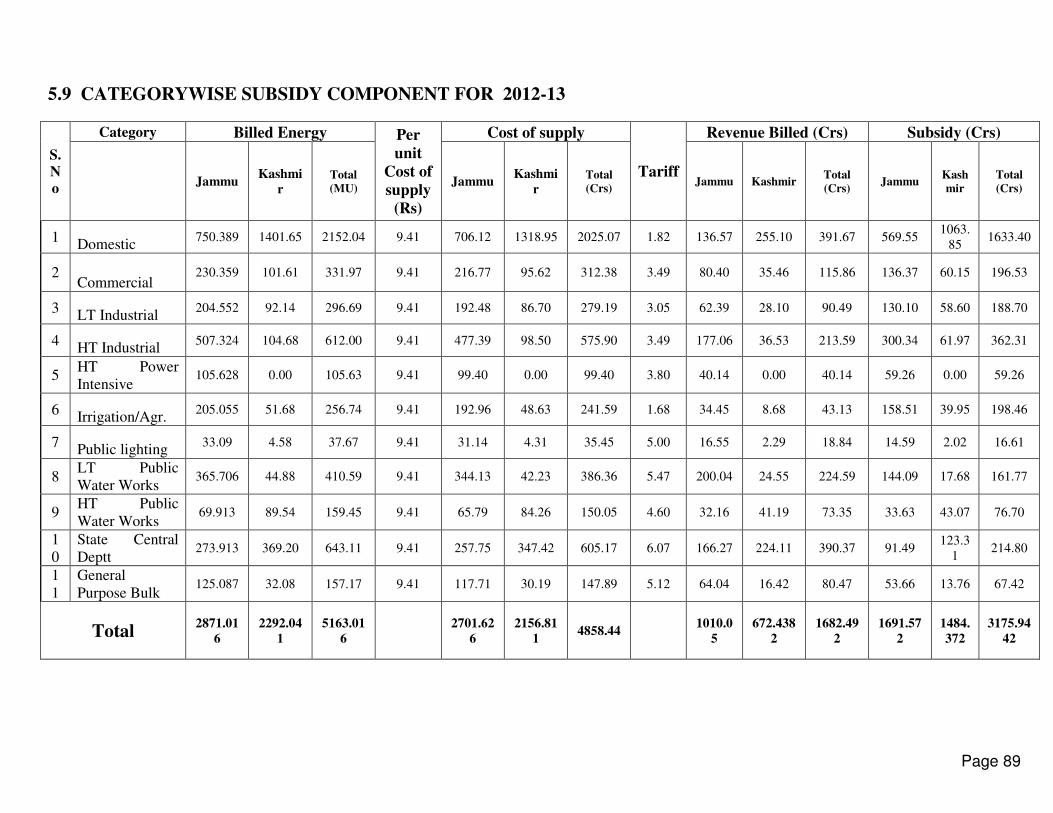
5.9 CATEGORYWISE SUBSIDY COMPONENT FOR 2012-13
S.
N
o
Category Billed Energy Per
unit
Cost of
supply
(Rs)
Cost of supply
Tariff
Revenue Billed (Crs) Subsidy (Crs)
Jammu Kashmi
r Total
(MU) Jammu
Kashmi
r Total
(Crs) Jammu Kashmir
Total
(Crs) Jammu
Kash
mir
Total
(Crs)
1 Domestic
750.389 1401.65 2152.04 9.41 706.12 1318.95 2025.07 1.82 136.57 255.10 391.67 569.55 1063.
85 1633.40
2 Commercial
230.359 101.61 331.97 9.41 216.77 95.62 312.38 3.49 80.40 35.46 115.86 136.37 60.15 196.53
3 LT Industrial
204.552 92.14 296.69 9.41 192.48 86.70 279.19 3.05 62.39 28.10 90.49 130.10 58.60 188.70
4 HT Industrial
507.324 104.68 612.00 9.41 477.39 98.50 575.90 3.49 177.06 36.53 213.59 300.34 61.97 362.31
5 HT Power
Intensive 105.628 0.00 105.63 9.41 99.40 0.00 99.40 3.80 40.14 0.00 40.14 59.26 0.00 59.26
6 Irrigation/Agr.
205.055 51.68 256.74 9.41 192.96 48.63 241.59 1.68 34.45 8.68 43.13 158.51 39.95 198.46
7 Public lighting
33.09 4.58 37.67 9.41 31.14 4.31 35.45 5.00 16.55 2.29 18.84 14.59 2.02 16.61
8 LT Public
Water Works 365.706 44.88 410.59 9.41 344.13 42.23 386.36 5.47 200.04 24.55 224.59 144.09 17.68 161.77
9 HT Public
Water Works 69.913 89.54 159.45 9.41 65.79 84.26 150.05 4.60 32.16 41.19 73.35 33.63 43.07 76.70
1
0
State Central
Deptt 273.913 369.20 643.11 9.41 257.75 347.42 605.17 6.07 166.27 224.11 390.37 91.49
123.3
1 214.80
1
1
General
Purpose Bulk 125.087 32.08 157.17 9.41 117.71 30.19 147.89 5.12 64.04 16.42 80.47 53.66 13.76 67.42
Total 2871.01
6
2292.04
1
5163.01
6
2701.62
6
2156.81
1 4858.44
1010.0
5
672.438
2
1682.49
2
1691.57
2
1484.
372
3175.94
42
Page 89
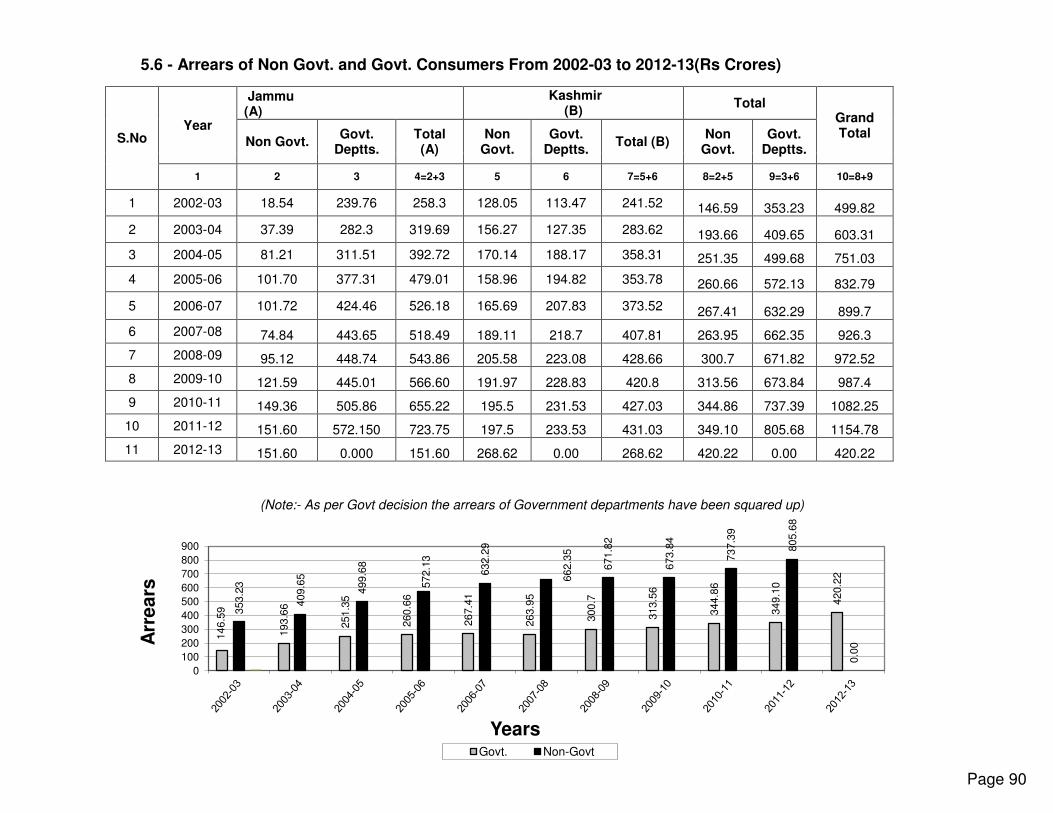
5.6 - Arrears of Non Govt. and Govt. Consumers From 2002-03 to 2012-13(Rs Crores)
S.No Year
Jammu (A)
Kashmir (B)
Total Grand Total
Non Govt. Govt.
Deptts. Total (A)
Non Govt.
Govt. Deptts.
Total (B) Non
Govt. Govt.
Deptts. 1 2 3 4=2+3 5 6 7=5+6 8=2+5 9=3+6 10=8+9
1 2002-03 18.54 239.76 258.3 128.05 113.47 241.52 146.59 353.23 499.82 2 2003-04 37.39 282.3 319.69 156.27 127.35 283.62 193.66 409.65 603.31 3 2004-05 81.21 311.51 392.72 170.14 188.17 358.31 251.35 499.68 751.03 4 2005-06 101.70 377.31 479.01 158.96 194.82 353.78 260.66 572.13 832.79 5 2006-07 101.72 424.46 526.18 165.69 207.83 373.52 267.41 632.29 899.7 6 2007-08 74.84 443.65 518.49 189.11 218.7 407.81 263.95 662.35 926.3 7 2008-09 95.12 448.74 543.86 205.58 223.08 428.66 300.7 671.82 972.52 8 2009-10 121.59 445.01 566.60 191.97 228.83 420.8 313.56 673.84 987.4 9 2010-11 149.36 505.86 655.22 195.5 231.53 427.03 344.86 737.39 1082.25 10 2011-12 151.60 572.150 723.75 197.5 233.53 431.03 349.10 805.68 1154.78 11 2012-13 151.60 0.000 151.60 268.62 0.00 268.62 420.22 0.00 420.22
(Note:- As per Govt decision the arrears of Government departments have been squared up)
146.5
9
193.6
6
251.3
5
260.6
6
267.4
1
263.9
5
300.7
313.5
6
344.8
6
349.1
0
420.2
2
353.2
3
409.6
5
499.6
8
572.1
3
632.2
9
662.3
5
671.8
2
673.8
4
737.3
9
805.6
8
0.0
0
0
100
200
300
400
500
600
700
800
900
Arr
ears
Years Govt. Non-Govt
Page 90

Schemes under implementation
6.1 - RGGVY:
RGGVY is basically ascheme for 100% Rural Electrification.
14 Schemes covering whole of J&K State were submitted to REC at a total estimated DPR (Detailed Project
Report) cost of Rs. 1051.73crores. All these schemes have been sanctioned by REC at a cost of Rs. 940.06
crores and Rs797.71croreshave been released ending 3/2013, against which an amount of Rs 713.64 has been
spent ending 3/2012.
Above RGGVY Schemes envisages electrification of 283no. virgin villages, un-electrified villages and de-
electrified villages, which are financially viable for electrification within the Grid System.
295221no. Rural Household connections are proposed to be provided under these RGGVY schemes.
136747no. BPL households are earmarked to be electrified free of cost and 5889 no. already electrified villages
to be covered for intensive electrification under the scheme.
As per guidelines of RGGVY, the execution of work for 7 districts each has been ensured to NHPC and
J&KSPDC as under:
NHPC: Udhampur, Kathua, Jammu, Srinagar, Budgam, Leh and Kargil.
J&KSPDC: Kupwara, Anantnag, Doda, Baramullah, Pulwama, Rajouri and Poonch.
Page 91
, .
Chapter-6
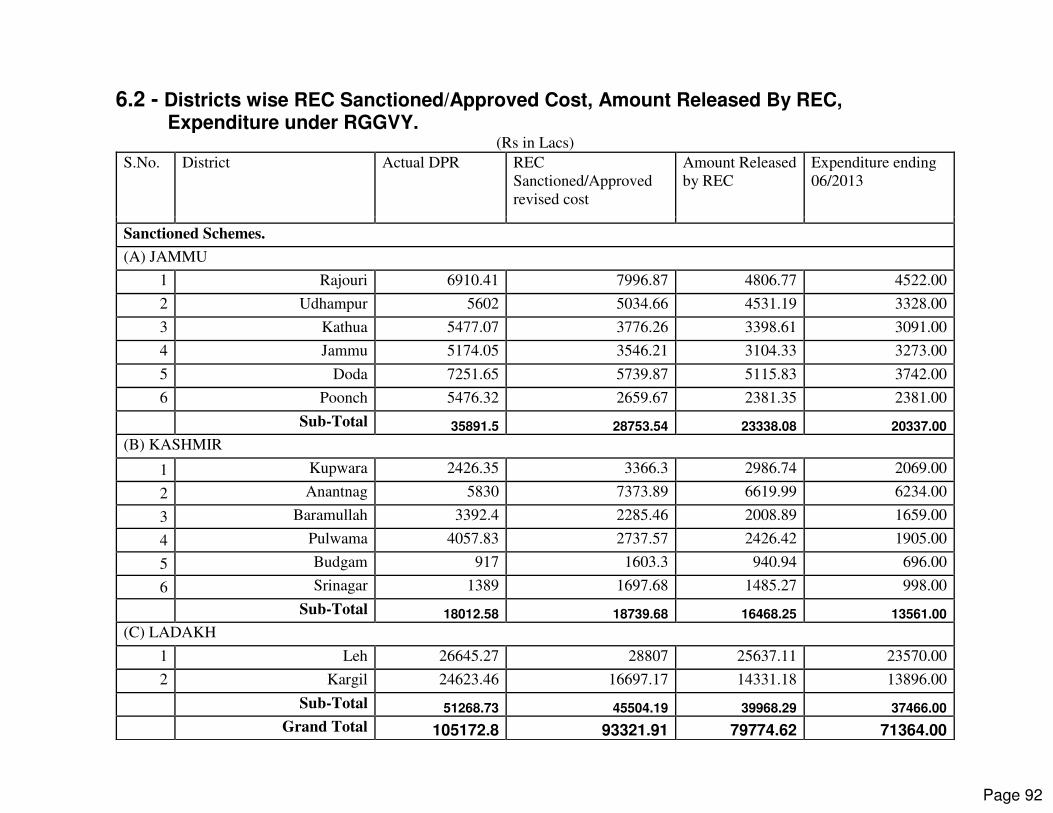
6.2 - Districts wise REC Sanctioned/Approved Cost, Amount Released By REC, Expenditure under RGGVY.
(Rs in Lacs)
S.No. District Actual DPR REC
Sanctioned/Approved
revised cost
Amount Released
by REC
Expenditure ending
06/2013
Sanctioned Schemes.
(A) JAMMU
1 Rajouri 6910.41 7996.87 4806.77 4522.00
2 Udhampur 5602 5034.66 4531.19 3328.00
3 Kathua 5477.07 3776.26 3398.61 3091.00
4 Jammu 5174.05 3546.21 3104.33 3273.00
5 Doda 7251.65 5739.87 5115.83 3742.00
6 Poonch 5476.32 2659.67 2381.35 2381.00
Sub-Total 35891.5 28753.54 23338.08 20337.00
(B) KASHMIR
1 Kupwara 2426.35 3366.3 2986.74 2069.00
2 Anantnag 5830 7373.89 6619.99 6234.00
3 Baramullah 3392.4 2285.46 2008.89 1659.00
4 Pulwama 4057.83 2737.57 2426.42 1905.00
5 Budgam 917 1603.3 940.94 696.00
6 Srinagar 1389 1697.68 1485.27 998.00
Sub-Total 18012.58 18739.68 16468.25 13561.00
(C) LADAKH
1 Leh 26645.27 28807 25637.11 23570.00
2 Kargil 24623.46 16697.17 14331.18 13896.00
Sub-Total 51268.73 45504.19 39968.29 37466.00
Grand Total 105172.8 93321.91 79774.62 71364.00
Page 92
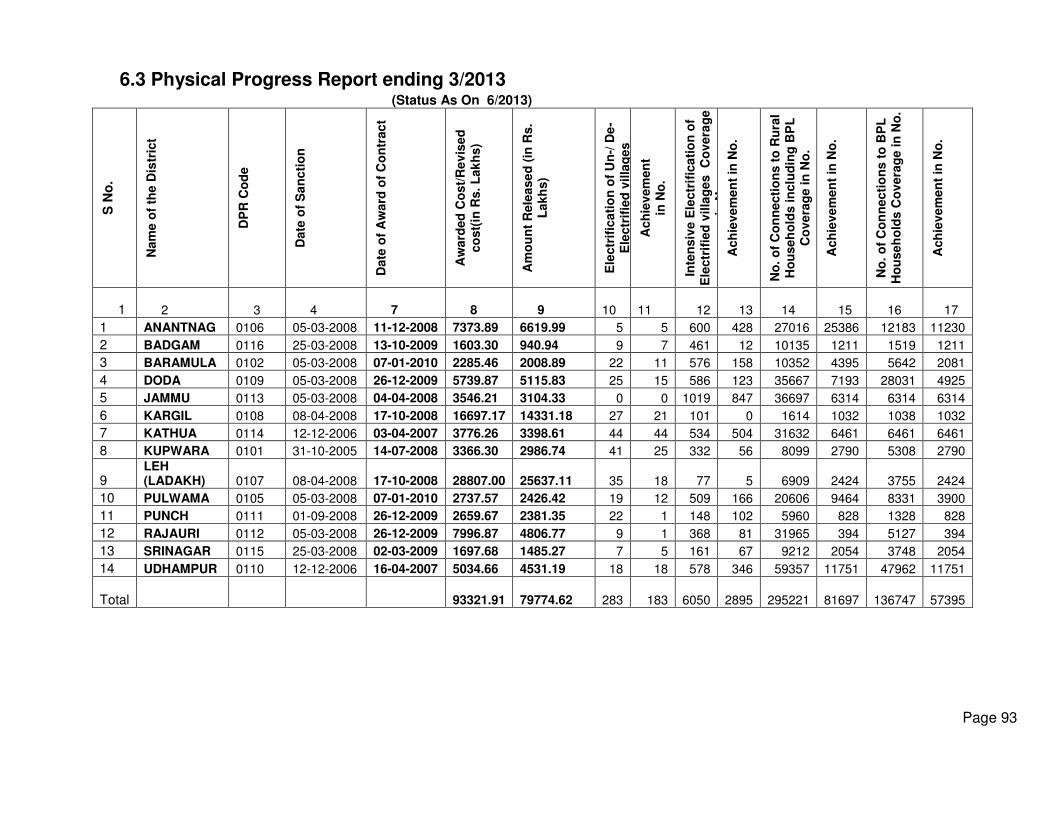
6.3 Physical Progress Report ending 3/2013
(Status As On 6/2013)
S
No
.
Nam
e o
f th
e D
istr
ict
DP
R C
od
e
Date
of
Sa
ncti
on
Date
of
Aw
ard
of
Co
ntr
ac
t
Aw
ard
ed
Co
st/
Re
vis
ed
co
st(
in R
s. L
ak
hs)
Am
ou
nt
Rele
ase
d (
in R
s.
Lakh
s)
Ele
ctr
ific
ati
on
of
Un
-/ D
e-
Ele
ctr
ifie
d v
illa
ges
Ach
ievem
en
t
in N
o.
Inte
nsiv
e E
lectr
ific
ati
on
of
Ele
ctr
ifie
d v
illa
ges C
overa
ge
in N
o.
Ach
ievem
en
t in
No
.
No
. o
f C
on
necti
on
s t
o R
ura
l H
ou
seh
old
s in
clu
din
g B
PL
C
overa
ge in
No
.
Ach
ievem
en
t in
No
.
No
. o
f C
on
necti
on
s t
o B
PL
H
ou
seh
old
s C
overa
ge in
No
.
Ach
ievem
en
t in
No
.
1 2 3 4 7 8 9 10
11 12 13 14 15 16 17
1 ANANTNAG 0106 05-03-2008 11-12-2008 7373.89 6619.99 5 5 600 428 27016 25386 12183 11230
2 BADGAM 0116 25-03-2008 13-10-2009 1603.30 940.94 9 7 461 12 10135 1211 1519 1211
3 BARAMULA 0102 05-03-2008 07-01-2010 2285.46 2008.89 22 11 576 158 10352 4395 5642 2081
4 DODA 0109 05-03-2008 26-12-2009 5739.87 5115.83 25 15 586 123 35667 7193 28031 4925
5 JAMMU 0113 05-03-2008 04-04-2008 3546.21 3104.33 0 0 1019 847 36697 6314 6314 6314
6 KARGIL 0108 08-04-2008 17-10-2008 16697.17 14331.18 27 21 101 0 1614 1032 1038 1032
7 KATHUA 0114 12-12-2006 03-04-2007 3776.26 3398.61 44 44 534 504 31632 6461 6461 6461
8 KUPWARA 0101 31-10-2005 14-07-2008 3366.30 2986.74 41 25 332 56 8099 2790 5308 2790
9 LEH (LADAKH) 0107 08-04-2008 17-10-2008 28807.00 25637.11 35 18 77 5 6909 2424 3755 2424
10 PULWAMA 0105 05-03-2008 07-01-2010 2737.57 2426.42 19 12 509 166 20606 9464 8331 3900
11 PUNCH 0111 01-09-2008 26-12-2009 2659.67 2381.35 22 1 148 102 5960 828 1328 828
12 RAJAURI 0112 05-03-2008 26-12-2009 7996.87 4806.77 9 1 368 81 31965 394 5127 394
13 SRINAGAR 0115 25-03-2008 02-03-2009 1697.68 1485.27 7 5 161 67 9212 2054 3748 2054
14 UDHAMPUR 0110 12-12-2006 16-04-2007 5034.66 4531.19 18 18 578 346 59357 11751 47962 11751 Total 93321.91 79774.62 283 183 6050 2895 295221 81697 136747 57395
Page 93
6.4- Restructured- Accelerated Power Development and Reforms Programme (R-APDRP)
Introduction
The Govt. of India has proposed to continue R-APDRP during the XI Plan with revised terms and conditions as a Central
Sector Scheme. The focus of the programme shall be on actual, demonstrable performance in terms of sustained loss
reduction. Establishment of reliable and automated systems for sustained collection of accurate base line data, and the
adoption of Information Technology in the areas of energy accounting will be essential before taking up the regular distribution
strengthening projects R- APDRP is a scheme to bring down T&D looses to 15% within project period of 5 years with minimum target 0f 3% p.a.
The scheme is divided in two parts, PART-A and PART-B. Part-A is to cover Ring Fencing, Feeder Metering, DT Metering,
application of Information Technology and Supervisory Control and Data Acquisition / DMS in Distribution Sub Sector. Part-B
is aimed to strengthen Distribution System in the identified project areas.
For Part-A of the scheme : M/s CMC Ltd, New Delhi has been appointed as IT consultant, M/s Prominent Engineers & Traders,
Haryana awarded the contract for Boundary Metering / Ring Fencing, M/s Wipro Ltd appointed as Information Technology
Implementation Agency ( ITIA ) and M/s NDPL New Delhi appointed as SCADA consultant.
The Power Finance Corporation ( PFC ) will be the Nodal Agency for the operationalisation and implementation of the R-
APDRP programme under the overall guidance of the Ministry of Power ( MoP ).
GoI will provide 100% loan for part A of the R-APDRP schemes and 90% loan for part B of the R-APDRP.
Under R-APDRP, 30 towns have been identified as project areas in J&K state with population of above 10,000 as per 2001
census. GoI has sanctioned Rs 191.25 crores for part-A and Rs 1665.27 crores for part-B of R-APDRP scheme. The DPR for
SCADA / DMS for Jammu and Srinagar cities has been approved by GoI at an estimated cost of Rs. 52.89 crores.
Page 94
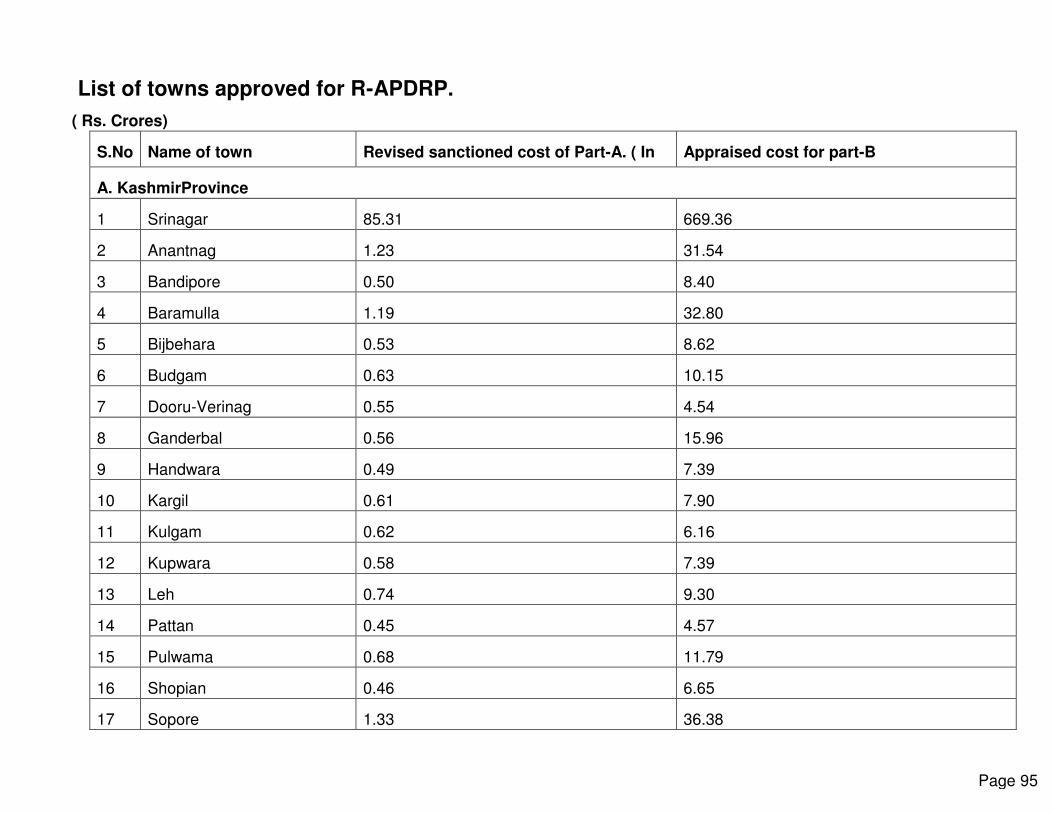
List of towns approved for R-APDRP.
( Rs. Crores)
S.No Name of town Revised sanctioned cost of Part-A. ( In Appraised cost for part-B
A. KashmirProvince
1 Srinagar 85.31 669.36
2 Anantnag 1.23 31.54
3 Bandipore 0.50 8.40
4 Baramulla 1.19 32.80
5 Bijbehara 0.53 8.62
6 Budgam 0.63 10.15
7 Dooru-Verinag 0.55 4.54
8 Ganderbal 0.56 15.96
9 Handwara 0.49 7.39
10 Kargil 0.61 7.90
11 Kulgam 0.62 6.16
12 Kupwara 0.58 7.39
13 Leh 0.74 9.30
14 Pattan 0.45 4.57
15 Pulwama 0.68 11.79
16 Shopian 0.46 6.65
17 Sopore 1.33 36.38
Page 95

18 Sumbal 0.55 4.70
19 Tral. 0.43 5.96
Total Kashmir 97.44 889.56
B- JammuProvince
1 Jammu 45.16 610.48
2 Akhnoor 0.33 13.64
3 Baderwah 0.56 6.75
4 Doda 0.70 7.28
5 Kathua 1.66 62.41
6 Kishtwar 0.56 7.42
7 Poonch 0.88 7.74
8 Rajouri 1.82 11.72
9 Ranbir Singh Pora 0.76 12.36
10 Samba 0.56 10.08
11 Udhampur 1.56 25.83
Total Jammu 54.55 775.71
Total J&K PDD 151.99* 1665.27
* Civil cost component of Rs 10.50 crores and FMS charges of Rs 28.76 crores to be born by the State Government for Part-A
after the Ist year of the commissioning of IT software in the State.
Page 96
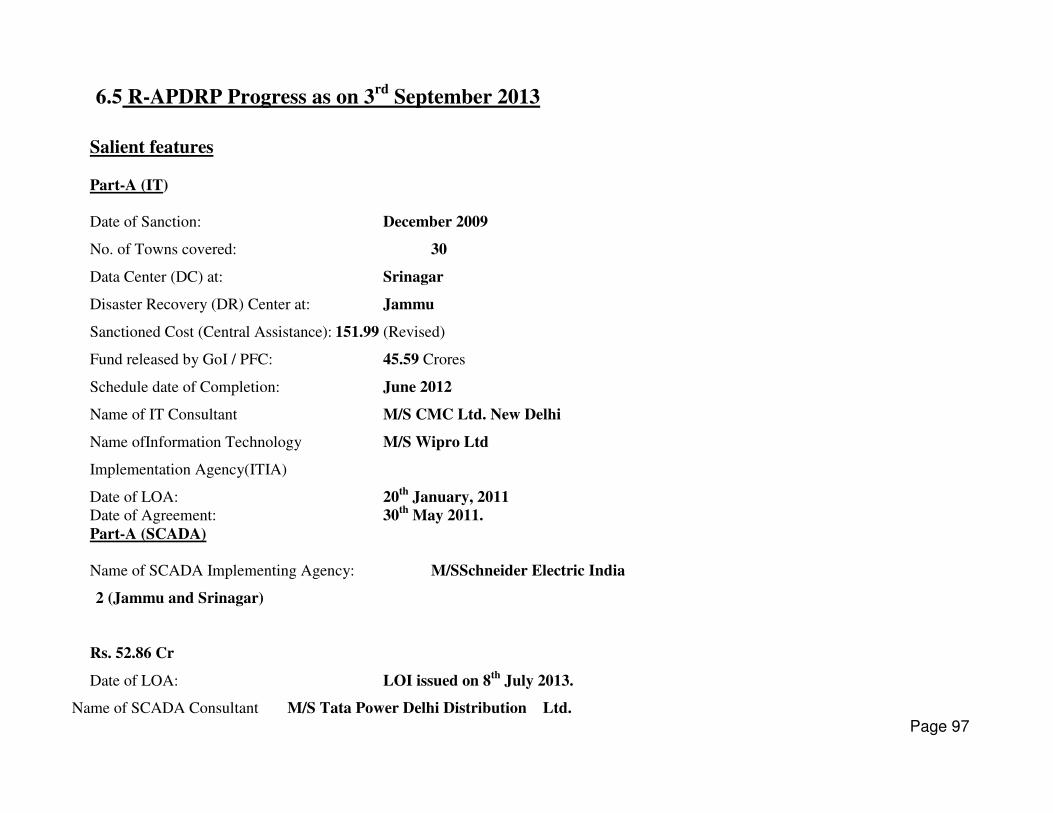
6.5 R-APDRP Progress as on 3rd
September 2013
Salient features
Part-A (IT)
Date of Sanction: December 2009
No. of Towns covered: 30
Data Center (DC) at: Srinagar
Disaster Recovery (DR) Center at: Jammu
Sanctioned Cost (Central Assistance): 151.99 (Revised)
Fund released by GoI / PFC: 45.59 Crores
Schedule date of Completion: June 2012
Name of IT Consultant M/S CMC Ltd. New Delhi
Name ofInformation Technology M/S Wipro Ltd
Implementation Agency(ITIA)
Date of LOA: 20th
January, 2011
Date of Agreement: 30th
May 2011.
Part-A (SCADA)
Name of SCADA Implementing Agency: M/SSchneider Electric India
2 (Jammu and Srinagar)
Rs. 52.86 Cr
Date of LOA: LOI issued on 8th
July 2013.
Name of SCADA Consultant M/S Tata Power Delhi Distribution Ltd. Page 97
Part B
Sanctioned Cost: Rs. 1665.27 Cr
Part-A Works:
ITIA (Wipro) activities:
All the hardware has been installed and the various modules/applications have been uploaded at the Data centre. Application functionality testing is
under progress. All the applications have been demonstrated in fully integrated mode starting from web portal request by prospective consumer to
1. conducting feasibility study, issue of BOQ, accepting payments, updating GIS Application.
2. Integrated Voice Response System (IVRS) Call flow has been configured as per the existing Call Center Application.
3. Custom reports are being developed as part of MIS.
GIS survey / Consumer Indexing / Asset mapping
1. AOI (Area of interest / boundary of project area) collection for all 19 towns of Kashmir region completed in July 2011.
2. AOI collection for all 11 towns of Jammu region completed September 2011.
3. Imagery Received for all the 30 towns
4. GIS Data model finalized and Proof of Concept (POC) demonstrated by ITIA for Pilot Area Pattan on 12/10/2011
5. Asset Mapping completed for all the 567 feeders (100%) in J&K. 554 feeders (98%) have been submitted out of which 442 feeders (77.95%)
have been validated by JKPDD.
6. Out of the total consumer base of 4.77 lac, Consumer Indexing is complete for 4.72 lac consumers ( 99.19%). 76.71% has been submitted by
ITIA for verification out of which 24.94% has been verified.
7. GIS data/Imagery updation is being taken up as per guidelines.
Software Development:
1. All the applications are installed at DC and following modules are ready for parallel run
Metering.
Billing.
Collection
Web Self Service
Assets Management. Page 98
Maintenance Management.
GIS Based integrated Network Analysis Module.
GIS Based Consumer Indexing & Assets Mapping.
MIS
Disconnection & Dismantling.
New Connection.
Centralized Customer Care Service.
2. Functional testing started on 8th
April 2013 at IT office Srinagar.
3. Parallel run started from 31th July 2013. Bill of May & June Months successfully generated and reconciled with legacy billing system for one
Pilot town (Pattan).Reconciliation for the Month of July in progress
SCADA works:
1. DPR for Srinagar City prepared by M/S NDPL, SCADA Consultant for J&K PDD and approved by DRC on 07/09/2011. MoM circulated
vide Adm. Deptt. No. PDD-VII/Plan/404/2008-09 dated 22/09/2011.
2. DPRs for Jammu (27.69 Crores) and Srinagar (25.20 Crores) Cities approved by MoP/PFC in R-APDRP Steering Committee meeting held
on 18th
October 2011.
3. As-Is report completed in February 2012.
4. RFP issued in May 2012.
5. Bids received in August 2012.
6. Products & Services demo by three bidders Alstom, Siemens and Schneider in November 2012.
7. Technical evaluation completed by TP-DDL, SDC in December 2013.
8. Price bids opened on 22nd
December 2012.
9. Price evaluation completed in January 2012.
10. Documents submitted for Pre-check submitted to Financial organisation in February 2012. Comments received from Finance in March
2013.
11. Schneider emerged as L1 with offer price of Rs. 45.02 Crores.
12. M/S Schneider Ltd (L1 bidder) appointed as SCADA Implementation Agency (SIA) and LOI issued on 8th
July 2013
Page 99

System Metering:
1. Boundary Metering/ Ring Fencing:
1. M/S Prominent Engineers & Traders, Haryana awarded contract.
2. Five towns Budgam, Bijbehara, Pulwama, Kulgam and Kulgam verified by TPIEA-EA.
3. Ring Fencing Completed in 16/19 Towns in Kashmir Province including Pilot Town of Pattan .
2. Feeder Metering:
1. 1091 meters to be installed in J&K. LoI issued to M/S Prominent Engineers Haryana vide this office No. CE/M&RE/KMR/ 12549-62 /TS
dated: 22/07/2011. LoA issued vide this office no. CE/M&RE/KMR/ 12549-62 /TS dated: 22/07/2011.
2. Feeder metering completed in 16/19 Towns of Kashmir province.
3. DT metering:
1. Meters for 19 towns of Kashmir awarded. 5165 DT Metering Units to be installed in Kashmir province out of which 1000 Meters have been
received.
Re-bidding decided for 11 towns of Jammu Division.
2. DT Metering of Pilot Town Pattan under Progress. Seven Meters installed in Pattan.
3. 5219 Modems received for Kashmir province.
Data Center/Data Recovery/Customer Care Center.
1. Civil works at DC and DR 100% Complete.
2. Hardware installation completed & Software testing at DC under progress
3. Dedicated Sub Station/DG Set at Data Center Installed and commissioned successfully
Part-B Works
DPRs for all 30 towns for Rs. 1665.27 Crores approved by MoP/PFC in R-APDRP Steering Committee meeting held on 18
th October 2011.
LOA placed for appointment of PMA for 11 Towns of Jammu in August 2013 in favour of M/S Louis Berger Group. PMA for 19 Towns of
Kashmir yet to be appointed.
Counterpart fund for Part-B status: Under Process with Finance Department of J&K
Page 100

6.6- Hon’ble Prime Ministers Reconstruction Programme.
The Hon`ble Prime Minster during his visit of J&K in November, 2004 announced a Re-construction Plan infrastructure for
J&K and the objective of Schemes under the Re-Construction program is develop infrastructure at 220KV and 132KV level by way of
construction/ Augmentation of Grid Stations, construction of New lines and thickning of Conductor of Existing lines. Originally the
project was estimated to cost of Rs. 707.00 Crores based on cost data 2003. the project was scrutinized by CEA and on their
observations , the project was revised to the cost of Rs. 1006.51 crores The CEA subsequently advised to revise the Project Report
necessitated due to further cost escalation during the intervening period. Accordingly, the revised project amounting to Rs. 1351.00
Crores was furnished to CEA for approval and finally the Project Report was approved for 1350.00 Crores. Out of this cost, an amount
of Rs. 1092.90 Crores has been spent ending 03/2013
The Scheme envisages construction/ augmentation of following transformation and Transmission capacities.
o Construction of 7 No. new 220/132 KVA, Grid sub Stations of 1880 MVA capacity.
o Augmentation of 1 No. , 220/13 KVA, Grid Sub Station of 150 MVA Capacity.
o Construction of 22 No., 132/33 Grid Sub Stations of 1190 MVA Capacity.
o Augmentation of 4 No. 132/66-33 Grid Sub Stations of 160 MVA Capacity.
o Laying of 381.52 Km of 220KV, D/C, Transmission Lines.
o Laying of 448.13 Km of 132KV, D/C, S/C transmission Lines.
Besides, the Scheme includes other works like Stringing of II Circuit of existing 220KV, D/C Transmission Lines
(40.40 Km), Stringing of II Circuit of 132 KV, D/C, Transmission lines (21.00 Km), thickening of conductor etc.
Page 101

6.7 - New / Augmentation of Grid Stations in Kashmir Division: Kashmir Division: B u d g a m ( 3 2 0 / 1 0 0 M V A ) M i r b a z a r 3 2 0 M V A ( A n a n t n a g ) A m a r g a r h ( 1 6 0 / 5 0 M V A ) A l u e s t a n g h ( 3 2 0 / 1 0 0 M V A ) S h o p i a n ( 5 0 M V A ) B a n d i p o r ( 5 0 M V A ) L i s s a r ( 5 0 M V A ) K h a n m o h ( 5 0 M V A B a n i h a l ( T e t h e r ) ( 5 0 M V A ) V i l g a m 5 0 M V A M a g a m ( 5 0 M V A ) a n d A u g m e n t a t i o n o f Z a i n a k o t e ( 3 0 0 - 1 4 5 0 M V A / P a m p o r e G r i d S t a t i o n s 1 5 0 -
2 0 0 M V A ) .
Jammu Division: 2 N o . i n B i s h n a ( 2 X 1 6 0 M V A a n d 1 0 0 M V A ) 2 N o . i n R a m b a n ( 3 X 4 0 M V A a n d 2 0 M V A ) K i s h t w a r ( 2 x 2 0 M V A ) K a t t r a ( 1 x 5 0 M V A ) B h a l e s s a ( 2 0 M V A P o o n i c h e c k ( 5 0 M V A ) B a t t a l m a n w a l ( 5 0 M V A ) C h a n d a k , ( 2 0 M V A ) B a r i b r a h m n a - I I ( 2 x 5 0 M V A ) G a n g y a l ( 1 x 5 0 M V A ) S i o t ( ( 5 0 M V A ) A u g m e n t a t i o n o f K a t h u a ( 7 0 - 1 2 0 M V A , S a m b a ( 5 0 - 1 0 0 M V A ) a n d H i r a n a g a r ( 4 2 . 5 - 5 0 M V A ) G r i d S t a t i o n s .
Page 102
The first ever State owned 132 KV Transmission Line from Ramban to Kishtwar and Rajouri-Poonch, ring around
Jammu cities are included in the package which are based on Technical requirement and survey done by CEA. The
power requirements under the Plan for Industries have been given due focus and priority.
6.8 - Achievements ending 03/2013
Jammu 220/132 kV, 320MVA Barn Grid Sub Station Commissioned alongwith allied 132/33kV, 40 MVA
transformer. 220/132 kV,320 MVA Bishnah Grid Sub Station Commissioned. 220/132 kV,120 MVA Ramban Grid Sub Station Commissioned. 132/33kV, 100 MVA Bari Brahamana-II Grid Sub Station Commissioned. 132/33kV, 50 MVA Gangyal Grid Sub Station Commissioned. 132/33kV, 50 MVA Katra Grid Sub Station Commissioned. 132/33kV, 100 MVA Bishnah Grid Sub Station Commissioned. 132/33kV, 50 MVA Pounichak Grid Sub Station Commissioned. Augmentation of 132/66 KV Grid Sub Station Kathua from 70 MVA to 120 MVA completed Augmentation of 132/66 KV Grid Sub Station Samba from 50 MVA to 100 MVA Augmentation of 132/33 KV Grid Sub Station Hira Nagar from 42.5 MVA to 50.0 MVA 220 kV D/C Burn-Kishenpur Transmission Line completed (37.40). 220 kV D/C Miran Sahab-Bishnah.Transmission Line commissioned (9.73Km). LILO of 220 kV KPTL for Ramban Grid commissioned (2.0Km). 220 kVD/C Bishnah-Hiranagar Transmission Line completed. 132kV D/C Rajouri-Draba Line Commissioned (35Km) LILO of 132 kV, Gladni-Miran Sahib Transmission Line for Grid Station Gangyal (1.0Km) 132 kV Barn-Siot-kalakote Transmission Line commissioned (53.87Km) LILO of 132 KV D/C ,Gladni-Hiranagar Transmission Line for Grid Station Bari Brahmana-II completed (2.7Km). 132 KV D/C Barn-Katra Transmission line completed(39.74). 132 kV S/C Draba- Chandak Transmission line commissioned (28.60). LILO of 132 kV S/C of Ring Main to Pounichak commissioned (2.58Km.) Page 103
LILO of CSTL-I for Ramban Grid Sub Station commissioned.(3.50Km) Stringing of conductor on II circuit of 132KV Burn-Reasi Transmission line completed(21.0KM). LILO of 132 KV D/C, CSTL-I for G/Stn Ramban completed. Reconductoring and stabilization of 132KV S/C Gladni-Janipur transmission line completed Reconductoringof 132KV D/C Ring main around Jammu city completed(23.5Km) 132/33kV, 20 MVA Chandak Grid Sub Station Commissioned(1.20Km).
Kashmir 220/132 kV,320 MVA Mirbazar Grid Sub Station Commissioned. 220/132/33 kV,320 MVA+100MVA Budgam Grid Sub Station Commissioned. 132/33kV, 50 MVA Lissar Grid Sub Station Commissioned. 132/33kV, 50 MVA Vilgam Grid Sub Station Commissioned. 132/33kV, 50 MVA Magam Grid Sub Station Commissioned. Augmentation of 220/132KV Grid Sub Station Zainakote from 300 MVA to 450 MVA Augmentation of 132/33KV Grid Sub Station Pampore from 150 MVA to 200 MVA Construction of 50MVA,132/33KV Grid station Tethar completed & Commissioned in 10/09 Construction of 50MVA,132/33KV Grid station Khonmoh completed & Commissioned in 5/09 LILO of Pampore-Cheshmashahi line for Khonmoh Grid station. LILO of CSTL at Tethar for Grid station Tethar. 132 kV D/C –Lissarline completed. 132 kV S/C Arampora- Vilgam line completed. 132 kV Pattan-Magam line completed 132 /33kV 50 MVA Shopian Grid Sub Station Commissioned 132 kV D/C Lassipora-Shopian line completed.
Page 104

Chapter- 7
7.1 PERFORMANCE REPORT OF DISTRIBUTION SECTOR Power revenue for 2012-13 in respect of Jammu & Kashmir regions has remained as Rs 1697.16Crores showing an increase of 41.41% over FY2011-12 (Rs 1200.15) – an increase of Rs.497.01 Crore. Multi-tier inspection squads have been constituted to check the misuse of power and an amount of Rs. 1438.00 lacs has been imposed fine against defaulters in 2012-13 , out of which Rs. 986.00lacs has been recovered. Judicial Magistrates have been associated with inspections to curb power theft. Consumer metering has been revived. Nearly 107257 No new electronic meters have been installed during 2012-13 23060 No defective meters replaced bynew electronic meters during 2012-13
The mismatch between the demand and the agreed load is being addressed. Nearly 506.38 MW of additional load has been brought within the tariff regime between 4/2012 to 31/3/2013.
In order reduce the transmission losses, Shunt capacitors of 531 MVAR capacities at 33 KV level have been installed at various Grid stations of J&K State at a cost of Rs.22.00 crores sanctioned by NRPC out of reactive compensation.
In 2012-13 T&D losses brought down from 61.58% of 2011-12 to 56.98 % and AT&C lossesdown from 72.74% of 2011-12 to 63.80. % 100 % computerization of energy bills achieved in the State. A special enforcement wing headed by Secretary Technical was established under which special enforcement teams have been constituted. These teams headed by Executive Engineers have been drawn from DCP’s office and the wings other than EM&RE wings (Distribution wings). These teams have given encouraging results during the last six months since their constitution. Empanelment of Independent Accredited Meter Testing Agency.
Page 105

Establishing of Meter Testing Labs (stationary and mobile) one each in Srinagar and Jammu. In order to redress consumer grievances on-spot and spread awareness about judicious use of electricity, BIJLI camps
were conducted in all the circles of the state. These camps were headed by the concerned Superintending Engineers. Voluntary Load Disclosure Scheme (VLDS) for domestic and commercial consumers was launched in June 2012, under
which the people were encouraged to voluntarily disclose their load. Incentive in the shape of waiving-off of Security deposit and other charges which are normally recovered from consumers on account of addition of load was also included in the scheme. Large number of consumers availed the scheme which resulted into addition of 278MW loads. Total load added during the year 2013-14 stands at 506.38 MW
The LT network in J&K state is in dilapidated condition due to aging of the system and meager investment on maintenance and repairs, the state Govt is committed to fund during FY 2013-14 for replacing rotton/deteriorated poles, replacing of GI/Barbed wire/Split conductor with ACSR conductor during current financial year. Schemes for the same are under formulation. In order to improve distribution network to attain reliability of power supply and curb pilferage of power R-APDRPscheme has been sanctioned for 30 Towns of Jammu and Kashmir State having population 10,000 and above .the scheme stands sanctioned for an amount of Rs 191.25 Crores for Part-A and Rs 1665.27 Crores for part-B.The execution of work under Part- A of the scheme comprising Feeder Metering, application of Information Technology and Supervisory Control and Data Acquisition / DMS in Distribution Sub Sector is in full swing and around 60% progress has been achieved while tendering for Ring Fencing and DT. Metering is at its final stage. Part B of the Scheme has been tendered out and bids for engagement of Project Management have been received which are under evaluation. In part B there is provision of Aerial Bunched Cables (ABC) and High Voltage Distribution System (HVDS) which are effective methods for curbing power theft.
RGGVY Scheme has been sanctioned by REC at a cost of Rs 933.21 Crores for electrification of 283 virgin villages, un-electrified villages and de-electrified villages of 7 districts in Jammu region and 7 districts in Kashmir region by NHPC and JKSPDC respectively as per guide lines of RGGVY.The execution of this project is under progress.The abstract of progress as on 31-5-2013 is as under:-
Page 106

7.2 PERFORMANCE REPORT DISTRIBUTION(Revised)
2011-12 2012-13 Growth %
Jammu Kashmir Total jammu Kashmir Total
1 . Revenue Billed (Pure) Rs. Cr. 790.9 637.78 1428.68 1010.05 672.39 1682.44 17.76
2 . Revenue Realization (Pure) Rs. Cr. 612.41 401.75 1014.16 841.74 573.90 1415.64 39.59
3 . Collection efficiency (2/1*100) % 77.43 62.99 70.99 83.34 85.35 84.14 13.16
4 . Electricity duty billed Rs. Cr. 130.18 90.66 220.84 166.89 119.62 286.51 29.74
5 . Electricity duty realized Rs. Cr. 108.04 75.66 183.70 161.94 115.92 277.86 51.26
6 . Revenue Misc. Realized Rs. Cr. 0.87 1.42 2.29 1.61 2.05 3.66 59.83
7 . Total Revenue (2+5+6) Rs. Cr. 721.32 478.83 1200.15 1005.29 691.87 1697.16 41.41
Arear realization from NHPC Rs. Cr. 169.09
Total 1174.38 691.87 1866.25
8 . Energy Input (Grid Level from
C&S)
MU
4969.245 6136.09 11105.33 5240.7 6867.30 12108.00 9.03
9 . Energy billed MU 2350 1917.00 4267.00 2871.017 2292.00 5163.02 21.00
10
.
T&D Losses (8-9) MU
2619.245 4219.09 6838.33 2369.683 4575.30 6944.98 1.54
11
.
T&D Losses % (10/8x100) %
52.709 68.76 61.58 45.217 66.62 57.36 4.22
12
.
Energy Realized (9x3/100) MU
1819.653 1207.56 3027.21 2392.604 1956.27 4348.88 43.66
13
.
AT&C Losses (8-12/8x100) %
63.38 80.32 72.74 54.35 71.51 64.1 8.66
14
.
Average Tariff billed/ unit Rs./ Unit
3.37 3.33 3.35 3.52 2.93 3.26 -2.68
15
.
New Meters installed No.
51967 58591 110558 71677 35580 107257.00 -2.99
16
.
Defective Meters replaced No.
9302 28590 37892 5323 14665 19988.00 -47.25
17
.
Inspections conducted No.
23700 49689.00 73389.00
Page 107

Page 108
18
.
Fine imposed Rs. Cr.
8.50 1.51 10.01 11.80 2.58 14.38 43.66
19
.
Fine Recovered Rs. Cr.
6.13 0.63 6.76 8.78 1.08 9.86 45.86
20
.
Disconnections effected No.
1362 53360 54722 6450 58696 65146.00 19.05
21
.
New Connections added No.
12033
35978 54667
66747 38124 104871
190.60
22
.
Connections regularized No.
6656 33454 20535 53989
23
.
Load regularized (New +
Illegal)
MW
58.895
89.74 230.94
89.233
175.75 506.38
119.26
24
.
Load added (Agreement
revised)
MW
82.309 241.396
25
.
Cumulative connections at the
end of the year
No.
608407 723629 1332036 708608 781988 1490596 11.90
26
.
Cumulative Load at the end of
the year
MW
1064.037 758.28 1822 1384.66 967.40 2352 29.07
27
.
Total Distribution
Transformers No. 19685 19815 39500 22265 21548 43813
28
.
Transformers damaged
No. 7620 8540 16160 7753 7992 15745
31
.
Damage rate
% 38.71 43.10 40.90 34.82 37.09 35.96
32
.
New 33/11 KV sub-stations
added No./MVA 8 / 33.7 6/48.35 14/82.05 1 / 6.30 4/22.05 5/28.35
33
.
Augmentation of 33/11 KV
Sub-Stations No./MVA 12 / 78.05 10/41.3 22/119.35 6 / 28.45 9/45.20 15/73.65
34
.
New distributions transformers
added No./MVA
1120 /
141.204 1499/103.6 2619/244.804
2580 /
330.629 1733 / 143 4313/473.629
Chapter 8
STANDARD CONSTRUCTION PRACTICES & TECHNICAL DATA FOR SUB TRANSMISSION & DISTRIBUTION WORK
IMPORTANT NOTES:-
i. Since errors and omissions in this chapter cannot be ruled out, standard drawings, tables & other data in this section are for guidelines only. Practicing Engineers are requested to refer to the original source of data. The DCP’s office does not bare any responsibility for any damage or loss which may occur as a consequence of implementation of any erroneous drawing or data in this section.
ii. Any suggestions for rectification/improvement may please be emailed at [email protected]
Page 109

8.1 RECOMMENDED TYPE AND SIZE OF MULTI-CORE CABLES REC CONSTRUCTION STANDARD
F-8
Distribution Transformer
Capacity in kVA Type
Size (Nominal area of Cross Section)
25 PVC insulated and sheathed un-armoured four core alumunium cable 16mm
2.
63
PVC insulated and sheathed un-armoured four core alumunium cable with reduced neutral conductor
70mm2.
OR
PVC insulated and sheathed alumunium armoured three core solid alumunium conductored cable
70mm2.
100
PVC insulated and sheathed un-armoured four core alumunium cable with reduced neutral conductor
120mm2.
OR
PVC insulated and sheathed alumunium armoured three core solid alumunium conductored cable
120mm2.
Note:
1 The cable would be laid in air.
2 In case of PVC armoured cables,aluminum amour shall serve as neutral for 63 and 100 KVA distribution transformer centers.
3 Size of reduced neutral conductor shall comply with the main -neutral conductor combination as per IS:1554 (Part-I)-1976
4 Type and size of single core cables which can be used for the same purpose are given in REC construction
Page 110
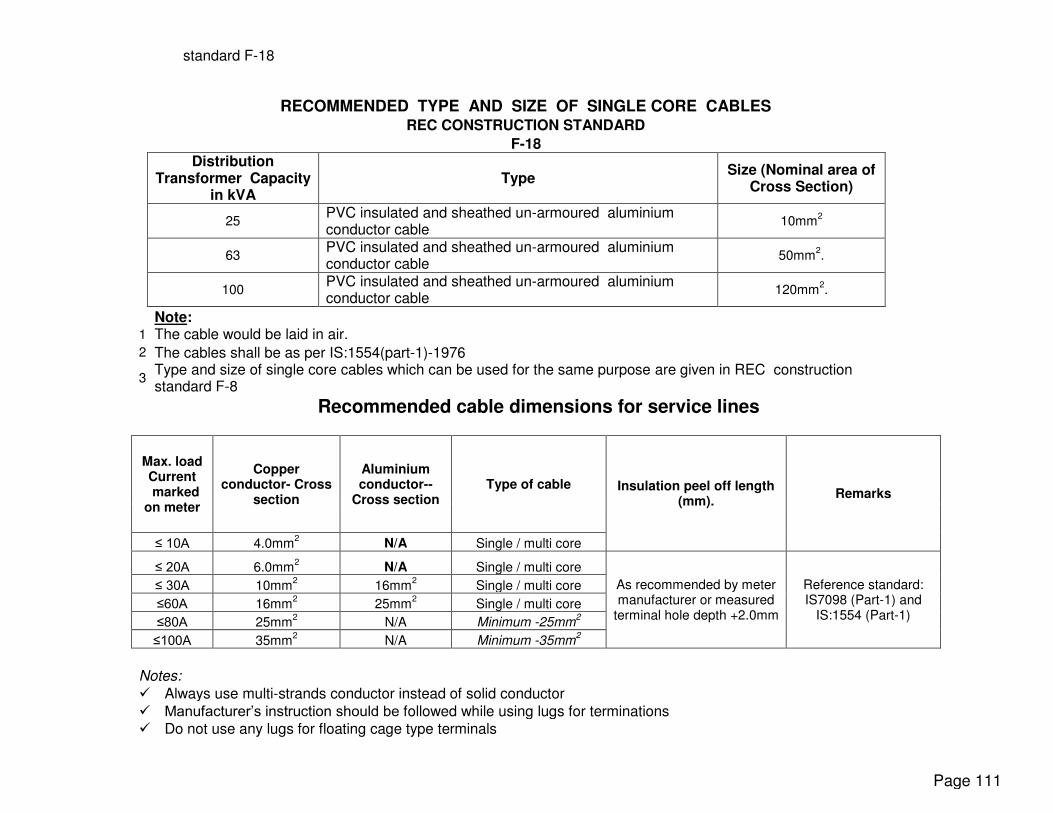
standard F-18
RECOMMENDED TYPE AND SIZE OF SINGLE CORE CABLES
REC CONSTRUCTION STANDARD
F-18
Distribution Transformer Capacity
in kVA Type
Size (Nominal area of Cross Section)
25
PVC insulated and sheathed un-armoured aluminium conductor cable
10mm2
63
PVC insulated and sheathed un-armoured aluminium conductor cable
50mm2.
100
PVC insulated and sheathed un-armoured aluminium conductor cable
120mm2.
Note: 1 The cable would be laid in air. 2 The cables shall be as per IS:1554(part-1)-1976
3 Type and size of single core cables which can be used for the same purpose are given in REC construction standard F-8
Recommended cable dimensions for service lines
Max. load Current marked on meter
Copper conductor- Cross
section
Aluminium conductor--
Cross section Type of cable Insulation peel off length
(mm). Remarks
≤ 10A 4.0mm2 N/A Single / multi core
≤ 20A 6.0mm2 N/A Single / multi core
As recommended by meter manufacturer or measured
terminal hole depth +2.0mm
Reference standard: IS7098 (Part-1) and
IS:1554 (Part-1)
≤ 30A 10mm2 16mm
2 Single / multi core
≤60A 16mm2 25mm
2 Single / multi core
≤80A 25mm2 N/A Minimum -25mm
2
≤100A 35mm2 N/A Minimum -35mm
2
Notes:
Always use multi-strands conductor instead of solid conductor Manufacturer’s instruction should be followed while using lugs for terminations Do not use any lugs for floating cage type terminals
Page 111

Page 112
8.2 CURRENT RATING OF DISTRIBUTION & POWER TRANSFORMERS
Voltage Ratio: 11/.433 kV
Transformer Capacity kVA 11 kV side LV Side
16 0.84 21.33
25 1.31 33.34
63 3.31 84.00
100 5.25 133.34
250 13.12 333.35
400 21.00 533.36
630 33.07 840.05
1000 52.49 1333.41
Voltage Ratio: 33/11 kV
Transformer Capacity MVA 33 kV side 11 kV Side
1.0 17.50 52.49
3.2 55.11 165.34
5.0 87.48 262.44
6.3 110.22 330.67
10.0 174.96 524.88
Voltage Ratio: 132/33 kV
Transformer Capacity MVA 132 kV side 33 kV Side
20.0 87.48 349.92
50.0 218.70 874.80
Voltage Ratio: 220/132 kV
Transformer Capacity MVA 220 kV side 132 kV side
150.0 393.66 656.10
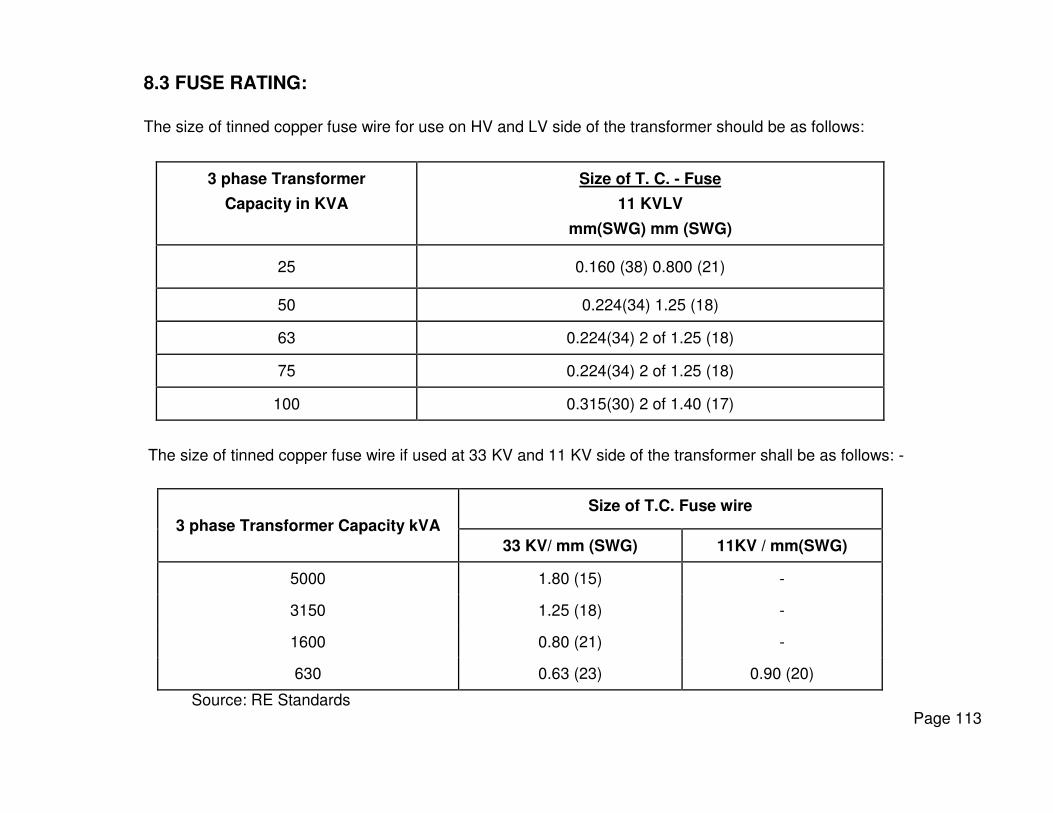
8.3 FUSE RATING:
The size of tinned copper fuse wire for use on HV and LV side of the transformer should be as follows:
3 phase Transformer
Capacity in KVA
Size of T. C. - Fuse
11 KVLV
mm(SWG) mm (SWG)
25 0.160 (38) 0.800 (21)
50 0.224(34) 1.25 (18)
63 0.224(34) 2 of 1.25 (18)
75 0.224(34) 2 of 1.25 (18)
100 0.315(30) 2 of 1.40 (17)
The size of tinned copper fuse wire if used at 33 KV and 11 KV side of the transformer shall be as follows: -
3 phase Transformer Capacity kVA Size of T.C. Fuse wire
33 KV/ mm (SWG) 11KV / mm(SWG)
5000 1.80 (15) -
3150 1.25 (18) -
1600 0.80 (21) -
630 0.63 (23) 0.90 (20)
Source: RE Standards Page 113

8.4 CT RATIOS APPLICABLE FOR HT METERING
Page 114

Page 115
8.5

8.6 SPECIFICATION OF SWAGED TYPE STEEL TUBULAR POLES AS PER IS2715 WIDELY USED IN J&K POWER DEVELOPMENT DEPARTMENT
Desig
nati
on
Over a
ll l
en
gth
L
Pla
nti
ng
dep
th
Lo
ad
ap
pli
ed
fro
m t
op
at
a
dis
tan
ce o
f
Hg
t. a
bo
ve
gro
un
d H
Length
Outside
diameter and
thickness of
sections
Ap
p.
Wt
of
Ple
Breakin
g L
oad
Crip
pin
g L
oad
Working
Load
Lo
ad
fo
r
perm
an
nen
tset
no
t exceed
ing
13
mm
Lo
ad
fo
r
tem
po
rary
dele
cti
on
of
15
7.5
mm
Bt
m
h3
Md
l
h2
To
p
h1
Btm
h3
Mdl
h2
Top
h1
Col
14(2)
Col
13
(2.5
) 1 2 3 4 5 6 7 8 9 10 11 12 13 14 15 16 17 18
(m) m m m m m m m mm mm mm kg (kg) N n N N N
(kg) (kg) (kg) (kg) (kg)
410SP 7.5 1.25 0.3 6.25 4.5 1.5 1.5
139.7 114.3 88.9
103
4630 3280 1650 1850 2250 1480
-8 x x x -472 -335 -168 -189 -229 -151
4.85 3.65 3.25
410SP 7.5 1.25 0.3 6.25 4.5 1.5 1.5
139.7 114.3 88.9
110
5100 3620 1810 2040 2480 1600
-9 x x x -520 -369 -185 -208 -253 -163
5.4 3.65 3.25
410SP 8 1.5 0.3 6.5 4.5 1.75 1.75
139.7 114.3 88.9
111
4440 3160 1580 1770 2160 1280
-14 x x x -453 -322 -161 -181 -220 -131
4.85 4.5 3.25
410 8 1.5 0.3 6.5 4.5 1.75 1.75
139.7 114.3 88.9
119
4890 3470 1740 1960 2380 1380
SP-15 x x x -499 -354 -177 -200 -243 -140
5.4 4.5 3.25
410 9 1.5 0.3 7.5 5 2 2
165.1 x 4.50
139.7 x 4.50
114.3
147 5070 (517)
3600 (367)
1800 (184)
2030 (207)
2460 (251) 1360 (139) SP-31 x
3.65
410 9 1.5 0.3 7.5 5 2 2
165.1 x 4.85
139.7 x 4.50
114.3
154 5430 (554)
3850 (393)
1930 (197)
2180 (222)
2640 (269) 1430 (146) SP-32 x
3.65
410 9 1.5 0.3 7.5 5 2 2
165.1 x 5.40
139.7 x 4.50
114.3
154 6000 (612)
4270 (435)
2130 (217)
2410 (245)
2910 (297) 1540 (157) SP-33 x
3.65
410 11 1.8 0.6 9.2 5.6 2.7 2.7
193.7 x 4.85
165.1 x 4.50
139.7
227 6370 (650)
4530 (462)
2260 (231)
2550 (260)
3100 (316) 1270 (130) SP-55 x
4.5
410 11 1.8 0.6 9.2 5.6 2.7 2.7
193.7 x 5.40
165.1 x 4.50
139.7 241
6990 (713)
4820 (502)
2480 (253)
2790 (285)
3400 (347) 1370 (140) SP-56 x
Page 116

4.5
410 11 1.8 0.6 9.2 5.6 2.7 2.7
193.7 x 5.90
165.1 x 4.85
139.7
256 7620 (777)
5410 (552)
2710 (276)
3050 (311)
3710 (378) 1470 (150) SP-57 x
4.5
410 13 2 0.6 11 5.8 3.6 3.6
219.1 x 5.60
193.7 x 4.85
165.1
333 7720 (787)
5480 (559)
2740 (279)
3090 (315)
3750 (382) 1160 (118) SP-71 x
4.5
410 13 2 0.6 11 5.8 3.6 3.6
219.1 x 5.90
193.7 x 4.85
165.1
343 8120 (828)
5770 (588)
2880 (294)
3250 (331)
3940 (402) 1190 (121) SP-72 x
4.5
410 14.5
2 0.6 12.5 6.5 4 4 219.1 x 5.60
193.7 x 4.85
165.1
370 6750 (688)
4790 (488)
2390 (244)
2700 (275)
3780 (334) 775 (79) SP-75 x
4.5
410 14.5
2 0.6 12.5 6.5 4 4 219.1 x 5.90
193.7 x 4.85
165.1
380 7100 (724)
5040 (514)
2520 (257)
2840 (290)
3450 (352) 794 (81) SP-76 x
4.5
410 16 2.3 0.6 13.7 7 4.5 4.5
219.1 x 5.60
193.7 x 4.85
165.1
405 6130 (625)
4350 (444)
2180 (222)
2450 (250)
2980 (304) 569 (58) SP-79 x
4.5
410 16 2.3 0.6 13.7 7 4.5 4.5
219.1 x 5.90
193.7 x 4.85
165.1
416 6440 (657)
4570 (466)
2280 (233(
2580 (263)
3130 (319) 568 (60) SP-80 x
4.5
RECOMMENDED SHADES FOR PAINTING ST POLES
1. Poles should be painted in Silver or orange only, as these colours are conspicuous and therefore safe for traffic and pedestrians.
2. Paint the poles with black and yellow strips upto the height of 180 CM, so as to protect them against the possible damage during the night by fast moving vehicles.
3. Green paint is not recommended, since it conveys safety and is used to identify earth conductors
Page 117

Page 118
8.7

8.8 RATING OF CAPACITORS FOR kVAR COMPENSATION
S# Rating of Individual Induction Motor kVAR rating of LT Capacitor
1 3BHP and above upto 5BHP 1
2 Above 5 BHP to 7.5 BHP 2
3 Above 7.5 BHP to 10 BHP 3
4 Above 10 BHP to 15 BHP 4
5 Above 15 BHP to 20 BHP 5
6 Above 20 BHP to 30 BHP 6
7 Above 30 BHP to 40 BHP 7
8 Above 40 BHP to 50 BHP 8
9 Above 50 BHP to 100 BHP 9
10 Above 100 HP As approved by the utility
Page 119

8.9Extracts from Record note of meetings of Coordination Committee constituted vide Development Commissioner (Power) communication no. DC/PD/TO-I/51/1659-1667 Dated 17-06-2005.
A) Pole Erection
The planting depth of poles up to and including 9Mtr. Shall be 1500mm (REC Construction standards).
The planting depth of poles of 11Mtr. Length shall be 1.83 Mtr. (One – sixth of pole length) (CBIP publication no 58).
PCC Poles shall be provided with base plates as per REC construction drawing no. K-1.
Base Plates for steel tubular poles shall be provided with a hole and shall be welded to pole bottom.
Steel tubular poles shall be provided with steel pole cap.
Drilling of holes in steel tubular shall be avoided as far as possible. Back up clamps shall be used to fix cross arms/
cross braces.
All HT/LT poles shall be earthed as per REC standard drawing no. J-1. (REC construction drawings, J&K PDD
Earthing Booklet Page No. 12)
At tension points PCC poles shall be installed in Transverse/ Lateral Position.
The Steel Tubular poles shall be concrete bottomed.
Earthing spiral shall be kept outside concrete portion.
Two pole, Three pole and four pole structures shall be provided with cross bracings as per REC construction drawing
no. A-21.
B) Guys for Overhead lines
The 33kV, 11kV and LT poles at angle locations (greater than 50o ), dead ends, tap off and tension points shall be
provided with guys.
Various accessories of guys shall be as per REC construction drawing no. G-1.
Accessories of guys shall be assembled as per REC construction drawing no. G-3.
Page 120
The no. of guys for various angle locations shall be as per REC Construction Standard G-5 to G-9.
The guy angle shall be 30 oto 45 oas per REC construction drawing no. G-3.
Anchor plate (or guy stone) shall be provided as per REC construction drawing no. K-1 and K-4.
Turn buckle shall be mounted at the pole end of the guy and guy wire shall be so fixed that the turn buckle is half
way in the working position thus giving the maximum movement for tightening or loosening.
Minimum two no. Guys shall be provided to two-pole structure of each distribution sub station.
For two pole tension points minimum four guys along the line two in each direction shall be provided.
Storm guys shall be provided for each section of line because KashmirValley is in wind zone of 100 Kg/cm2 (greater
than 50 Kg/cm2). (CBIP Publication no. 88 Page 123)
Fixing of guys to trees, buildings, structures, poles, pipe lines etc. Shall not be allowed in any case whatsoever.
Guy strain insulators: These are used in the guys so that in case of any mishap if the live conductor comes into
contact with the guy wire and continues to be in contact and if the line does not trip then the bottom portion of the
guy wire would have no voltage due to the insulation provided by the guy insulator. The insulator is fixed between the
guy wire almost in middle. The bottom portion of the wire thus gets insulated. Any human being or animal if coming
in contact with the bottom portion of the guy-wire will be provided safety. No guy insulator shall be installed less than
2.6m from the ground. (CBIP Publication no. 88 Page 39,40 and 124)
Two types of insulators are standardized:
(i) A type for 415/240 V lines
(ii) C type for 11kV lines.
Two C-type insulators are used in series for 33kV lines.
The minimum failing load for A type insulator is 44kN and for C type insulator is 88 kN. If space for installation of normal guys is not available then fly guy, bow guy and strut shall be used as per REC
construction standard no. G-4.
Page 121

C) ACSR for Overhead Lines
Nomenclature/ Dimensions:
The conductors shall be specified by their code names and the cross sectional area shall be mentioned in sq. mm only.
Equivalent copper area in sq. inch is no longer being used. Given below is an example to convert conductor sizes into
sq. mm if it is given in equivalent copper area in sq. inch:
Size of ACSR Dog in equivalent Copper area = 0.1 inch2
= 0.1 X 25.4 X 25.4 = 64.51 mm2 Conductivity of Copper = 1.6 X Conductivity of Aluminum (for same area of copper)
Therefore cross sectional area of ACSR Dog in sq. mm = 1.6 X 64.51=100 mm2 (Approx) Following table gives technical details of conductors widely used in Sub Transmission and Distribution networks:
Code Name of ACSR
Equivalent Copper
Area (Inch2)
Nominal Al. Area in mm2
Stranding and wire diameter
(mm)
Approx. Mass
(Kg/Km.)
Calculated Resistance
at 200 C (Ohm/Km)
Approx. calculated breaking
load) KN
Current rating for Ambient Temperature
of 350 C (Amp)
Al Steel
Squirrel 0.02 20 6/ 2.11 1/ 2.11 85 1.394 7.61 110 Weasel 0.03 30 6/2.59 1/2.59 128 0.9289 11.12 145 Rabbit 0.05 50 6/3.35 1/3.35 214 0.5524 18.25 200 Racoon 0.08 80 6/4.09 1/4.09 319 0.3712 26.91 255 Dog 0.1 100 6/4.72 7/1.57 394 0.2792 32.41 305 Leopard 0.125 125 30/2.36 7/2.36 603.8 0.2221 56.56 380 Wolf 0.15 150 30/2.59 7/2.59 727.4 0.1844 67.59 420 Panther 0.2 200 30/3.00 7/3.00 976.0 0.1375 89.66 510
REC Specification 1/1971 (Revised 1993) Table-II, IS 398 -1961 Page 122

The design of conductor shall be based on Voltage Regulation, Thermal rating and mechanical loading.The conductor for overhead lines shall be designed with following regulation:
( CBIP Publication no 198 page 10)
The calculation for voltage regulation shall be based on KW-KM for 1% voltage drop to be taken from following REC Construction Standards:
Nominal voltage of line Reference to REC construction standard for
KW-KM
LT Lines B-9
11kV A-9
33kV M-12
Page 123
Nominal voltage of line Voltage Regulation
33kV 9%
11kV 9%
LT Lines 6%
8.10 General Guidelines for execution of works:
A) Control Cables/C&R Panels:
No openings shall be left in the panels, marshalling kiosks, terminal boxes etc. Special care shall be taken in sealing outdoor cubicles to ensure IP 55 protection. All spare holes in gland plates for cable entry shall be sealed.
The punches in gland plates shall be made by hole punching machine or some other approved mechanical means. Making of holes by welding shall not be allowed. Contractor shall replace gland plates in which holes have been made with welding machines immediately at his cost.
Outdoor cables lying on the yard metal without any protection shall not be acceptable. Cables to equipments like CTs, PTs,
CBs, Transformers shall be routed through cable trays, conduits etc.
Cables without glands shall not be allowed.
Contractor shall ensure that space heaters, thermostats, lights, sockets in all cubicles are working.
Contractor shall provide inter-panel and panel to equipment cable cores with tube type cross ferrules printed by ferrule printer. The ferrules shall have address of the terminal block and terminal of the panel in which terminated and address of panel / equipment , terminal block and terminal of other side. “Cross Ferruling is a global standard for identification of cable cores in a sub station. Suppose a cable core is to be connected from 5th terminal of Terminal Block No. X2 of Control Panel K1 to the 2nd terminal of Terminal Block X3 of another panel R1. The cross ferrule in panel K1 will be “5-X2-K1-R1-X3-2”. 5 is to be kept towards terminal block and 2 side away from the terminal block in K1. Similarly the cross ferrule in panel R1 for the same core will be 2-X3-R1-K1-X2-5. 2 side is to be kept towards terminal block and 5 away from terminal block in R1. Similarly the practice is to be followed for panel to equipment wiring. Cross ferrule is very convenient for identification of cores and fault finding. Earlier ring type PVC ferrules were used for identification of cores. Electronic ferrule printers are now available which print ferrules on PVC tubes. The electronic printer can be hooked on to the computer and ferrules can be printed from the cable schedules
directly from the computer”.
Cable entries to the panels shall be from the bottom. Cable gland plate fitted on the bottom of the panel shall be connected rigidly to the earthing of the panel/station through a flexible braided copper conductor.
Page 124

Wire termination shall be made with solder-less crimping type and tinned copper lugs which firmly grip the conductor and
insulation. Insulated sleeves shall be provided at all the wire terminations. Engraved core identification plastic ferrules marked to correspond with panel wiring diagram shall be fitted at both ends of each wire. Ferrules shall fit tightly on the wire and shall not fall off when the wire is disconnected from the terminal blocks.
All wires directly connected to trip circuit breaker or device shall be distinguished by the addition of red coloured “T” lettered
ferrule. Number 6 and 9 shall not be included for ferrule purpose. CT and VT secondary neutral or common lead shall be earthed at one place only at the terminal blocks where they enter the
panel. For all single core cables, gland plates shall be of non-magnetic material. The cable opening and cable entries for cables terminating to the panels shall be sealed with fire sealing materials. At least one (1) core shall be kept as spare in each copper control cable of 4C, 5C or 7C size whereas minimum number of
spare cores shall be two (2) for control cables of 10 core or higher size. Looping of earth connections shall be such that it would not result in loss of earth connections to other devices when the loop is
broken. However, looping of earth connection between equipment to provide alternative paths to earth bus shall be provided. For control cables only round wire armouring shall be used. Not more than 2 wires shall be connected to any terminal. Disconnecting type terminal blocks shall be provided for Current Transformer and Voltage Transformer secondary leads. All
CT secondary leads shall be provided with short circuiting and earthing facilities. The terminal blocks shall be fully enclosed with removable covers of transparent, non-inflammable, non-deteriorating type
plastic material. At least 20% spare terminals shall be provided at each panel and these spare terminals shall be uniformly distributed on all
terminal blocks. All panels shall be equipped with an earth bus securely fixed. Location of earth bus shall ensure no radio interference for
effectively earthed systems under various switching conditions of isolators and breakers. The material and the size of the bus bar shall be at least 25X6 sq.mm perforated copper with threaded holes at a gap of 50 mm with the provision of bolts and nuts
Page 125

for connection with cable armours and mounted equipment etc. for effective earthing. When several panels are mounted adjoining each other, the earth bus shall be made continuous.
Panels shall be provided with two separate and distinct earthing terminals suitable to receive the earthing conductors of size 50
X 8 mm GS flat.
All panel doors, removable covers and plates shall be gasketed all round with EDPM/ Neoprene gaskets. Cable gland shall be dust tight, screw or double compression type and made up of brass. The glands shall have provision for
securing armour of the cable separately and shall be provided with earthing tag. All cubicles shall be provided with a thermostatically controlled space heater, interior lighting facilities and one single-phase
power outlet ( 3 pin) with socket. All indicating and control devices shall be mounted on the front door. The bay marshalling kiosks shall be provided with danger plates and a diagram showing the numbering/connection/ferruling by
pasting the same on the inside of the door. Aluminium conductor XLPE insulated armoured cables shall be used for main power supply purpose from LT Auxiliary
Transformers to control room, between distribution boards and for supply for colony lighting from control room. Aluminium conductor PVC insulated armoured power cables shall be used for various other applications in switchyard
area/control room except for control/protection purposes. Separate cables shall be used for AC & DC. Progressive sequential marking of the length of cable in metres at every one metre shall be provided on the outer sheath of all
cables.
B) Laying of ACSR
For 11kV lines, at straight runs and light angles (00 to 100) pin insulators shall be used. The conductor shall be tied to the insulator at
the top groove at straight runs and to side groove on top of insulator through helically formed fittings (REC Construction drawing no.
C-3 and C-4).
Page 126
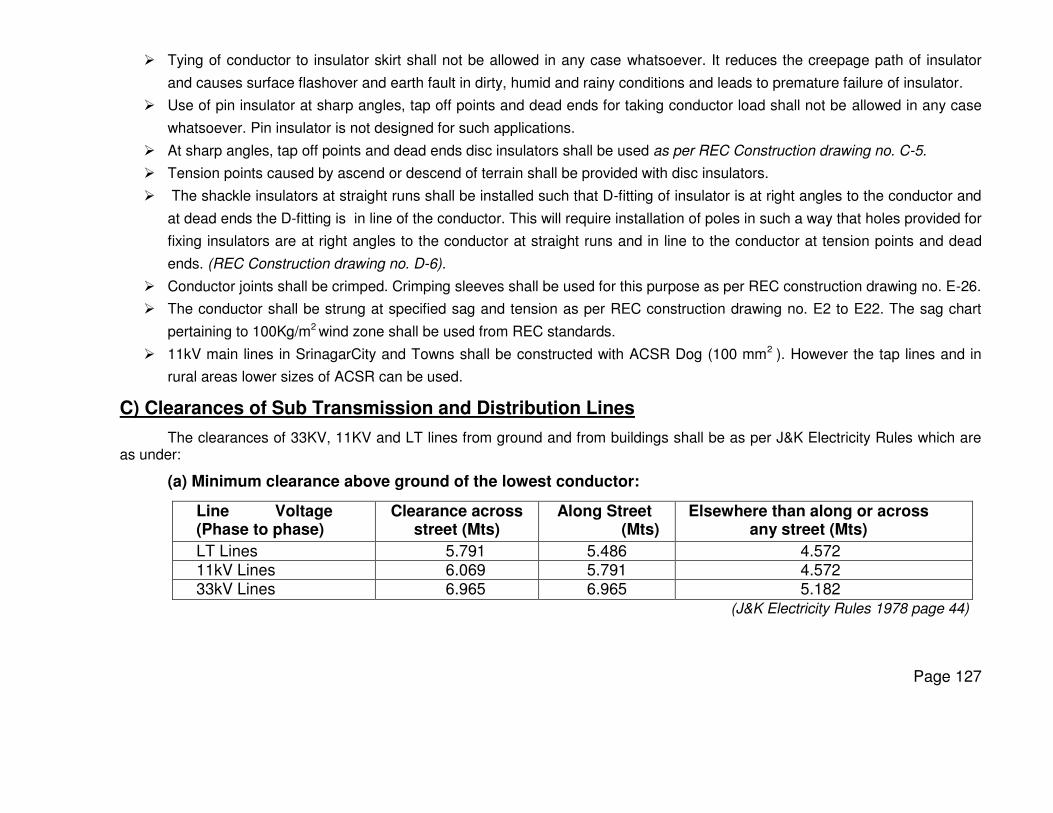
Tying of conductor to insulator skirt shall not be allowed in any case whatsoever. It reduces the creepage path of insulator
and causes surface flashover and earth fault in dirty, humid and rainy conditions and leads to premature failure of insulator.
Use of pin insulator at sharp angles, tap off points and dead ends for taking conductor load shall not be allowed in any case
whatsoever. Pin insulator is not designed for such applications.
At sharp angles, tap off points and dead ends disc insulators shall be used as per REC Construction drawing no. C-5.
Tension points caused by ascend or descend of terrain shall be provided with disc insulators.
The shackle insulators at straight runs shall be installed such that D-fitting of insulator is at right angles to the conductor and
at dead ends the D-fitting is in line of the conductor. This will require installation of poles in such a way that holes provided for
fixing insulators are at right angles to the conductor at straight runs and in line to the conductor at tension points and dead
ends. (REC Construction drawing no. D-6).
Conductor joints shall be crimped. Crimping sleeves shall be used for this purpose as per REC construction drawing no. E-26.
The conductor shall be strung at specified sag and tension as per REC construction drawing no. E2 to E22. The sag chart
pertaining to 100Kg/m2 wind zone shall be used from REC standards.
11kV main lines in SrinagarCity and Towns shall be constructed with ACSR Dog (100 mm2 ). However the tap lines and in
rural areas lower sizes of ACSR can be used.
C) Clearances of Sub Transmission and Distribution Lines
The clearances of 33KV, 11KV and LT lines from ground and from buildings shall be as per J&K Electricity Rules which are as under:
(a) Minimum clearance above ground of the lowest conductor:
Line Voltage (Phase to phase)
Clearance across street (Mts)
Along Street (Mts)
Elsewhere than along or across any street (Mts)
LT Lines 5.791 5.486 4.572 11kV Lines 6.069 5.791 4.572 33kV Lines 6.965 6.965 5.182
(J&K Electricity Rules 1978 page 44)
Page 127
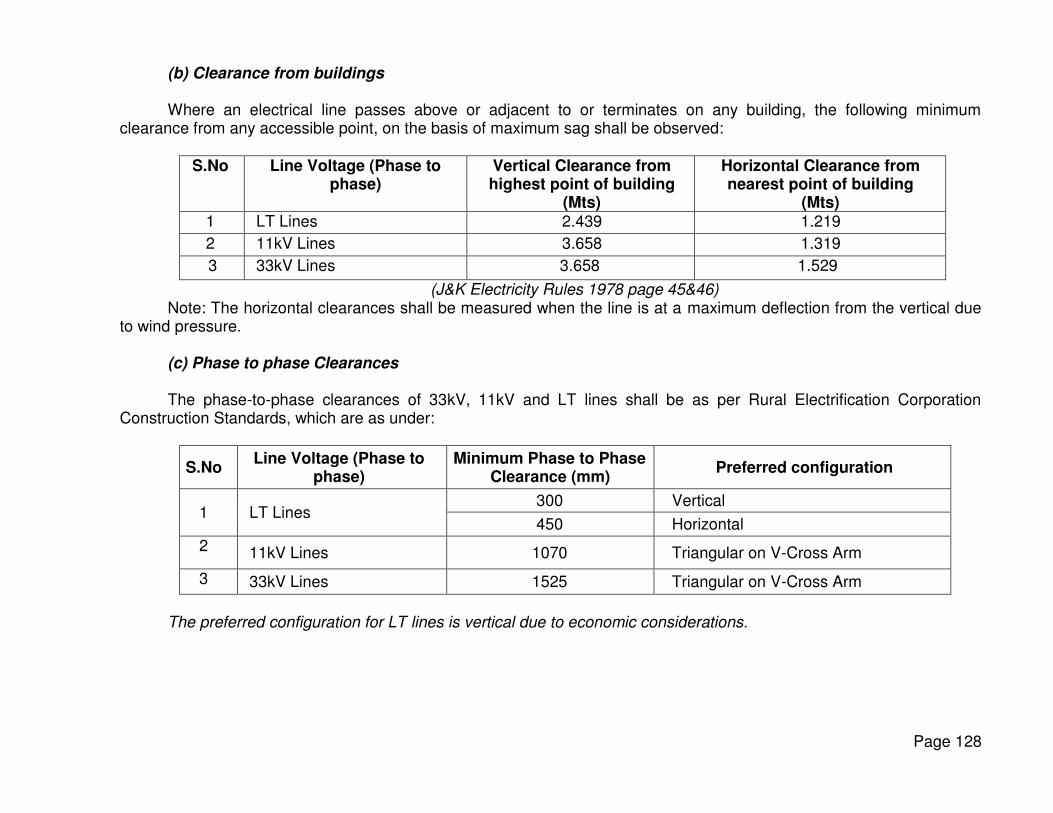
(b) Clearance from buildings Where an electrical line passes above or adjacent to or terminates on any building, the following minimum
clearance from any accessible point, on the basis of maximum sag shall be observed:
S.No Line Voltage (Phase to phase)
Vertical Clearance from highest point of building
(Mts)
Horizontal Clearance from nearest point of building
(Mts) 1 LT Lines 2.439 1.219
2 11kV Lines 3.658 1.319
3 33kV Lines 3.658 1.529
(J&K Electricity Rules 1978 page 45&46) Note: The horizontal clearances shall be measured when the line is at a maximum deflection from the vertical due
to wind pressure. (c) Phase to phase Clearances The phase-to-phase clearances of 33kV, 11kV and LT lines shall be as per Rural Electrification Corporation
Construction Standards, which are as under:
S.No Line Voltage (Phase to
phase) Minimum Phase to Phase
Clearance (mm) Preferred configuration
1 LT Lines 300 Vertical
450 Horizontal
2 11kV Lines 1070 Triangular on V-Cross Arm
3 33kV Lines 1525 Triangular on V-Cross Arm
The preferred configuration for LT lines is vertical due to economic considerations.
Page 128

D) 11kV/ 433V Distribution Sub Station Installation
(a) Clearances:As per REC standard specification no. F-1, F-2, F-3 and F-4 and TATA Consultants report on remodeling of distribution scheme in SrinagarCity, following clearances shall be maintained for 11/0.433kV Sub Stations:
Description Pole mounted
Transformer
Pad mounted
Transformer
References
Capacity Up to and including 250kVA
Above 250KVA
TATA Consultants report, Drg. No. 7-3
Phase to Phase spacing of down conductors
760mm 460mm REC Standards Drg. No. F1,F2,F3 and F4, TATA Consultants report, Drg. No. 7-3
Phase to ground clearance of down conductors (Horizontal)
460mm 460mm REC Standards Drg. No. F1,F2,F3 and F4, TATA Consultants report, Drg. No. 7-3
HT terminal of 11kV bushing upto ground
5440 mm
2200 mm
REC Standards Drg. No. F1,F2,F3 and F4, TATA Consultants report, Drg. No. 7- 4
Note : The transformer jumpers and bushing terminals of pad mounted transformers shall be insulated with PVC
sleeves or coated with epoxy compound. (b) Earthing
1. Three independent earths shall be provided to 11/0.433kV Sub Stations as per REC Construction Drawing no. F-
5 and F-10
2. To one of the earth electrodes one direct connection shall be provided from three Lightening Arresters.
3. To each of remaining two electrodes
(a) one separate connection from the neutral of the transformer.
(b) one separate connection from the transformer body and the handle of 11kV AB switch.
(c.) one separate connection from the earthing of poles.
4. The earthing electrodes shall be 2.5meter perforated GI pipe 40mm dia or 20mm GI rod as per REC construction
drawing no. J-1
Page 129
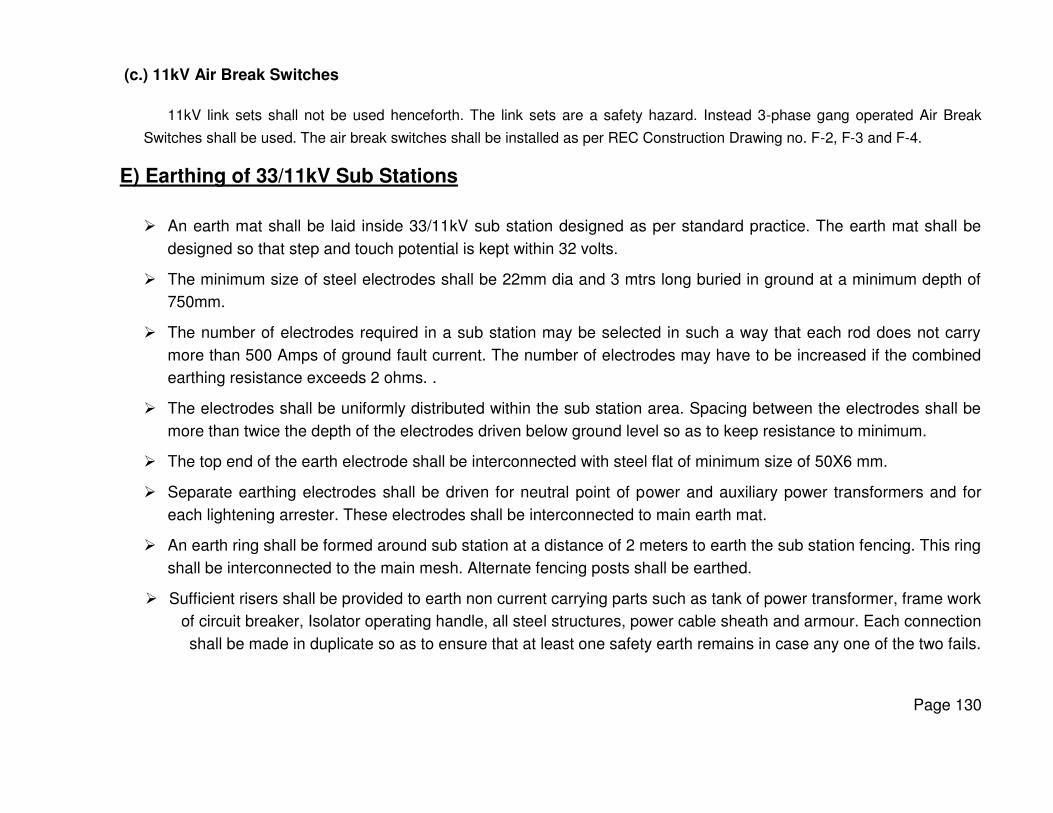
(c.) 11kV Air Break Switches
11kV link sets shall not be used henceforth. The link sets are a safety hazard. Instead 3-phase gang operated Air Break
Switches shall be used. The air break switches shall be installed as per REC Construction Drawing no. F-2, F-3 and F-4.
E) Earthing of 33/11kV Sub Stations
An earth mat shall be laid inside 33/11kV sub station designed as per standard practice. The earth mat shall be
designed so that step and touch potential is kept within 32 volts.
The minimum size of steel electrodes shall be 22mm dia and 3 mtrs long buried in ground at a minimum depth of
750mm.
The number of electrodes required in a sub station may be selected in such a way that each rod does not carry
more than 500 Amps of ground fault current. The number of electrodes may have to be increased if the combined
earthing resistance exceeds 2 ohms. .
The electrodes shall be uniformly distributed within the sub station area. Spacing between the electrodes shall be
more than twice the depth of the electrodes driven below ground level so as to keep resistance to minimum.
The top end of the earth electrode shall be interconnected with steel flat of minimum size of 50X6 mm.
Separate earthing electrodes shall be driven for neutral point of power and auxiliary power transformers and for
each lightening arrester. These electrodes shall be interconnected to main earth mat.
An earth ring shall be formed around sub station at a distance of 2 meters to earth the sub station fencing. This ring
shall be interconnected to the main mesh. Alternate fencing posts shall be earthed.
Sufficient risers shall be provided to earth non current carrying parts such as tank of power transformer, frame work
of circuit breaker, Isolator operating handle, all steel structures, power cable sheath and armour. Each connection
shall be made in duplicate so as to ensure that at least one safety earth remains in case any one of the two fails.
Page 130

The risers to equipment or risers to steel structure shall not be welded. All these connections shall be bolted. The
risers shall be connected to steel structures through bolts/nuts of minimum size of 16mm and the riser to
equipment connection shall be through the bolts/nuts provided with the equipment by manufacturer.
The risers shall not be embedded in concrete.
All welded mesh joints shall be painted with red lead and aluminum and later coated with bituminous.
The power cables shall be grounded at one end only. If the cables are grounded at both ends, the induced currents
flow through a continuous loop formed by armor/ sheath through ground and may damage the cable and/or
termination due to overheating.
Crushed rock may be used as surface layer as it provides high resistivity, keeps away the reptiles and also avoids
formation of pools of oil in case of leakage. It also helps in presence of moisture in the under layer of soil and thus
helps in maintaining low resistivity.
Crushed rock of size 3cm to 5cm to a depth of approximately 10 cm may be spread in the yard area. Electric
equipments and structures supporting live conductors may be surrounded be a surface layer of crushed rock within
a distance of above two meters. This is so as a person is not likely to be exposed to touch voltage when he is two
meters away from any live equipment or structure swith yard.
(Source : REC Earthing Manual; PDD Earthing Booklet; PDD Const. Practice)
F) Electrical Clearances in 33/11kV Sub Stations (Receiving Stations)
Minimum phase – phase clearance of 33kV Bus shall be 1200mm.(REC Construction Drawing no. L-1)
Minimum phase – column clearance of outermost conductors of 33kV Bus shall be 1050mm. (REC Construction
Drawing no. L-1)
Minimum Phase to ground clearance of 33kV Bus shall be 4500mm.(REC Construction Drawing no. L-1)
Minimum ground clearance of HV terminal of 33KV Circuit Breaker and 33/11kV Transformer shall be
3660mm.
Page 131

Minimum phase – phase clearance on 11kV gantry shall be 900mm .(REC Construction Drawing no. L-1)
Minimum distance from 33kV switchyard up to control room shall be 7500mm(REC Construction Drawing no. L-
1)
Minimum spacing between 11kV panels and control room wall shall be 1000mm(with back door open)
Tilting of V-Cross Arms
Some field engineers have approached the committee with complaint regarding tilting of V-Cross Arms at angle locations. The
committee examined the issue and following clarifications are hereby given:
The tilting problem has been noticed mostly at angle locations more than 100 .
The committee has recommended V-Cross arm for tangent locations (straight runs) and light angles (upto100)only. For
angle locations 100 to 600 two pole structure shall be used and for angle locations 600 to 900 4 pole structure shall be
used.(KEECC Record note no dated 09-07-2005 ) (REC Construction Drawing no. A-10)
At some locations the cross arms have slipped and/ or tilted because back clamp for the cross arm was not fabricated as
per REC Construction drawing no. K-2. Please note 20mm gap is to be left between the cross arm and back clamp after
firm tightening
Still if the field engineers have apprehensions that the cross arm may slip/ tilt they can use supporting braces as per
enclosed drawing (CBIP publication no 88 page 58 )
Standardized V-Cross arm has been in use in the country since September 1972. This cross arm is considered to be the
best choice of power engineers all over the country in view of its advantage of reducing the bird faults considerably. Due to
this advantage Central Board of Irrigation and Power has also upheld its use. TATA consultants have also recommended its
use in Srinagar and JammuCities. REC has again standardized this cross arm for RGGVY Schemes (REC Guide Line for
RGGVY Schemes- Attachment-I)
Since KashmirValley is gifted with vast variety of birds some of which are large sized like crows, Kites, Vultures etc. the bird
faults are very common here. The bird sits on the flat cross arm and its beak or tail touches the live conductor resulting in
earth fault. This problem was not widespread earlier because wooden poles and wooden cross arms were used in Sub
Transmission and Distribution System in KashmirValley. These poles/ cross arms provided sufficient insulation to ground.
Ever since the wooden poles and wooden cross arms have been replaced by Steel/PCC poles and steel cross arms, the
occurrence of bird faults has become a regular feature reducing reliability of power supply.
Page 132

The V-cross arm has been designed in such a way that bird cannot sit on it due to its slanting design.
Under the circumstances the committee considers the V-Cross Arm is the best choice for Sub Transmission and Distribution
System in KashmirValley for reliability and safety of the system.
HVDS (High voltage distribution system)
HVDS stands for High Voltage System. In this system high voltage line is drawn as near the load as possible and
small capacity distribution transformer is installed. This system is best suited to meet scattered rural loads. The advantages of this system are:
(i) Reduction in losses because LT line length is reduced.
(ii) Improvement in voltage at the consumers premises.
(iii) Theft of energy by direct tapping of long LT lines eliminated.
(iv) Frequent faults on LT side are reduced.
(v) Failure of Transformers prevented because transformer is feeding 3-5 consumers and these consumers have
sense of belonging of the transformer and they take care of the transformer.
REC specification no. 50/1987 specifies the Single Phase Distribution Transformers. Fig.1, Fig.2, Fig.4 and fig.5 attached to
this specification gives the connection diagram of the single phase transformers. In each drawing continues 11kV neutral is shown on
HT side connected to the transformer. In order to accomplish this scheme a continuous neutral shall have to be run on existing poles
from the star point of 33/11kV Power Transformer right up to the distribution sub station.
The prevailing practice of HVDS in KashmirValley is to use a single conductor for HVDS transformer. The other terminal of HT
winding of the single-phase transformer is grounded locally. This connection is nothing but Single Wire Earth Return System
(SWER).
REC specification no 14/1979 specifies SWER distribution transformers. This specification was issued for gaining experience
only. REC did not issue any construction standard for SWER system till 1994. The REC standards available with the committee
are amended up to 30-07-1994.
The committee tried to obtain information from World Wide Web on SWER systems and following are the findings:
Page 133
A record note regarding HVDS (High Voltage Distribution System) was issued on 23-09-2005. The issue remained
inconclusive at that time because of non-availability of sufficient information on the subject.
REC has recently issued Standard Technical Specification (Specification No. 75/2005) for 5kVA HVDS
Transformers, wherein it has been made clear that in case of single phase 11/3 HVDS transformers, 3 ph., 4
Wire system at 11kV (with separate neutral wire running continuously from 33/11kV sub-station) shall be
adopted and proper earthing of neutral wire separately at both ends shall be ensured. In view of this
development the committee decided to issue following guideline for construction of HVDS substations:
The standard rating of HVDS transformers shall be 5, 6.3, 10 & 16kVA for 11/3 (Phase to Neutral) transformers
and 10 & 16kVA for 11kV (Phase to Phase) transformers. (REC Specification no. 50/1987 & 75/2005)
5kVA transformers will be of great help in feeding small habitations were small loads are to be supplied in rural
areas. Also 5kVA transformers can be used as a dedicated transformer for every consumer in urban area.(Fore-
word to REC Specification no. 75/2005)
The 3 phase and 2 phase HVDS transformers shall be fed from 3 wire 11kV system in conventional manner.
However in case of single phase HVDS transformers (11/3 kV primary), 3 Ph, 4 wire system at 11kV with
separate neutral wire running continuously from 33/11kV sub-station shall be adopted and proper earthing of
neutral wire separately at both ends shall be ensured.(REC Specification no. 50/1987 & 75/2005)
The transformers shall be mounted on single poles. The neutral wire shall be of minimum size ACSR/AAAC
recommended for 11kV by REC (eg ACSR 7/2.11mm, 20mm2 aluminum area)( REC Specification no. 1/1970
revised 1993 & A-32, F-13& F14)
The neutral shall be run on LT shackle insulators installed on 11kV pole directly through D-clamps. The point of
attachment of neutral wire shall be 800mm below lowermost 11kV phase conductors.( REC Specification no. A-16)
The single phase HVDS transformers shall be distributed equally on the 3 phases of 11kV system to ensure
balancing of load at 33/11kV sub station feeding the single phase HVDS system.
Page 134

METER INSTALLATION
In view of ongoing metering drive in the department a guideline was issued for consumer meter installation for wall
mounted and pole mounted meters. However APDRP task force set up by Ministry of Power has devised a
comprehensive guideline for meter installation. It was decided to issue the same to the field engineers for
implementation. This guideline supersedes the guideline devised by the committee.
The first Para of the guideline states: “Choose a location where the meter will be protected from exposure to direct sunlight and rainwater. The location should be away from children's approach and should have enough ventilation
and light for meter installation, testing, meter reading, etc. There should be free space for meter mains fuse
installation and maintenance”.
In view of above and also for convenience of downloading the readings from meter to the AMR/ Laptop computer
the committee felt that meters shall be installed on walls of the consumer installations only. However in case of
extreme necessity where installation on wall is not feasible or for the purpose of exposing of unscrupulous
consumers, the meters may be installed on poles as per guideline issued by the committee earlier.
The present practice of tying the meters to poles, especially in Srinagar city, with steel standards without clamps,
lugs and meter seal and with undersized service line is a sub standard practice and shall not be acceptable to
inspection wing.
TECHNICAL SPECIFICATIONFOR CROSS-ARMSFOR 33 kV AND 11 kV OVERHEAD POWER LINES
1.0 ‘V’ SHAPE M.S. CROSS ARM WITH CLAMPS
1.1 X-arms shall be made out of 100 x 50 x 6 mm and 75 x 40 x 6 mm M.S. Channel for 33KV and 75x40X6mm for
11KV.
1.2 The cross arm shall be hot dipped galvanized generally conforming to IS – 2633/72.
1.3 The X-arm should not be welded/ jointed at any place except as specified.
Page 135

1.4 The clamps for the X-arm shall be of G.I. & shall be hot dipped galvanized generally conforming to IS – 2633/72.
1.5 The clamps shall be designed to fit for the specified rail & PSC poles.
2.0 Shape & Size
2.1 The cross arms shall be of MS channel.
2.2 The cross arms shall have two holes of 22 mm dia (for 11kV line) and 26 mm dia (for 33kV line) for fixing of pin
insulators. The center-to-centre distance between the holes shall be 1070 mm (for 11kV) and 1525 mm (for 33kV)
and holes shall be in the middle of the top width of cross arm.
2.3 If required by the owner, holes of specified size and spacing shall also be provided for fixing of pole back clamp to
suit the pole.
3.0 Marking
The following information shall be marked on each cross arm:
a) Manufacturer’s name or trademark.
b) Year of manufacture
Page 136
8.11COSNTRUCTION DRAWINGS OF
CROSS ARMS, SUB STATION FRAME ETC
Page 137
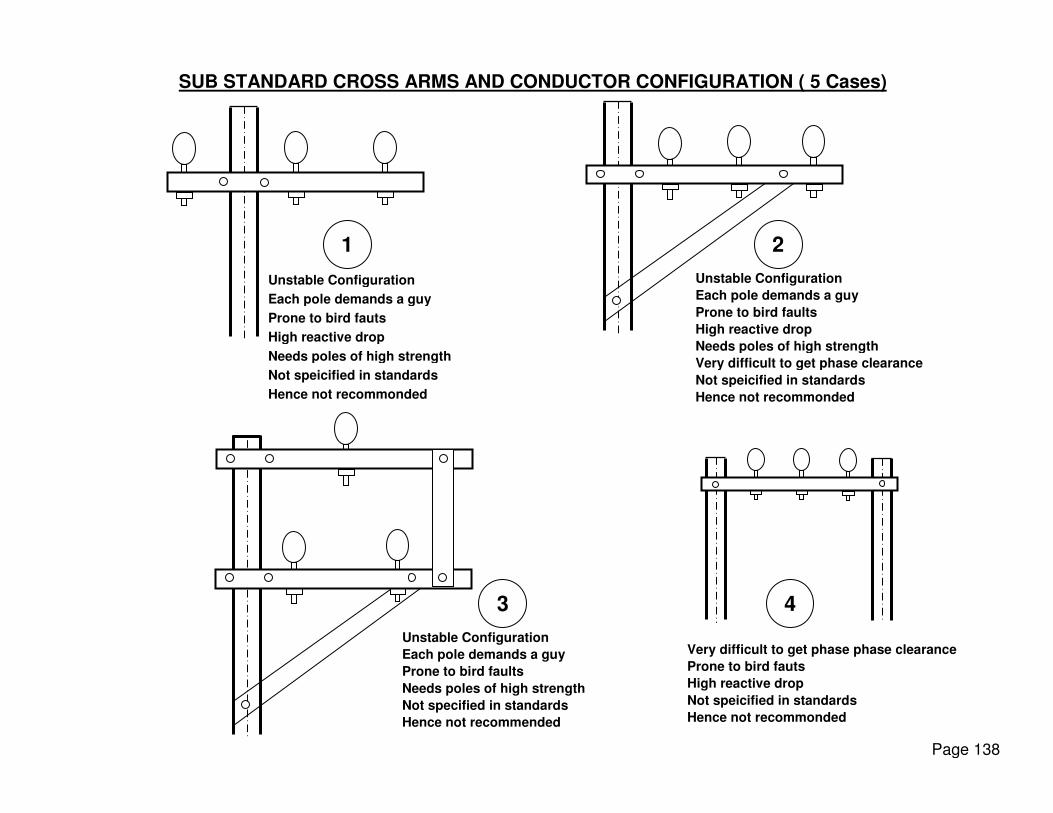
1 2
3 4
Unstable Configuration
Each pole demands a guy
Prone to bird fauts
High reactive drop
Needs poles of high strength
Not speicified in standards
Hence not recommonded
Unstable Configuration
Each pole demands a guy
Prone to bird faults
High reactive drop
Needs poles of high strength
Very difficult to get phase clearance
Not speicified in standards
Hence not recommonded
Very difficult to get phase phase clearance
Prone to bird fauts
High reactive drop
Not speicified in standards
Hence not recommonded
Unstable Configuration
Each pole demands a guy
Prone to bird faults
Needs poles of high strength
Not specified in standards
Hence not recommended
SUB STANDARD CROSS ARMS AND CONDUCTOR CONFIGURATION ( 5 Cases)
Page 138
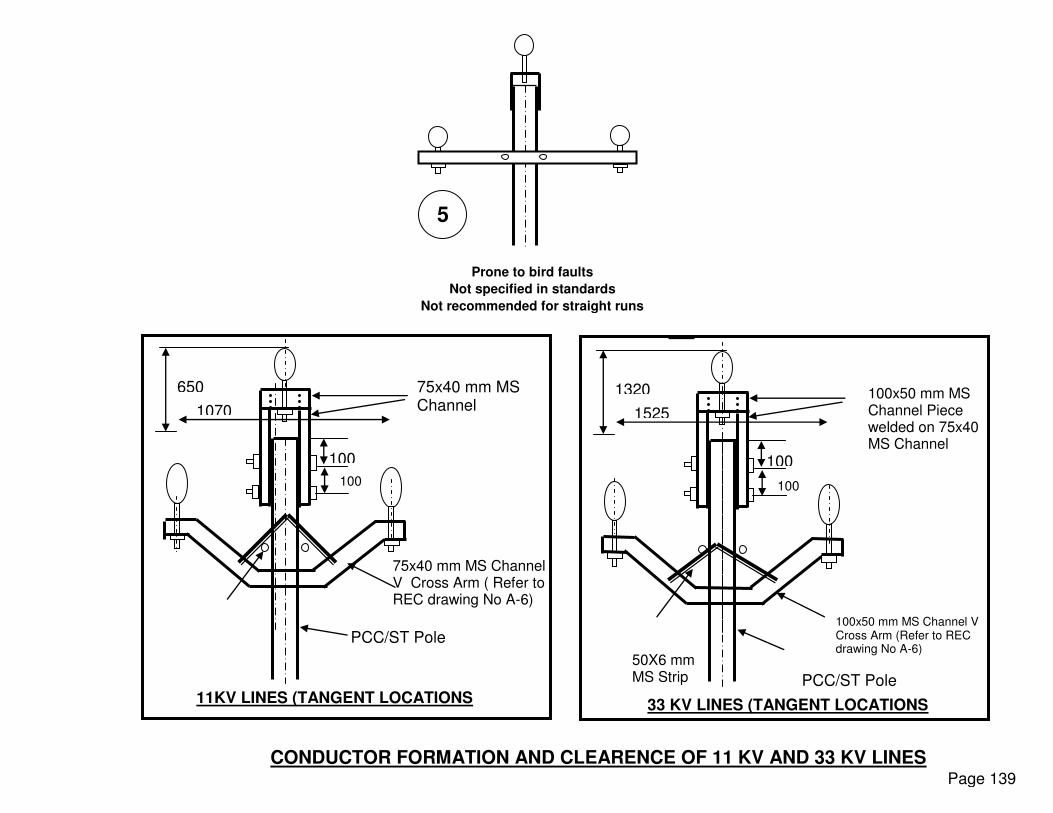
5
Prone to bird faults
Not specified in standards
Not recommended for straight runs
CONDUCTOR FORMATION AND CLEARENCE OF 11 KV AND 33 KV LINES
1070
100
100
650 75x40 mm MS Channel
PCC/ST Pole
75x40 mm MS Channel V Cross Arm ( Refer to REC drawing No A-6)
11KV LINES (TANGENT LOCATIONS
100x50 mm MS Channel Piece welded on 75x40 MS Channel
PCC/ST Pole
100x50 mm MS Channel V Cross Arm (Refer to REC drawing No A-6)
33 KV LINES (TANGENT LOCATIONS
50X6 mm MS Strip
1525
100
100
1320
Page 139

Page 140

Page 141
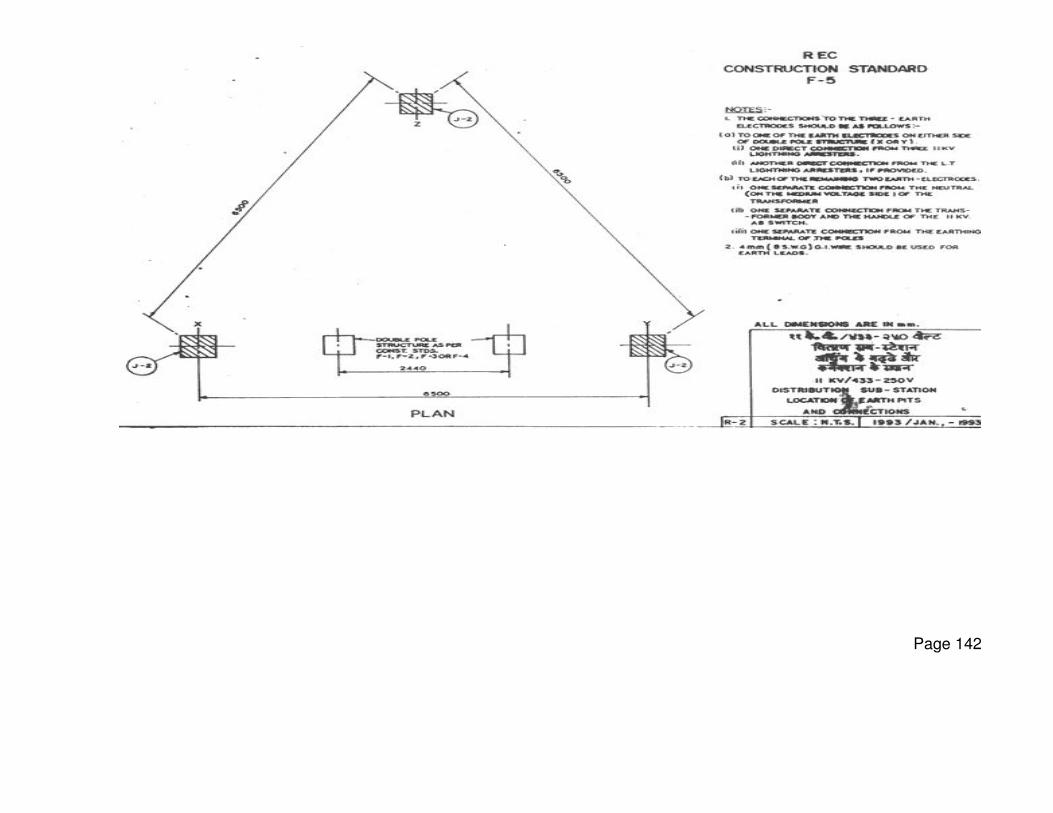
Page 142

Page 143
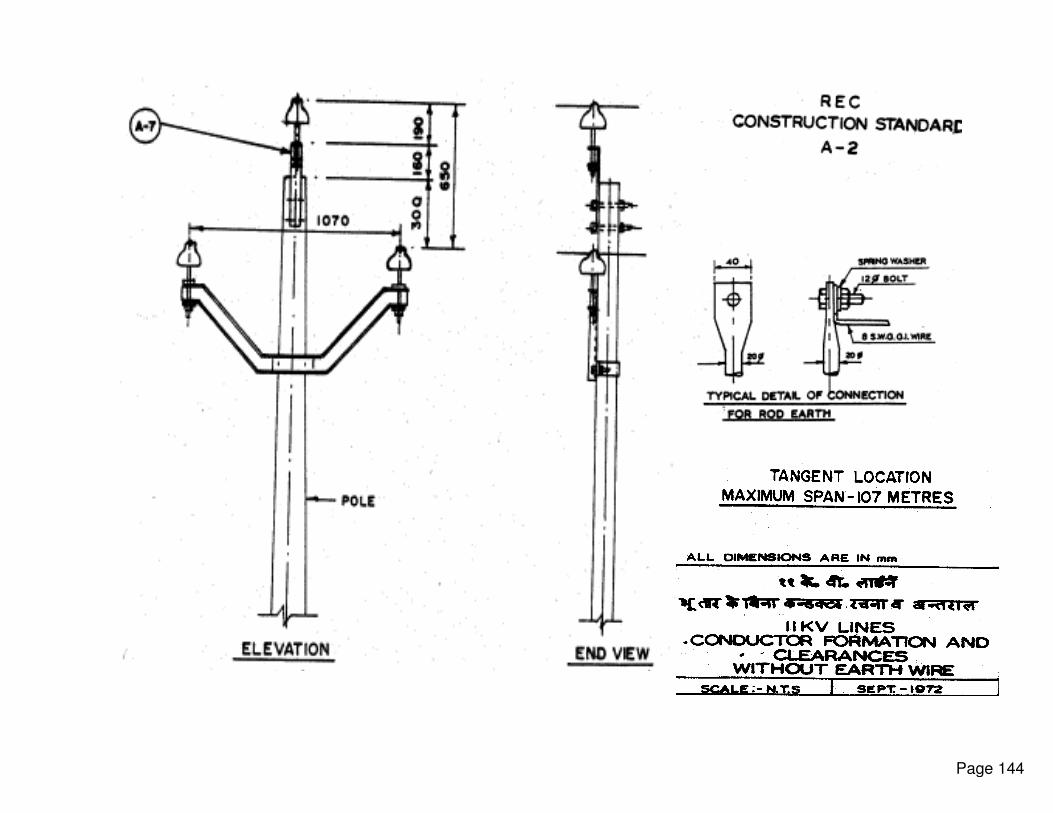
Page 144

Page 145

Suspension and Dead end clamps for Aerial Bunched Cable (ABC)
Page 146
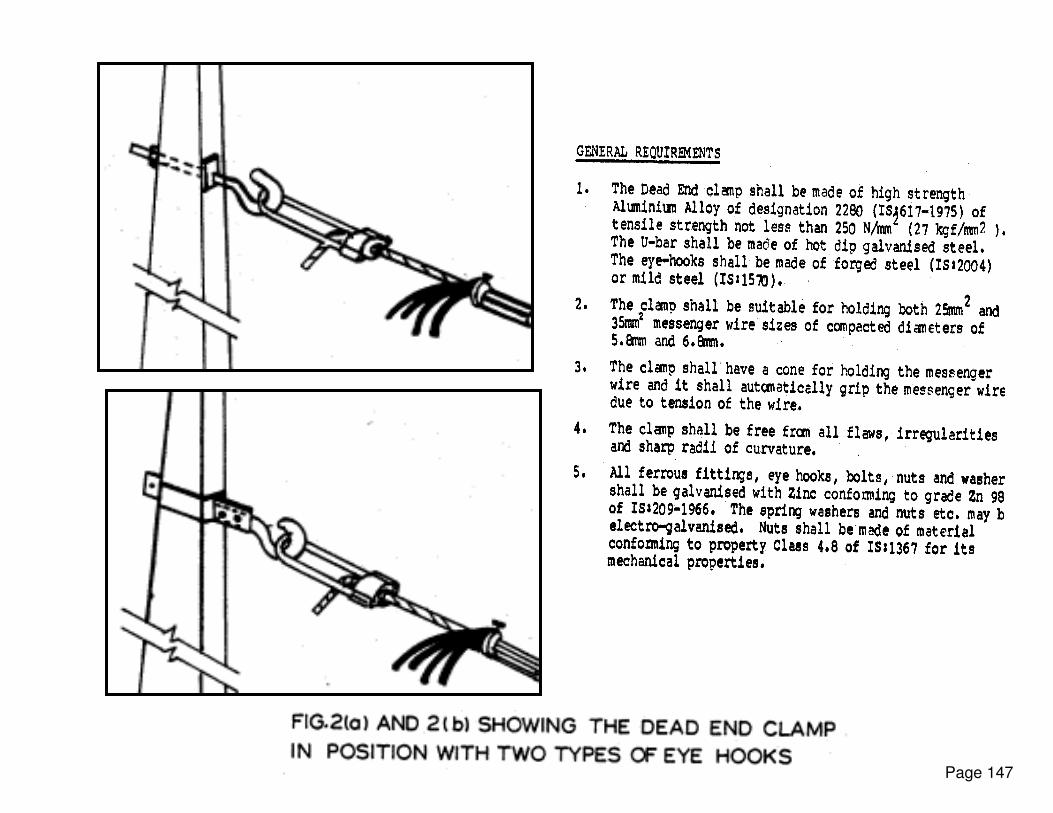
Page 147

INSTALATTION OF METERS ON PCC & ST POLES
Leave 20mm for tightening
4 no 5X30 mm bolts with nuts and washers
25X4 mm MS
Clamp
PCC Pole
Leave 20mm for tightening
4 no 5X30 mm bolts with nuts and washers
25X4 mm MS Clamp
PCC Pole
Leave 20mm for tightening
4 no 5X30 mm bolts with nuts and washers
Electronic Meter
Electronic Meter
ST Pole
Electronic Meter
Page 148
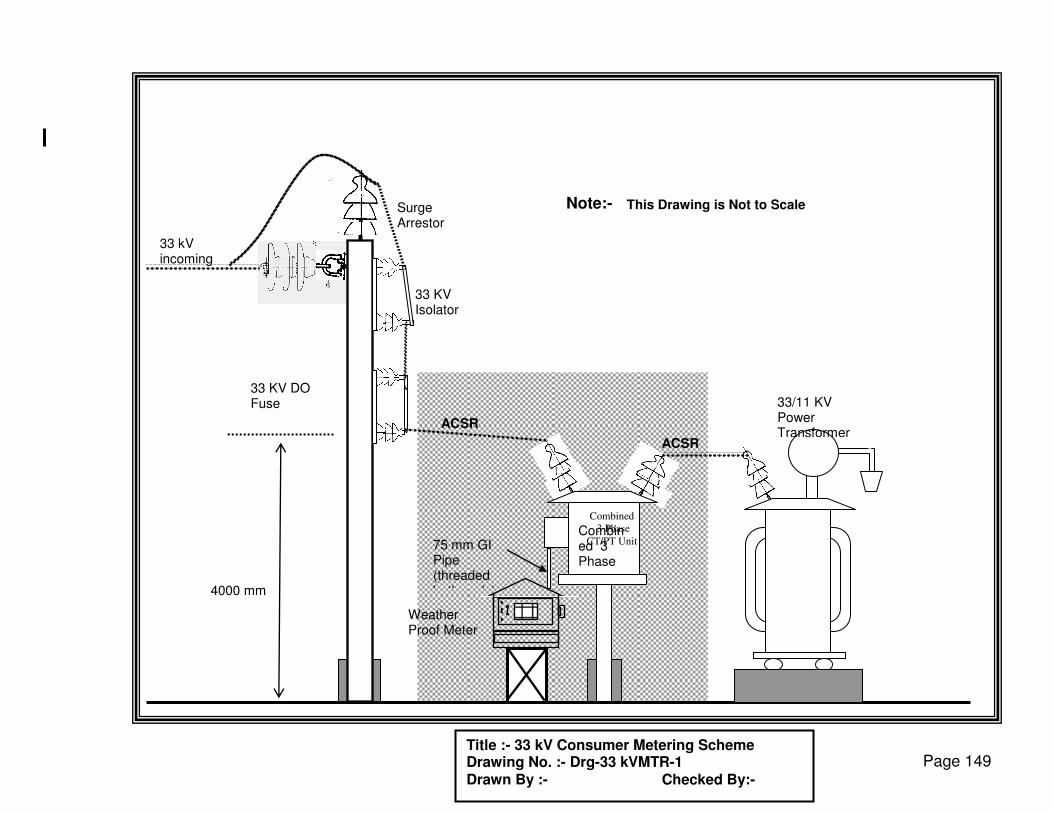
Note:- This Drawing is Not to Scale
Combined 3 Phase CT/PT
33 kV incoming Line
33 KV Isolator
Weather Proof Meter Box
33/11 KV Power Transformer
33 KV DO Fuse
75 mm GI Pipe (threaded both ends) 4000 mm
ACSR
ACSR
Title :- 33 kV Consumer Metering Scheme Drawing No. :- Drg-33 kVMTR-1 Drawn By :- Checked By:-
Surge Arrestor
Combined
3 Phase
CT/PT Unit
Page 149

TITLE : 11 kV Consumer Metering Scheme
7
0
3
3
0
0
0
0
1625
710 710
710
710
1
0
15
00
SR.NO DESCRIPTION
1 11 KV EPOXY CAST CT 3 NOS.
2 11 KV EPOXY CAST 3 Ø PT 1 NO.
3 MOUNTING CHANNEL 2 NOS. SIZE 100X50X50
4 BUSBAR TO CONNECT THE CTS 40 mm COPPER STRIP
5 BUSBAR TO CONNECT THE PTS FLEXIBLE COPPER PLATE
6 SIZE OF MS PLATE 2 mm
7 WIREMESH SQUARE OF 35 mm
8 SIZE OF ACRYLIC SHEET 3 mm
9 RS 232 PORT
10 HINGED COVER FOR RS 232 PORT WITH LOCKING ARRANGEMENT
Page 150


![[XLS]apsebea.orgapsebea.org/files/Tel-APTRANSCO-10.09.2011.xls · Web view132 KV Korutla 080-31,32 132 KV Manthani 0729/029-36 132 KV Huzurabad 033-35 132 KV Mallaram 08723-236164](https://static.fdocuments.net/doc/165x107/5b0e1ab67f8b9aa31f8b92d9/xls-view132-kv-korutla-080-3132-132-kv-manthani-0729029-36-132-kv-huzurabad.jpg)