
@ 2012, Cengage Learning Cost Behavior and Cost-Volume-Profit Analysis LO 4 – Using the Graphic...
21
@ 2012, Cengage Learning Cost Behavior and Cost-Volume-Profit Analysis LO 4 – Using the Graphic Approach for CVP Analysis
-
Upload
doreen-wells -
Category
Documents
-
view
217 -
download
0
Transcript of @ 2012, Cengage Learning Cost Behavior and Cost-Volume-Profit Analysis LO 4 – Using the Graphic...

@ 2012, Cengage Learning
Cost Behavior and Cost-Volume-Profit Analysis
LO 4 – Using the Graphic Approach for CVP Analysis
Cost-Volume-Profit (Break-Even) Chart
A cost-volume-profit chart, sometimes called a break-even chart, graphically shows sales, costs, and the related profit or loss for various levels of units sold.
LO 4

Cost-Volume-Profit (Break-Even) Chart
LO 4
The cost-volume-profit charts in this section are based on Exhibit 5, which was constructed using the following data:
(continued)

Cost-Volume-Profit (Break-Even) Chart
LO 4
Sal
es a
nd
Co
sts
(in
th
ou
san
ds)
0Units of Sales (in thousands)
$500
$450
$400
$350
$300
$250
$200
$150
$100
$ 50
Dollar amounts are indicated along the vertical axis.
1 2 3 4 5 6 7 8 9 10
Volume is shown along the horizontal axis.

Cost-Volume-Profit (Break-Even) Chart
LO 4
Point APoint A
1 2 3 4 5 6 7 8 9 10
Sal
es a
nd
Co
sts
(in
th
ou
san
ds)
0
$500
$450
$400
$350
$300
$250
$200
$150
$100
$ 50
Units of Sales (in thousands)
Point A could have been plotted at any sales level, because linearity is assumed.

Cost-Volume-Profit (Break-Even) Chart
LO 4
Beginning at zero on the left corner of the graph, connect a straight line to the dot (Point A). This is
the total revenue or total sales line.
Point APoint A
1 2 3 4 5 6 7 8 9 10
Sal
es a
nd
Co
sts
(in
th
ou
san
ds)
0
$500
$450
$400
$350
$300
$250
$200
$150
$100
$ 50
Units of Sales (in thousands)
Total Revenue

1 2 3 4 5 6 7 8 9 10
Sal
es a
nd
Co
sts
(in
th
ou
san
ds)
0
$500
$450
$400
$350
$300
$250
$200
$150
$100
$ 50
Units of Sales (in thousands)
Cost-Volume-Profit (Break-Even) Chart
LO 4
Fixed cost of $100,000 is a horizontal line.
Fixed Cost

1 2 3 4 5 6 7 8 9 10
Sal
es a
nd
Co
sts
(in
th
ou
san
ds)
0
$500
$450
$400
$350
$300
$250
$200
$150
$100
$ 50
Units of Sales (in thousands)
Cost-Volume-Profit (Break-Even) Chart
LO 4
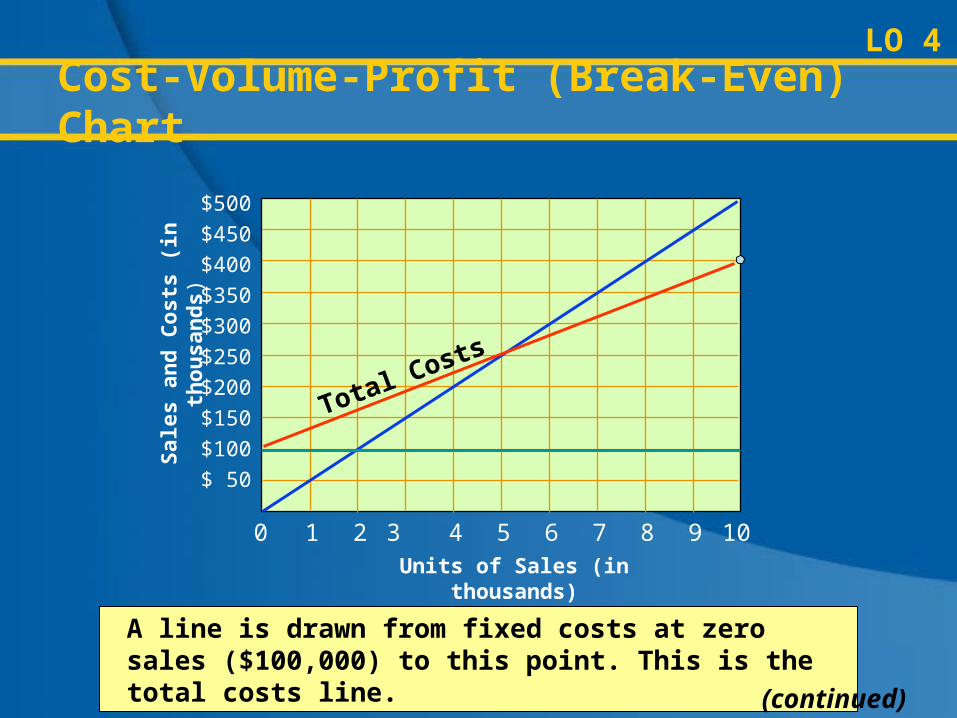
A point is marked at $400,000, where 10,000 units are sold.
(continued)
1 2 3 4 5 6 7 8 9 10
Sal
es a
nd
Co
sts
(in
th
ou
san
ds)
0
$500
$450
$400
$350
$300
$250
$200
$150
$100
$ 50
Units of Sales (in thousands)
Cost-Volume-Profit (Break-Even) Chart
LO 4
A line is drawn from fixed costs at zero sales ($100,000) to this point. This is the total costs line.
(continued)
Total Costs

Cost-Volume-Profit (Break-Even) Chart
LO 4
1 2 3 4 5 6 7 8 9 10
Sal
es a
nd
Co
sts
(in
th
ou
san
ds)
0
$500
$450
$400
$350
$300
$250
$200
$150
$100
$ 50
Units of Sales (in thousands)
Cost-Volume-Profit (Break-Even) Chart
LO 4
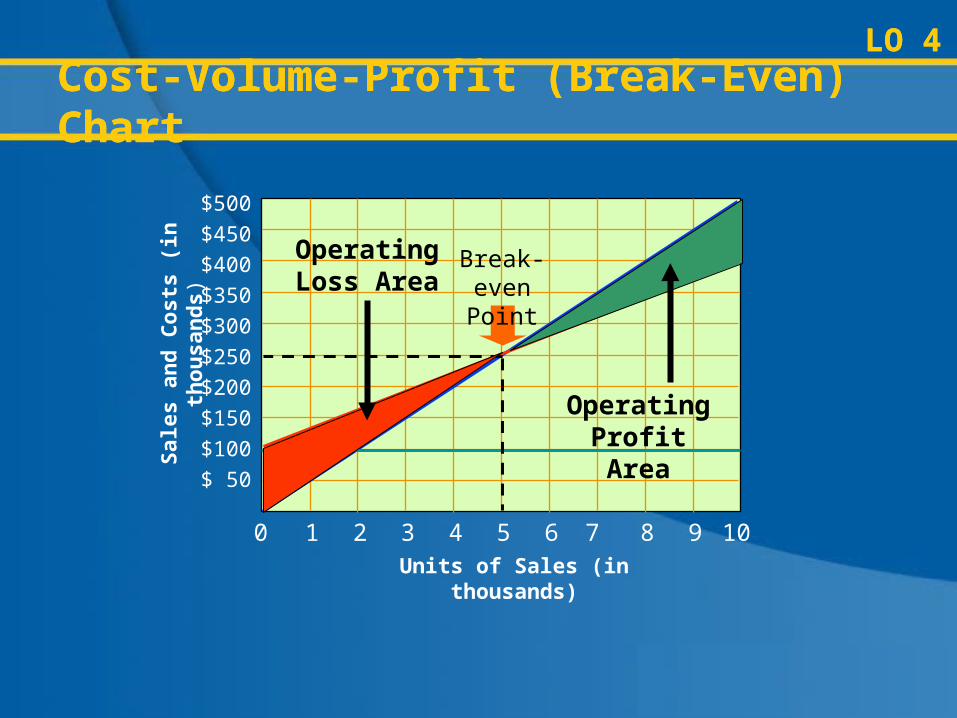
The point where the revenue (blue) line and the total costs (orange) line intersect is the break-even point.
Break-even Point
(continued)

Cost-Volume-Profit (Break-Even) Chart
LO 4
1 2 3 4 5 6 7 8 9 10
Sal
es a
nd
Co
sts
(in
th
ou
san
ds)
0
$500
$450
$400
$350
$300
$250
$200
$150
$100
$ 50
Units of Sales (in thousands)
Cost-Volume-Profit (Break-Even) Chart
LO 4
Break-even is sales of 5,000 units or $250,000.
Break-even Point
Cost-Volume-Profit (Break-Even) Chart
LO 4
1 2 3 4 5 6 7 8 9 10
Sal
es a
nd
Co
sts
(in
th
ou
san
ds)
0
$500
$450
$400
$350
$300
$250
$200
$150
$100
$ 50
Units of Sales (in thousands)
Cost-Volume-Profit (Break-Even) Chart
LO 4
Break-even Point
Operating Loss Area
Operating Profit Area

Cost-Volume-Profit (Break-Even) Chart
LO 4Cost-Volume-Profit (Break-Even) Chart
LO 4

Cost-Volume-Profit (Break-Even) Chart
LO 4Cost-Volume-Profit (Break-Even) Chart
LO 4
A proposal to reduce fixed costs by $20,000 is to be evaluated. The cost-volume-profit chart in Exhibit 6 (next page) was designed to assist in this evaluation. Note that the total costs line has been drawn from fixed costs at zero sales of $80,000, reducing the break-even point to dollar sales of $200,000, or 4,000 units.

Cost-Volume-Profit (Break-Even) Chart
LO 4Cost-Volume-Profit (Break-Even) Chart
LO 4

Profit-Volume Chart
Another graphic approach to cost-volume-profit analysis, the profit-volume chart, plots only the difference between total sales and total costs (or profits). Again, data from Exhibit 5 are used.
LO 4LO 4
Unit selling price $ 50Unit variable cost 30Unit contribution margin $ 20
Total fixed costs $100,000
Unit selling price $ 50Unit variable cost 30Unit contribution margin $ 20
Total fixed costs $100,000

Profit-Volume ChartLO 4LO 4
The maximum operating loss is equal to the fixed costs of $100,000. Assuming that the maximum unit sales within the relevant range is 10,000 units, the maximum operating profit is $100,000, as shown below.
Maximum profitMaximum profit

Profit-Volume ChartLO 4LO 4
Profit-Volume ChartLO 4LO 4
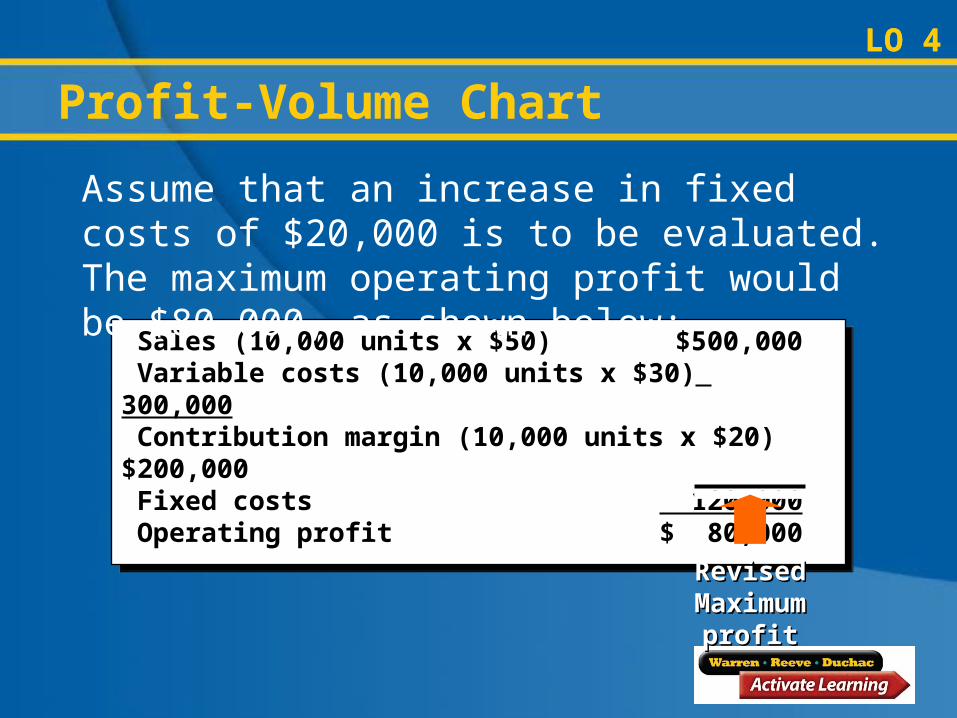
Sales (10,000 units x $50) $500,000 Variable costs (10,000 units x $30) 300,000 Contribution margin (10,000 units x $20) $200,000 Fixed costs 120,000 Operating profit $ 80,000
Sales (10,000 units x $50) $500,000 Variable costs (10,000 units x $30) 300,000 Contribution margin (10,000 units x $20) $200,000 Fixed costs 120,000 Operating profit $ 80,000
Assume that an increase in fixed costs of $20,000 is to be evaluated. The maximum operating profit would be $80,000, as shown below:
Revised Revised Maximum profitMaximum profit

Profit-Volume ChartLO 4LO 4

Assumptions of Cost-Volume-Profit Analysis
The primary assumptions are as follows:1. Total sales and total costs can be represented by straight
lines.
2. Within the relevant range of operating activity, the efficiency of operations does not change.
3. Costs can be divided into fixed and variable components.
4. The sales mix is constant.
5. There is no change in the inventory quantities during the period.
LO 4
![Cost Volume Profit [CVP] Analysis - CA Sri LankaCVP – Cost Volume Profit analysis : analysis of total cost and profitability at different levels of production. BEP – Break Even](https://static.fdocuments.net/doc/165x107/5f3059f5c0749f17840931f1/cost-volume-profit-cvp-analysis-ca-sri-cvp-a-cost-volume-profit-analysis-.jpg)


![Cost Volume Profit [CVP] Analysis - CA Sri Lanka - 4.pdf · cost volume profit [cvp] analysis ca business school postgraduate diploma in business and finance semester 1 : financial](https://static.fdocuments.net/doc/165x107/5acdcb8d7f8b9a875a8e4368/cost-volume-profit-cvp-analysis-ca-sri-lanka-4pdfcost-volume-profit-cvp.jpg)


![Cost Volume Profit [CVP] Analysis - CA Sri Lanka · cost volume profit [cvp] analysis ca business school postgraduate diploma in business and finance semester 1 : financial planning](https://static.fdocuments.net/doc/165x107/5acdcb8d7f8b9a875a8e4359/cost-volume-profit-cvp-analysis-ca-sri-lanka-volume-profit-cvp-analysis-ca.jpg)

