© 2010 VMware Inc. All rights reserved Enterprise Management.
76
© 2010 VMware Inc. All rights reserved Enterprise Management
-
Upload
lee-briggs -
Category
Documents
-
view
218 -
download
0
Transcript of © 2010 VMware Inc. All rights reserved Enterprise Management.

© 2010 VMware Inc. All rights reserved
Enterprise Management

2
Why Automated Operations, now more than ever?

3
What We Are Hearing From You
Configuration & CompliancePerformance & Capacity
“I need a more integrated, simpler approach to ensure the performance,
capacity, and health of our virtual
environment”
“In the past we’ve just over-provisioned as that was the safest way to CYA. But now
management is asking for usage reports and capacity plans before they allow us to buy more infrastructure.”
“We are constantly preparing for or
responding to an audit. We basically shut down normal IT Ops, other than emergencies,
during each quarterly audit period.”
“We don’t really have good visibility with
our servers – we don’t know what patches have been applied or when. It would be great to know what percentage we are
patched each week.”
4
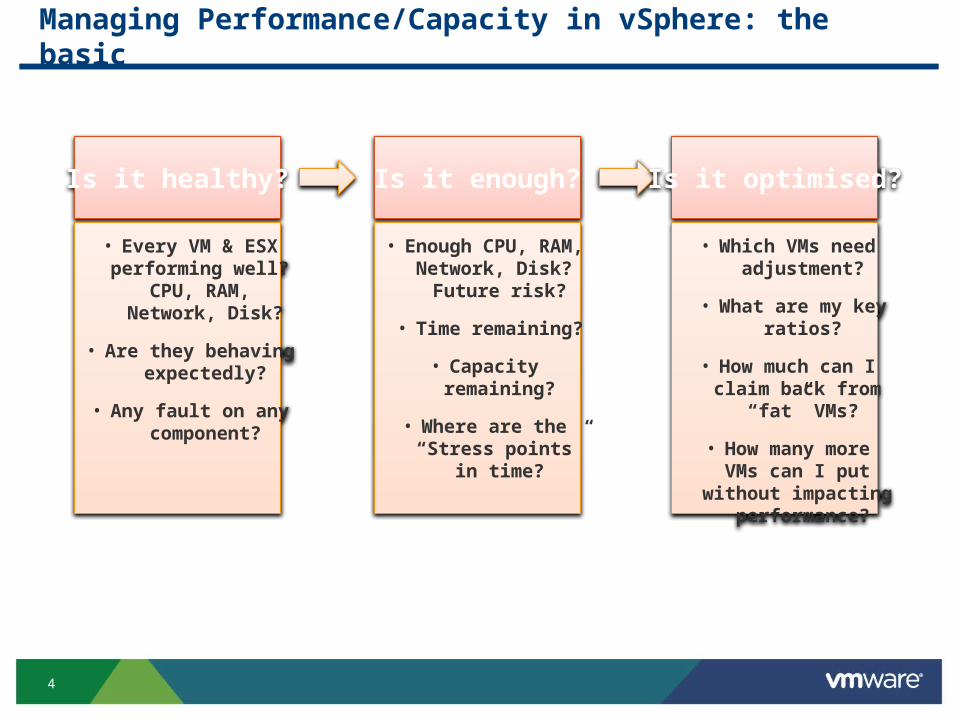
Managing Performance/Capacity in vSphere: the basic
Is it healthy?
• Every VM & ESX performing well?
CPU, RAM, Network, Disk?
• Are they behaving expectedly?
• Any fault on any component?
Is it enough?
• Enough CPU, RAM, Network, Disk?
Future risk?
• Time remaining?
• Capacity remaining?
• Where are the “Stress points”
in time?
Is it optimised?
• Which VMs need adjustment?
• What are my keyratios?
• How much can I claim back from
“fat” VMs?
• How many more VMs can I put
without impacting performance?

5
Deep understanding of vCenter is required
Yes, buy more RAM.
ESXi has 32 GB RAM.
It is highly used
6
VMware’s Approach to Automated Operations

7
Purpose Built Capacity Planning & Analysis• Integrated capacity analysis and forecasting• Decision support & automation via views, alerts, reports• VM right sizing and capacity reclamation
Automated Configuration & Compliance• Automated Patching and Provisioning• Comprehensive change tracking to isolate root cause• Single-click rollback to remediate and return to normal
Patented Performance Analytics• Self-learning of “normal” performance conditions• Service health baseline and trending • Smart alerts of impending performance degradation
vCenter Operations Solution- Bringing together 3 Disciplines

8
Threshold: a shift in mindset needed
vCenter sets “static” threshold, which can be misleading
• During peak, it is common for VM to reach high utilisation.
• Static threshold will generate alerts when they should not.
• vSphere admin quickly learns to ignore them, defeating the purpose of alert to begin with.
• During non-peak, it might be abnormal for VM to reach even 50% utilisation.
• Static threshold will not generate alerts when they should have.
vCenter only sets high threshold
• Do you set static threshold when CPU or RAM utilisation drops below 5%? • A drop in entire array storage IOPS might be a sign of terrible day ahead.
• Will not alert when these happen:
• Utilisation drops from 75% to 1% when it should not.
• Utilisation change from 5% to 70% when it should not.
• We need to plots both upper range and lower range
But each VM differs. And the same VM differs depending on day/time…
• Intelligence required to analyse each metrics and their expected “normal” behaviour.

10
Technical Deep Dive Presentation
Back

11
vCenter Operations Management Suite 5.0
VMware vCenter Operations Manager
• Key part of the VMware vCenter Operations Management Suite
CapacityIQ Merged with vC Ops
• CIQ gets VCOPs features
Dashboard
• New Badges (11 – Up from 3)
• Improved Details Page
Greater Emphasis on the Datastore (First Class Object)
• Performance Management and Capacity Management
New Integrations
• VCM vC Ops
• vC Ops Chargeback
• vCD vC Ops

12
vSphere
vCenter Operations Mgr. – High Level Architecture
OpenVPN
Postgres DB
vSphere
WebApp
Custom
WebApp
Admin
WebApp
vCenter Operations Manager vApp
UI VM
Rolled up capacity data
Capacity Analytics
FSDBPostgres DB
Collector
ActiveMQ
Performance Analytics
Analytics VM
Metric Data
vSphere
VMware Cloud / vCenter
vSphere
vC Ops Mgr vSphere UI
vCenter Configuration
Manager
3rd Party Data Sources
vCenter Communications
over SSL
vC Ops Mgr Custom UI

13
Brand new UI in vCOps5
Updates to the 1.0 Skittles View
Operations Badges
Relationship to the
Datastore
Left Pane Navigation
Drives Focus(e.g. Datastore)
New World Object
Multi vCenter Support

14
Dashboards & Badges

15 Confidential
Vc Ops vSphere UI – Unified Dashboard
Launching Pad
• Click to Drill down
Focused on problems
• Click to drill into details!
• Almost everything is clickable
Main Themes
• Health
• Risk
• Efficiency
New Concepts
• Faults
• Weekly Stress Profile
• Reclaimable Waste
• Density

16
vC Ops vSphere UI – Two Different Users
• Immediate problems
• What is happening right now?
• What do I need to pay attention to?
Operations Short and Long Term Capacity
• Forward Looking
• Are there areas that I should be concerned about from a capacity perspective?
• Have I deployed my VI in the most efficient manner?

17
vC Ops Default UI – Major and Minor Badges
• High level Understanding
• Calculated from scores of Minor Badges
Major x 3
Minor x 8• Specifics
• Guidance

18
Operations: Major Badge – Health
“How is this object doing right now?"
• Identifies current problems in the system
• Issues that need to be resolved immediately to avoid problems
High Health is good (100-0)
Heatmap
• Provides quick view of many objects at once
• Shows Health of all parent and child objects
• Go back in time (6 hours) and see the “weather” of the Virt Infrastructure
Health Score is calculated from its Minor Badges
• Workload
• Anomalies
• Faults

19
Operations: Health Minor Badge – Workload
Measures how hard an object is working?
High Workload is bad (0-100 or more!)
• Percentage of Demand divided by effective capacity
• As workload approaches (and exceeds) 100% Performance Problems!
Starving object for resources!
Focused attention
• CPU
• Memory
• Disk I/O
• Network I/O
95
Improved Network and Disk I/O calculations
Eliminates idle networks and storage from showing High Workload
Limit the erroneous 100% Workload scores

20
Operations: Health Minor Badge – Anomalies
Measures how normal is this object behaving?
• Is what the vC Ops 1.x Health score was, but now inversed
Derived from the number of metrics that are outside of their “Normal” trended ranges
• Learns dynamic ranges of “Normal” for each metric
• Identifies metric abnormalities
Low Anomalies is good (0-100)
• Zero meaning the object is performing exactly the way vC Ops expects it to for that time of the day, that day of the week
• A high number of anomalies are usually an indication of a problem
Anomalies Chart
• Current number of Abnormal Metrics
• Problem/Noise Threshold
Crossing problem threshold will increase the Anomalies Score
Does not generate an alert in this vSphere UI

21
Workload and Anomalies
Workload and Anomalies together tell you a lot…
Workload High & Anomalies Low
• Workload – Object is Running Hot
• Workload – Potentially Starving for Resources
• Anomalies – Normal Behavior for this timeframe
• Work with users to determine if more resources are needed
Workload High & Anomalies High
• Workload – Object is Running Hot
• Workload – Potentially Starving for Resources
• Anomalies – Abnormal behavior for this timeframe
• Something is amiss!!!
• Immediate Attention!!!

22
Operations: Health Minor Badge – Faults
Measures the degree of faults or problems the object is experiencing
• Pulled from active vCenter events
VMware specific knowledge of which vCenter Events affect Availability and Performance (examples):
• Loss of redundancy in NICs or HBAs
• Memory checksum errors
• HA failover problems
Low Faults is good (0-100)• Each fault has a default score (e.g. 25,
50, 75, 100)• Highest individual Fault Score drives the
Fault object Score
Best Practices:
• Do not change the Faults Threshold
• Use Alerts View to manage Faults
Faults shown in Widget

23
Capacity Planning: Major Badge – Risk
Are there future risks to my systems and VI?
Identifies potential problems that could eventually hurt the performance
Low Risk is good (0-100)
Risk Score is calculated from its Minor Badges
• Time Remaining
• Capacity Remaining
• Stress
Risk Chart
• Shows Risk score over the last 7 days

24
Capacity Planning: Risk Minor Badge – Time Remaining
Measures time remaining before each resource type reaches its capacity
• CPU
• Memory
• Disk
• Network I/O
Early warning of upcoming provisioning needs
• Avoid future performance issues
High Time Remaining is good (100-0)
Graph shows resource utilization trends

25
Capacity Planning: Risk Minor Badge – Capacity Remaining
Measures how many more VMs can be placed on the object
Percentage of Total VM “Slots” Remaining
• Based on the average size of the VM on the object (e.g. VM profile)
• Each object has its OWN VM profile size: Host, Cluster, Datacenter, Etc.
High Capacity Remaining is good (100-0)
• Zero mean no room left for more VMs
333 More VMs correlates to 77% Capacity Remaining for this object

26
Capacity Remaining Calculation
Determine Capacity Constraint Resource• Dashboard Chart does not show
which resource is the limiting one• Must drill into the Details Chart
Deployed or Powered On VMs• Deployed/Powered Off VMs only use
disk space resources• Powered On VMs uses ALL of the 4
resources
Calculation Example Shown: • Limiting Resource is Disk Space with
333 VMs available • Use the Deployed VM number of 99
to do the calculation for percentage space remaining• Determine Capacity Remaining
• 333 / (333 + 99) = 77%

27
Capacity Planning: Risk Minor Badge – Stress
Stress measures long-term or chronic workload
• Workload shows an instantaneous value
• Stress looks over a longer period of time
Quickly find and resolve
• Undersized objects
• Population contention
Low Stress is good (0-100)
Stress score encompasses a six (6) week period
• Workloads > 70% = “Stressed”
• Threshold Configurable
Chart shows weeks break down of Stress for each day/hour averaged over the last six (6) Weeks

28
Stress Calculation
Stress Score is a % and is based on area of Workload Above “Stress Line” Threshold compared to the Total Capacity of the object
• Stress line is configured in the vC Ops Configuration Wizard
• Stress Score = (Stress area / Stress Zone) *100
Example• Stress Line is 70% Workload• 12% of the area is above the 70% threshold• Stress Score is 12
0
100
70
Stress Zone
Workload Line
6 Weeks
12%

29
Stress Configuration – Host or Cluster
Access via Configuration Widget
• Stressed Cluster and Host
• Undersized VM
Stress Line
• CPU and/or Memory Workload
Stress Threshold
• When should an object appear on the Stress Reports
• Does not affect Badge Score
Object is stressed if its degree stressed is greater than the %
Stressed threshold
Determines the Stress line for a physical resource (viz. CPU, Memory)

30
Stress Configuration – Undersized VM Detection
A cluster or host is identified as stressed if its degree stressed is greater than the %
Stressed threshold
Use Any or All thresholds for detection
Determines the Stress line for a physical resource (viz. CPU, Memory)

31
Workload, Anomalies and Stress
Adding Stress Badge can tell you even more…
Workload High & Anomalies Low & Stress High
• Workload – Object is Running Hot
• Workload – Potentially Starving for Resources
• Anomalies – Normal Behavior for this timeframe
• Stress – Object is often running under high Workload
• Add resources!!!
Workload High & Anomalies Low & Stress Low
• Workload – Object is Running Hot
• Workload – Potentially Starving for Resources
• Anomalies – Normal Behavior for this timeframe
• Stress – Object usually has enough resources
• Not likely a big problem…a cyclical workload spike?

32
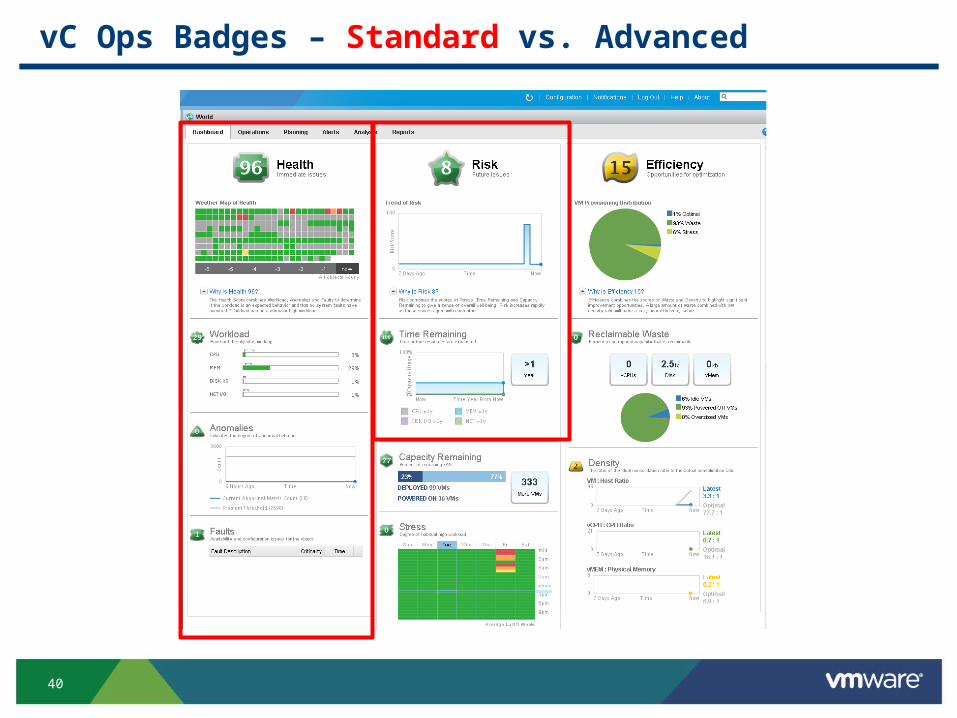
Capacity Planning: Major Badge – Efficiency
Are there optimization opportunities in my systems?
How to run a leaner datacenter
Save $$$ by better utilizing resources
High Efficiency is good (100-0)
Efficiency Score calculated from Minor Badges
• Reclaimable Waste
• Density
Graph Depicts VMs by Percent
• Optimal – Optimally Provisioned VMs
• Waste – Over Provisioned VMs
• Stress – Under Provisioned VMs• Not used in Efficiency Calculation (see Risk)
Three Resources Considered• CPU• Memory• Disk Space
Note: VMs can appear in Stress and Waste
33
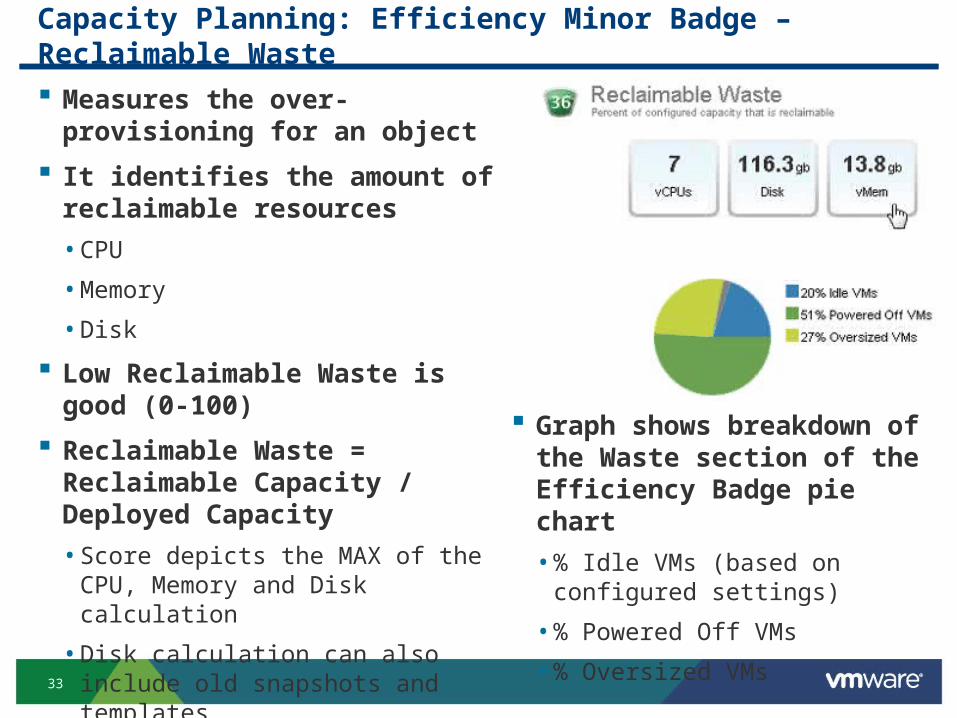
Capacity Planning: Efficiency Minor Badge – Reclaimable Waste
Measures the over-provisioning for an object
It identifies the amount of reclaimable resources
• CPU
• Memory
• Disk
Low Reclaimable Waste is good (0-100)
Reclaimable Waste = Reclaimable Capacity / Deployed Capacity
• Score depicts the MAX of the CPU, Memory and Disk calculation
• Disk calculation can also include old snapshots and templates
Graph shows breakdown of the Waste section of the Efficiency Badge pie chart
• % Idle VMs (based on configured settings)
• % Powered Off VMs
• % Oversized VMs
34
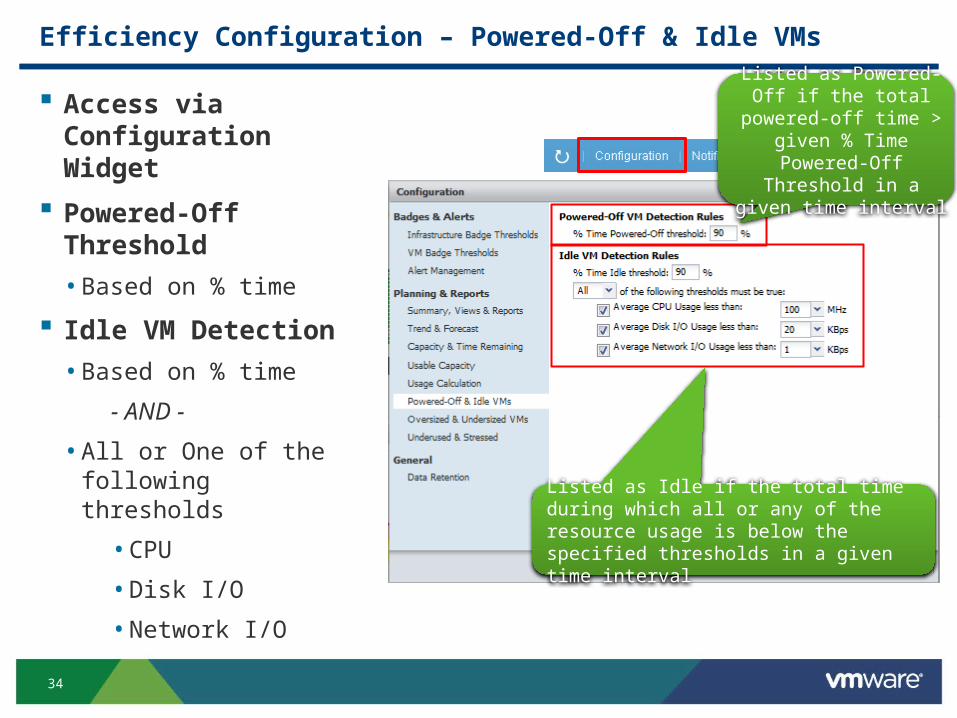
Efficiency Configuration – Powered-Off & Idle VMs
Access via Configuration Widget
Powered-Off Threshold
• Based on % time
Idle VM Detection
• Based on % time
- AND -
• All or One of the following thresholds
• CPU
• Disk I/O
• Network I/O
Listed as Powered-Off if the total powered-off time > given % Time Powered-Off Threshold in a given
time interval
Listed as Idle if the total time during which all or any of the resource usage is below the specified thresholds in a given time interval
35
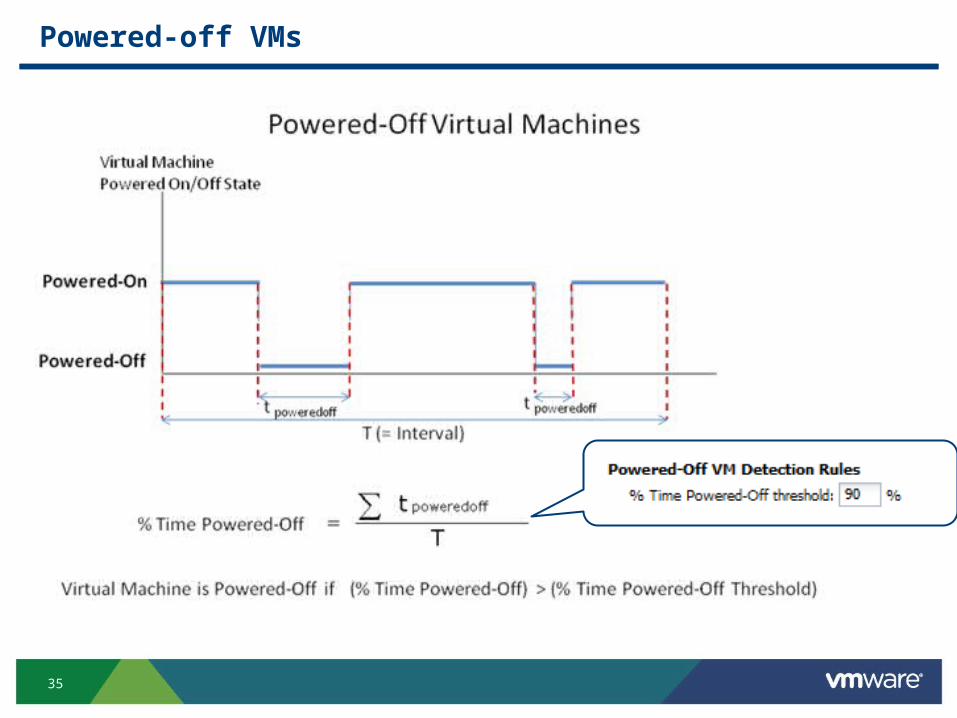
Powered-off VMs

36
Idle Virtual Machines

37
Efficiency Configuration – Oversized VMs
Access via Configuration Widget
Oversized Detection
• CPU and/or Memory Workload
Oversized Threshold
• What percentage of Oversized is acceptable
• When should an object be reported
An Object is oversized if its degree oversized is greater than
the % Oversized threshold
For the given time interval, CapacityIQ first calculates if a physical resource (viz. CPU,
Memory) is over-sized based on the configurable Utilization Less Than
threshold.

38
Oversized VMs - Calculation
• % Oversized Threshold = Area in Blue/ Area of Grey Box
• Higher the ratio (i.e. more blue), higher the over-sizing

39
Capacity Planning: Efficiency Minor Badge – Density
Contrasts Actual vs. Ideal Density
Identify Optimal Resource Deployment Before Contention Occurs
Greater Consolidation $$$
High Density is good (100-0)
Measures consolidation ratios:
• VMs/Host Ratios
• vCPU/Physical CPU Ratios
• vMem/Physical Memory Ratios
40
vC Ops Badges – Standard vs. Advanced

41
vC Ops Default UI – Badge Thresholds
Adjust levels to user defined settings
Access via Configuration Widget
Set Infrastructure and VM thresholds separately
• Capacity problems for a Host requires more “warning” than a VM
Disable Color Threshold by Clicking the Level Off

43
Operations Tab

44
Operations: Environment
Updates to the 1.0 Skittles View
Operations Badges
Relationship to the
Datastore
Left Pane Navigation
Drives Focus(e.g. Datastore)
New World Object
Multi vCenter Support
46
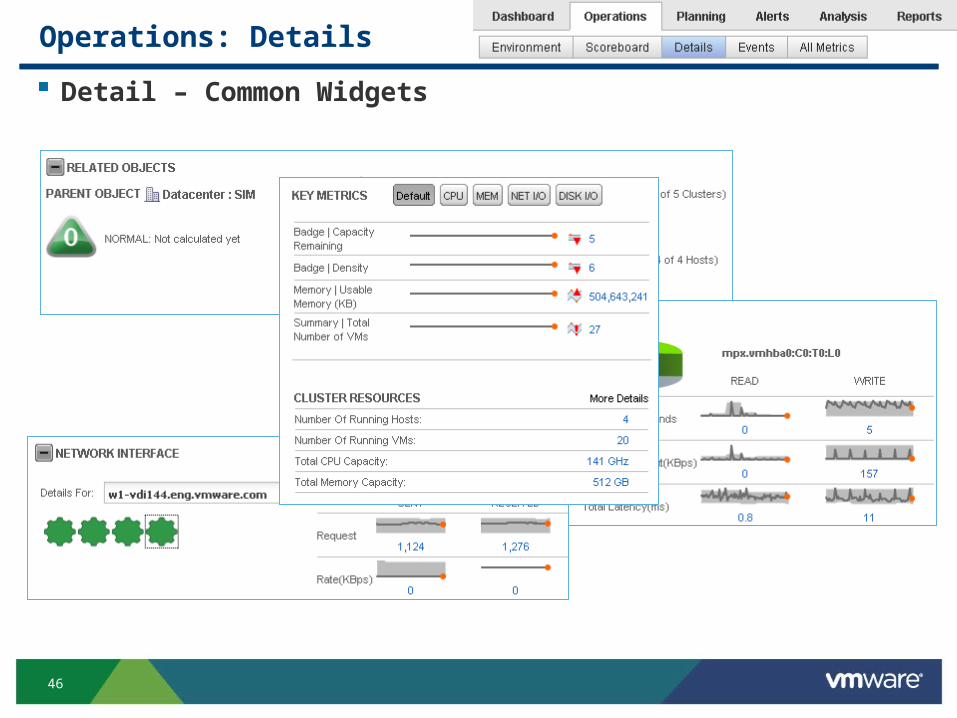
Operations: Details
Detail – Common Widgets
Easier Navigation via
Dropdown

47
Operations: Details
Health Badge Focus
Overview of the 3 Minor Health
Badges
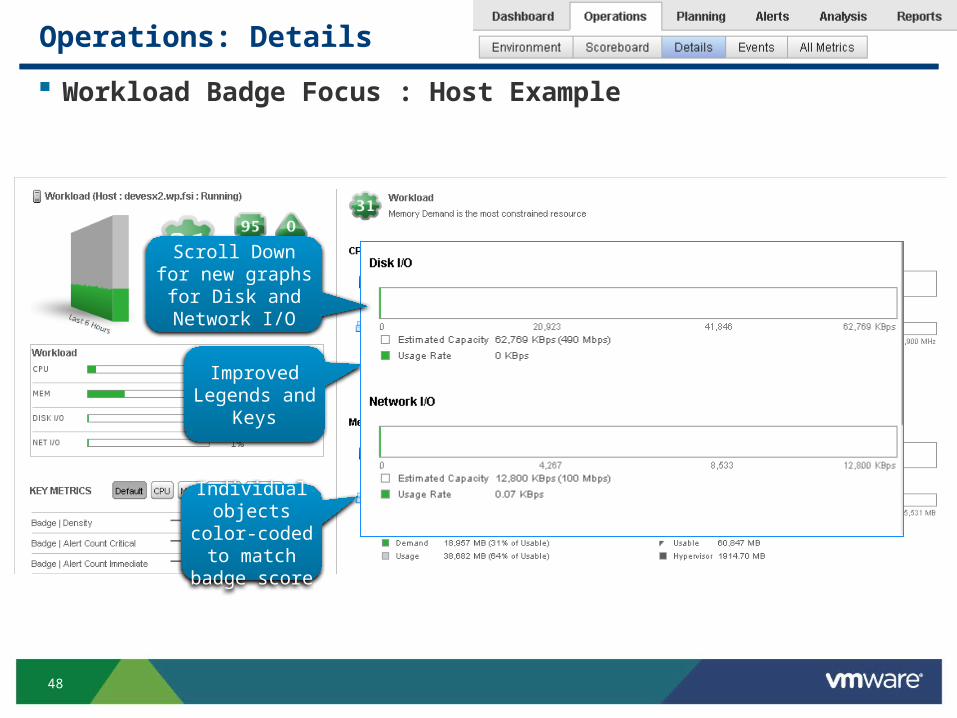
48
Operations: Details
Workload Badge Focus : Host Example
Improved Legends and
Keys
Scroll Down for new graphs for Disk and
Network I/O
Individual objects color-
coded to match badge score

49
Operations: Details
Workload Badge Focus : VM Example
Reserved, Limits and Entitlement Highlighted
on Graphs

50
Operations: Details
Workload Badge Focus : Datastore Example
Space Available
Throughput
IOPS
Latency

51
Operations: Details
Anomalies Badge FocusSubset of the
Anomalies for an object
Help with any troubleshooting
efforts
Visualize magnitude and
impact
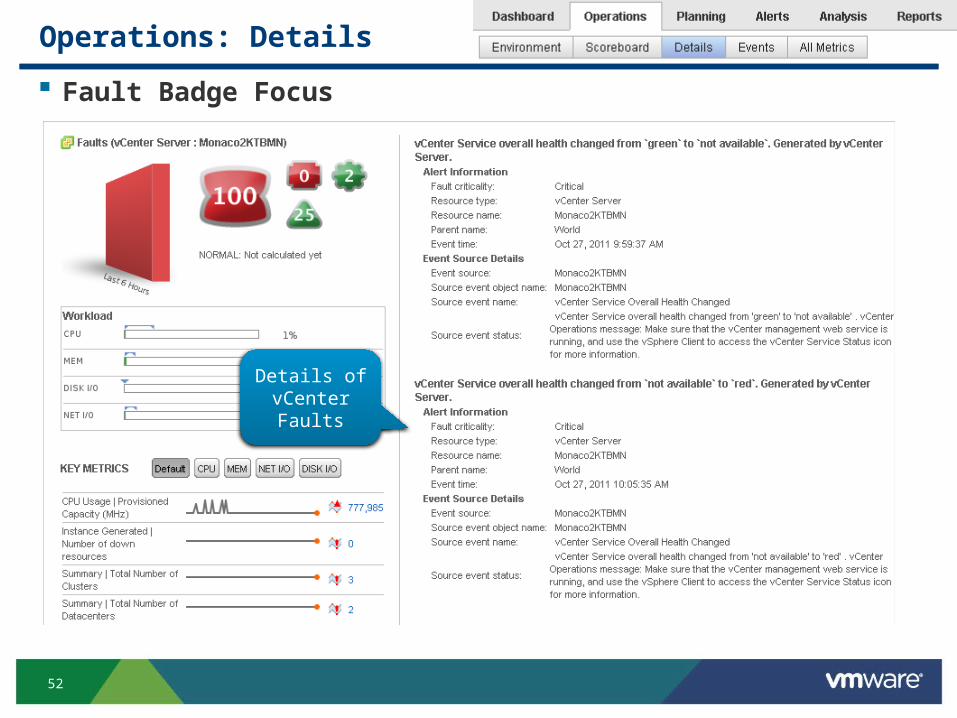
52
Operations: Details
Fault Badge Focus
Details of vCenter Faults

53
Operations: Events
Updates to the 1.0 Events View
Choose Badge
For which objects should I show Alerts and Events?
Overlay Badge Alerts
Overlay ChangeEvents
Health ScoreLine

54
Operations: All Metrics
New Metrics Available
Badge Metrics
Capacity Planning Metrics

55
Planning Tab
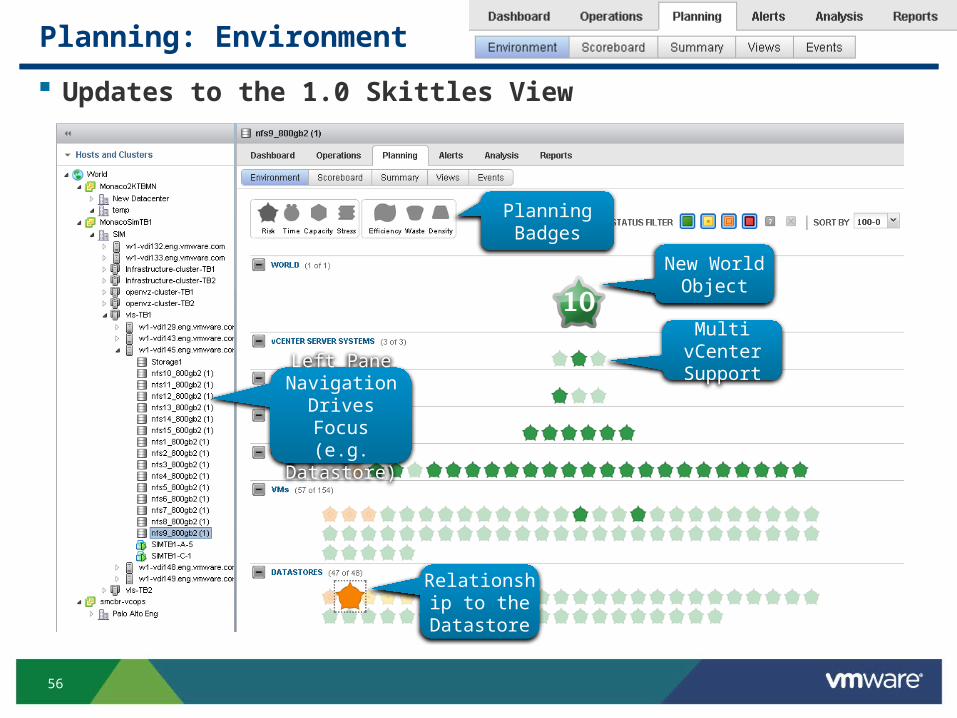
56
Planning: Environment
Updates to the 1.0 Skittles View
Planning Badges
Relationship to the
Datastore
Left Pane Navigation
Drives Focus(e.g. Datastore)
New World Object
Multi vCenter Support

58
Planning: Summary
“Classic CapIQ” Dashboard rolled up under Summary tab
• Summary view context sensitive to object selected
Network I/O trending and forecasting
• Usable Capacity supports Network I/O
What-if Modeling allows CPU & Memory Reservations and Limits configuration

59
Planning: Views
Reports Organized by “Badge”
• 5 different categories – one for each minor badge under Risk and Efficiency
New List Reports
• VM List
• Datastores List
• Datastores Waste List
Views associated with Datastores

64
Configuration Widget: Planning & Reports – Usage Calculation
By default, CapacityIQ calculates capacity usage based all 24 hours of data every day
Use specific hours and days to match business week workload, and not skew data
with off-peak usage

65
Alerts Tab

66
Smart Alerts – Overview
New Alerting Functionality
Smarts Alerts Available in EACH vC Ops Suite edition
Different Types of Smart Alerts
• Custom UI Alerts
• Can show vSphere UI Badge Alerts
• Alerts driven by
• Problem/Noise Threshold Anomaly Breaches
• KPI Threshold Breaches
• Very useful for groups of objects (e.g. Application Monitoring)
• vSphere UI Badge Alerts
• Threshold Based
• Driven by Badge Color Change Thresholds
• Only Alert on Minor Badges
• Workload YES – Health NO
• Good for Alerts on single objects (e.g. VM)

67
Smart Alerts - Configuration
Enable/Disable Alerts by Specific Badge Definitions
Create alerts on vCenter faults
• Subset of events from vCenter are considered faults
• VMware best practices and knowledge
Enable Infrastructure and VM Alert separately
Access via Configuration Widget
• Disable threshold level to disable the alert
• Turn off “Workload Orange” – No Alert

70
Smart Alerts – Usability
Filter to view specific Badges
Filter on column values
Add and Remove columns
Search for specific alerts
71
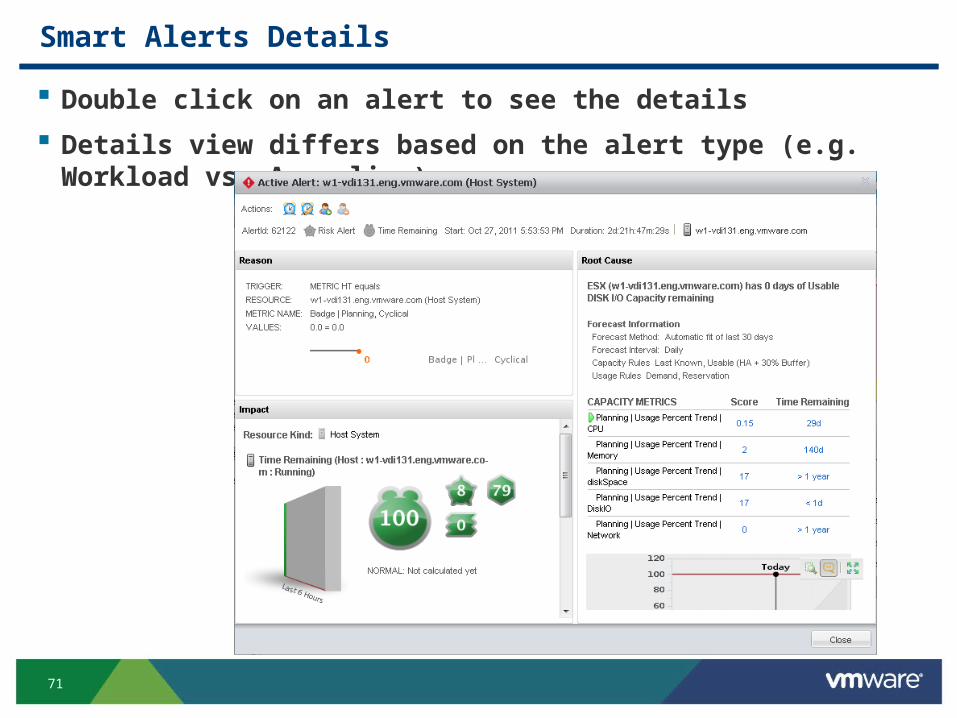
Smart Alerts Details
Double click on an alert to see the details
Details view differs based on the alert type (e.g. Workload vs. Anomalies)

72
Smart Alerts – External Notification Configuration
Configure via the Administration UI
SNMP Notifications
• All alerts are streamed to the source
• Filtering must occur on the Destination System
SMTP Notifications
• Create Email Rules for filtering

73
Smart Alerts – Email Notification Rules
Configure via the Notification Widget
Create Email Rules via Notification Widget
Configure
• Email address
• Alert Types
• Criticality Levels
• Object
• Children

74
Analysis Tab

75
Analysis – Heatmaps
Heatmaps like in vC Ops Std 1.0
We now have the Capacity badges and metrics available in the heatmaps
Examples:
• Which Clusters are Healthy and have available Capacity?
• Which hosts have a Low Workload and a low Density?

76
Reports Tab
77
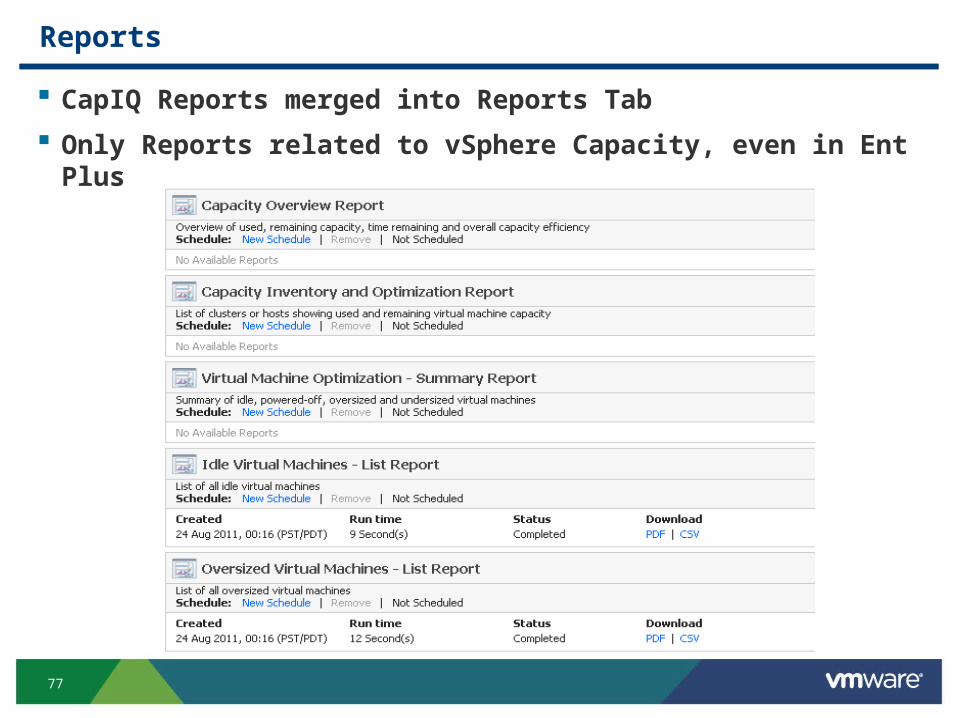
Reports
CapIQ Reports merged into Reports Tab
Only Reports related to vSphere Capacity, even in Ent Plus

78
Schedule and Publish Report
Per-User Scheduling
Publish via email

79
Reports Settings

80
vCM vC Ops Integration

81
vCM vC Ops : Change Events Correlated with Performance
Overview Integration between vCM and vC
Ops Mgr for change events Overlay Guest OS configuration
changes from vCM in vC Ops
performance trend graphs Launch in context into vCM to see
full details of changes and
potentially remediate them
Benefits Enable Operations to quickly understand and resolve performance issues arising from
configuration changes (reduce MTTR) Drive efficient & effective troubleshooting by correlating Guest OS configuration changes
w/ VM performance degradations

82
vCM Events in vC Ops – Event Collected
vC Ops does not pull in every event from vCenter
• Only events that could affect health or workload (vSphere Knowledge!)
Adapter only pulls in change events for Guest OSs
• No ESX/i Host configurations changes (these come from vCenter Adapter)
• Guest OS has to be by managed by vCM
Event Collected
Reboot
Software Install/Uninstall
Windows Registry
IP/Networking changes
Device Driver changes
Memory/CPU changes
Windows Firewall
Patches

83
vCM Change Events Correlated with Performance
Launches to the Master Change Log view in vCM for the change in question Rollback the change (if possible)

85
Packaging and Licensing
Back

86
vCenter Operations Management Suite Packaging
Standard Edition Enterprise Plus Edition
VC Ops Mgr 5.0 – Std. VC Ops Mgr 5.0(incl. CapIQ)
VC Infra Navigator **
VC Configuration Mgr
** Not Available a-la-carte.
Chargeback Mgr
Advanced Edition
VC Ops Mgr 5.0(incl. CapIQ)
For hybrid cloud and heterogeneous environments
For larger vSphere
environments
Automated Operations Management
For smaller vSphere
environments
Enterprise Edition
VC Ops Mgr 5.0 (incl. CapIQ)
VC Infra Navigator **
VCM for vSphere **
Chargeback Mgr
For virtual and cloud infrastructure
New SKU New Name
87 Confidential
Thank YouThank You