Wholesale Banking and Consumer Banking Day 2012€¦ · Wholesale Banking and Consumer Banking Day...
48
Wholesale Banking and Consumer Banking Day 2012 1
Transcript of Wholesale Banking and Consumer Banking Day 2012€¦ · Wholesale Banking and Consumer Banking Day...
Wholesale Banking and
Consumer Banking Day
2012
1
Leading the way in Asia, Africa and the Middle East
Steve Bertamini
Group Executive Director and CEO,
Consumer Banking
2

Key messages
Consumer Banking transformation on track
Strong balance sheet and diversified growth
Macro trends support long term opportunities
Continuing to invest for long term growth
3
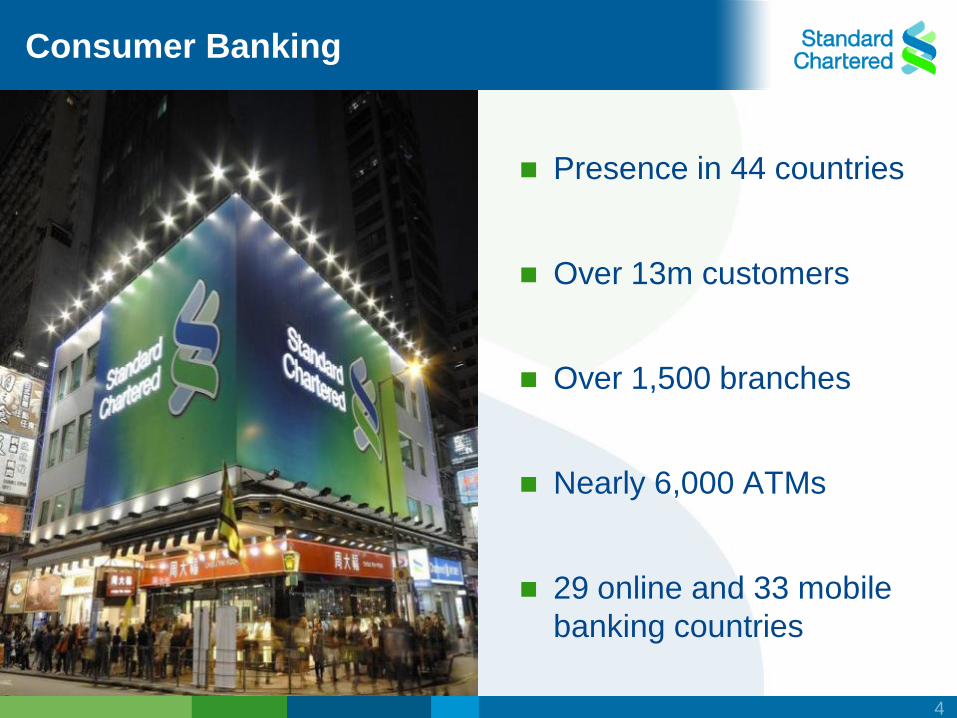
Consumer Banking
Presence in 44 countries
Over 13m customers
Over 1,500 branches
Nearly 6,000 ATMs
29 online and 33 mobile
banking countries
4
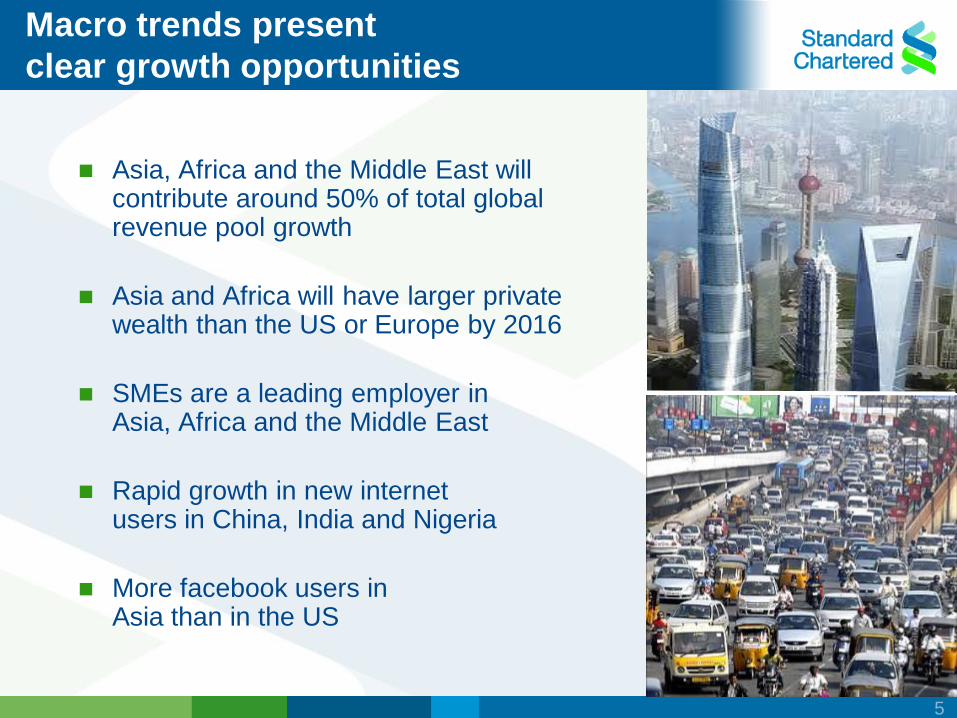
Macro trends present
clear growth opportunities
Asia, Africa and the Middle East will contribute around 50% of total global revenue pool growth
Asia and Africa will have larger private wealth than the US or Europe by 2016
SMEs are a leading employer in Asia, Africa and the Middle East
Rapid growth in new internet users in China, India and Nigeria
More facebook users in Asia than in the US
5
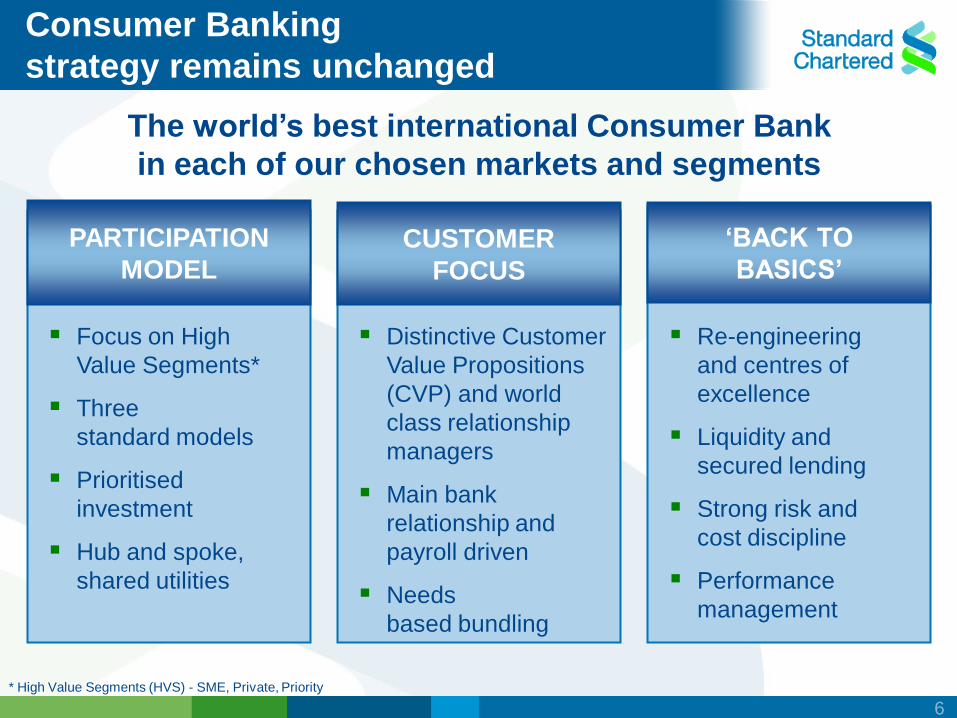
The world‟s best international Consumer Bank
in each of our chosen markets and segments
* High Value Segments (HVS) - SME, Private, Priority
CUSTOMER
FOCUS
Distinctive Customer
Value Propositions
(CVP) and world
class relationship
managers
Main bank
relationship and
payroll driven
Needs
based bundling
„BACK TO
BASICS‟
Re-engineering
and centres of
excellence
Liquidity and
secured lending
Strong risk and
cost discipline
Performance
management
PARTICIPATION
MODEL
Focus on High
Value Segments*
Three
standard models
Prioritised
investment
Hub and spoke,
shared utilities
Consumer Banking
strategy remains unchanged
6
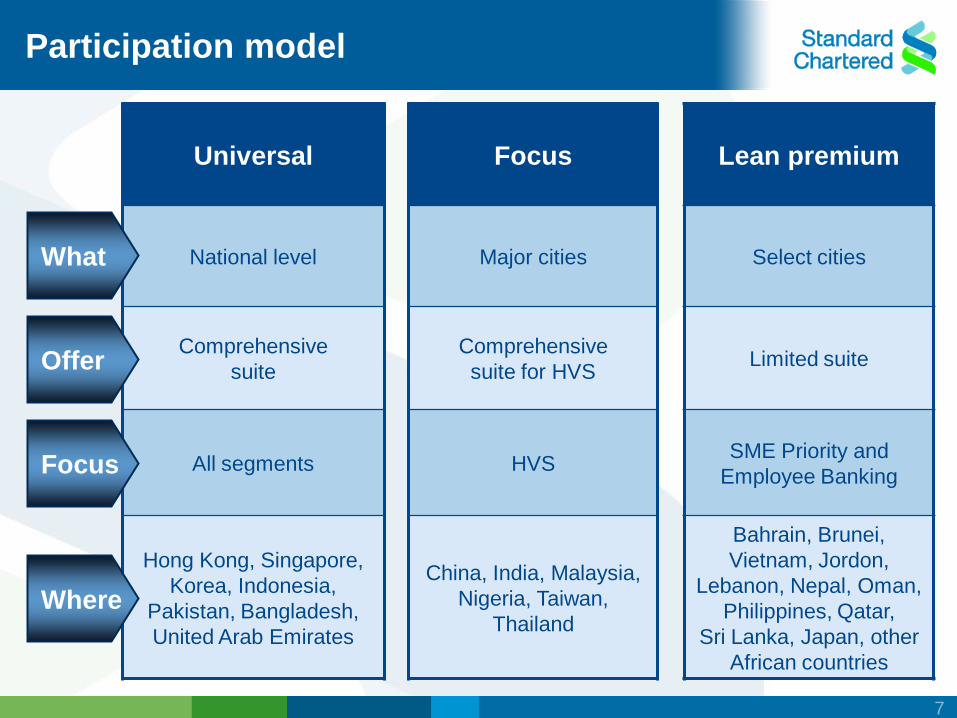
Universal Focus Lean premium
National level Major cities Select cities
Comprehensive
suite
Comprehensive
suite for HVS Limited suite
All segments HVS SME Priority and
Employee Banking
Hong Kong, Singapore,
Korea, Indonesia,
Pakistan, Bangladesh,
United Arab Emirates
China, India, Malaysia,
Nigeria, Taiwan,
Thailand
Bahrain, Brunei,
Vietnam, Jordon,
Lebanon, Nepal, Oman,
Philippines, Qatar,
Sri Lanka, Japan, other
African countries
Participation model
What
Offer
Focus
Where
7
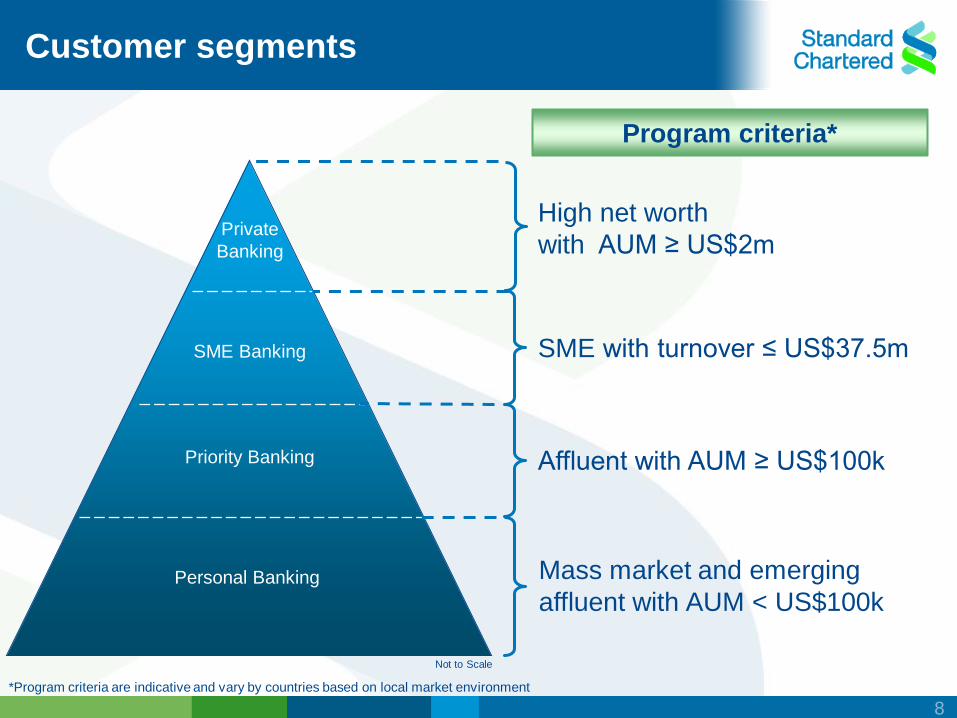
*Program criteria are indicative and vary by countries based on local market environment
SME with turnover ≤ US$37.5m
Affluent with AUM ≥ US$100k
Program criteria*
Mass market and emerging
affluent with AUM < US$100k
Not to Scale
SME Banking
Priority Banking
Personal Banking
Private
Banking
High net worth
with AUM ≥ US$2m
Customer segments
8
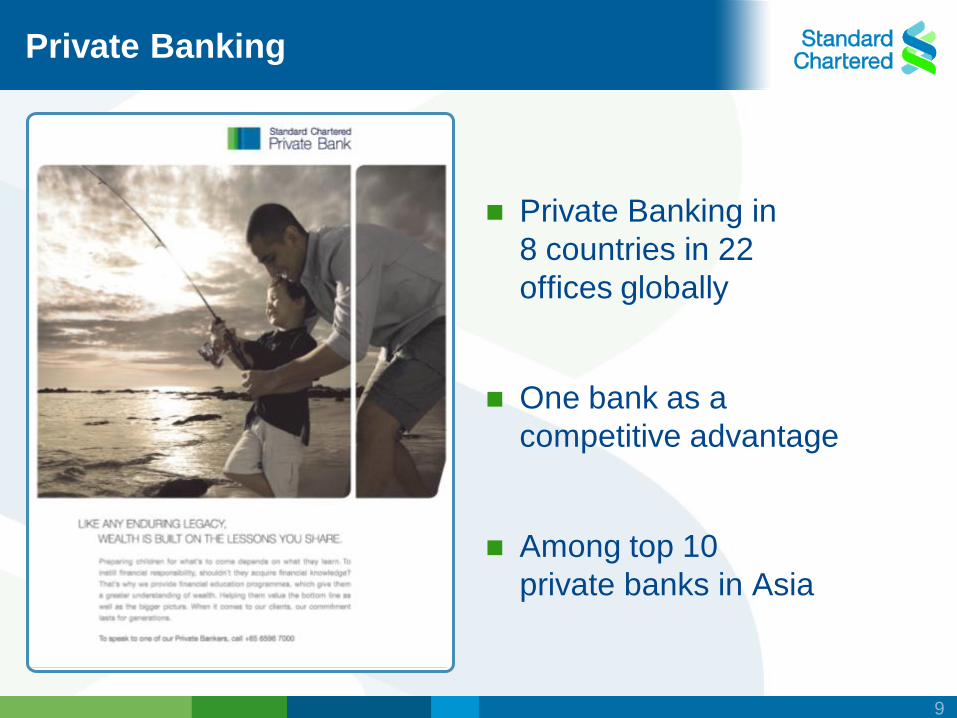
Private Banking
Private Banking in
8 countries in 22
offices globally
One bank as a
competitive advantage
Among top 10
private banks in Asia
9
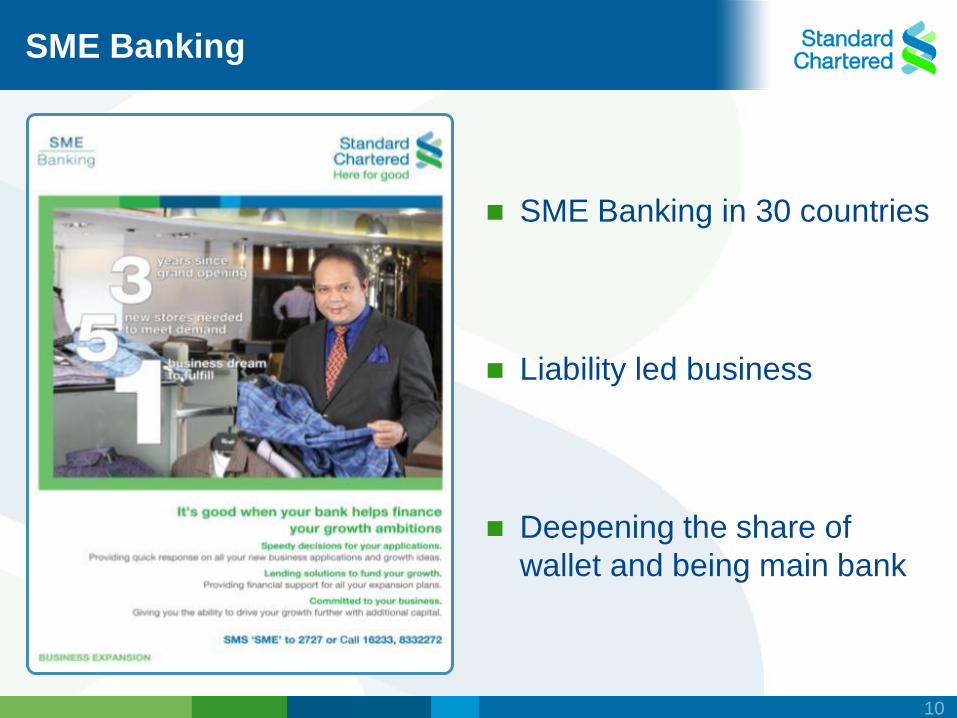
SME Banking
SME Banking in 30 countries
Liability led business
Deepening the share of
wallet and being main bank
10
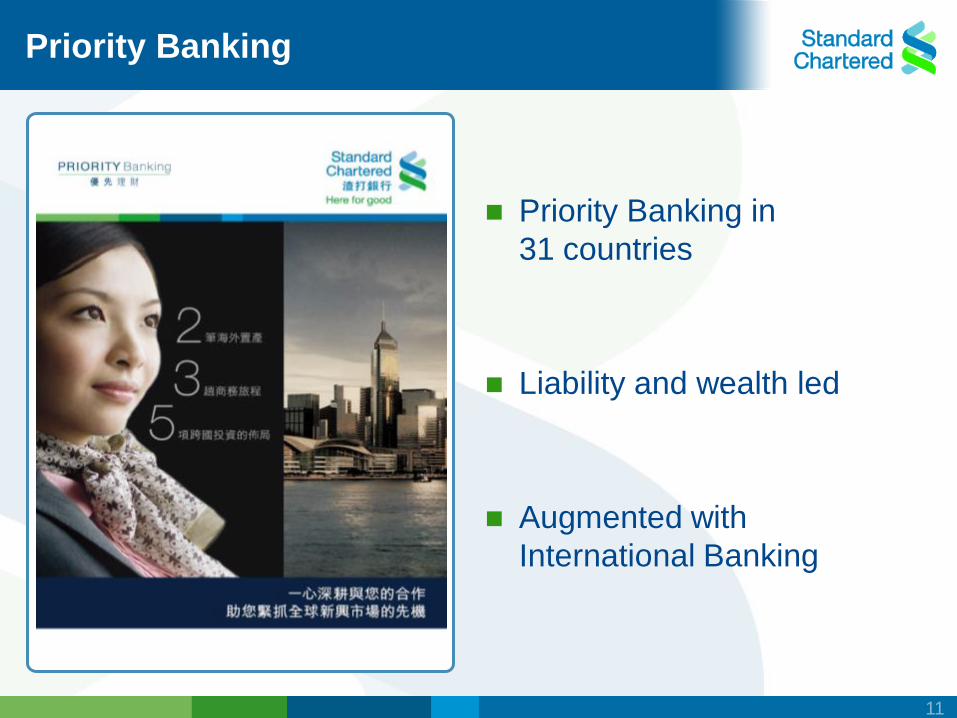
Priority Banking
Priority Banking in
31 countries
Liability and wealth led
Augmented with
International Banking
11
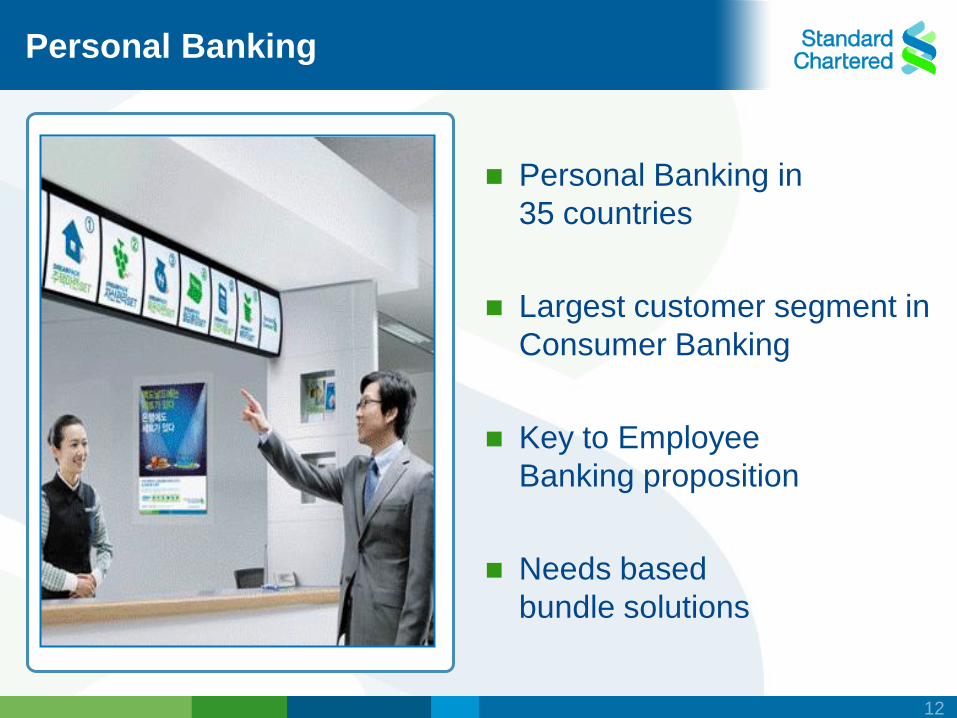
Personal Banking
Personal Banking in
35 countries
Largest customer segment in
Consumer Banking
Key to Employee
Banking proposition
Needs based
bundle solutions
12
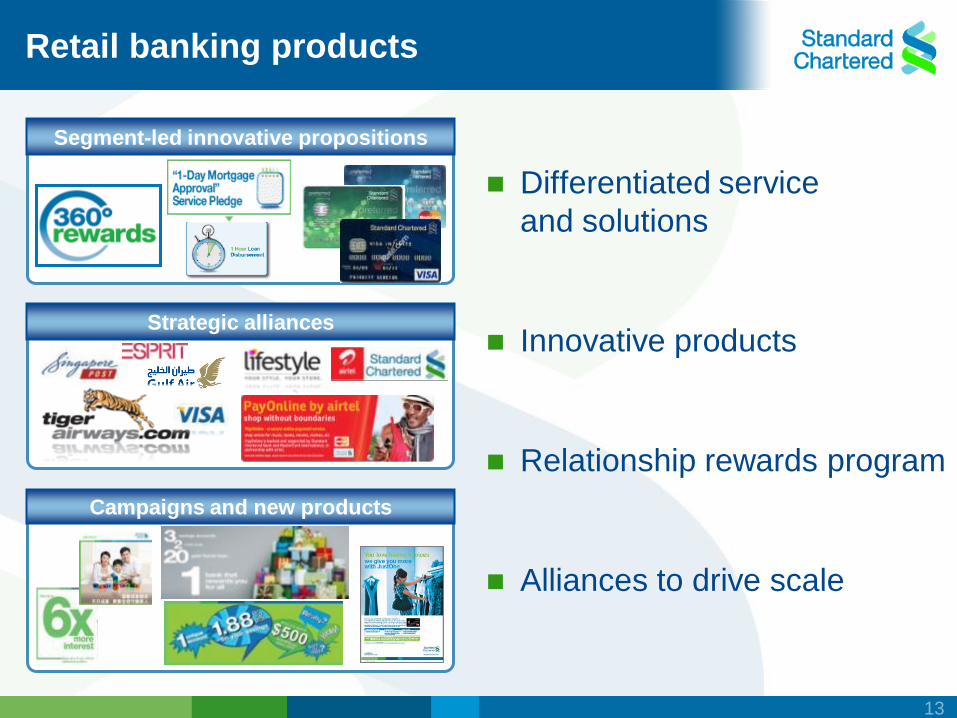
Retail banking products
Differentiated service
and solutions
Innovative products
Relationship rewards program
Alliances to drive scale
Segment-led innovative propositions
Campaigns and new products
Strategic alliances
13
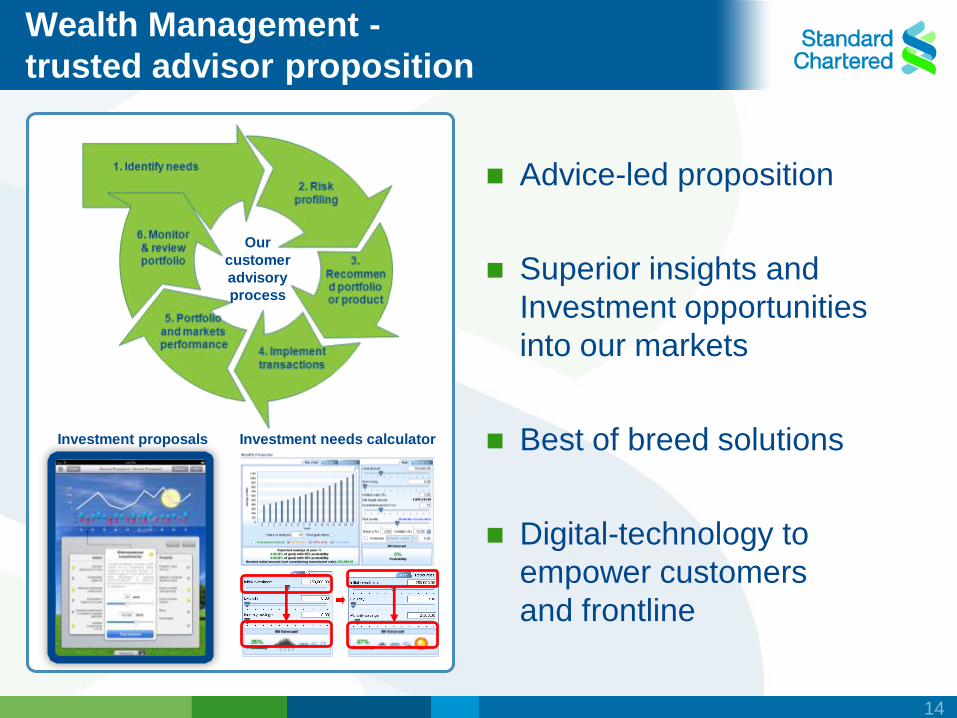
Wealth Management -
trusted advisor proposition
Advice-led proposition
Superior insights and
Investment opportunities
into our markets
Best of breed solutions
Digital-technology to
empower customers
and frontline
Investment needs calculator Investment proposals
Our
customer
advisory
process
14
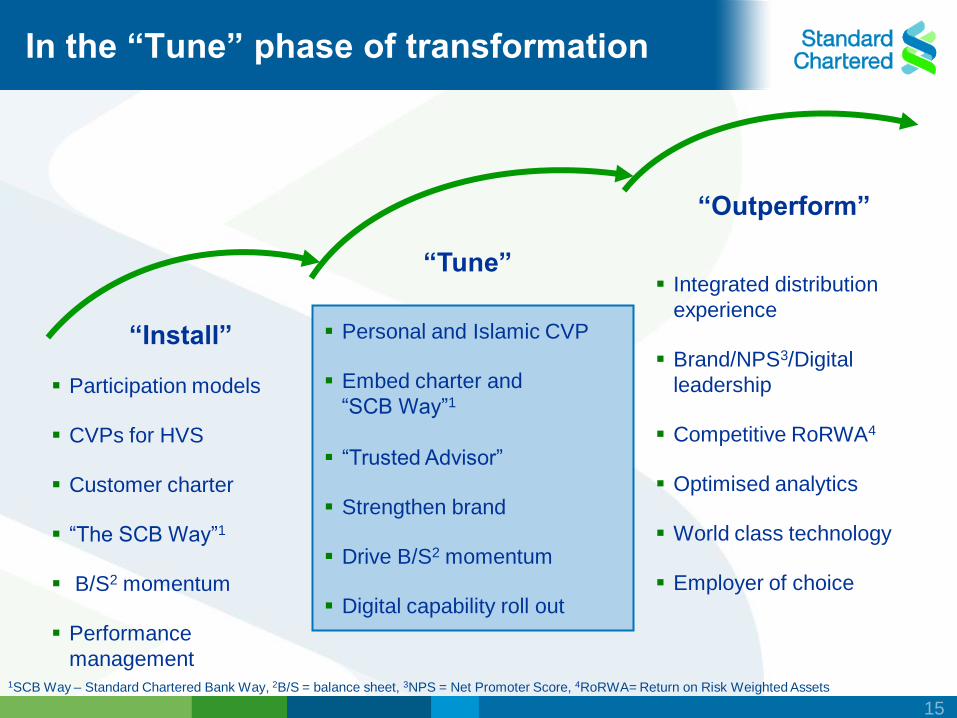
“Tune”
“Outperform”
“Install”
Participation models
CVPs for HVS
Customer charter
“The SCB Way”1
B/S2 momentum
Performance
management
Personal and Islamic CVP
Embed charter and
“SCB Way”1
“Trusted Advisor”
Strengthen brand
Drive B/S2 momentum
Digital capability roll out
Integrated distribution
experience
Brand/NPS3/Digital
leadership
Competitive RoRWA4
Optimised analytics
World class technology
Employer of choice
In the “Tune” phase of transformation
1SCB Way – Standard Chartered Bank Way, 2B/S = balance sheet, 3NPS = Net Promoter Score, 4RoRWA= Return on Risk Weighted Assets
15
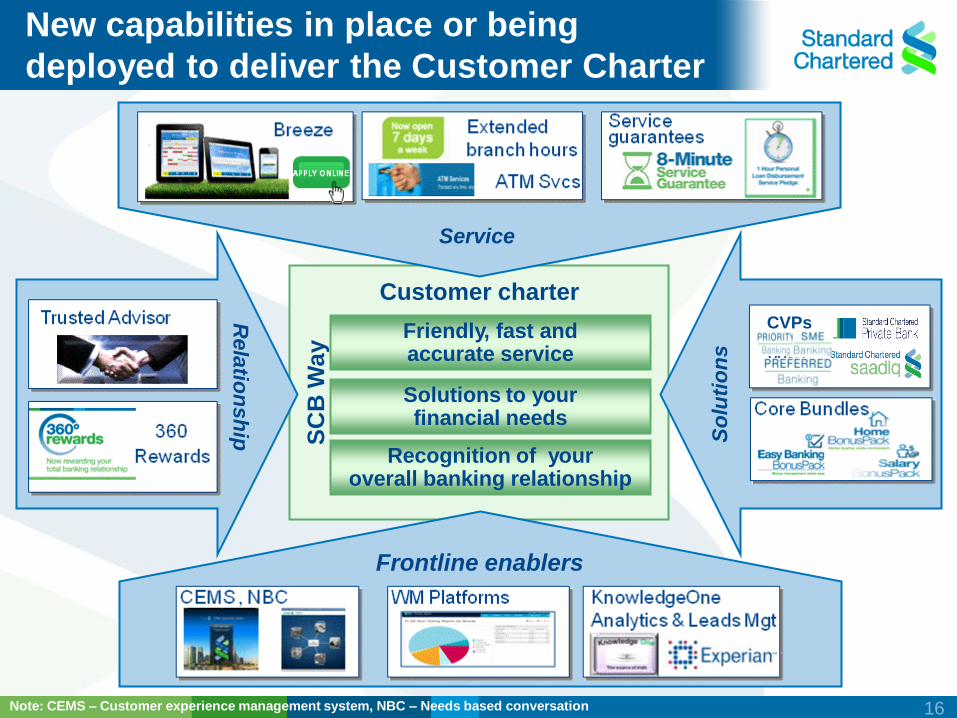
Friendly, fast and accurate service
Solutions to your financial needs
Recognition of your overall banking relationship
Customer charter S
CB
Wa
y
Frontline enablers
Rela
tion
sh
ip
So
luti
on
s
Service
CVPs
New capabilities in place or being
deployed to deliver the Customer Charter
Note: CEMS – Customer experience management system, NBC – Needs based conversation 16
Performance metrics
Financials
Risk and portfolio
Product and segment
Process and sales productivity
Customer and service level
17
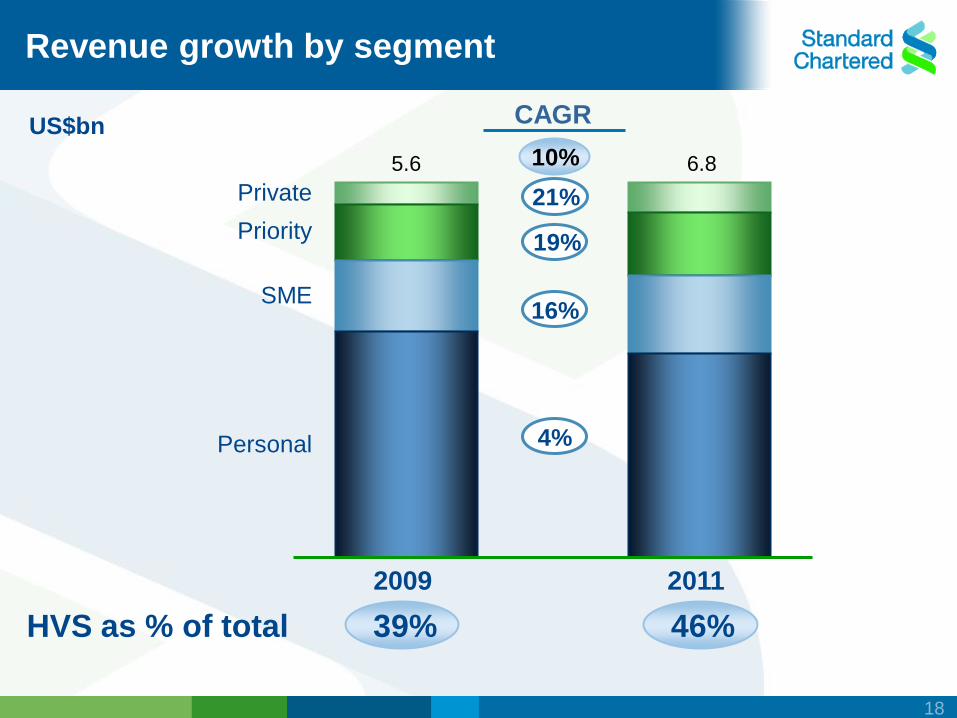
4%
16%
19%
21%
5.6 6.8
Revenue growth by segment
US$bn
Private
Priority
SME
Personal
CAGR
HVS as % of total
2009 2011
46%
10%
39%
18
2010 2009 2008
2009 2008 2010 2010 2009 2008
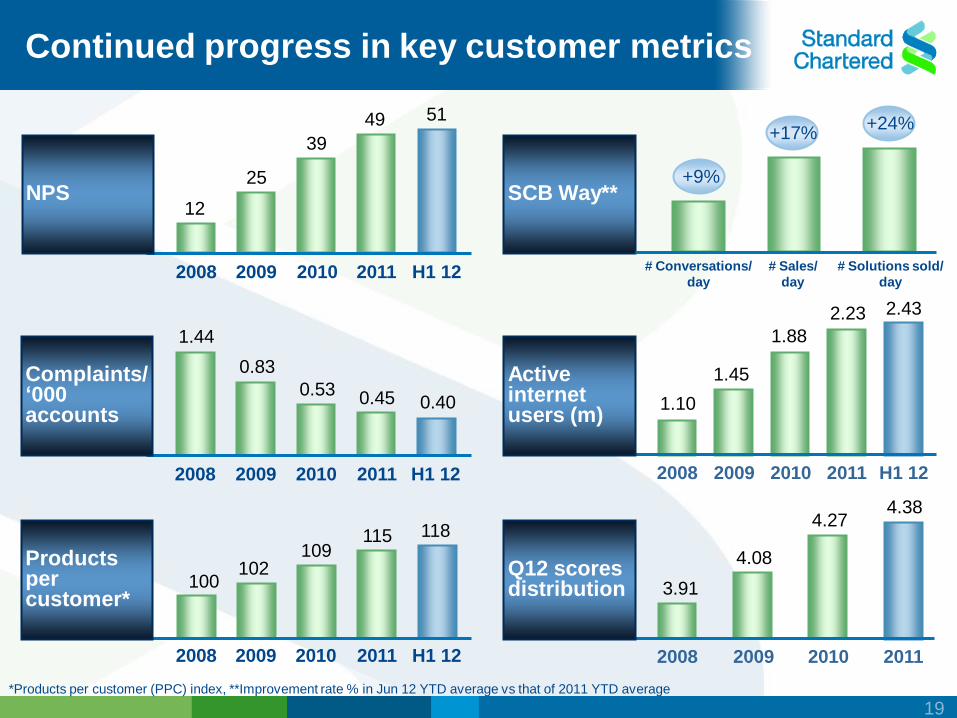
0.83
0.53
1.44
1.10
1.88
1.45
4.08
3.91
4.27
0.45
2011
2.23
2011
Complaints/ „000 accounts
Active internet users (m)
Q12 scores distribution
2011
4.38
0.40
H1 12
2.43
H1 12
# Conversations/
day
# Solutions sold/
day
# Sales/
day
SCB Way**
*Products per customer (PPC) index, **Improvement rate % in Jun 12 YTD average vs that of 2011 YTD average
100 102
109 115 118
2010 2009 2008 2011 H1 12
Continued progress in key customer metrics
12
25
39
49 51
2008 2009 2010 2011 H1 12
+9%
+17% +24%
Products per customer*
NPS
19
Awards in 2012
Asian Banker Summit, 2012
Best Customer Relationship Mgmt
Best SaaS (software as a service) pgm
Citywealth Magic Circle Awards, 2012
Asian Advisor/Manager of the Year
Capital Outstanding
Enterprise Awards
Best Performing Bank
Foreign, 2012
The Asian Banker
Excellence in Retail
Financial Services Awards
CNBC Financial Advisor
Awards, 2012
CNBC Financial Advisor
Awards for WM expertise
(India)
Banker M.E. Product
Awards, 2012
Best SME Internet Bkg
Best SME Foreign
Exchange Service
Retail Banker International Awards, 2012
Best Retail Bank (Global)
Best Online Banking Strategy
Bkg & Pmts Asia Trailblazer Awards, 2012
Process Excellence in Account Opening
Global Finance Best Internet Banking
2012 Awards.
Best Consumer Internet Bank in
Singapore, Vietnam, Pakistan, UAE,
Bahrain and Zambia.
Gartner CRM
Excellence Awards
Best Customer Experience
Excellence Award
20
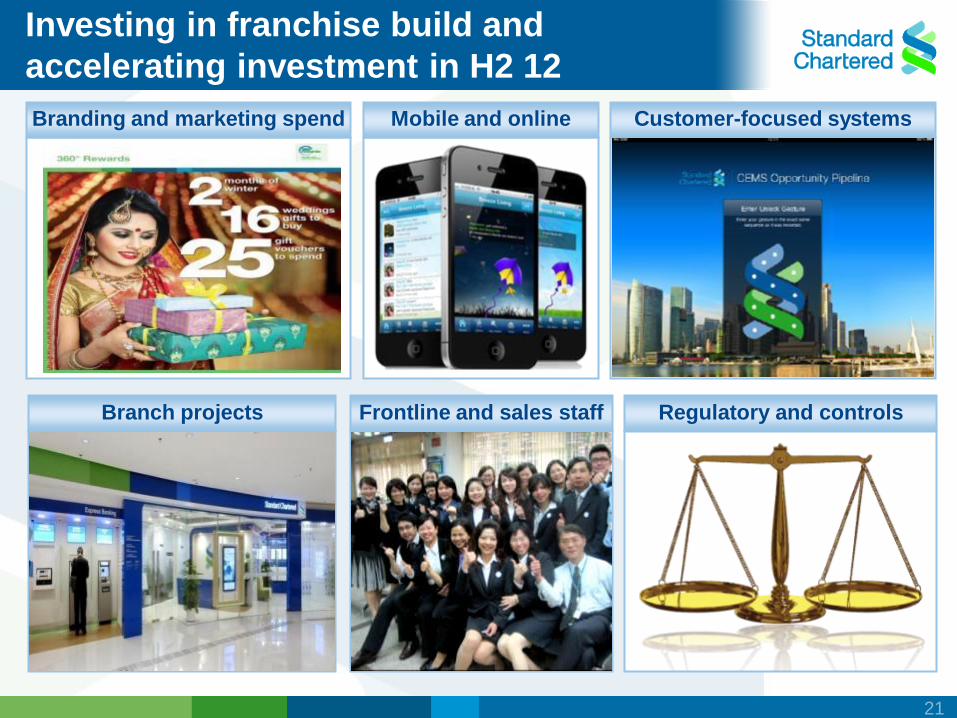
Frontline and sales staff Regulatory and controls Branch projects
Mobile and online Customer-focused systems Branding and marketing spend
Investing in franchise build and
accelerating investment in H2 12
21
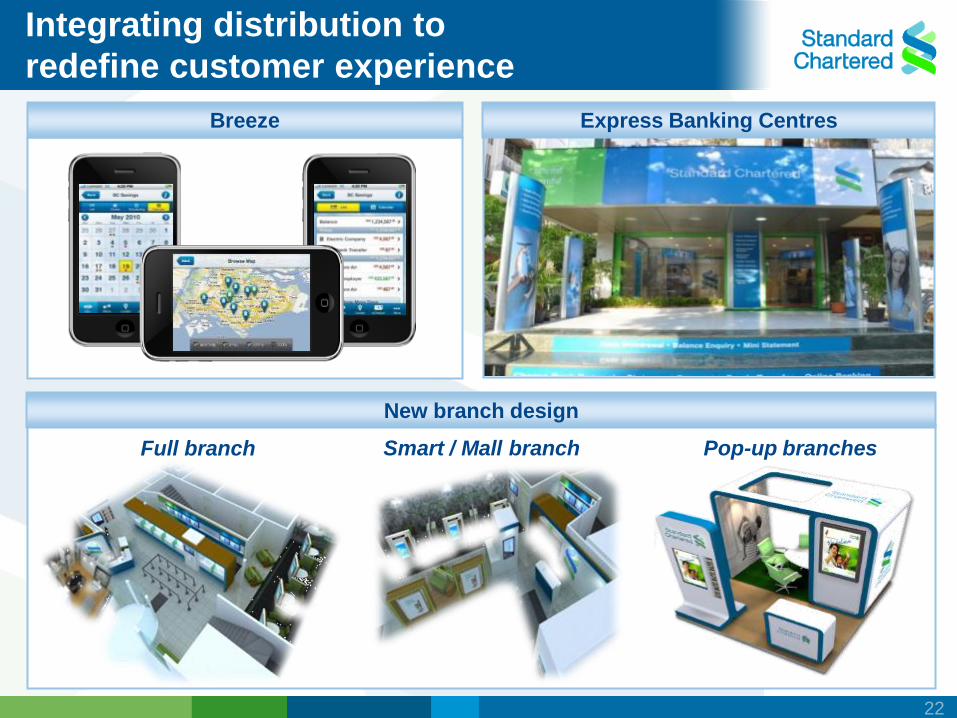
New branch design
Integrating distribution to
redefine customer experience
Full branch Smart / Mall branch Pop-up branches
Express Banking Centres Breeze
22
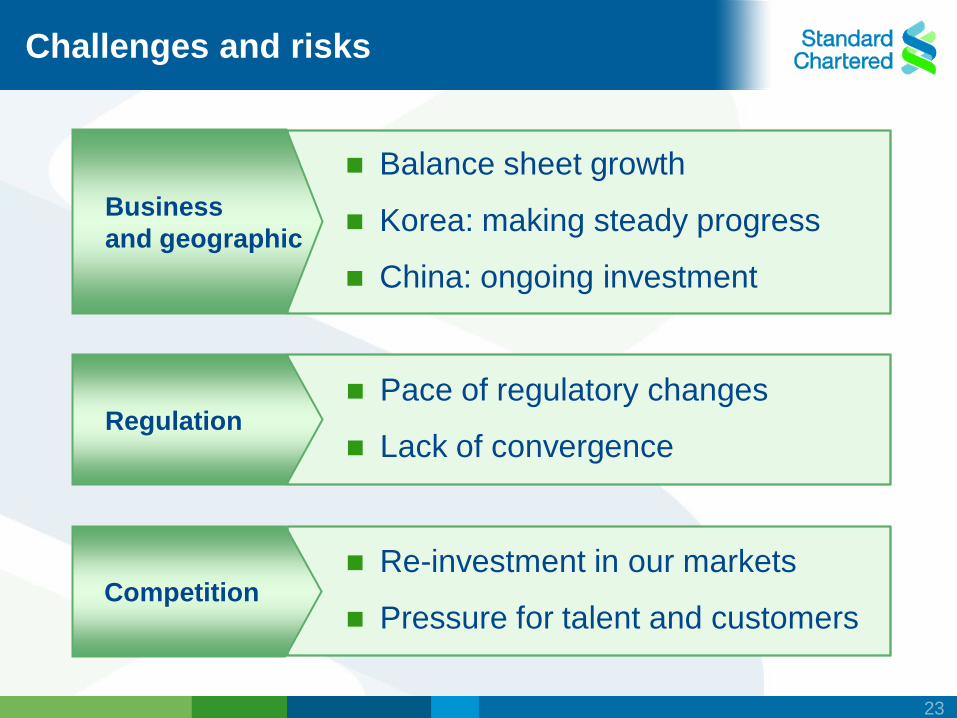
Balance sheet growth
Korea: making steady progress
China: ongoing investment
Pace of regulatory changes
Lack of convergence
Re-investment in our markets
Pressure for talent and customers
Challenges and risks
Business
and geographic
Regulation
Competition
23

Incremental growth opportunities
Become digital main bank
Scale up Hong Kong and Singapore
Build strategic alliances
Accelerate Africa buildup
Focus on SME and Wealth Management
24
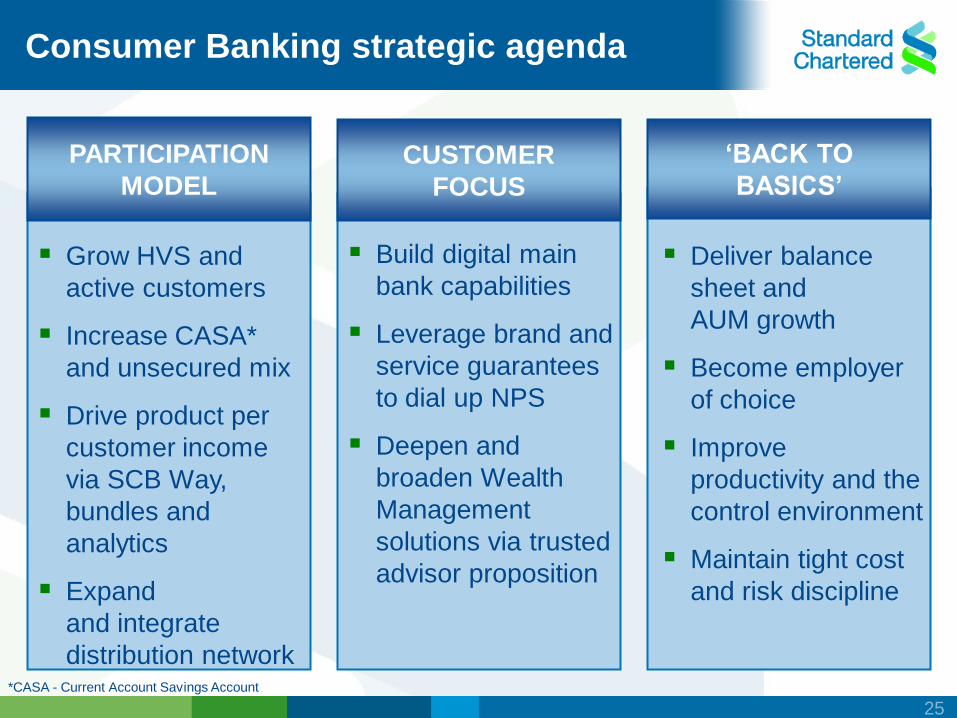
Consumer Banking strategic agenda
CUSTOMER
FOCUS
Build digital main
bank capabilities
Leverage brand and
service guarantees
to dial up NPS
Deepen and
broaden Wealth
Management
solutions via trusted
advisor proposition
„BACK TO
BASICS‟
Deliver balance
sheet and
AUM growth
Become employer
of choice
Improve
productivity and the
control environment
Maintain tight cost
and risk discipline
PARTICIPATION
MODEL
Grow HVS and
active customers
Increase CASA*
and unsecured mix
Drive product per
customer income
via SCB Way,
bundles and
analytics
Expand
and integrate
distribution network *CASA - Current Account Savings Account
25
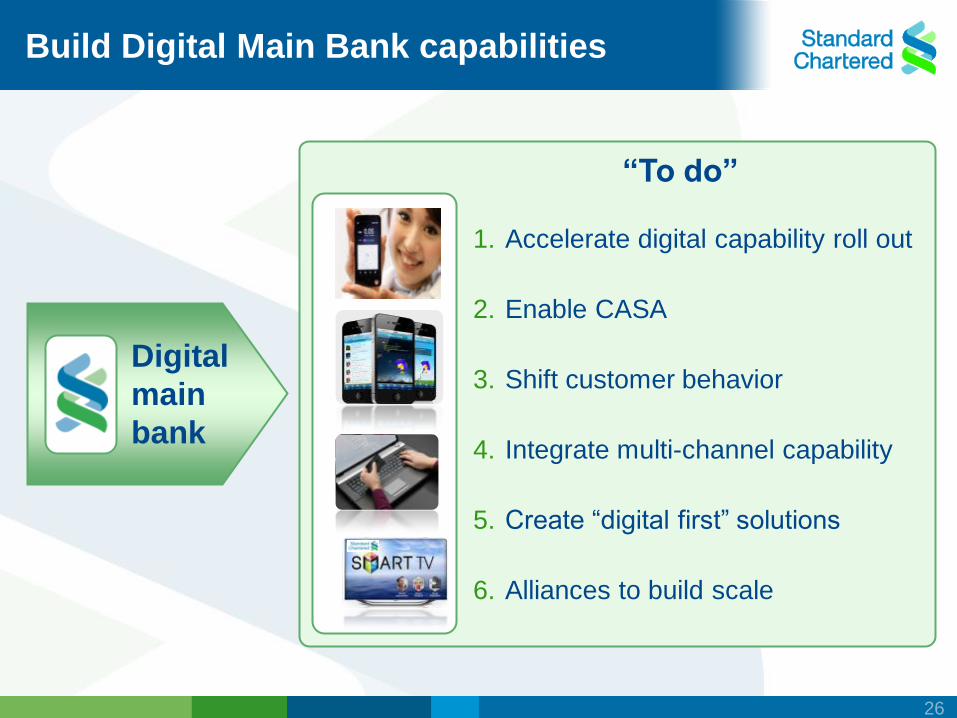
Digital
main
bank
“To do”
1. Accelerate digital capability roll out
2. Enable CASA
3. Shift customer behavior
4. Integrate multi-channel capability
5. Create “digital first” solutions
6. Alliances to build scale
Build Digital Main Bank capabilities
26
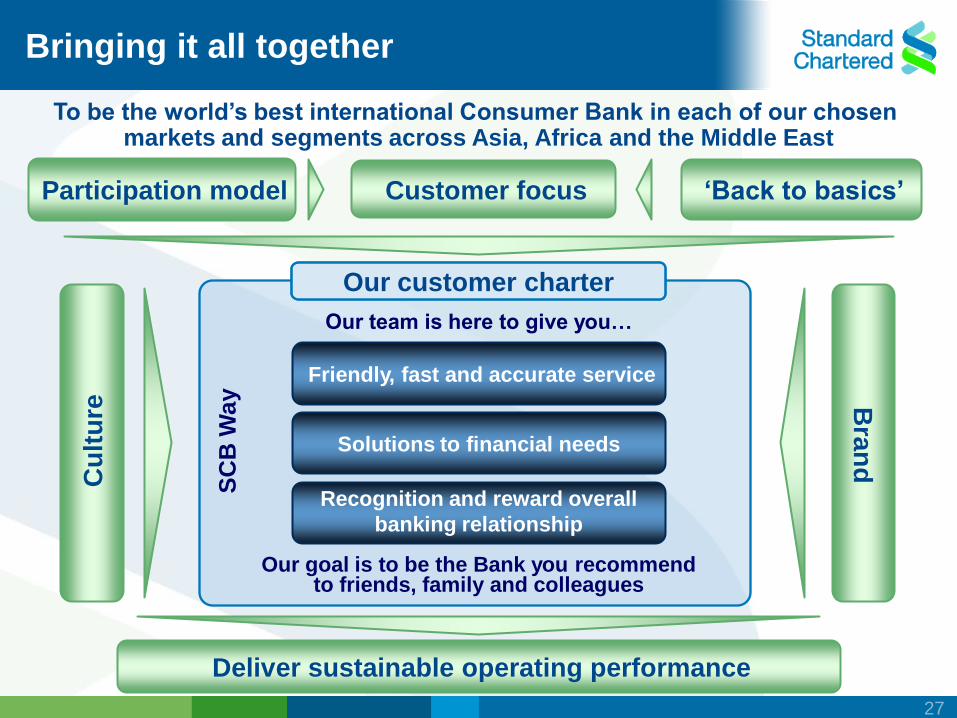
Deliver sustainable operating performance
Bringing it all together
To be the world‟s best international Consumer Bank in each of our chosen markets and segments across Asia, Africa and the Middle East
Participation model „Back to basics‟ Customer focus
Friendly, fast and accurate service
Our goal is to be the Bank you recommend to friends, family and colleagues
Solutions to financial needs
Our customer charter
Recognition and reward overall
banking relationship
Our team is here to give you…
Bra
nd
Cu
ltu
re
SC
B W
ay
27
Key messages
Consumer Banking transformation on track
Strong balance sheet and diversified growth
Macro trends support long term opportunities
Continuing to invest for long term growth
28
Leading the way in Asia, Africa and the Middle East
Kevin Hoffman-Smith
CFO, Consumer Banking
29
Key messages
Balanced growth across segments,
products and geographies
Lending mix shifting gradually to unsecured and SME
Strong portfolio quality
30
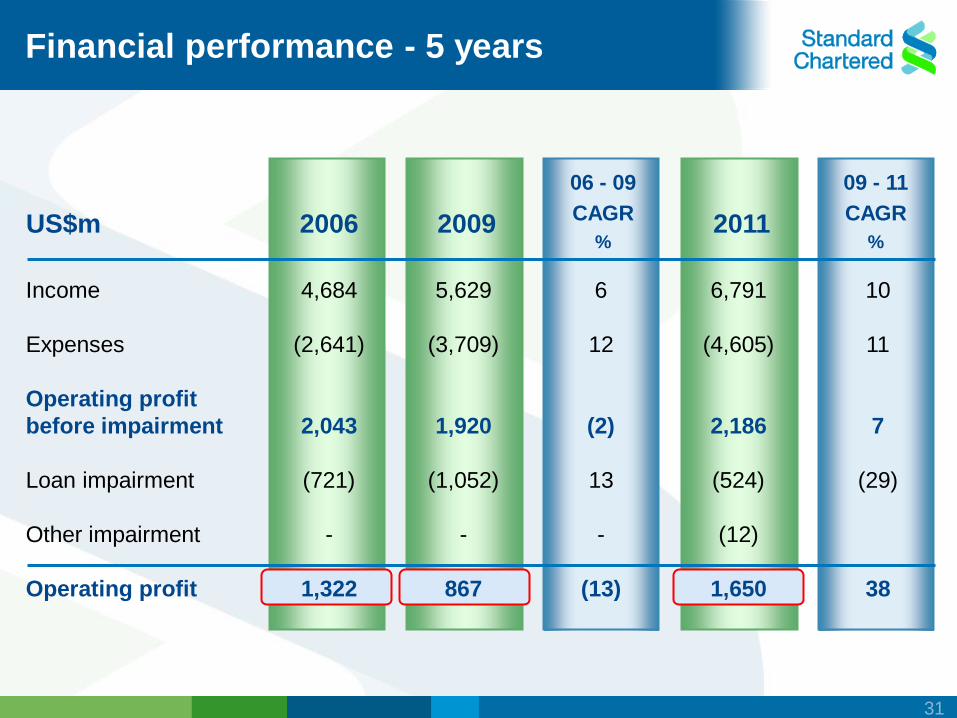
2011 US$m
06 - 09
CAGR
% 2006 2009
Income
Expenses
Operating profit
before impairment
Loan impairment
Other impairment
Operating profit
6
12
(2)
13
-
(13)
10
11
7
(29)
38
09 - 11
CAGR
%
Financial performance - 5 years
4,684
(2,641)
2,043
(721)
-
1,322
5,629
(3,709)
1,920
(1,052)
-
867
6,791
(4,605)
2,186
(524)
(12)
1,650
31
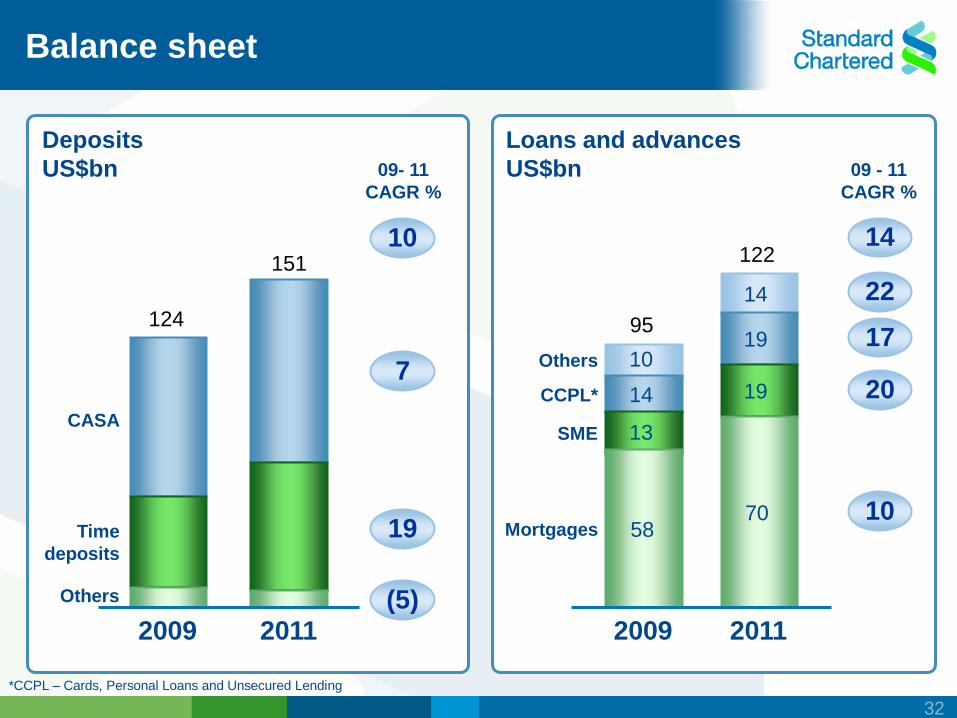
124
151
10
14
14
19
13
19
Mortgages
SME
Others
CCPL*
58 70
2009 2011
09 - 11
CAGR %
Others
Time
deposits
CASA
Deposits
US$bn
2009 2011
09- 11
CAGR %
Loans and advances
US$bn
95
122
*CCPL – Cards, Personal Loans and Unsecured Lending
Balance sheet
10
7
19
(5)
14
22
17
20
10
32
(262)
H1 12 vs H1 11
8
12
1
48
(9)
125
% Constant fx
5
%
9
(2)
42
125
(11)
178
US$m
(20)
89
5
(114)
198
139 4
112 8 5
27 5 2
81 35 31
5 125
(59) (4) (7)
125
7
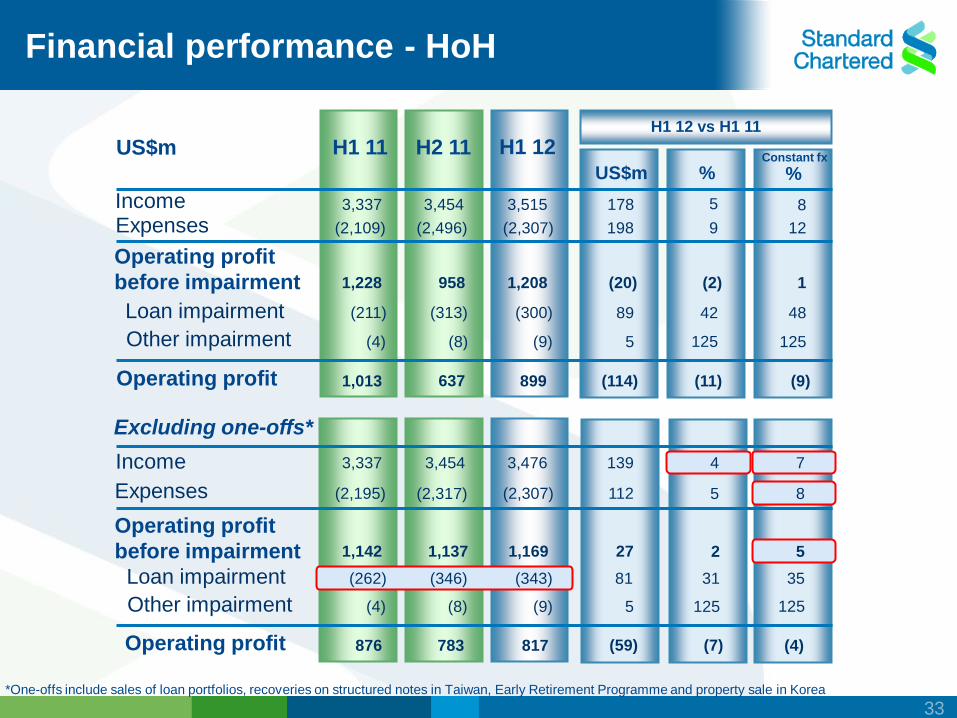
Financial performance - HoH
Excluding one-offs*
Income
Expenses
Operating profit
before impairment
Loan impairment
Operating profit
Other impairment
*One-offs include sales of loan portfolios, recoveries on structured notes in Taiwan, Early Retirement Programme and property sale in Korea
US$m
Income
Expenses
Loan impairment
Operating profit
Other impairment
3,454 3,476
(2,317) (2,307)
1,137 1,169
(346) (343)
(8) (9)
783 817
3,337
(2,195)
1,142
(4)
876
H2 11
3,454 3,515
(2,496) (2,307)
958 1,208
(313) (300)
(8) (9)
637 899
H1 11
3,337
(2,109)
1,228
(211)
(4)
1,013
Operating profit
before impairment
H1 12
33
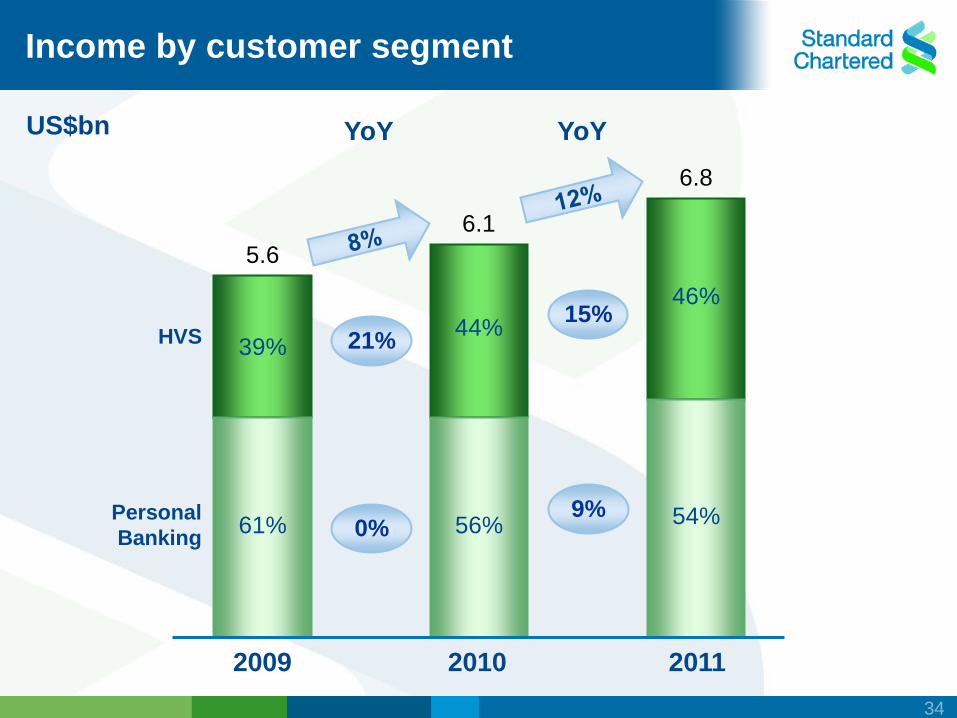
US$bn
HVS
Personal
Banking
Income by customer segment
5.6
39%
2009
61%
6.1
44%
2010
56%
6.8
46%
2011
54% 0%
21% 15%
9%
YoY YoY
34
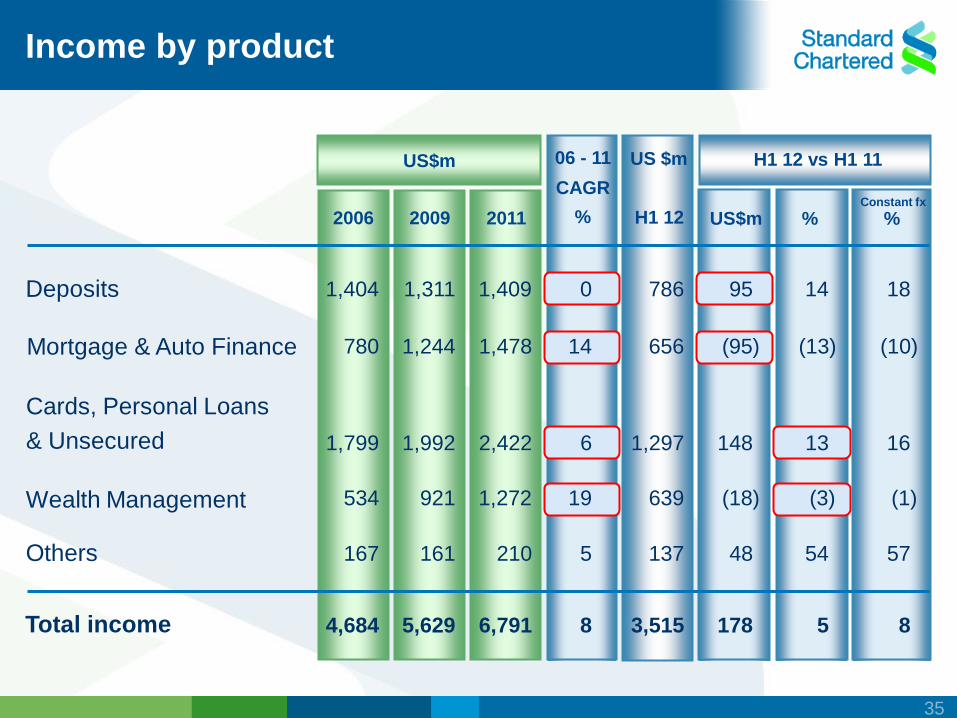
Income by product
2009 2006
H1 12 vs H1 11
534 921 1,272 19
Others 167 161 210 54 5 137 48
Wealth Management 639 (18) (3)
US$m % 2011
06 - 11
CAGR
% H1 12
Total income 4,684 5,629 6,791 5 8 3,515 178
US $m
%
Mortgage & Auto Finance 780 1,244 1,478 (13) 14 656 (95)
Cards, Personal Loans
& Unsecured 1,799 1,992 2,422 13 6 1,297 148
(10)
16
Deposits 1,404 1,311 1,409 14 0 786 95 18
57
(1)
8
US$m
Constant fx
35
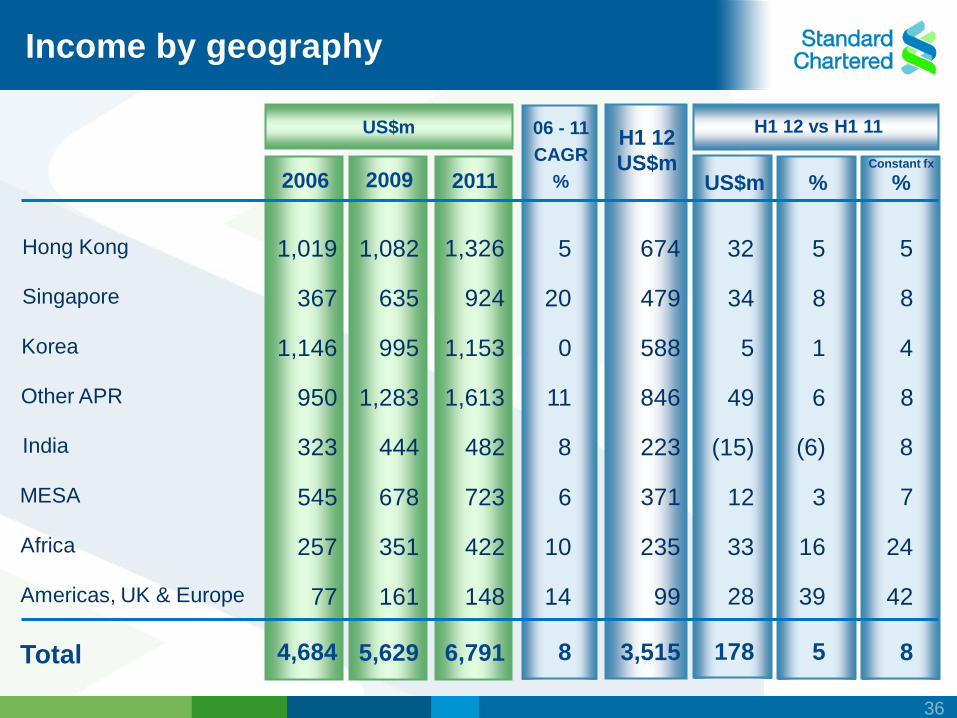
Hong Kong
Singapore
Korea
Other APR
MESA
Total
1,019
367
1,146
950
323
4,684 8
2006 2009
H1 12
US$m 2011 US$m %
Africa
Americas, UK & Europe
India
545
257
77
1,082
635
995
1,283
444
678
351
161
1,326
924
1,153
1,613
482
723
422
148
5,629 6,791
5
20
0
11
8
6
10
14
3,515
674
479
588
846
223
371
235
99
178
32
34
5
49
(15)
12
33
28
5
5
8
1
6
(6)
3
16
39
06 - 11
CAGR
% Constant fx
%
8
5
8
4
8
8
7
24
42
Income by geography
H1 12 vs H1 11 US$m
36
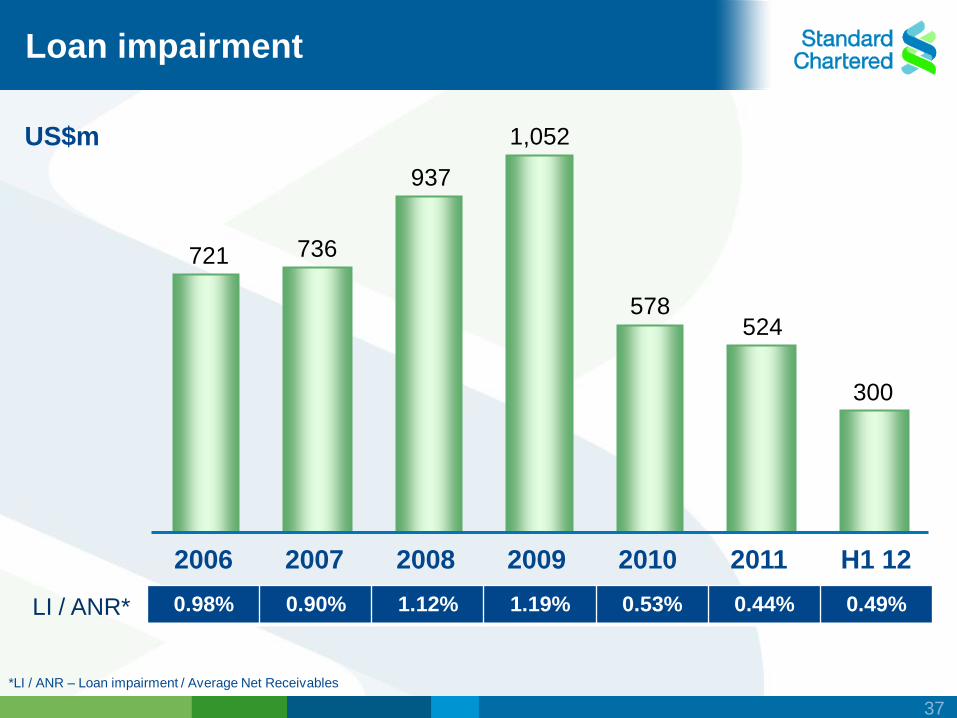
LI / ANR*
US$m
0.98% 0.90% 1.12% 1.19% 0.53% 0.44% 0.49%
721 736
578
937
1,052
524
300
2006 2007 2008 2009 2010 2011 H1 12
Loan impairment
*LI / ANR – Loan impairment / Average Net Receivables
37

Key messages
Balanced growth across segments,
products and geographies
Lending mix shifting gradually to unsecured and SME
Strong portfolio quality
38
Leading the way in Asia, Africa and the Middle East
Ray Duggins
Chief Risk Officer, Consumer Banking
39

Key messages
Credit quality remains strong and stable
Lending mix gradually shifting gradually to
unsecured and SME
Established and proven credit risk
management toolkit and processes
40
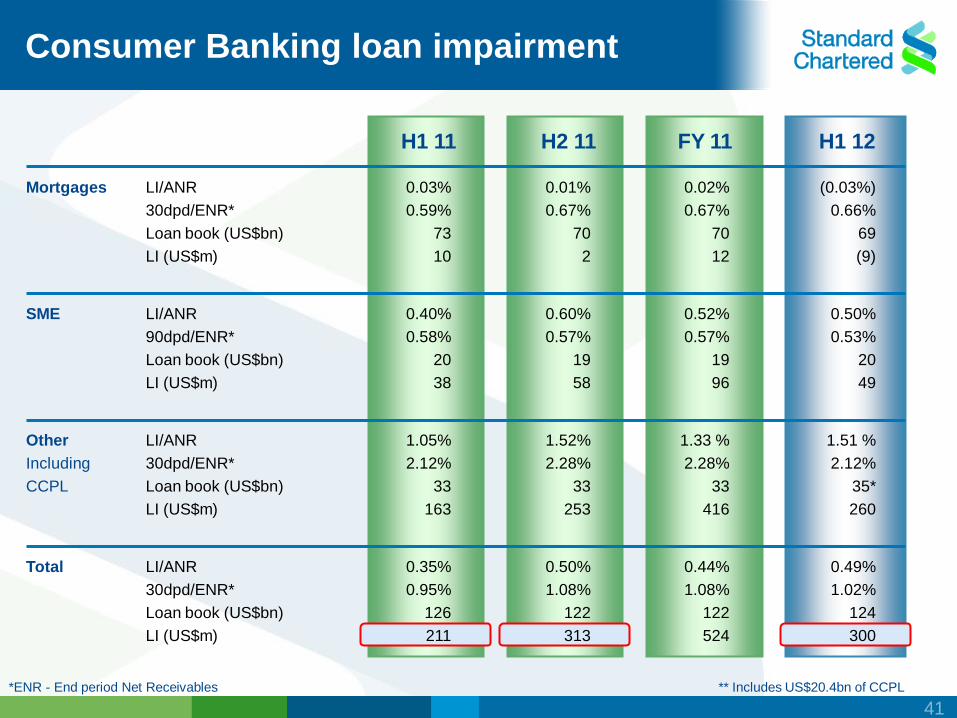
H1 12 FY 11
Consumer Banking loan impairment
*ENR - End period Net Receivables ** Includes US$20.4bn of CCPL
LI/ANR
30dpd/ENR*
Loan book (US$bn)
LI (US$m)
LI/ANR
90dpd/ENR*
Loan book (US$bn)
LI (US$m)
LI/ANR
30dpd/ENR*
Loan book (US$bn)
LI (US$m)
LI/ANR
30dpd/ENR*
Loan book (US$bn)
LI (US$m)
Mortgages
SME
Other
Including
CCPL
Total
H2 11
0.01%
0.67%
70
2
0.60%
0.57%
19
58
1.52%
2.28%
33
253
0.50%
1.08%
122
313
(0.03%)
0.66%
69
(9)
0.50%
0.53%
20
49
1.51 %
2.12%
35*
260
0.49%
1.02%
124
300
H1 11
0.03%
0.59%
73
10
0.40%
0.58%
20
38
1.05%
2.12%
33
163
0.35%
0.95%
126
211
0.02%
0.67%
70
12
0.52%
0.57%
19
96
1.33 %
2.28%
33
416
0.44%
1.08%
122
524
41
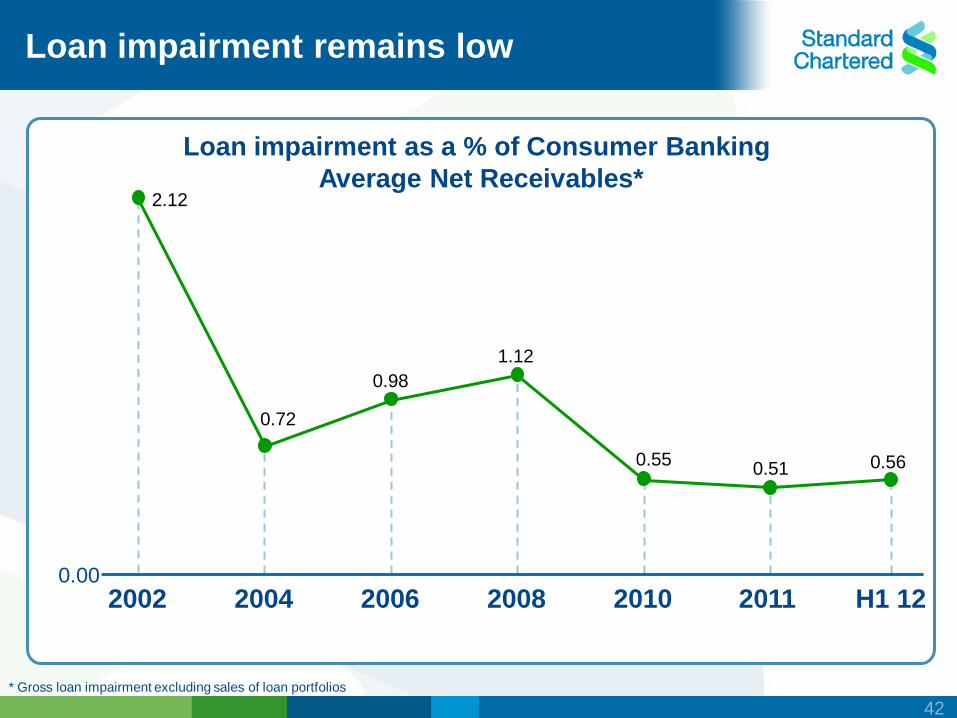
Loan impairment remains low
Loan impairment as a % of Consumer Banking
Average Net Receivables*
* Gross loan impairment excluding sales of loan portfolios
2.12
0.72
0.98
1.12
0.55 0.51
2002 2004 2006 2008 2010 H1 12 0.00
0.56
2011
42
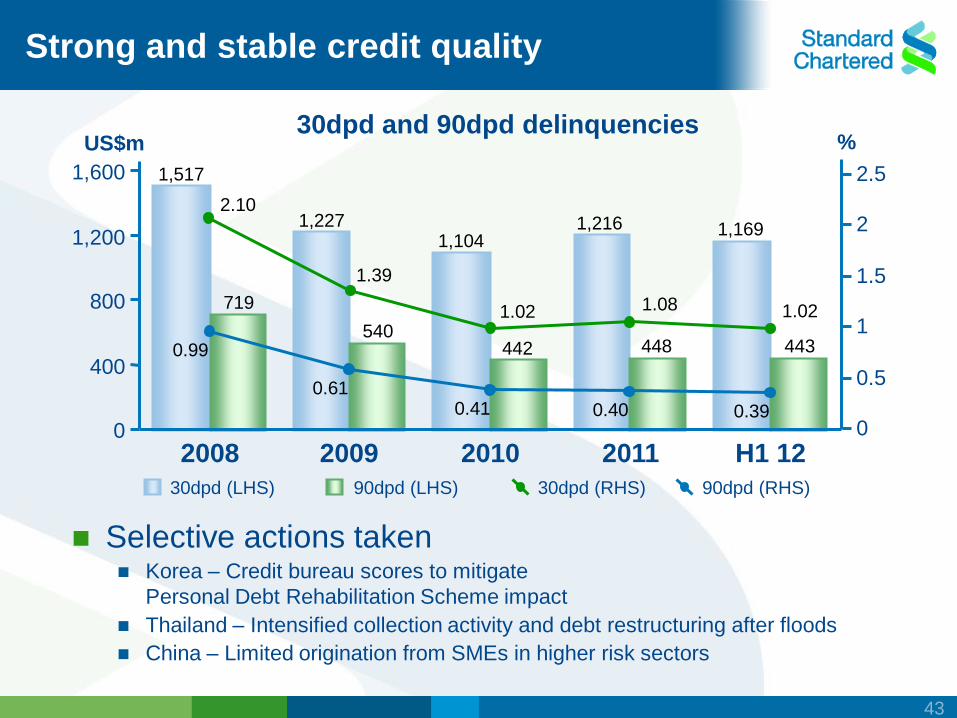
30dpd and 90dpd delinquencies
Strong and stable credit quality
Selective actions taken Korea – Credit bureau scores to mitigate
Personal Debt Rehabilitation Scheme impact
Thailand – Intensified collection activity and debt restructuring after floods
China – Limited origination from SMEs in higher risk sectors
30dpd (RHS) 90dpd (RHS) 30dpd (LHS) 90dpd (LHS)
1,517
1,227 1,104
1,216 1,169
719
540 442 448 443
0
400
800
1,200
1,600
2008 2009 2010 2011 H1 12
2.10
1.39
1.02 1.08 1.02
0.99
0.61 0.41 0.40 0.39
0
0.5
1
1.5
2
2.5
US$m %
43
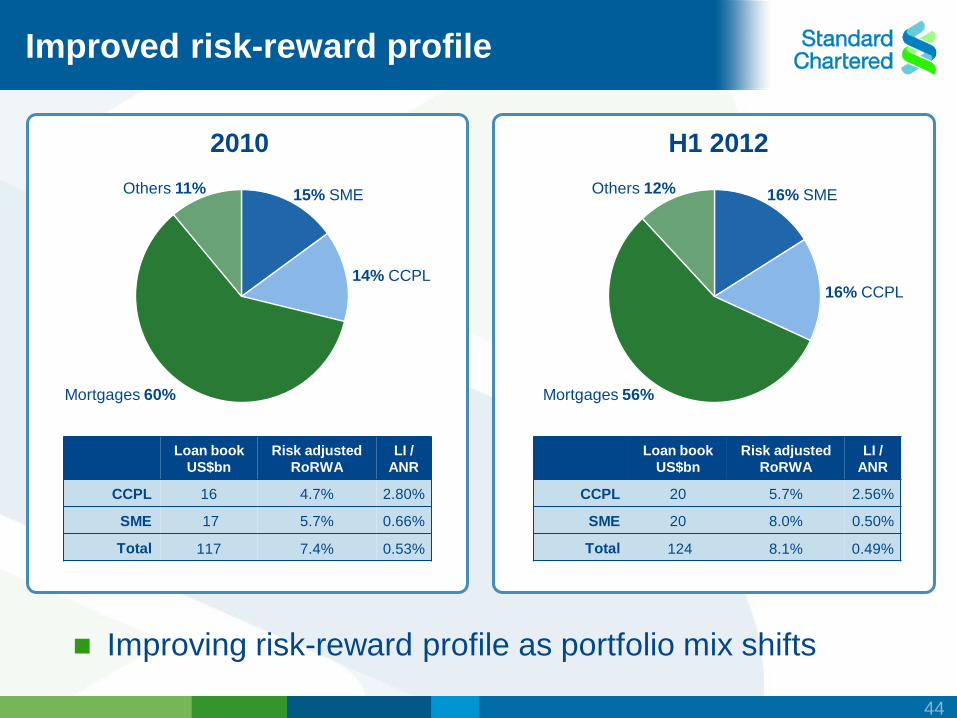
Loan book
US$bn
Risk adjusted
RoRWA
LI /
ANR
CCPL 16 4.7% 2.80%
SME 17 5.7% 0.66%
Total 117 7.4% 0.53%
Loan book
US$bn
Risk adjusted
RoRWA
LI /
ANR
CCPL 20 5.7% 2.56%
SME 20 8.0% 0.50%
Total 124 8.1% 0.49%
Improved risk-reward profile
Improving risk-reward profile as portfolio mix shifts
2010
H1 2012
15% SME
14% CCPL
Mortgages 60%
Others 11% 16% SME
16% CCPL
Mortgages 56%
Others 12%
44
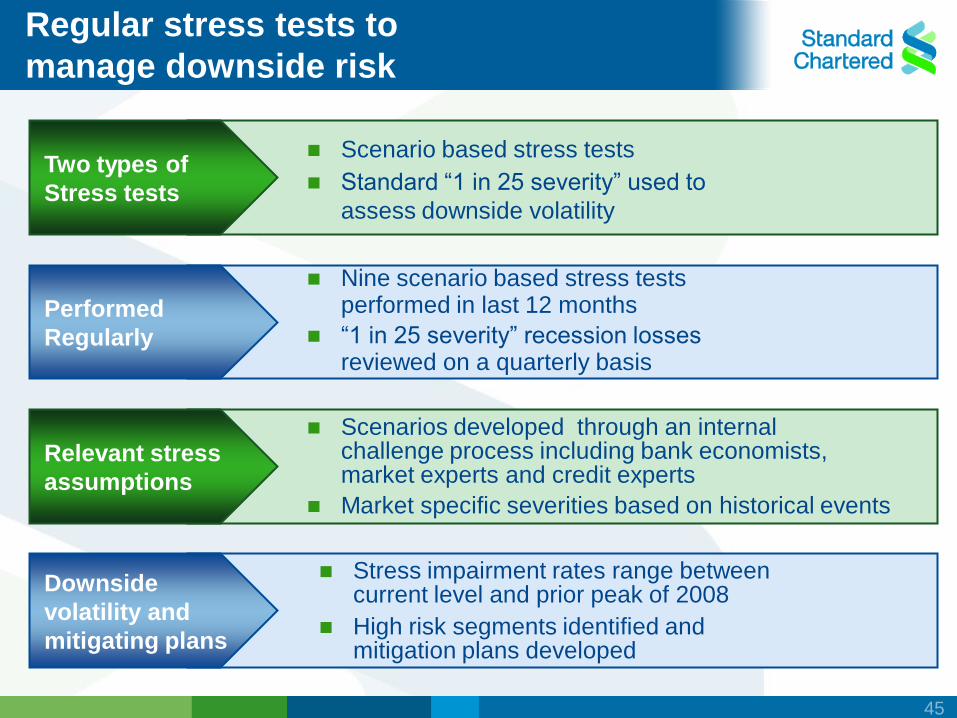
Two types of
Stress tests
Performed
Regularly
Relevant stress
assumptions
Downside
volatility and
mitigating plans
Scenario based stress tests
Standard “1 in 25 severity” used to
assess downside volatility
Nine scenario based stress tests performed in last 12 months
“1 in 25 severity” recession losses reviewed on a quarterly basis
Scenarios developed through an internal challenge process including bank economists, market experts and credit experts
Market specific severities based on historical events
Stress impairment rates range between current level and prior peak of 2008
High risk segments identified and mitigation plans developed
Regular stress tests to
manage downside risk
45
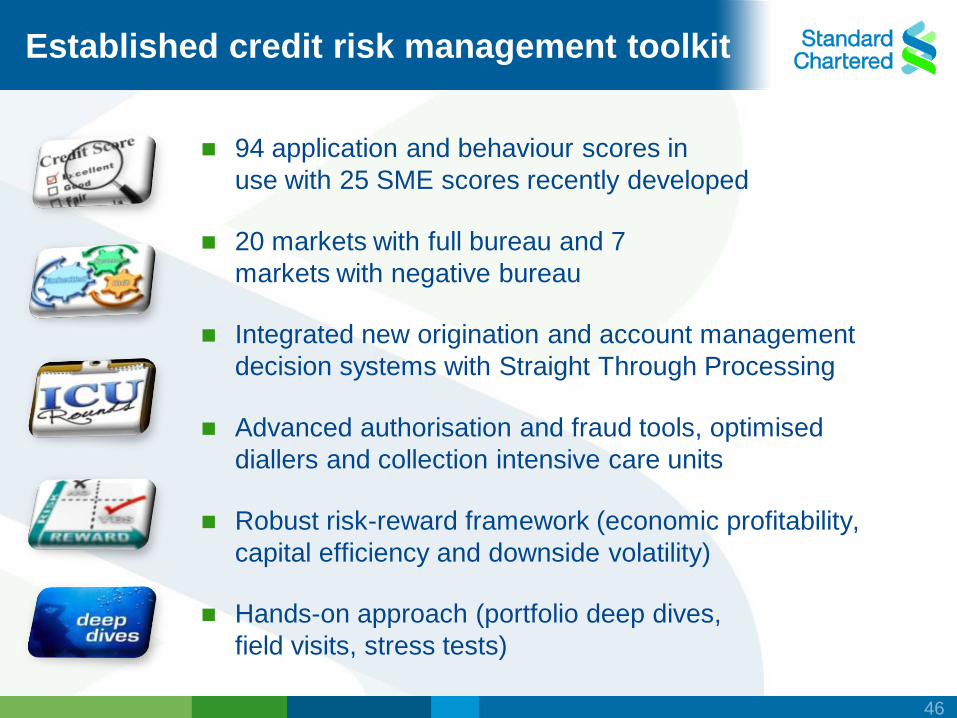
Established credit risk management toolkit
94 application and behaviour scores in
use with 25 SME scores recently developed
20 markets with full bureau and 7
markets with negative bureau
Integrated new origination and account management
decision systems with Straight Through Processing
Advanced authorisation and fraud tools, optimised
diallers and collection intensive care units
Robust risk-reward framework (economic profitability,
capital efficiency and downside volatility)
Hands-on approach (portfolio deep dives,
field visits, stress tests)
46
Key messages
Credit quality remains strong and stable
Lending mix gradually shifting gradually to
unsecured and SME
Established and proven credit risk
management toolkit and processes
47

48
Q&A