Understandingthe pharmaceutical value chain - IFPMA · Understandingthe pharmaceutical value chain...
12
Pharmaceuticals Policy and Law 18 (2016) 55–66 55 DOI 10.3233/PPL-160432 IOS Press Understanding the pharmaceutical value chain Murray Aitken IMS Institute for Healthcare Informatics, 100 IMS Drive, Parsippany, NJ 07054, USA Tel.: +1 973 316 4034; Fax: +1 973 541 3589; E-mail: [email protected] Understanding the pharmaceutical value chain requires the identification of each component from man- ufacturer to end consumer of medicines – and to understand their interaction. In most cases, the manufac- turer’s selling price represents only a fraction of the retail price of a drug. More than half of the end user price results from insurance, freight charges (CIF), import tariffs and charges, importer margin, distributor margin, retailer margin and taxes. The article describes the elements of the medicine value chain, outlines factors and costs that contribute to the difference between the net price a pharmaceutical manufacturer receives for a drug and the final amount paid for the drug by the end user. It quantifies the price build-up for specific therapy areas and countries and illustrates the diversity of approaches and costs associated with the value chain through case studies. Keywords: Pharmaceutical value chain, pharmaceutical distribution and retail margins, pharmaceutical cost analysis 1. Introduction The growing role and use of medicines in healthcare systems globally, driven both by innovative medicines emerging from research and development investments and the expansion of access to meet the imperative of universal health coverage, brings greater importance to understanding the pharmaceutical value chain. This includes the full set of activities that occurs between the point when a medicine is manufac- tured and shipped from a production or import facility until the time it is received by a patient in the course of their medical care and treatment. At each step, understanding the specific elements of the value chain, the contribu- tion to the health system that is provided, and the cost components that are incurred provides important context and perspective to the full value that medicines can and do play in advancing population health around the world. However, components of the value chain can and do differ both between and within markets depending on the type of medicine, channel of distribution, reimbursement regulation, or geographic region. Country comparisons underscore the extent to which health systems differ in a multitude of ways and for many reasons. Recent research on this topic focused on seven markets, representing a range of in- come levels, health system development and geographic regions, and comprised the Netherlands (a high income country with a rational approach to pricing and margins 1389-2827/16/$35.00 c 2016 – Network of Centres for Study of Pharmaceutical Law. All rights reserved
Transcript of Understandingthe pharmaceutical value chain - IFPMA · Understandingthe pharmaceutical value chain...
Pharmaceuticals Policy and Law 18 (2016) 55–66 55DOI 10.3233/PPL-160432IOS Press
Understanding the pharmaceutical value chain
Murray AitkenIMS Institute for Healthcare Informatics, 100 IMS Drive, Parsippany, NJ 07054, USATel.: +1 973 316 4034; Fax: +1 973 541 3589; E-mail: [email protected]
Understanding the pharmaceutical value chain requires the identification of each component from man-ufacturer to end consumer of medicines – and to understand their interaction. In most cases, the manufac-turer’s selling price represents only a fraction of the retail price of a drug. More than half of the end userprice results from insurance, freight charges (CIF), import tariffs and charges, importer margin, distributormargin, retailer margin and taxes.
The article describes the elements of the medicine value chain, outlines factors and costs that contributeto the difference between the net price a pharmaceutical manufacturer receives for a drug and the finalamount paid for the drug by the end user. It quantifies the price build-up for specific therapy areas andcountries and illustrates the diversity of approaches and costs associated with the value chain through casestudies.
Keywords: Pharmaceutical value chain, pharmaceutical distribution and retail margins, pharmaceuticalcost analysis
1. Introduction
The growing role and use of medicines in healthcare systems globally, driven bothby innovative medicines emerging from research and development investments andthe expansion of access to meet the imperative of universal health coverage, bringsgreater importance to understanding the pharmaceutical value chain. This includesthe full set of activities that occurs between the point when a medicine is manufac-tured and shipped from a production or import facility until the time it is received bya patient in the course of their medical care and treatment.
At each step, understanding the specific elements of the value chain, the contribu-tion to the health system that is provided, and the cost components that are incurredprovides important context and perspective to the full value that medicines can anddo play in advancing population health around the world. However, components ofthe value chain can and do differ both between and within markets depending on thetype of medicine, channel of distribution, reimbursement regulation, or geographicregion. Country comparisons underscore the extent to which health systems differ ina multitude of ways and for many reasons.
Recent research on this topic focused on seven markets, representing a range of in-come levels, health system development and geographic regions, and comprised theNetherlands (a high income country with a rational approach to pricing and margins
1389-2827/16/$35.00 c© 2016 – Network of Centres for Study of Pharmaceutical Law. All rights reserved
56 M. Aitken / Understanding the pharmaceutical value chain
that is useful as an “anchor” country for comparison purposes), Brazil, India, Indone-sia, Kenya, Russia and South Africa [1]. The researchers also selected five therapyclasses representing a mix of chronic and acute disease areas, and comprised antibi-otics, diabetes, epilepsy, hypertension and respiratory. For each therapy area and ineach country, analysis of costs, margins and mark-ups was undertaken, indexed to100 and represented in a way that enables comparison.
2. Major components of the pharmaceutical value chain
In advancing the understanding of the pharmaceutical value chain, it is useful tolook at three major components:
1. Manufacturing of the medicine: In order to produce a medicine, a number ofsteps are involved, from the initial research and development phase, to gainingregulatory approval which allows a medicine to be sold in a market, to thefinal commercialization phase. The specific steps and requirements will differbetween types of medicine, manufacturers and countries.
2. Distribution to the dispensing point: This step includes the transportation andhandling of the medicine from the manufacturer to the end user, whether thisis a retail pharmacy (retailer), hospital or dispensing doctor. The complexityof this journey will differ depending on manufacturer location, the need forimportation of the medicine, the nature of special handling requirements, andthe geographic location of the end user which will vary between large urbancenters and remote rural villages.
3. Dispensing to the end user: Providing the correct medicine dosage and form,to the right patient, in a convenient and timely manner is the final step in thevalue chain. This step can also involve a number of additional activities, in-cluding checking for potential interactions, providing advice, and processingreimbursement claims, each of which is intended to ensure the patient receivesthe full benefit and value from the medicines they receive.
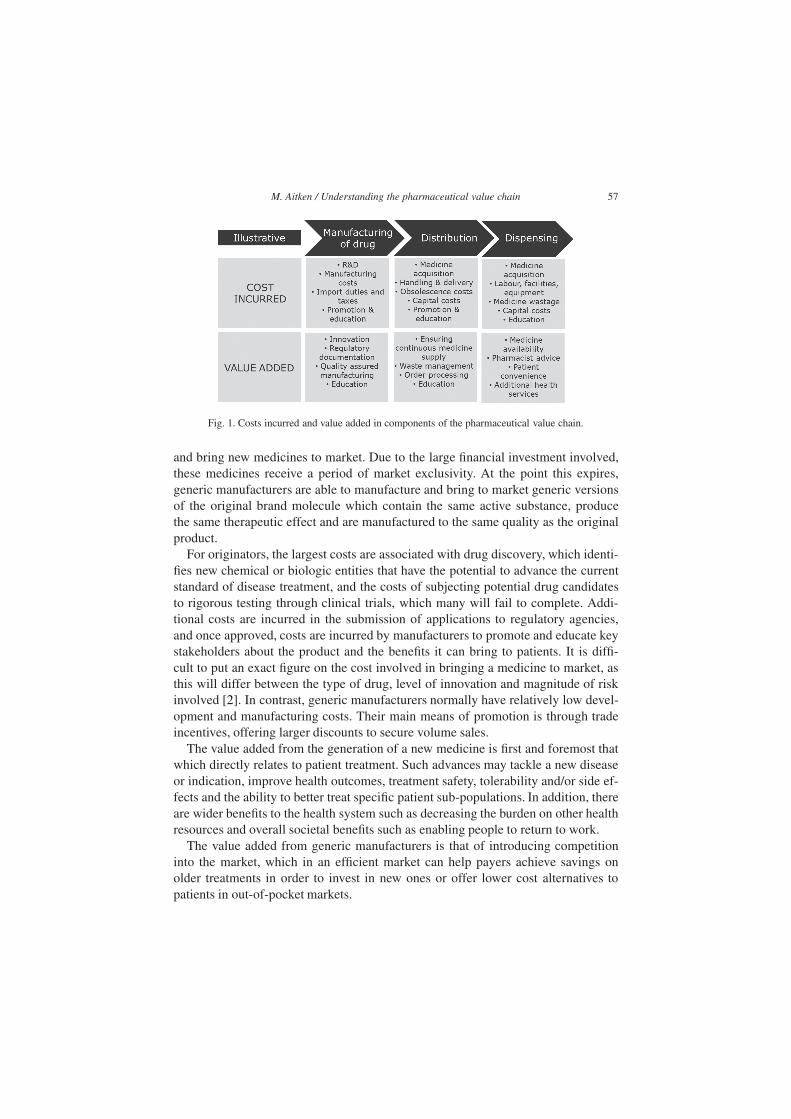
In each of these components of the value chain, a range of costs are incurred andvalue added, as summarized in Fig. 1.
3. Activities, costs and value added in manufacturing medicines
Broadly speaking, there are two categories of manufacturing required for drugproduction: active pharmaceutical ingredient (API) manufacturers which produce theraw ingredients used in medicine; and finished form manufacturers which producethe final product to be sold to market and consumed by the patient.
Finished form manufacturers can also be categorized as innovators or generic com-panies. Innovator companies invest in research and development in order to discover
M. Aitken / Understanding the pharmaceutical value chain 57
Fig. 1. Costs incurred and value added in components of the pharmaceutical value chain.
and bring new medicines to market. Due to the large financial investment involved,these medicines receive a period of market exclusivity. At the point this expires,generic manufacturers are able to manufacture and bring to market generic versionsof the original brand molecule which contain the same active substance, producethe same therapeutic effect and are manufactured to the same quality as the originalproduct.
For originators, the largest costs are associated with drug discovery, which identi-fies new chemical or biologic entities that have the potential to advance the currentstandard of disease treatment, and the costs of subjecting potential drug candidatesto rigorous testing through clinical trials, which many will fail to complete. Addi-tional costs are incurred in the submission of applications to regulatory agencies,and once approved, costs are incurred by manufacturers to promote and educate keystakeholders about the product and the benefits it can bring to patients. It is diffi-cult to put an exact figure on the cost involved in bringing a medicine to market, asthis will differ between the type of drug, level of innovation and magnitude of riskinvolved [2]. In contrast, generic manufacturers normally have relatively low devel-opment and manufacturing costs. Their main means of promotion is through tradeincentives, offering larger discounts to secure volume sales.
The value added from the generation of a new medicine is first and foremost thatwhich directly relates to patient treatment. Such advances may tackle a new diseaseor indication, improve health outcomes, treatment safety, tolerability and/or side ef-fects and the ability to better treat specific patient sub-populations. In addition, thereare wider benefits to the health system such as decreasing the burden on other healthresources and overall societal benefits such as enabling people to return to work.
The value added from generic manufacturers is that of introducing competitioninto the market, which in an efficient market can help payers achieve savings onolder treatments in order to invest in new ones or offer lower cost alternatives topatients in out-of-pocket markets.
58 M. Aitken / Understanding the pharmaceutical value chain
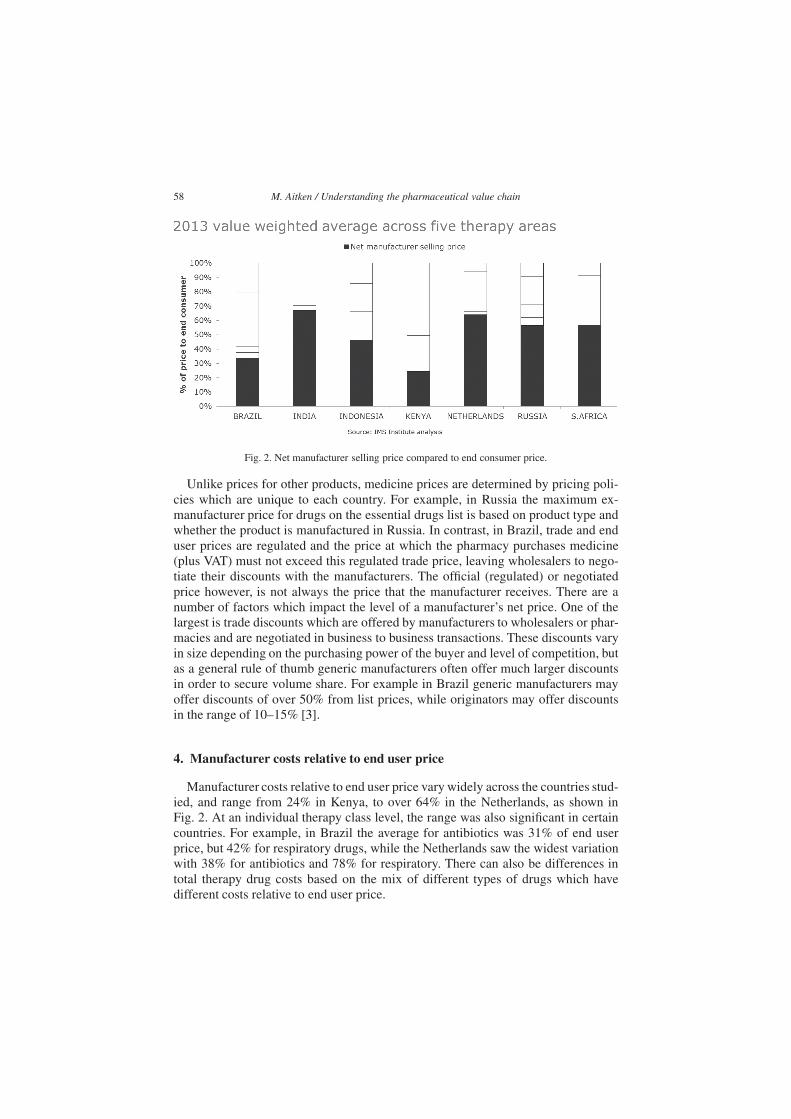
Fig. 2. Net manufacturer selling price compared to end consumer price.
Unlike prices for other products, medicine prices are determined by pricing poli-cies which are unique to each country. For example, in Russia the maximum ex-manufacturer price for drugs on the essential drugs list is based on product type andwhether the product is manufactured in Russia. In contrast, in Brazil, trade and enduser prices are regulated and the price at which the pharmacy purchases medicine(plus VAT) must not exceed this regulated trade price, leaving wholesalers to nego-tiate their discounts with the manufacturers. The official (regulated) or negotiatedprice however, is not always the price that the manufacturer receives. There are anumber of factors which impact the level of a manufacturer’s net price. One of thelargest is trade discounts which are offered by manufacturers to wholesalers or phar-macies and are negotiated in business to business transactions. These discounts varyin size depending on the purchasing power of the buyer and level of competition, butas a general rule of thumb generic manufacturers often offer much larger discountsin order to secure volume share. For example in Brazil generic manufacturers mayoffer discounts of over 50% from list prices, while originators may offer discountsin the range of 10–15% [3].
4. Manufacturer costs relative to end user price
Manufacturer costs relative to end user price vary widely across the countries stud-ied, and range from 24% in Kenya, to over 64% in the Netherlands, as shown inFig. 2. At an individual therapy class level, the range was also significant in certaincountries. For example, in Brazil the average for antibiotics was 31% of end userprice, but 42% for respiratory drugs, while the Netherlands saw the widest variationwith 38% for antibiotics and 78% for respiratory. There can also be differences intotal therapy drug costs based on the mix of different types of drugs which havedifferent costs relative to end user price.
M. Aitken / Understanding the pharmaceutical value chain 59
5. Activities, costs and value added in distribution of medicines
The distribution of medicines in most markets is carried out by importers andwholesalers, which act as a link between manufacturers and retailers to ensure thecontinuous supply of medicine, regardless of the geographical location and portfolioof medicine required. For those medicines which are imported, there is often anadditional step in handling the logistics of bringing the medicine into the country.The exact number of steps, participants and complexity in the distribution componentdiffers based on the nature of the products, markets and distribution profile.
Pharmaceutical distribution needs to meet the logistical challenge of serving alarge number of pharmacies with products sourced from many manufacturers andoften in a short period of time. At the same time regulation may require a certainlevel of distribution standards to ensure that medicines are handled according togood distribution practice. The distributor invests in inventory to be able to serviceits customers. The distributor might typically be holding one to two months’ worthof inventory and the cost to carry inventory includes warehousing cost, capital cost,and obsolescence. The working capital, both for the inventory held and supply stockto pharmacies, is done on a credit cycle which can range from 28 days in the Nether-lands to 120–150 days in Kenya (90 days to get paid by the retailer and two monthsof stock holding) [3]. For the wholesaler this results in additional costs from interestand the risk that pharmacy repayment may be delayed or in a worst case scenario,default on their obligations. Furthermore, in countries such as Kenya, the importer isunlikely to pay for goods with domestic currency and will be impacted by the finan-cial cost of acquiring foreign currency and any fluctuations in exchange rate whenpurchasing medicines from manufacturers.
The key function of a wholesaler is to resolve the challenge of being able to meetvaried and un-predictable patient needs, by supplying medicines from manufactur-ers, without requiring the retailer to hold large inventories on-site. A second majorfunction (and cost) is to provide the necessary working capital for pharmacies toallow them to purchase the required drugs, before receiving end user payment. Fi-nally, in some markets wholesalers provide a broad set of commercial support toindependent pharmacies to improve the operation of the business, such as categorymanagement (retail initiatives to help grow the pharmacies business), sales training,accounting and continuing education for pharmacies.
Distributors are traditionally paid on a regulated margin basis set as a fixed per-centage of the price. In some countries, this has become a regressive margin with alower percentage applied for more expensive packs. In markets with regulated mar-gins, discounts from the manufacturer might also exist; in other countries and forsome categories of products, discounts may not be allowed. Generally, discountsare given when the wholesalers can influence which manufacturer’s product is sold,meaning that they are more common on products without patent protection (nolonger protected originals or generics). Some countries have moved to a “fee-for-service model” in which the margin for the wholesaler is negotiated between thedistributor and the manufacturer.
60 M. Aitken / Understanding the pharmaceutical value chain
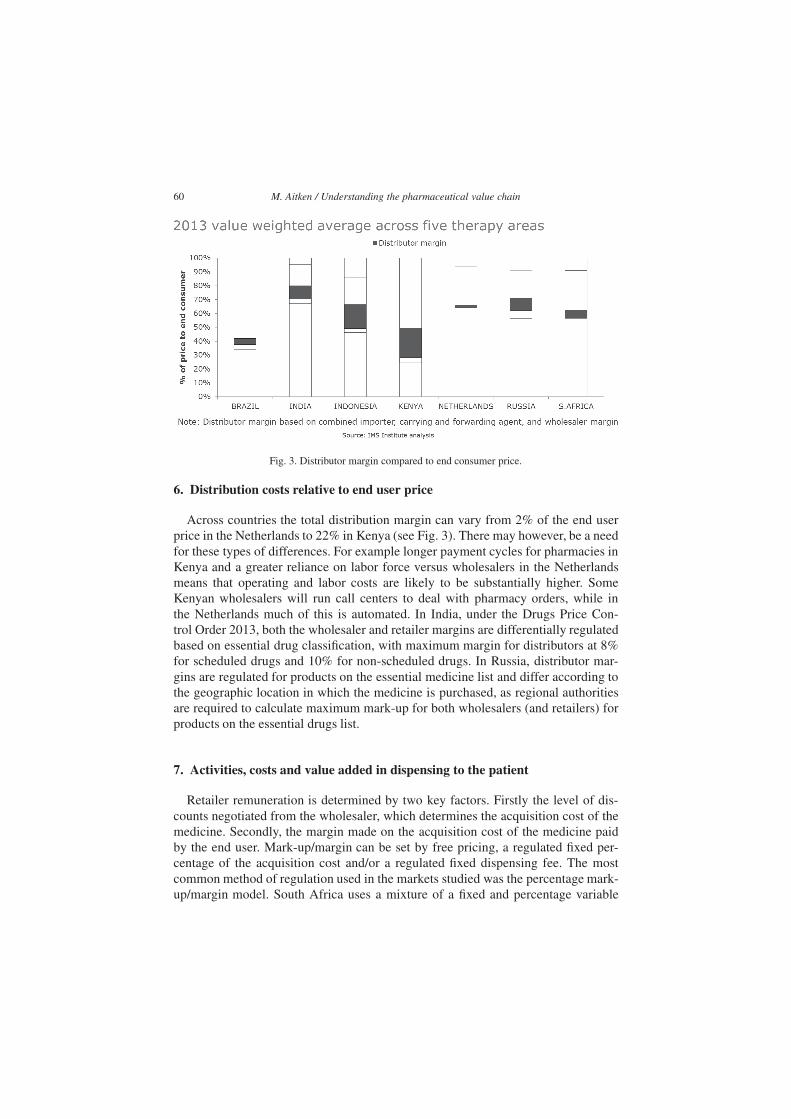
Fig. 3. Distributor margin compared to end consumer price.
6. Distribution costs relative to end user price
Across countries the total distribution margin can vary from 2% of the end userprice in the Netherlands to 22% in Kenya (see Fig. 3). There may however, be a needfor these types of differences. For example longer payment cycles for pharmacies inKenya and a greater reliance on labor force versus wholesalers in the Netherlandsmeans that operating and labor costs are likely to be substantially higher. SomeKenyan wholesalers will run call centers to deal with pharmacy orders, while inthe Netherlands much of this is automated. In India, under the Drugs Price Con-trol Order 2013, both the wholesaler and retailer margins are differentially regulatedbased on essential drug classification, with maximum margin for distributors at 8%for scheduled drugs and 10% for non-scheduled drugs. In Russia, distributor mar-gins are regulated for products on the essential medicine list and differ according tothe geographic location in which the medicine is purchased, as regional authoritiesare required to calculate maximum mark-up for both wholesalers (and retailers) forproducts on the essential drugs list.
7. Activities, costs and value added in dispensing to the patient
Retailer remuneration is determined by two key factors. Firstly the level of dis-counts negotiated from the wholesaler, which determines the acquisition cost of themedicine. Secondly, the margin made on the acquisition cost of the medicine paidby the end user. Mark-up/margin can be set by free pricing, a regulated fixed per-centage of the acquisition cost and/or a regulated fixed dispensing fee. The mostcommon method of regulation used in the markets studied was the percentage mark-up/margin model. South Africa uses a mixture of a fixed and percentage variable
M. Aitken / Understanding the pharmaceutical value chain 61
component, while the Netherlands is the only country where remuneration is a fixedfee per prescription (regardless of the number of packs dispensed) [4].
Retailer costs can be split into those which are fixed and those which vary de-pending on the level of business. Fixed costs include the cost of labor (pharma-cist, etc.), facilities, equipment (including information technology), utilities and in-surance. Variable costs include product acquisition cost and the volume being pur-chased; medicine wastage resulting from expiry or damage; and the capital cost ofinventory. The costs of running a retailer in a rural location compared to an urbanarea can be quite different. The size of a retailer in a rural location is often muchsmaller, clientele is scarcer and often poorer, both of which reduce the opportunityto recover fixed costs [5].
One fundamental role of a retail pharmacist is that of logistics: being able to dis-pense the right drug, to the right time at the correct dosage. This in itself is an over-simplification as this task also entails correcting prescribing errors, processing theprescription, labelling etc. and advising and educating patients on the safe use ofprescribed drug, contraindications, interactions and side effects. For example, somepharmacists in the Netherlands suggest that 15% of prescriptions require an inter-vention from the pharmacist, e.g. adjusting dose to patient weight, change of labeldue to preference etc. [6]. Pharmacists can also spend a substantial amount of timemitigating the impact of drug shortages by finding either new sources or alternativemedicines.
As retailer business models evolve, additional services are becoming more com-mon and the role of a pharmacist is no longer just about medicine provision, butthe provision of services which help maintain patient health [7]. These can includetraining on the administration of medications including inhalation and injectables,blood pressure testing and measurement of blood glucose and triglyceride levels, ed-ucation on disease management through non-medical means such as nutrition andother lifestyle factors, and improving patient adherence through education and pa-tient monitoring [8]. Such initiatives have the potential to improve patient health out-comes and reduce health service utilization, which can ultimately reduce the burdenon the overall health system.
Retail dispensing fees in many of the markets analyzed – Brazil, India, Russiaand South Africa – are capped to help regulate the end-consumer price. However, todifferentiate themselves from competition, pharmacies may charge below this max-imum either by foregoing or reducing the dispensing fee (South Africa) or passingon discounts acquired from the wholesaler to the patient (Brazil) [3]. This meansthat the prices of drugs are often well below the official regulated end user price.However, the ability to discount varies between types of pharmacies. Those whichare able to negotiate high discounts from wholesalers – normally the large chains-are subsequently able to offer cheaper prices to patients than smaller independentpharmacies which are unable to run on smaller margins.
In some markets where retailers make a loss from selling prescription medicine,profit is instead generated from additional over-the-counter and health and beauty
62 M. Aitken / Understanding the pharmaceutical value chain
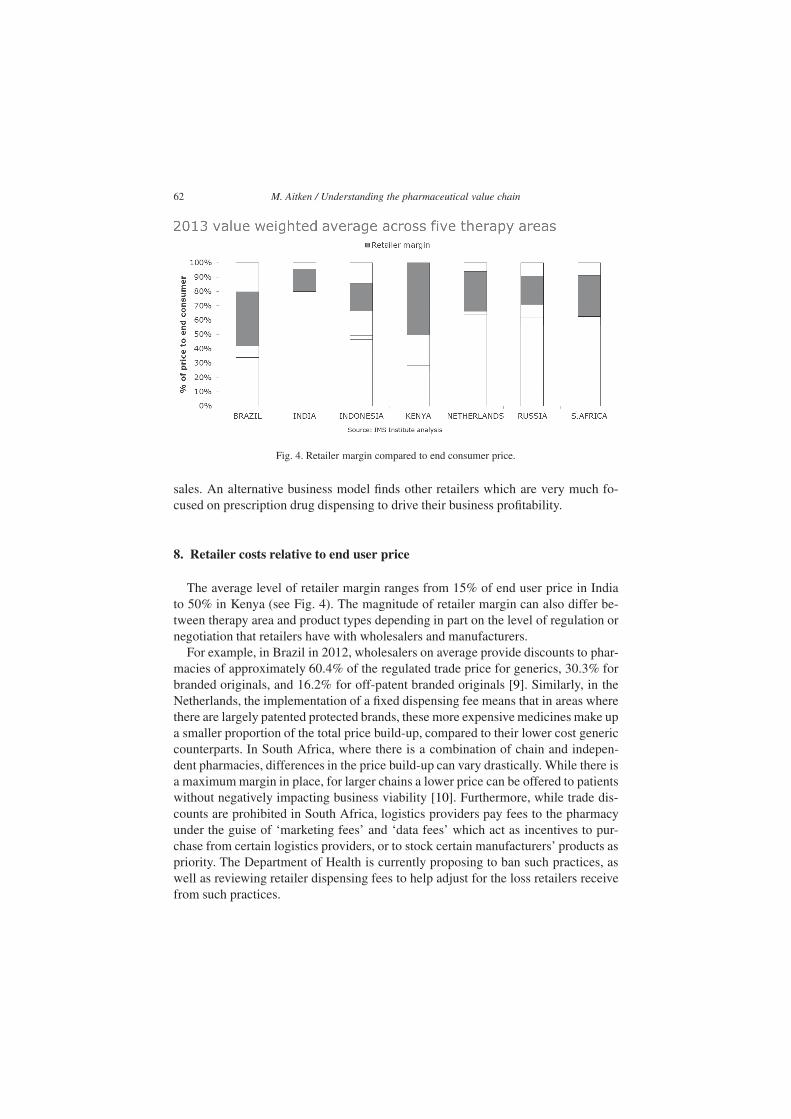
Fig. 4. Retailer margin compared to end consumer price.
sales. An alternative business model finds other retailers which are very much fo-cused on prescription drug dispensing to drive their business profitability.
8. Retailer costs relative to end user price
The average level of retailer margin ranges from 15% of end user price in Indiato 50% in Kenya (see Fig. 4). The magnitude of retailer margin can also differ be-tween therapy area and product types depending in part on the level of regulation ornegotiation that retailers have with wholesalers and manufacturers.
For example, in Brazil in 2012, wholesalers on average provide discounts to phar-macies of approximately 60.4% of the regulated trade price for generics, 30.3% forbranded originals, and 16.2% for off-patent branded originals [9]. Similarly, in theNetherlands, the implementation of a fixed dispensing fee means that in areas wherethere are largely patented protected brands, these more expensive medicines make upa smaller proportion of the total price build-up, compared to their lower cost genericcounterparts. In South Africa, where there is a combination of chain and indepen-dent pharmacies, differences in the price build-up can vary drastically. While there isa maximum margin in place, for larger chains a lower price can be offered to patientswithout negatively impacting business viability [10]. Furthermore, while trade dis-counts are prohibited in South Africa, logistics providers pay fees to the pharmacyunder the guise of ‘marketing fees’ and ‘data fees’ which act as incentives to pur-chase from certain logistics providers, or to stock certain manufacturers’ products aspriority. The Department of Health is currently proposing to ban such practices, aswell as reviewing retailer dispensing fees to help adjust for the loss retailers receivefrom such practices.
M. Aitken / Understanding the pharmaceutical value chain 63
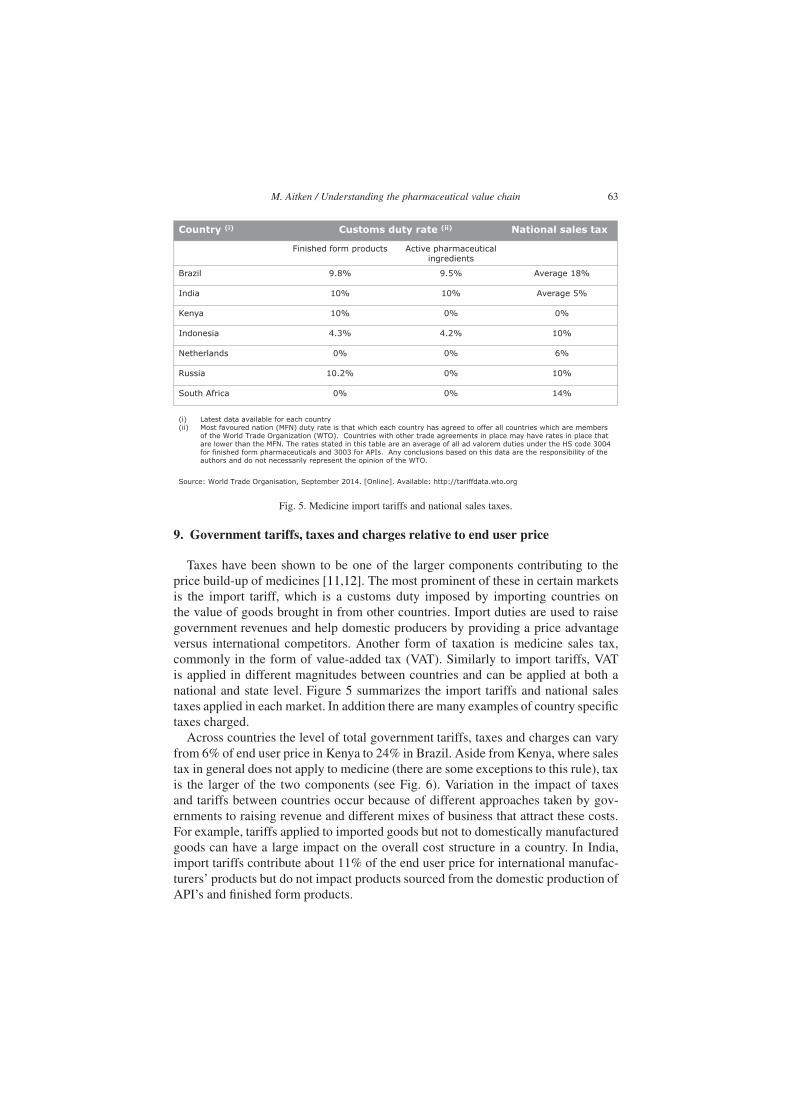
Country (i) Customs duty rate (ii) National sales tax
Finished form products Active pharmaceutical ingredients
%81 egarevA%5.9%8.9lizarB
%5 egarevA%01%01aidnI
%0%0%01ayneK
%01%2.4%3.4aisenodnI
%6%0%0sdnalrehteN
%01%0%2.01aissuR
%41%0%0acirfA htuoS
(i) Latest data available for each country(ii) Most favoured nation (MFN) duty rate is that which each country has agreed to offer all countries which are members
of the World Trade Organization (WTO). Countries with other trade agreements in place may have rates in place that are lower than the MFN. The rates stated in this table are an average of all ad valorem duties under the HS code 3004 for finished form pharmaceuticals and 3003 for APIs. Any conclusions based on this data are the responsibility of the authors and do not necessarily represent the opinion of the WTO.
Source: World Trade Organisation, September 2014. [Online]. Available: http://tariffdata.wto.org
Fig. 5. Medicine import tariffs and national sales taxes.
9. Government tariffs, taxes and charges relative to end user price
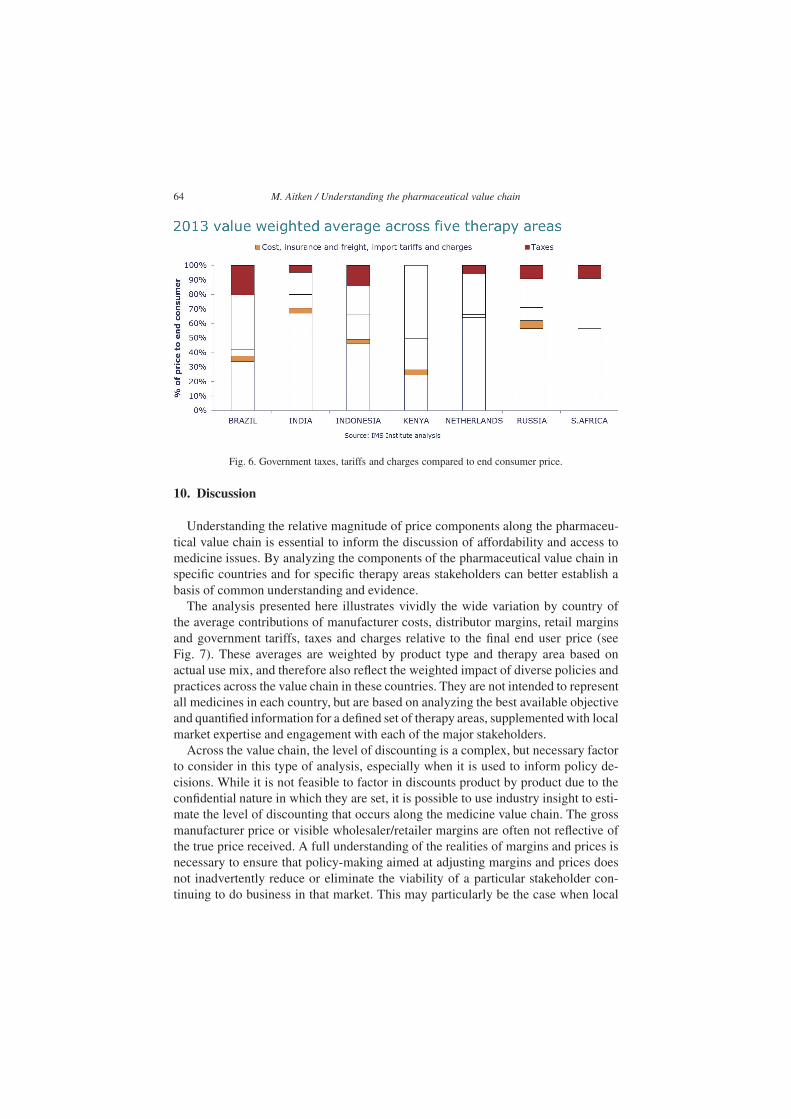
Taxes have been shown to be one of the larger components contributing to theprice build-up of medicines [11,12]. The most prominent of these in certain marketsis the import tariff, which is a customs duty imposed by importing countries onthe value of goods brought in from other countries. Import duties are used to raisegovernment revenues and help domestic producers by providing a price advantageversus international competitors. Another form of taxation is medicine sales tax,commonly in the form of value-added tax (VAT). Similarly to import tariffs, VATis applied in different magnitudes between countries and can be applied at both anational and state level. Figure 5 summarizes the import tariffs and national salestaxes applied in each market. In addition there are many examples of country specifictaxes charged.
Across countries the level of total government tariffs, taxes and charges can varyfrom 6% of end user price in Kenya to 24% in Brazil. Aside from Kenya, where salestax in general does not apply to medicine (there are some exceptions to this rule), taxis the larger of the two components (see Fig. 6). Variation in the impact of taxesand tariffs between countries occur because of different approaches taken by gov-ernments to raising revenue and different mixes of business that attract these costs.For example, tariffs applied to imported goods but not to domestically manufacturedgoods can have a large impact on the overall cost structure in a country. In India,import tariffs contribute about 11% of the end user price for international manufac-turers’ products but do not impact products sourced from the domestic production ofAPI’s and finished form products.
64 M. Aitken / Understanding the pharmaceutical value chain
Fig. 6. Government taxes, tariffs and charges compared to end consumer price.
10. Discussion
Understanding the relative magnitude of price components along the pharmaceu-tical value chain is essential to inform the discussion of affordability and access tomedicine issues. By analyzing the components of the pharmaceutical value chain inspecific countries and for specific therapy areas stakeholders can better establish abasis of common understanding and evidence.
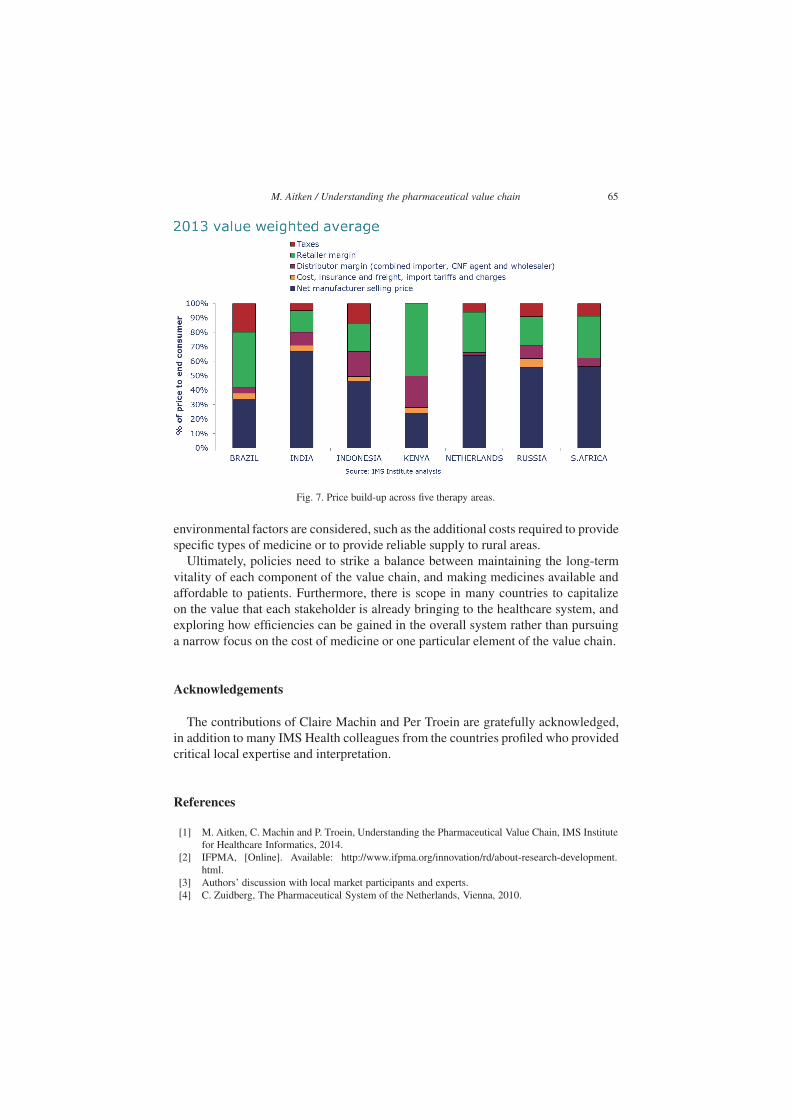
The analysis presented here illustrates vividly the wide variation by country ofthe average contributions of manufacturer costs, distributor margins, retail marginsand government tariffs, taxes and charges relative to the final end user price (seeFig. 7). These averages are weighted by product type and therapy area based onactual use mix, and therefore also reflect the weighted impact of diverse policies andpractices across the value chain in these countries. They are not intended to representall medicines in each country, but are based on analyzing the best available objectiveand quantified information for a defined set of therapy areas, supplemented with localmarket expertise and engagement with each of the major stakeholders.
Across the value chain, the level of discounting is a complex, but necessary factorto consider in this type of analysis, especially when it is used to inform policy de-cisions. While it is not feasible to factor in discounts product by product due to theconfidential nature in which they are set, it is possible to use industry insight to esti-mate the level of discounting that occurs along the medicine value chain. The grossmanufacturer price or visible wholesaler/retailer margins are often not reflective ofthe true price received. A full understanding of the realities of margins and prices isnecessary to ensure that policy-making aimed at adjusting margins and prices doesnot inadvertently reduce or eliminate the viability of a particular stakeholder con-tinuing to do business in that market. This may particularly be the case when local
M. Aitken / Understanding the pharmaceutical value chain 65
Fig. 7. Price build-up across five therapy areas.
environmental factors are considered, such as the additional costs required to providespecific types of medicine or to provide reliable supply to rural areas.
Ultimately, policies need to strike a balance between maintaining the long-termvitality of each component of the value chain, and making medicines available andaffordable to patients. Furthermore, there is scope in many countries to capitalizeon the value that each stakeholder is already bringing to the healthcare system, andexploring how efficiencies can be gained in the overall system rather than pursuinga narrow focus on the cost of medicine or one particular element of the value chain.
Acknowledgements
The contributions of Claire Machin and Per Troein are gratefully acknowledged,in addition to many IMS Health colleagues from the countries profiled who providedcritical local expertise and interpretation.
References
[1] M. Aitken, C. Machin and P. Troein, Understanding the Pharmaceutical Value Chain, IMS Institutefor Healthcare Informatics, 2014.
[2] IFPMA, [Online]. Available: http://www.ifpma.org/innovation/rd/about-research-development.html.
[3] Authors’ discussion with local market participants and experts.[4] C. Zuidberg, The Pharmaceutical System of the Netherlands, Vienna, 2010.
66 M. Aitken / Understanding the pharmaceutical value chain
[5] B. Waning, J. Maddix and L. Soucy, Balancing medicine prices and business sustainability: analy-ses of pharmacy costs, revenues and profit shed light on retail medicine mark-ups in rural Kyrgyz-tan, BMC Health Services Research, 2010.
[6] Author interview with private retail pharmacist in the Netherlands. [Interview]. Sept 2014.[7] S. Pande, J. Hiller, N. Nkansah and L. Bero, The effect of pharmacist provided non-dispensing ser-
vices on patient outcomes, health service utilisation and costs in low and middle-income countries(Review), Cochrane Database of Systemic Reviews, 2013.
[8] M. Aitken and L. Gorokovich, Advancing the responsible use of medicines: applying levers forchange, IMS Institute for Healthcare Informatics, 2012.
[9] Author’s analysis of IMS Health Pharmaquery, 2013.[10] A. Andrews, The dispensing fee for medications: The Negative Effects of Pricing Uncertainty on
Pharmacy Practise in South Africa, Centre for social science research: Aids and society researchunit, 2009.
[11] A. Creese, Working Paper 5: Sales taxes on Medicines – WHO/HAI Project on Medicine Pricesand Availability, Review Series on Pharmaceutical Pricing Policies and Interventions, 2011.
[12] M. Olcay and R. Laing, Pharmaceutical Tariffs: What is their effect on prices, protection of localindustry and revenue generation? WHO, 2005.