UGANDA BUREAU OF STATISTICS · 1 THE REPUBLIC OF UGANDA Labour market transition of young people in...
82
1 THE REPUBLIC OF UGANDA Labour market transition of young people in Uganda Highlights of the School-to- Work Transition Survey 2015 UGANDA BUREAU OF STATISTICS May, 2016 Uganda Bureau of Statistics Statistics House Plot 9, Colville Street P.O. Box 7186, Kampala Tel: +256 414 706 000 Fax: +256 414 237 553 Email: [email protected] Website: www.ubos.org
Transcript of UGANDA BUREAU OF STATISTICS · 1 THE REPUBLIC OF UGANDA Labour market transition of young people in...

1
THE REPUBLIC OF UGANDA
Labour market
transition of young
people in Uganda
Highlights of the School-to-
Work Transition Survey 2015
UGANDA BUREAU OF STATISTICS
May, 2016
Uganda Bureau of Statistics Statistics House Plot 9, Colville Street P.O. Box 7186, Kampala Tel: +256 414 706 000 Fax: +256 414 237 553
Email: [email protected] Website: www.ubos.org
PREFACE
Employment
people globally suffer higher unemployment levels and their job
characterised by lower pay
Therefore, identifying the nature of employment challenge of the young
people at country level is
integrated policy interventions. The global jobs crisis has,
exacerbated the vulnerability of young people in terms of: i) higher
unemployment, ii) lower quality jobs for those who find work, iii) greater labour market
inequalities among different groups of young people, iv) longer and more insecure school
work transitions, and v) increased detachment from the labour market. At the global level, th
challenges are envisaged to be
(SDGs), and at the national level through the Vision 2040 and the Second National Development
Plan (NDP II).
To fulfil these policy strategies
people to deliver. It is, thus, important for government t
commitment in providing a conducive environment for gainful employment. This can be
achieved through collaboration with agencies such as trade unions, employers’ organisations,
international community and the active particip
people to make a good start in the world of work.
The “School-to-Work Transition Survey” (SWTS) was designed by the International
Labour Organisation (ILO) and implemented for the first time in Uganda by the
of Statistics (UBOS) in 2013 as one such collaboration. The second SWTS, undertaken by
UBOS in 2015, was sponsored by a partnership between the ILO and The MasterCard
Foundation through the Work4Youth (W4Y) Project. The W4Y Project entailed p
statistical agencies and policy
SWTS and assist governments and the social partners in the use of the data for effective policy
design and implementation. This is the report of
All stakeholders including
general public can use the results of
response to employment challenges
Ben Paul Mungyereza
Executive Director
Uganda Bureau of Statistics
Employment of young people is good for sustainable development.
people globally suffer higher unemployment levels and their job
characterised by lower pay and high insecurity than that of other age groups.
Therefore, identifying the nature of employment challenge of the young
people at country level is necessary for formulating evidence
integrated policy interventions. The global jobs crisis has,
exacerbated the vulnerability of young people in terms of: i) higher
unemployment, ii) lower quality jobs for those who find work, iii) greater labour market
inequalities among different groups of young people, iv) longer and more insecure school
rk transitions, and v) increased detachment from the labour market. At the global level, th
envisaged to be addressed through the 2015 UN Sustainable Development Goals
and at the national level through the Vision 2040 and the Second National Development
To fulfil these policy strategies, countries can rely on the creativity and innovation of young
people to deliver. It is, thus, important for government to provide a leadership role and
commitment in providing a conducive environment for gainful employment. This can be
achieved through collaboration with agencies such as trade unions, employers’ organisations,
international community and the active participation of donors in supporting efforts by young
people to make a good start in the world of work.
Work Transition Survey” (SWTS) was designed by the International
Labour Organisation (ILO) and implemented for the first time in Uganda by the
of Statistics (UBOS) in 2013 as one such collaboration. The second SWTS, undertaken by
UBOS in 2015, was sponsored by a partnership between the ILO and The MasterCard
Foundation through the Work4Youth (W4Y) Project. The W4Y Project entailed p
statistical agencies and policy-makers of 34 low- and middle-income countries to undertake the
SWTS and assist governments and the social partners in the use of the data for effective policy
design and implementation. This is the report of the second SWTS survey.
All stakeholders including Policy makers, Academia, Civil Society Organisations
use the results of SWTS to design and implement integrated polic
challenges faced by young people.
Uganda Bureau of Statistics
i
sustainable development. Young
people globally suffer higher unemployment levels and their jobs are
than that of other age groups.
Therefore, identifying the nature of employment challenge of the young
for formulating evidence-based
integrated policy interventions. The global jobs crisis has, further,
exacerbated the vulnerability of young people in terms of: i) higher
unemployment, ii) lower quality jobs for those who find work, iii) greater labour market
inequalities among different groups of young people, iv) longer and more insecure school-to-
rk transitions, and v) increased detachment from the labour market. At the global level, these
UN Sustainable Development Goals
and at the national level through the Vision 2040 and the Second National Development
, countries can rely on the creativity and innovation of young
o provide a leadership role and
commitment in providing a conducive environment for gainful employment. This can be
achieved through collaboration with agencies such as trade unions, employers’ organisations,
ation of donors in supporting efforts by young
Work Transition Survey” (SWTS) was designed by the International
Labour Organisation (ILO) and implemented for the first time in Uganda by the Uganda Bureau
of Statistics (UBOS) in 2013 as one such collaboration. The second SWTS, undertaken by
UBOS in 2015, was sponsored by a partnership between the ILO and The MasterCard
Foundation through the Work4Youth (W4Y) Project. The W4Y Project entailed partnership with
income countries to undertake the
SWTS and assist governments and the social partners in the use of the data for effective policy
Academia, Civil Society Organisations and the
to design and implement integrated policies in

ii
TABLE OF CONTENTS
PREFACE ................................................................................................................................................. i
LIST OF TABLES ................................................................................................................................... v
LIST OF FIGURES ................................................................................................................................ vii
LIST OF ACRONYMS ......................................................................................................................... viii
ACKNOWLEDGMENTS ....................................................................................................................... ix
1. INTRODUCTION AND MAIN FINDINGS ................................................................................. 1
1.1 Overview .................................................................................................................................... 1
1.2 Main Findings ............................................................................................................................ 2
1.3 Structure of the report ................................................................................................................ 4
2. OVERVIEW OF THE UGANDA LABOUR MARKET AND SURVEY METHODOLOGY ... 5
2.1 Introduction ................................................................................................................................ 5
2.2 The labour market in Uganda..................................................................................................... 7
2.3 School-to-work transition survey in Uganda: Objectives and Methodology ............................. 9
2.3.1 Objectives ............................................................................................................................... 9
2.3.2 Methodology ........................................................................................................................ 10
2.3.2.1 Questionnaire development .............................................................................................. 11
2.3.2.2 Survey design and sample size ......................................................................................... 11
2.3.2.3 Training of Field Staff ...................................................................................................... 11
2.3.2.4 Data Collection ................................................................................................................. 11
2.3.2.5 Data Processing ................................................................................................................ 11
2.3.3 Response Rates ..................................................................................................................... 11
2.3.4 Reliability of Estimates ........................................................................................................ 12
3. CHARACTERISTICS OF YOUNG PEOPLE ............................................................................ 13
3.1 Individual characteristics of young people .............................................................................. 13
3.2 Perceived household’s financial situation ................................................................................ 14
3.3 Migration status of young people............................................................................................. 15
3.4 Education Attainment of Young people ................................................................................... 17
3.5 Young people who were current students ................................................................................ 19
3.5.1 Field of study of current students ......................................................................................... 20
3.5.2 Current students by type of preferred future work place and job ......................................... 20
3.6 Activity Status of the young people ......................................................................................... 21

iii
3.7 Primary Life Goals of Young People ....................................................................................... 24
4. EMPLOYED YOUNG PEOPLE ................................................................................................ 25
4.1 Background Characteristics of Young People who were Employed ....................................... 25
4.2 Sectors and Occupations of Working Young People ............................................................... 25
4.3 Status in Employment .............................................................................................................. 28
4.4 Hours of Work ......................................................................................................................... 29
4.5 Characteristics of Wage Employment ...................................................................................... 29
4.5.1 Earnings of Young Workers in Paid Employment ............................................................... 30
4.5.2 Type, Nature and Duration of Contracts of Young Paid Employees ................................... 30
4.5.3 Access to Benefits and Entitlements by Young Paid Employees ......................................... 31
4.6 Self-Employment ..................................................................................................................... 32
4.6.1 Reason for Self-Employment ............................................................................................... 32
4.6.2 Source of Funding for the Self Employed ............................................................................ 33
4.6.3 Challenges of Self-Employment .......................................................................................... 33
4.7 Other Indicators of Job Quality ................................................................................................ 34
4.7.1 Qualifications Mismatch ...................................................................................................... 36
4.7.2 Informal Employment .......................................................................................................... 36
4.8 Job Security and Satisfaction ................................................................................................... 37
5. LABOUR UNDER-UTILISATION OF YOUNG PEOPLE ....................................................... 39
5.1 UNEMPLOYMENT AMONG YOUNG PEOPLE ..................................................................... 40
5.1.1 Introduction .......................................................................................................................... 40
5.1.2 Unemployment Levels of Young People ............................................................................. 40
5.1.3 Unemployed Youth by Duration of Job Search ................................................................... 41
5.1.4 Type of Job Sought by Unemployed Young People ............................................................ 42
5.1.5 Perception about Household overall financial situation ....................................................... 43
5.1.6 Main Obstacle of Finding Work for unemployed young People.......................................... 43
5.1.7 Not- Working, Available for Work but Not Looking for Work ........................................... 44
5.1.8 Discouraged young people ................................................................................................... 44
5.1.9 Job Search Method of the unemployed ................................................................................ 45
5.1.10 Unemployed Young People who had refused a Job ............................................................. 46
6. YOUNG PEOPLE NOT ECONOMICALLY ACTIVE ............................................................. 48
6.1 Reasons for Inactivity by Young People .................................................................................. 48

iv
6.2 Young people Neither in Employment nor Education /Training ............................................. 49
7. STAGES OF TRANSITION ....................................................................................................... 50
7.1 Concepts and Definitions ......................................................................................................... 50
7.2 Stages of transition of young people ........................................................................................ 51
7.3 Characteristics of Young People who transited ....................................................................... 52
7.3.1 Occupation of young people who transited .......................................................................... 52
7.3.2 Previous Activities of Young People who Transited ........................................................... 53
7.4 Average duration of transition for “transited” youth ............................................................... 54
7.5 Characteristics of Young People “In-transition” ...................................................................... 54
8. RELEVANT POLICY FRAMEWORK AND POLICY IMPLICATIONS ................................ 56
8.1 The relevant policies ................................................................................................................ 56
8.2 Long and medium term strategies and plans ............................................................................ 56
8.3 Policy Implications and Recommendations ............................................................................. 57
8.4 Conclusion ............................................................................................................................... 59
REFERENCES ....................................................................................................................................... 60
APPENDICES .................................................................................................................................... 61
Appendix i: Definitions of Labour concepts ....................................................................................... 62
Appendix ii: CVs for selected variables ............................................................................................. 64
Appendix iii: Additional Statistical Tables ......................................................................................... 69
Appendix iv: List of Field staff ........................................................................................................... 72

v
LIST OF TABLES
Table 2.1 Uganda’s Macroeconomic Indicators, GDP (2009/10=100); CPI (2005/06=100) ............. 5
Table 2.3: Key labour market indicators for working-age population (15+), 2012/13 ............................ 7
Table 2.4: Working-age population by educational attainment and sex (for those out of school), .......... 8
Table 2.5: Employed population (15+) by main branches of economic activity and sex, 2012/13.......... 9
Table 2.7: Response Rates (un-weighted) .............................................................................................. 12
Table 3.1: Distribution of young people by selected characteristics, 2015 ............................................ 13
Table 3.2: Young people who moved by area of residence and main reasons for movement, 2015 ..... 16
Table 3.3: Migration matrix for young people that moved by area of residence, 2015 ........................ 16
Table 3.4: Distribution of completed education level of young people, 2015 (percent) ........................ 17
Table 3.5: Percentage share of early school leavers by reason for leaving school, 2015 ....................... 18
Table 3.6: Educational attainment of young people by parental educational attainment, 2015, Percent 19
Table 3.7: Proportion of young people who were students, 2013 & 2015 (percent) .............................. 19
Table 3.8: Share of current students by level of education expected to complete, 2015 (Percent) ........ 20
Table 3.9: Distribution of field of study of current young students by sex, 2015 (percent) ................... 20
Table 3.10: Current students by desired future occupation and place of work, 2015 (Percent) ............. 21
Table 3.11: Distribution of preferred future job of current young students by sex, 2015 (Percent)....... 21
Table 3.12: Key labour market indicators of young people by sex, 2013 and 2015 (Percent) ............... 22
Table 3.13: Characteristics of the young people by economic activity and sex, (Percent) ................... 23
Table 3.14: Educational attainment of young people (out of school) by current activity status, (%) .... 23
Table 3.16: Primary life goals of young people by activity status, 2015 (percent) ................................ 24
Table 4.1: Employed young people by selected background characteristics, 2015 (Percent) ................ 25
Table 4.2: Distribution of young people in employment by Industry and sex, 2015 (percent) .............. 26
Table 4.3: Proportion of employed young people by sector and sex, 2013 and 2015 (Percent) ............ 26
Table 4.4: Share of young people who were employed by Occupation and Sex, 2015 (percent) .......... 27
Table 4.5: Employed young persons by status in employment and selected characteristics, 2015 (%) . 28
Table 4.6: Share of Young people who were employed by actual number of hours worked per week . 29
Table 4.7: Share of young wage or salaried workers by type of selceted characteristics, (Percent) ...... 31
Table 4.8: Share of young wage or salaried workers by access to benefits and sex, (Percent) .............. 32
Table 4.9: Young own-account workers by reason for self-employment and area of residence ............ 32
Table 4.10: Share of young self-employed by main challenges, sex and residence ............................... 33
Table 4.11: Shares of over-educated and under-educated workers by occupation, 2015 (Percent) ....... 36

vi
Table 4.12: Employed young people who liked to change their work by reason, 2015 (Percent) ......... 38
Table 5.0: Labour under utilization of young people ............................................................................. 39
Table 5.1: Unemployment rates (%) for young people by background characteristics, 2013 and 2015 41
Table 5.2: Young people without work, available for work but not actively seeking work, 2015 (%) .. 44
Table 5.3: Distribution of reasons for discouragement by sex, 2015 (percent) ...................................... 45
Table 5.4: Distribution of reasons for refusing a job, 2015 (Percent) .................................................... 47
Table 6.1: Proportion of young people not economically active by background characteristics, (%) ... 48
Table 6.2: Reasons for not being economically active, 2013 and 2015 (percent) .................................. 49
Table 6.5: Proportion of Young people NEET by Sex and Residence, 2013 and 2015 (Percent) ......... 49
Table 7.1: Stages of transition of young people by selected background characteristics, 2015 (%) ...... 51
Table 7.2: Young people who “Transited” by sub-category - 2015, Percentage share .......................... 52
Table 7.3: Share of young people who “Transited” by sub-category and occupation, 2015 (Percent) .. 53
Table 7.4: Distribution of young people who transited by previous activity to first job (flows), 2015 . 53
Table 7.5: Av. lengths of labour market transitions from first labour market entry by sex (months) .... 54
Table 7.6: Young people “in transition” by sub-categories - 2015, Percent .......................................... 55
APPENDIX TABLES
Table A3.0: Key Labour market indicators for Young people by selected characteristics, 2015 .......... 69
Table A7.1: Distribution of transition categories of young people by background characteristics, (%) 70
Table A7.2: “Transited” youth by sub-category - 2013, Percentage share............................................. 71

vii
LIST OF FIGURES
Figure 2.2: Primary and Secondary Education Enrolment, 2014 ............................................................. 6
Figure 3.1: Distribution of young people by level of perceived household financial situation, 2015 .... 14
Figure 3.2: Proportion of young people that moved by sex and residence, 2015 ................................... 15
Figure 3.3: Distribution of Educational attainment of young people and that of their parents, 2015 .... 18
Figure 4.1: Distribution of employed young people by occupation, 2013 and 2015 (Percent) .............. 27
Figure 4.2: Wage employment by sex, 2015 (Percent) .......................................................................... 29
Figure 4.3: Av. monthly wages of paid employees (’000) by education attainment, residence and sex30
Figure 4.4: Self employed young persons by main source of funding for starting current activity, (%) 33
Figure 4.5: Indicators measuring quality of youth employment, 2015 ( percent) .................................. 35
Figure 4.6: Changes in indicators measuring quality of youth employment, 2013 and 2015 (percent) . 35
Figure 4.7: Share of employed youth in informal employment by sex and residence, 2015 (Percent) .. 37
Figure 4.8: Share of employed young people who wanted to change job, 2015 (Percent) .................... 37
Figure 5.2: Distribution of unemployed youth by type of job sought, 2015 (percent) ........................... 42
Figure 5.3: Unemployed young people by household Financial Situation ............................................. 43
Figure 5.4: Young people who were unemployed by opinion about main obstacles to finding work,
2015 (percent) ......................................................................................................................................... 43
Figure 5.6: Job search method of unemployed young people, 2015 (percent) ....................................... 46
Figure 5.7: Unemployed young people who had turned down a job offer by sex, 2015 (%) ................. 46
Figure 5.8: The Unemployed that would not accept a job below a certain wage amount, 2015 (%) ..... 47
viii
LIST OF ACRONYMS
CsPro Census and Survey Processing Software
CV Coefficient of Variation
EA Enumeration Area
ILO International Labour Organisation
IMF International Monetary Fund
MDGs Millennium Development Goals
PPS Population Proportion to Size
SDGs Sustainable Development Goals
SE Standard Error
SWTS School To Work Transition Survey
UBOS Uganda Bureau of Statistics
UN United Nations

ix
ACKNOWLEDGMENTS
The School-to-work Transition Survey (SWTS) was implemented by the Uganda Bureau
of Statistics (UBOS) with Funding from the “Work4Youth” partnership between the
International Labour Organisation (ILO) Youth Employment Programme and the MasterCard
Foundation. The partnership supported the SWTS in 34 target countries between 2012 and
2016. In Uganda the first round of the survey was conducted in 2013 and the second round
took place between January and April 2015. UBOS is extremely grateful to the ILO for
supporting the program.
The Bureau is grateful for the support received from a number of stakeholders involved
in the survey. The persons involved in the survey design, data collection and analysis; the ILO
Work4Youth Team for financial and technical support throughout all the stages of the survey
and report production. The general Survey implementation and editing of the report were
supported by Sara Elder and Yonca Gurbuzer of ILO Work4Youth team.
The draft findings of the survey were presented in a workshop involving key stakeholders
in the labour market in Uganda. UBOS wishes to thank the participants of the workshop for
the validation of the results and for their feedback on the relevance of the survey to the
monitoring of the numerous youth-related policies and programmes in the country.
Finally, UBOS extends its gratitude to all the field staff who worked tirelessly to
successfully implement the data collection phase of the survey; and the survey respondents
who provided the data which formed the basis of this report.

1
1. INTRODUCTION AND MAIN FINDINGS
1.1 Overview
Uganda has a long term Comprehensive National Development Planning Framework
under the Vision 2014. This is segmented into six National Development Plans (NDPs), the
second NPD II launched in 2015, has the goal of “Strengthening Uganda‘s Competitiveness
for Sustainable Wealth Creation, Employment and Inclusive Growth”. These national
development strategies have been modelled around regional and international development
agenda such as the Millennium Development Goals (MDGs) and now the 2015 Sustainable
Development Goals.
Following the implementation of NDP I, findings showed that the percentage of people
living below the poverty line decreased from 24.3 percent in 2009/10 to 19.7 percent in
2012/13. There was also an improvement in life expectancy at birth from 51.5 years in
2009/10 to 54.5 years in 2011/12 and then 63.3 years according to the National Population and
Housing Census (NPHC) 2014. However, there was a drop in the literacy rate from 73 percent
in 2009/10 to 71 percent in 2012/13 (72 percent according to NPHC 2014) mainly due to high
school dropout rates at primary level. The percentage of the working labour force increased
from 75 percent in 2009/10 to 79 percent by 2011/12. The proportion of the labour force in
paid employment was 47.4 percent in 2012/13 while 17 percent of persons in employment
were poor. Unemployment rate in Uganda is still low even when statistics are presented
according to 2013 ICLS resolutions on work statistics. Using the 2013 definition on work
statistics, unemployment rate was 9.4 percent according to 2012/13 UNHS1.
Uganda’s big challenge remains labour underutilisation with more than one quarter of the
working population (27 percent) underutilized in relation to time, inappropriate skills and low
pay. The challenge impacts on the youth as evidenced with high youth unemployment rate of
13.3 percent (SWTS2013, relaxed definition)2. Identifying the nature and extent of youth
challenges at country level guides formulation of strategic and evidence based interventions.
The school-to-work transition survey (SWTS) are one of the key tools for detailed assessment
of youth characteristics and providing analytical information on the various challenges that
affect young men and women in making transition to the labour market. The ILO developed
the school-to-work transition survey (SWTS), which was conducted for first time in Uganda in
2013 with the second round in 2015 as household survey of youth aged 15–30 years. The
results of the survey can serve as a principle tool for monitoring the impact of youth
employment policies and programmes.
Like the 2013 report3 of the SWTS, this report summarizes the results of the second
round of the SWTS, implemented in Uganda in 2015, and is intended for the policy-makers
and social partners responsible for the implementation of youth-related policies and
programmes. The indicators generated from the survey and analysed in this report aim to
1UNHS is Uganda National Household Survey conducted every three years.
2Includes youth without work and available to work regardless of engagement in an active job search.
3JimrexByamugisha, Leyla Shamchiyeva and TakaakiKizu (2014): Labour market transitions of young women and
men in Uganda, Work4Youth Publication Series No. 24 (Geneva, ILO); http://www.ilo.org/employment/areas/youth-
employment/work-for-youth/publications/national-reports/WCMS_326255/lang--en/index.htm.

2
present a much more detailed picture of the youth labour market than is usually available from
standard surveys, including the labour force survey. As noted in the Uganda Vision 2040,
Unemployment among youth is a major national concern “becoming a social and economic
threat”. It is therefore, important to consider the quality of work made available to the youth
population, whether it provides the wages and security necessary to empower young Ugandans
to move towards self-sufficiency in their pending adulthood. The report also draws attention to
the path, duration and characteristics of young people’s transition from school to the labour
market, drawing conclusions based on these experiences to allow for a smoother transition.
1.2 Main Findings
A high proportion of the young people is not benefitting fully from the education system,
but some progress has been made in the area of education comparing the education levels of
the current cohort with previous cohorts.
Notable progress has been made in enrolment at both primary and secondary levels in the
Country in the current years. Results from the SWTS shows a progression in that the youth are
generally more highly educated than their parents. Young people today are more likely to have
easy access to education compared to those in the earlier years. Yet the survey findings reveal
that still as much as 68 percent of young people out of school had only completed primary
education and only 3.4 percent had completed tertiary education. The level of leaving school
early remains high; about half (51 percent) of young persons left school early with the
majority (almost 59 percent) being young females. Results also show that too many young
Ugandans were leaving school early to take up work. The SWTS results show that as high as
71 per cent of young working Ugandans were undereducated for the work they do. These are
concentrated in skilled agriculture, forestry and fishery work, plant and machine operators, and
assemblers and craft and related trades work. Under-education can have a negative impact on
the productivity of the worker and thus on the output of the place where he/she work and on
the young worker’s sense of economic security.
In an effort to improve on educational enrolment and attainment, Government has
invested in programmes such as the Universal Primary Education (UPE) and Universal
Secondary Education (USE). This is in addition to programs that existed such as affirmative
action for the girl child that involved adding 1.5 points for female students during intake at
public universities.
The vast majority of young Ugandans were working. However the quality of employment
was low for most of them, which results into the majority of young people and the country
failing to make the most out of their economic potential.
Nearly two thirds (64 percent) of the young persons aged 15-29 years in Uganda were
working in 2015, up from 63 percent in 2013. A sizable proportion of the youth at school were
also engaged in employment (15 percent). Of the employed, own-account workers represented
43 percent and contributing family workers represented nearly 28 percent. These two
categories, which are considered as vulnerable employment, accounted for 71 percent of the
youth. The high shares of vulnerable employment is worrying given that the results from the
SWTS that show that only 20 percent who had attained stable and/or satisfactory employment
arrived at that stage from a previous position of contributing family worker. If this trend

3
continues, young contributing family workers will remain in that category for a long time and
are unlikely to subsequently attain stable employment or satisfactory self-employment.
Statistics on labour quality indicators showed that informal employment was almost
universal among young workers with 92 percent engaged here. In addition nearly three in
every four young workers aged 15-29 years were classified under irregular employment and
only 18 percent of young people in paid employment benefitted from a written contract. Low
pay was common among the young workers in Uganda with 60 percent of paid young
employees taking home less than the average monthly wages/salaries.
The unemployment rate among young people in Uganda was 6.5 percent at the time of
the survey, with the more educated and the women being more unemployed.
The SWTS results indicate that the unemployment rate among young people in 2015,
thus the share of persons without work, available and actively looking for work among the
economically active population was 6.5 percent. The unemployment rate among young people
increased with each additional level of education attainment with the tertiary level
unemployment rate being 11.8 percent and that with no education being 3.6 percent. In
addition, young women had a higher unemployment rate (7.4 percent) compared to the males
(5.5 percent).
Although the unemployment rate was higher among the better educated, the survey
results indicate that investing in education results into positive returns to the young people in
form of wages and access to better jobs.
Results from the SWTS indicate that young persons with higher levels of education have
higher chances of accessing better jobs. Among the youth who completed their labour market
transition, those with the highest education level were three times more likely to find a stable
job than to remain in self-employment. The results also show that investing in education
brings a clear pay-off in terms of higher wage potential. The average monthly wage increased
with the level of education with the highest impact felt at vocational and tertiary level. Young
persons of vocational level of education earned more than two times the wage of a young paid
employee with no education.
Gender differentials were observed in a number of indicators related to school to work
transition among the young persons
Although Uganda has taken various steps aimed at reducing the gender gap in the
education system, the proportion of females classified as Neither in Education nor
Employment nor Training - NEET (about 19 percent) was nearly three times that of males
(7percent). The findings also indicate that 15 percent were female inactive non-students with
plans for future work compared to only 4 percent of males. Male young persons had higher
chances of completing their school to work transition compared to females. Regarding
transition categories, there was no major gender differentials among young people who
completed their transition but more females were still in-transition (57 percent) compared to
males (54 percent) and more males who had not started their transition compared to females
(18 percent and 16 percent respectively).
More men than women attain wage employment; the majority of the self-employed young
persons in Uganda did not benefit from institutional financial support.

4
The proportion of wage earners among the young workers constituted about a quarter of
the total workforce of the young persons with the males (32 percent) being more engaged in
wage employment compared to their female counterparts (18 percent).The proportion of the
self-employed young persons in the country constituted three quarters of the working young
persons, including own account workers (43 percent), contributing family workers (28
percent) and employers (4 percent). The SWTS results indicate that 47 percent of the young
self-employed persons indicated that that they did not need funding to start their present
activity. For those who needed funding, own savings (29 percent) and family and friends (20
percent) served as the main source of financing. This information on self-employment
highlights limitations of institutional lending opportunities. Further proof is shown by only a
quarter (26 percent) of the self-employed young persons indicated that their main challenge in
their work was limited financial resources.
About one quarter (27 percent) of the young people successfully completed their labour
market transition and the period of completion was still quiet lengthy, an average of nearly 3
years when direct transition is excluded.
About one quarter (27 percent) of the young people had transited to a stable employment
or satisfactory self or temporary employment with majority still in transition (56 percent) and
about 17 percent in “transition-not-started” category”. The biggest proportion of the young
people (15-29 years) who were still “in-transition” was those in non-satisfactory self-
employment (40 percent).There were no gender differentials between among young people
who completed transition.
More young people had transited to satisfactory self or temporary jobs (66 percent) as
compared to stable employment (34 percent). The young people that completed their transition
came through mainly direct transition (86 percent) and about 7 percent who transited from
unemployment. Excluding direct transition, it took a young person on average 31 months to
attain a first job deemed to be either stable or satisfactory.
1.3 Structure of the report
Section 2 sets out the socio-economic and labour market conditions for Uganda and
introduces the objectives and the methodology of the survey process. Section 3 presents the
results of the SWTS with details on major characteristics of the youth and their labour market
outcomes. Section 4 highlights youth employment detailing by sector and occupation with
unemployment presented in section 5 and inactive population in section 6.The labour market
transition classifications and characteristics are handled in section 7 of the report. The section
also discusses the length of time that young men and women spent in transition and traces the
various labour market experiences they had along the way. The final section of the report
(section 8) presents policy implications with strategic suggestions recommended.

5
2. OVERVIEW OF THE UGANDA LABOUR MARKET AND SURVEY METHODOLOGY
2.1 Introduction
Uganda is governed under the decentralisation arrangement and according to the Uganda
constitution (1995), chapter Eleven, 176 (g), the Local Governments are responsible for
oversight over the performance of persons employed by the Government to provide services in
their areas and to monitor the provision of Government services or the implementation of
projects in their areas. The Local Governments are based on the district as a unit under which
there are lower local governments and administrative units. The country has an area of
241,039 square kilometres and is administratively divided into 111 districts and Kampala
Capital City Authority.
Over the period 2010/11to 2014/15, Uganda’s GDP growth averaged 6.0 percent per
annum with the highest growth rate of 9.7percent registered in 2010/2011. The average per
capita income in the same period was USD 719. In 2014/15, the services sector had the highest
contribution to GDP of 48 percent, while contribution of agriculture was 24 percent and
Industry was 20 percent. Uganda’s current population growth rate is 3.0 percent, according to
the 2014 National Population and Housing Census.
Table 2.1 Uganda’s Macroeconomic Indicators, GDP (2009/10=100); CPI (2005/06=100)
Indicator 2010/11 2011/12 2012/13 2013/14 2014/15
Real GDP Growth Rate at Market prices (percent) 9.7 4.4 3.3 4.8 5.0
Average Per Capita Income (USDs)
638 710
732
778
737
Fiscal Deficit Excluding grants (percent of GDP) 5.5 4.4 5.0 5.1 5.7
Domestic Revenue (percentof GDP) 13.6 11.2 11.5 11.9 12.8
Expenditure (percentof GDP) 19.1 15.6 16.5 17.1 18.7
Headline Inflation 6.5 23.5 5.6 6.7 2.7
Sector contribution to GDP at Market prices (percent)
Agriculture
24.7 26.5
25.3
25.1
23.7
Industry
20.4 21.3
20.8
20.4
20.4
Services
47.7 45.5
46.8
47.0
47.6
Net Taxes on products
7.2 6.8
7.1
7.5
8.3
Source: Uganda Bureau of Statistics
The year 2014/15 registered lower headline inflation rate of 2.7 percent as compared to
the 6.7 percent that was reported in 2013/14. The highest inflation rate in the last five years of
23.5 percent was registered in 2011/12.
Uganda has a fast growing population which increased from 9.5 million in 1969 to 34.6
million according to NPHC 2014. As a result of the high fertility rate, Uganda has one of the
youngest populations in the world. According to the National Population and Housing Census

6
2014, the population aged between 0-14 years accounted for 47.9 percent of the total
population. The population aged below 18 years constituted 51 percent, the working age
population (14-64 years) was 52.2 percent, the primary school age population (6-12 years)
was21.3 percent, and elderly persons (60 and above years) was only 3.7 percent.The
population pyramid in Figure 2.1 shows the graphical presentation of age and sex composition
of a population. The pyramid shows the expected pattern of declines in the length of the bars
for each group with advancing age.Uganda’s rapidly growing population places great pressure
on the economy that struggles to keep up. The country’s high fertility coupled with a young
population transforms into a continuation in the population growth momentum even if fertility
reduced but also a great opportunity for an abundance of work force. What remains is for the
work force to be transformed into an economically productive one.
Figure 2.1: Population Pyramid
Source: National Population and Housing Census 2014
The country has a responsibility of providing quality education to its large youthful
population. Enrolment at the primary school level increased from 6.5 million in 2000 to over
8.8 million in 2014 (of which female were 50 percent). As presented in Figure 2.2, the primary
school net enrolment ratio was 97 percent in 2014 while the pupil teacher ratio was 46 percent.
The secondary school net enrolment ratio was only 26 percent in 2014 with student teacher
ratio of 22.
Figure 2.2: Primary and Secondary Education Enrolment And Pupil-Teacher Ratio, 2014
Source: Ministry of Education, Science, Technology and Sports (Annual Statistical Abstract 2014)
15 10 5 0 5 10
0 - 4
10-14
20 - 24
30 - 34
40 - 44
50 - 54
60 - 64
70 - 74
80 - 84
90+
Male Female
97
26
46
22
0
20
40
60
80
100
Primary Secondary
Enrolmen
t, pe
rcen
t
Level
Net Enrolment Ratio
Pupil Teacher Ratio

7
2.2 The labour market in Uganda
The labour market in Uganda is characterized by a fast-growing working-age population.
The Uganda National Population and Housing Census 2014 established that 78 percent of the
working age population (14-64 years) was working. According to the UNHS 2012/13, the
labour force participation rate of persons aged 15+ years was 86 percent. Men were more
active than women, with the labour force participation rate at 89 percent for men and 82
percent for women. The rural population of working age was only somewhat more
economically active than the urban population (88 and 79 percent, respectively (see Table
2.2).
Despite recent growth in wage employment, informal employment continues to be
predominant in Uganda. The 2012/13 household survey estimated that 3.1 million people
representing 79 percent of working persons were employed in the informal sector outside
agriculture (table 2.5). Male workers (78 percent) and female workers (80 percent) were
almost equally engaged in the informal sector employment.
Table 2.2: Key labour market indicators for working-age population (15+), 2012/13
Labour Market Indicators Male Female Rural Urban Total
Working population (‘000) 6,890 7,108 10,804 3,194 13,998
Unemployed (‘000) 103 179 141 141 282
Labour force (‘000) 6,994 7,287 10,945 3,335 14,280
Total employment outside agriculture (‘000) 2,271 1,618 2,043 1,847 3,889
Portion in Informal sector outside Agriculture (percent) 77.8 80.2 75.8 82.1 78.8
Employment in the informal sector outside agriculture (‘000) 1,767 1,297 1,549 1,515 3,064
Employment-to-population ratio (Percent) 87.5 80.7 86.7 75.9 83.9
Labour force participation rate (percent) 88.8 82.8 87.8 79.2 85.6
Unemployment rate (strict definition) (percent) 1.5 2.5 1.3 4.2 2.0
Unemployment rate (relaxed definition) (percent) 2.6 6.1 3.1 8.6 4.4
Source: Estimates based on Uganda National household Survey 2012/13
With a fast growing population and low levels of education, the country is facing large
numbers of low-skilled labour market entrants every year. A successful programme of
universal secondary education would significantly reduce the annual number of new labour
force entrants as many young people would be engaged in secondary education full time.
Educational is one of the key requirements for a country to have a high quality and productive
labour force. More females (28 percent) than males (12 percent) did not have any formal
education. Overall, more males than females attained different levels of formal education
(Table 2.3).

8
Table 2.3: Working-age population (15+) by educational attainment and sex (for those out of school), 2012/13
Education Attainment Male Female Rural Urban Total
% % % % %
No formal schooling 12.3 27.6 23.9 11.6 20.8
Primary 56.1 51.4 58.2 40.1 53.5
Secondary 20.9 14.8 12.7 31.4 17.5
Post primary specialised training 4.5 2.3 2.2 6.3 3.2
Post-secondary specialised training 3.2 1.9 1.6 4.9 2.5
Degree and above 1.7 0.9 0.2 4.3 1.3
Do not know 1.4 1.2 1.2 1.5 1.3
Total (Percent) 100 100 100 100 100
Total Population (Number, ‘000) 6,186 7,644 10,292 3,538 13,831 Source: Estimates based on Uganda National household Survey 2012/13
The 2012/13 Uganda National Household Survey revealed that agriculture employs the
highest percentage of the working population. The proportion was higher for females (77
percent) than males (66 percent). Relatively, more people in the rural areas (82 percent) are
employed in agriculture compared to urban areas (35 percent) see Table 2.4. Trading was
more prominent in urban areas (22 percent).
The disaggregation by occupation shows that the majority of the working population was
employed as skilled agricultural and fisheries workers. More females (70 percent) had this as
their occupation compared to the males (58 percent). This was followed by elementary
occupations where about 14 per cent of the males were employed compared to 11 per cent of
the females.
The majority of the working population were own account workers for both males and
females. Out of the males, 53 percent were own account workers compared to women who
were slightly higher at 59 percent. These were followed by employees who constitute about 20
per cent of the working population.

9
Table 2.4: Employed population (15+) by main branches of economic activity and sex, 2012/13
Economic Activity/Occupation Male Female Rural Urban Total
Main Branch of Economic Activity
Agriculture, forestry and fishing 66.2 76.5 82.3 34.8 71.4
Trade 9.0 10.1 5.8 22.3 9.6
Manufacturing 5.6 3.5 3.3 8.8 4.5
Education 2.9 2.3 1.9 4.8 2.6
Transport and storage 4.3 0.2 1.5 4.8 2.2
Construction 4.2 0.1 1.4 4.6 2.1
Other service activities 2.4 1.7 1.1 5.1 2.0
Accommodation and food 0.6 2.4 0.7 4.3 1.5
Others 4.7 3.1 2.2 10.6 3.9
Occupation
Skilled agricultural and fisheries workers 58.4 69.9 74.1 30.9 64.2
Elementary occupations 13.9 10.7 11.8 13.9 12.3
Service workers 9.9 12.7 6.3 28.4 11.3
Craft and related workers 7.9 2.9 4.1 9.8 5.4
Professionals 3 2.1 1.3 5.1 2.5
Plant and machine operators 4.1 0.1 1.2 5.1 2.1
Technicians and associate professionals 1.6 0.9 0.9 4.1 1.3
Others 1.1 0.5 0.4 2.5 0.8
Missing 0.1 0.2 0.1 0.3 0.1
Status in Employment Own account workers 52.8 58.7 57.9 48.6 55.8
Contributing family workers 19.1 26.8 26.1 12.4 23
Employees 26.1 13.4 14.8 36 19.7
Employers 1.8 0.9 1 2.6 1.3
Volunteers 0.2 0.2 0.1 0.4 0.2
Total 100 100 100 100 100
Number 6,890 7,108 10,804 3,194 13,999 Source: Estimates based on Uganda National household Survey 2012/13
2.3 School-to-work transition survey in Uganda: Objectives and Methodology
2.3.1 Objectives
The “Work4Youth” project of the ILO in partnership with The Master Card Foundation
is helping countries to tackle the unprecedented youth employment crisis through a multi-
pronged approach geared towards pro-employment growth and decent job creation following
the resolution “The youth employment crisis: A call for action” by the ILO. To assist
governments and the social partners in the use of the data for effective policy design and
implementation, the “Work4Youth” project collaborates with statistical partners and policy-
makers of 34 low- and middle-income countries to undertake the school-to-work transition
survey (SWTS).

10
The broad objective of the SWTS is to generate detailed information on the challenges of
young men and women in transition to the labour market. The SWTS offers more detailed
additional data over household based labour force surveys. It includes questions of the history
of economic activity of young people providing an opportunity to produce indicators on their
labour market transitions. The analytical framework of the SWTS allows for the application of
indicators relating to areas of ‘good’ jobs. The attainment of stable and/or satisfactory
employment is the prime goal of most young people in developing countries. The stages of
transition applied to the SWTS results are based on the various combinations of the two
variables of stability and satisfaction.
2.3.2 Methodology
The school-to-work transition survey (SWTS) is a detailed household survey covering
15–30 year-olds (see box 1). It is utilised to generate information on the current labour market
situation, the history of economic activities and the perceptions and aspirations of young
people. Information at sub-national level is not presented except in a few cases where it has
been analysed at four regional levels. However, detailed information is disaggregated by sex
and residential status4.
Box 1. Definition of Young People
While in other contexts, a youth is defined as a person aged between 15 and 24 (United Nations) or between 15 and 35 (African Union), in Uganda, a youth is a person aged 18 to 30 years. For the purpose of the SWTS the upper age limit is 30 years. However, this report discusses labour market condition and transition of young people aged 15-29 years in line with the “Work4Youth” project for the SWTS 2015. This recognizes the fact that some young people remain in education beyond the age of 24, and allows the opportunity to capture more information on the post-graduation employment experiences of young people.
Uganda undertook the first round of the SWTS in 2013 to collect and analyse information
on the various challenges that affect young men and women as they make the transition to
working life. Both rounds of the survey were implemented by the Uganda Bureau of Statistics
(UBOS). The fieldwork of the second round (SWTS 2015) took place in January through April
2015. Funding for the survey came from the “Work4Youth” partnership between the ILO
Youth Employment Programme and The MasterCard Foundation (see box 2).
Box 2. Work4Youth: An ILO project in partnership with The MasterCard Foundation
The Work4Youth (W4Y) Project is a partnership between the ILO Youth Employment Programme and The MasterCard Foundation. The project has a budget of US$14.6 million and will run for 5 years to mid-2016. Its aim is to “promote decent work opportunities for young men and women through knowledge and action”. The immediate objective of the partnership is to produce more and better labour market information specific to youth in developing countries, focusing in particular on transition paths to the labour market. The assumption is that governments and social partners in the project’s 34 target countries will be better prepared to design effective policy and programme initiatives once armed with detailed information on:
• what young people expect in terms of transition paths and quality of work; •what employers expect in terms of young applicants; •what issues prevent the two sides – supply and demand – from matching; and •what policies and programmes can have a real impact.
For more information on the project, see website: www.ilo.org/w4y.
4 Although Uganda has three identifiable residential statuses, namely, Rural, Urban and Peri-urban, the SWTS-2015 considered two statuses. These included Rural and Urban areas. The Urban area included Kampala City and other gazette Urban areas like Municipalities, Town
Councils and Town Boards. Whatever area was not gazetted as Urban by the time of the survey was considered as Rural area.

11
2.3.2.1 Questionnaire development
The standard ILO SWTS questionnaire developed in 2013 was adapted to the national
context based on the consultative process between the ILO and UBOS. The questionnaire was
detailed in nature and collected information on personal information, family and household
information, formal education/ training, activity history, working criteria, activities, and non-
working youth. A pre-test exercise was carried out before the finalization of the questionnaire.
2.3.2.2 Survey design and sample size
The SWTS sample was designed to allow reliable estimation of key indicators for
Uganda and rural-urban. A two-stage stratified sampling design was used. At the first stage,
Enumeration Areas (EAs) were grouped by rural-urban location, then drawn using Probability
Proportional to Size (PPS). A total of 200 EAs (160 rural and 40 urban) were selected using
the 2014 Uganda Population and Housing Census Mapping Frame. For the 200 PSUs (EAs)
that were selected from the 2014 PHC sampling frame, a household listing process was carried
out to update the number of households in these EAs. At the second stage, 15 households per
EA, which were the Ultimate Sampling Units, were drawn using Systematic Sampling. This
gave a total sample size of 3,000 households. When determining the required sample size, the
degree of precision (reliability) desired for the survey estimates, the cost and operational
limitations, and the efficiency of the design were taken into consideration. Basic information
was gathered from all persons within the sampled households and the youth aged 15-30 years
were filtered out for administration of the detailed questions.
2.3.2.3 Training of Field Staff
The training of field staff was carried out during the period 07th- 13
th January 2015. In
total 34 persons were centrally trained. The training included lectures, class exercises, mock
interviews and field practice. The trainees were later divided into 8 field supervisors, 24
enumerators and 2 editors. The field staff were recruited and deployed based on fluency of
local languages spoken in the respective regions of deployment.
2.3.2.4 Data Collection
A centralized approach to data collection was employed whereby eight mobile field
teams hired at the headquarters were dispatched to different sampled areas. Each team
comprised one Supervisor, three Enumerators and a Driver.
2.3.2.5 Data Processing
At the Central Office a team of two Data Editors, Data Entry Staff and Computer
programmers were assigned to undertake respective survey activities. Questionnaires were
retrieved from the field and edited before data capture. A data capture application was
developed for data entry and processing under the Cspro platform. Machine editing was also
carried out to clean errors in the captured data set before the commencement of data analysis
2.3.3 Response Rates
The actual fully covered sample for the SWTS was 2,712 households, with a total
response rate of 90 percent, as shown in Table 2.7. The response rate was slightly higher in
rural areas (91 percent compared to urban areas (89 percent).
The individual SWTS questionnaire targeted all persons aged 15-30 years. A total of
3,198 individuals aged 15-30 years were found from the responding households. Completion

12
of the individual interviews was successful with 3,049 individuals yielding an individual
response rate (complete interview) of 95 percent with no marked differences observed by
residence (See Table 2.5).
Table 2.5: Response Rates (un-weighted)
Result Code Rural % Urban % Total %
Household interviews
Completed (C) 1,761 81.2 611 73.6 2,372 79.1
Partially done (PD) 120 5.5 44 5.3 164 5.5
No contact (NC) 29 1.3 12 1.4 41 1.4
Refused (R) 1 0.0 6 0.7 7 0.2
Temporarily absent (TA) 34 1.6 17 2.0 51 1.7
Vacant, demolished (V) 34 1.6 25 3.0 59 2.0
Listing error (LE) 3 0.1 1 0.1 4 0.1
Other reasons/missing 187 8.6 114 13.7 302 10.1
Total 2,169 100.0 830 100.0 3,000 100.0
Household Response Rate
90.5
88.6
90.0
Individual interviews
Persons aged 15-30 2,374 824 3,198 Eligible persons interviewed fully for SWTS questions
2,274 768 3,049
Eligible respondents response rate 95.8 93.2 95.1
2.3.4 Reliability of Estimates
The estimates presented in this report were derived from a scientifically selected sample
and analysis of survey data was undertaken at national and rural-urban levels. In a few cases,
regional estimates have been provided. As presented in Appendix ii, the sampling Errors show
that the indicators are quite reliable. The Coefficients of Variation (CVs) of all indicators
presented in this report were low (about 10 or less). During the analysis, variables with at least
30 valid responses were deemed reliable enough to be presented given that the CVs were
good. Consequently, some variables with fewer observations were merged into related groups
to ensure that reliability is maintained.

13
3. CHARACTERISTICS OF YOUNG PEOPLE
3.1 Individual characteristics of young people
Young people are a wealth of human resource required for socio-economic development
in a country. The 2015 SWTS revealed that there are more young people in the rural (about
seven of every ten young people) than urban areas as shown in table 3.1. More male (75
percent) than female (70 percent) were residing in the rural areas. Regional distribution
showed that minority of the young people (about 19 percent) were from the Western region
and the other three regions had an almost equal share of the remaining young people. Majority
of the females (31 percent) were from the Central region while 29 percent of the males were
from the Northern region.
With regard to age, 41 percent of the young people were teenagers aged 15 to19 years
followed by young persons aged 20-24 years who were 33 percent and the 25 to 29 year-olds
who constituted 26 percent. Among the teenagers, the males (45 percent) were more than their
female counterparts (38 percent) contrary to the 20-24 and 25-29 age groupings where the
females were more than males.
Table 3.1: Distribution of young people by selected characteristics, 2015
Characteristics
Male Female Total
Number (‘000) percent
Number (‘000) percent
Number (‘000) percent
Household head 1,147 29.8 218 4.7 1,366 16.1
Age group 15–19 1,746 45.3 1,765 37.9 3,511 41.3 20–24 1,176 30.5 1,592 34.2 2,767 32.5 25–29 931 24.2 1,297 27.9 2,228 26.2
Area of residence
Urban 967 25.1 1,401 30.1 2,368 27.8 Rural 2,886 74.9 3,253 69.9 6,139 72.2
Region Central 996 25.9 1,419 30.5 2,416 28.4 Eastern 998 25.9 1,141 24.5 2,138 25.1 Northern 1,106 28.7 1,259 27.1 2,366 27.8 Western 752 19.5 835 17.9 1,587 18.7
Marital status Single / Never married 2,737 71 2,209 47.5 4,946 58.2 Married 1,089 28.3 2,257 48.5 3,346 39.4 Separated / Divorced 26 0.7 172 3.7 198 2.3 Widowed 0 0.0 13 0.3 13 0.2
Current schooling status
Never went to school 163 4.2 357 7.7 520 6.1 Left before graduation 1,802 46.8 2,553 54.9 4,355 51.2 Completed school 343 8.9 457 9.8 801 9.4 Currently attending school 1,544 40.1 1,286 27.6 2,831 33.3
Level of educational
attainment**
No education 163 7.1 357 10.6 520 9.2 Incomplete Primary 1,024 44.4 1,484 44.2 2,508 44.2 Primary 552 23.9 824 24.5 1,375 24.3 Secondary 374 16.2 449 13.4 823 14.5 Vocational 108 4.7 143 4.3 252 4.4 Tertiary 87 3.8 104 3.1 191 3.4
Total (‘000) 3,853 100 4,654 100 8,507 100 Note: 1. **Considers young people currently not attending school
2. Vocational education is for those with professional certificate
3. Tertiary includes professional diploma, degree and above

14
Statistics on marital status showed that more than half of the young people (58 percent)
were single or had never been married. There was greater proportion of males (71 percent)
than females (48 percent). This could be attributed to the fact that girls especially those in the
rural areas, where majority of them are, marry off at an early age compared to boys. As shown
in the table, almost twice as many females (49 percent) than males (28 percent) were married.
Table 3.1 further reveals that six (6) percent of the young people (4 and 8 percent for
male and female respectively) have never gone to school despite the existence of universal
Primary and Secondary school and 33 percent were currently in school. Twice as many
females (8 percent) than males (4 percent) had never been to school.
Of the young people currently not in school, 44 percent never completed primary level of
education while 9 percent had never been to school for formal education. A combined share of
about 8 percent had completed either vocational or tertiary education with some sex
differential (9 percent and7 percent for males and females respectively). The higher the level
of education, the less the attainment rate, a similar pattern observed for both young males and
females.
3.2 Perceived household’s financial situation
The financial situation of households has significant impact on access to the basic needs
of life including health and education. Individuals from perceived ‘wealthy’ households were
more likely to attend school than those from ‘poor’ households. Wealthy families can ably
send their children to school let alone provide them with start-up capital upon completing
school. During the survey, young people were asked to rank their households according to its
financial situation, ranging from poor to well off. Figure 3.1 below shows that half of the
young people felt that their household was ‘poor’. Only 13 percent of the young people
perceived their household to be ‘well off’.
Figure 3.1: Percentage distribution of young people by level of perceived household financial situation, 2015
Figure 3.1 further shows that most young people in urban areas (46 percent) described
their household as ‘average’ unlike their counterparts in rural areas (54 percent) who perceived
their household’s financial situation as ‘poor’.
25.8
45.9
28.3
8.6
27.3
64.1
13.4
32.5
54.1
0
10
20
30
40
50
60
70
Well Off Average Poor
Pro
po
rtio
n,
pe
rce
nt
Perceived Household Financial Situation
Urban
Rural
Total

3.3 Migration status of young people
The young people
why they moved to the current place of residence.
the young people moved
had moved.
Figure 3.2: Proportion of
The main reason attributed to movement among
followed by 23 percent ‘to work/for employment’. About
moved for education/training purposes implying that majority study within their local home
towns. Most males (35 percent) mov
of marriage (Table 3.2)
Table 3.2also shows that 65 percent of the
by 15 percent from Metropolitan
another country. Most of the young people that moved (57 percent
areas.
11.6
0
5
10
15
20
25
30
Male
Pro
po
rtio
n,
Pe
rce
nt
tion status of young people
young people were also asked about their previous areas of residence and reasons
why they moved to the current place of residence. Figure 3.2 shows that about 18 percent of
the young people moved. Almost twice as many females (22 percent) than males (12 percent)
Proportion of young people that moved by sex and residence, 2015
The main reason attributed to movement among young people was ‘marriage’
nt ‘to work/for employment’. About one in every ten
moved for education/training purposes implying that majority study within their local home
(35 percent) moved to work and most females (47 percent) moved because
(Table 3.2).
shows that 65 percent of the young people moved from rural areas followed
percent from Metropolitan i.e. gazetted urban areas with the least (1
Most of the young people that moved (57 percent) currently reside
22.4
13.8
27.2
Female Urban Rural
Sex Residence
15
were also asked about their previous areas of residence and reasons
Figure 3.2 shows that about 18 percent of
s (22 percent) than males (12 percent)
by sex and residence, 2015
was ‘marriage’ (a third)
one in every ten young people
moved for education/training purposes implying that majority study within their local home
percent) moved because
rom rural areas followed
urban areas with the least (1 percent) from
) currently resided in rural
17.5
Total

16
Table 3.2: Percentage distribution of young people by area of current residence, previous residence and main reasons for movement, 2015
Characteristics Male Female Total
Current residence
Urban 43.7 43.1 43.3
Rural 56.3 56.9 56.8
Area of previous residence
Rural area 59.0 67.6 65.0
Small town* 13.0 8.4 9.8
Metropolitan area 15.9 15.1 15.3
Large city 8.6 5.1 6.2
Another country 1.3 0.9 1.0
Missing 2.1 2.9 2.7
Main reason
To accompany family 33.1 18.8 23.1
Education/training 16.3 7.1 9.9
Marriage 0.6 48.2 33.8
To work/for employment 35.2 18.1 23.3
Others** 14.8 7.8 9.9
Total
Total (‘000) 100
449 100 1,042
100 1,491
*Small towns are ungazetted urban areas. **Others included Farming, draught, landslides, war, etc.
Further analysis of the young people that moved showed that majority of those that
moved from rural areas still reside in rural areas similar to those from metropolitan (gazetted
urban) areas as shown in table 3.3 below. About 36 percent of the young people moved from
rural to urban areas and surprisingly a similar percentage moved from metropolitan to rural
areas. Three in every ten of the young people moved from the large city to rural areas.
Table 3.3: Migration matrix for young people that moved by area of previous residence and current residence, 2015
Area of previous residence Area of current residence
Rural Urban Total
Rural area 64.1 35.9 100
Small town* 61.4 38.6 100
Metropolitan area 36.2 63.8 100
Large city 33.5 66.6 100
Total 57.4 42.6 100
*Small towns are ungazetted urban areas.

17
3.4 Education Attainment of Young people
Education is an essential part of one’s life both personally and socially. Through
education, young people: become economically independent which is a stepping stone to
national economic growth, adapt to newer techniques of production, increase their
employability potential, among others. The Government of Uganda introduced the Universal
Primary Education (UPE) in 1997 and Universal Secondary Education (USE) in 2007 to
ensure that all children of school going age (especially those from poor backgrounds) are
provided with free primary and secondary education (MoES, 20135).
Table 3.4 shows that, among young people out of school, 24 percent had completed
primary education and 44 percent had incomplete primary. About 8 percent completed either
tertiary or vocational training. Except for primary level, more males attained higher education
levels than females for the rest of the levels. More young people from urban areas attained
higher education levels.
The proportion of young people that attained vocational and tertiary education in urban
areas more than doubled that in rural areas (14 percent and 5 percent in urban and rural areas
respectively).In urban areas, more young people attained tertiary (9 percent) than vocational
education (5 percent) while in rural areas vocational education was more common than tertiary
(4 and 1 percent, respectively).
Table 3.4: Distribution of completed education level of young people, 2015 (percent)
Level of Education
Sex Residence Total
Male Female Rural Urban
No education 7.1 10.6 11.6 3.1 9.2
Incomplete Primary 44.4 44.1 50.8 27.5 44.2
Primary 23.9 24.5 23.4 26.4 24.3
Secondary 16.2 13.3 8.9 28.7 14.5
Vocational 4.7 4.3 4.2 5.1 4.4
Tertiary 3.8 3.1 1.1 9.1 3.4
Total 100 100 100 100 100
Early school leavers are those young people who left school without completing all the
grades at that given education level. In every ten young persons, five left school early, the
majority (almost 59 percent) being young females. More than half of young people (59
percent) reported that they left school early because it was too expensive while 9 percent left
school early because they were not willing to attend school further. The portion that left school
as a result of pregnancy was 14 percent. Pregnancy and early marriage prevents young females
from realising their full academic and economic potential. Survey findings revealed that twice
more females than males left school early because their parents did not want them to go to
school. About 6 percent of the young people left school early due to poor academic progress
(Table 3.5).
5 Ministry of Education and Sports Statistical Abstract, 2013

18
Table 3.5: Percentage share of early school leavers by reason for leaving school, 2015
Characteristics Sex
Male Female Total
Distribution of Early school leavers 41.4 58.6 100
Share of early school leavers 48.8 59.4 54.5
Main reason
Too expensive 64.4 55.5 59.2
Not willing to attend further 11.8 7.0 8.9
Pregnancy 0.0 13.7 8.2
Poor academic progress 6.1 5.7 5.8
Sickness or calamity in family 5.1 5.7 5.4
Further schooling not available 2.2 2.6 2.4
Parents did not want 1.4 2.8 2.2
Other Reasons 9.1 7.2 7.8
Total 100 100 100
Total ( '000) 1,802 2,553 4,355
The education level of a parent is vital to a child’s education achievement and
behavioural outcomes. Educated parents know the value of education and are thus in position
to encourage their children to go to school and raise them in a way that they have the self-
drive in terms of academic abilities with positive attitude towards learning. Figure 3.3 shows
that, among young people’s parents, father had relatively higher levels of completed education
compared to mothers. The proportions of those with incomplete primary or no education
remained high for both.
Figure 3.3: Percentage distribution of educational attainment of young people and that of their parents, 2015
Others includedyoung people that didn’t know the edcucation attainment of their parents and those whose parents’ education
attainment is not any of the mentioned categories.
A comparison of the young people and their parent’s education level showed that overall:
more than two-thirds of the young people had the same education levels attained as their
parents (72 percent and 89 percent in comparison with father and mother respectively). See
Table 3.6. Among the young people that have attained tertiary education, 17 percent have
9.2
19.8
33.3
44.2
37.4
42.8
24.3
22.6
15.7
14.5
14.4
5.9
4.4
2.4
1.4
3.4
3.4
1.0
0.0 10.0 20.0 30.0 40.0 50.0
Young People
Father
Mother
Proportion, percent
Ed
ucati
on
att
ain
men
t
Tertiary
Vocation
Secondary
Primary
Incomplete Primary
No education

19
fathers whose levels are higher while 6 percent have mothers with higher levels of education
attained.
Table 3.6: Educational attainment of young people by parental educational attainment, 2015, Percent
Level of completed education**
Comparison with father Comparison with mother
Same level as parent
Parent has lower level education
Parent has higher level education
Same level as parent
Parent has lower level education
Parent has higher level education
No education or incomplete primary 71.8 - 28.2 89.4 - 10.6
Primary 25.0 66.8 8.3 15.1 80.6 4.2
Secondary 10.5 86.5 3.0 7.3 85.7 7.0
Vocational 23.1 76.9 - 10.3 89.7 -
Tertiary 40.4 43.0 16.6 42.9 50.7 6.4
Total 71.8 - 28.2 89.4 - 10.6 Note: **Excludes young people currently attending school
3.5 Young people who were current students
Out of the estimated 8.5 million young people, about 33 percent (or 2.8 million) were in
school at the time of the survey. The proportion was higher for males (40 percent) compared to
females (28 percent). However, there were minor differentials by residence. The results further
indicate that the proportion of students overall reduced from 40 percent to 33 percent during
the survey periods (Table 3.7).
Table 3.7: Proportion of young people who were students, 2013 & 2015 (percent)
Background characteristic
2013 2015
Sex Male 45.9 40.1
Female 33.7 27.6
Residence Rural 39.6 33.7
Urban 39.0 32.1 Total
39.5 33.3
Young people currently attending school were asked which fields of study they expect to
complete, the desired future occupation and place of work upon completing school. Majority
of the young people (58 percent) expect to complete tertiary followed by those who expect to
complete secondary (nearly 22 percent) as shown in Table 3.8.

20
Table 3.8: Share of current students by level of education expected to complete, 2015 (Percent)
Education level
Sex Residence
Male Female Urban Rural Total
Tertiary 60.6 53.8 69.1 53.2 57.6
Vocational 12.2 22.2 11.7 18.6 16.7
Secondary 23.3 21.1 17 24.3 22.3
Primary 2.2 2.8 0.8 3.0 2.4
Missing 1.8 0.2 1.5 0.9 1.1
Total 100 100 100 100 100
3.5.1 Field of study of current students
The majority of the current students (88 percent males and 85 percent females) were still
studying general programmes, which is to be expected when so many continue to study at the
secondary level or lower. The field of studies and choice is diverse between the sexes (Table
3.9). Regarding specialized fields, there was slightly more specialization in business studies
than other specialized fields, but with notable gender disparities. More males were in
Business studies and Engineering (with no female) while females were more in Training
programmes and Education.
Table 3.9: Distribution of field of study of current young students by sex, 2015 (percent)
Field of study
Male Female Total
General Education
88.4 84.6 86.6
Business Studies
2.3 1.8 2.1
Training course or apprenticeship/internship programme
1.1 2.3 1.6
Engineering
2.9 0.0 1.6
Education
0.5 2.3 1.3
Health Sciences
1.0 1.5 1.2
Others*
3.9 7.7 5.6
Total
100 100 100 *Others included: Computer studies, public administration, finance, medical, carpentry, brick laying, cosmetology, catering, tourism and hair dressing among others.
3.5.2 Current students by type of preferred future work place and job
The survey results show that more than half of the young people (nearly 66 percent)
desired to work in the Government/Public sector (Table 3.10). More females (70 percent) than
males 63 percent) desired to work in Government/Public sector. About 19 percent of young
people desired to be self-employed mainly the males and young persons in rural areas. More
young people in the urban areas desired to work in own business and private companies than
their counterparts in the rural areas.

21
Table 3.10: Current students by desired future occupation and place of work, 2015 (Percent)
Desired place of work (for those currently in school) Male Female Urban Rural Total
Government/Public sector 62.5 69.7 57.3 68.9 65.8
Myself (Own business) 19.8 17.9 20.5 18.4 18.9
A private company 14.7 9.5 18.0 10.2 12.3
Others ** 3.0 2.9 4.3 2.5 3.0
Total 100 100 100 100 100 Note: **Other desired places of work included international organisations and Family business/farm
Current students were also asked to identify the occupations in which they would like to
work in the future. The aim here was to use current circumstances to judge whether students
have realistic expectations in terms of future possibilities for execution. Most students
expressed an aspiration to work in higher skilled occupations such as professionals (64
percent) as indicated in Table 3.11. Such preferences correspond well with their intention to
complete tertiary education but are at odds with the current capacity of the Ugandan labour
market. Young people are currently not highly skilled. As indicated earlier in this chapter, only
about 8 percent of the youth out of school completed either vocation or tertiary education.
Table 3.11: Distribution of preferred future job of current young students by sex, 2015 (Percent)
Preferred future job of current students
Sex
Male Female Total
Professionals 62.9 65.2 64.0
Craft and related trades workers 14.7 6.2 10.8
Service and sales workers 5.1 6.8 5.9
Technicians and associate professionals 6.4 13.4 9.6
Plant and machine operators, and assemblers 3.0 0.9 2.0
Others* 7.9 7.6 7.7
Total 100 100 100 *Note: Others included managers, clerical support workers, skilled agricultural, forestry and fishery workers, elementary
occupations, armed forces
3.6 Activity Status of the young people
The employment to population ratio (EPR) provides a good indication of the degree to
which the economy is using its key productive labor resource. On the other hand the Labour
Force Participation Rate (LFPR) tells us the proportion of working age population that is
active in the labour market either employed or actively looking for employment.
Table 3.12 shows that the Employment to Population Ratio (EPR) of the young people
was 65 percent in 2015 compared to 63 percent in 2013 and the Labour Force Participation
Rate (LFPR) of the young people was 69 percent in 2015compared to 67 percent in 2013. In
2015, both the EPR and LFPR were higher among young people in rural areas implying
greater potential and more active involvement by the young people in the rural areas compared
to those in the urban areas. In like manner, the young males showed a more active

22
involvement than their female counterparts. Males were also found to be more active in the
labour market than their female counterparts.
Table 3.12: Key labour market indicators of young people by sex, 2013 and 2015 (Percent)
INDICATOR
Sex Residence
Male Female Urban Rural Total
2013
Employment to Population Ratio (EPR) 65.2 61.1 56.4 65.4 63.1
Labour Force Participation Rate (LFPR) 68.3 65.2 68.5 66.6 66.6
2015
Employment to Population Ratio(EPR) 69.1 60.8 60.1 66.2 64.5
Labour Force Participation Rate (LFPR) 73.1 65.6 66.7 69.9 69.0
The traditional classification of current economic activity status of persons has three
categories: employed, unemployed or inactive. The employed and unemployed are added
together to form the total labour force (also known as the economically active population).
Unemployment according to international standards is defined as the situation of a person
who: (a) did not work in the reference period, (b) was available to take up a job had offer in
the week prior to the reference period, and (c) actively sought work within the 30 days prior to
the reference period (for example, by registering at an employment centre or answering a job
advertisement). The definition of “relaxed unemployment” (also known as broad
unemployment), in contrast, differs in the relaxation of the “seeking work” criterion.
According to the international standards, the seeking work criterion may be relaxed “in
situations where the conventional means of seeking work are of limited relevance, where the
labour market is largely unorganized or of limited scope, where labour absorption is, at the
time, inadequate or where the labour force is largely self-employed” (ILO6).
Table 3.13 shows that in 2015 about 65 percent of young people were employed with
more male (69 percent) than female (61 percent) in employment. With reference to the strict
framework, survey results showed that about five percent of the young people were
unemployed and four percent non-students were unemployed. Nearly a third of the young
people were economically inactive with a higher share of females (34 percent) than males (27
percent).
A labour force participation rate of 69 percent was realised. Once the definition of
unemployment is relaxed, the unemployment among young people almost triples that of the
strict definition implying that several young people are available for work but not actively
looking for work.
6Global employment trends for youth 2013, International Labour Organisation (ILO), 2013, Page 31

23
Table 3.13: Characteristics of the young people by economic activity and sex, 2013 and2015 (Percent)
Economic activity
2013 2015
Male Female Rural Urban Total Male Female Rural Urban Total
Employed 65.2 61.1 65.4 56.4 63.1 69.1 60.8 66.2 60.1 64.5
Strict framework1
Unemployed 2.9 3.7 2.8 4.7 3.3 4.1 4.9 3.7 6.6 4.5
Unemployed non-students 2.5 3.5 2.8 3.7 3.0 2.6 4.3 2.9 5.1 3.5
Inactive 31.9 35.2 31.8 38.9 33.6 26.5 33.8 29.6 32.9 30.5
Relaxed framework2
Unemployed 6.2 12.9 8.4 13.5 9.7 11.3 17.5 12.9 19.4 147
Unemployed non-students 4.6 10.3 6.5 10.5 7.6 5.2 12.5 8.3 11.7 9.2
Inactive 28.5 26.0 26.2 30.1 27.2 19.4 21.2 20.4 20.2 20.4
Total 100 100 100 100 100 100 100 100 100 100 1Refers to individuals not working at all, actively looking for work and are available for work 2Refers to individuals not working at all and are available for work
Employment is not only for persons out of school but even students. The 2015 SWTS
revealed that of the young people currently attending school, 15 percent were employed and of
these 63 percent were males
Upon completing school or dropping-out of school majority of the young people join the
labour market. The results presented in Table 3.14 showed that majority of the young people
out of school were employed (about 8 in 10) irrespective of their education attainment status.
However, young persons who were more educated were more likely to access employment
than their less-educated educated counterparts. The results further showed that skills training
which is associated to vocational education provides young people with higher chances of
employment (85 percent) with (6 percent inactive) as compared to general tertiary education
with a share of 81 percent employed and 8 percent inactive. The share of young people who
were inactive was 15 percent and only 5 percent of the young people were unemployed.
Table 3.14: Educational attainment of young people (out of school) by current activity status, 2015 (Percent)
Level of Completed Education
Activity Status
Employed Unemployed Inactive Total
No education 87.0 3.3 9.8 100
Incomplete Primary 78.5 4.0 17.6 100
Primary 78.4 5.3 16.3 100
Secondary 78.3 8.2 13.5 100
Vocational 84.8 9.5 5.7 100
Tertiary 81.2 10.9 8.0 100
Total 79.5 5.3 15.2 100

24
3.7 Primary Life Goals of Young People
Most young people (37 percent) considered “having lots of money” as their primary life
goal. However, the highest proportion of the unemployed (32 percent) had their life goal as
having a “good family life” (Table 3.16). It’s surprising that the least desired primary life goal
for all young people irrespective of activity status was ‘making a contribution to society’
(Table 3.16).
Table 3.16: Primary life goals of young people by activity status, 2015 (percent)
Characteristics Activity status
Employed Unemployed Inactive Total
Having lots of money 38.1 28.5 37.1 37.4
Having a good family life 33.0 32.4 27.9 31.3
Being successful in work 20.5 28.2 20.4 20.8
Making a contribution to society 8.2 9.6 14.2 10.1
Missing 0.2 1.3 0.4 0.4
Total 100 100 100 100

25
4. EMPLOYED YOUNG PEOPLE
4.1 Background Characteristics of Young People who were Employed
The employed young people consist of persons who worked for pay, profit or family gain
and those persons who had work but were temporarily absent from it during the reference
week. As shown earlier in Table 3.13, about 65 percent of the young people were employed in
2015. Table 4.1 below presents the percentage distribution of employed young persons by
selected background characteristics. The results reveal that the majority of the employed
young persons were in the age group 20-24.The proportion of the married employed young
females was higher than that of the males. The findings also revealed that less than one quarter
of employed young persons had attained secondary or higher education level.
Table 4.1: Employed young people by selected background characteristics, 2015 (Percent)
Background Characteristic Male Female Total
Age
15-19 33.9 26.9 30.3
20-24 34.4 37.2 35.9
25-29 31.6 35.9 33.8
Marital status
Single/never married 61.7 35.5 48.2
Married 37.4 59.6 48.8
Ever married but currently not in union 0.9 4.8 2.9
Area of Residence
Rural 74.6 73.6 74.1
Urban 25.4 26.4 25.9
Region
Central 28.3 27.9 28.1
Eastern 23.1 22.9 23.0
Northern 26.5 28.6 27.6
Western 22.1 20.5 21.3
Education Attainment
No Education 7.0 12.4 10.0
Incomplete Primary 44.2 43.5 43.8
Primary 24.2 23.8 24.0
Secondary 16.3 12.5 14.2
Vocational 4.3 4.8 4.6
Tertiary 4.0 3.0 3.5 Total 100 100 100 Number (‘000) 2,662 2,828 5,490
4.2 Sectors and Occupations of Working Young People
The sector-level distribution of young people in employment is shows that the
Agriculture sector accounted for the largest share of employment in Uganda (57 percent) as
shown in Table 4.2. The share among female workers in this sector (61 percent) was higher
than the share of young male workers (53 percent). The sector with the second highest share
of employment in Uganda among the young people was the trade sector, where 14 percent of

26
the young people were engaged with the proportion among females (16 percent) being slightly
higher than that of the males (13 percent). The Trade sector was the largest in terms of
employment in the urban areas engaging 29 percent of employed compared to 10 percent in
the rural areas. There were very few young women in the labour-intensive sectors, such as
transport and storage and construction each of which accounted for less than one percent.
Table 4.2: Distribution of young people in employment by Industry and sex, 2015 (percent)
Industry Male Female Rural Urban Total
Agriculture, forestry and fishing 53.3 60.9 70.9 18.2 57.2
Trade 12.7 16.0 9.4 28.7 14.4
Manufacturing 6.8 4.5 5.0 7.3 5.6
Transport and storage 9.2 0.4 3.1 9.2 4.7
Construction 7.5 0.3 3.0 5.9 3.8
Education 2.4 4.3 2.3 6.4 3.4
Other service activities 2.0 3.8 1.7 6.4 2.9
Activities of household employers 0.7 4.3 1.1 6.6 2.6
Hotels , restaurant eating places 0.9 2.0 1.0 2.9 1.5
Others 4.2 3.6 2.5 8.5 4.2
Total 100 100 100 100 100
Number (‘000) 2,662 2,828 4,066 1,424 5,490
Table 4.3 shows the distribution of employed young persons by the main branch of
economic activity. The proportion of young persons employed in the Agriculture sector
slightly reduced from 60 percent in 2013 to 57 percent in 2015. The services sector absorbed
about one third (32 percent) with a slightly higher share for females (33 percent) than males
(31 percent). The results also indicate that only 11 percent of the employed youths were in the
industry sector with the share among males (16 percent) being more than two times that of
females (6 percent). The sector composition between two survey periods remained nearly the
same.
Table 4.3: Proportion of employed young people by sector and sex, 2013 and 2015 (Percent)
Aggregate Sector
2013 2015
Male Female Total Male Female Total
Agriculture 56.8 63.7 60.3 53.3 60.9 57.2
Industry 12.9 4.4 8.6 15.9 6.1 10.8
Services 30.4 31.9 31.1 30.9 33.0 32.0
Total 100 100 100 100 100 100
The distribution of young workers aged 15-29 years by occupations for the years 2015
and 2013 is presented in Figure 4.1 below. Fifty two percent of employed young persons were
engaged as agriculture workers in 2015, almost the same proportion reported in 2013. The
results also indicate that 19 percent were service workers while 12 percent were engaged in
elementary occupations for both 2015 and 2013. In general, the differences in proportions of
persons employed by occupation categories between 2013 and 2015 was less than one percent

27
apart from among the Plant and machine operators and assemblers where the proportion for
2015 (5 percent) was about 2 percentage points higher than that of 2013 (3 percent).
Figure 4.1: Distribution of employed young people by occupation, 2013 and 2015 (Percent)
*Note: Others include Armed forces, Technicians, Clerks and Managers
The findings in Table 4.4 show that there were more female young workers (57 percent)
in agricultural and fishery than the males (47 percent). Similarly, there were more females
working as Service and sales workers (24 percent) than males (13 percent). The proportion
among employed males in elementary occupations was about three percentage points higher
than that of females. The craft and related workers were dominated by males with the male
young workers (13 percent) being more than four times that of employed females (3 percent).
The results further show that the proportion of young persons employed in occupations
requiring high qualifications like professional occupations and managerial occupations was
low with no gender disparity observed.
Table 4.4: Share of young people who were employed by occupation and sex, 2015 (percent)
Occupation*
Male Female Total
Skilled agricultural, forestry and fishery workers 46.6 57.0 52.0
Service and sales workers 13.0 24.0 18.7 Elementary occupations 13.2 10.1 11.6
Craft and related trades workers 12.7 3.0 7.7
Plant and machine operators, and assemblers 9.3 0.8 4.9
Professionals 3.6 3.6 3.6
Others** 1.7 1.3 1.5
Total 100 100 100
*Classification based on ISCO-08
**Note: Others include Armed forces, Technicians, Clerks and Managers
52
18.7
11.6
7.7
3.6
4.9
1.5
52.3
19.1
12.3
7.5
3.4
3
2.5
0 10 20 30 40 50 60
Skilled agricultural,
Service workers
Elementary occupation
Craft and related wor
Professionals
Plant and machine ope
Others*
Proportion employed, percent
Occupation
2013
2015

28
4.3 Status in Employment
Table 4.5 shows that the highest proportion of young workers in Uganda in 2015 were
own account workers (43 percent). Almost equal proportions of young working Ugandans
were contributing family workers (28 percent) and wage and salaried workers (25 percent)
while employers contributed only about 4 percent.
The proportion of young people in wage employment in urban areas (48 percent) was
about three times that of the rural areas (17 percent). Conversely the share of young
contributing family workers in rural areas (33 percent) was higher than that of the urban areas
(13 percent). Working young persons in Eastern and Northern Regions were less likely to be
involved in paid employment compared to their counterparts in the other regions. The majority
young workers were engaged in self-employment, with the proportion of young female
workers (82 percent) higher than that of males (68 percent). The findings also show that young
workers with education attainment of vocational education and tertiary education had higher
shares in wage employment compared to those with lower education categories.
The employed workforce in vulnerable employment is the sum of own-account workers
and contributing family workers. Vulnerable employment is often characterized by inadequate
earnings, low productivity and difficult conditions of work that undermine workers’
fundamental rights. Almost three quarters (71 percent) of young workers in Uganda were
classified as “vulnerable” in 2015 with females (79 percent), young persons living in rural
areas (79 percent) and those from Eastern region (81 percent) and Northern region (83
percent) being more likely to engage in vulnerable employment compared to others.
Vulnerable employment was negatively related to education attainment with 91 percent of the
young persons with no education in vulnerable employment compared to 34 percent of those
with education attainment of Tertiary education.
Table 4.5: Share of employed young persons by status in employment and selected background characteristics, 2015 (Percent)
Vulnerable Employment
Background Characteristic Employees
Employers
Own account workers
Contributing family
workers Others Total Self
Employment Total
Residence
Rural 17.0 3.5 46.4 32.9 0.3 83.0 100
Urban 47.5 5.1 33.7 12.9 0.8 52.5 100 Region
Central 41.1 6.4 32.6 19.5 0.4 58.9 100 Eastern 16.1 3.0 52.8 28.1 0.0 83.9 100 Northern 14.7 1.6 40.1 43.0 0.6 85.3 100 Western 26.2 4.7 50.3 18.2 0.5 73.8 100
Sex
Male 32.4 5.1 36.3 26.0 0.2 67.6 100 Female 17.8 2.8 49.5 29.4 0.5 82.2 100 Education Attainment
No Education 7.2 0.8 46.0 45.3 0.7 92.8 100 Incomplete Primary 23.0 3.3 53.8 19.7 0.2 77.0 100 Primary 21.1 5.2 55.6 17.8 0.3 78.9 100 Secondary 40.0 8.2 39.3 12.0 0.5 60.0 100 Vocational 57.6 5.3 33.5 3.6 0.0 42.4 100 Tertiary 56.5 9.4 24.5 9.6 0.0 43.5 100 Total 24.9 3.9 43.1 27.7 0.4 75.1 100 Number (‘000) 1,365 216 2,366 1,521 21 4,125 5,490

29
4.4 Hours of Work
Table 4.6 shows the distribution of the young people in employment by the actual
number of hours worked per week. The results indicate that overall, more than a half of the
working young persons,51 percent, worked for less than the standard 40 hours a week. The
proportion was higher for females than males. Overall, nearly one quarter of the working
young persons (24 percent) were engaged for excessive hours (49+) with the proportion of
males (29 percent) being higher than that of females (19 percent).
Table 4.6: Proportion of young people who were employed by actual number of hours worked per week
Hours of Work Male (Percent) Female (Percent) Total (Percent)
Absent from work 9.2 8.9 9.1
1-9 8.2 10.2 9.2
10-19 10.4 15.2 12.9
20-29 11.0 17.1 14.2
30-39 15.2 13.9 14.5
40-49 12.3 9.0 10.6
50-59 5.6 3.9 4.7
60+ 20.9 13.7 17.2
Missing 7.2 8.1 7.7
Total 100 100 100
49+ 28.6 19.1 23.7
4.5 Characteristics of Wage Employment
Figure 4.2 shows that a quarter of (25 percent) of the young workers in 2015were paid
employees. Young paid employees in the country are likely to be disadvantaged because they
cannot ably negotiate in terms of wage due to low or no work experience. The share of young
males in wage employment (32 percent) was nearly double the share of females (18 percent)
Figure 4.2: Wage employment by sex, 2015 (Percent)
32.4
17.8
24.9
0.0
10.0
20.0
30.0
40.0
Male Female Total
Share, percent
Sex

30
4.5.1 Earnings of Young Workers in Paid Employment
Figure 4.3 presents the average monthly wages of young wage and salaried workers by
some selected background characteristics. The young wage and salaried workers earned an
average of 217,000 Uganda Shillings per month. The males earned (UGX 249,000) 1.6 times
more than their female counterparts (UGX 158,000). The results also show that investing in
education brings a clear pay-off in terms of higher wage potential. The average monthly wage
increased with the level of education with the highest impact felt at vocational and tertiary
level. Young persons with tertiary education earned (UGX 335,000) more than three times the
wage of young paid employees with no education (UGX 102,000).
Figure 4.3: Average monthly wages of paid employees (’000) by education attainment, residence and sex
4.5.2 Type, Nature and Duration of Contracts of Young Paid Employees
Results on the type of contracts held by young wage and salaried workers, show that
nearly eight in every ten (79 percent) of young employees were engaged on an oral agreement,
this was the same proportion reported in 2013. The proportion of females with a written
contract in 2015 (22 percent) was slightly higher than that of the males (17 percent). Young
persons living in urban areas were more likely to have contracts of unlimited duration (82
percent) compared to those living in the rural areas (60 percent).
102
207 204 216
335
151
281249
158
217
0
100
200
300
400
Average
Mon
thly W
age, '000
Shs
Education attainment
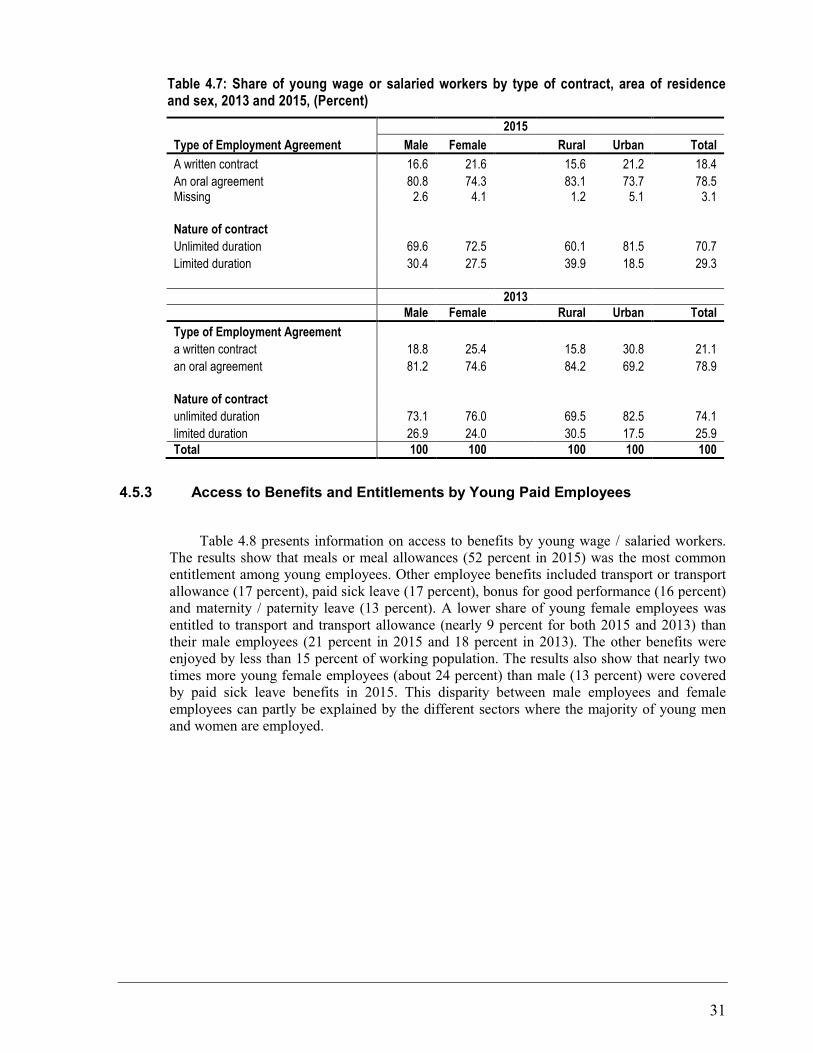
31
Table 4.7: Share of young wage or salaried workers by type of contract, area of residence and sex, 2013 and 2015, (Percent)
Type of Employment Agreement
2015
Male Female Rural Urban Total
A written contract 16.6 21.6
15.6 21.2 18.4
An oral agreement 80.8 74.3
83.1 73.7 78.5 Missing 2.6 4.1 1.2 5.1 3.1
Nature of contract Unlimited duration 69.6 72.5
60.1 81.5 70.7
Limited duration 30.4 27.5
39.9 18.5 29.3
2013 Male Female Rural Urban Total
Type of Employment Agreement a written contract 18.8 25.4
15.8 30.8 21.1
an oral agreement 81.2 74.6
84.2 69.2 78.9
Nature of contract unlimited duration 73.1 76.0
69.5 82.5 74.1
limited duration 26.9 24.0
30.5 17.5 25.9 Total 100 100 100 100 100
4.5.3 Access to Benefits and Entitlements by Young Paid Employees
Table 4.8 presents information on access to benefits by young wage / salaried workers.
The results show that meals or meal allowances (52 percent in 2015) was the most common
entitlement among young employees. Other employee benefits included transport or transport
allowance (17 percent), paid sick leave (17 percent), bonus for good performance (16 percent)
and maternity / paternity leave (13 percent). A lower share of young female employees was
entitled to transport and transport allowance (nearly 9 percent for both 2015 and 2013) than
their male employees (21 percent in 2015 and 18 percent in 2013). The other benefits were
enjoyed by less than 15 percent of working population. The results also show that nearly two
times more young female employees (about 24 percent) than male (13 percent) were covered
by paid sick leave benefits in 2015. This disparity between male employees and female
employees can partly be explained by the different sectors where the majority of young men
and women are employed.
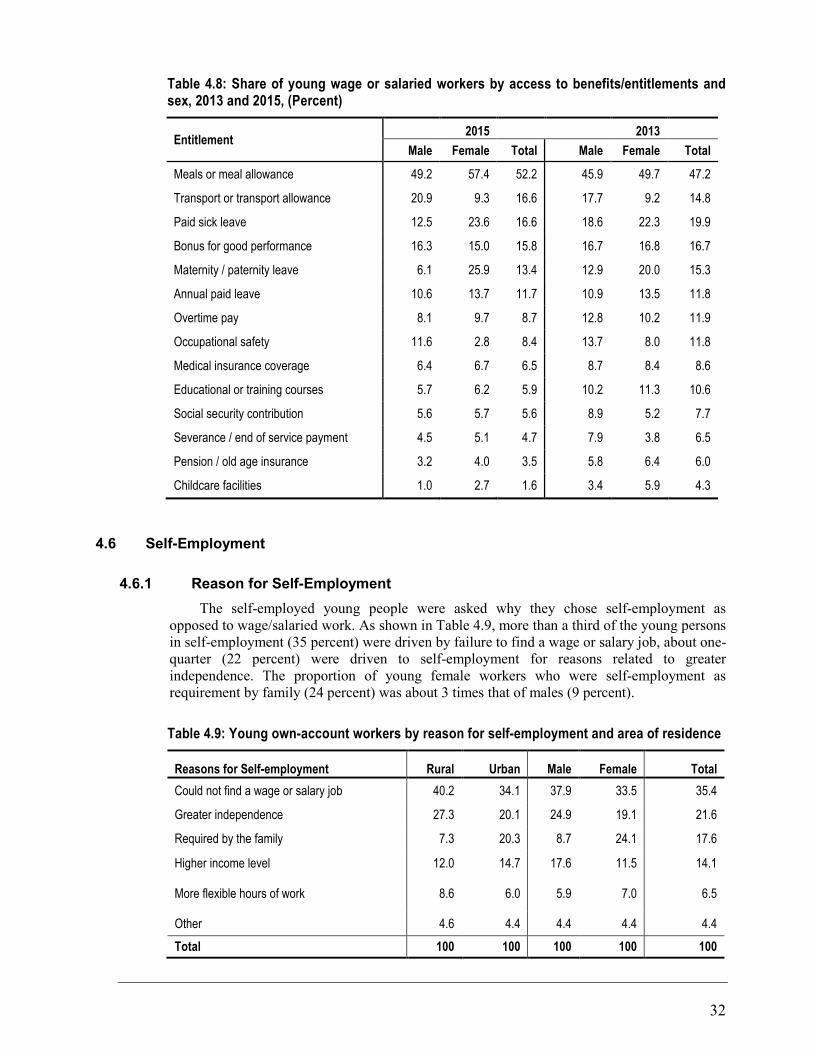
32
Table 4.8: Share of young wage or salaried workers by access to benefits/entitlements and sex, 2013 and 2015, (Percent)
Entitlement 2015 2013
Male Female Total Male Female Total
Meals or meal allowance 49.2 57.4 52.2 45.9 49.7 47.2
Transport or transport allowance 20.9 9.3 16.6 17.7 9.2 14.8
Paid sick leave 12.5 23.6 16.6 18.6 22.3 19.9
Bonus for good performance 16.3 15.0 15.8 16.7 16.8 16.7
Maternity / paternity leave 6.1 25.9 13.4 12.9 20.0 15.3
Annual paid leave 10.6 13.7 11.7 10.9 13.5 11.8
Overtime pay 8.1 9.7 8.7 12.8 10.2 11.9
Occupational safety 11.6 2.8 8.4 13.7 8.0 11.8
Medical insurance coverage 6.4 6.7 6.5 8.7 8.4 8.6
Educational or training courses 5.7 6.2 5.9 10.2 11.3 10.6
Social security contribution 5.6 5.7 5.6 8.9 5.2 7.7
Severance / end of service payment 4.5 5.1 4.7 7.9 3.8 6.5
Pension / old age insurance 3.2 4.0 3.5 5.8 6.4 6.0
Childcare facilities 1.0 2.7 1.6 3.4 5.9 4.3
4.6 Self-Employment
4.6.1 Reason for Self-Employment
The self-employed young people were asked why they chose self-employment as
opposed to wage/salaried work. As shown in Table 4.9, more than a third of the young persons
in self-employment (35 percent) were driven by failure to find a wage or salary job, about one-
quarter (22 percent) were driven to self-employment for reasons related to greater
independence. The proportion of young female workers who were self-employment as
requirement by family (24 percent) was about 3 times that of males (9 percent).
Table 4.9: Young own-account workers by reason for self-employment and area of residence
Reasons for Self-employment Rural Urban Male Female Total
Could not find a wage or salary job 40.2 34.1 37.9 33.5 35.4
Greater independence 27.3 20.1 24.9 19.1 21.6
Required by the family 7.3 20.3 8.7 24.1 17.6
Higher income level 12.0 14.7 17.6 11.5 14.1
More flexible hours of work 8.6 6.0 5.9 7.0 6.5
Other 4.6 4.4 4.4 4.4 4.4
Total 100 100 100 100 100

33
4.6.2 Source of Funding for the Self Employed
Figure 4.4 indicates that most young persons (47 percent) in self-employment did not
need funding to start their current activity. For those who needed funding, it was mainly from
own savings (29 percent) or family and friends (20 percent). The findings also reveal that the
self-employed residents of the urban areas had a higher likelihood of using a startup capital
either from friends or own savings compared to those of the rural areas. In addition the
proportion of young males who used own funding for their activities (35 percent) was about 11
percentage points more than that of the females and that of young females who used funding
from friends or family (23 percent) was five percentage points higher than that of males.
Figure 4.4: Self employed young persons by main source of funding for starting current activity, sex and residence, 2015 (Percent)
4.6.3 Challenges of Self-Employment
Table 4.10 shows the key challenges that self-employed young persons reported to be
facing in running their businesses. The most common problem was limited financial resources
(26 percent). The findings also indicate that a higher share of young persons in self-
employment in urban areas reported limited financial resources, competition in the market and
shortage of raw materials as their greatest challenges as compared to those in rural areas.
Similarly labour shortage and access to technology was more frequently reported as a
challenge by the rural self-employed young persons than their urban counterparts. There were
no major gender differences in the type of problems reported.
Table 4.10: Share of young self-employed by main challenges, sex and residence
Challenges Sex Residence
Male Female Rural Urban Total
Limited Financial resources 27.9 23.8 23.6 32.7 25.6
Competition in the market 13.4 14.5 13.9 14.4 14.0
Unfavourable weather / pests & diseases in farming 12.5 12.5 13.7 8.3 12.5
Shortages in raw material/insufficient quality 6.2 4.4 4.3 8.6 5.2
Labour shortage 3.7 5.0 4.9 2.7 4.4
Limited access to technology & product development 4.9 2.5 4.2 1.0 3.5 Unfavourable Legal & Tax regulations & bad debts 4.4 2.4 2.6 5.8 3.4
Limited Entrepreneurial skills 0.3 1.5 0.8 1.5 1.0 Others 26.7 33.5 32.1 25.0 30.6 Total 100 100 100 100 100
42.5
51.255.0
20
47.5
34.8
24.4 26.4
37.6
28.8
17.4
22.7
15.7
37.9
20.5
5.41.7 2.9 4.4 3.3
0
10
20
30
40
50
60
Male Female Rural Urban Total
Proportion, percent
No Money Needed Own Savings Family or friends Others

34
4.7 Other Indicators of Job Quality
The SWTS also allows measurement of the quality of jobs to which young people have
access. Figure 4.5 characterizes the youth labour market in Uganda along the job-quality
continuum introduced by the ILO. Regarding the quality of employment, the left-hand side of
the figure lists five indicators within the realm of low-quality employment and these are:
(i) The proportion of paid employees with below-average monthly wages (poorly paid);
(ii) The share of workers with contract duration of less than 12 months, own-account workers
and contributing (unpaid) family workers (irregular employment).
(iii) The proportion of over- or undereducated workers (skills mismatch);
(iv) The proportion of workers in informal employment;
(v) The share of workers that claim dissatisfaction with their current job (unsatisfactory
employment);
According to the ILO7, the “under-education” of young workers in developing countries
is a concern, and a major hindrance to transformative growth. Low levels of education results
in vulnerable employment and low wages of young workers and a subsequent lack of financial
means to fund the education of the next generation. As shown in Table 3.1, only about 8
percent of the young people out of school completed vocation training and above leaving the
bulk of them with lower levels of education attainment. This combined with 92 percent of
working youth classified in informal employment as shown in Figure 4.5 strongly correlates
with poor job quality and thus vulnerable employment. In addition data on work irregularity
indicates that 76 percent of jobs were classified as irregular in 2015.
The right-hand side of the figure represents indicators of better quality employment based
on the above mentioned scale. The information in the figure illustrates that about three
quarters of the youths aged 15-29 years were classified under irregular employment, while
skills mismatch among employed young persons was about four-fifth (82 percent). Low pay
was common among the youth in Uganda with about two thirds (67 percent) of paid youth
employees taking home less than the average monthly wages/salaries.
7ILO Work4Youth Publication Series No. 23: Is education the solution to decent work for youth in developing
economies?:Identifying qualifications mismatch from 28 school-to-work transition surveys: Sparreboom; T. & Staneva A.;
2014

35
Figure 4.5: Indicators measuring quality of youth employment, 2015 ( percent)
The results also show that informal employment rate among the young persons remained
high at 92 percent in both the 2013 and 2015 surveys. No big differentials were observed in
the indicators of quality of employment among young persons between 2013 and 2015. The
proportion of employed young workers with skills mismatch increased from 78 percent to 82
percent while those in irregular employment decreased from78 percent to 76 percent
respectively. The young people categorised to be in non-satisfactory employment decreased by
five percentage points (34 percent to 29 percent)-(Figure 4.6).
Figure 4.6: Changes in indicators measuring quality of youth employment, 2013 and 2015 (percent)
33
17.5
23.8
8.1
70.6
Poorly/Well Paid
Qualifications Mismatch/Match
Irregular/Regular
Informal/Formal
Non-Satisfactory /Satisfactory
-120 -100 -80 -60 -40 -20 0 20 40 60 80
34.4
92.2
77.7
77.6
29.4
91.9
76.2
82.3
0 20 40 60 80 100
Non-Satisfactory/Satisfactory Employment
Informal/Formal
Irregular/Regular Employment
Qualifications mismatch/Match
Proportion, percent
Chan
ges
2015
2013

36
4.7.1 Qualifications Mismatch
According to the classification of skills mismatch/match, every employed person is
expected to have a minimum of primary education implying that young workers in low-skilled
non-manual jobs or skilled manual jobs are undereducated when they do not complete primary
level education. The results are, in part, a reflection of the levels of education attained by
youth in the country. With a substantial share of employed young people having completed
only primary or lower education (54 percent), it is not surprising to find more young people
classified as under-educated compared to over-educated.
The results from the Uganda SWTS 2015 indicate that less than one fifth of the young
persons in employment (18 percent) were engaged in occupations that matched their level of
education, implying that more than four fifths (82 percent) of the working young persons in
Uganda were either undereducated or over educated. The findings also reveal that 80 percent
of working young people were under-educated for their occupations.
Nine out of every ten young persons employed as agricultural, forestry and fishery
workers were undereducated for their occupations. This is because young people who cannot
find work elsewhere mostly move to work as agricultural and fishery workers since to be a
subsistence farmer no minimum level of education is required.
Table 4.11: Shares of over-educated and under-educated young workers by major occupational category, 2015 (Percent)
Broad Occupations* Over Educated Under Educated Matching
Qualifications
Professionals - 92.7 7.3
Service workers 2.0 62.0 35.6
Skilled agricultural, forestry and fisheries workers 0.6 90.7 8.5
Craft and related workers - 69.2 30.8
Plant and machine operators 2.6 74.2 23.2
Elementary occupations 16.2 66.8 17.0
Others 7.7 75.2 17.0
Total 2.8 79.5 17.5
*Note: Occupation was classified by ISCO-08
Under-education has an impact on the productivity of the worker, as well as on their
levels of confidence and well-being. One way of addressing the qualifications mismatch is to
ensure that young workers have the necessary skills to perform available jobs most effectively
is to offer on-the-job training. A trained worker has higher chances of being more efficient,
effective and better motivated at work than an untrained (and hence insecure) worker.
4.7.2 Informal Employment
Following the guidelines of the International Conference of Labour Statisticians (ICLS)
published in 2013, informal employment is composed of two components i.e. workers in the
informal sector and paid employees holding informal jobs in the formal sector. Figure 4.7
shows that almost all young workers (92 percent) were involved in informal employment. The
major contributor to informal employment was informal sector involvement (72 percent)
compared to informal jobs in the formal sector (20 percent). Informal employment among

37
young women in Uganda (93 percent) was higher than that of young men (91 percent). The
results also show that the urban informal employment (87 percent) was lower than that of the
rural areas (94 percent).
Figure 4.7: Share of employed youth in informal employment by sex and residence, 2015 (Percent)
4.8 Job Security and Satisfaction
The survey examined the degree of satisfaction with the present job by young people by
asking whether or not they wanted to change their present jobs. The findings reveal that
despite a stated satisfaction rate of 71 percent among young workers; still a majority (59
percent) expressed the desire to change their present employment as shown in Figure 4.8.
More males than females were less satisfied with the jobs, 61 percent and 56 percent
respectively.
Figure 4.8: Share of employed young people who wanted to change job, 2015 (Percent)
The reasons advanced by those young persons who wanted to change employment are
presented in Table 4.12 below. The most common reasons advanced were desire for higher
pay (57 percent), improvement of working conditions (20 percent), using better their
qualifications/skills (4 percent) and temporary nature of the present job(4 percent).
90.6 93.0 93.686.7
91.8
66.5
77.8 76.9
59.1
72.3
24.1
15.2 16.7
27.619.5
0.0
20.0
40.0
60.0
80.0
100.0
Male Female Rural Urban Total
share, percent
Informal employment
Informal employment rate Informal sector employment Informal job in the formal sector
61.0
56.3
58.4 58.7 58.6
50.0
55.0
60.0
65.0
Male Female Urban Rural Total
Propo
rtion, Percent
Domain

38
Table 4.12: Distribution of Employed young people who liked to change their work by reason, 2015 (Percent)
Reasons for desired change Male Female Total
To have a higher pay per hour 57.8 56.8 57.3
To improve working conditions 17.4 22.5 19.9
To use better their qualifications/skills 4.7 4.0 4.4
Present job is temporary 5.0 3.1 4.1
To work more hours paid at current rate 3.1 3.2 3.2
To have more convenient working time 2.1 2.6 2.3
Others 9.9 7.6 8.8
Total 100 100 100

39
5. LABOUR UNDER-UTILISATION OF YOUNG PEOPLE
Labour underutilization has three major components: 1) Labour slack (including
unemployment, time-related underemployment and the marginally attached), 2) skills related
and 3) Wage related inadequate employment. Time-related under-employment is a situation
where the actual hours worked is insufficient in relation to an alternative employment situation
in which the person is willing and available to engage (16th
International Conference of Labour
Statisticians 1998).
Table 5.0 shows that labour under utilisation of young persons 15-29 years was 33
percent. The biggest component of this under utilisation was labour slack (26 percent). Female
young persons were more underutilised (36 percent) compared to the males (30 percent).
The share of young people in time-related under-employment was 17 percent. Although
high, this indicator only measures problems related to insufficient volume of work but does
not capture problems related to type of work one actually performs. Young persons who were
marginally attached to the labour force were more in the urban areas (13 percent) compared to
rural areas (9 percent).
Skill-related under-employment was about 4 percent. These were young persons who
during the reference week were not already categorized as time-related under-employed and
whose educational attainment were higher than the educational level required by their current
main jobs. The survey used the minimum level of education to categorize someone to be in
skill related inadequate employment as S4. Wage related under-employment was 8 percent and
more than double in urban areas compared to rural areas.
Table 5.0: Labour under-utilisation of young people
Variables Male Female Urban Rural Total
Unemployment (% of youth population) 4.1 4.9 6.6 3.7 4.5
Time related underemployment(2) (% of working youth)
15.1 18.5 13.0 18.2 16.8
Marginally attached to labour force(1) (% of youth population)
7.2 12.7 12.8 9.2 10.2
Labour slack (% of youth population) 21.7 28.7 27.2 24.9 25.6
Labour slack (Number, '000) 836 1,338 643 1,531 2,174
Skill related under-employment (% of working youth) 3.9 3.8 8.1 2.3 3.8
Low pay related under-employment(3) (% of working persons)
8.7 7.8 14.3 6.1 8.2
Low pay related under employment(3) (% of working persons in paid employment)
26.9 43.7 30.1 36.0 33.1
Labour underutilisation (% of youth population) 30.4 35.8 40.6 30.5 33.3
Labour underutilisation (Number, '000) 1,171 1,664 962 1,873 2,835 Note: (1) Not actively looking for work, but available for work
(2) National indicator is 40 hours (the person should have wanted or sought to work additional hours).
(3) Two-third of the median wage of young people in full time payment was Shs. 133,000. (i.e. below which is low pay)

40
5.1 UNEMPLOYMENT AMONG YOUNG PEOPLE
5.1.1 Introduction
Youth employment challenges in Africa are often associated with rapid population
growth rates. The relationship however is not always direct, nor that simple. First the youth
bulge has not created an even unemployment rate throughout the continent. Second, it is not
the numbers of young people that has created unemployment, but structural issues specific to
individual countries, like Uganda. About 36percent of the young people in Uganda were still
considered “in transition” in 2013 either because they were unemployed or because they
worked in conditions that were below the standards of decency.
A persistently high level of youth unemployment and underemployment, coupled with
young working poor lacking even primary-level education, unemployment and
underemployment remain a serious problem thatjeopardizes social inclusion, cohesion and
stability8. It is estimated that about 133 million young people in Africa are illiterate. Many
young people have little or no skills and are therefore largely excluded from productive
economic and social life. Those that have some education often exhibit skills irrelevant to
current demand in the labour market, in a situation where educational and skill requirements
are increasing, resulting in millions of unemployed and underemployment9.
5.1.2 Unemployment Levels of Young People
The young people who were unemployed comprised all those aged 15-29 years who during the
reference period were;
a) Without work, that , were not in paid employment or self-employment during a reference
period which was four weeks in our case
b) Currently available for work , that is, were available for paid employment or self-
employment during the reference period and
c) Seeking work, that is, had taken specific steps in the four weeks prior to the survey to seek
paid employment or self –employment
Those who meet all the three criteria are unemployed by the strict definition. In the relaxed
definition of unemployment, a person without work and available to work (relaxing the job-
seeking criterion of item c above) is included.
Based on the strict definition, the survey reported an overall youth unemployment rate of
6.5 percent (5.5 percent for men and 7.4 percent for women) as shown in Table 5.1. Slight
differences were observed by residence where the urban population had a rate of 10 percent
compared to the rural population that registered a rate of 5 percent.
8UN 2015
9 Africa Economic Outlook, 2015

41
Table 5.1: Unemployment rates (percent) for young people by background characteristics, 2013 and 2015
Background Characteristics
Strict definition Relaxed definition
2013 2015 2015
Sex
Male 4.2 5.5 14.0
Female 5.7 7.4 22.4
Residence
Rural 4.1 5.3 16.3
Urban 7.6 9.9 24.4
Age group
15-19 4.0 7.4 24.6
20-24 5.4 7.7 18.4
25-29 5.5 4.4 12.5
Education
None 9.9 3.6 7.4
Incomplete Primary - 4.8 14.9
Primary 3.7 6.4 16.2
Secondary 7.4 9.5 17.7
Vocational - 10.1 14.2
Tertiary 8.6 11.8 14.8
Total 5.0 6.5 18.6
Table 5.1 also shows that, Unemployment rate amongst young people with vocational
and tertiary education was 10 percent and 12 percent respectively, compared to 5 percent for
young people with primary education. Those that have some education often exhibit skills
irrelevant to current demand in the labour market in a situation where educational and skill
requirements are increasing. This means that even in settings where those with higher
education remain in short supply, unemployment and underemployment of the educated can
still result.10
At the same time, those with higher education are more selective regarding the
type of job they will accept, which can also help to explain their comparatively higher
unemployment rates.
5.1.3 Unemployed Youth by Duration of Job Search
Periods of unemployment can have an effect on individuals, families, and communities in
general when individuals are out of work, their skills may erode through lack of practice. The
survey findings show that in Uganda, 40 percent of unemployed young people had been
looking for work for more than 1 year. Despite the gradual improvement in the labour market
for long term unemployment, the share of the unemployed young people who had been out of
work for more than six months remains at very high levels as shown by Figure 5.1 Being out
of work for six months or more is associated with lower-well-being among the long term
unemployed especially within their household. Each week out of work means more lost in
terms of income.
10
African Commission

42
Figure 5.1: Share of unemployed youth by duration of job search, 2015 (Percent)
Note: Short term refers to a period of 12 months or less, otherwise it is long term.
Figure 5.1 further shows a slight variation by sex for long term unemployment with the
females registering a higher proportion (43 percent) compared to the males (35 percent).
5.1.4 Type of Job Sought by Unemployed Young People
The unemployed young people were asked the type of job they were seeking for during
the period of job search and findings indicate that more than half (41percent) of them sought
employment in the services and sales occupation. The next most sought occupations were:
professionals (12 percent), followed by Crafts and related trades workers (13 percent) as
shown in Figure 5.2.
Figure 5.2: Distribution of unemployed young people by type of job sought, 2015 (percent)
64.9
56.760.0
35.0
43.440.0
0
10
20
30
40
50
60
70
Male Female Total
Short term
Long term
41.3
13.3 12.1
29.2
4.1
0
5
10
15
20
25
30
35
40
45
Service and sales workers
Craft and related trades workers
Professionals Others Missing
Share of unem
ployed

43
5.1.5 Perception about Household overall financial situation
Figure 5.3 indicates that 58percent of the unemployed young people considered the
financial situation of their household as poor. It is evident from Figure 5.3 that very few
unemployed young people (14percent) perceived their households to be well off. The findings
further showed that more females who were unemployed perceived their households to be
poor (59 percent) compared to males (56 Percent).
Figure 5.3: Unemployed young people by perceived household financial situation
5.1.6 Main Obstacle of Finding Work for unemployed young People
Many job seekers experience one or more barriers to employment during their job search.
Barriers such as not enough jobs available (34percent), Higher requirements for jobs (26
percent) and did not know how or where to find work (10percent) were identified as the
principal obstacles to finding work among the Ugandan young people as indicated in Figure
5.4.
Figure 5.4: Young people who were unemployed by opinion about main obstacles to finding work, 2015 (percent)
14.6 13.2 13.8
28.9 27.5 28.1
56.459.3 58.2
0
10
20
30
40
50
60
70
Male Female Total
Proportion, P
ercent
Fairly well off Average Poor
Not enough jobs available, 34.2%
Requirements for jobs were more, 25.5%
Did not know how and where to findwork, 10.1%
Low wages in available jobs , 8.7%
Others, 20.1%
Others missing, 1.3%

44
5.1.7 Not- Working, Available for Work but Not Looking for Work
The difference between the unemployment strict definition and relaxed definition are
those who are not working, available to work but not actively seeking work (included in the
latter definition and excluded from the former). In Uganda, of the young people in this
category, 68 percent were female and 32 percent male. The most common reasons why young
people did not seek work were being in school or training (22 percent) and personal family
responsibilities (22percent). The proportion that was just unable to find work either because
they did not know where or how was 16 percent. Twice more young men than women were
inactive due to being in school or training (35 percent and 17 percent, respectively), while
young women were more likely to cite personal family responsibilities as a reason for their
inactivity (26 percent for young women compared to only 14 percent for young men).
Table 5.2: Distribution of young people without work, available for work but not actively seeking for work by reason for not seeking work, 2015 (percent)
Reason for not seeking work Male
Percent Female Percent
Total Percent
Education leave or training 35.0 16.5 22.4
Personal family responsibilities 14.4 25.8 22.2
Unable or Don't know how or where to find work 16.5 16.3 16.3
Had looked for job(s) 12.3 12.0 12.1
Was waiting opportunity 8.5 11.0 10.2
Own illness, injury or disability 2.9 5.7 4.8
Too young to find a job 7.4 1.7 3.5
Pregnancy 0.0 4.6 3.1
Other reasons 2.9 6.4 5.3
5.1.8 Discouraged young people
Discouraged workers are the portion of the category not working, available to work but
not actively seeking work for a reason implying that they felt that undertaking a job search
would be a futile effort. Out of the estimated 8.5 million young people aged 15-29 years, the
results in Figure 5.5 show that overall, about three percent (about 272,000 youth) were
discouraged at the time of the survey. The proportion was slightly higher for females (about 4
percent) compared to that of males (3 percent). The proportion is almost similar by residence.
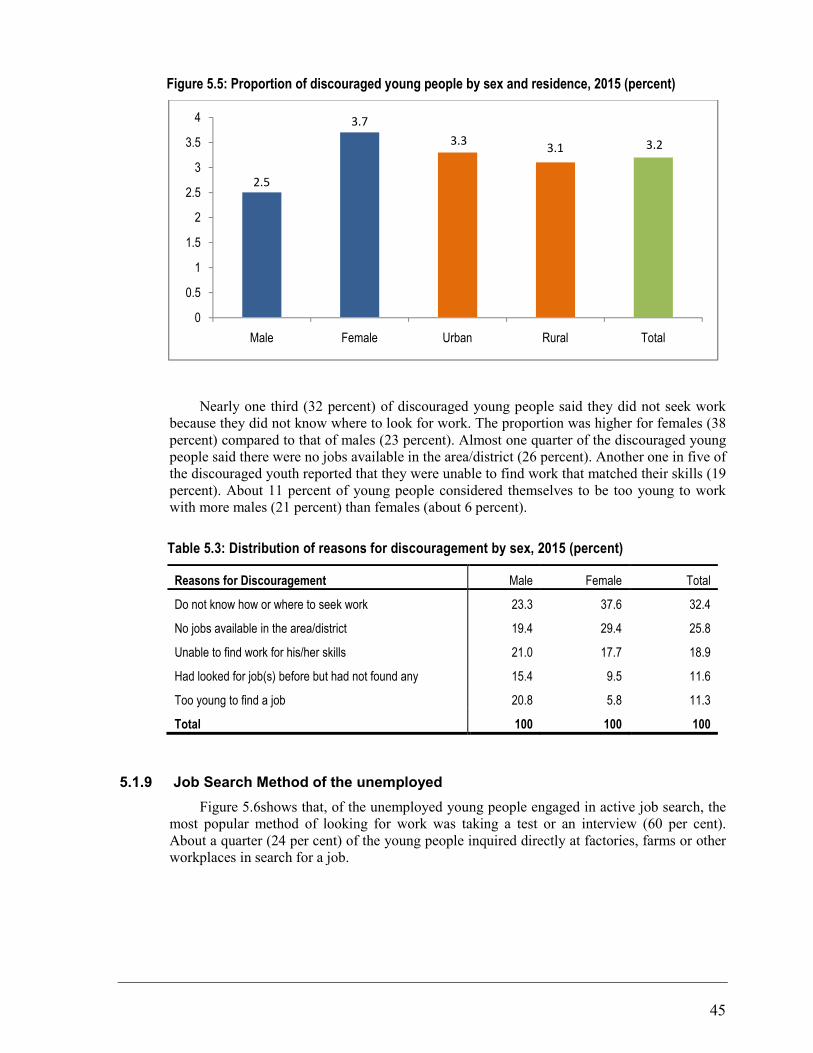
45
Figure 5.5: Proportion of discouraged young people by sex and residence, 2015 (percent)
Nearly one third (32 percent) of discouraged young people said they did not seek work
because they did not know where to look for work. The proportion was higher for females (38
percent) compared to that of males (23 percent). Almost one quarter of the discouraged young
people said there were no jobs available in the area/district (26 percent). Another one in five of
the discouraged youth reported that they were unable to find work that matched their skills (19
percent). About 11 percent of young people considered themselves to be too young to work
with more males (21 percent) than females (about 6 percent).
Table 5.3: Distribution of reasons for discouragement by sex, 2015 (percent)
Reasons for Discouragement Male Female Total
Do not know how or where to seek work 23.3 37.6 32.4
No jobs available in the area/district 19.4 29.4 25.8
Unable to find work for his/her skills 21.0 17.7 18.9
Had looked for job(s) before but had not found any 15.4 9.5 11.6
Too young to find a job 20.8 5.8 11.3
Total 100 100 100
5.1.9 Job Search Method of the unemployed
Figure 5.6shows that, of the unemployed young people engaged in active job search, the
most popular method of looking for work was taking a test or an interview (60 per cent).
About a quarter (24 per cent) of the young people inquired directly at factories, farms or other
workplaces in search for a job.
2.5
3.7
3.33.1 3.2
0
0.5
1
1.5
2
2.5
3
3.5
4
Male Female Urban Rural Total

46
Figure 5.6: Job search method of unemployed young people, 2015 (percent)
Findings further show that none of the unemployed youth registered with an employment
centre, implying that the system of public employment needs to be strengthened in Uganda.
5.1.10 Unemployed Young People who had refused a Job
In the current job market, a good number of the young people had a number of reasons
why they would rather not take employment in a given organisation. The survey findings show
that about 9 percent of the young people aged 15-29 years turned down a job offer for various
reasons. More females (10 percent) than males (7 percent) had turned down job offers.
Figure 5.7:Distribution of unemployed young people who had turned down a job offer by sex, 2015 (Percent)
Table 5.4 presents reasons reported by young people for refusing a job offer. Majority of
them (50 percent) reported that the wages offered to them were too low. Another 26 percent
refused job offers because they felt the jobs were not interesting. Male young people always
wanted better job offers (24 percent) compared to no female young person who advanced this
as a reason for refusing a job. Reasons associated with location and long hours were only
given by the female young people.
13.9
24.1
60.9
12.5 13.2
0.0
20.0
40.0
60.0
80.0
Placed/answered job advertisements
Inquired directly at factories, farms or other workplaces
Took a test or an interview
Waited on the street to be recruited for
casual work
Other method
Proportion, percent
Job search method
7.1
9.88.7
0
2
4
6
8
10
12
Male Female Total
Proportion, percent
Sex

47
Table 5.4: Distribution of reasons for refusing a job, 2015 (Percent)
Reasons for refusing jobs Male Female
Total
Wages offered were too low 48.1 50.4
49.6
Work was not interesting 27.8 24.9
25.9
Location was not convenient 0.0 11.9
7.9
Work would require too many hours 0.0 12.8
8.6
Waiting for a better job offer 24.1 0.0
8.0
Total 100 100
100
The findings further showed that about 63 percent of the unemployed young people were
not willing to work below a certain wage amount per month. This finding showed pronounced
gender variation (48 percent for males and 73 percent for females). Figure 5.8 further indicates
that more urban residents (69 percent) were willing to turn down a job offer below a certain
wage compared to the rural residents (58 percent).
Figure 5.8: Proportion of unemployed that would not accept a job below a certain wage amount, 2015 (Percent)
48.0
72.8
58.2
69.062.6
0.0
20.0
40.0
60.0
80.0
Male Female Rural Urban Total
Proportion, percent
Sex and Residence

48
6. YOUNG PEOPLE NOT ECONOMICALLY ACTIVE
The population not in the labour force (also referred to as the not economically active
population) is generally composed of persons of the working age who during the reference
period of seven days were neither working nor actively looking for work, because of various
reasons.
As indicated in chapter three, the survey estimated the population of young people aged
15-29 years to be about 8.5 million persons. The results in Table 6.1 indicate that 31 percent
(about 2.6 million persons) of the young people aged 15-29 were not economically active. The
proportion was higher for females (34percent) compared to that of males (27percent).
However, there were minor differentials by residence.
There are variations in the inactivity rates by age. The inactivity rate was highest among
those aged 15-19, with almost a half (48 percent) being inactive. The proportion declines with
increasing age, reaching the lowest level of 12 percent in the age group of 25-29 as indicated
in Figure 6.1. The high inactivity rates exhibited can partly be explained by the fact that this is
a school going age and many persons are still not actively looking for work.
Table 6.1: Proportion of young people not economically active by background characteristics, 2013 & 2015 (percent)
2013 2015
Sex Male 31.9 26.5
Female 35.2 33.8
Residence Urban 38.9 32.9
Rural 31.8 29.6
Age group 15-19 48.6 48.3
20-24 22.7 22.5
25-29 12.6 12.3 Total 33.7 30.5
6.1 Reasons for Inactivity by Young People
As indicated in Table 6.2, 71 percent of the total not economically active population of
young people were inactive because they were attending education/training accounted. Those
taking care of family responsibilities or housework, which includes household chores like
cooking, fetching water, washing utensils and clothes, cleaning the house and compound,
accounted for 11 percent of the not economically active population.
More young males than females were inactive due to school attendance (83 and 62
percent, respectively), while young females are more likely to cite family responsibilities as a
reason for their inactivity (18 percent for young females compared to only 2 percent for young
males).

49
Table 6.2: Reasons for not being economically active, 2013 and 2015 (percent)
2013 2015
Male Female Total Male Female Total
Attending education / training 92.7 75.6 84.0 83.2 61.8 71.1
Family responsibilities or housework 1.2 11.8 6.6 2.3 18.0 11.1
Illness, injury or disability 4.3 3.3 3.8 7.5 6.7 7.1
Pregnancy 0.0 2.1 1.1 0.0 5.8 3.3 Other reasons 1.8 7.2 4.6 7.1 7.7 7.4 Total 100 100 100 100 100 100
6.2 Young people Neither in Employment nor Education /Training
The share of young people who were Neither in Employment nor Education/Training
(NEET) captures the non-utilized labour potential of the youthful population sometimes
referred to as ‘idle youth’. It includes young people who are unemployed as well as those who
are inactive for reasons other than participation in education (thus it includes discouraged
workers and persons who are inactive for other reasons such as disability or engagement in
household duties).
The results in Table 6.5 shows that out of the 8.5 million young people aged 15-29, about
1.2 million (14 percent) were neither in employment nor education/training (NEET). The
proportion for female youth who were neither in employment nor education/training was
almost three times that of the male counterparts. There also exist variations in the indicator by
residence. The proportion was higher in urban areas (17 percent) compared to the rural
counterparts (12 percent).
Table 6.5: Proportion of Young people NEET by Sex and Residence, 2013 and 2015 (Percent)
Characteristics
2013 2015
(Percent) (Percent)
Sex Male 7.1 6.9
Female 16.9 19.0
Residence Urban 16.5 16.9
Rural 10.7 12.3
Region Central 16.1 15.9
Eastern 14.8 11.1
Northern 13.9 16.5
Western 5.3 8.8
Total (percent) 12.2 13.5
Total ('000) 1,060 1,152
The results also show that the total number of young people who were neither in
employment, education / training (NEET) increased by almost 2 percentage points between in
2013 from 2015 irrespective of sex and place of residence. The young people who were NEET
at the time of the survey were mostly from the urban areas (17 percent) and females (19
percent).

50
7. STAGES OF TRANSITION
7.1 Concepts and Definitions11
Defining school-to-work transition calls for careful consideration since it is the
definition that determines the interpretation. Most studies define school-to-work transition
as the length of time between the exit from education (either upon graduation or early exit
without completion) to the first entry into stable employment. However, the SWTS was
designed to apply a stricter definition of “stable employment” than is typically used. By
starting from the premise that a person has not “transited” until settled in a job that meets
very basic criteria of stability, as defined by the duration of the employment contract, the
SWTS analytical framework introduces a new element of quality to the standard definition
of labour market transition. However, as seen in previous sections, few young people in
Uganda attain stable employment and, if the “end goal” does not fit reality, then perhaps
the statistics are not framed widely enough. For this reason, the ILO added job satisfaction
as a component and built it into the concept of labour market transition.
More specifically, labour market transition is defined as the passage of a young
person (aged 15–29) from the end of schooling (or entry to first economic activity) to the
first stable or satisfactory job. Based on their experience analysing data from 2012-2013
SWTS datasets, the ILO made slight revisions to the methodology for calculating the
stages of transition. The justification for the revisions, based on lessons learned in the
analyses, is summarized in the ILO Global Employment Trends for Youth 2015, chapter
4.
The revised definition thus acknowledges the transitory state of current students and
also the subjectivity of job satisfaction. The transition is thus considered to be complete
only when a young person has attained a stable job based on a written contract of duration
greater than 12 months or oral agreement with likelihood of retention or has attained a
satisfactory temporary job judged on the young respondent’s willingness to stay there.
Since all current students are counted among those “in transition”, unlike for calculations
based on the 2013 survey that distributed students according to their labour market status,
we are unfortunately not able to compare directly to transition results presented in
Byamugisha et al. (2014). Rather, for comparability across the two surveys, this section
also applies the revised framework for defining the transition to the 2013 survey.
The full definitions of the stages of transition are presented in the glossary in
appendix I.
Two elements of this classification are noteworthy. First, the stages of transition span
across the boundaries of economic activity as defined in the standard labour force
framework12
. The “transited” category includes a sub-set of young people classified as
employed; the remaining employed fall within the category of “in transition”, which
includes those who fall under the strict definition of unemployed and portions of the
11
This section was drafted by the ILO.
12 The international guidelines for measuring statistics on the economically active population, set
out by the 13th International Conference of Labour Statisticians (ICLS) in 1982, provide the
framework for measuring who is counted as employed and as unemployed according to the
economic production boundaries set out by the System of National Accounts.

51
inactive (namely, those without work, available for work but not actively seeking work13
and inactive non-students who have stated an intention to join the labour force at a later
stage). The “transition-not-yet-started” category is the residual of the inactive population.
Second, the stages of transition are not intended to be a normative framework.
Because of the inclusion of young people in satisfactory self-employment and satisfactory
temporary employment, one cannot say that all young people in the transited category
have transited to a “good” job. In fact, many young people in self-employment – the own-
account workers and unpaid family workers – are engaged in the informal economy and,
by definition, these make up the bulk of the country’s share of irregularly employed. Yet
they have expressed a degree of satisfaction with their job, and they are likely to have
finished their transition in the sense that they will remain in the self-employed
classification for the remainder of their working lives.
7.2 Stages of transition of young people
Slightly more than one-quarter (27 percent) of young people (15-29 years) completed
their labour market transition, with only 9 per cent transiting to a stable job. The largest
share of youth in the country remain in transition (about 6 percent) and 17 per cent has not
yet started the transition as shown in Table 7.1. Given that labour market transition is
measured by job stability or satisfaction, it shows that there is limited stable or
satisfactory employment for young people in Uganda. In comparison to 2013, however,
there does seem to be some progress in the transition process; between the two years, the
share of transited young people increased by 4 percentage points and the share remaining
in transition decreased by 3 percentage points.
Table 7.1: Stages of transition of young people by selected background characteristics, 2015 (percent)
Characteristics Male Female Rural Urban Total Total Total (2013)
(Share, (Number, (Share, percent) '000) percent)
Transited 26.9 26.5 25.6 29.5 26.7 2,269 22.5
i) To stable employment 11.7 6.8 6.4 15.6 9.0 764 8.2
ii) To satisfactory employment
15.2 19.7 19.1 13.9 17.7 1,505 14.3
In-Transition 54.2 57.0 56.5 53.8 55.7 4,740 52.8
Transition Not Started 18.1 15.5 17.3 15.1 16.7 1,419 24.6
N/A 0.9 1.0 0.7 1.6 0.9 79 0.1
The statistics provided in Table7.1further shows that among young people, there was no
difference in the proportion of the males who completed their transition (27 percent) compared
to their female counterparts (27 percent). However, more young men were likely to transit to
stable employment (12 percent) compared to young women (7 percent). For those in transition,
there was a higher proportion among the females (57 percent).
In 2015, more than half of young people residing in urban areas, about 30 percent were
likely to complete their transition with about 16 percent to stable jobs. There was a more
13
This is the portion added to the “strictly” unemployed category to make up the unemployed (relaxed
definition).
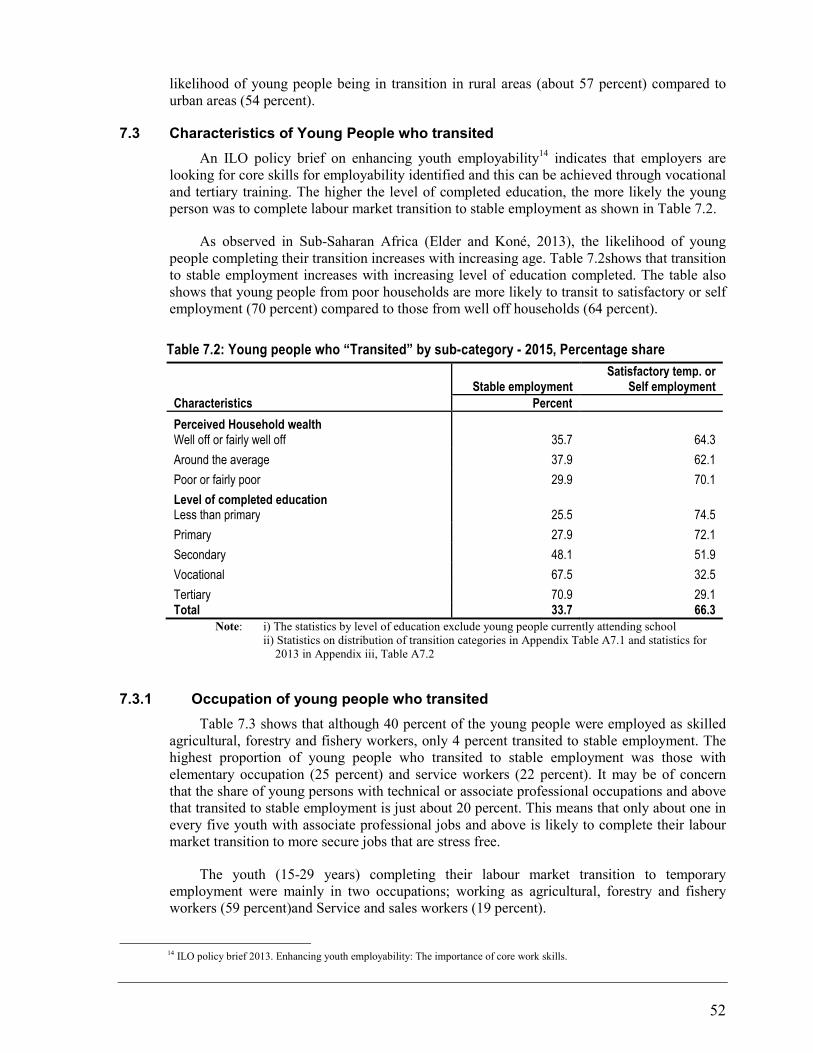
52
likelihood of young people being in transition in rural areas (about 57 percent) compared to
urban areas (54 percent).
7.3 Characteristics of Young People who transited
An ILO policy brief on enhancing youth employability14
indicates that employers are
looking for core skills for employability identified and this can be achieved through vocational
and tertiary training. The higher the level of completed education, the more likely the young
person was to complete labour market transition to stable employment as shown in Table 7.2.
As observed in Sub-Saharan Africa (Elder and Koné, 2013), the likelihood of young
people completing their transition increases with increasing age. Table 7.2shows that transition
to stable employment increases with increasing level of education completed. The table also
shows that young people from poor households are more likely to transit to satisfactory or self
employment (70 percent) compared to those from well off households (64 percent).
Table 7.2: Young people who “Transited” by sub-category - 2015, Percentage share
Characteristics
Stable employment Satisfactory temp. or
Self employment
Percent
Perceived Household wealth
Well off or fairly well off 35.7 64.3
Around the average 37.9 62.1
Poor or fairly poor 29.9 70.1
Level of completed education
Less than primary 25.5 74.5
Primary 27.9 72.1
Secondary 48.1 51.9
Vocational 67.5 32.5
Tertiary 70.9 29.1 Total 33.7 66.3
Note: i) The statistics by level of education exclude young people currently attending school
ii) Statistics on distribution of transition categories in Appendix Table A7.1 and statistics for
2013 in Appendix iii, Table A7.2
7.3.1 Occupation of young people who transited
Table 7.3 shows that although 40 percent of the young people were employed as skilled
agricultural, forestry and fishery workers, only 4 percent transited to stable employment. The
highest proportion of young people who transited to stable employment was those with
elementary occupation (25 percent) and service workers (22 percent). It may be of concern
that the share of young persons with technical or associate professional occupations and above
that transited to stable employment is just about 20 percent. This means that only about one in
every five youth with associate professional jobs and above is likely to complete their labour
market transition to more secure jobs that are stress free.
The youth (15-29 years) completing their labour market transition to temporary
employment were mainly in two occupations; working as agricultural, forestry and fishery
workers (59 percent)and Service and sales workers (19 percent).
14 ILO policy brief 2013. Enhancing youth employability: The importance of core work skills.

53
Table 7.3: Share of young people who “Transited” by sub-category and occupation, 2015 (Percent)
Stable
employment Satisfactory temp. /
self emp. Total
Transited
Skilled agricultural, forestry and fishery workers 3.8 53.7 36.9
Service and sales workers 22.3 21.1 21.5
Elementary occupations 25.1 9.8 15.0
Craft and related trades workers 15.9 7.1 10.1
Plant and machine operators, and assemblers 13.3 6.0 8.4
Professionals 13.8 1.2 5.5
Technicians and associate professionals 3.7 0.6 1.6
Clerical support workers 2.1 - 0.7
Managers - 0.5 0.4 Total 100 100 100
7.3.2 Previous Activities of Young People who Transited
As shown in Table 7.4, out of the different activities, the young people that that attained
their first stable or satisfactory employment came from mainly direct transition (86 percent)
followed by unemployment (7 percent). The share of those that came from some form of
employment (non satisfactory) was low (all with a combined share of about 4 percent).
Table 7.4: Percentage distribution of young people who transited by previous activity to first stable / satisfactory job (flows), 2015
Flow variable Male Female Total
Direct 85.6 86.0 85.8
From unemployment 8.1 6.5 7.3
From inactivity 1.0 3.1 2.1
From non satisfactory employment 2.1 2.0 2.0
From self-employed (not-satisfactory) 1.8 1.1 1.4
From internship 0.6 0.2 0.4
From temporary employment (Not satisfactory) 0.3 0.0 0.1
N/A 0.5 1.0 0.8

54
7.4 Average duration of transition for “transited” youth
Table 7.5 provides information on the lengths of the labour market transition. Lengths are
calculated from the date of graduation (i) to the first job, (ii) to the first “transited” job and (iii)
to the current “transited” job. The various categories might or might not overlap: a young
person could have only one job experience which is deemed stable and/or satisfactory (so that
the first job = first transited job = current transited job) or the young person might have held
several jobs and moved into and out of transition before settling finally into the current stable
and/or satisfactory job (so that the first job ≠ first transited job ≠ current transited job). In a
country like Uganda, with so many moving directly to their transited job (see Table 7.4), we
will expect to see low lengths of transition when the direct transitions are included.
Table 7.5: Average lengths of labour market transitions from end of school by sex (months)
Male Female Total
To first job (any job, including direct transitions) 6.4 5.8 7.0
To first transited job (including direct transitions) 8.7 8.5 8.9
To first transited job (excluding direct transitions) 12.5 12.0 13.1
To current transited job (including direct transition) 24.2 28.1 21.1
To current transited job (excluding direct transitions) 29.4 33.0 26.2
The results show that it took a young person on average 9 months to attain a first job
deemed to be either stable or satisfactory. Taking out the majority share of youth who moved
directly to that first transited job, the average length jumped to 12 months (1 year). It takes
young women only slightly longer than young men to make the transition to a first job
(regardless of quality) and also to the first transited job when the direct transitions are
excluded.
Some young people continue their pathway in the labour market even after attaining a
first transited job – perhaps they are let go from the job or leave to have children or for other
purposes15
. Regardless, it makes sense then that the average lengths to current transited jobs
are longer than the lengths to the first transited job. In Uganda, it took a young person an
average of 24 months to complete the transition to the current transited job (28 months for
young men and 21 months for young women). If we exclude those who moved directly to the
current transited job, the transition duration comes to as long as 29 months, or more than two
years. Regardless of the measure, it is clear that the labour market does have a significant
problem in absorbing many of its young people. Yet still the main problem remains that too
many young people are still working too young and in very poor conditions rather than being
empowered to invest in their education and then hold out for a job of decent quality.
7.5 Characteristics of Young People “In-transition”
Young people in-transition are classified into four major categories; the unemployed
(relaxed definition), those engaged in non-satisfactory self-employment or paid temporary job
that they have expressed dissatisfaction with or if they are inactive non-students with desire to
work in the future. According to the 2015 school-to-work transition survey, the highest
proportion of young people (15-29 years) who were in-transition were in non-satisfactory self-
employment (40 percent) (Table 7.6). Nearly 31 percent were combining school with either
working or looking for work and 17 percent were in unemployment. The smallest categories
15
The Work4Youth team will soon put out a technical brief examining the reasons that young people leave a job
that they deemed as satisfactory and stable. Interested readers should check the website:www.ilo.org/w4y.

55
are young people in non-satisfactory temporary employment (6 percent) and inactive non-
students who aim to work in the future (about 7 percent).
Table 7.6: Young people “in transition” by sub-categories - 2015, Percent
Characteristics Unemployed
(relaxed definition)
In non-satisfactory temporary
employment
In non-satisfactory
self-employment
Active students
Inactive, non-student,
future work plans
Sex Male 9.7 9.4 37.4 41.4 2.2
Female 22.0 3.9 41.8 22.5 9.9
Area of residence
Urban 21.8 10.2 26.8 31.6 9.6
Rural 14.6 4.9 44.6 30.5 5.4
Household wealth
Well off 14.8 4.4 31.9 38.3 10.6
Fairly well off 14.2 8.1 39.2 32.2 6.3
Around the average
18.2 5.6 41.8 28.5 5.8
Level of completed education
Less than primary (including no schooling)
21.4 8.2 60.7 - 9.7
Primary 24.3 7.0 58.7 - 10.0
Secondary 30.2 12.0 49.0 - 8.7
Vocational 29.6 25.8 42.1 - 2.5
Tertiary 30.9 10.7 48.1 - 10.3
Total 16.6 6.3 39.8 30.8 6.5
Both female and male young persons in transition were mostly engaged in non
satisfactory temporary or self employment (42 percent and 37 percent respectively) but the
females were more unemployed (22 percent) compared to the males (10 percent).The share of
the young people in urban areas that remained in transition due to unemployment was nearly
double those in rural areas (22 percent in urban compared to15 percent in rural areas).
Majority of young persons (15-29 years) who remained in transition due to
unemployment considered their household financial situation as well off or fairly well-
off(about 29 percent). Young people with higher levels of education were more likely to be in
temporary or self employment.

56
8. RELEVANT POLICY FRAMEWORK AND POLICY IMPLICATIONS
The country is not creating enough quality jobs to meet the employment needs of the
large cohorts of young people entering the labour market. Crowding for the few jobs created
depresses the wages of young people and leads to compromised working conditions. The
survey findings indicate that 92 percent of the employed young people were in the informal
employment.
8.1 The relevant policies
The National Employment Policy for Uganda, (2011) aims at employment creation
through multi-layered approaches such as accelerated investment; integrated rural
development initiatives; infrastructural development schemes; as well as curricular review.
The other fundamental priority action area within it is the operationalisation of a functional
labour market information and analysis system.
The National Gender Policy, (2007) focuses on gender parity in labour markets. It calls
for systematic empowerment of female workers and removal of constraints on the
participation of female workers in the labour market. It also prescribes affirmative action to
cure defects in the labour markets.
The National Youth Policy (Revised Draft, 2016): The difference between the National
Youth Policy, (2001) and this revised (draft) National Youth Policy, (2016) is that it seeks to
include young adolescents (14-17) in official Government policies and plans which define a
youth as between 18-30 years. This policy once approved, will cater for young male and
female workers joining employment markets.
The Oil and Gas Policy (2009) aims to maximise local content through participation in
procurement, prospection, exploration and production processes for all categories of workers
in the nascent Oil and Gas industry of Uganda.
The Social Protection Policy, (2015) recognises the importance of direct income support
to vulnerable groups that include both the young and old and undertakes a co-ordinated
approach to social protection and inclusion.
The HIV and the World of Work Policy, (2006) stresses putting HIV/AIDS prevention,
care, support and treatment services in the world of work. This policy targets both young and
old workers and fights stigma as well.
The Medium, Small and Micro Enterprises Policy lays down detail on supporting
evolution and development of medium, small and micro-enterprises for entrepreneurs as a
form of employment creation. However, this policy is silent on women entrepreneurship.
8.2 Long and medium term strategies and plans
The BTVET Strategic Plan (2011-2020): The aim of this plan is to review the current
technical programmes in the education sub-sector to a comprehensive skills-sets development.
This undertaking is dictated by the need to make Uganda’s education, particularly, vocational
and technical education relevant to Uganda’s private sector labour or manpower needs. It
operationalises the BTVET Act (2009) which provides for the creation of Directorate of
Industrial Training (DoIT) to superintend over apprenticeship schemes for skills creation. This
is aimed at equipping young workers with skills ready for Uganda’s labour markets. It also

57
proposes the establishment of a Skills Development Authority (SDA) to co-ordinate the
process of skills’ implantation.
The Vision 2040 and National Development Plan II (2015/16-19/2020): The
operationalisation of the Vision 2040 is based on National Development Plans. These two are
hinged on employment creation strategies for the youth through a variety of strategies. The
focus is on removing binding constraints to investments, industrialisation and wealth creation.
Youth employment is at the core of these two blueprints.
8.3 Policy Implications and Recommendations
Education relevance and quality: The SWTS-2015 findings reveal that young persons
with tertiary level of education had higher levels of unemployment (12 percent) than the
national average (7 percent). This raises questions as to whether the country can match the
education skills received from tertiary institutions with the available vacancies in the labour
market. This calls for education institutions to provide graduates with the soft and technical
skills needed to prepare youth to enter the labour market.
This can be achieved through:
(i) Involvement of employers in the identification of skills standards and training needs;
(ii) Linkage of training and work;
(iii) Establishment of innovative systems for on-the-job training and youth apprenticeships
(iv) Introducing regular and independent monitoring of the quality of education.
(v) Raising awareness of the importance of quality education, BTVET and lifelong
learning;
The proportion of young people who dropped out of school before completing primary was
44 percent and nine percent did not attend school at all. Gender differentials show that more
females than males did not have any formal education and more than twice more females than
males leave school early because parents do not want them to go to school. Such statistics is
very critical in assessing the effectiveness of government programs such as UPE in
maintaining children in school. It also provides information drop out stage of young people in
the education cohort to start economic activities which is the beginning of assessment of
transition status of young people. Similarly, the mean years of schooling provides
opportunities in placing target age group related interventions.
Skilling for young men and women: The SWTS 2015 results revealed that although the
unemployment rate was higher among the better educated, the survey results indicated that
investing in education (especially vocational) results into positive returns in wage / salaried
employment. Although Uganda continues to face the challenge of inadequacy of skilled
labour force, the survey established that most (80 percent) of young working Ugandans were
under-educated for the work they were doing which causes doubt in the process of job hiring.
Still, with only 3.4 per cent of youth completing tertiary education, the primary bulk of
investment in skills development should target the lesser educated.
Under the BTVET Act and Strategic Plan, creation of a Skills Development Authority is
envisioned but this has remained on paper. Skilling of young male and female workers may
require targeting emerging sectors such as the Oil and Gas industry. Others include, certified
skills in hoisting and lifting; machine operations; welding (plating); welding (pipe); welding

58
(piping); general craftsmen and heavy duty driving which are the major occupations in the
country save for the agricultural workers.
For adequate skilling to be attained there will be need to increase skills budget and to
ensure that a comprehensive educational curriculum review is undertaken to emphasize skills
and practical courses at very early stages of education as opposed to theoretical education.
This is given the fact that many young people drop out of education at early stages such as
primary to engage in economic activities yet transition is mainly completed in skills related
occupations.
Facilitate the financial inclusion of young persons and access to credit for existing enterprises: Access to finance has been consistently listed as a major constraint for enterprises
to expand their capacity through investments that lead to the creation of new jobs. This is
particularly important in countries like Uganda where a majority of establishments are micro-
and small enterprises.
The findings revealed that the most common problem faced by young people in self-
employment was limited financial resources (26 percent). However, very many young persons
in self-employment did not access funds from formal financial institutions. This could be
associated with the fact the age for access to finance is 18 years and above and those below
may not have collateral including inability to use inheritance which is considered for adult age.
Consequently, measures aimed at improving financial inclusion are likely to stimulate
labour demand and thereby generate new employment opportunities for young people. These
may include:
(i) Increased and targeted funding to programmes such as the Youth Livelihood
programme, Operation Wealth Creation (OWC) and National Agricultural Advisory
Services (NAADS) which are critical vehicles through which employment creation for
the young people can be effected.
(ii) Inclusion of young adolescents (14-17) in National Youth Policies in conformity with
Labour market definition of working age population and to allow early participation by
young people. Responsibility starts early since many young people leave school to work
as early as primary.
Regularize the Informal sector: The SWTS 2015 has highlighted a series of challenges
among which was informal employment which was about 92 percent. Informal employment is
associated with widespread decent work deficits and low wages. There is need to pursue
formalisation of the informal sector through conscious strategies. There is need for an
Informal Sector Development Strategy to provide coherent policy and interventions’ direction.
To begin with, there is need for digitalization and getting more information about the
informal sector enterprises in Uganda to ensure their traceability, easy monitoring and
regulation. To achieve this:
i. Comprehensive studies should be undertaken to locate its enclaves by determining where
they are and what they are doing. It should also be mapped to establish its geospatial or
spatial distribution. Location, scoping and mapping of the informal sector enterprises has
incidental benefits to it for instance, connection to local, regional and international
markets. Products from their cottage industries can be marketed with effective and
efficient production processes’ arrangement and organisation.

59
ii. There is need to have an Informal Sector Management Information System for ease of
tracking and monitoring. Informatisation and digitalization have benefits in as far as
financial and capacity-enhancement targeting are concerned.
iii. Uganda’s informal sector enterprises are also dotted with widespread decent work
deficits. Effective policies in relation to the Employment Law of 2006 can be developed
to allow for the regulation of this sector.
Improvement of an Integrated Labour Market Information System: The Government of
Uganda has established a labour market information system coordinated by the Ministry of
Gender, labour and Social Development. However this system may require improvement as
follows:
i. The system should be integrated with key players in the labour sector to feed in
information on the labour market continuously. The systems should be popularized and
young persons should be able to easily access information in the system through the
common economic means such as social media.
ii. Real-time and secondary data on the challenges young people face during their transition
into the national labour is very critical in designing high impact employment strategies.
Labour market information will be required regularly to provide indicators in the labour
market as an input to the information system.
8.4 Conclusion
The transition of young people to first transited job takes between 9 to 12 months on
average and young people follow difficult paths such as unemployment. The characteristics of
the young people and the social dynamics within the country may partly explain the lengthy
and difficult path that they take to transit. Further research on the reasons and relationships
may be advanced in the following areas, among others.
� About 10 percent of the unemployed young females turn down jobs even when offered one.
� Parents life history and education background is likely to persist in young persons lives. A link
between these two groups would be ideal for policy.
� The possibility of examining statistical significant of the indicators changes across the two
survey periods-using tests such as t-tests statistic.
� Exploring the group that left school before graduation in terms of sustainability of education
programmes such as UPE and USE given the high level of financial inputs.
� Exploring the mean years of schooling for this ages cohort to establish dropout rate and putting
in place target age group related interventions.

60
REFERENCES
African Economic Outlook, 2015: Youth unemployment.
http://www.africaneconomicoutlook.org/en/theme/developing-technical-vocational-skills-in-
africa/tvsd-in-specific-contexts/youth-unemployment/
Byamugisha . J; Leyla S.; TakaakiKizu. 2014. Labour market transitions of young women and men in
Uganda, Work4Youth Publication Series No. 24 (Geneva, ILO).
Constitution of the Republic of Uganda, 1995.
http://www.statehouse.go.ug/sites/default/files/attachments/Constitution_1995.pdf
Elder, S.; Koné, K.S. 2013. Labour market transitions of young women and men in sub-Saharan
Africa, Work4Youth Publication Series No. 9 (Geneva, ILO).
International Labour Organization (ILO). 2013. Global employment trends for Youth, 2013 (Geneva).
-- . 2013. Enhancing youth employability: The importance of core work skills, Skills for Employment
Policy Brief, Geneva.
Ministry of Education and Sports. 2013. Annual Statistical Abstract, 2013
Sparreboom, T.; Staneva, A. 2014. Is education the solution to decent work Is education the solution to
decent work for youth in developing economies? Identifying qualifications mismatch from 28 school-
to-work transition surveys, Work4Youth Publication Series No. 23 (Geneva, ILO).
United Nations (UN). 2015: Youth and Education.
http://www.un.org/esa/socdev/documents/youth/fact-sheets/youth-education.pdf

61
APPENDICES

62
Appendix i: Definitions of Labour concepts
1. The following units are defined according to the standards of the International Conference of
Labour Statisticians:
a. The employed include all persons of 15 years of age or more who, during a week of reference:
i. worked for wage or profit (in cash or in kind) for at least one hour;
ii. were temporarily absent from work (because of illness, leave, studies, a break in the
activity of the firm, for example), but had a formal attachment to their job;
iii. - performed some work without pay for family gain.
b. Employment to Population Ratio (EPR): The proportion of the population that is employed. It is
the ratio of the currently employed population 15 years of age or more to the total working
age population of the country.
c. Labour Force Participation Rate (LFPR): A measure of the active proportion of the labor
force in an economy. The participation rate refers to labour force (people who are either
employed or are actively looking for work) expressed as a percentage of the working age
population. The labour force participation rate is the labour force expressed as a percentage of
the total working-age population.
d. The unemployed (strictly defined) include all persons of 15 years of age or more who met the
following three conditions during the week of reference:
i. they did not work (according to the abovementioned definition);
ii. they were actively searching for a job or took concrete action to start their own business;
iii. they were available to start work within the two weeks following the reference week.
e. c. Persons neither included in the employed nor in the unemployed category are classified as
not in the labour force (also known as inactive).
2. The International Classification of Status in Employment (ICSE) categorizes the employed
population on the basis of their explicit or implicit contract of employment, as follows:
a. Employees (also wage and salaried workers) are all those workers who hold the type of jobs
defined as “paid employment jobs”, where the incumbents hold explicit (written or oral) or
implicit employment contracts that give them a basic remuneration which is not directly
dependent upon the revenue of the unit for which they work.
b. Employers are those workers who, working on their own account or with one or a few
partners, hold the type of jobs defined as “self-employment jobs” (i.e. jobs where the
remuneration is directly dependent upon the profits derived from the goods and services
produced) and, in this capacity, have engaged, on a continuous basis, one or more persons to
work for them as employee(s).
c. Own-account workers are those who, working on their own account or with one or more
partners, hold the type of jobs defined as “self-employment jobs” and have not engaged, on a
continuous basis, any employees to work for them.
d. Contributing (unpaid) family workers are those workers who hold “self-employment jobs”
as own-account workers in a market-oriented establishment operated by a related person living
in the same household.
3. The employed are also classified by their main occupation, in accordance with the
International Standard Classification of Occupations (ISCO-08).
4. A household is a family or other community of persons living together and jointly spending
their income to satisfy the basic necessities of life. The concept of household includes
members present in the place where the household resides, as well as individuals who are
temporarily absent and living elsewhere, including abroad, for business, education or other
purposes, as long as their residence in the foreign country does not exceed one year. A person
living alone can also qualify as a household (“single household”) if she or he does not already
belong to another unit. The single household can reside in a separate or shared dwelling, and
will be considered as an independent unit as long as the household’s income is not shared with

63
other residents. Collective households, such as prisons and institutions, and their members are
not observed in the Labour Force Survey.
5. The reporting period, to which the questions for the economic activity are related, is the
week before the day of interview.
6. The following units are also defined within the SWTS analysis but are outside the scope of
those defined within the international framework of labour market statistics mentioned in item
1 above:
a. Labour underutilization rate – the sum of shares of youth in irregular employment,
unemployed (relaxed definition) and youth neither in the labour force nor in education/training
(inactive non-students) as a percentage of the youth population.
b. Regular employment – the sum of employees with a contract (oral or written) of 12months or
more in duration and employers; the indicators are therefore a mix of information on status in
employment and contract situations.
TRANSITION CATEGORIES
7. Transited – A young person who has “transited” is one who is currently employed and not in
school in:
a. a stable job
i. based on a written contract of duration at least 12 months, or
ii. based on an oral agreement and likely to keep the job over the next 12 months;
b. a satisfactory temporary job
i. based on a written contract of duration less than 12 months and does not want
to change the job, or
ii. based on an oral agreement; not certain to keep the job over the next 12
months and does not want to change the job; or
c. satisfactory self-employment (in self-employed status and does not want to change the
job).
8. In transition – A young person still “in transition” is one who is currently:
a. an active student (employed or unemployed);
b. unemployed (non-student, relaxed definition);
c. employed in a temporary and non-satisfactory job
i. based on a written contract of duration less than 12 months and wants to
change the job, or
ii. based on an oral agreement; not certain to keep the job over the next 12
months and wants to change the job;
d. in non-satisfactory self-employment (in self-employed status and wants to change the
job); or
e. inactive and not in education or training, with the aim of looking for work later.
9. Transition not yet started – A young person whose “transition has not yet started” is one who is
currently:
a. still in school and inactive (inactive student); or
b. inactive and not in education or training (inactive non-student), with no intention of
looking for work.

64
Appendix ii: CVs for selected variables
CHARACTERISTICS OF YOUNG PEOPLE Estimate std. Error CV Confidence limits
Lower Upper Observations
Youth population
Total 8,506,688 238,171 2.8 8,037,275 8,976,101 3,049
Sex
Male 3,852,665 137,313 3.6 3,582,034 4,123,297 1,390
Female 4,654,023 142,743 3.1 4,372,689 4,935,356 1,659
Residence
Urban 2,367,967 146,221 6.2 2,079,780 2,656,154 790
Rural 6,138,721 188,002 3.1 5,768,186 6,509,256 2,259 Distribution of the youth population
Age group
15–19 0.413 0.011 2.6 0.391 0.434 3,049
20–24 0.325 0.009 2.7 0.308 0.343 3,049
25–29 0.262 0.009 3.4 0.244 0.279 3,049
Marital status
Single / Never married 0.582 0.012 2.1 0.557 0.606 3,048
Married 0.394 0.013 3.2 0.368 0.419 3,048
Separated / Divorced 0.023 0.003 13.1 0.017 0.029 3,048
Widowed 0.002 0.001 44.4 0.000 0.003 3,048 Current schooling status
Never went to school 0.061 0.013 21.5 0.035 0.087 3,049
Left before graduation 0.512 0.015 3.0 0.482 0.542 3,049
Completed school 0.094 0.008 8.6 0.078 0.110 3,049
Currently attending school 0.333 0.013 3.9 0.307 0.358 3,049 Distribution of youth by main economic activity
Employed 0.645 0.016 2.4 0.614 0.677 3,049
Employed students 0.117 0.009 7.6 0.099 0.134 3,049
Unemployed (strict) 0.045 0.005 10.4 0.036 0.054 3,049
Unemployed non-students (strict) 0.035 0.004 11.3 0.027 0.043 3,049
Unemployed (relaxed) 0.146 0.011 7.4 0.124 0.167 3,049
Unemployed non-students (relaxed) 0.092 0.007 7.8 0.077 0.106 3,049
Inactive (strict) 0.306 0.015 4.8 0.278 0.335 3,049
Inactive (relaxed) 0.206 0.010 5.0 0.185 0.226 3,049
Current students 0.333 0.013 3.9 0.307 0.358 3,049
Employed young people by selected background characteristics
Age
15-19 0.303 0.013 4.4 0.277 0.330 1,961
20-24 0.359 0.011 3.1 0.336 0.381 1,961
25-29 0.338 0.013 3.8 0.313 0.364 1,961

65
CHARACTERISTICS OF YOUNG PEOPLE Estimate std. Error CV Confidence limits
Lower Upper Observations
Marital status
Single/never married 0.482 0.016 3.3 0.451 0.514 1,961
Married 0.488 0.016 3.3 0.456 0.520 1,961
Ever married but currently not in union 0.029 0.004 13.7 0.021 0.037 1,961
Missing/Not Stated 0.001 0.001 99.7 (0.001) 0.002 1,961
Area of Residence
Rural 0.741 0.014 1.9 0.713 0.768 1,961
Urban 0.259 0.014 5.4 0.232 0.287 1,961
Region
Central 0.281 0.030 10.7 0.222 0.340 1,961
Eastern 0.230 0.031 13.4 0.169 0.291 1,961
Northern 0.276 0.037 13.2 0.204 0.348 1,961
Western 0.213 0.032 15.1 0.150 0.276 1,961
Education Attainment
No Education 0.100 0.023 22.9 0.055 0.145 1,598
Primary 0.676 0.023 3.3 0.632 0.721 1,598
Secondary 0.142 0.012 8.3 0.119 0.165 1,598
Vocational 0.046 0.006 12.8 0.034 0.058 1,598
Tertiary 0.034 0.006 17.0 0.023 0.046 1,598
Missing 0.002 0.001 70.7 -0.001 0.004 1,598 Distribution of youth employment by aggregate sector
Agriculture 0.572 0.019 3.3 0.535 0.609 1,961
Industry 0.108 0.010 9.2 0.089 0.128 1,961
Services 0.320 0.017 5.2 0.287 0.353 1,961 Employed youth by occupation (ISCO-08)
Professionals 0.036 0.005 13.3 0.027 0.045 1,961
Service and sales workers 0.187 0.012 6.5 0.163 0.210 1,961 Skilled agricultural, forestry and fishery workers 0.520 0.019 3.7 0.482 0.557 1,961
Craft and related trades workers 0.077 0.008 9.8 0.062 0.092 1,961 Plant and machine operators, and assemblers 0.049 0.005 10.0 0.039 0.059 1,961
Elementary occupations 0.116 0.011 9.1 0.095 0.137 1,961
Others 0.016 0.003 21.0 0.009 0.022 1,961 Employed youth by status in employment
Employee 0.249 0.016 6.3 0.218 0.280 1,961
Employer 0.039 0.005 13.1 0.029 0.050 1,961
Own-account worker 0.431 0.018 4.1 0.396 0.466 1,961
Member of a producers' cooperative 0.001 0.001 99.4 -0.001 0.003 1,961
Contributing family workers 0.277 0.019 6.9 0.240 0.314 1,961
Other 0.003 0.001 52.8 0.000 0.006 1,961
Type of Employment Agreement
A written contract 0.190 0.021 11.0 0.149 0.231 460
An oral agreement 0.810 0.021 2.6 0.769 0.851 460
Nature of contract
Unlimited duration 0.707 0.026 3.7 0.655 0.759 475
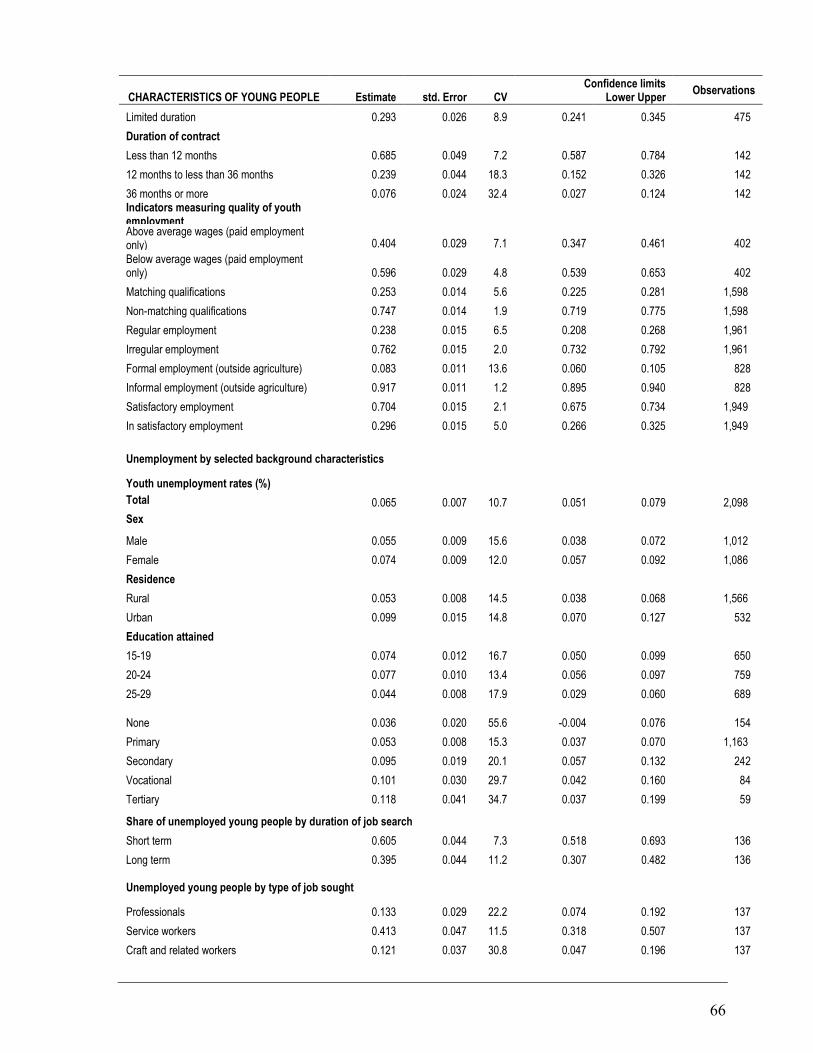
66
CHARACTERISTICS OF YOUNG PEOPLE Estimate std. Error CV Confidence limits
Lower Upper Observations
Limited duration 0.293 0.026 8.9 0.241 0.345 475
Duration of contract
Less than 12 months 0.685 0.049 7.2 0.587 0.784 142
12 months to less than 36 months 0.239 0.044 18.3 0.152 0.326 142
36 months or more 0.076 0.024 32.4 0.027 0.124 142 Indicators measuring quality of youth employment Above average wages (paid employment only) 0.404 0.029 7.1 0.347 0.461 402
Below average wages (paid employment only) 0.596 0.029 4.8 0.539 0.653 402
Matching qualifications 0.253 0.014 5.6 0.225 0.281 1,598
Non-matching qualifications 0.747 0.014 1.9 0.719 0.775 1,598
Regular employment 0.238 0.015 6.5 0.208 0.268 1,961
Irregular employment 0.762 0.015 2.0 0.732 0.792 1,961
Formal employment (outside agriculture) 0.083 0.011 13.6 0.060 0.105 828
Informal employment (outside agriculture) 0.917 0.011 1.2 0.895 0.940 828
Satisfactory employment 0.704 0.015 2.1 0.675 0.734 1,949
In satisfactory employment 0.296 0.015 5.0 0.266 0.325 1,949
Unemployment by selected background characteristics
Youth unemployment rates (%)
Total 0.065 0.007 10.7 0.051 0.079 2,098
Sex
Male 0.055 0.009 15.6 0.038 0.072 1,012
Female 0.074 0.009 12.0 0.057 0.092 1,086
Residence
Rural 0.053 0.008 14.5 0.038 0.068 1,566
Urban 0.099 0.015 14.8 0.070 0.127 532
Education attained
15-19 0.074 0.012 16.7 0.050 0.099 650
20-24 0.077 0.010 13.4 0.056 0.097 759
25-29 0.044 0.008 17.9 0.029 0.060 689
None 0.036 0.020 55.6 -0.004 0.076 154
Primary 0.053 0.008 15.3 0.037 0.070 1,163
Secondary 0.095 0.019 20.1 0.057 0.132 242
Vocational 0.101 0.030 29.7 0.042 0.160 84
Tertiary 0.118 0.041 34.7 0.037 0.199 59
Share of unemployed young people by duration of job search Short term 0.605 0.044 7.3 0.518 0.693 136
Long term 0.395 0.044 11.2 0.307 0.482 136 Unemployed young people by type of job sought
Professionals 0.133 0.029 22.2 0.074 0.192 137
Service workers 0.413 0.047 11.5 0.318 0.507 137
Craft and related workers 0.121 0.037 30.8 0.047 0.196 137

67
CHARACTERISTICS OF YOUNG PEOPLE Estimate std. Error CV Confidence limits
Lower Upper Observations
Others 0.333 0.041 12.2 0.252 0.414 137 Unemployed young people by household Financial Situation
Fairly well off 0.138 0.034 25.0 0.069 0.206 137
Around the national average 0.281 0.042 15.0 0.197 0.365 137
Poor 0.582 0.054 9.3 0.474 0.690 137 Proportion of discouraged youth by sex and residence
Total 0.032 0.004 11.7 0.025 0.040 3,049
Sex
Male 0.026 0.005 20.4 0.016 0.036 1,390
Female 0.038 0.005 12.7 0.028 0.047 1,659
Residence
Rural 0.032 0.005 14.8 0.023 0.041 2,259
Urban 0.034 0.006 18.2 0.022 0.046 790
Reasons for discouragement
Do not know how or where to seek work 0.327 0.059 17.9 0.210 0.444 102
Unable to find work for his/her skills 0.185 0.041 22.0 0.104 0.267 102
Had looked for job(s) before but had not found any 0.125 0.039 31.4 0.047 0.204 102
Too young to find a job 0.110 0.035 31.8 0.040 0.180 102
No jobs available in the area/district 0.253 0.048 19.0 0.157 0.349 102
Proportion of young people not economically active
Total 0.307 0.015 4.8 0.278 0.337 3,039
Sex
Male 0.267 0.016 5.9 0.236 0.298 1,386
Female 0.341 0.018 5.4 0.305 0.377 1,653
Residence
Urban 0.332 0.025 7.6 0.282 0.382 789
Rural 0.298 0.018 6.0 0.263 0.333 2,250
Age group
15-19 0.486 0.022 4.5 0.443 0.529 1,271
20-24 0.227 0.019 8.2 0.190 0.264 979
25-29 0.126 0.014 10.9 0.099 0.153 789
Education attained
No education 0.097 0.028 28.9 0.042 0.153 172
Primary 0.172 0.015 8.6 0.143 0.202 1,406
Secondary 0.138 0.025 18.1 0.089 0.187 280
Vocation 0.057 0.024 42.4 0.009 0.104 89
Tertiary 0.080 0.032 40.9 0.015 0.144 64
Reasons for not being economically active
Attending education/training 0.679 0.028 4.1 0.624 0.733 624
Family responsibilities 0.108 0.015 14.0 0.078 0.138 624
Pregnancy 0.030 0.007 24.6 0.016 0.045 624
Illness, injury or disease 0.066 0.011 16.2 0.045 0.087 624

68
CHARACTERISTICS OF YOUNG PEOPLE Estimate std. Error CV Confidence limits
Lower Upper Observations
Pregnancy 0.068 0.013 18.7 0.043 0.093 624
Other reasons 0.049 0.011 22.5 0.027 0.071 624
Young people Neither in Employment nor Education Training
Proportion
Total 0.136 0.009 6.5 0.119 0.154 3,049
Sex
Male 0.069 0.008 12.1 0.053 0.086 1,390
Female 0.192 0.013 6.7 0.167 0.217 1,659
Residence
Urban 0.171 0.017 9.7 0.138 0.204 790
Rural 0.123 0.010 8.5 0.102 0.144 2,259
Region
Central 0.162 0.016 9.7 0.131 0.192 817
Eastern 0.112 0.020 17.7 0.073 0.151 798
Northern 0.165 0.018 10.8 0.130 0.200 881
Western 0.088 0.014 15.8 0.061 0.116 553

69
Appendix iii: Additional Statistical Tables
Table A3.0: Key Labour market indicators for Young people (15-29 years) by selected characteristics, 2015
Characteristics Male Female Urban Rural Total
Total Population ('000) 3,853 4,654 2,368 6,139 8,507
Total Population ('Percent) 45.3 54.7 27.8 72.2 100
Proportion of household heads (Percent) 29.8 4.7 20.8 14.3 16.1 Age group
15–19 45.3 37.9 34.2 44.0 41.3
20–24 30.5 34.2 36.3 31.1 32.5
25–29 24.2 27.9 29.5 24.9 26.2
Current Activity Status Employed 69.1 60.8 60.1 66.2 64.5
Strict framework1 Unemployed 4.1 4.9 6.6 3.7 4.5
Unemployed non-students 2.6 4.3 5.1 2.9 3.5
Inactive 26.5 33.8 32.9 29.6 30.5
Relaxed framework2 Unemployed 11.3 17.5 19.4 12.9 14.7
Unemployed non-students 5.2 12.5 11.7 8.3 9.2
Inactive 19.4 21.2 20.2 20.4 20.4
Employment to Population Ratio (EPR) 69.1 60.8 60.1 66.2 64.5
Labour Force Participation Rate (LFPR)-Strict 73.1 65.6 66.7 69.9 69
Sector of Employment of young people
Agriculture 53.3 60.9 18.2 70.9 57.2
Industry 15.9 6.1 14.1 9.7 10.8
Services 30.9 33.0 67.6 19.5 32.0
Wage Employment of young people 32.4 17.8 17.0 47.5 24.9
informal employment rate 90.8 93.0 86.9 93.7 91.9
Labour underutilisation (% of youth population) 30.4 35.8 40.6 30.5 33.3
Unemployment rates 5.5 7.4 9.9 5.3 6.5
Unemployment rates (relaxed definition) 14 22.4 24.2 16.2 18.6
Discouraged young people 2.6 3.7 3.7 3.2 3.2
Young people not economically active 26.7 34.1 33.2 29.8 30.7
Young people NEET 6.9 19.0 16.9 12.3 13.5
Stages of transition of young people Transited 26.9 26.5 29.5 25.6 26.7
i) To stable employment 11.7 6.8 15.6 6.4 9.0
ii) To satisfactory employment 15.2 19.7 13.9 19.1 17.7
In-Transition 54.2 57.0 53.8 56.5 55.7
Transition Not Started 18.1 15.5 15.1 17.3 16.7
N/A 0.9 1.0 1.6 0.7 0.9

70
TABLE A7.1: Distribution of transition categories of young people (15-29 Years) by background characteristics, (2015) percent
Characteristics
Transited to stable
employment
Transited to satisfactory self- or temp. employment
In transition Total
Percent Percent Percent Percent
Sex
Male 14.4 18.8 66.8 100
Female 8.1 23.6 68.3 100
Area of residence
Rural 7.8 23.3 68.8 100
Urban 18.7 16.7 64.6 100
Perceived household wealth
Well off 12.9 23.3 63.7 100 Around the average 13.5 22.2 64.3 100
Poor 8.8 20.6 70.6 100
Level of completed education
None or lower than primary 10.2 29.9 59.9 100
Primary 10.3 26.8 62.9 100
Secondary 20.8 22.5 56.7 100
Vocational 35.5 17.1 47.4 100
Tertiary 37.3 15.3 47.4 100
Total (Share, percent) 10.9 21.5 67.7 100
Total (Number, ‘000) 764 1,505 4,740 7,009

71
Table A7.2: “Transited” youth by sub-category - 2013, Percentage share
15-29
Characteristics
Stable employment Satisfactory temporary
employment Satisfactory self-
employment
% % %
Sex
Male 43.4 4.7 52.0
Female 25.6 2.0 72.4
Area of residence
Urban 52.8 7.9 39.2
Rural 25.2 1.1 73.7
Household wealth
Well off 35.7 8.3 56.1
Around the average 37.9 3.5 58.7
Poor 29.9 1.7 68.5
Level of completed education
No education or less than primary 25.5 2.3 72.2
Completed primary 27.9 4.5 67.6
Secondary 48.1 5.2 46.7
Vocational education 67.5 2.1 30.4
Tertiary 70.9 2.8 26.4
Total 33.7 3.2 63.1
Source: SWTS 2013
72
Appendix iv: List of Field staff
HEAD OFFICE SUPERVISION
Name
Title
Ben Paul Mungyereza Executive Director
Imelda Atai Musana Deputy Executive Director
Andrew Mukulu Director-Population and Social Statistics
Wilson Nyegenye Principal Statistician
Michael Ogen Sijje Senior Statistician
Dorcas Nabukwasi Senior Statistician
Simon Kyewalyanga Statistician
Sharon Apio
Statistician OFFICE EDITORS
No. First name Middle name Sex 1 Namiyonga Noor F Kassim Female 2 Mubiru Emmanuelson Male
FIELD SUPERVISORS No First name Middle name Sex 1 Tumuhikye Martin Male 2 Kavuma Patrick Male 3 Feni Benard Male 4 Kagarura Gilbert Male 5 Ilelit Ebyau Sam Male 6 Birungi Sarah Female 7 Byawaka Peter Male 8 Tabingwa Joyce Alice Female
FIELD INTERVIEWERS SN Surname First name Other name Sex 1 Obuya Patrick Male 2 Opio Peter Male 3 Jjemba Mahadi Male 4 Namubiru Rebecca Female 5 Nakyambadde Jane Gladys Female 6 Makonje Grace Kisombo Female 7 Nakaayi Claire Elizabeth Female 8 Ssemwanga Hassan Hussien Male 9 Sentuya Gerald Majella Male
10 Achola Harriet Female 11 Nono Polycarp Male 12 Nyadoi Faith Lydia Female 13 Khisa Pamela Female 14 Kantono Josephine Female 15 Ojambo Milton Male 16 Agani Richard Male 17 Opio Paul Male 18 Odinia Gloria Female 19 Karambe Fiona Ley Female 20 Kwikiriza Daniel Male 21 Atuha Jonah Female 22 Kobusinge Lilian Female 23 Ssensamba Matia Male 24 Kobusinge Eve Female DRIVERS
1. Kasunsuni Perterson 4. Sekiranda
Rogers 7. Tumwine Apollo
2. Nyiiro Charles 5. Kiiza David 8. Tumwejukye Moses
3. Simbwa Hassan 6. Warukwagana
Musa