The MENA Report on Policies for Sustainable … MENA Report on Policies for Sustainable...
36
The MENA Report on Policies for Sustainable Competitiveness PROPOSED FRAMEWORK AND ROADMAP 31 st March 2010, Tunis OECD Private Sector Development Division
Transcript of The MENA Report on Policies for Sustainable … MENA Report on Policies for Sustainable...
The MENA Report on Policies for Sustainable Competitiveness
PROPOSED FRAMEWORK AND ROADMAP
31st March 2010, Tunis
OECD Private Sector Development Division

Agenda
2
1. Overview and Aims
2. The Approach
3. Calendar and next steps
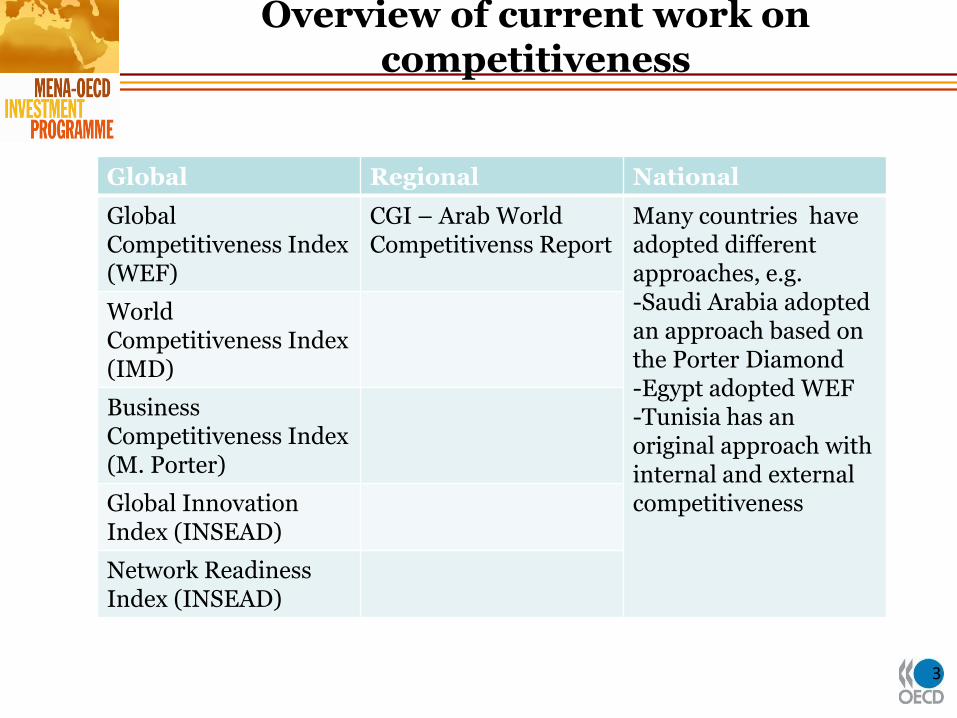
Overview of current work on competitiveness
Global Regional National
Global Competitiveness Index (WEF)
CGI – Arab World Competitivenss Report
Many countries have adopted different approaches, e.g. -Saudi Arabia adopted an approach based on the Porter Diamond -Egypt adopted WEF -Tunisia has an original approach with internal and external competitiveness
World Competitiveness Index (IMD)
Business Competitiveness Index (M. Porter)
Global Innovation Index (INSEAD)
Network Readiness Index (INSEAD)
3
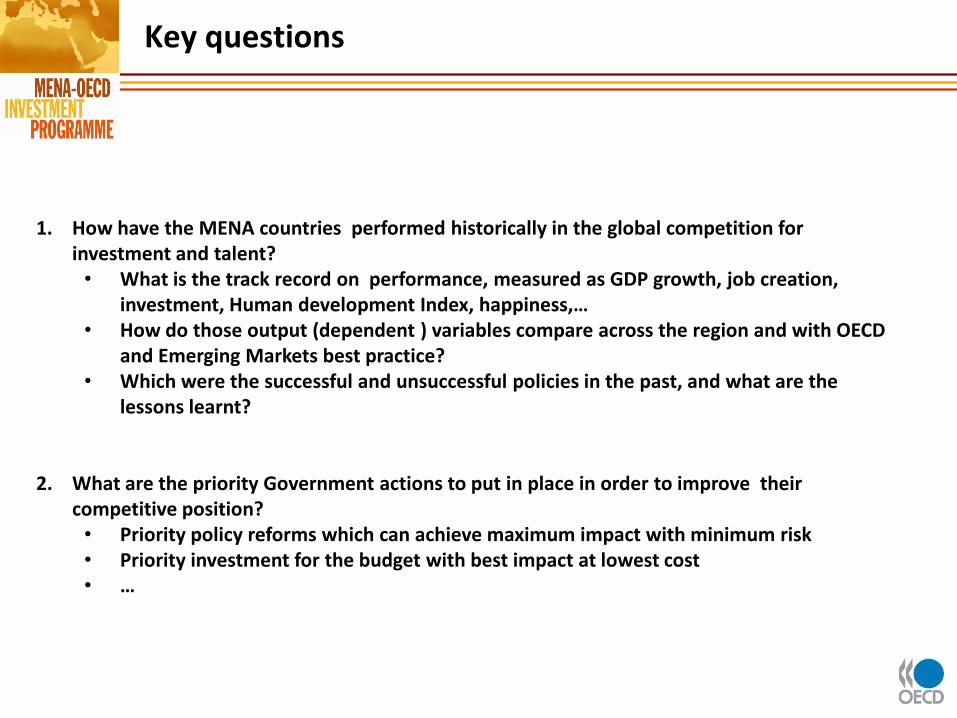
Key questions
1. How have the MENA countries performed historically in the global competition for investment and talent?
• What is the track record on performance, measured as GDP growth, job creation, investment, Human development Index, happiness,…
• How do those output (dependent ) variables compare across the region and with OECD and Emerging Markets best practice?
• Which were the successful and unsuccessful policies in the past, and what are the lessons learnt?
2. What are the priority Government actions to put in place in order to improve their
competitive position? • Priority policy reforms which can achieve maximum impact with minimum risk • Priority investment for the budget with best impact at lowest cost • …
MENA-OECD Sustainable Competitiveness Objectives correspond to identified needs
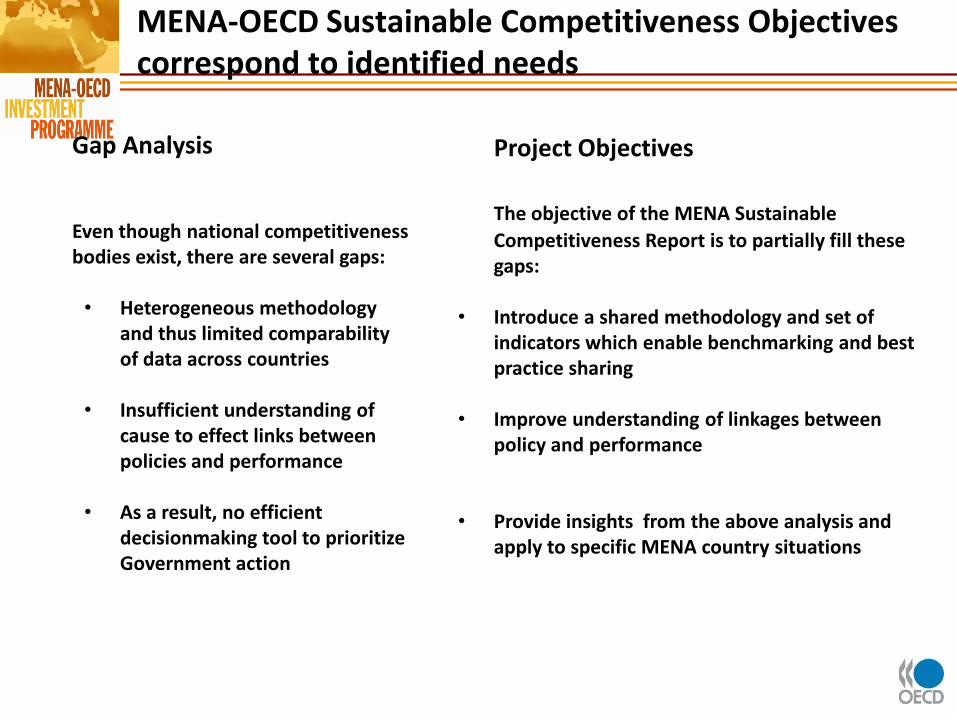
Gap Analysis
Even though national competitiveness
bodies exist, there are several gaps:
• Heterogeneous methodology and thus limited comparability of data across countries
• Insufficient understanding of cause to effect links between policies and performance
• As a result, no efficient decisionmaking tool to prioritize Government action
Project Objectives The objective of the MENA Sustainable
Competitiveness Report is to partially fill these gaps:
• Introduce a shared methodology and set of
indicators which enable benchmarking and best practice sharing
• Improve understanding of linkages between policy and performance
• Provide insights from the above analysis and apply to specific MENA country situations
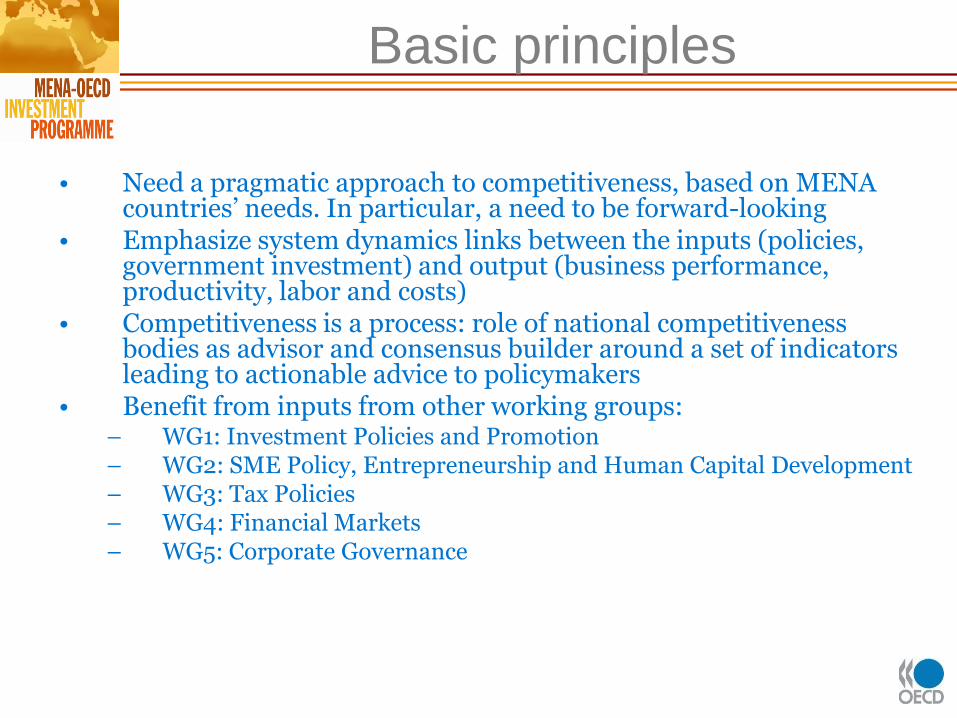
Basic principles
• Need a pragmatic approach to competitiveness, based on MENA countries’ needs. In particular, a need to be forward-looking
• Emphasize system dynamics links between the inputs (policies, government investment) and output (business performance, productivity, labor and costs)
• Competitiveness is a process: role of national competitiveness bodies as advisor and consensus builder around a set of indicators leading to actionable advice to policymakers
• Benefit from inputs from other working groups: – WG1: Investment Policies and Promotion – WG2: SME Policy, Entrepreneurship and Human Capital Development – WG3: Tax Policies – WG4: Financial Markets – WG5: Corporate Governance

Agenda
7
1. Overview and Aims
2. The Approach
3. Calendar and next steps
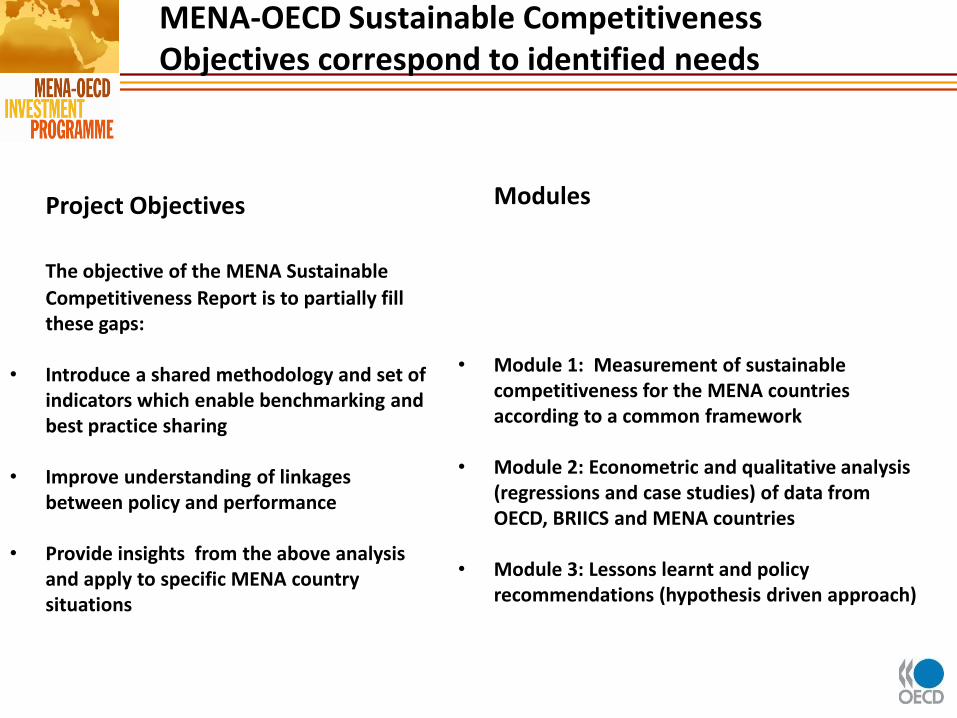
MENA-OECD Sustainable Competitiveness Objectives correspond to identified needs
Project Objectives The objective of the MENA Sustainable
Competitiveness Report is to partially fill these gaps:
• Introduce a shared methodology and set of
indicators which enable benchmarking and best practice sharing
• Improve understanding of linkages between policy and performance
• Provide insights from the above analysis and apply to specific MENA country situations
Modules
• Module 1: Measurement of sustainable
competitiveness for the MENA countries according to a common framework
• Module 2: Econometric and qualitative analysis (regressions and case studies) of data from OECD, BRIICS and MENA countries
• Module 3: Lessons learnt and policy recommendations (hypothesis driven approach)
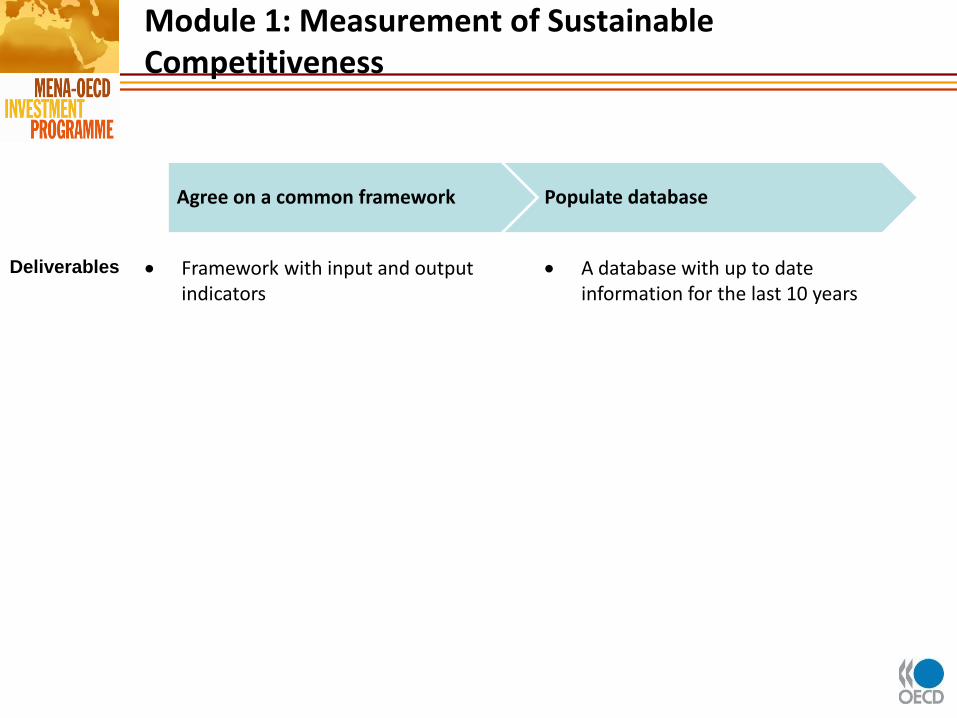
Module 1: Measurement of Sustainable Competitiveness
Framework with input and output indicators
A database with up to date information for the last 10 years
Agree on a common framework Populate database
Deliverables
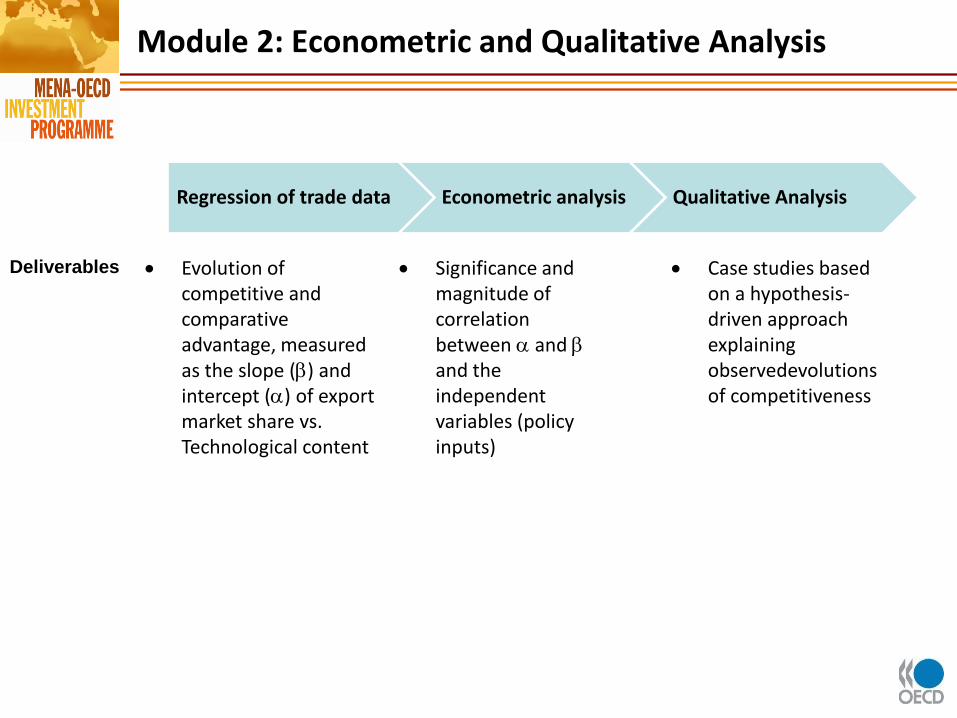
Module 2: Econometric and Qualitative Analysis
Evolution of competitive and comparative advantage, measured as the slope () and intercept () of export market share vs. Technological content
Significance and magnitude of correlation between and and the independent variables (policy inputs)
Case studies based on a hypothesis-driven approach explaining observedevolutions of competitiveness
Regression of trade data Econometric analysis Qualitative Analysis
Deliverables
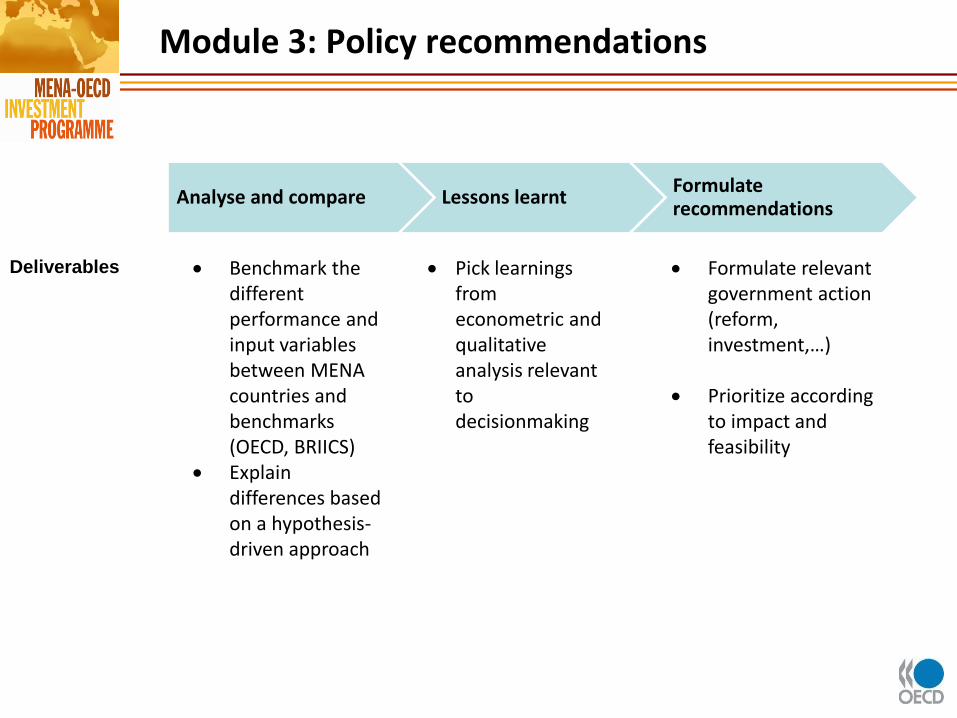
Module 3: Policy recommendations
Deliverables Benchmark the different performance and input variables between MENA countries and benchmarks (OECD, BRIICS)
Explain differences based on a hypothesis-driven approach
Pick learnings from econometric and qualitative analysis relevant to decisionmaking
Formulate relevant government action (reform, investment,…)
Prioritize according to impact and feasibility
Analyse and compare Lessons learnt Formulate recommendations
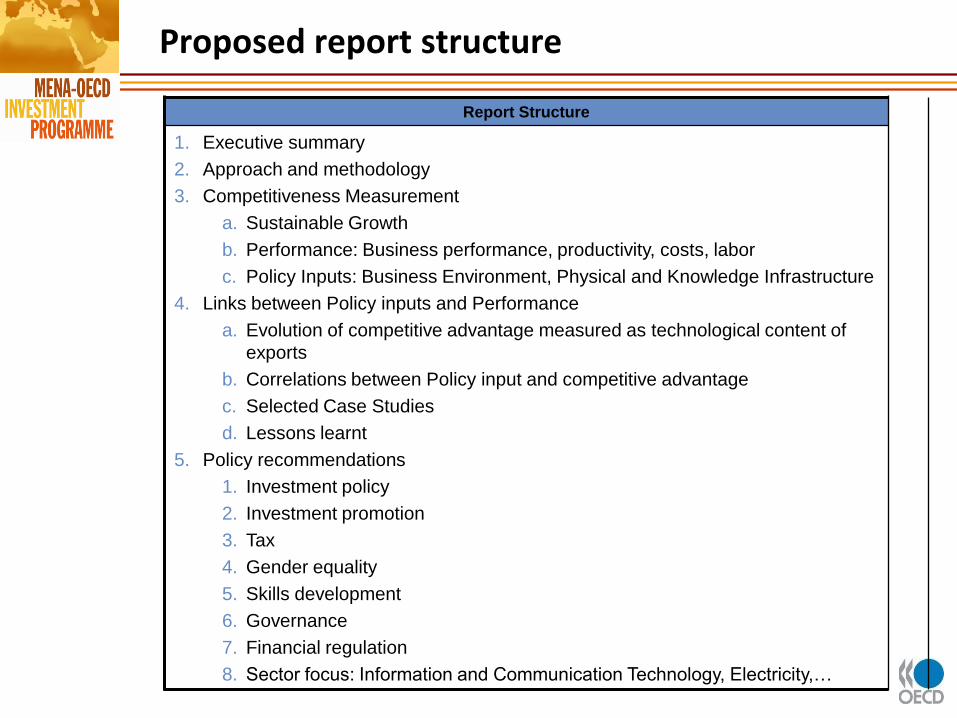
Proposed report structure
Report Structure
1. Executive summary
2. Approach and methodology
3. Competitiveness Measurement
a. Sustainable Growth
b. Performance: Business performance, productivity, costs, labor
c. Policy Inputs: Business Environment, Physical and Knowledge Infrastructure
4. Links between Policy inputs and Performance
a. Evolution of competitive advantage measured as technological content of
exports
b. Correlations between Policy input and competitive advantage
c. Selected Case Studies
d. Lessons learnt
5. Policy recommendations
1. Investment policy
2. Investment promotion
3. Tax
4. Gender equality
5. Skills development
6. Governance
7. Financial regulation
8. Sector focus: Information and Communication Technology, Electricity,…

Agenda
13
1. Overview and Aims
2. The Approach
Module 1
Module 2
Module 3
3. Calendar and next steps
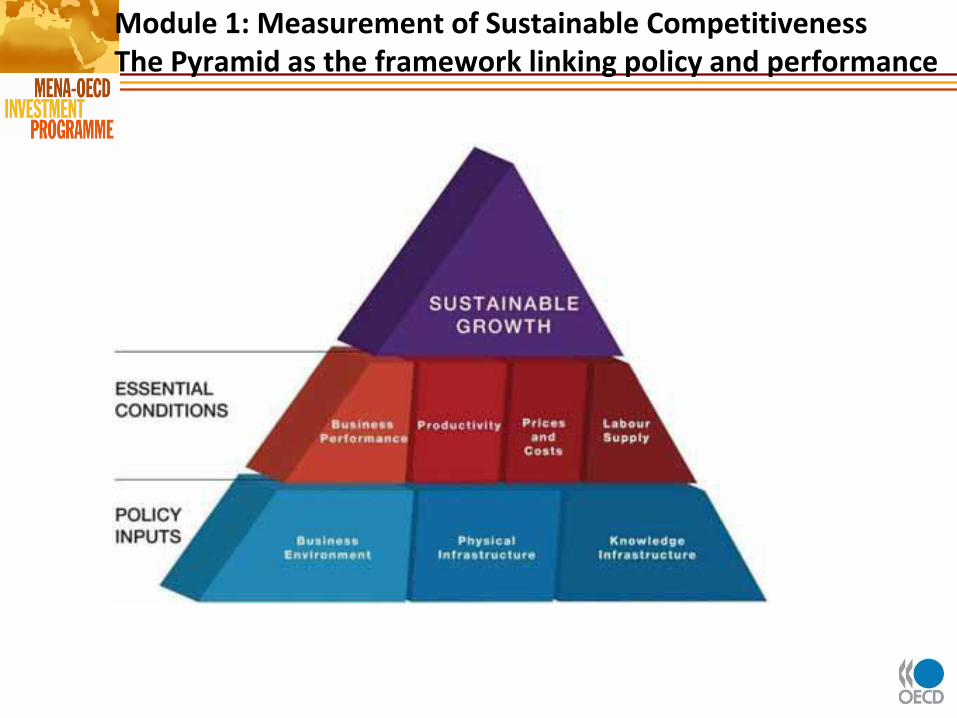
Module 1: Measurement of Sustainable Competitiveness The Pyramid as the framework linking policy and performance

Module 1: Measurement of Sustainable Competitiveness The bottom measures indicators subject to government action
Tax
Legal environment
Access to finance
Telecommunications
Transport
Energy
Water
Land
Research&Development
Education
Health
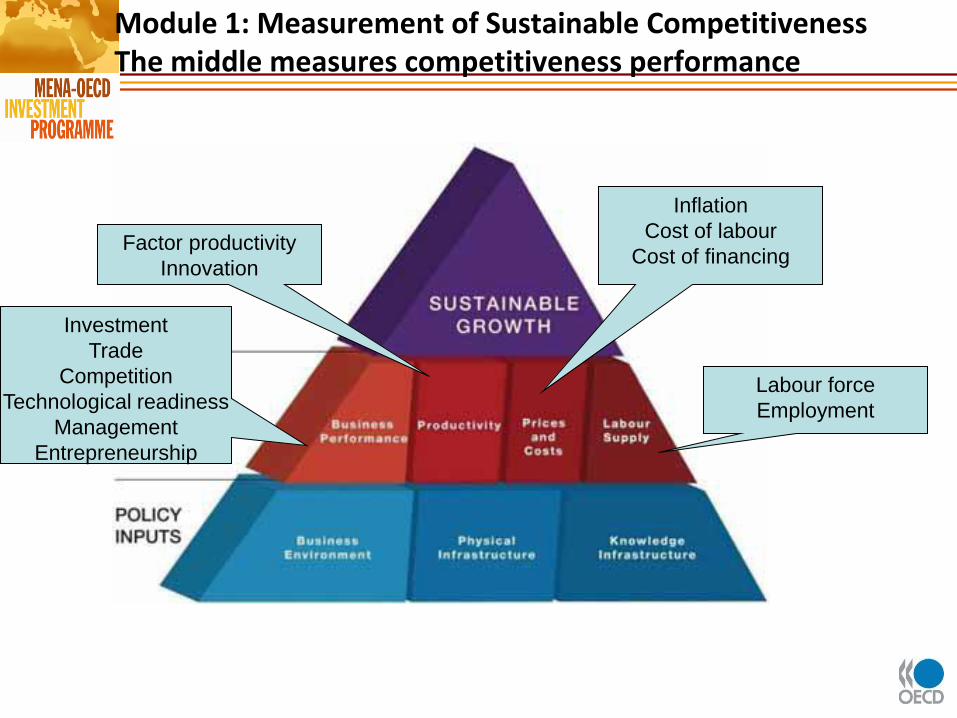
Module 1: Measurement of Sustainable Competitiveness The middle measures competitiveness performance
Investment
Trade
Competition
Technological readiness
Management
Entrepreneurship
Factor productivity
Innovation
Inflation
Cost of labour
Cost of financing
Labour force
Employment

Module 1: Measurement of Sustainable Competitiveness The top measures sustainable growth
Income
HDI
Happiness
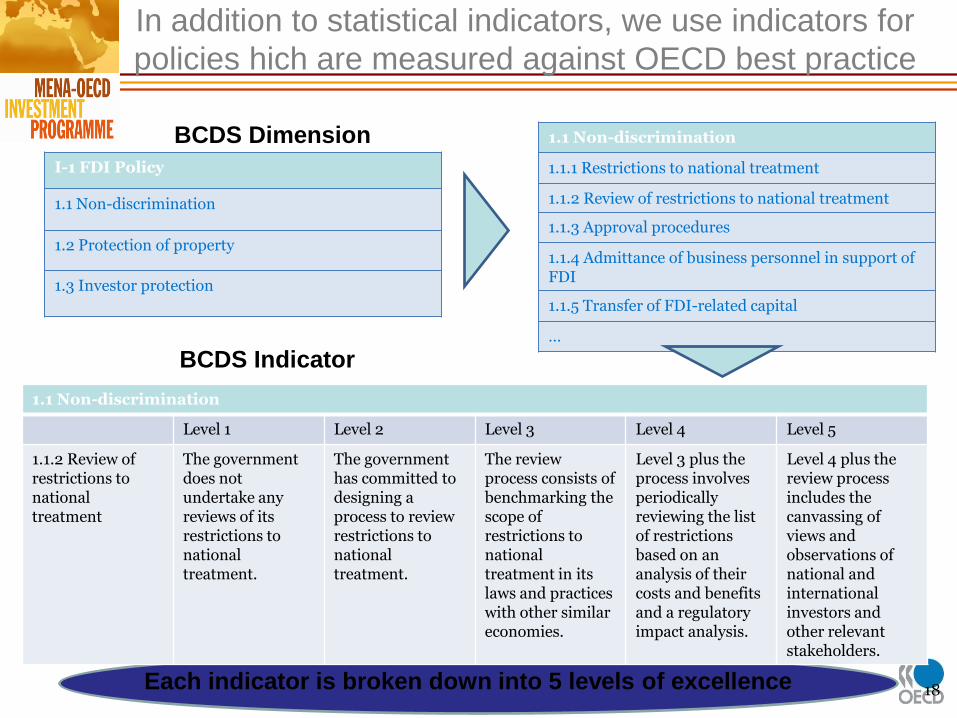
In addition to statistical indicators, we use indicators for
policies hich are measured against OECD best practice
I-1 FDI Policy
1.1 Non-discrimination
1.2 Protection of property
1.3 Investor protection
1.1 Non-discrimination
1.1.1 Restrictions to national treatment
1.1.2 Review of restrictions to national treatment
1.1.3 Approval procedures
1.1.4 Admittance of business personnel in support of FDI
1.1.5 Transfer of FDI-related capital
…
1.1 Non-discrimination
Level 1 Level 2 Level 3 Level 4 Level 5
1.1.2 Review of restrictions to national treatment
The government does not undertake any reviews of its restrictions to national treatment.
The government has committed to designing a process to review restrictions to national treatment.
The review process consists of benchmarking the scope of restrictions to national treatment in its laws and practices with other similar economies.
Level 3 plus the process involves periodically reviewing the list of restrictions based on an analysis of their costs and benefits and a regulatory impact analysis.
Level 4 plus the review process includes the canvassing of views and observations of national and international investors and other relevant stakeholders.
BCDS Dimension
BCDS Indicator
Each indicator is broken down into 5 levels of excellence 18

Agenda
19
1. Overview and Aims
2. The Approach
Module 1
Module 2
Module 3
3. Calendar and next steps
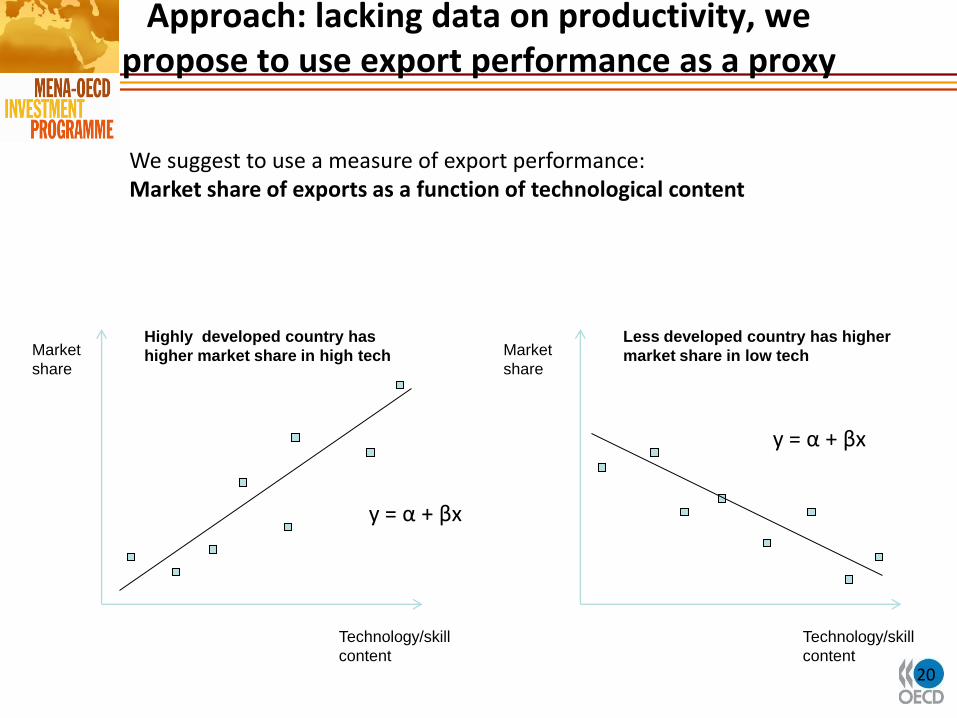
Approach: lacking data on productivity, we propose to use export performance as a proxy
20
We suggest to use a measure of export performance: Market share of exports as a function of technological content
Market
share
Technology/skill
content
Highly developed country has
higher market share in high tech Market
share
Technology/skill
content
Less developed country has higher
market share in low tech
y = α + βx
y = α + βx
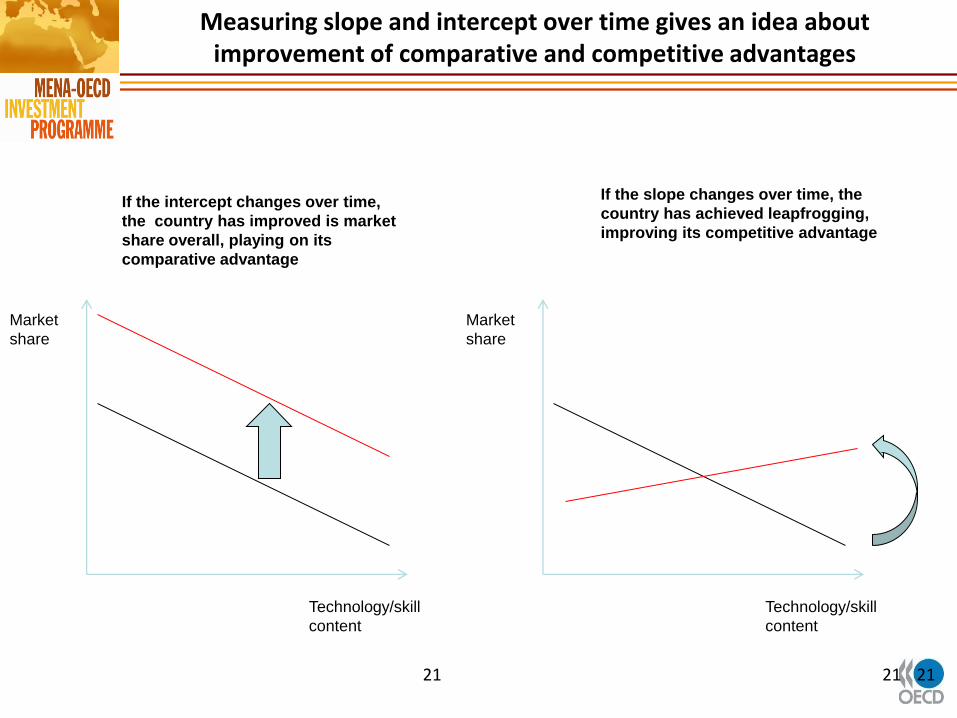
Measuring slope and intercept over time gives an idea about improvement of comparative and competitive advantages
21 21
Market
share
Technology/skill
content
21
Market
share
Technology/skill
content
If the intercept changes over time,
the country has improved is market
share overall, playing on its
comparative advantage
If the slope changes over time, the
country has achieved leapfrogging,
improving its competitive advantage
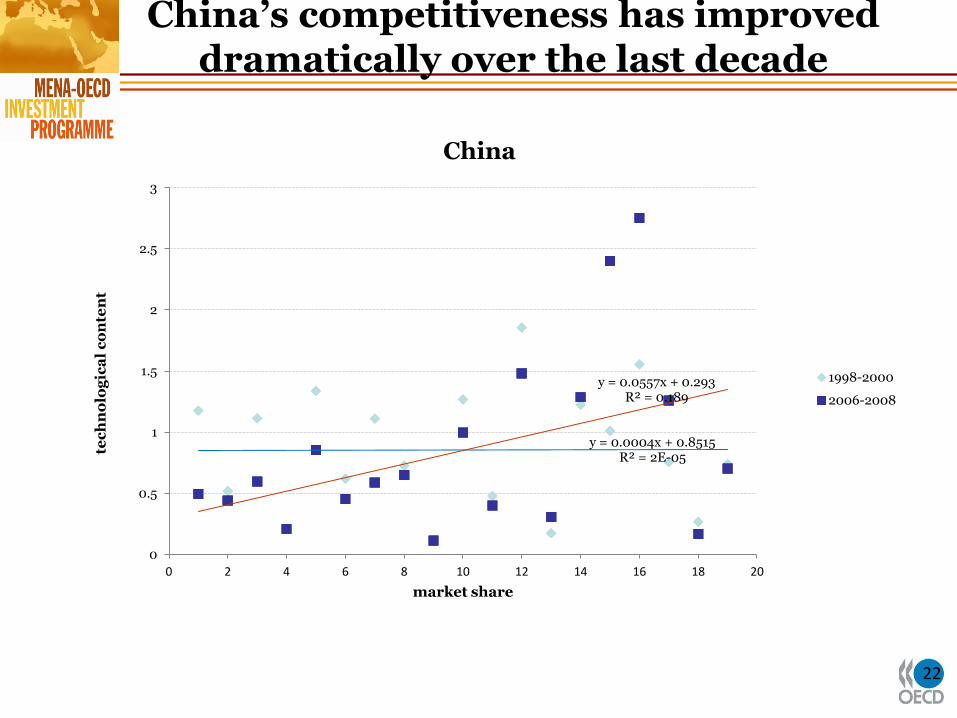
China’s competitiveness has improved dramatically over the last decade
22
y = 0.0004x + 0.8515 R² = 2E-05
y = 0.0557x + 0.293 R² = 0.189
0
0.5
1
1.5
2
2.5
3
0 2 4 6 8 10 12 14 16 18 20
tec
hn
olo
gic
al
co
nte
nt
market share
China
1998-2000
2006-2008
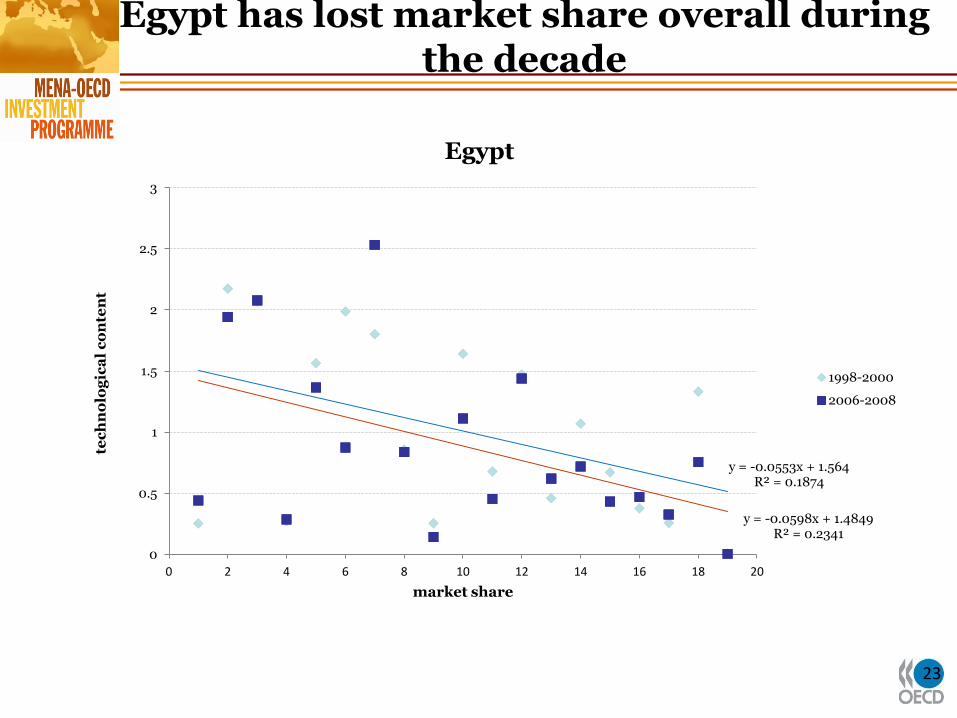
Egypt has lost market share overall during the decade
23
y = -0.0553x + 1.564 R² = 0.1874
y = -0.0598x + 1.4849 R² = 0.2341
0
0.5
1
1.5
2
2.5
3
0 2 4 6 8 10 12 14 16 18 20
tec
hn
olo
gic
al
co
nte
nt
market share
Egypt
1998-2000
2006-2008
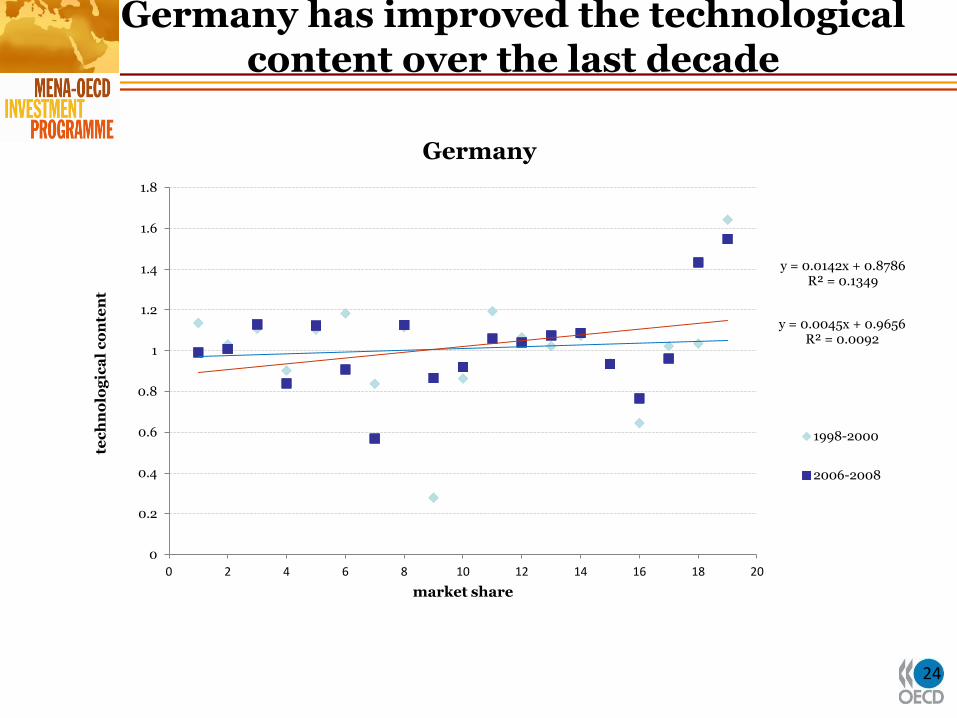
Germany has improved the technological content over the last decade
24
y = 0.0045x + 0.9656 R² = 0.0092
y = 0.0142x + 0.8786 R² = 0.1349
0
0.2
0.4
0.6
0.8
1
1.2
1.4
1.6
1.8
0 2 4 6 8 10 12 14 16 18 20
tec
hn
olo
gic
al
co
nte
nt
market share
Germany
1998-2000
2006-2008
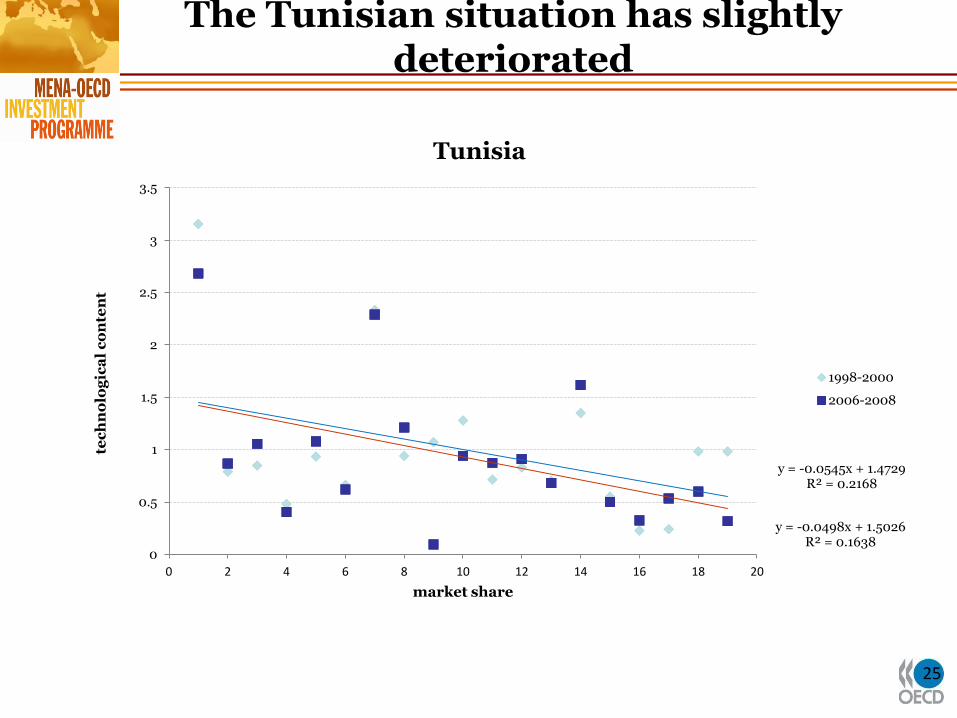
The Tunisian situation has slightly deteriorated
25
y = -0.0498x + 1.5026 R² = 0.1638
y = -0.0545x + 1.4729 R² = 0.2168
0
0.5
1
1.5
2
2.5
3
3.5
0 2 4 6 8 10 12 14 16 18 20
tec
hn
olo
gic
al
co
nte
nt
market share
Tunisia
1998-2000
2006-2008
Question: what influences the evolution of the comparative and competitive advantages?
26
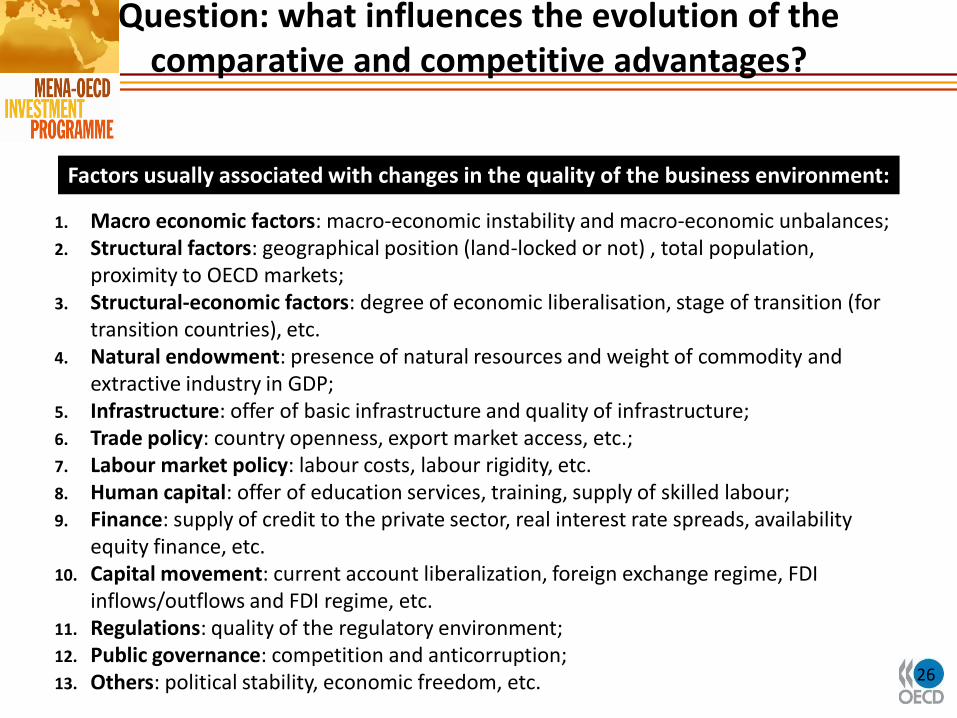
1. Macro economic factors: macro-economic instability and macro-economic unbalances; 2. Structural factors: geographical position (land-locked or not) , total population,
proximity to OECD markets; 3. Structural-economic factors: degree of economic liberalisation, stage of transition (for
transition countries), etc. 4. Natural endowment: presence of natural resources and weight of commodity and
extractive industry in GDP; 5. Infrastructure: offer of basic infrastructure and quality of infrastructure; 6. Trade policy: country openness, export market access, etc.; 7. Labour market policy: labour costs, labour rigidity, etc. 8. Human capital: offer of education services, training, supply of skilled labour; 9. Finance: supply of credit to the private sector, real interest rate spreads, availability
equity finance, etc. 10. Capital movement: current account liberalization, foreign exchange regime, FDI
inflows/outflows and FDI regime, etc. 11. Regulations: quality of the regulatory environment; 12. Public governance: competition and anticorruption; 13. Others: political stability, economic freedom, etc.
Factors usually associated with changes in the quality of the business environment:
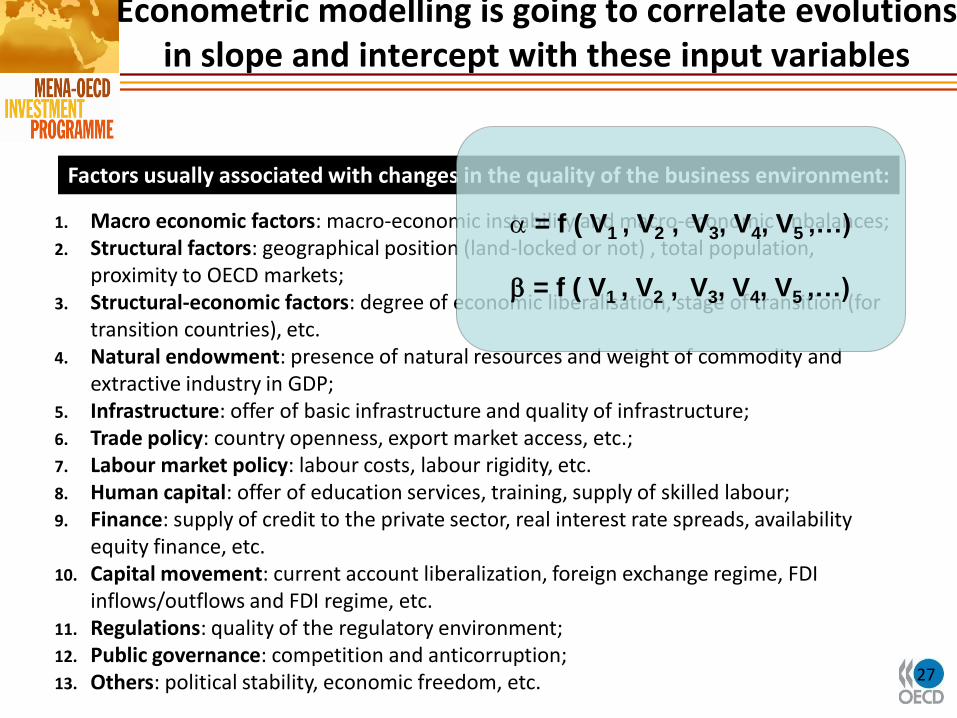
Econometric modelling is going to correlate evolutions in slope and intercept with these input variables
27
1. Macro economic factors: macro-economic instability and macro-economic unbalances; 2. Structural factors: geographical position (land-locked or not) , total population,
proximity to OECD markets; 3. Structural-economic factors: degree of economic liberalisation, stage of transition (for
transition countries), etc. 4. Natural endowment: presence of natural resources and weight of commodity and
extractive industry in GDP; 5. Infrastructure: offer of basic infrastructure and quality of infrastructure; 6. Trade policy: country openness, export market access, etc.; 7. Labour market policy: labour costs, labour rigidity, etc. 8. Human capital: offer of education services, training, supply of skilled labour; 9. Finance: supply of credit to the private sector, real interest rate spreads, availability
equity finance, etc. 10. Capital movement: current account liberalization, foreign exchange regime, FDI
inflows/outflows and FDI regime, etc. 11. Regulations: quality of the regulatory environment; 12. Public governance: competition and anticorruption; 13. Others: political stability, economic freedom, etc.
Factors usually associated with changes in the quality of the business environment:
= f ( V1 , V2 , V3, V4, V5 ,…)
= f ( V1 , V2 , V3, V4, V5 ,…)
Pros and Cons
28
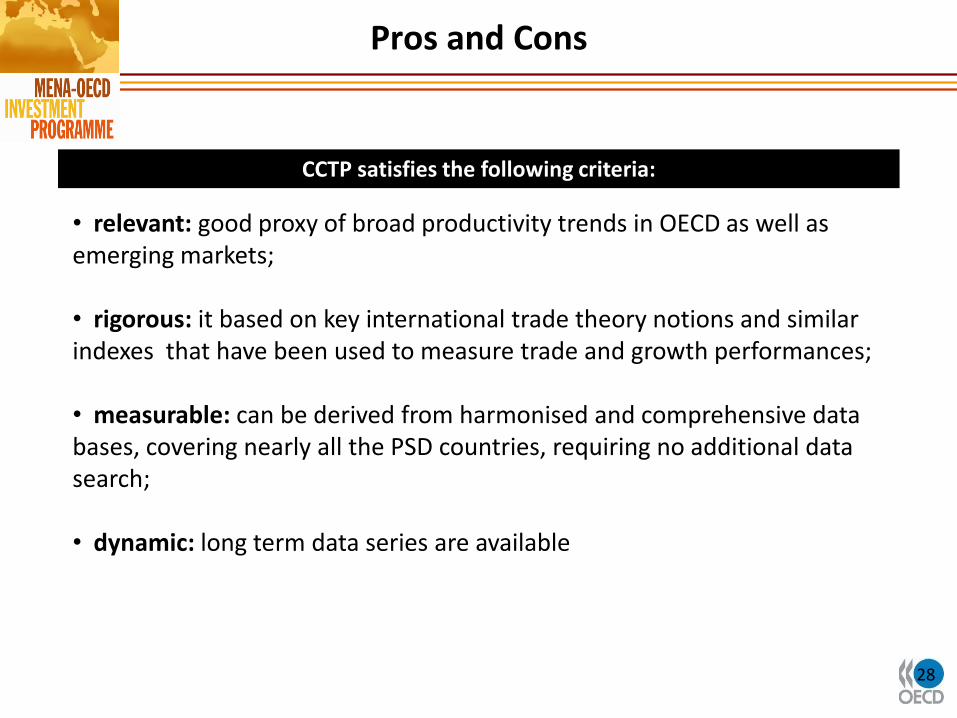
• relevant: good proxy of broad productivity trends in OECD as well as emerging markets; • rigorous: it based on key international trade theory notions and similar indexes that have been used to measure trade and growth performances; • measurable: can be derived from harmonised and comprehensive data bases, covering nearly all the PSD countries, requiring no additional data search; • dynamic: long term data series are available
CCTP satisfies the following criteria:
29
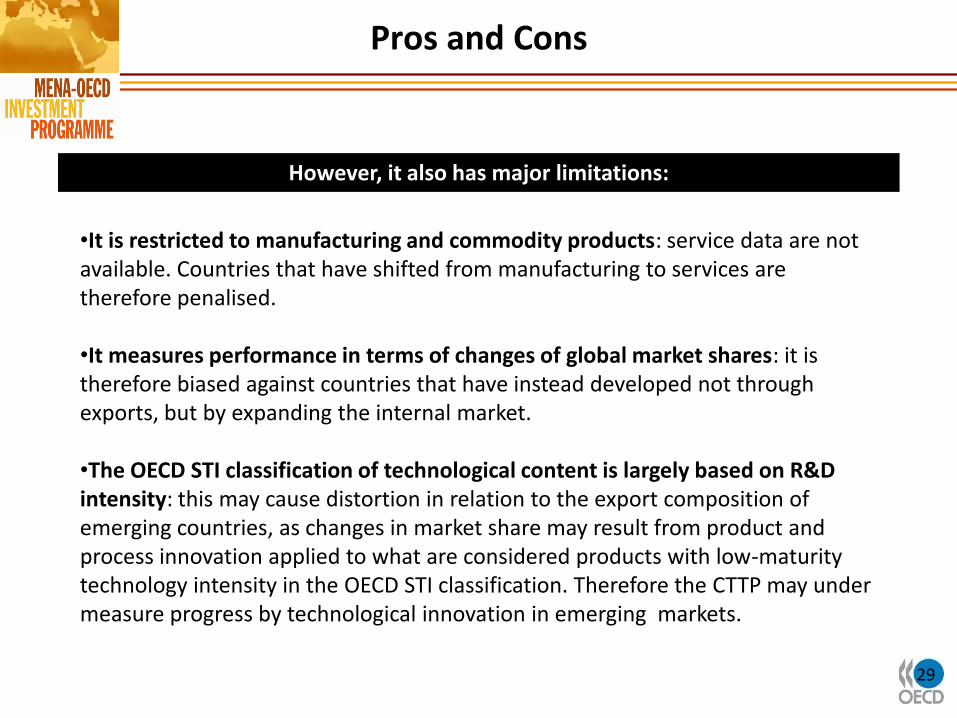
•It is restricted to manufacturing and commodity products: service data are not available. Countries that have shifted from manufacturing to services are therefore penalised.
•It measures performance in terms of changes of global market shares: it is therefore biased against countries that have instead developed not through exports, but by expanding the internal market.
•The OECD STI classification of technological content is largely based on R&D intensity: this may cause distortion in relation to the export composition of emerging countries, as changes in market share may result from product and process innovation applied to what are considered products with low-maturity technology intensity in the OECD STI classification. Therefore the CTTP may under measure progress by technological innovation in emerging markets.
However, it also has major limitations:
Pros and Cons

Agenda
30
1. Overview and Aims
2. The Approach
Module 1
Module 2
Module 3
3. Calendar and next steps
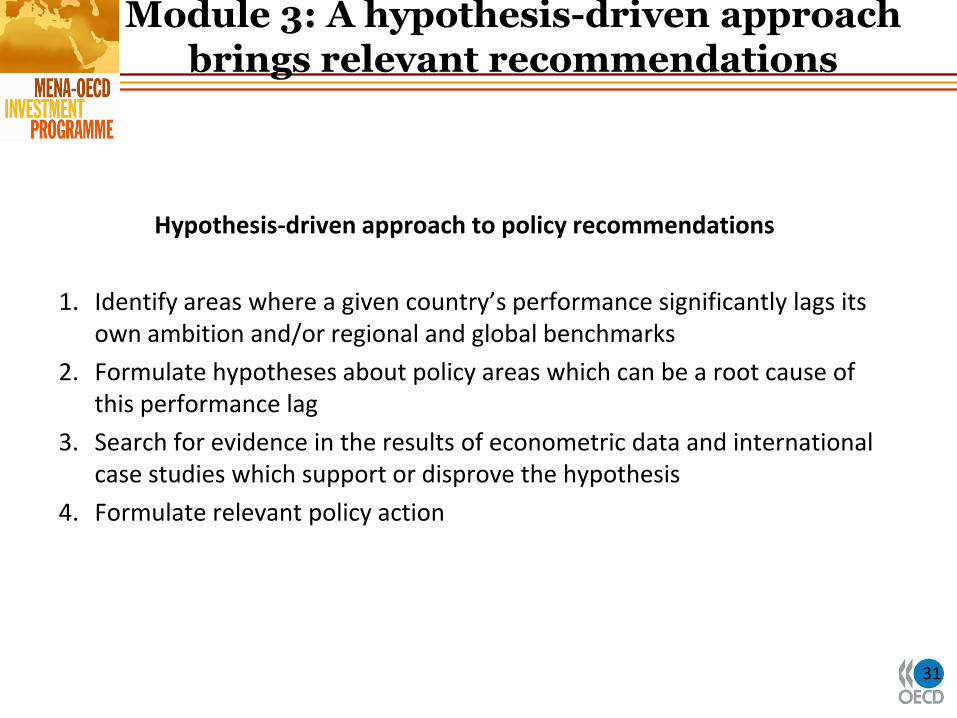
Module 3: A hypothesis-driven approach brings relevant recommendations
Hypothesis-driven approach to policy recommendations
1. Identify areas where a given country’s performance significantly lags its own ambition and/or regional and global benchmarks
2. Formulate hypotheses about policy areas which can be a root cause of this performance lag
3. Search for evidence in the results of econometric data and international case studies which support or disprove the hypothesis
4. Formulate relevant policy action
31
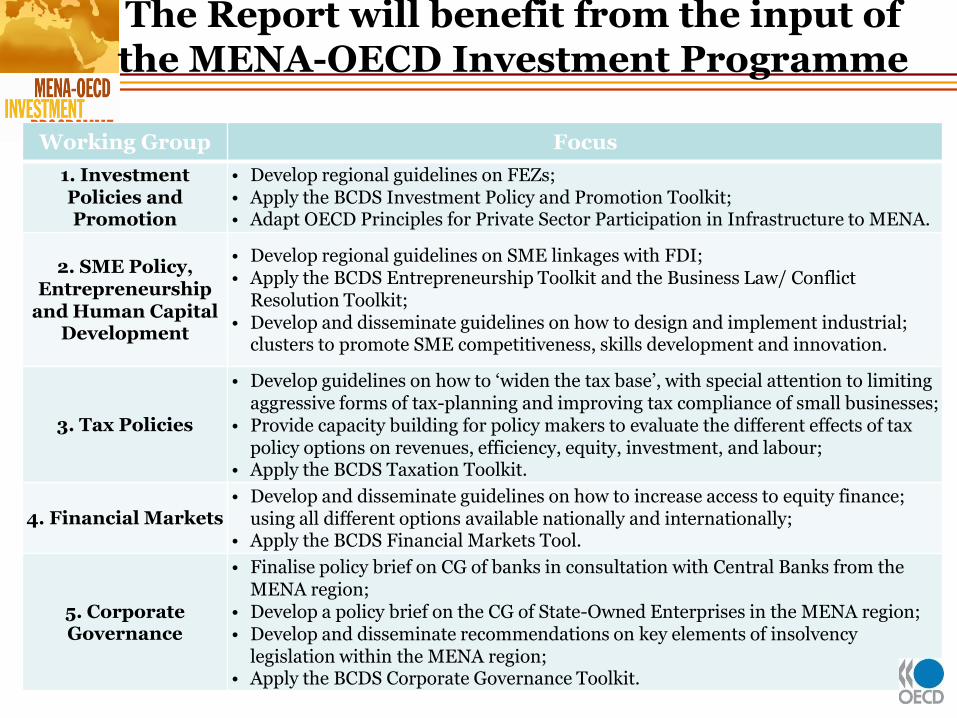
The Report will benefit from the input of the MENA-OECD Investment Programme
32
Working Group Focus
1. Investment Policies and Promotion
• Develop regional guidelines on FEZs; • Apply the BCDS Investment Policy and Promotion Toolkit; • Adapt OECD Principles for Private Sector Participation in Infrastructure to MENA.
2. SME Policy, Entrepreneurship
and Human Capital Development
• Develop regional guidelines on SME linkages with FDI; • Apply the BCDS Entrepreneurship Toolkit and the Business Law/ Conflict
Resolution Toolkit; • Develop and disseminate guidelines on how to design and implement industrial;
clusters to promote SME competitiveness, skills development and innovation.
3. Tax Policies
• Develop guidelines on how to ‘widen the tax base’, with special attention to limiting aggressive forms of tax-planning and improving tax compliance of small businesses;
• Provide capacity building for policy makers to evaluate the different effects of tax policy options on revenues, efficiency, equity, investment, and labour;
• Apply the BCDS Taxation Toolkit.
4. Financial Markets • Develop and disseminate guidelines on how to increase access to equity finance;
using all different options available nationally and internationally; • Apply the BCDS Financial Markets Tool.
5. Corporate Governance
• Finalise policy brief on CG of banks in consultation with Central Banks from the MENA region;
• Develop a policy brief on the CG of State-Owned Enterprises in the MENA region; • Develop and disseminate recommendations on key elements of insolvency
legislation within the MENA region; • Apply the BCDS Corporate Governance Toolkit.
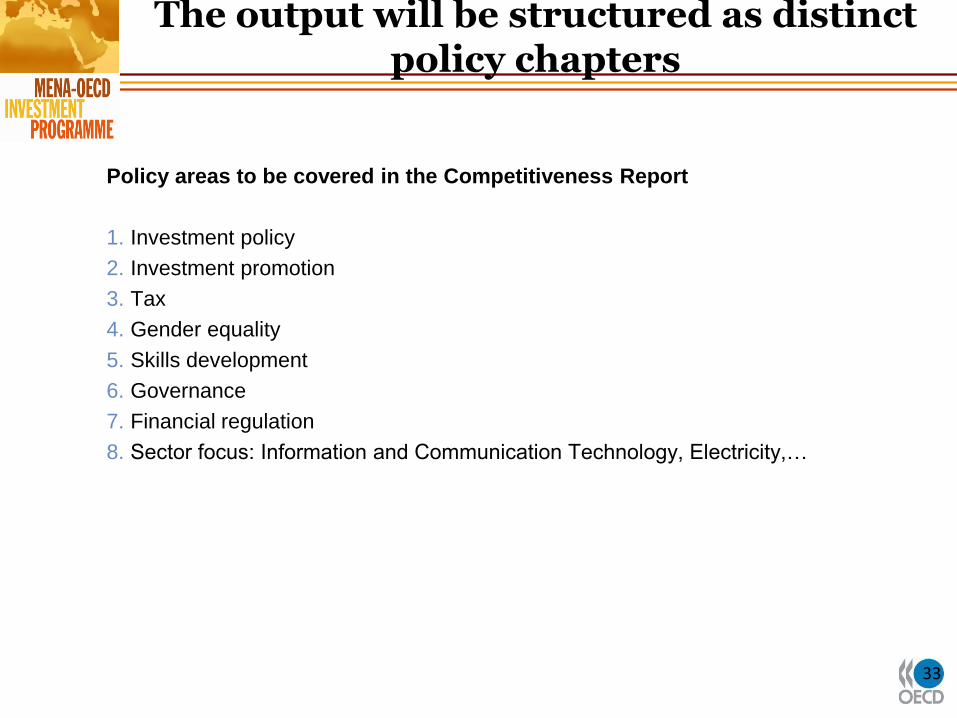
The output will be structured as distinct policy chapters
Policy areas to be covered in the Competitiveness Report
1. Investment policy
2. Investment promotion
3. Tax
4. Gender equality
5. Skills development
6. Governance
7. Financial regulation
8. Sector focus: Information and Communication Technology, Electricity,…
33

Agenda
34
1. Overview and Aims
2. The Approach
3. Calendar and next steps
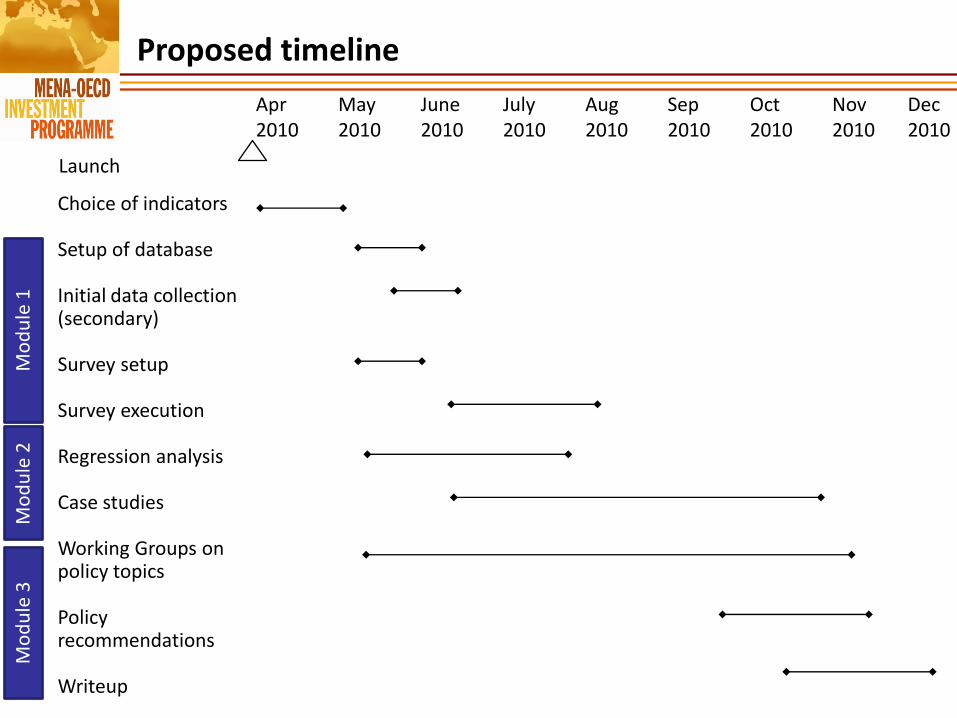
Proposed timeline
Launch
Apr 2010
May 2010
June 2010
July 2010
Aug 2010
Sep 2010
Oct 2010
Nov 2010
Choice of indicators Setup of database Initial data collection (secondary) Survey setup Survey execution Regression analysis Case studies Working Groups on policy topics Policy recommendations Writeup
Mo
du
le 1
M
od
ule
2
Mo
du
le 3
Dec 2010
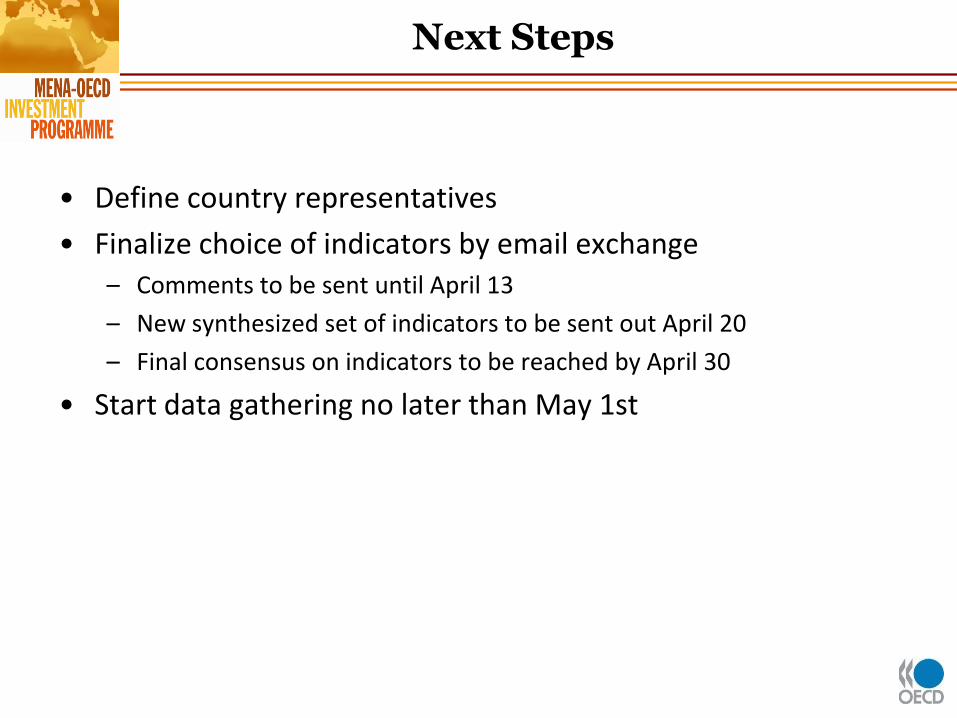
Next Steps
• Define country representatives
• Finalize choice of indicators by email exchange – Comments to be sent until April 13
– New synthesized set of indicators to be sent out April 20
– Final consensus on indicators to be reached by April 30
• Start data gathering no later than May 1st