The Free Cashflow to Equity Model - New York...
22
Aswath Damodaran 1 The Free Cashflow to Equity Model Aswath Damodaran
Transcript of The Free Cashflow to Equity Model - New York...
Aswath Damodaran 1
The Free Cashflow to Equity Model
Aswath Damodaran
Aswath Damodaran 2
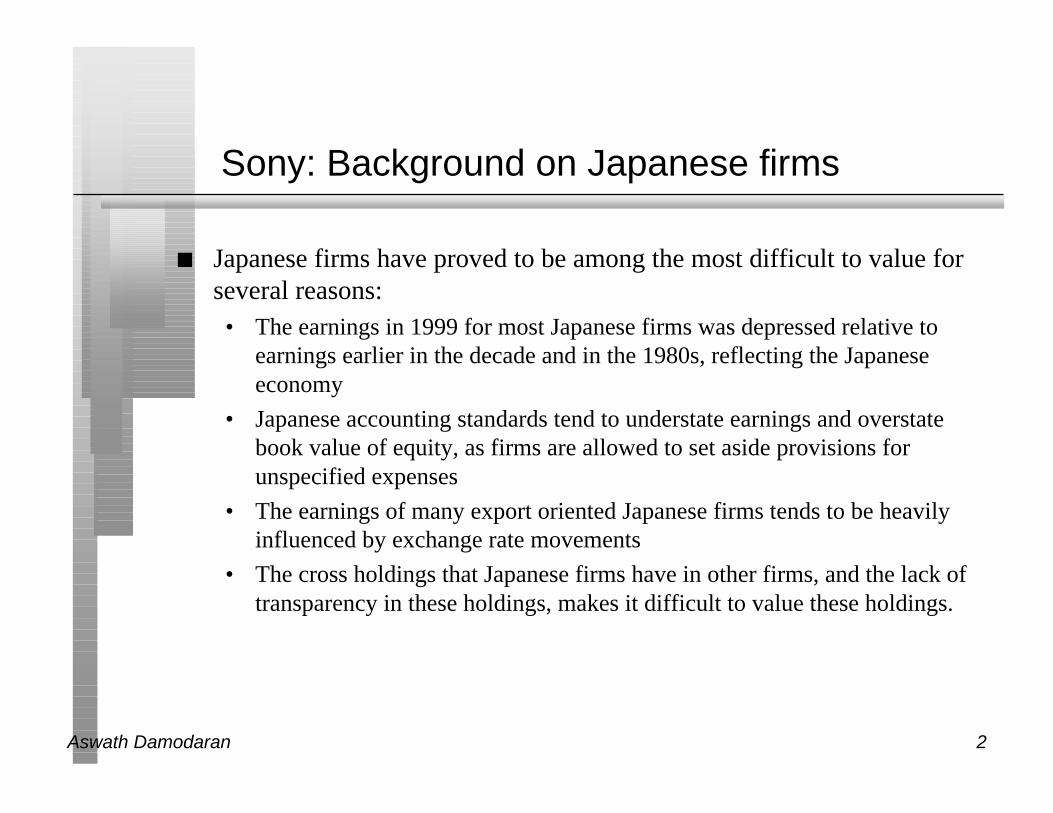
Sony: Background on Japanese firms
n Japanese firms have proved to be among the most difficult to value forseveral reasons:• The earnings in 1999 for most Japanese firms was depressed relative to
earnings earlier in the decade and in the 1980s, reflecting the Japaneseeconomy
• Japanese accounting standards tend to understate earnings and overstatebook value of equity, as firms are allowed to set aside provisions forunspecified expenses
• The earnings of many export oriented Japanese firms tends to be heavilyinfluenced by exchange rate movements
• The cross holdings that Japanese firms have in other firms, and the lack oftransparency in these holdings, makes it difficult to value these holdings.
Aswath Damodaran 3
Valuing Sony: August 2000
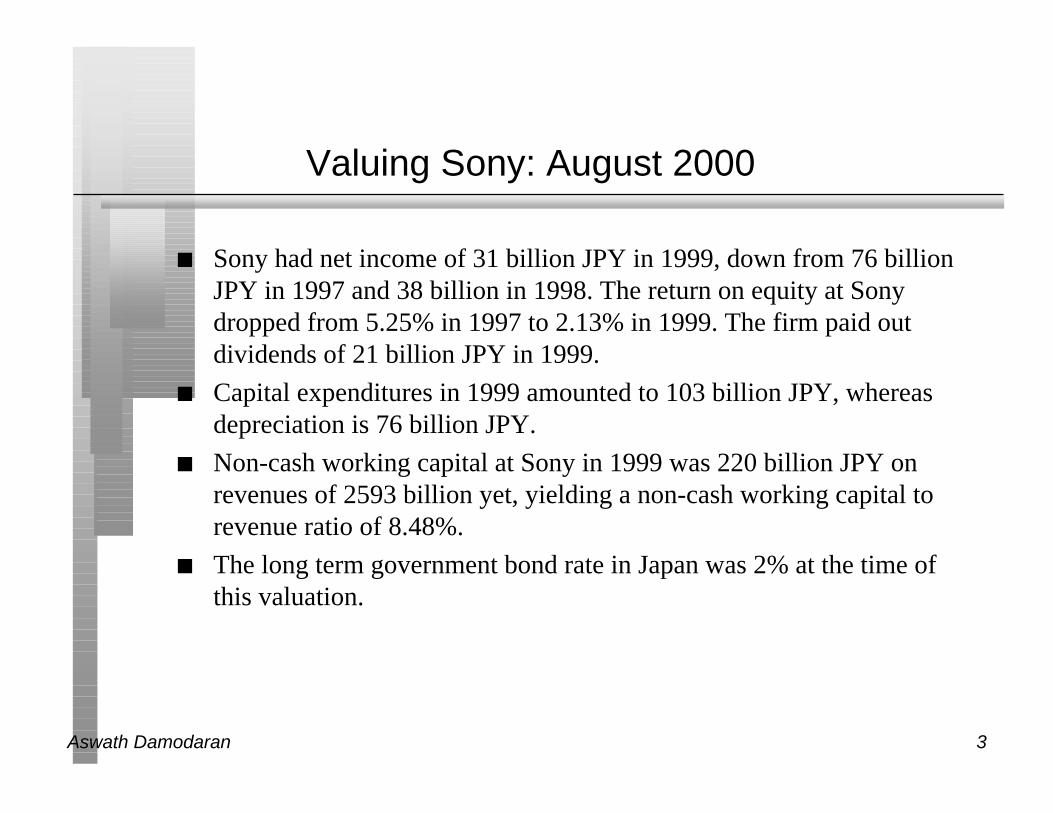
n Sony had net income of 31 billion JPY in 1999, down from 76 billionJPY in 1997 and 38 billion in 1998. The return on equity at Sonydropped from 5.25% in 1997 to 2.13% in 1999. The firm paid outdividends of 21 billion JPY in 1999.
n Capital expenditures in 1999 amounted to 103 billion JPY, whereasdepreciation is 76 billion JPY.
n Non-cash working capital at Sony in 1999 was 220 billion JPY onrevenues of 2593 billion yet, yielding a non-cash working capital torevenue ratio of 8.48%.
n The long term government bond rate in Japan was 2% at the time ofthis valuation.
Aswath Damodaran 4
Sony: Rationale for Model
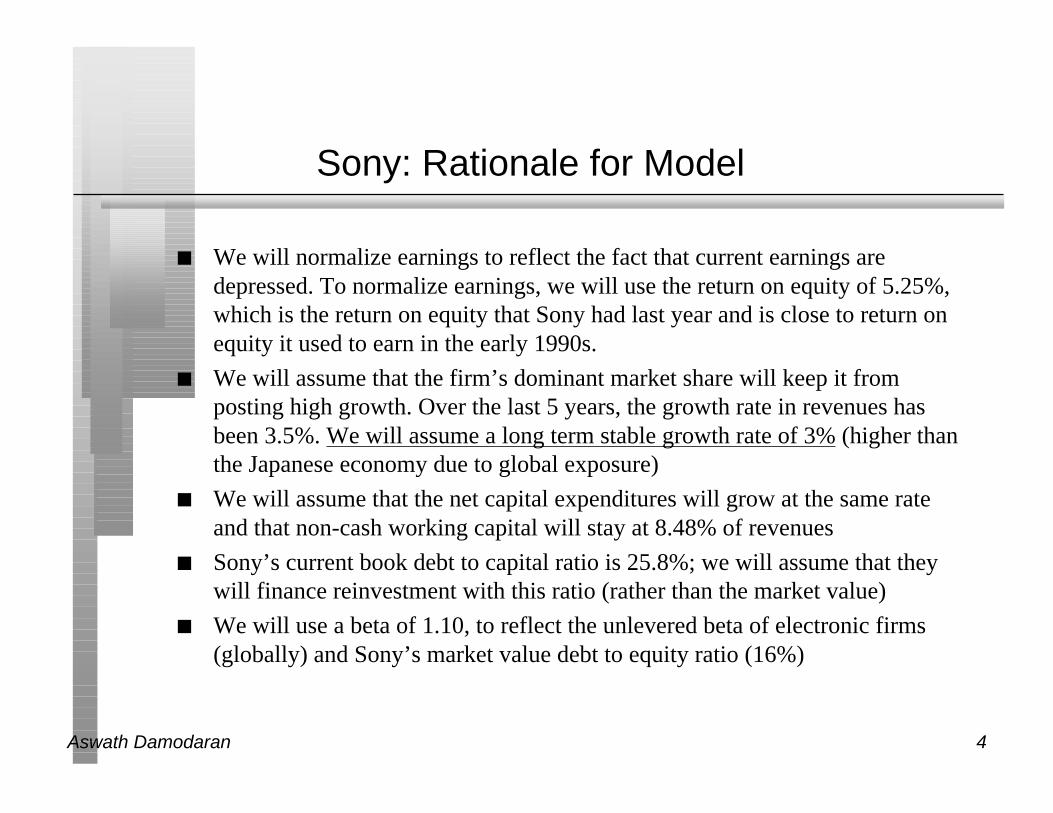
n We will normalize earnings to reflect the fact that current earnings aredepressed. To normalize earnings, we will use the return on equity of 5.25%,which is the return on equity that Sony had last year and is close to return onequity it used to earn in the early 1990s.
n We will assume that the firm’s dominant market share will keep it fromposting high growth. Over the last 5 years, the growth rate in revenues hasbeen 3.5%. We will assume a long term stable growth rate of 3% (higher thanthe Japanese economy due to global exposure)
n We will assume that the net capital expenditures will grow at the same rateand that non-cash working capital will stay at 8.48% of revenues
n Sony’s current book debt to capital ratio is 25.8%; we will assume that theywill finance reinvestment with this ratio (rather than the market value)
n We will use a beta of 1.10, to reflect the unlevered beta of electronic firms(globally) and Sony’s market value debt to equity ratio (16%)
Aswath Damodaran 5
Estimating the Inputs
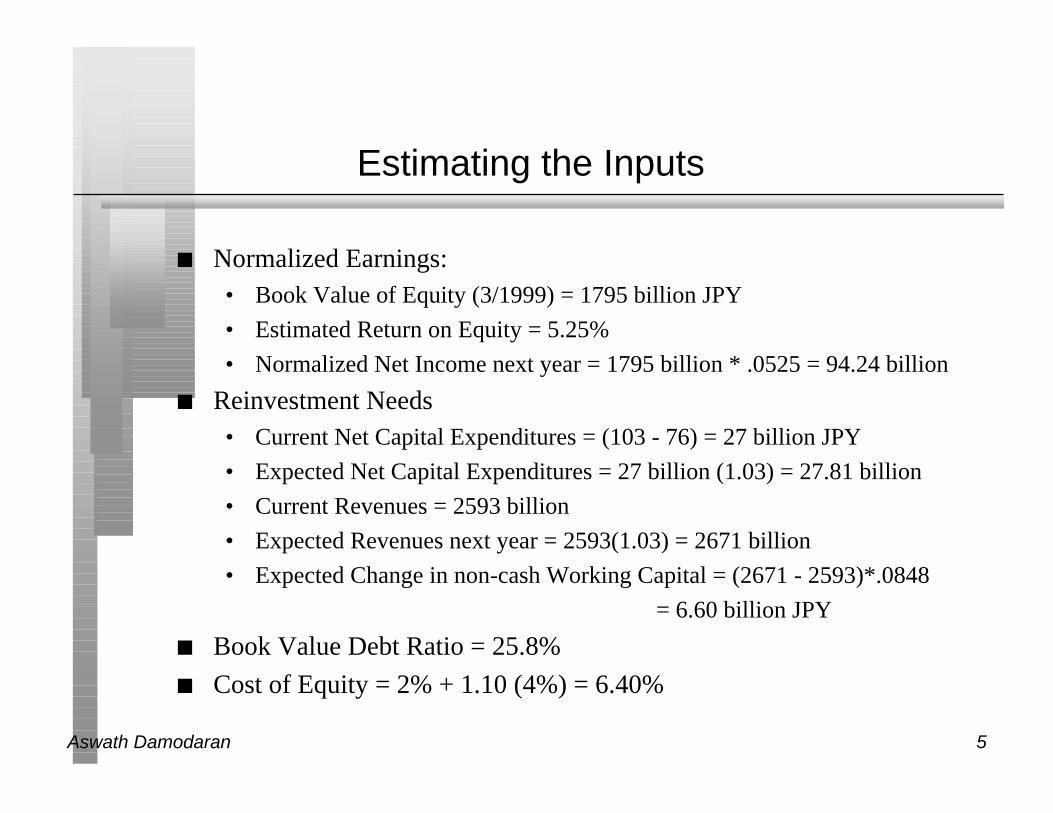
n Normalized Earnings:• Book Value of Equity (3/1999) = 1795 billion JPY
• Estimated Return on Equity = 5.25%
• Normalized Net Income next year = 1795 billion * .0525 = 94.24 billion
n Reinvestment Needs• Current Net Capital Expenditures = (103 - 76) = 27 billion JPY
• Expected Net Capital Expenditures = 27 billion (1.03) = 27.81 billion
• Current Revenues = 2593 billion
• Expected Revenues next year = 2593(1.03) = 2671 billion
• Expected Change in non-cash Working Capital = (2671 - 2593)*.0848
= 6.60 billion JPY
n Book Value Debt Ratio = 25.8%
n Cost of Equity = 2% + 1.10 (4%) = 6.40%
Aswath Damodaran 6
The Valuation
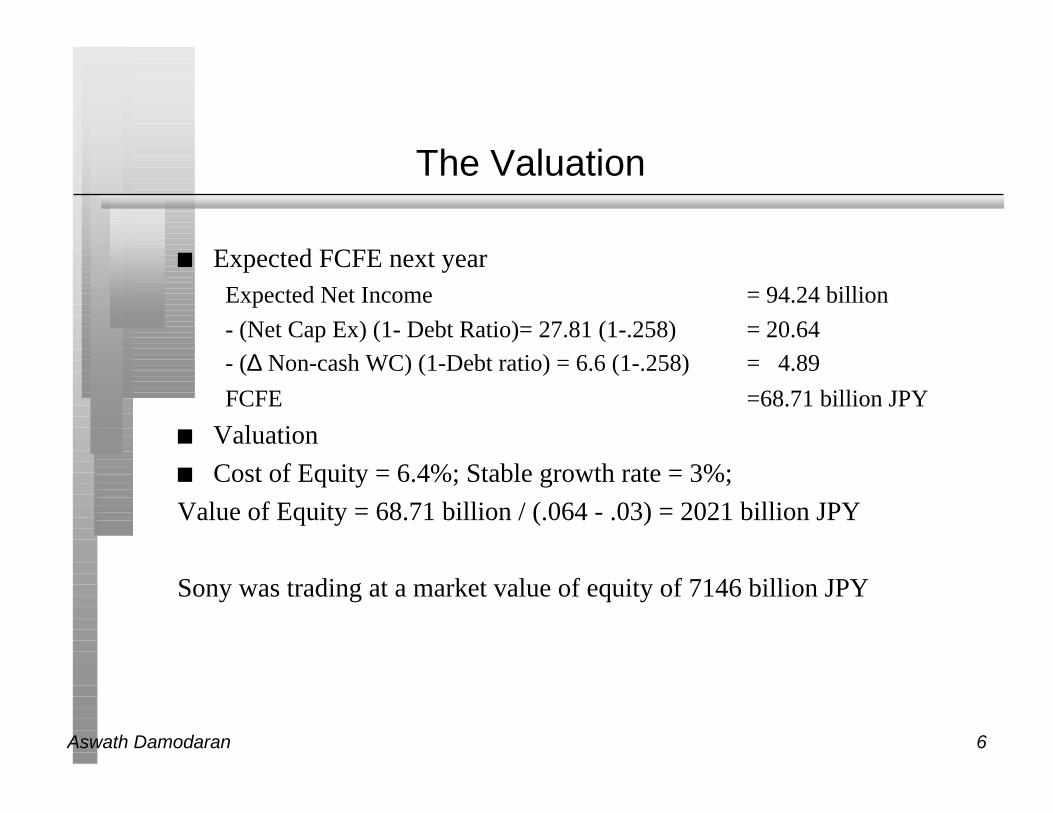
n Expected FCFE next yearExpected Net Income = 94.24 billion
- (Net Cap Ex) (1- Debt Ratio)= 27.81 (1-.258) = 20.64
- (∆ Non-cash WC) (1-Debt ratio) = 6.6 (1-.258) = 4.89
FCFE =68.71 billion JPY
n Valuation
n Cost of Equity = 6.4%; Stable growth rate = 3%;
Value of Equity = 68.71 billion / (.064 - .03) = 2021 billion JPY
Sony was trading at a market value of equity of 7146 billion JPY
Aswath Damodaran 7
The Effect of Cross-holdings
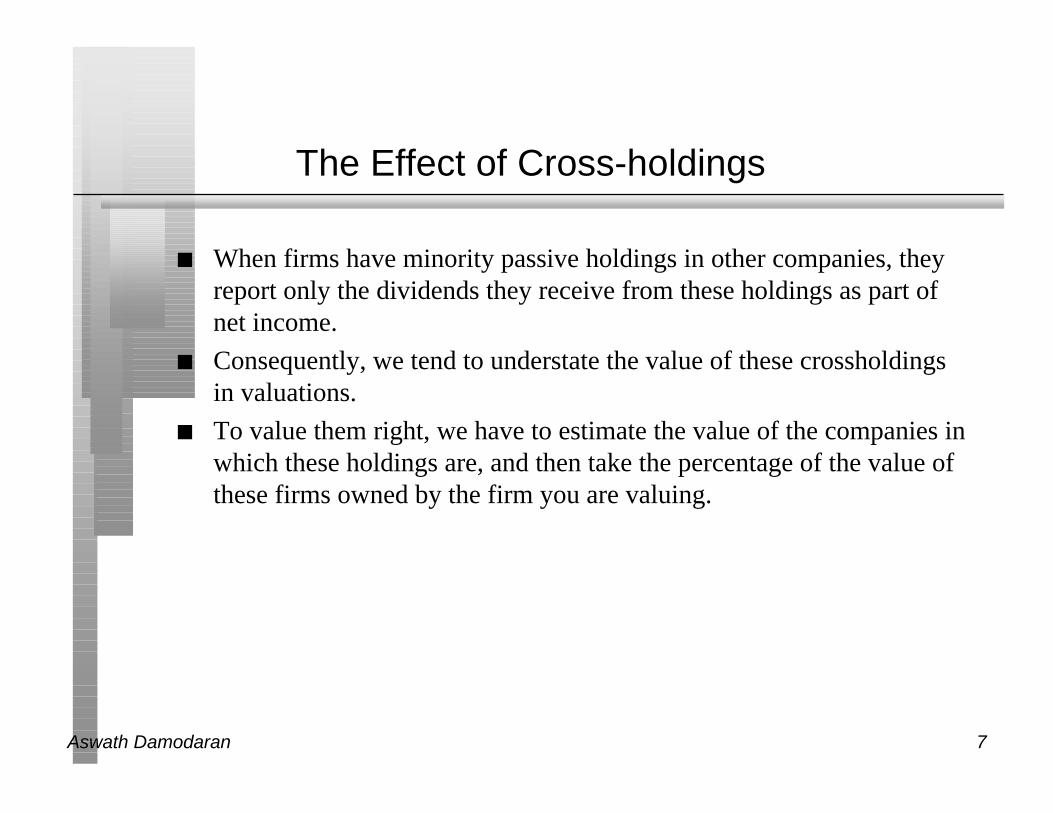
n When firms have minority passive holdings in other companies, theyreport only the dividends they receive from these holdings as part ofnet income.
n Consequently, we tend to understate the value of these crossholdingsin valuations.
n To value them right, we have to estimate the value of the companies inwhich these holdings are, and then take the percentage of the value ofthese firms owned by the firm you are valuing.
Aswath Damodaran 8
Nestle: Rationale for Using Model
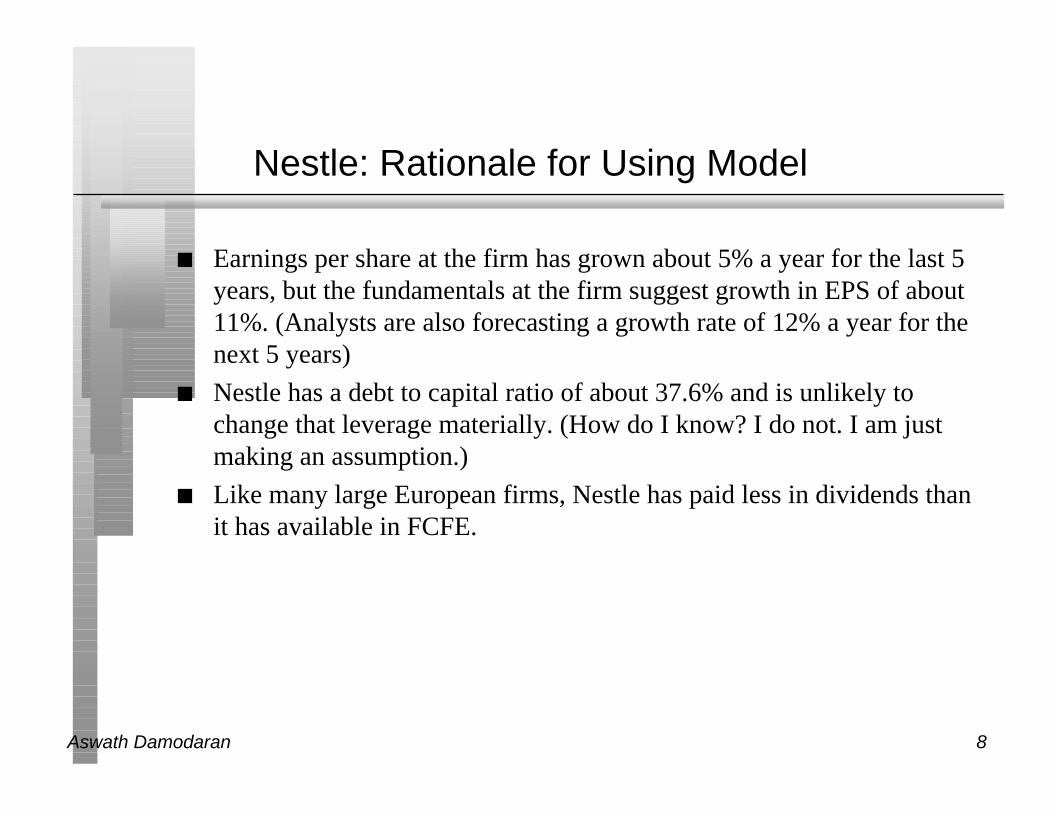
n Earnings per share at the firm has grown about 5% a year for the last 5years, but the fundamentals at the firm suggest growth in EPS of about11%. (Analysts are also forecasting a growth rate of 12% a year for thenext 5 years)
n Nestle has a debt to capital ratio of about 37.6% and is unlikely tochange that leverage materially. (How do I know? I do not. I am justmaking an assumption.)
n Like many large European firms, Nestle has paid less in dividends thanit has available in FCFE.
Aswath Damodaran 9
Nestle: Summarizing the Inputs
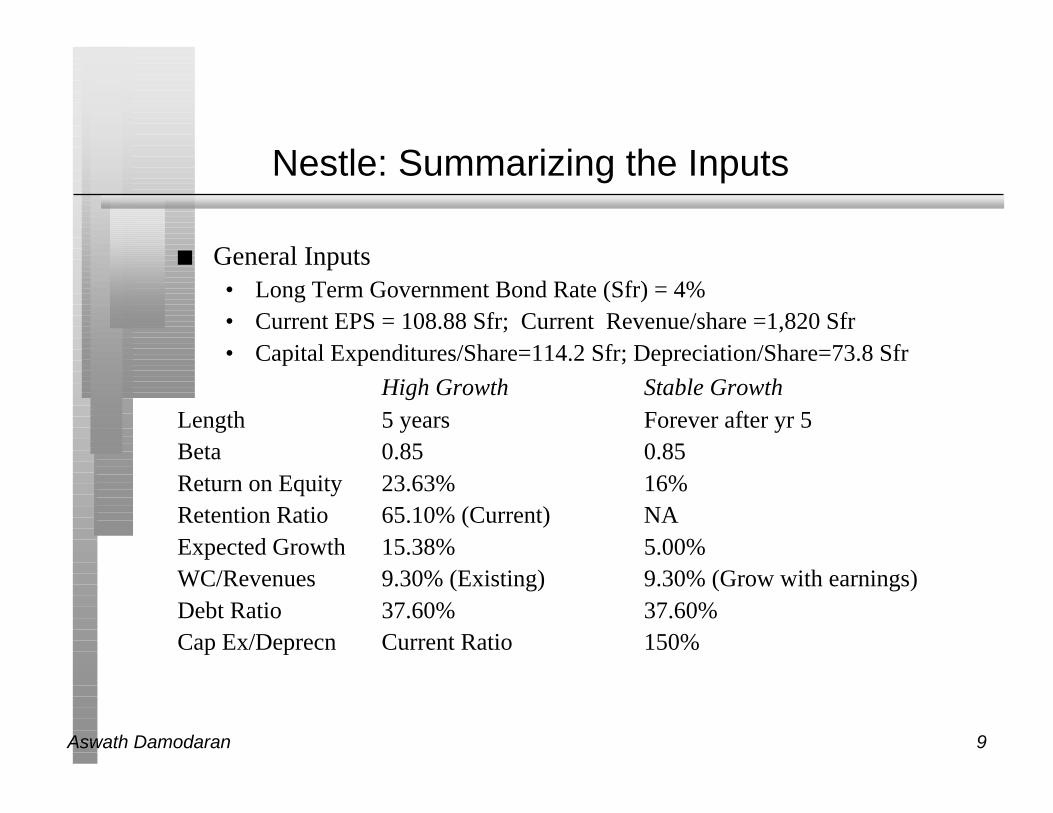
n General Inputs• Long Term Government Bond Rate (Sfr) = 4%• Current EPS = 108.88 Sfr; Current Revenue/share =1,820 Sfr• Capital Expenditures/Share=114.2 Sfr; Depreciation/Share=73.8 Sfr
High Growth Stable GrowthLength 5 years Forever after yr 5Beta 0.85 0.85Return on Equity 23.63% 16%Retention Ratio 65.10% (Current) NAExpected Growth 15.38% 5.00%WC/Revenues 9.30% (Existing) 9.30% (Grow with earnings)Debt Ratio 37.60% 37.60%Cap Ex/Deprecn Current Ratio 150%
Aswath Damodaran 10
Estimating the Risk Premium for Nestle
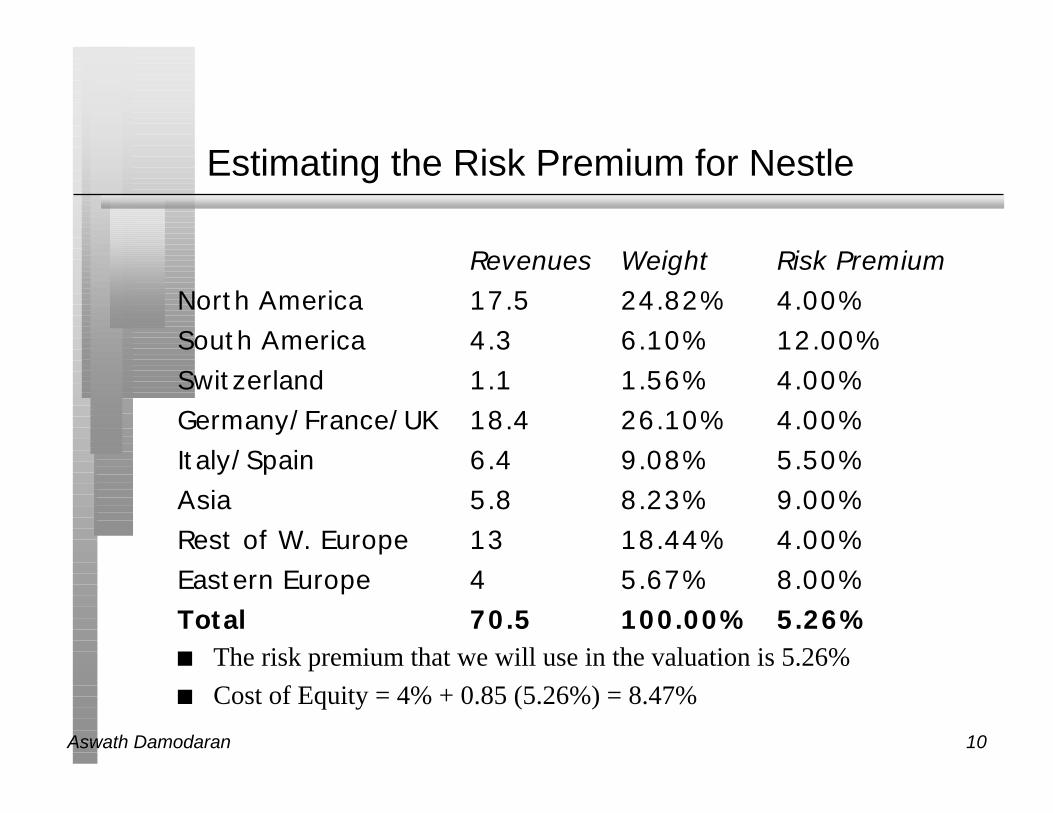
Revenues Weight Risk PremiumNorth America 17.5 24.82% 4.00%South America 4.3 6.10% 12.00%Switzerland 1.1 1.56% 4.00%Germany/France/UK 18.4 26.10% 4.00%Italy/Spain 6.4 9.08% 5.50%Asia 5.8 8.23% 9.00%Rest of W. Europe 13 18.44% 4.00%Eastern Europe 4 5.67% 8.00%Total 70.5 100.00% 5.26%n The risk premium that we will use in the valuation is 5.26%
n Cost of Equity = 4% + 0.85 (5.26%) = 8.47%
Aswath Damodaran 11
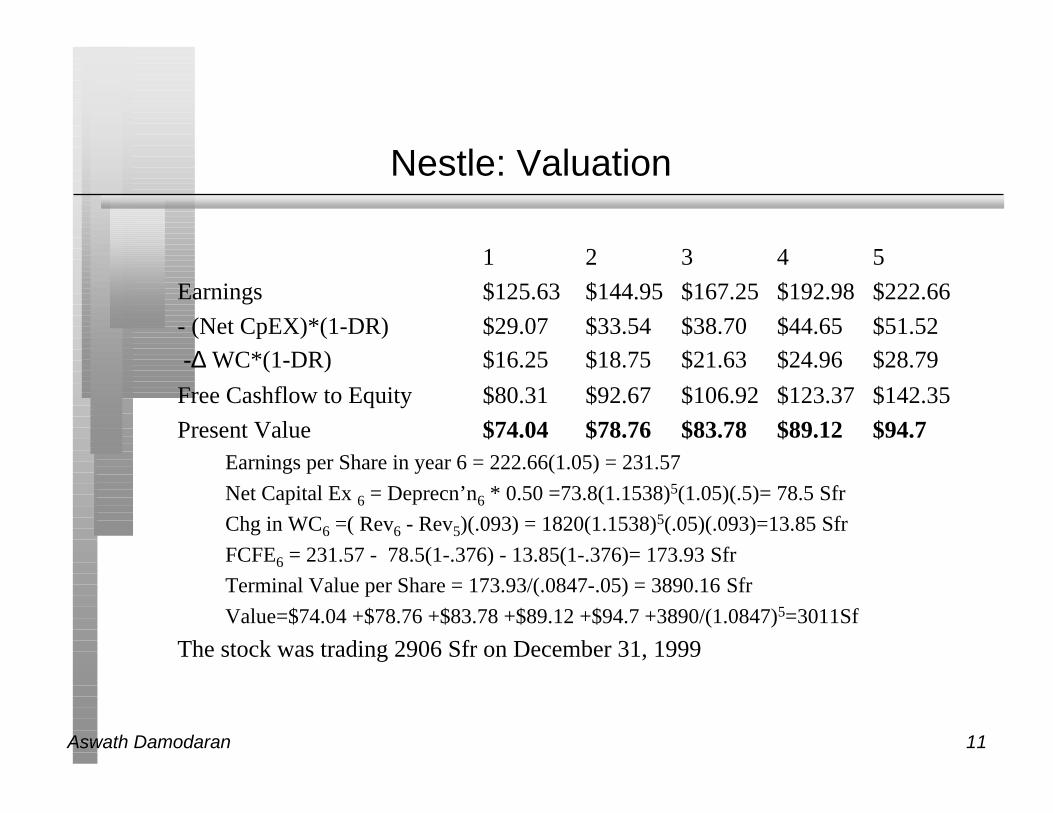
Nestle: Valuation
1 2 3 4 5
Earnings $125.63 $144.95 $167.25 $192.98 $222.66
- (Net CpEX)*(1-DR) $29.07 $33.54 $38.70 $44.65 $51.52
-∆ WC*(1-DR) $16.25 $18.75 $21.63 $24.96 $28.79
Free Cashflow to Equity $80.31 $92.67 $106.92 $123.37 $142.35
Present Value $74.04 $78.76 $83.78 $89.12 $94.7Earnings per Share in year 6 = 222.66(1.05) = 231.57
Net Capital Ex 6 = Deprecn’n6 * 0.50 =73.8(1.1538)5(1.05)(.5)= 78.5 Sfr
Chg in WC6 =( Rev6 - Rev5)(.093) = 1820(1.1538)5(.05)(.093)=13.85 Sfr
FCFE6 = 231.57 - 78.5(1-.376) - 13.85(1-.376)= 173.93 Sfr
Terminal Value per Share = 173.93/(.0847-.05) = 3890.16 Sfr
Value=$74.04 +$78.76 +$83.78 +$89.12 +$94.7 +3890/(1.0847)5=3011Sf
The stock was trading 2906 Sfr on December 31, 1999
Aswath Damodaran 12
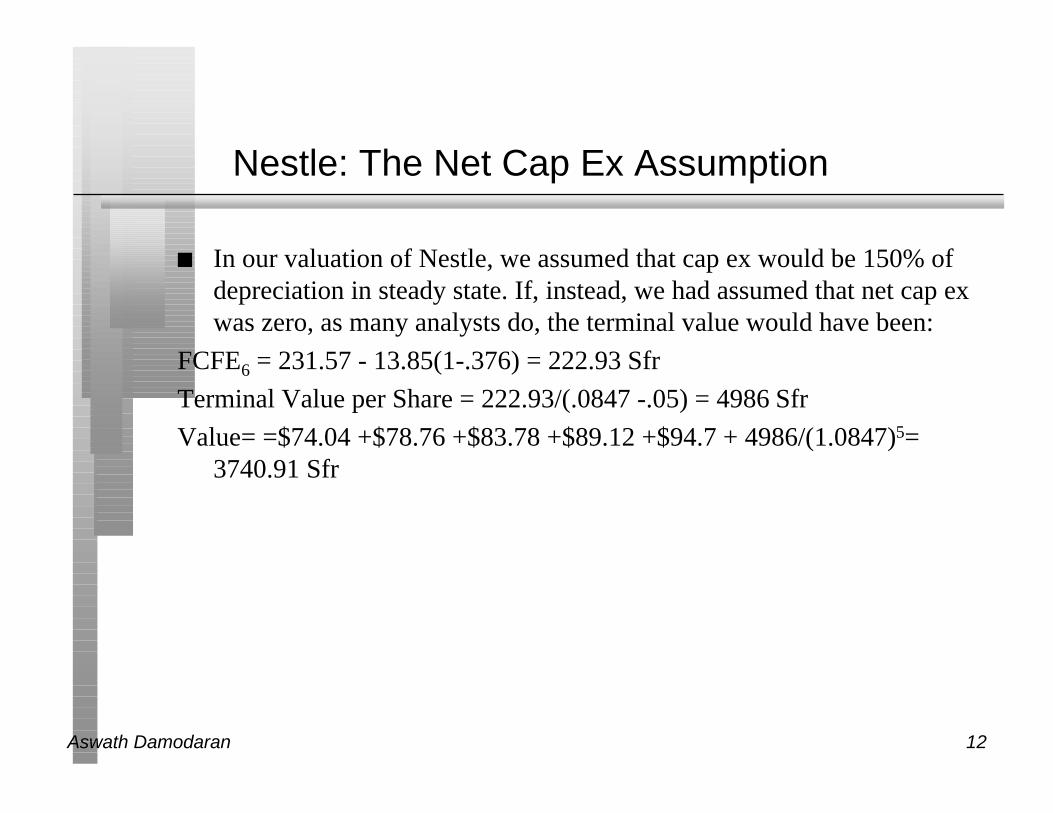
Nestle: The Net Cap Ex Assumption
n In our valuation of Nestle, we assumed that cap ex would be 150% ofdepreciation in steady state. If, instead, we had assumed that net cap exwas zero, as many analysts do, the terminal value would have been:
FCFE6 = 231.57 - 13.85(1-.376) = 222.93 Sfr
Terminal Value per Share = 222.93/(.0847 -.05) = 4986 Sfr
Value= =$74.04 +$78.76 +$83.78 +$89.12 +$94.7 + 4986/(1.0847)5=3740.91 Sfr

Aswath Damodaran 13
Terminal Value= 173.93/(.0847-.05) = 3890
Cashflow to EquityNet Income 108.88- (Cap Ex - Depr) (1- DR) 25.19- Change in WC (!-DR) 4.41= FCFE 79.28
Expected GrowthRetention Ratio *Return on Equity=.651*.2363=15.38%
80.31 Sfr 92.67 Sfr 106.92 Sfr 123.37 Sfr 142.35 Sfr
Forever
Firm is in stable growth:g=5%; Beta=0.85;Cap Ex/Deprec=150%Debt ratio stays 37.6%
.........
Cost of Equity4%+0.85(5.26%)=8.47%
Financing WeightsDebt Ratio = 37.6%
Discount at Cost of Equity
Value of Equity per Share = 3011 Sfr
Riskfree Rate :
Swiss franc rate = 4%+
Beta0.85 X
Risk Premium4% + 1.26%
Bottom-up beta for food= 0.79
Market D/E=11%
Base EquityPremium: 4%
Country RiskPremium:1.26%
A VALUATION OF NESTLE (PER SHARE)
Aswath Damodaran 14
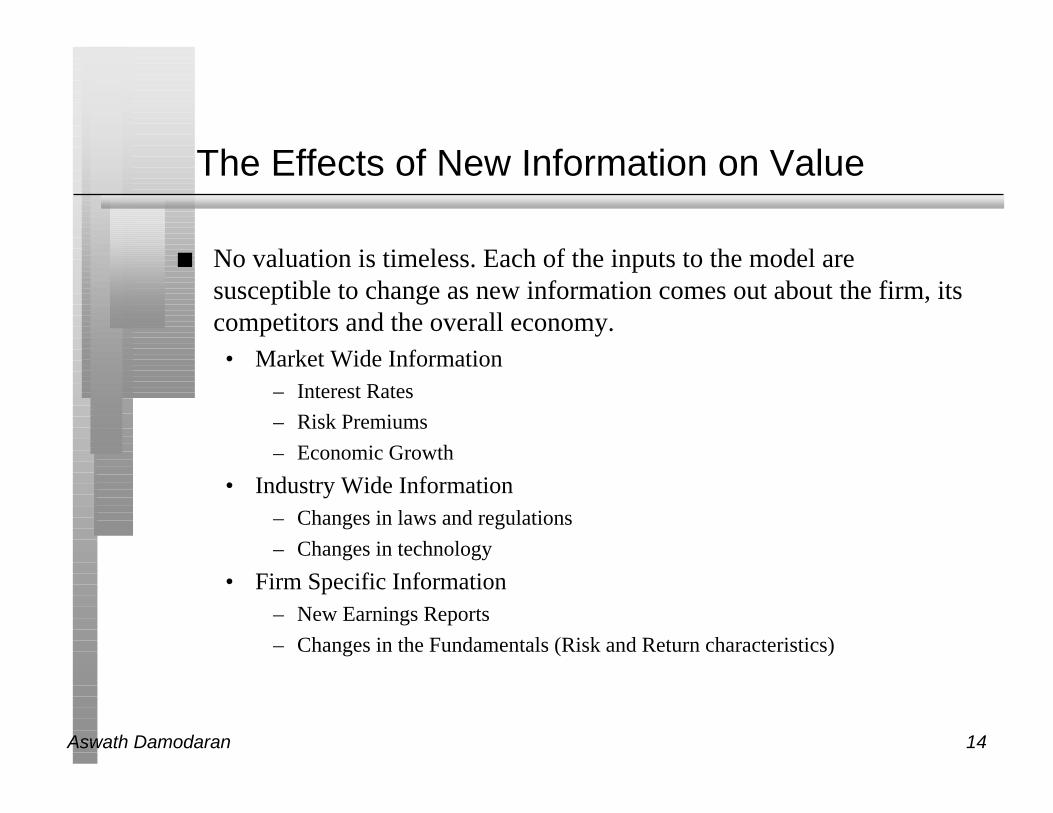
The Effects of New Information on Value
n No valuation is timeless. Each of the inputs to the model aresusceptible to change as new information comes out about the firm, itscompetitors and the overall economy.• Market Wide Information
– Interest Rates
– Risk Premiums
– Economic Growth
• Industry Wide Information– Changes in laws and regulations
– Changes in technology
• Firm Specific Information– New Earnings Reports
– Changes in the Fundamentals (Risk and Return characteristics)
Aswath Damodaran 15
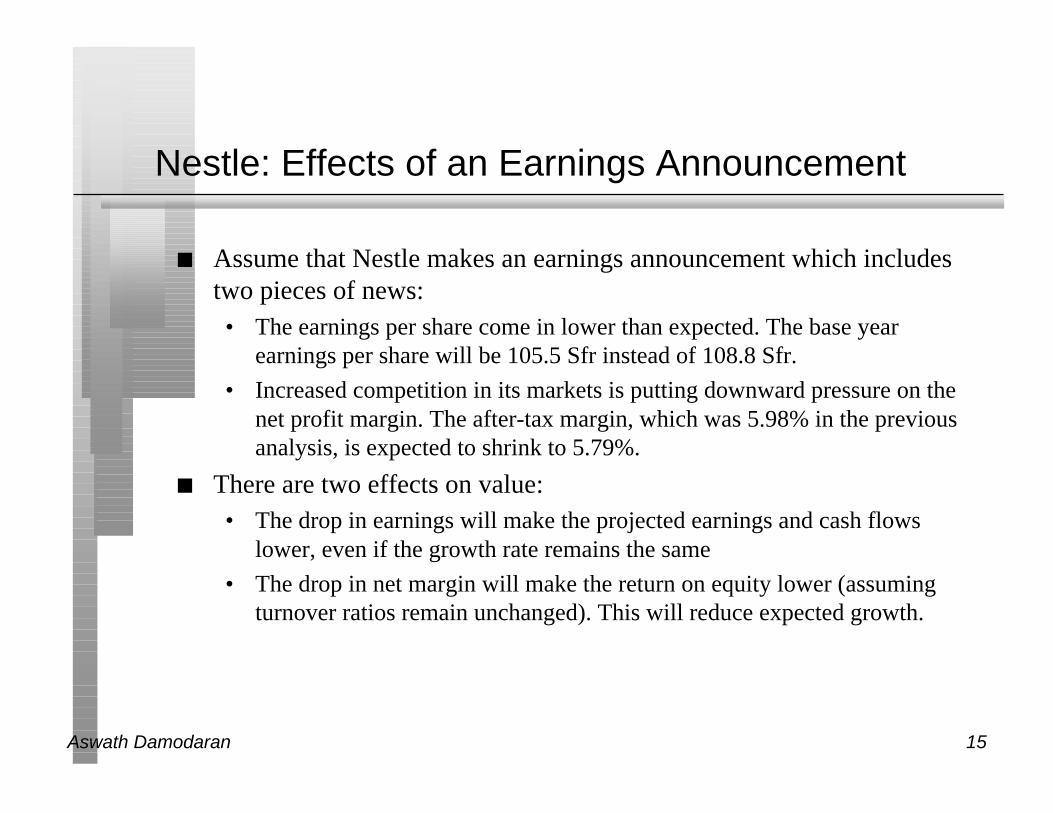
Nestle: Effects of an Earnings Announcement
n Assume that Nestle makes an earnings announcement which includestwo pieces of news:• The earnings per share come in lower than expected. The base year
earnings per share will be 105.5 Sfr instead of 108.8 Sfr.
• Increased competition in its markets is putting downward pressure on thenet profit margin. The after-tax margin, which was 5.98% in the previousanalysis, is expected to shrink to 5.79%.
n There are two effects on value:• The drop in earnings will make the projected earnings and cash flows
lower, even if the growth rate remains the same
• The drop in net margin will make the return on equity lower (assumingturnover ratios remain unchanged). This will reduce expected growth.
Aswath Damodaran 16
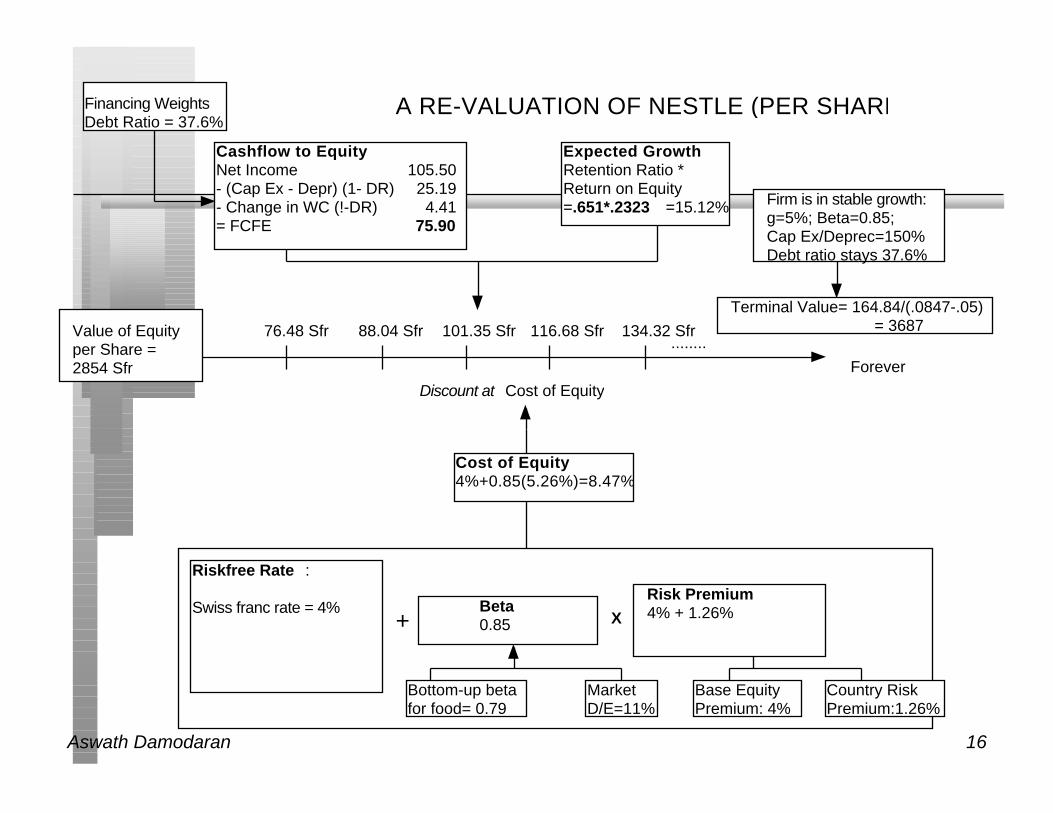
Terminal Value= 164.84/(.0847-.05) = 3687
Cashflow to EquityNet Income 105.50- (Cap Ex - Depr) (1- DR) 25.19- Change in WC (!-DR) 4.41= FCFE 75.90
Expected GrowthRetention Ratio *Return on Equity=.651*.2323 =15.12%
76.48 Sfr 88.04 Sfr 101.35 Sfr 116.68 Sfr 134.32 Sfr
Forever
Firm is in stable growth:g=5%; Beta=0.85;Cap Ex/Deprec=150%Debt ratio stays 37.6%
.........
Cost of Equity4%+0.85(5.26%)=8.47%
Financing WeightsDebt Ratio = 37.6%
Discount at Cost of Equity
Value of Equity per Share = 2854 Sfr
Riskfree Rate :
Swiss franc rate = 4%+
Beta0.85 X
Risk Premium4% + 1.26%
Bottom-up beta for food= 0.79
Market D/E=11%
Base EquityPremium: 4%
Country RiskPremium:1.26%
A RE-VALUATION OF NESTLE (PER SHARE)
Aswath Damodaran 17
Tsingtao Breweries: Rationale for Using Model
n Why three stage? Tsingtao is a small firm serving a huge and growingmarket – China, in particular, and the rest of Asia, in general. Thefirm’s current return on equity is low, and we anticipate that it willimprove over the next 5 years. As it increases, earnings growth will bepushed up.
n Why FCFE? Corporate governance in China tends to be weak anddividends are unlikely to reflect free cash flow to equity. In addition,the firm consistently funds a portion of its reinvestment needs withnew debt issues.
Aswath Damodaran 18
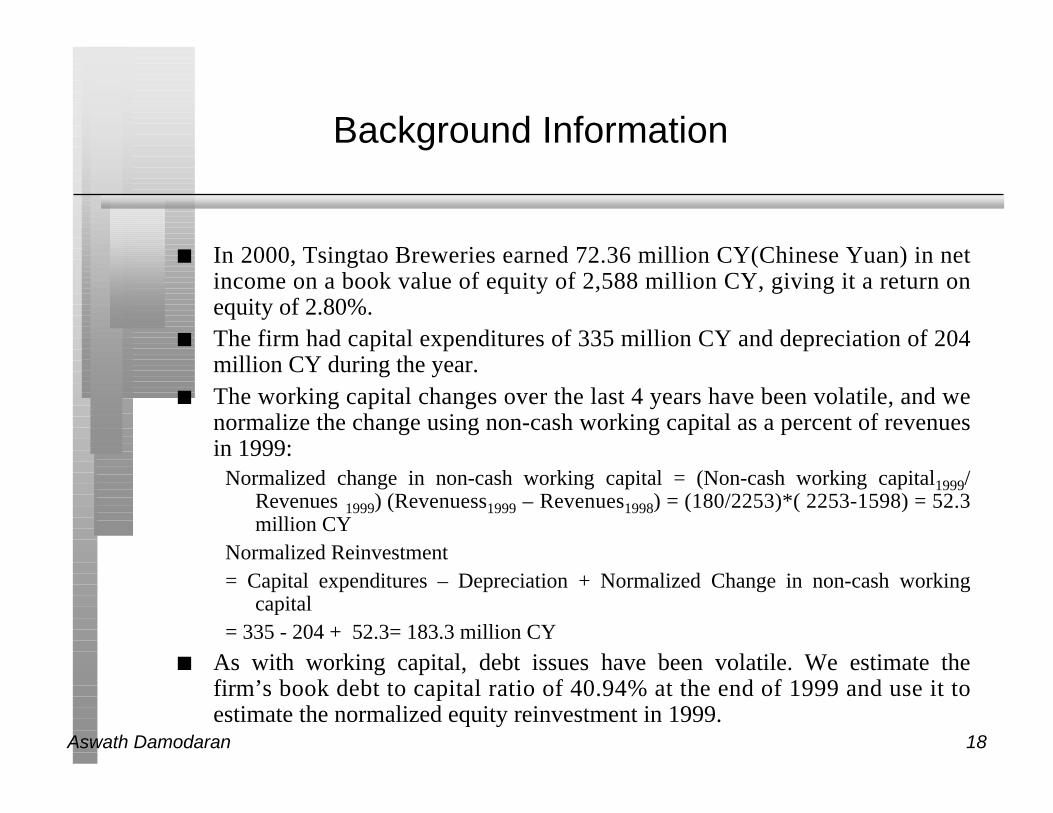
Background Information
n In 2000, Tsingtao Breweries earned 72.36 million CY(Chinese Yuan) in netincome on a book value of equity of 2,588 million CY, giving it a return onequity of 2.80%.
n The firm had capital expenditures of 335 million CY and depreciation of 204million CY during the year.
n The working capital changes over the last 4 years have been volatile, and wenormalize the change using non-cash working capital as a percent of revenuesin 1999:
Normalized change in non-cash working capital = (Non-cash working capital1999/Revenues 1999) (Revenuess1999 – Revenues1998) = (180/2253)*( 2253-1598) = 52.3million CY
Normalized Reinvestment= Capital expenditures – Depreciation + Normalized Change in non-cash working
capital= 335 - 204 + 52.3= 183.3 million CY
n As with working capital, debt issues have been volatile. We estimate thefirm’s book debt to capital ratio of 40.94% at the end of 1999 and use it toestimate the normalized equity reinvestment in 1999.
Aswath Damodaran 19
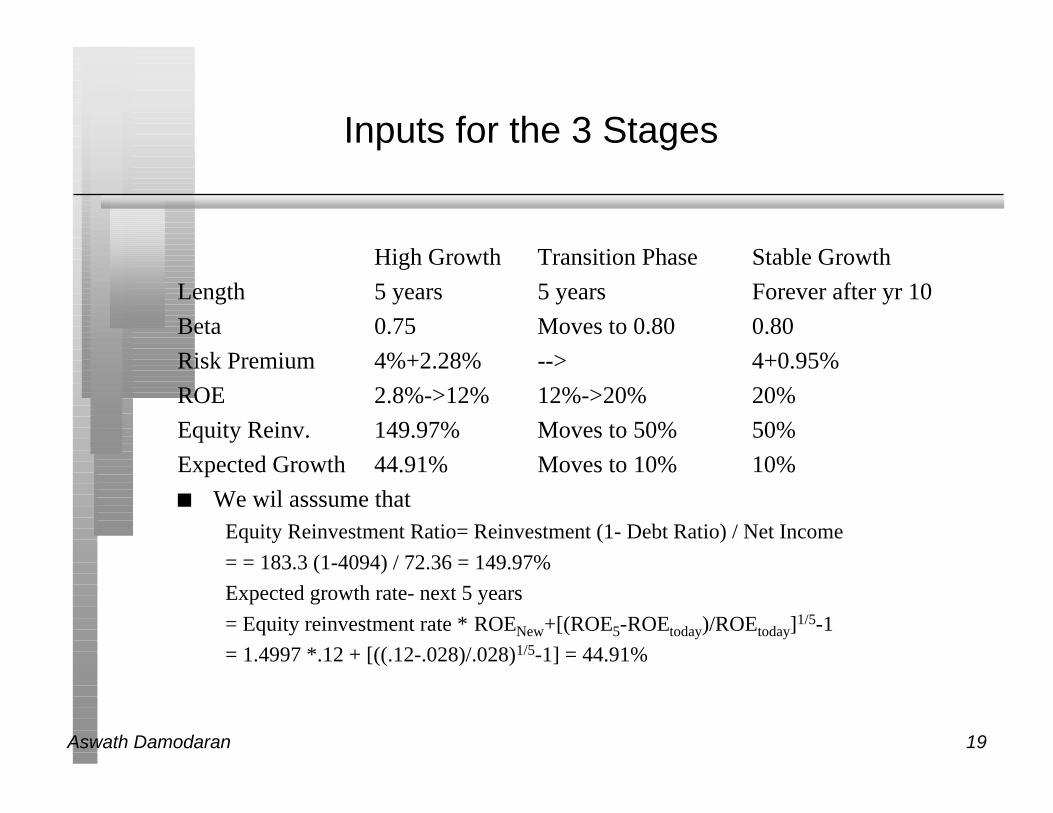
Inputs for the 3 Stages
High Growth Transition Phase Stable Growth
Length 5 years 5 years Forever after yr 10
Beta 0.75 Moves to 0.80 0.80
Risk Premium 4%+2.28% --> 4+0.95%
ROE 2.8%->12% 12%->20% 20%
Equity Reinv. 149.97% Moves to 50% 50%
Expected Growth 44.91% Moves to 10% 10%
n We wil asssume thatEquity Reinvestment Ratio= Reinvestment (1- Debt Ratio) / Net Income
= = 183.3 (1-4094) / 72.36 = 149.97%
Expected growth rate- next 5 years
= Equity reinvestment rate * ROENew+[(ROE5-ROEtoday)/ROEtoday]1/5-1
= 1.4997 *.12 + [((.12-.028)/.028)1/5-1] = 44.91%
Aswath Damodaran 20
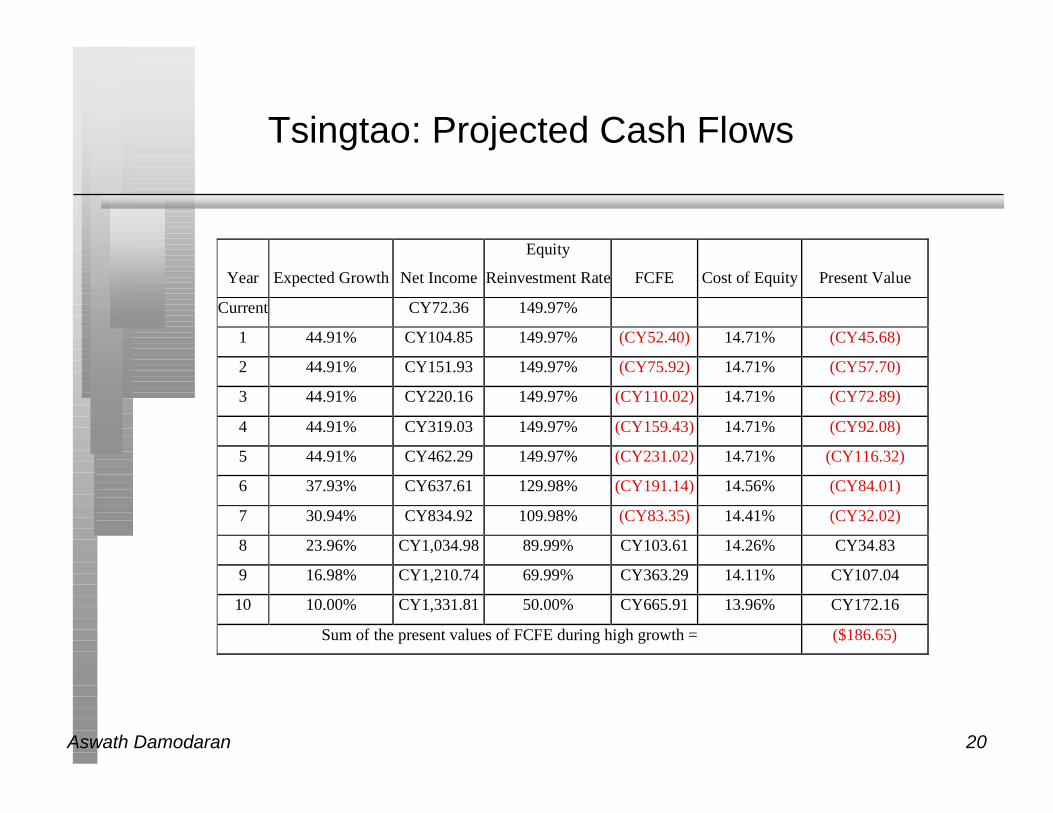
Tsingtao: Projected Cash Flows
Year Expected Growth Net Income
Equity
Reinvestment Rate FCFE Cost of Equity Present Value
Current CY72.36 149.97%
1 44.91% CY104.85 149.97% (CY52.40) 14.71% (CY45.68)
2 44.91% CY151.93 149.97% (CY75.92) 14.71% (CY57.70)
3 44.91% CY220.16 149.97% (CY110.02) 14.71% (CY72.89)
4 44.91% CY319.03 149.97% (CY159.43) 14.71% (CY92.08)
5 44.91% CY462.29 149.97% (CY231.02) 14.71% (CY116.32)
6 37.93% CY637.61 129.98% (CY191.14) 14.56% (CY84.01)
7 30.94% CY834.92 109.98% (CY83.35) 14.41% (CY32.02)
8 23.96% CY1,034.98 89.99% CY103.61 14.26% CY34.83
9 16.98% CY1,210.74 69.99% CY363.29 14.11% CY107.04
10 10.00% CY1,331.81 50.00% CY665.91 13.96% CY172.16
Sum of the present values of FCFE during high growth = ($186.65)

Aswath Damodaran 21
Tsingtao: Terminal Value
n Expected stable growth rate =10%
n Equity reinvestment rate in stable growth = 50%
n Cost of equity in stable growth = 13.96%
n Expected FCFE in year 11
= Net Income11*(1- Stable period equity reinvestment rate)
= CY 1331.81 (1.10)(1-.5) = CY 732.50 million
n Terminal Value of equity in Tsingtao Breweries
= FCFE11/(Stable period cost of equity – Stable growth rate)
= 732.5/(.1396-.10) = CY 18,497 million
Aswath Damodaran 22
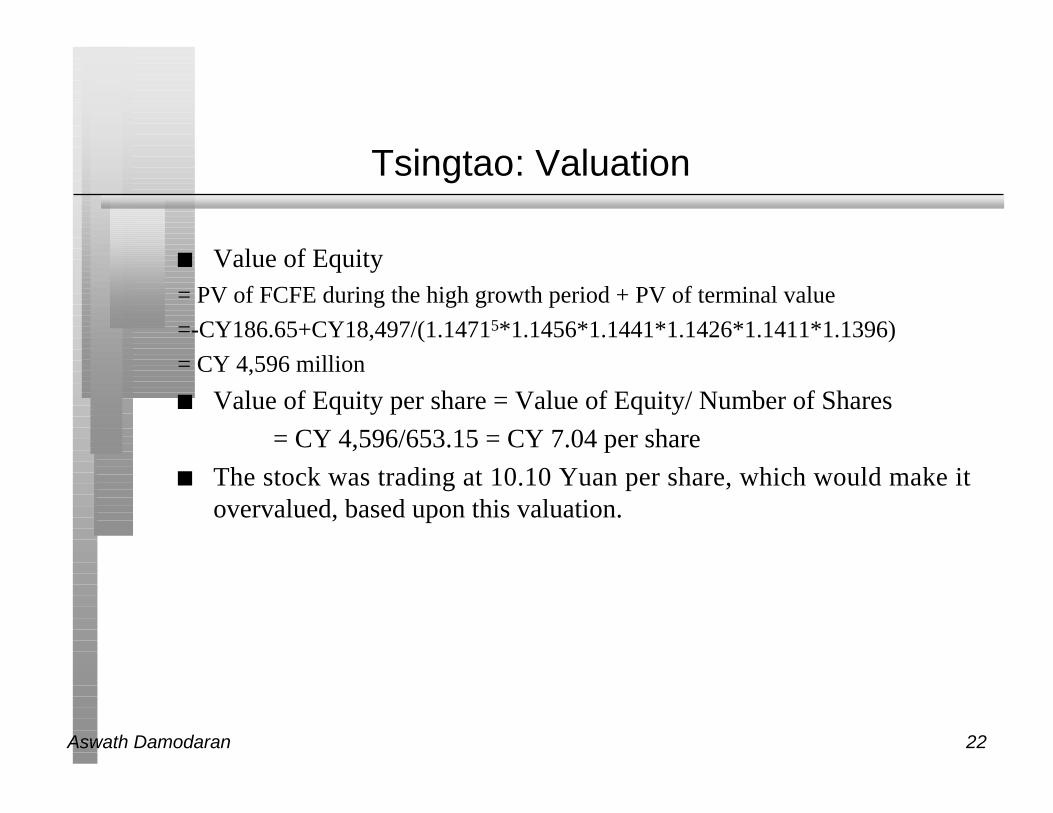
Tsingtao: Valuation
n Value of Equity= PV of FCFE during the high growth period + PV of terminal value
=-CY186.65+CY18,497/(1.14715*1.1456*1.1441*1.1426*1.1411*1.1396)
= CY 4,596 million
n Value of Equity per share = Value of Equity/ Number of Shares
= CY 4,596/653.15 = CY 7.04 per share
n The stock was trading at 10.10 Yuan per share, which would make itovervalued, based upon this valuation.