Strain-Rate Sensitive Behavior of Cement Paste and …iri/projects/concrete/HSD.pdf · Strain-Rate...
9
ACI MATERIALS JOURNAL TECHNICAL PAPER Title no. 87-M55 Strain-Rate Sensitive Behavior of Cement Paste and Mortar in Compression. by Shraddhakar Harsh, Zhenjia Shen, and David Darwin The strain-rate sensitivity of the cement paste and mortar constitu- ents of concrete is studied experimentally. Saturated cement paste and mortar specimens are loaded in compression to 15,000 microstrains, 27 to 29 days after casting, using strain rates ranging from 0.3 to 300,000 microstrainslsec. Water-cement ratios of 0.3, 0.4, and 0.5 are used. Strain-rate sensitivity of the materials is measured in terms of the initial elastic moduli, maximum stress, and corresponding strain. The initial elastic moduli and the strength of cement paste and mor- tar increase by 7 percent and 15 percent, respectively, with each or- der of magnitude increase in strain rate. The strain at the maximum stress is the greatest for the lowest strain rate. With an increase in strain rate, the strain at the maximum stress first decreases and then increases. Keywords: cement pastes; compression; compressive strength; concretes; mod· ulus of elasticity; mortars (material); Poisson ratio; sands; saturation; strains; stresses; stress-strain diagram. The strain-rate sensitive behavior of concrete and its constituents has been under investigation for several decades. 1 The rate sensitivity has generally been meas- ured in terms of the strength, modulus of elasticity, or the strain at the maximum stress in compression. It has also been measured in terms of Poisson's ratio, tensile strength, or flexural strength. In most studies, the compressive strength of concrete and its constituents has been observed to increase ap- proximately linearly with each order of magnitude (factor of 10) increase in strain rate, up to moderate strain rates, e.g., about 1000 microstrains/sec. Gener- ally, the increase has been 7 to 15 percent with each or- der of magnitude increase in strain rate or stress rate. 1 -s In a few cases, however, the increase has been consid- erably less 9 • 10 or insignificant. 2 • 11 At higher than moder- ate strain rates (i.e., above 1000 microstrains/sec), there has been less agreement among various studies. Some have observed that the linear relation is maintained up to strain rates as high as 8 x 10 8 microstrains/sec, 12 while others have found the relation to be either con- cave upward, 10 • 13 • 15 or concave downward 16 • 17 with in- creasing strain rate. The modulus of elasticity, while less sensitive than strength, 11 • 19 has also been found to increase with strain rate. 508 The effect of strain rate on the Poisson's ratio of on- crete has not been investigated extensively. 2 • 20 No re- sults are available on the strain-rate sensitivity of Pois- son's ratio for cement paste and mortar. There is little agreement among researchers on the rate-sensitive behavior of the strain at the maximum stress. Some have found it to increase, 10 • 20 • 21 while oth- ers have found it to remain almost constant 19 • 22 or even decrease 2 • 17 • 23 with increasing strain rate. Generally, in cases when it was found to increase, the tests were done at higher strain rates. In spite of the considerable number of studies on the rate sensitivity of concrete and its constituents, there are significant disagreements. The disagreements can sometimes be attributed to changes in test conditions, such as the moisture content of specimens, the curing conditions, or the range of strain rates used. For ex- ample, the insignificant increase in compressive strength with increasing strain rate observed by Dhir and Sangha 2 was most likely due to the low moisture con- tent of their specimens, caused by storage in air for 10 weeks. The purpose of this study is to help improve the knowledge of concrete by studying the rate-sensitive re- sponse of its constituents, cement paste, and mortar. The study is aimed at gathering basic information on the response of fully saturated materials, that is, materials that are not affected by drying. A study of materials in the saturated state, while not universally applicable to all concrete, directly applies to a large percentage of concrete structures, which remain satu- rated at depth. Compressive stress-strain response is measured in terms of the peak stress ,fp, the strain cor- responding to the peak stress Ep, the initial modulus of AC! Materials Journal, V. 87, No. 5, September-October 1990. Received June 23, 1989, and reviewed under Institute publication policies. Copyright © 1990, American Concrete Institute. All rights reserved, includiing the making of copies unless permission is obtained from the copyright propri- etors. Pertinent discussion will be published in the July-AugusM991 AC! Ma- terials Journal if received by Apr. I, 1991. ACI Materials Journal I September-October 1990
-
Upload
phungthien -
Category
Documents
-
view
214 -
download
0
Transcript of Strain-Rate Sensitive Behavior of Cement Paste and …iri/projects/concrete/HSD.pdf · Strain-Rate...

ACI MATERIALS JOURNAL TECHNICAL PAPER Title no. 87-M55
Strain-Rate Sensitive Behavior of Cement Paste and Mortar in Compression.
by Shraddhakar Harsh, Zhenjia Shen, and David Darwin
The strain-rate sensitivity of the cement paste and mortar constituents of concrete is studied experimentally. Saturated cement paste and mortar specimens are loaded in compression to 15,000 microstrains, 27 to 29 days after casting, using strain rates ranging from 0.3 to 300,000 microstrainslsec. Water-cement ratios of 0.3, 0.4, and 0.5 are used. Strain-rate sensitivity of the materials is measured in terms of the initial elastic moduli, maximum stress, and corresponding strain. The initial elastic moduli and the strength of cement paste and mortar increase by 7 percent and 15 percent, respectively, with each order of magnitude increase in strain rate. The strain at the maximum stress is the greatest for the lowest strain rate. With an increase in strain rate, the strain at the maximum stress first decreases and then increases.
Keywords: cement pastes; compression; compressive strength; concretes; mod· ulus of elasticity; mortars (material); Poisson ratio; sands; saturation; strains; stresses; stress-strain diagram.
The strain-rate sensitive behavior of concrete and its constituents has been under investigation for several decades.1 The rate sensitivity has generally been measured in terms of the strength, modulus of elasticity, or the strain at the maximum stress in compression. It has also been measured in terms of Poisson's ratio, tensile strength, or flexural strength.
In most studies, the compressive strength of concrete and its constituents has been observed to increase approximately linearly with each order of magnitude (factor of 10) increase in strain rate, up to moderate strain rates, e.g., about 1000 microstrains/sec. Generally, the increase has been 7 to 15 percent with each order of magnitude increase in strain rate or stress rate. 1-s
In a few cases, however, the increase has been considerably less9•10 or insignificant. 2•11 At higher than moderate strain rates (i.e., above 1000 microstrains/sec), there has been less agreement among various studies. Some have observed that the linear relation is maintained up to strain rates as high as 8 x 10⁸ microstrains/sec, 12
while others have found the relation to be either concave upward, 10•13• 15 or concave downward16•17 with increasing strain rate.
The modulus of elasticity, while less sensitive than strength, 11•19 has also been found to increase with strain rate.
508
The effect of strain rate on the Poisson's ratio of oncrete has not been investigated extensively. 2•20 No results are available on the strain-rate sensitivity of Poisson's ratio for cement paste and mortar.
There is little agreement among researchers on the rate-sensitive behavior of the strain at the maximum stress. Some have found it to increase, 10•20•21 while others have found it to remain almost constant19•22 or even decrease2•17•23 with increasing strain rate. Generally, in cases when it was found to increase, the tests were done at higher strain rates.
In spite of the considerable number of studies on the rate sensitivity of concrete and its constituents, there are significant disagreements. The disagreements can sometimes be attributed to changes in test conditions, such as the moisture content of specimens, the curing conditions, or the range of strain rates used. For example, the insignificant increase in compressive strength with increasing strain rate observed by Dhir and Sangha2 was most likely due to the low moisture content of their specimens, caused by storage in air for 10 weeks.
The purpose of this study is to help improve the knowledge of concrete by studying the rate-sensitive response of its constituents, cement paste, and mortar. The study is aimed at gathering basic information on the response of fully saturated materials, that is, materials that are not affected by drying. A study of materials in the saturated state, while not universally applicable to all concrete, directly applies to a large percentage of concrete structures, which remain saturated at depth. Compressive stress-strain response is measured in terms of the peak stress ,fp, the strain corresponding to the peak stress Ep, the initial modulus of
AC! Materials Journal, V. 87, No. 5, September-October 1990. Received June 23, 1989, and reviewed under Institute publication policies.
Copyright © 1990, American Concrete Institute. All rights reserved, includiing the making of copies unless permission is obtained from the copyright proprietors. Pertinent discussion will be published in the July-AugusM991 AC! Materials Journal if received by Apr. I, 1991.
ACI Materials Journal I September-October 1990

ACI member Shraddhakar Harsh is a design engineer with McGraw Construction, Ashland, Kentucky. He holds a BS from Brita Institute of Technology and Science, Pilani, India, an MBA from Podar Institute of Management, Jaipur, India, and MS and PhD degrees from the University of Kansas. He has seven years of experience in the construction industry.
Zhmjia Shen is a visiting scholar at the University of Manitoba. He recently completed three years of study at the University of Kansas. He holds a master of science degree from Tongji University, Shanghai, People's Republic of China, and has served as an assistant engineer with the No. I Bureau of Railroads and as an instructor in the Department of Materials Engineering at the Shanghai Institute of Building Materials.
David Darwin, FACI, Deane E. Ackers Professor of Civil Engineering and Director of the Structural Engineering and Materials Laboratory at the University of Kansas. He is a member of the Board of Direction and the Technical Activities Committee and is Past President of the Kansas Chapter of ACI. He is also a member and past-chairman of ACI Committee 224, Cracking. He is a member of ACI Committee 408, Bond and Development of Reinforcement; ACI-ASCE Committee 445, Shear and Torsion; ACI Committee 446, Fracture Mechanics; ACI-ASCE Committee 447, Finite Element Analysis of Reinforced Concrete Structures; and the Concrete Materials Research Council.
elasticity E;, and the initial Poisson's ratio ";· Material response is compared based on strain rate €, water-cement ratio (wlc), and sand-cement ratio (sic). Details of this study are provided in Reference 24.
RESEARCH SIGNIFICANCE This experimental study investigates the strain-rate
sensitive behavior of saturated cement paste and mortar in compression. The stress-strain response of these materials is found to be significantly sensitive to the strain rate. The results indicate that the peak stress will increase with each order of magnitude increase in strain rate. The strain at peak stress first decreases, then increases with an increase in strain rate. The results clearly show that the initial elastic moduli of the materials also increase significantly with each order of magnitude increase in strain rate, which emphasizes how very few aspects of the response of these materials in compression can be considered independent of strain rate. This study has added significance because strainrate tests are most often run on partially dried specimens (a complete lack of moisture control is not uncommon) and data from tests conducted under fully saturated conditions, as described in this paper, are sparse.
EXPERIMENTAL PROGRAM Materials
Cement - Type I portland cement with the following composition was used: tricalcium silicate = 51.1 percent, dicalcium silicate = 22.3 percent, tetracalcium aluminoferrite = 9.5 percent, and tricalcium aluminate = 7 percent.
Fine aggregate - The fine aggregate was river sand consisting mainly of quartz, with 10 to 15 percent feldspar. Larger particles contained some limestone and dolomite. Fineness modulus = 2.91, bulk specific gravity (saturated surface dry) = 2.61, absorption = 0.79 percent. Source: Kansas River, Lawrence, Kansa8. The sand was passed through a No. 4 sieve before use.
Mix proportions - Three water-cement ratios (wlc), 0.3, 0.4, and 0.5, were used for cement paste.and mortar. Concrete mixtures were proportioned for each w I c
ACI Materials Journal I September-October 1990
Top Platen
T LVDT
Bottom Platen~ ~1"
Fig. 1 - Schematic of test setup
to obtain the sand-cement ratio (sic) for the corresponding mortar, designated as Mortar A. For wlc = 0.4 and 0.5, a second mortar, Mortar B, was also tested to evaluate the effect of a change in sic upon the response. Mortar A with wlc = 0.3 had a sic of 0.97. For wlc = 0.4, Mortar A had a sic of 1.59, and Mortar B had a sic of 1.97. For wlc = 0.5, Mortar A had a sic of 2.28 and Mortar B had a sic of 1.29.
Test specimens Prismatic test specimens, 1 x 1 x 5 in., were pre
pared using steel molds. The constituents were mixed according to ASTM C 305-87, 2' except that the sand was oven-dried at 105 C for 24 hr and then presoaked for 5 min before mixing. The specimens were cast in a vertical position. The molds were filled in three equal layers. The degree of consolidation was adjusted to account for the stiffness of the plastic material. For wlc = 0.5, each layer was hand-rodded 25 times using a V-iin. diameter steel rod. For wlc = 0.3 and 0.4, the molds were bolted to a vibrating table with a frequency of 60 cycles/sec and an amplitude of 0.006 in. Each layer was vibrated for 2.5 min for wlc = 0.3 and 2 min for wlc = 0.4. The molds were sealed at the top.
During the first 24 hr, the molds were stored in a horizontal position to reduce the effects of bleeding. The specimens were then removed from the molds and stored in lime-saturated water until the time of test.
Prior to testing, the specimens were shortened to 3 in. by removing equal portions from each end using a high-speed masonry saw. Each specimen was wrapped in plastic to avoid the loss of moisture. The specimens remained saturated throughout testing.
Loading procedure Specimens were loaded in uniaxial compression using
a closed-loop servo-hydraulic testing machine. A pair of linear variable differential transformers (L VDTs) were used to measure the average axial strain (Fig. 1), and to control the applied strain. The two L VDTs provided the average longitudinal strain for the total height of the specimen. Two extensometers were attached at midheight on opposite faces of the specimen to obtain the average lateral strain over the width of the specimen.
The specimens were strained in compression to 15,000 microstrain, insuring data from th~ descending as well as the ascending portions of the stress-strain
509
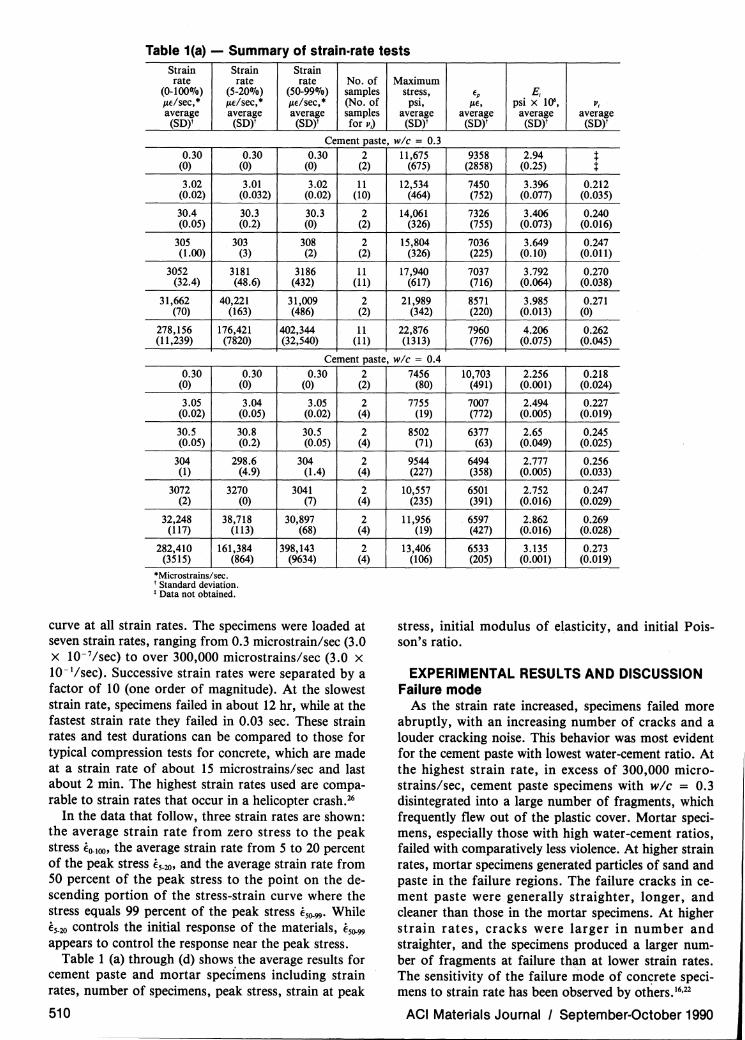
Table 1(a} - Summary of strain-rate tests Strain Strain Strain rate rate rate No. of Maximum
(0-lOOOJo) (5-20%) (50-99%) samples stress, E, E, µEl sec,* µdsec,* µEl sec,* (No. of psi, µE, psi x 10', v, average average average samples average average average average
(SD)1 (SD)1 (SD)1 for v,) (SD)1 (SD)1 (SD)1 (SD)1
Cement paste, wlc = 0.3 0.30 0.30 0.30 2 11,675 9358 2.94 t
(0) (0) (0) (2) (675) (2858) (0.25) t 3.02 3.01 3.02 11 12,534 7450 3.396 0.212
(0.02) (0.032) (0.02) (10) (464) (752) (0.077) (0.035)
30.4 30.3 30.3 2 14,061 7326 3.406 0.240 (0.05) (0.2) (0) (2) (326) (755) (0.073) (0.016)
305 303 308 2 15,804 7036 3.649 0.247 (1.00) (3) (2) (2) (326) (225) (0.10) (0.011)
3052 3181 3186 11 17,940 7037 3.792 0.270 (32.4) (48.6) (432) (11) (617) (716) (0.064) (0.038)
31,662 40,221 31,009 2 21,989 8571 3.985 0.271 (70) (163) (486) (2) (342) (220) (0.013) (0)
278,156 176,421 402,344 11 22,876 7960 4.206 0.262 (11,239) (7820) (32,540) (11) (1313) (776) (0.075) (0.045)
Cement paste, wlc = 0.4
0.30 0.30 (0) (0)
3.05 3.04 (0.02) (0.05)
30.5 30.8 (0.05) (0.2)
304 298.6 (1) (4.9)
3072 3270 (2) (0)
32,248 38,718 (117) (113)
282,410 161,384 (3515) (864)
*Microstrains/ sec. 1 Standard deviation. 1 Data not obtained.
0.30 2 (0) (2)
3.05 2 (0.02) (4)
30.5 2 (0.05) (4)
304 2 (1.4) (4)
3041 2 (7) (4)
30,897 2 (68) (4)
398,143 2 (9634) (4)
curve at all strain rates. The specimens were loaded at seven strain rates, ranging from 0.3 microstrain/sec (3.0 x 10⁻¹/sec) to over 300,000 microstrains/sec (3.0 x 10- 1/sec). Successive strain rates were separated by a factor of 10 (one order of magnitude). At the slowest strain rate, specimens failed in about 12 hr, while at the fastest strain rate they failed in 0.03 sec. These strain rates and test durations can be compared to those for typical compression tests for concrete, which are made at a strain rate of about 15 microstrains/sec and last about 2 min. The highest strain rates used are comparable to strain rates that occur in a helicopter crash.26
In the data that follow, three strain rates are shown: the average strain rate from zero stress to the peak stress €{)-100 , the average strain rate from 5 to 20 percent of the peak stress €5_20 , and the average strain rate from 50 percent of the peak stress to the point on the descending portion of the stress-strain curve where the stress equals 99 percent of the peak stress €5()-99 • While €5_20 controls the initial response of the materials, €5()-99
appears to control the response near the peak stress. Table 1 (a) through (d) shows the average results for
cement paste and mortar specimens including strain rates, number of specimens, peak stress, strain at peak
510
7456 10,703 2.256 0.218 (80) (491) (0.001) (0.024)
7755 7007 2.494 0.227 (19) (772) (0.005) (0.019)
8502 6377 2.65 0.245 (71) (63) (0.049) (0.025)
9544 6494 2.777 0.256 (227) (358) (0.005) (0.033)
10,557 6501 2.752 0.247 (235) (391) (0.016) (0.029)
11,956 6597 2.862 0.269 (19) (427) (0.016) (0.028)
13,406 6533 3.135 0.273 (106) (205) (0.001) (0.019)
stress, initial modulus of elasticity, and initial Poisson's ratio.
EXPERIMENTAL RESULTS AND DISCUSSION Failure mode
As the strain rate increased, specimens failed more abruptly, with an increasing number of cracks and a louder cracking noise. This behavior was most evident for the cement paste with lowest water-cement ratio. At the highest strain rate, in excess of 300,000 microstrains/sec, cement paste specimens with w/c = 0.3 disintegrated into a large number of fragments, which frequently flew out of the plastic cover. Mortar specimens, especially those with high water-cement ratios, failed with comparatively less violence. At higher strain rates, mortar specimens generated particles of sand and paste in the failure regions. The failure cracks in cement paste were generally straighter, longer, and cleaner than those in the mortar specimens. At higher strain rates, cracks were larger in number and straighter, and the specimens produced a larger number of fragments at failure than at lower strain rates. The sensitivity of the failure mode of concrete specimens to strain rate has been observed by others. 16•22
ACI Materials Journal I September-October 1990
Table 1(b) - Summary of strain-rate tests Strain Strain Strain rate rate rate No. of Maximum
(0-1000"/o) (5-200"/o) (50-990"/o) samples stress, f, E; µEl sec,* µEl sec,* µEl sec,* (No. of psi, µf, psi x 10' V;
average average average samples average average average average (SD)! (SD)' (SD)' for v;) (SD)' (SD)' (SD)' (SD)'
Cement paste, wlc = 0.5
0.30 0.31 0.30 2 5048 7024 1.760 0.218 (0) (0) (0) (3) (79) (632) (0.034) (0.0)
3.0 3.01 3.0 11 5896 6311 2.035 0.234 (0.02) (0.029) (0.02) (3) (318) (737) (0.097) (0.007)
30.4 30.5 30.4 2 6551 5857 1.935 0.214 (0.05) (0.20) (0.05) (2) (38) (27) (0.032) (0.017)
305 298.8 305 2 6897 5358 2.114 0.247 (2) (1) (2) (2) (31) (262) (0.010) (0.030)
3048 3330 3007 11 7878 5568 2.339 0.267 (20) (66.7) (21.9) (0) (398) (638) (0.086) (0.021)
32,863 38,002 31,160 2 8093 5198 2.289 0.261 (167) (12) (191) (2) (211) (261) (0.037) (0.024)
284,722 162,043 391,875 11 9816 5886 2.678 0.281 (8700) (6064) (10,801) (0) (629) (552) (0.103) (0.012)
Mortar, wlc = 0.3, sic = 0.97
25000
20000
l 15000
Ii ~ 10000
5000
0 -5000
0.30 0.30 (0) (0.005)
3.04 2.99 (0) (0.03)
30.3 30.5 (0) (0.025)
291 306 (13) (3)
3090 3681 (10) (136)
32, 155 29,730 (914) (2132)
264,352 141,982 (7939) (10014)
*Microstrains/ sec. 1 Standard deviation. 1 Data not obtained.
0 5000 Microstroin
0.30 2 (0) (0)
3.05 2 (0.01) (1)
30.3 2 (0.5) (2)
302 2 (0) (2)
3068 2 (12) (2)
31,447 2 (595) (2)
465,254 2 (2666) (2)
300.000 11'/•ec
0.3 11'/sec
10000 15000
Fig. 2 - Stress versus longitudinal and transverse strain for cement paste with w!c = 0.3, tested at strain rates from 0.3 to 300,000 microstrainslsec
Stress-strain curves Fig. 2 and 3 show typical stress-strain curves at the
seven strain rates for cement paste and mortar with w/c = 0.3. Oscillations after the peak stress in the stress-strain curves at higher strain rates are due to the limited stiffness of the load frame and the finite re-
ACI Materials Journal I September-October 1990
9831 4901 3.843 t (155) (100) (0.386) t
10,841 4157 4.553 0.207 (23) (55) (0.045) (0.0)
12,323 4164 4.906 0.235 (215) (56) (0.059) (0.0)
13,394 4183 5.070 0.236 (212) (37) (0.067) (0.021)
14,558 4226 5.008 0.238 (167) (185) (0.097) (0.031)
15,695 4377 5.955 0.260 (196) (94) (0.716) (0.014)
17,804 4636 5.675 0.274 (240) (33) (0.211) (0.020)
20000 300,000 ,../soc
l 15000
"'! 10000
OL_~_,__~.L_~_,_~I.IT::E~~iiilll..----i~__J -5000 0 5000 10000 15000
Microstroin
Fig. 3 - Stress versus longitudinal and transverse strain for mortar with w!c = 0.3, tested at strain rates from 0.3 to 300,000 microstrains!sec
sponse time of the servo-hydraulic feedback system. The figures show both the longitudinal and transverse strains. Similar curves were also obtained for w!c = 0.4 and 0.5.24
A significant change in the stress-strain response of the materials with each order of magnitude increase in
511

Table 1(c) - Summary of strain-rate tests Strain Strain Strain rate rate rate No. of Maximum
(0-100%) (5-20%) (50-990Jo) samples stress, fp E; f.LE/sec, * f.LElsec,* f.LElsec, * (No. of psi, f.LE, psi x HJ' "II;, average average average samples average average average average
(SD)t (SD)' (SD)' for v;) (SD)' (SD)' (SD)' (SD)'
Mortar A, wlc = 0.4, sic = 1.59 0.31 0.30 0.30 2 7356 4132 3.898 +
(0) (0) (0) (0) (39) (61) (0.10) t 3.03 3.01 3.03 2 7814 3712 4.256 t
(0.03) (0.38) (0.04) (0) (60) (72) (0.046) + 30.6 30.4 30.6 2 8812 3336 4.738 0.205 (0.5) (0.38) (0.01) (l) (92) (196) (0.176) (0.0)
306 293 306 2 9588 3502 4.978 0.256 (0.5) (7) (0.1) (2) (184) (32) (0.079) (0.017)
3038 3970 3080 2 10,398 3520 4.938 0.269 (84) (56) (30) (l) (180) (225) (0.315) (0.001)
32,262 26,135 31,776 2 11,278 3721 5.100 0.273 (551) (515) (551) (2) (148) (133) (0.141) (0.001)
267,708 126,581 521,089 3 12,547 3620 5.817 0.281 (4935) (4219) (29,090) (2) (116) (180) (0.189) (0.011)
Mortar B, wlc = 0.4, sic = 1.97
0.31 0.30
3.04 3.01 (0.02) (0.05)
30.6 30.2 (0.05) (0.4)
304 297 (l) (3.5)
3111 3915 (22) (0)
32,345 28,965 (1057) (3489)
264,199 123,744 (3785) (489)
• Microstrains/sec. t Standard deviation. 1 Data not obtained.
0.30 l (0)
3.03 5 (0.027) (2)
30.4 2 (0.1) (2)
303 2 (l) (l)
3047 2 (16) (2)
31,692 3 (1127) (l)
512,384 2 (15476) (0)
2.25 ...-------------------.,
·;; c.
:f 1.75
~ "' :r 'll .~ l t.2!l
~
0.7~0 -t
o. -- Paste WIC • 0.3 l!I ··-·-·-·-· Poole WIC • 0.4 z ---- Poole WIC • 0.5 • -- Mortar WIC • 0.3 • ··-·-·-·-· Mortar WIC • 0.4-A • ·--·-·-·-· Mortar WIC ~ 0.4-B C!I ---- Mortar WIC • 0.5-A • ---- Mortar WIC • 0.5-B
10 J
Microstrain/sec
Fig. 4 - Normalized peak stress versus strain rates (i::5.2a) for cement paste and mortar with w I c = 0.3, 0.4, and 0.5
strain rate is clearly seen in these figures. For each material, as the strain rate is increased, both the initial slope and the peak stress increase, while the nonlinearity of the initial response decreases. The strain at the peak stress is generally the greatest at the lowest strain rate (0.3 microstrain/sec). As the strain rate is increased, the strain at the peak stress first decreases and then increases. Similar variations have been observed by others2•17•27•28 for concrete and its constituents. Spe-
512
7566 4045 3.888 +
8002 3272 4.618 0.228 (178) (151) (0.212) (0.027)
8760 3200 4.851 0.249 (57) (10) (0.073) (0.022)
9724 3267 5.195 0.270 (87) (122) (0.132) (0.0)
10,508 3142 5.450 0.278 (52) (109) (0.009) (0.006)
11,515 3398 5.689 0.273 (58) (76) (0.211) (0.0)
12,720 3568 5.954 + (213) (146) (0.024)
12000 .----------------------.
: 8000
"' :r -i; c
~ 4000
• -- Mortar WIC • 0.3 • ··-·-·-·-· Mort or W IC • 0.4-A • ··-·-·-·-· Mort or W IC • 0.4-B
~O -I 10 O 10 1 10 2
o. -- Paste WIC • 0.3 l!I ------·-· Posto WIC • 0.4 z ---- Paste WIC • 0.5
C!I ---- Mortar WIC • 0.5-A • ---- Mortar WIC • 0.5-B
Microstrain/sec
Fig. 5 - Strain at the peak stress versus strain rate (i::50-wJ for cement paste and mortar with wlc = 0.3, 0.4, and 0.5
cific aspects of the response of the materials as a function of strain rate are discussed next.
Peak stress Fig. 4 shows the normalized peak stress of each ma
terial as a function of strain rate €50-99 and represents all specimens summarized in Table 1. The peak stresses are normalized by dividing the average peak stress at each strain rate by the average peak stress obtained at 3 mi-
ACI Materials Journal I September-October 1990

Table 1(d) - Summary of strain-rate tests Strain Strain Strain rate rate rate No. of Maximum
(0.lOOOJo) (5-200Jo) (50-99%) samples stress, e, E, µe/sec,* µe/sec,• µe/sec,* (No. of psi, µe, psi x 10' ,,j, average average average samples average average average verage
(SD)1 (SD)1 (SD)1 for v,) (SD)1 (SD)1 (SD)1 (SD)'
Mortar A, w/c = 0.5, sic = 2.28
0.31 0.30 0.31 3 5379 3503 3.490 t (0) (65) (434) (0.184)
3.01 2.98 3.01 12 5582 2827 4.024 0.190 (0.02) (0.09) (0.03) (2) (279) (185) (0.163) (0.004)
30.4 30.1 30.5 3 6407 2908 4.147 0.210 (0.08) (0.24) (0.08) (2) (122) (108) (0.103) (0.031)
307 293 305 3 7090 2948 4.561 0.218 (0.81) (l) (1.63) (2) (70) (46) (0.055) (0.031)
3089 4211 3017 12 7434 2907 4.584 0.227 (28) (259) (22) (2) (270) (180) (0.149) (0.004)
34,645 27,487 34,071 3 8824 3135 5.050 0.248 (210) (775) (297) (2) (266) (125) (0.161) (0.0)
21,9728 97,292 438,418 12 9391 2839 5.451 t (15,162) (6318) (29,980) (0) (585) (156) (0.177)
Mortar B, wlc = 0.5, sic = l.29
0.30 0.31 (0) (0.1)
3.03 2.96 (0.01) (0.03)
30.3 29.8 (0) (0)
304 298 (0.5) (5)
3078 3580 (5) (41)
32,637 34,218 (1081) (582)
293,825 137,452 (8464) (8165)
• Microstrains/ sec. 1Standard deviation. IData not obtained.
0.30 2 (0) (0)
3.03 5 (0.01) (4)
30.3 2 (0.1) (1)
302 2 (0.5) (2)
3038 2 (24) (2)
30,982 2 (1037) (2)
532,744 2 (3105) (2)
crostrains/sec. Fig. 4 indicates that with every order of magnitude increase in strain rate, the strength of saturated cement paste and mortar increases about 15 percent. This nearly linear increase in strength with each order of magnitude increase in strain rate does not appear to be a function of the type of material (paste or mortar) or the water-cement ratio, although the two highest strength pastes show the greatest increase in strength at the highest strain rate (it is not clear whether this is a true trend or just statistical scatter).
The fact that the effects of strain rate on strength are virtually the same for the materials tested indicates that the mechanisms that control the rate-sensitive behavior of these materials are quite similar.
Strain at peak stress Fig. 5 shows the variation in the average strain at the
peak stress eP, as a function of strain rate (Eso.99) for cement paste and mortar. For both materials, the nonmonotonic variation in eP is clearly shown in Fig. 5. Ep
first decreases and then increases with increasing strain rate. In each case, the slowest test rate (test duration = 12 hr) results in the highest value of eP, due to the effect of creep. As the strain rate increases, the creep ef-
ACI Materials Journal I September-October 1990
5712 4284 3.020 t (49) (0) (0.258)
6240 3745 3.500 0.199 (140) (200) (0.111) (0.019)
6626 3626 3.690 0.224 (54) (27) (0.031) (0.0)
7297 3637 3.923 0.231 (12) (115) 0.121 (0.051)
7908 3680 3.952 0.232 (80) (39) (0.110) (0.008)
8273 3900 3.714 0.251 (136) (31) (0.200) (0.023)
10,040 3699 4.891 0.267 (330) (33) (0.181) (0.006)
fects decrease and ep decreases accordingly. With a further increase in strain rate, Ep once again increases. This increase in Ep is likely the result of limitations in crack velocity compared to the rate of loading.
Initial modulus of elasticity In this study, the initial modulus of elasticity E; is
taken as the slope of the best fit line through the stressstrain curve between 5 and 20 percent of the peak stress. This range is selected to remove the initial seating errors as a specimen is loaded, to allow a range wide enough to limit the effects of scatter, and to keep the upper limit at a value where the response is virtually linear (i.e., not significantly effected by microcracking). Like the peak stress, normalized values of E; are obtained by dividing the values at various strain rates by the value at 3 microstrains/sec. Fig. 6 shows the change in the normalized values of E; of each material as a function of strain rate €5_20 • As with strength, E; increases approximately linearly with each order of magnitude increase in strain rate. However, the increase is only about half of the corresponding percentage increase in strength. The lower rate sensitivity of E; compared to strength is consistent with similar obser-
513

1.50 .----------------------,
1.25
1.00
0.7~0 -I
t. -- Paste W/C • 0.3 l!I ··-·-·-·-· Paste W/C • 0.4 e z ---- Paste W/C • 0.5
10 °
" -- Mortar W/C • 0.3 • ··-·-·-·-· Mortar W/C = 0.4-A • ··-·-·-·-· Mortar W/C = 0.4-8 <!> ---- Mortar W/C • 0.5-A • ---- Mortar W/C - 0.5-B
Microstroin/sec
Fig. 6 - Normalized initial modulus of elasticity versus strain rate (E.5_2a) for cement paste and mortar with w/c = 0.3, 0.4, and 0.5
vations in studies of concrete. 11•19 For both cement paste and mortar, E; increases by about 7 percent for each order of magnitude increase in strain rate as the strain rate €5_20 increases from 0.3 microstrain/sec to about 150,000 microstrains/sec.
Initial Poisson's ratio Fig. 7 illustrates the variation in the average initial
Poisson's ratios of the pastes and mortars as a function of strain rate (€5_20). The initial Poisson's ratio µ; illustrated here is calculated at 20 percent of the strength. The data points shown represent the average values listed in Table 1. The values fall within a relatively narrow range, with µ; being, on the average, somewhat lower for mortar than for cement paste. For example, at €5_20 of 3, 3000, and 150,000 microstrains/sec,. the ranges in µ; are 0.199 to 0.234, 0.227 to 0.270, and 0.262 to 0.281, respectively. The strain-rate sensitivity of the initial Poisson's ratio is about the same as that of the initial modulus of elasticity, abC''\t 7 percent for each order magnitude increase in strain ite.
The magnitude of the increase in µ; is consistent with the observations of Dhir and Sangha2 for concrete. Strain-rate sensitivity of the Poisson's ratio at higher strain levels is discussed in Reference 24.
While the rate sensitivity of stress-strain response near failure can be related to the initiation and growth of cracks,24•29-31 the same cannot be said for the rate sensitivity of the initial moduli E; and µ;. Very little cracking occurs at the strain levels at which E; and µ; are calculated, 32-34 yet these parameters are significantly rate sensitive, indicating that another mechanism, in all likelihood moisture movement, plays an important role in the initial response of the materials. The importance of moisture movement in controlling material stiffness at low stresses is discussed in detail in Reference 24.
The sensitivity of E; and µ; to strain rate also points out that these properties are not in themselves basic properties of the materials, but rather that they depend on other material characteristics, such as porosity and degree of saturation, which control stress-strain behavior. 24
514
0.30 .----------------------,
> 0.25
! .~
a ~ 0.20
0.1~0 -I
Microstrain/sec
Fig. 7 - Initial Poisson's ratio versus strain rate (f.5_2a) for cement paste and mortar with w/c = 0.3, 0.4, and 0.5
Effect of sand content Sand increases the initial modulus of elasticity and
reduces the strength and ductility of mortar in comparison to cement paste. As discussed by Attiogbe and Darwin,32 sand acts as a stress raiser, thus increasing the local compressive and lateral tensile stresses within the material. The increase in local stresses reduces both the strength and the strain capacity of the composite materials compared to paste. As Table 1 shows, the strain at the peak stress Ep is lower for mortar than for cement paste with the same water-cement ratio. Also, between the two mortars at a given water-cement ratio, the mortar with the higher sand-cement ratio has the lower Er The addition of relatively stiffer sand particles to cement paste increases the initial stiffness. Thus, mortars have higher initial elastic moduli than pastes with the same water-cement ratio. At a given water-cement ratio, the mortar with the higher sand content (Mortar B for w/c = 0.4 and Mortar A for w!c = 0.5) has a higher initial elastic modulus than the mortar with the lower sand content.
The effects of strain rate on the strength and initial elastic moduli of both cement paste and mortar appear to be about the same, indicating that the controlling mechanisms are not greatly affected by either the water-cement ratio or sand content.
The comparisons of the previous sections show that the rate sensitivities of the stress-strain behavior near failure, the initial modulus of elasticity, and the initial Poisson's ratio do not change with strength. Thus the results differ from previous observations for concrete in which weaker concrete was observed to be more rate sensitive than stronger concrete.3•8•16•22•31 •35
The key reason for the conflict is that the earlier studies that cite the greater relative strength enhancement of lower strength concrete with increasing loading rate were performed under stress control or at "constant loading head speed" rather than strain control. In either case, the strain rate will increase more near the peak stress for weaker concretes than for stronger concretes. Thus the weaker materials were really subjected to a higher strain rate and should be exp~cted to show more strength enhancement than stronger materials.
ACI Materials Journal I September-October 1990
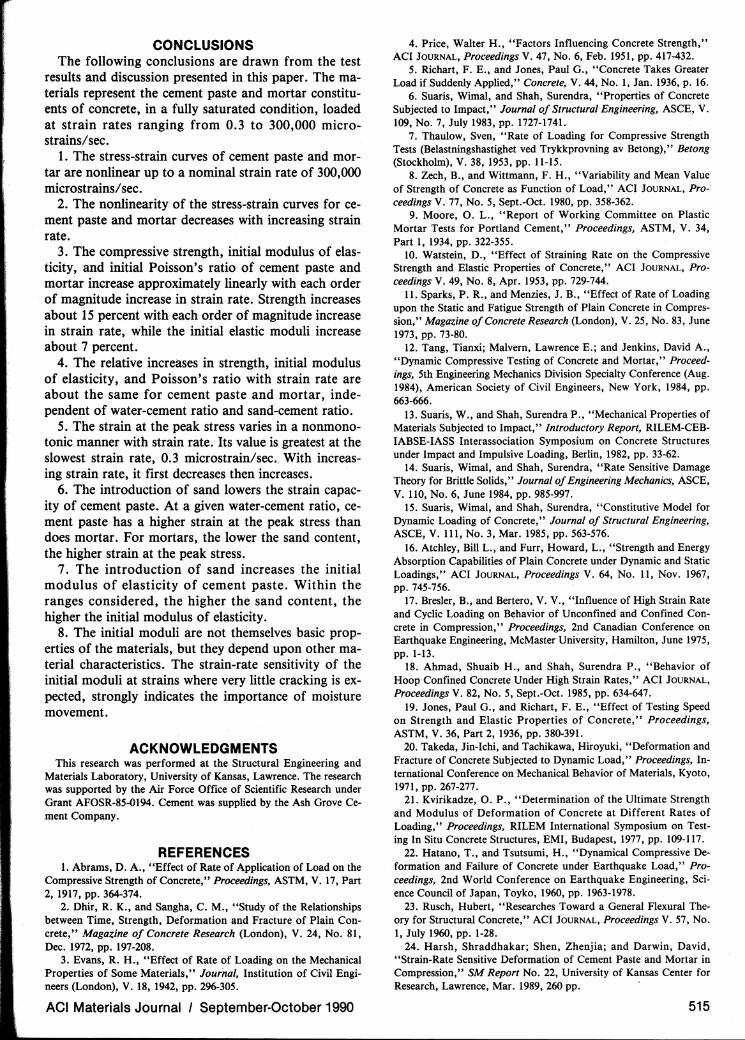
CONCLUSIONS The following conclusions are drawn from the test
results and discussion presented in this paper. The materials represent the cement paste and mortar constituents of concrete, in a fully saturated condition, loaded at strain rates ranging from 0.3 to 300,000 microstrains/ sec.
1. The stress-strain curves of cement paste and mortar are nonlinear up to a nominal strain rate of 300,000 microstrains/ sec.
2. The nonlinearity of the stress-strain curves for cement paste and mortar decreases with increasing strain rate.
3. The compressive strength, initial modulus of elasticity, and initial Poisson's ratio of cement paste and mortar increase approximately linearly with each order of magnitude increase in strain rate. Strength increases about 15 percent with each order of magnitude increase in strain rate, while the initial elastic moduli increase about 7 percent.
4. The relative increases in strength, initial modulus of elasticity, and Poisson's ratio with strain rate are about the same for cement paste and mortar, independent of water-cement ratio and sand-cement ratio.
5. The strain at the peak stress varies.in a nonmonotonic manner with strain rate. Its value is greatest at the slowest strain rate, 0.3 microstrain/sec .. With increasing strain rate, it first decreases then increases.
6. The introduction of sand lowers the strain capacity of cement paste. At a given water-cement ratio, cement paste has a higher strain at the peak stress than does mortar. For mortars, the lower the sand content, the higher strain at the peak stress.
7. The introduction of sand increases the initial modulus of elasticity of cement paste. Within the ranges considered, the higher the sand content, the higher the initial modulus of elasticity.
8. The initial moduli are not themselves basic properties of the materials, but they depend upon other material characteristics. The strain-rate sensitivity of the initial moduli at strains where very little cracking is expected, strongly indicates the importance of moisture movement.
ACKNOWLEDGMENTS This research was performed at the Structural Engineering and
Materials Laboratory, University of Kansas, Lawrence. The research was supported by the Air Force Office of Scientific Research under Grant AFOSR-85-0194. Cement was supplied by the Ash Grove Cement Company.
REFERENCES 1. Abrams, D. A., "Effect of Rate of Application of Load on the
Compressive Strength of Concrete," Proceedings, ASTM, V. 17, Part 2, 1917, pp. 364-374.
2. Dhir, R. K., and Sangha, C. M., "Study of the Relationships between Time, Strength, Deformation and Fracture of Plain Concrete," Magazine of Concrete Research (London), V. 24, No. 81, Dec. 1972, pp. 197-208.
3. Evans, R.H., "Effect of Rate of Loading on the Mechanical Properties of Some Materials," Journal, Institution of Civil Engineers (London), V. 18, 1942, pp. 296-305.
ACI Materials Journal I September-October 1990
4. Price, Walter H., "Factors Influencing Concrete Strength," ACI JOURNAL, Proceedings V. 47, No. 6, Feb. 1951, pp. 417-432.
5. Richart, F. E., and Jones, Paul G., "Concrete Takes Greater Load if Suddenly Applied," Concrete, V. 44, No. 1, Jan. 1936, p. 16.
6. Suaris, Wimal, and Shah, Surendra, "Properties of Concrete Subjected to Impact,'' Journal of Structural Engineering, ASCE, V. 109, No. 7, July 1983, pp. 1727-1741.
7. Thaulow, Sven, "Rate of Loading for Compressive Strength Tests (Belastningshastighet ved Trykkprovning av Betong)," Betong (Stockholm), V. 38, 1953, pp. 11-15.
8. Zech, B., and Wittmann, F. H., "Variability and Mean Value of Strength of Concrete as Function of Load," ACI JOURNAL, Proceedings V. 77, No. 5, Sept.-Oct. 1980, pp. 358-362.
9. Moore, 0. L., "Report of Working Committee on Plastic Mortar Tests for Portland Cement," Proceedings, ASTM, V. 34, Part l, 1934, pp. 322-355.
10. Watstein, D., "Effect of Straining Rate on the Compressive Strength and Elastic Properties of Concrete," ACI JOURNAL, Proceedings V. 49, No. 8, Apr. 1953, pp. 729-744.
11. Sparks, P. R., and Menzies, J. B., "Effect of Rate of Loading upon the Static and Fatigue Strength of Plain Concrete in Compression," Magazine of Concrete Research (London), V. 25, No. 83, June 1973, pp. 73-80.
12. Tang, Tianxi; Malvern, Lawrence E.; and Jenkins, David A., "Dynamic Compressive Testing of Concrete and Mortar," Proceedings, 5th Engineering Mechanics Division Specialty Conference (Aug. 1984), American Society of Civil Engineers, New York, 1984, pp. 663-666.
13. Suaris, W., and Shah, Surendra P., "Mechanical Properties of Materials Subjected to Impact," Introductory Report, RILEM-CEBIABSE-IASS Interassociation Symposium on Concrete Structures under Impact and Impulsive Loading, Berlin, 1982, pp. 33-62.
14. Suaris, Wimal, and Shah, Surendra, "Rate Sensitive Damage Theory for Brittle Solids," Journal of Engineering Mechanics, ASCE, V. 110, No. 6, June 1984, pp. 985-997.
15. Suaris, Wimal, and Shah, Surendra, "Constitutive Model for Dynamic Loading of Concrete," Journal of Structural Engineering, ASCE, V. 111, No. 3, Mar. 1985, pp. 563-576.
16. Atchley, Bill L., and Furr, Howard, L., "Strength and Energy Absorption Capabilities of Plain Concrete under Dynamic and Static Loadings," ACI JOURNAL, Proceedings V. 64, No. 11, Nov. 1967, pp. 745-756.
17. Bresler, B., and Bertero, V. V., "Influence of High Strain Rate and Cyclic Loading on Behavior of Unconfined and Confined Concrete in Compression," Proceedings, 2nd Canadian Conference on Earthquake Engineering, McMaster University, Hamilton, June 1975, pp. 1-13.
18. Ahmad, Shuaib H., and Shah, Surendra P., "Behavior of Hoop Confined Concrete Under High Strain Rates," ACI JOURNAL, Proceedings V. 82, No. 5, Sept.-Oct. 1985, pp. 634-647.
19. Jones, Paul G., and Richart, F. E., "Effect of Testing Speed on Strength and Elastic Properties of Concrete," Proceedings, ASTM, V. 36, Part 2, 1936, pp. 380-391.
20. Takeda, Jin-lchi, and Tachikawa, Hiroyuki, "Deformation and Fracture of Concrete Subjected to Dynamic Load," Proceedings, International Conference on Mechanical Behavior of Materials, Kyoto, 1971, pp. 267-277.
21. Kvirikadze, 0. P., "Determination of the Ultimate Strength and Modulus of Deformation of Concrete at Different Rates of Loading," Proceedings, RILEM International Symposium on Testing In Situ Concrete Structures, EMI, Budapest, 1977, pp. 109-1.17.
22. Hatano, T., and Tsutsumi, H., "Dynamical Compressive Deformation and Failure of Concrete under Earthquake Load," Proceedings, 2nd World Conference on Earthquake Engineering, Science Council of Japan, Toyko, 1960, pp. 1963-1978.
23. Rusch, Hubert, "Researches Toward a General Flexural Theory for Structural Concrete," ACI JOURNAL, Proceedings V. 57, No. 1, July 1960, pp. 1-28.
24. Harsh, Shraddhakar; Shen, Zhenjia; and Darwin, David, "Strain-Rate Sensitive Deformation of Cement Paste and Mortar in Compression," SM Report No. 22, University of Kansas Center for Research, Lawrence, Mar. 1989, 260 pp. ·
515

25. "Standard Practice for Mechanical Mixing of Hydraulic Cement Pastes and Mortars of Plastic Consistency,'' (ASTM C 305-82) (Reapproved 1987), 1988 Annual Book of ASTM Standards, V. 04.01, ASTM, Philadelphia, pp. 197-199.
26. Struck, W., and Voggenreiter, W., "Examples of Impact and Impulsive Loading in the Field of Civil Engineering," Materials and Structures, Research and Testing (RILEM, Paris), V. 8, No. 44, Sept. 1975, pp. 81-87.
27. Bicanic, N., and Zienkiewicz, 0. C., "Constitutive Model for Concrete Under Dynamic Loading," Earthquake Engineering and Structural Dynamics (Chichester), V. 11, No. 5, Sept.-Oct. 1983, pp. 689-710.
28. Kawamato, Toshikazu, and Saito, Toshiaki, "Behavior of Rock-Life Materials in Some Controlled Strain States," Proceedings, Congress of the International Society for Rock Mechanics, Denver, Sept. 1974, pp. 161-166.
29. Wittmann, F. H., "Mechanism and Mechanics of Fracture of Concrete," Proceedings, 5th International Conference on Fracture, Cannes, 1981, pp. 1467-1487.
30. Zielinski, A. J., and Reinhardt, H. W., "Stress-Strain Behav-
516
iour of Concrete and Mortar at High Rates of Tensile Loading,'' Cement and Concrete Research, V. 12, No. 3, May 1982, pp. 309-319.
31. Zielinski, A. J.; Reinhardt, H. W.; and Kormeling, H. A., "Experiments on Concrete undre Uniaxial Tensile Loading," Materials and Structures, Research and Testing (RILEM, Paris), V. 14, No. 80, Mar.-Apr. 1981, pp. 103-112.
32. Attiogbe, Emmanuel K., and Darwin, David, "Submicroscopic Cracking of Cement Paste and Mortar in Compression," SM Report No. 16, University of Kansas Center for Research, Lawrence, Nov. 1985, 439 pp.
33. Attiogbe, Emmanuel K., and Darwin, David, "Submicrocracking in Cement Paste and Mortar," ACJ Materials Journal, V. 84, No. 6, Nov.-Dec. 1987, pp. 491-500.
34. Attiogbe, Emmanuel K., and Darwin, David, "Strain Due to Submicrocracking in Cement Paste and Mortar," ACJ Materials Journal, V. 85, No. 1, Jan.-Feb. 1988, pp. 3-11.
35. Carrasquillo, Ramon L.; Nilson, Arthur H.; and Slate, Floyd 0., "Properties of High Strength Concrete Subject to Short-Term Loads," ACI JOURNAL, Proceedings V. 78, No. 3, May-June 1981, pp. 171-178.
ACI Materials Journal I September-October 1990


![Genomic Sequence of Bacteriophage ATCC 8074-B1 and ... · Propagationandsequencingof8074-B1. 8074-B1(alsoknownas F1 [6]) was propagated on sensitive strain C. sporogenes ATCC 17786](https://static.fdocuments.net/doc/165x107/6044c91da78c315167768bda/genomic-sequence-of-bacteriophage-atcc-8074-b1-and-propagationandsequencingof8074-b1.jpg)