Spying on the Mystery Shopper - Universiteit Twenteessay.utwente.nl/65019/1/Render Dorothee -s...
75
Spying on the Mystery Shopper ‘A Study of the Reliability Concerns with Respect to the Method’ Master Thesis Corporate Communication Studies Student: Dorothee Render Student number: s1258249 Supervisors: Dr. J. F. Gosselt Dr. J. J. van Hoof
Transcript of Spying on the Mystery Shopper - Universiteit Twenteessay.utwente.nl/65019/1/Render Dorothee -s...
Spying on the Mystery Shopper
‘A Study of the Reliability Concerns with Respect to the Method’
Master Thesis
Corporate Communication Studies
Student: Dorothee Render
Student number: s1258249
Supervisors:
Dr. J. F. Gosselt
Dr. J. J. van Hoof
2 |
Table of Contents
ABSTRACT ........................................................................................................................................................ 4
1. INTRODUCTION ....................................................................................................................................... 7
2. THEORETICAL BACKGROUND ................................................................................................................ 10
2.1. MYSTERY SHOPPING ................................................................................................................................ 10
2.2. HALO EFFECT ......................................................................................................................................... 12
2.3. SERVICE QUALITY MEASUREMENT .............................................................................................................. 13
2.4. THE INTERDEPENDENCIES OF SERVICE LEVELS ............................................................................................... 18
2.5. THE RESEARCH MODEL ............................................................................................................................ 21
3. METHOD ............................................................................................................................................... 23
3.1. PRETEST 1 – COMPOSING THE LEVELS ......................................................................................................... 23
3.2. PRETEST 2 – MANIPULATIONS LEVEL 1 & LEVEL 2 .................................................................................. 25
3.3. MANIPULATIONS .................................................................................................................................... 26
3.4. PROCEDURE ........................................................................................................................................... 28
3.5. DESIGN ................................................................................................................................................. 29
3.6. INSTRUMENT .......................................................................................................................................... 30
3.7. MYSTERY SHOPPERS ................................................................................................................................ 31
4. RESULTS ................................................................................................................................................ 35
4.1. ACCURACY OF MEASURING FACTS LEVEL 1 ................................................................................................... 35
4.2. INFLUENCES OF LEVEL 1............................................................................................................................ 37
4.3. ACCURACY OF MEASURING FACTS LEVEL 2 ................................................................................................... 38
4.4. INFLUENCES OF LEVEL 2............................................................................................................................ 39
4.5. COMPOSITION OF LEVEL 4 ........................................................................................................................ 40
4.6. SUMMARY RESULTS ................................................................................................................................. 43
5. DISCUSSION .......................................................................................................................................... 45
5.1. ABSENCE OF THE HALO EFFECT IN SERVICE EVALUATIONS ............................................................................... 45
5.2. COMPOSITION OF THE OVERALL SERVICE QUALITY ......................................................................................... 46
5.3. ACCURACY OF MYSTERY SHOPPERS WHEN MEASURING FACTS ......................................................................... 47
5.4. MANAGERIAL IMPLICATIONS ..................................................................................................................... 48
5.5. LIMITATIONS .......................................................................................................................................... 48
5.6. SUGGESTIONS FOR FUTURE RESEARCH ........................................................................................................ 49
5.7. CONCLUSIONS ........................................................................................................................................ 51
5.8. ACKNOWLEDGEMENTS ............................................................................................................................. 52
3 |
BIBLIOGRAPHY ............................................................................................................................................... 53
APPENDIX A: USED SERVICE QUALITY SCALES. ............................................................................................... 59
APPENDIX B: PRETEST 2 – MANIPULATION CHECK ......................................................................................... 62
APPENDIX C: RESEARCH BOOKLET .................................................................................................................. 63
APPENDIX D: ITEM SELECTION ....................................................................................................................... 70
APPENDIX E: DATA SET ................................................................................................................................... 75
4 |
ABS TR AC T
Aim. Based on literature regarding service quality measurement, service quality has
been classified into four distinctive levels: the physical environment, the employee, policies
& proficiencies and the overall service quality evaluation. Level 1 includes attributes
regarding physical aspects around and in the store, Level 2 refers to the employee behavior
and the employee‐customer interaction, Level 3 consists of policies and proficiencies and
Level 4 is the combining level for an overall impression of the service quality based on Level
1, 2 and 3. A known phenomenon from psychology is the Halo Effect which states that
individuals do not evaluate single object attributes, but tend to evaluate them as a whole in
order to maintain cognitive consistency. The aim of this study was to approach the question
whether this effect applies in case of mystery shopping evaluations. Therefore hypotheses
regarding the possible effects of Level 1 on other levels, Level 2 on other levels and the
composition of Level 4 have been developed and tested.
Method. In order to test whether the Halo Effect has consequences for the reliability
of mystery shopping, a 2 (Level 1) x 2 (Level 2) experiment was performed in a Dutch
supermarket. Sixty four mystery shoppers were instructed to perform a mystery shopping
visit and were not aware of the fact that their behavior was actually the object of
investigation. Due to the fact that the Levels 1 and 2 have repeatedly been found to be
important dimensions in the evaluation of service quality, they were chosen as variables to
be manipulated.
Results. A SPSS analysis of the data revealed that Level 1 had no significant effect on
any of the other service levels. Level 2 evaluations had a marginally significant effect on
Level 3, while no significant effects on Level 1 could be found. Furthermore it has been
proven that the overall service evaluation is based on the other three service levels, with
Level 2 as strongest predictor.
5 |
Discussion. Based on the results, it can be stated that mystery shoppings’ reliability
is not undermined by the Halo Effect, due to the fact that mystery shoppers are able to
evaluate Level 1 and Level 2 independently, despite the fact that the Halo Effect suggests
otherwise. Finally some valuable suggestions for further research, focusing on the pressing
questions on the reliability of mystery shopping are made.
Keywords: Mystery shopping, Halo Effect, Service Quality Measurement, Reliability.

6 |
Chapter 1
‘Introduction’
7 |
1. Introduction
In the last three decades measuring service quality has been named one of the biggest
obstacles in marketing literature (Martínez & Martínez, 2010; Urban, 2013; Ihtiyar & Ahmad,
2012). Due to the fact that services are produced, delivered and consumed at the same time
a quality check of the service prior to the delivery is impossible (Strawderman & Koubek,
2008; Beck & Miao, 2003). A traditional research technique to elaborate service quality is the
use of customer surveys. However those are restricted to the measurement of customers’
opinions about the outcome of a service delivery. Therefore, in order to measure whether
predefined service standards have been met during the service process, the use of mystery
shopping has become common practice. According to the Mystery Shopping Providers
Association (MSPA) the current value of the mystery shopping industry is 1.5 billion dollar
worldwide (MSPA, 2014). The most typical characteristic of the method is that the service
providers do not know they are being evaluated. Trained mystery shoppers pretend to be
regular customers and engage in the service delivery process as a participant or client, in
order to report about their observations of predetermined service attributes in detail (Finn
& Kayandé, 1999; Wilson, 2001).
Strikingly, there are only a few academic attempts to test the reliability of the method,
despite the extensive use of mystery shopping (Steinman, 2014; Wilson, 2001). Mystery
shopping aims at discovering the quality of different levels of service, as for example the
quality of the physical environment or the quality of the employee‐customer interaction.
Therefore mystery shopping enables service providers to evaluate service levels individually
and to find bottlenecks within their service delivery (Wilson, 2001). Within the method of
mystery shopping, persons are being used as measurement instruments. The use of persons
as a measurement instrument is the major weakness of the method and threatens its’
8 |
reliability (Calvert, 2005; Morrison, Colman, & Preston, 1997).
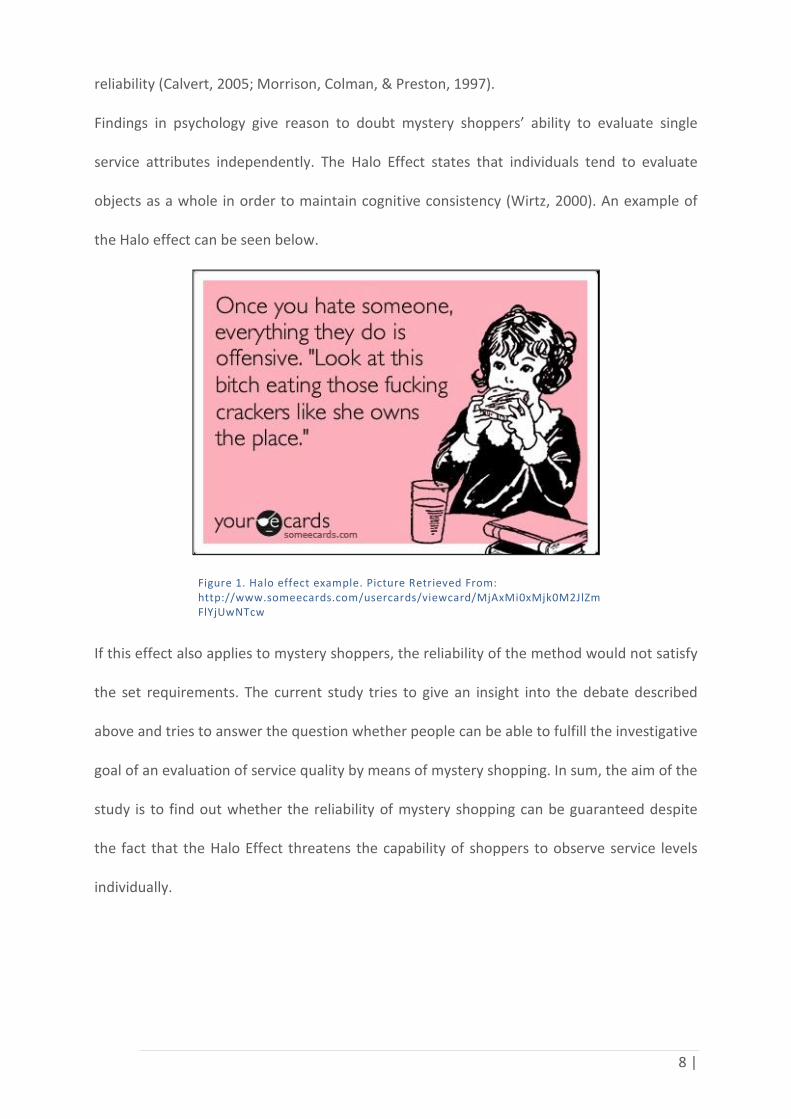
Findings in psychology give reason to doubt mystery shoppers’ ability to evaluate single
service attributes independently. The Halo Effect states that individuals tend to evaluate
objects as a whole in order to maintain cognitive consistency (Wirtz, 2000). An example of
the Halo effect can be seen below.
Figure 1. Halo effect example. Picture Retrieved From: http://www.someecards.com/usercards/viewcard/MjAxMi0xMjk0M2JlZmFlYjUwNTcw
If this effect also applies to mystery shoppers, the reliability of the method would not satisfy
the set requirements. The current study tries to give an insight into the debate described
above and tries to answer the question whether people can be able to fulfill the investigative
goal of an evaluation of service quality by means of mystery shopping. In sum, the aim of the
study is to find out whether the reliability of mystery shopping can be guaranteed despite
the fact that the Halo Effect threatens the capability of shoppers to observe service levels
individually.

9 |
Chapter 2
‘Theoretical Background’
10 |
2. Theoretical Background
In the following chapter, the literature the study was based on will be discussed. First,
literature about mystery shopping will be presented and it will be outlined in how far it
constitutes a reliable research method. In a second step the Halo Effect will be discussed
which is used as one of the most important tools for criticism of the method and it will be
elaborated on its possible effects on the reliability of mystery shopping. In a third step the
literature on service quality measurement will be discussed and four generalized service
levels will be introduced. In a final step these three approaches will be combined and it will
be shown how the research hypotheses have been developed.
2.1. MYSTE RY SHO PPIN G
Traditionally customer surveys or customer complaints were used to measure employee
performance, but those are not able to give detailed information about whether
predetermined service standards have been met (Wilson, 2001). Furthermore the majority
of unsatisfied customers simply do not return instead of expressing their dissatisfaction. A
study of TARP (Technical Assistance Research Program) revealed that 26 out of 27 customers
of low prized goods chose not to buy again in the specific branch rather than to complain
(Hesselink & van der Wiele, 2003). This clearly reveals the need for an additional method for
retailers and service providers to measure their service processes. A common alternative for
testing service quality is mystery shopping. Mystery shopping is a qualitative research
technique and was developed out of the Participant Observation Technique (Wilson, 2001;
Wilson, 1998). It can be used in the retail sector as well as in the service sector in order to
accomplish multiple research purposes, such as identifying failings or weak points during
service delivery, motivate personnel or assess the service level of the competition (Wilson,
2001). The most typical characteristic of this technique is that the data subjects are not
11 |
aware of their participation in the study (ESOMAR, 2005). The observer pretends to be a
regular customer and reports in detail about the gained service and the store environment
by filling in a questionnaire afterwards (Finn & Kayandé, 1999; Wilson, 2001). The mystery
shopping method offers several advantages in measuring service quality compared with the
traditional customer surveys: (1) Mystery shopping measures the process rather than the
outcome of a service experience (Wilson, 2001); (2) Mystery shopping measures whether
procedures are followed rather than gathering opinions about the quality of those
procedures (Wilson, 2001); (3) Mystery shopping measures facts instead of perceptions of
different customers (Wilson, 2001); (4) Mystery shopping allows the evaluation of whole
branches, rather than just one service facility (Finn & Kayandé, 1999); (5) Mystery shopping
allows the evaluation of objective, single service encounters, while customer surveys are not
able to isolate single encounters and are rather biased by multiple previous service
encounters (Lowndes & Dawes, 2001).
However, apart from the advantages, it can be argued that several concerns regarding the
reliability of mystery shopping remain. The most important threat concerns the
measurement instrument (Morrison, Colman, & Preston, 1997). Due to the fact that the
used measurement instrument is a person, the reliability of the method depends on this
person. The observations made by the mystery shopper should be identical with reality in
order to gain reliable data (Schwartz & Schwartz, 1955). The purenesses of these
observations are threatened by several cognitive factors and are a major area of weakness
according to Calvert (2005). Summarizing these statements it can be said that the reliability
of mystery shopping may only be guaranteed if the observations of the mystery shoppers
reflect reality.
Despite these concerns and the rise of mystery shopping, very few academic attempts to
test its value have been pursued (Latham, Ford, & Tzabbar, 2012; Wilson, 2001). Therefore a
12 |
thorough investigation of the reliability and thus the value of mystery shopping outcomes is
long overdue. One possible reliability threat concerns perception influences between
different service attributes. Assuming a mystery shopper evaluates the surroundings of a
store very negative due to the neglected state of the store, this evaluation might bias his
perception of the sales persons in a negative way. In order to deepen possible effects of this
phenomenon the following part will outline the Halo effect, which may form a threat to the
assumption that mystery shoppers are able to deliver reliable data about service standards.
2.2. HAL O EFFEC T
The earliest theories about the Halo Effect go back to the 1920s where Thorndike first
defined the phenomenon. Thorndike developed the theory which states that individuals are
unable to evaluate specific attributes without the affective influence of general evaluations
(Beckwith & Lehmann, 1975; Nisbett & Wilson, 1977). The research however was mainly
focused on psychology, but was rapidly expanded to other research fields, such as
marketing. Consequences for the marketing research were that service evaluations were
threatened in their reliability due to the Halo Effect. Models with the aim to evaluate service
quality are commonly based on multi attribute levels (Wirtz & Bateson, 1995) and are
therefore likely to be affected by the Halo Effect. In this context the Halo Effect is defined as
a misrepresentation of attribute perceptions of consumers, due to the tendency to judge
attributes based on general and attribute‐specific impressions (Van Doorn, 2008; Wirtz,
2000; Wu & Petroshius, 1987). The misrepresentation is caused by the tendency to maintain
cognitive consistency (Holbrook, 1983). This means their positive or negative impression of
the whole service delivery process overshadows contradicting service level experiences. This
type of effect threatens the goal of service quality research, which aims at finding the
strengths and weaknesses within a service. Mystery shopping, as other service quality
13 |
measurement methods, detect attribute evaluations which are possibly inaccurate due to
the Halo Effect (Van Doorn, 2008). In marketing literature two types of Halo Effects have
been researched (Wirtz, 2000). The first type states that the evaluation of service attributes
may be affected by the customers’ affection towards the brand and the second type asserts
that service attributes individually affect the evaluation of other service attributes in either a
positive or a negative way (Wirtz, 2000; Wirtz & Bateson, 1995). Empirical evidence for both
effects have been found (Singh, 1991; Nisbett & Wilson, 1977; Wirtz & Bateson, 1995;
Gómez, McLaughlin, & Wittink, 2004). In sum, the first type of the Halo Effect states that
corporate image may affect the evaluation of service quality while type II states that single
attributes may be affected mutually, as for example a very dirty store may shed a negative
light on the service personnel. The current study focuses on the Halo II type and thus on the
dependencies of single service attributes.
In closing it may be assumed that the Halo Effect is a serious threat to the reliability of
mystery shopping, as the reliability of mystery shopping may only be guaranteed if the
observations of the mystery shoppers reflect reality. Therefore the current study will aim at
answering the question whether mystery shoppers can be assumed capable of observing
service levels independent of each other. In the following part, service quality measurement
will be discussed and the generalized four underlying levels of service quality will be
introduced.
2.3. SER VI CE QUALI TY ME AS UREMEN T
Service quality is the achievement of meeting customers’ needs, wants and expectations
(Strawderman & Koubek, 2008). Measuring service quality has been one of the biggest
obstacles in marketing literature within the last three decades (Martínez & Martínez, 2010;
Urban, 2013; Ihtiyar & Ahmad, 2012). Service quality is immaterial and therefore hard to
14 |
measure. Since services are produced, delivered and consumed at the same time, a quality
check previous to the service delivery is impossible (Beck & Miao, 2003; Strawderman &
Koubek, 2008). A common method to measure service quality is the use of after sales
customer surveys, which are based on service quality models. A large amount of attention
has been devoted to the development of standardized scales to measure service quality. An
extensive literature search on service quality models was conducted in order to define the
underlying levels of service quality perception and their measurement techniques. Based on
the models’ measurement technique, two groups can be distinguished. The first group is
based on the “disconfirmation paradigm” and the second group is based solely on the
perception of customers. The “disconfirmation paradigm” states that service quality can be
measured by finding the gap between expectations of service level and the perceived service
level (Brady & Cronin, 2001). The second group of models is based on “perception only”
scores. Carillat, Jaramillo and Mulki (2007) state that perception based scores are already
based on the comparison of expected and actual service, which means that respondents
base their perception scores on their expectations. By measuring both, the expectation and
the perception scores, the expectation would be measured twice. Therefore measuring
expectations using separate items is superfluous. Within the last decades several authors
found that the “perception only” measurement scale is to be preferred rather than the
“disconfirmation paradigm” measurement scale in order to avoid redundancy and to achieve
more reliable and valid results (Carrillat, Jaramillo, & Mulki, 2007; Cronin & Taylor, 1992).
Concerning the underlying levels of service quality, a lack of consensus between authors still
exists. All models share the belief of a multidimensional conceptualization of service quality.
Nevertheless authors disagree on the grouping of underlying dimensions. Therefore the
current study aimed at setting up a generalized conceptualization of service quality levels
from the existing amount of literature. The first step was to search the marketing literature
15 |
for predefined underlying levels of service quality. The second step was the collection of
service quality models and their corresponding items. And the final step was to match the
collected items of the models with the definitions of service levels. Based on this, four
general levels have been defined which will be introduced in the following part. An overview
of all used scales and the corresponding items can be found in Appendix A.
Level 1 ‘Physical Environment’
Kotler first recognized the importance of tangibles as a marketing tool in 1973. The author
defined the construct called “atmospherics” as the conscious designing of a service setting
with the aim to evoke positive emotional effects in consumers (Rajic & Dado, 2013). The
work Bitner conducted in (1992) is similar to the work of Kotler (1973), in which the author
explained the term “servicescape” as the man‐made physical surrounding.
The research conducted on service quality scales revealed the following variables to
compose the physical environment: the store’s surroundings, the merchandise, the store’s
equipment, the comfort and the ambience (Brady & Cronin, 2001; Parasuraman, Zeithaml, &
Berry, 1988; Dabholkar, Thorpe, & Rentz, 1996; Vazquez, Rodriguez‐del Bosque, Diaz, & Ruiz,
2001; Sureshchandar, Rajendran, & Kamalanabhan, 2001). Those variables may underlie
several rating criteria, such as cleanliness, beauty, availability or quality. In other words, the
merchandise a store offers may for example be evaluated based on its quality or its
availability and the stores equipment may be evaluated on its cleanliness, its availability and
its beauty. Summarizing the first level, ‘physical environment’, includes all items which
concern either: the presence, the quality or the appearance of physical factors within and
around the store and the comfort those factors provide for the customers. It can be said that
Level 1, the ‘physical environment’, comprises the more consistent variables, since they are
less subject to change, although they are man‐made.
16 |
Level 2 ‘Employees’
In the literature the human aspect of service quality is indicated as the “humanic clue”.
Definitions include the behavior of service employees (including body language and tone of
voice) and their level of enthusiasm (Wall & Berry, 2007). Berry, Carbone and Haeckel (2002)
simply defined the humanic aspect of service quality as service attributes emitted by people.
The research on service quality scales revealed the following variables to compose Level 2:
the employee‐customer interaction is being evaluated on its quality regarding
communication patterns, complaints handling and provision of information and the
employee is being evaluated based on, for example, friendliness, expertise, attitude,
responsiveness and appearance (Brady & Cronin, 2001; Parasuraman, Zeithaml, & Berry,
1988; Dabholkar, Thorpe, & Rentz, 1996; Vazquez, Rodriguez‐del Bosque, Diaz, & Ruiz, 2001;
Sureshchandar, Rajendran, & Kamalanabhan, 2001). Summarizing the second level,
‘employees’, comprises items which are directly linked to the employee‐customer
interaction or the employees’ characteristics. Therefore it can be said that Level 2 is
malleable, but less constant than Level 1.
Level 3 ‘Policies & Proficiencies’
In the literature these variables are called credence or ambiguous attributes. Credence
attributes are attributes which are being evaluated by the customers without them having
the ability to gain sufficient information (Wirtz, 2000). In other words, customers are not
able to evaluate all attributes even after the service has been delivered, e.g. whether a retail
store is environmentally involved or not. Additionally there are ambiguous attributes, which
refer to attributes that may be evaluated in different ways based on different hypotheses
made by the customer (Wirtz, 2000). Those interpretations are normally seen as more
diagnostic then they are and therefore lead to rushed evaluations of the service quality.
17 |
Services have a high amount of credence and ambiguous attributes compared to goods
(Wirtz, 2000).
The research on service quality scales revealed the following variables to compose Level 3:
compliances, administration, corporate social responsibility and customer treatment (Brady
& Cronin, 2001; Parasuraman, Zeithaml, & Berry, 1988; Dabholkar, Thorpe, & Rentz, 1996;
Vazquez, Rodriguez‐del Bosque, Diaz, & Ruiz, 2001; Sureshchandar, Rajendran, &
Kamalanabhan, 2001). In the context of mystery shopping, respondents are only once
exposed to the service provider. Therefore they are not able to gather sufficient information
to evaluate the service providers’ policies properly. Evaluation of this category is thus often
based on assumptions, made on cues they encountered during their visit. A mystery
shopper, who encounters for instance a supermarket where the coffee is out of stock, will
easily make the assumption that the company must lack a good administration. This
assumption can be incorrect since the reason for the absent coffee could as well be a
problem of the producer, who had faced troubles with a shipment. Summarizing the third
level: ‘Policies and Proficiencies’ includes items concerning the handled policies of the
service provider and its proficiencies.
Level 4 ‘Overall Service Evaluation’
The fourth and last level is called ‘overall service evaluation’ and includes the overall feeling
about the service and the emotional outcomes the service evoked. The research on service
quality scales revealed the following variables to compose Level 4: feelings about, for
instance, atmosphere, design, level of service, cleanliness and the emotional outcomes the
service evoked, for instance convenience or the feeling of equal treatment (Brady & Cronin,
2001; Parasuraman, Zeithaml, & Berry, 1988; Dabholkar, Thorpe, & Rentz, 1996; Vazquez,
Rodriguez‐del Bosque, Diaz, & Ruiz, 2001; Sureshchandar, Rajendran, & Kamalanabhan,
2001). Basically, Level 4 is meant to be the outcome of the evaluations of Level 1, 2 and 3.
18 |
Based on the attribute evaluations of those levels the customer forms an overall perception
of the service level. In the following part the literature regarding mystery shopping, the Halo
Effect and service quality have been combined in order to develop the research hypotheses.
2.4. THE IN TE RDE PENDEN C IES OF SER VI CE LE VEL S
Based on the literature about service quality levels and the Halo Effect, several concerns
about the reliability of mystery shopping must be taken into consideration. Therefore the
possible interactions of each level, introduced in section 2.3, will be discussed in the
following part.
Level 1 ‘Physical Environment’
There is growing empirical support for the effect of the physical environment on service
quality evaluations of customers (Rajic & Dado, 2013). Kim and Moon (2009) researched
whether the physical environment has a positive effect on the overall perceived service
quality perception within a hospitality setting. They used after sales surveys in which, among
other constructs, the servicescape (facility aesthetics, layout, electric equipment, seating
comfort and ambient conditions) and the perceived service quality (performance,
expectations and normative evaluation) have been measured. The authors succeeded in
demonstrating that a better servicescape increases perceived service quality (Kim & Moon,
2009). A second study in the retail industry divided the servicescape into two different
constructs: design factors (color, displays, layout and organization of merchandise) and
ambient factors (music and lightning) (Baker, Grewal, & Parasuraman, 1994). In a 2 (ambient
factors) x2 (design factors) x2 (social factors) laboratory experiment they managed to prove
that ambient conditions increase perceived service quality (customer treatment, employees
and merchandise). However it has not been indicated that design factors increase service
quality. Even though it is well known that the physical environment impacts service quality
19 |
perception and consumer behavior, only little is known about how to explain, predict or
control those effects (Turley & Milliman, 2000). Finally research revealed that a very good
attribute specific performance, for instance beautiful interior or a high quality product may
cause a Halo Effect on other service levels (Wirtz, 2000). Credence and ambiguous attributes
can be assumed to be particularly influenced by this effect, due to the fact that individuals
search for arguments and hypotheses to evaluate those attributes. Thus any outstanding
performances in Level 1 are assumed to affect the evaluation of Level 3. The Halo Effect, as
earlier discussed, along with the above mentioned findings lead to the assumption that Level
1 attributes may affect other attributes of the service delivery as well as the overall
evaluation of the service quality. This effect may also be interactive for the reason that other
service attributes may cause an effect on Level 1 attributes. Based on this the following
hypotheses have been stated:
H1a: The evaluation of Level 1 impacts mystery shoppers’ evaluation of Level 2.
H1b: The evaluation of Level 1 impacts mystery shoppers’ evaluation of Level 3.
The assumed effect of Level 1 on Level 4 will be evaluated with Hypothesis H1c.
Level 2 ‘Employee’
As mentioned earlier the study by Baker, Grewal and Parasuraman (1994) also included the
effect of social factors (number of sales people, greeting by salesperson and salesperson
dress) on service quality as well as merchandise quality. The authors did find a significant
positive effect of social factors on merchandise quality and a marginally significant (p = 0.07)
positive effect of social factors on service quality (Baker, Grewal, & Parasuraman, 1994).
More recently an empirical study in the hospitality industry succeeded in demonstrating a
significant effect of employee behavior on the perception of service quality (Wall & Berry,
2007). The study enlightened that the humanic clues have a much larger effect size on the
perception of service quality than the physical environment (c.f. Hypothesis 4).
20 |
As discussed earlier, credence and ambiguous attributes are considered to be influenced the
most by other outstanding service attributes, therefore it can be assumed that also Level 2
will affect Level 3. The Halo Effect along with the above mentioned findings lead to the
assumption that Level 2 attributes may affect other attributes of the service delivery as well
as the overall evaluation of the service. This effect may also be interactive for the reason
that other service attributes may cause an effect on Level 2 attributes. Based on this the
following hypotheses have been stated:
H2a: The evaluation of Level 2 impacts mystery shoppers’ evaluation of Level 1.
H2b: The evaluation of Level 2 impacts mystery shoppers’ evaluation of Level 3.
The assumed effects of Level 2 on Level 4 will be evaluated with Hypothesis H2c and H4.
Overall Service Evaluation
Based on the findings about the three service levels it is assumed that Level 4 is the outcome
of all perceived service attributes during the visit. It thus functions as an umbrella construct
to the other variables. Furthermore Level 2 attributes are expected to have a larger effect
size on the overall perception of service quality than Level 1 attributes. Therefore the
following hypotheses have been stated:
H1c: The evaluation of Level 4 is based on the evaluations of Level 1.
H2c: The evaluation of Level 4 is based on the evaluations of Level 2.
H3: The evaluation of Level 4 is based on the evaluations of Level 3.
H4: Level 2 has a stronger correlation with the overall perception of service quality
(Level 4) than Level 1.
Whether these hypotheses can be accepted or have to be rejected, will enlighten to what
extent the research method mystery shopping is indeed a reliable method and whether the
claims made about mystery shopping can be confirmed.
21 |
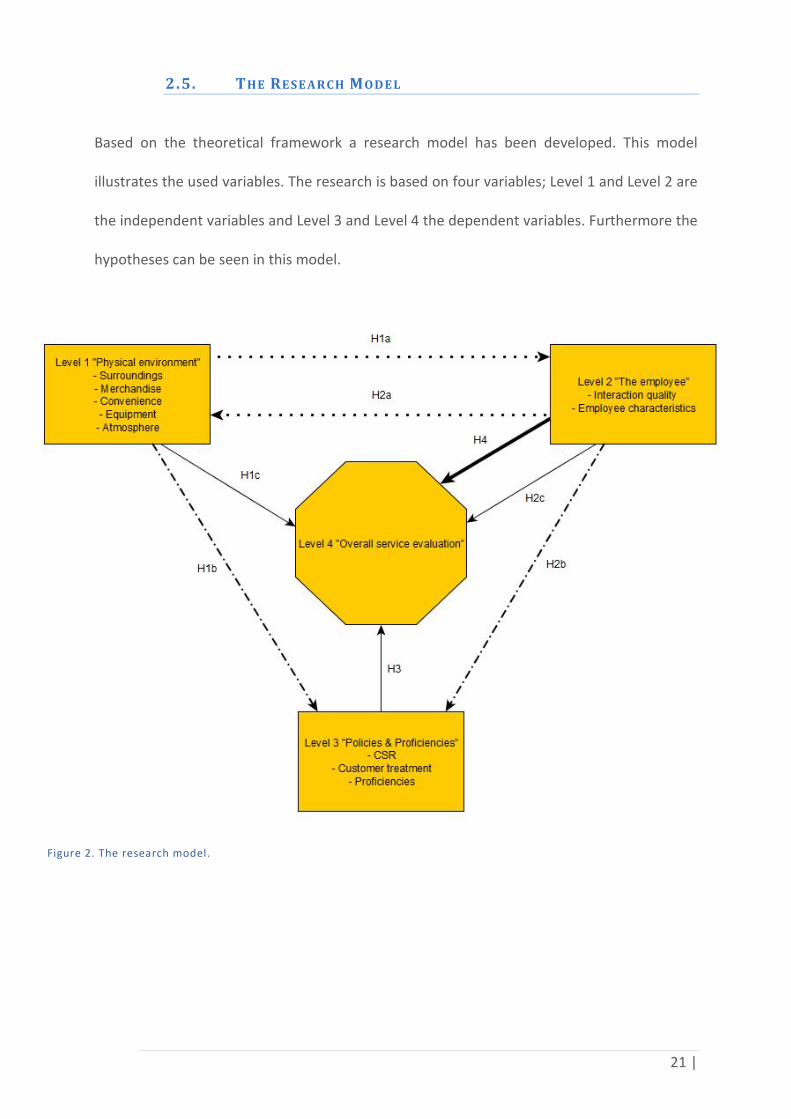
2.5. THE RESE AR CH MODE L
Based on the theoretical framework a research model has been developed. This model
illustrates the used variables. The research is based on four variables; Level 1 and Level 2 are
the independent variables and Level 3 and Level 4 the dependent variables. Furthermore the
hypotheses can be seen in this model.
Figure 2. The research model.
22 |
Chapter 3
‘Method’
23 |
3. Method
The aim of the study was to investigate whether the reliability of mystery shopping can be
guaranteed. Therefore an experiment with a 2 (positive Level 1 and negative Level 1) x 2
(positive Level 2 and negative Level 2) factorial design has been set up. The measurement
instrument asked respondents to evaluate all four service quality levels. In order to validate
the composition of the levels a pretest has been executed, in which researchers categorized
each item to one of the four levels. Additionally the manipulations have been tested during a
second pretest in order to test their efficacy. Finally the participants were instructed to
perform a mystery shopping visit at the butchery of an Emté supermarket. During the
controlled interaction between the mystery shopper and the service provider, an essential
condition for achieving valid research results was that the mystery shoppers were unaware
of the fact that they were being observed (Schwartz & Schwartz, 1955). This is due to the
fact that mystery shoppers, who are aware of the observation, might show deviant behavior
and thus bias the results. In the following the two pretests, the applied manipulations, the
design, the instrument, the procedure and the mystery shoppers will be discussed.
3.1. PR E TEST 1 – COM POSI NG THE LE VELS
In order to ensure that the categorization into four levels is indeed valuable and
representative, three other researchers were asked to categorize the items into one of the
four levels. One researcher was familiar with the subject, while the other researchers were
not familiar with neither mystery shopping nor service quality research. The researchers
were provided with a short explanation letter in which they were asked to assign each item
to one of the four levels. During the categorization process participants were not allowed to
ask questions about the items or definitions in order to avoid any kind of bias. Once the
24 |
participants completed the categorization the researcher compared their assigned items.
Each item mismatching the original categorization was held apart. Afterwards short
interviews were held with the participants in order to gain more insight into their
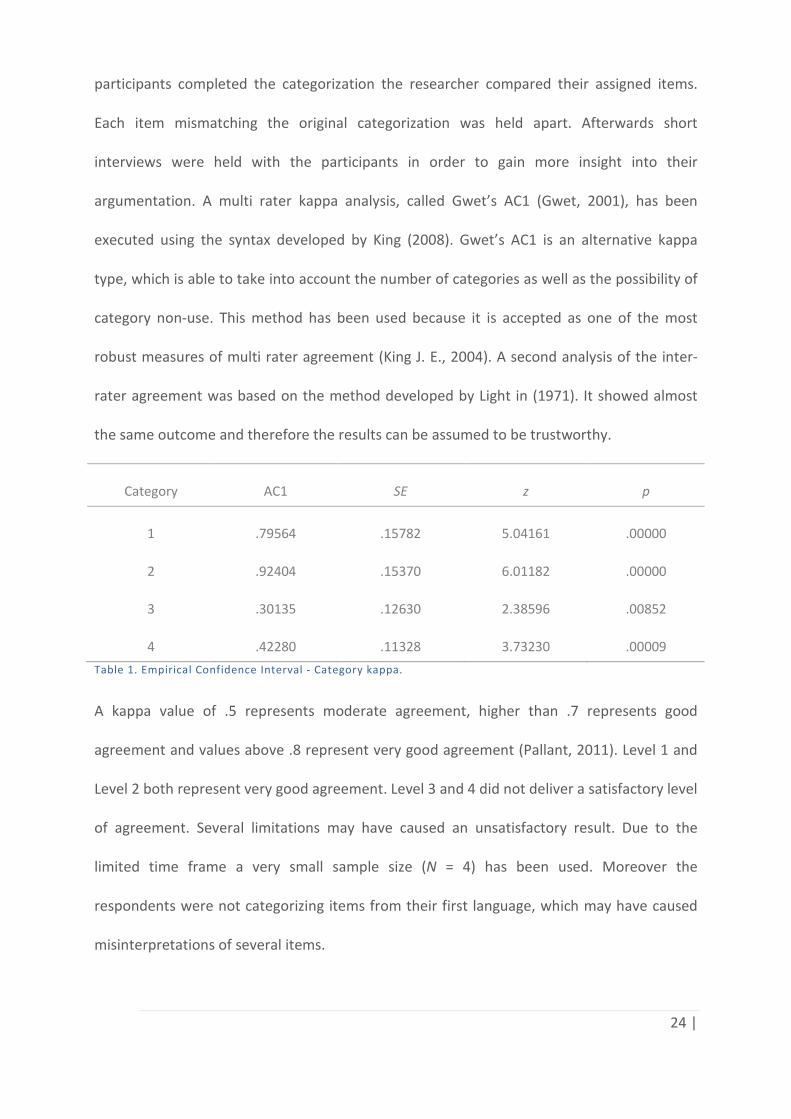
argumentation. A multi rater kappa analysis, called Gwet’s AC1 (Gwet, 2001), has been
executed using the syntax developed by King (2008). Gwet’s AC1 is an alternative kappa
type, which is able to take into account the number of categories as well as the possibility of
category non‐use. This method has been used because it is accepted as one of the most
robust measures of multi rater agreement (King J. E., 2004). A second analysis of the inter‐
rater agreement was based on the method developed by Light in (1971). It showed almost
the same outcome and therefore the results can be assumed to be trustworthy.
Category
AC1
SE
z
p
1
.79564
.15782
5.04161
.00000
2
.92404
.15370
6.01182
.00000
3
.30135
.12630
2.38596
.00852
4
.42280
.11328
3.73230
.00009
Table 1. Empirical Confidence Interval ‐ Category kappa.
A kappa value of .5 represents moderate agreement, higher than .7 represents good
agreement and values above .8 represent very good agreement (Pallant, 2011). Level 1 and
Level 2 both represent very good agreement. Level 3 and 4 did not deliver a satisfactory level
of agreement. Several limitations may have caused an unsatisfactory result. Due to the
limited time frame a very small sample size (N = 4) has been used. Moreover the
respondents were not categorizing items from their first language, which may have caused
misinterpretations of several items.
25 |
3.2. PR E TEST 2 – MANI PULATIONS LEVEL 1 & LEVEL 2
The service levels chosen to manipulate were the physical environment and the employee,
due to the fact, that both levels have been found repeatedly to be important dimensions in
the evaluation of service quality (Finn & Kayandé, 1999; Morrison, Colman, & Preston, 1997).
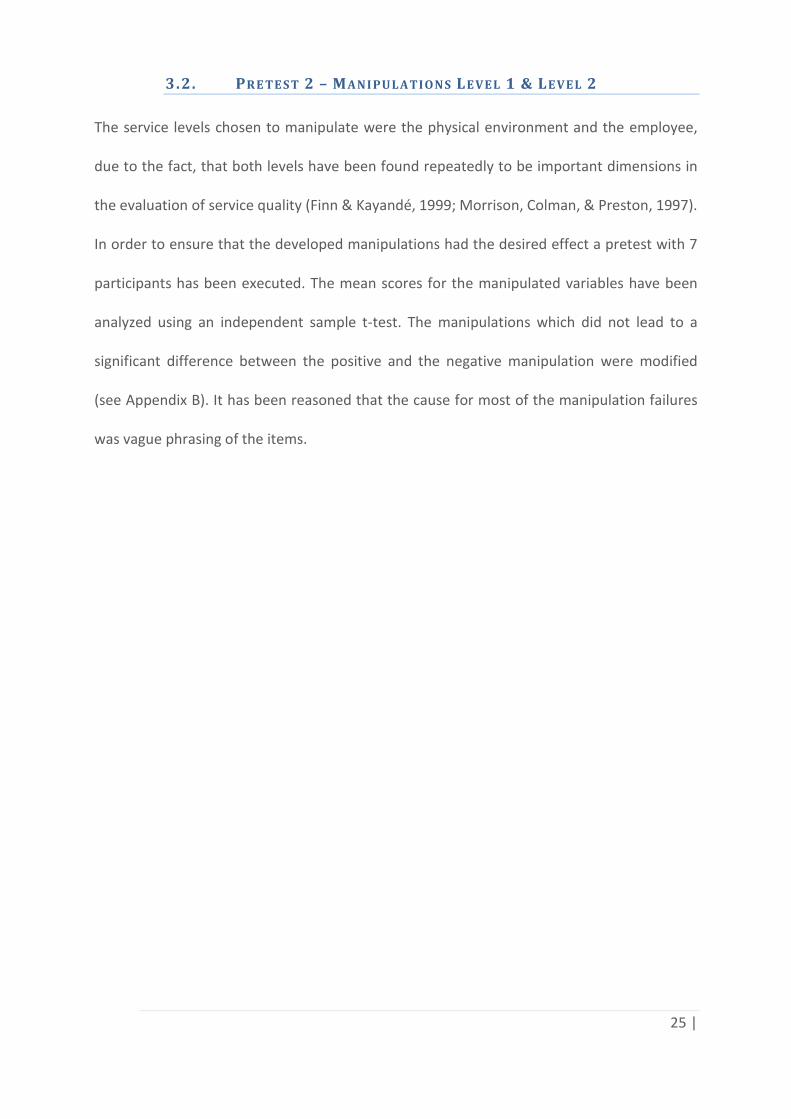
In order to ensure that the developed manipulations had the desired effect a pretest with 7
participants has been executed. The mean scores for the manipulated variables have been
analyzed using an independent sample t‐test. The manipulations which did not lead to a
significant difference between the positive and the negative manipulation were modified
(see Appendix B). It has been reasoned that the cause for most of the manipulation failures
was vague phrasing of the items.
26 |
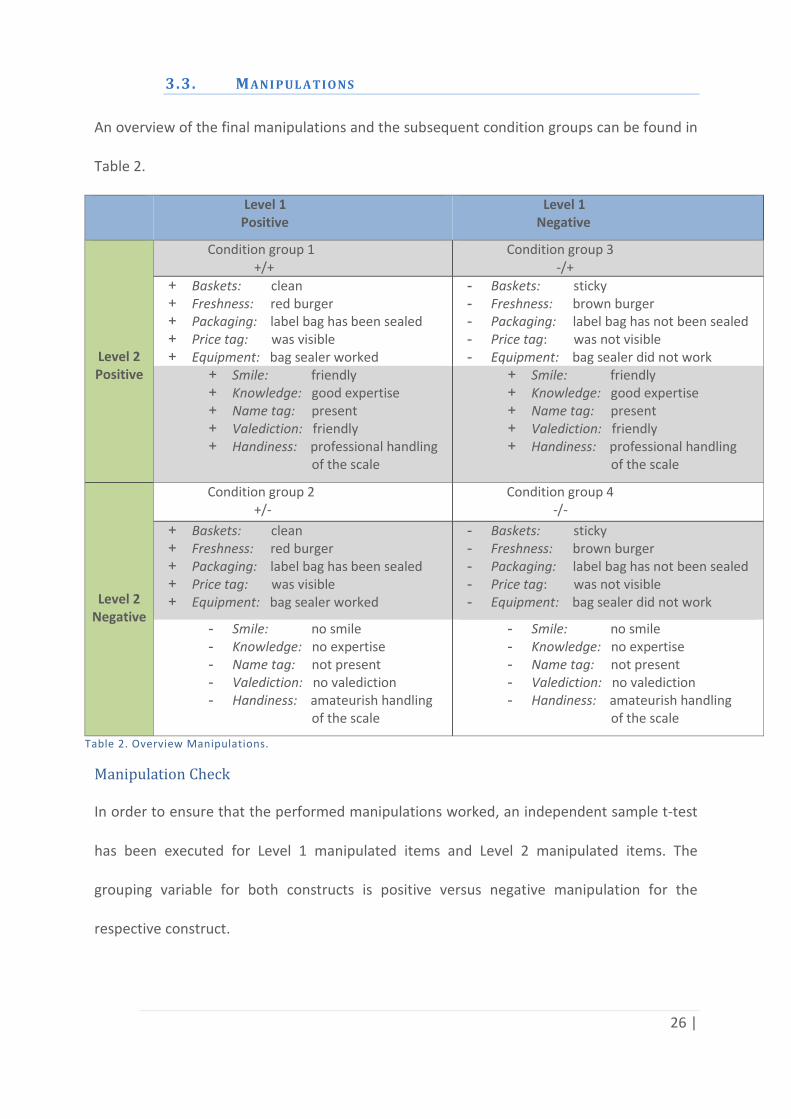
3.3. MANI PUL ATIONS
An overview of the final manipulations and the subsequent condition groups can be found in
Table 2.
Level 1 Positive
Level 1 Negative
Level 2 Positive
Condition group 1 +/+
Condition group 3 ‐/+
+ Baskets: clean + Freshness: red burger + Packaging: label bag has been sealed + Price tag: was visible + Equipment: bag sealer worked
- Baskets: sticky - Freshness: brown burger - Packaging: label bag has not been sealed - Price tag: was not visible - Equipment: bag sealer did not work
+ Smile: friendly + Knowledge: good expertise + Name tag: present + Valediction: friendly + Handiness: professional handling
of the scale
+ Smile: friendly + Knowledge: good expertise + Name tag: present + Valediction: friendly + Handiness: professional handling
of the scale
Level 2 Negative
Condition group 2 +/‐
Condition group 4 ‐/‐
+ Baskets: clean + Freshness: red burger + Packaging: label bag has been sealed + Price tag: was visible + Equipment: bag sealer worked
- Baskets: sticky - Freshness: brown burger - Packaging: label bag has not been sealed - Price tag: was not visible - Equipment: bag sealer did not work
- Smile: no smile - Knowledge: no expertise - Name tag: not present - Valediction: no valediction - Handiness: amateurish handling
of the scale
- Smile: no smile - Knowledge: no expertise - Name tag: not present - Valediction: no valediction - Handiness: amateurish handling
of the scale
Table 2. Overview Manipulations.
Manipulation Check
In order to ensure that the performed manipulations worked, an independent sample t‐test
has been executed for Level 1 manipulated items and Level 2 manipulated items. The
grouping variable for both constructs is positive versus negative manipulation for the
respective construct.
27 |
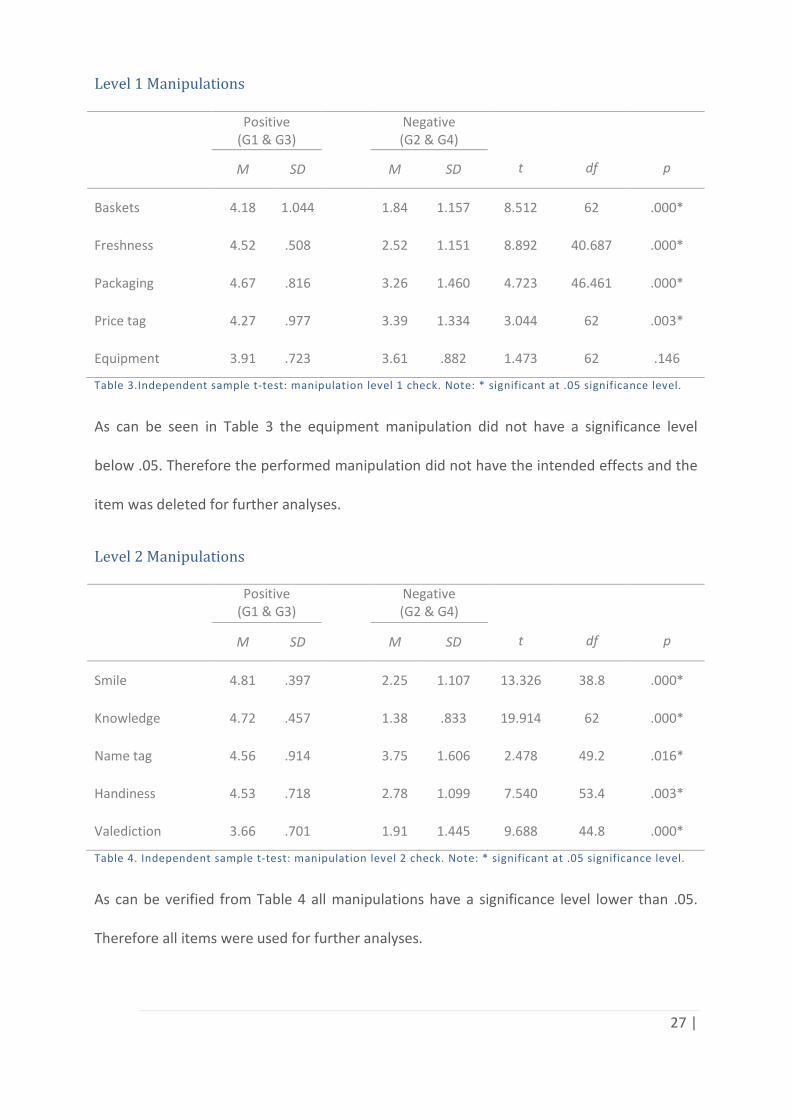
Level 1 Manipulations
Positive (G1 & G3)
Negative (G2 & G4)
t
df
p M SD M SD
Baskets 4.18 1.044 1.84 1.157 8.512 62 .000*
Freshness 4.52 .508 2.52 1.151 8.892 40.687 .000*
Packaging 4.67 .816 3.26 1.460 4.723 46.461 .000*
Price tag 4.27 .977 3.39 1.334 3.044 62 .003*
Equipment 3.91 .723 3.61 .882 1.473 62 .146
Table 3.Independent sample t‐test: manipulation level 1 check. Note: * significant at .05 significance level.
As can be seen in Table 3 the equipment manipulation did not have a significance level
below .05. Therefore the performed manipulation did not have the intended effects and the
item was deleted for further analyses.
Level 2 Manipulations
Positive (G1 & G3)
Negative (G2 & G4)
t
df
p M SD M SD
Smile 4.81 .397 2.25 1.107 13.326 38.8 .000*
Knowledge 4.72 .457 1.38 .833 19.914 62 .000*
Name tag 4.56 .914 3.75 1.606 2.478 49.2 .016*
Handiness 4.53 .718 2.78 1.099 7.540 53.4 .003*
Valediction 3.66 .701 1.91 1.445 9.688 44.8 .000*
Table 4. Independent sample t‐test: manipulation level 2 check. Note: * significant at .05 significance level.
As can be verified from Table 4 all manipulations have a significance level lower than .05.
Therefore all items were used for further analyses.
28 |
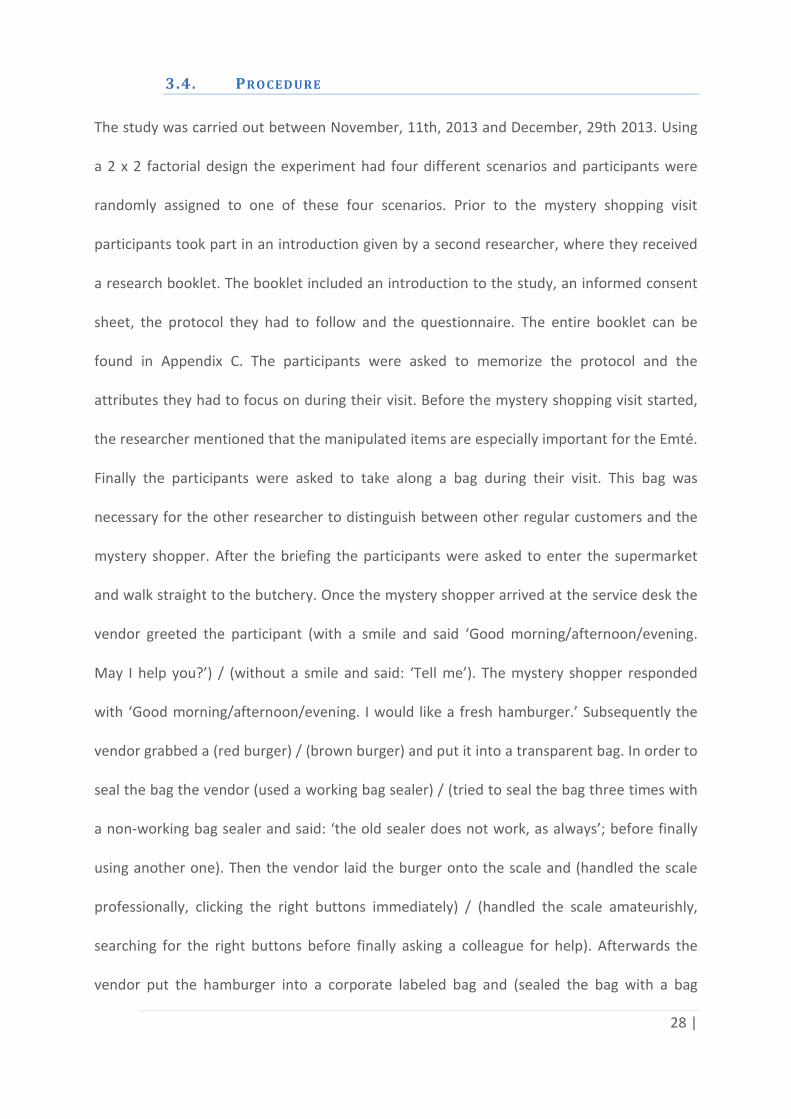
3.4. PR O CED URE
The study was carried out between November, 11th, 2013 and December, 29th 2013. Using
a 2 x 2 factorial design the experiment had four different scenarios and participants were
randomly assigned to one of these four scenarios. Prior to the mystery shopping visit
participants took part in an introduction given by a second researcher, where they received
a research booklet. The booklet included an introduction to the study, an informed consent
sheet, the protocol they had to follow and the questionnaire. The entire booklet can be
found in Appendix C. The participants were asked to memorize the protocol and the
attributes they had to focus on during their visit. Before the mystery shopping visit started,
the researcher mentioned that the manipulated items are especially important for the Emté.
Finally the participants were asked to take along a bag during their visit. This bag was
necessary for the other researcher to distinguish between other regular customers and the
mystery shopper. After the briefing the participants were asked to enter the supermarket
and walk straight to the butchery. Once the mystery shopper arrived at the service desk the
vendor greeted the participant (with a smile and said ‘Good morning/afternoon/evening.
May I help you?’) / (without a smile and said: ‘Tell me’). The mystery shopper responded
with ‘Good morning/afternoon/evening. I would like a fresh hamburger.’ Subsequently the
vendor grabbed a (red burger) / (brown burger) and put it into a transparent bag. In order to
seal the bag the vendor (used a working bag sealer) / (tried to seal the bag three times with
a non‐working bag sealer and said: ‘the old sealer does not work, as always’; before finally
using another one). Then the vendor laid the burger onto the scale and (handled the scale
professionally, clicking the right buttons immediately) / (handled the scale amateurishly,
searching for the right buttons before finally asking a colleague for help). Afterwards the
vendor put the hamburger into a corporate labeled bag and (sealed the bag with a bag
29 |
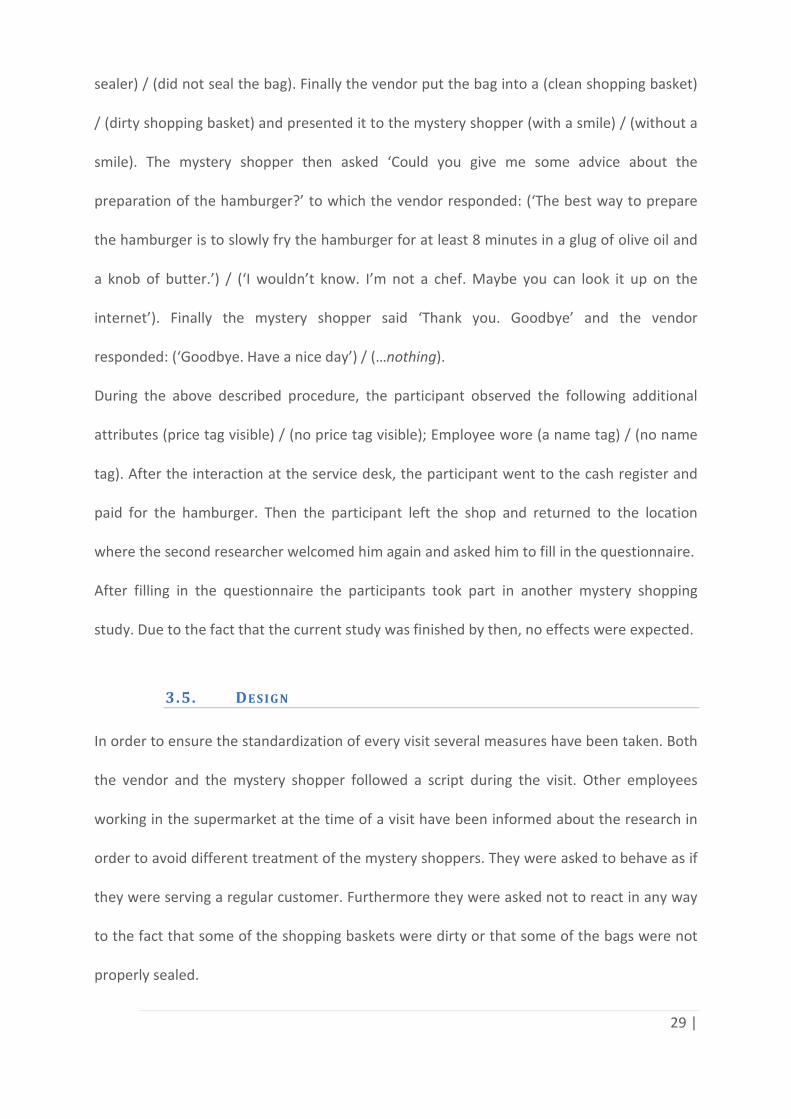
sealer) / (did not seal the bag). Finally the vendor put the bag into a (clean shopping basket)
/ (dirty shopping basket) and presented it to the mystery shopper (with a smile) / (without a
smile). The mystery shopper then asked ‘Could you give me some advice about the
preparation of the hamburger?’ to which the vendor responded: (‘The best way to prepare
the hamburger is to slowly fry the hamburger for at least 8 minutes in a glug of olive oil and
a knob of butter.’) / (‘I wouldn’t know. I’m not a chef. Maybe you can look it up on the
internet’). Finally the mystery shopper said ‘Thank you. Goodbye’ and the vendor
responded: (‘Goodbye. Have a nice day’) / (…nothing).
During the above described procedure, the participant observed the following additional
attributes (price tag visible) / (no price tag visible); Employee wore (a name tag) / (no name
tag). After the interaction at the service desk, the participant went to the cash register and
paid for the hamburger. Then the participant left the shop and returned to the location
where the second researcher welcomed him again and asked him to fill in the questionnaire.
After filling in the questionnaire the participants took part in another mystery shopping
study. Due to the fact that the current study was finished by then, no effects were expected.
3.5. DESIGN
In order to ensure the standardization of every visit several measures have been taken. Both
the vendor and the mystery shopper followed a script during the visit. Other employees
working in the supermarket at the time of a visit have been informed about the research in
order to avoid different treatment of the mystery shoppers. They were asked to behave as if
they were serving a regular customer. Furthermore they were asked not to react in any way
to the fact that some of the shopping baskets were dirty or that some of the bags were not
properly sealed.
30 |
3.6. INSTR UMEN T
Based on the research model and the collected items from the literature search on service
scales the measurement instrument has been developed. The detailed process of the item
selection can be found in Appendix D. In the following part the instrument will be discussed.
The questionnaire included a total of 58 items: 26 items measuring the evaluation of the 4
service levels, 26 items measuring the importance of those items for the respondent and 6
additional items. The 26 items measuring the evaluation of the service levels had to be rated
on a five point Likert scale (totally disagree – totally agree). Level 1 has been measured using
9 items of which 5 were manipulated (baskets, freshness, packaging, price tag and
equipment) and 4 were fillers (interior, neatness, meat variety, advertising signs). The 4
fillers have been added in order to have the same number of fillers in each level (see below).
Level 2 has also been measured using 9 items of which 5 were manipulated (smile,
knowledge, name tag, valediction and handiness) and 4 were fillers (waiting time, language
use, responsiveness and focus). Level 3 has been measured using 4 items (social project
involvement, environmental care, administration accuracy and customer involvement) and
finally Level 4 has also been measured using 4 items (excellence of service, cleanliness,
convenience and positive experience). The 26 items measuring the importance of each item
had to be rated on a five point Likert scale (not important at all – very important). Those
have been added to the measurement instrument in order to run an ANCOVA analysis in
case of a significant outcome for the dependencies of the levels. This test is important in
order to rule out the possibility that dependencies have been caused by respondents’
personal preferences. Finally 3 demographic items (age, gender and shopping behavior) and
3 items for the Emté management (grade, importance butchery, and preference for fresh or
packed meat) were added to the questionnaire.
31 |
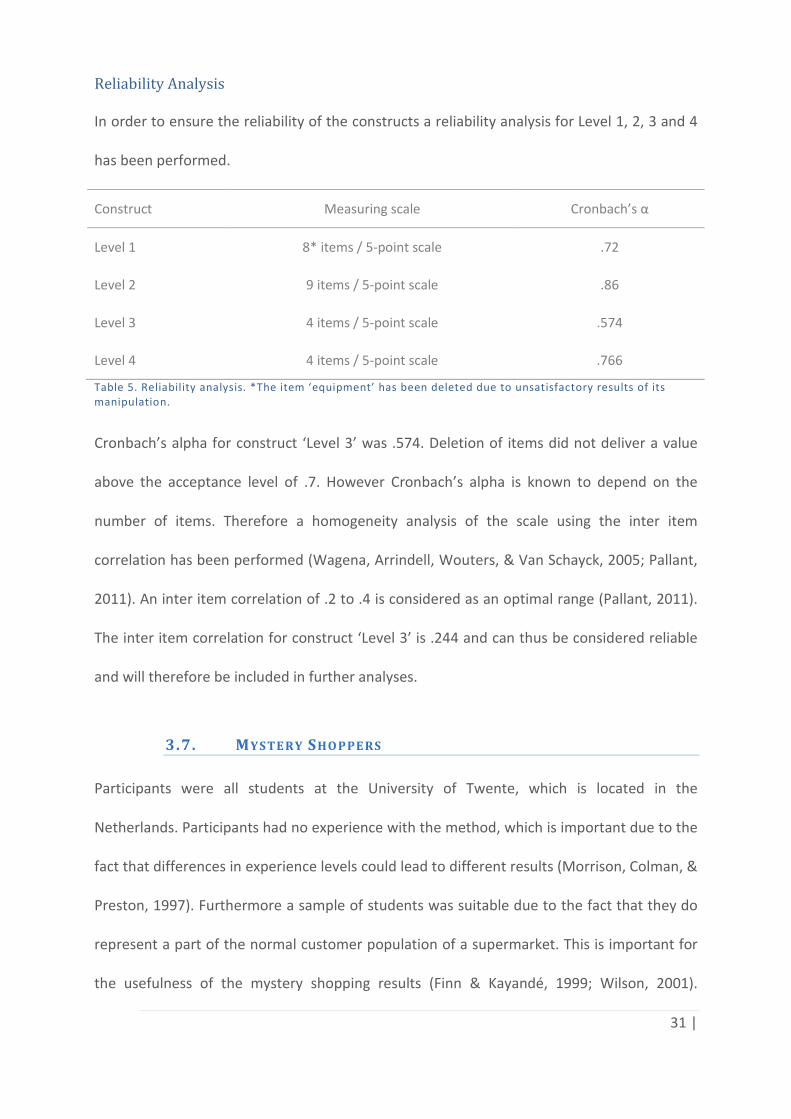
Reliability Analysis
In order to ensure the reliability of the constructs a reliability analysis for Level 1, 2, 3 and 4
has been performed.
Construct Measuring scale Cronbach’s α
Level 1 8* items / 5‐point scale .72
Level 2 9 items / 5‐point scale .86
Level 3 4 items / 5‐point scale .574
Level 4 4 items / 5‐point scale .766
Table 5. Reliability analysis. *The item ‘equipment’ has been deleted due to unsatisfactory results of its manipulation.
Cronbach’s alpha for construct ‘Level 3’ was .574. Deletion of items did not deliver a value
above the acceptance level of .7. However Cronbach’s alpha is known to depend on the
number of items. Therefore a homogeneity analysis of the scale using the inter item
correlation has been performed (Wagena, Arrindell, Wouters, & Van Schayck, 2005; Pallant,
2011). An inter item correlation of .2 to .4 is considered as an optimal range (Pallant, 2011).
The inter item correlation for construct ‘Level 3’ is .244 and can thus be considered reliable
and will therefore be included in further analyses.
3.7. MYSTE RY SHO PPE RS
Participants were all students at the University of Twente, which is located in the
Netherlands. Participants had no experience with the method, which is important due to the
fact that differences in experience levels could lead to different results (Morrison, Colman, &
Preston, 1997). Furthermore a sample of students was suitable due to the fact that they do
represent a part of the normal customer population of a supermarket. This is important for
the usefulness of the mystery shopping results (Finn & Kayandé, 1999; Wilson, 2001).
32 |
Students were compensated for their participation. Each behavioral sciences student at the
University of Twente is required to participate for fifteen hours in research experiments as
part of their curriculum. For the participation in the current study students received two of
the fifteen research hours as compensation, which equals the invested amount of time. The
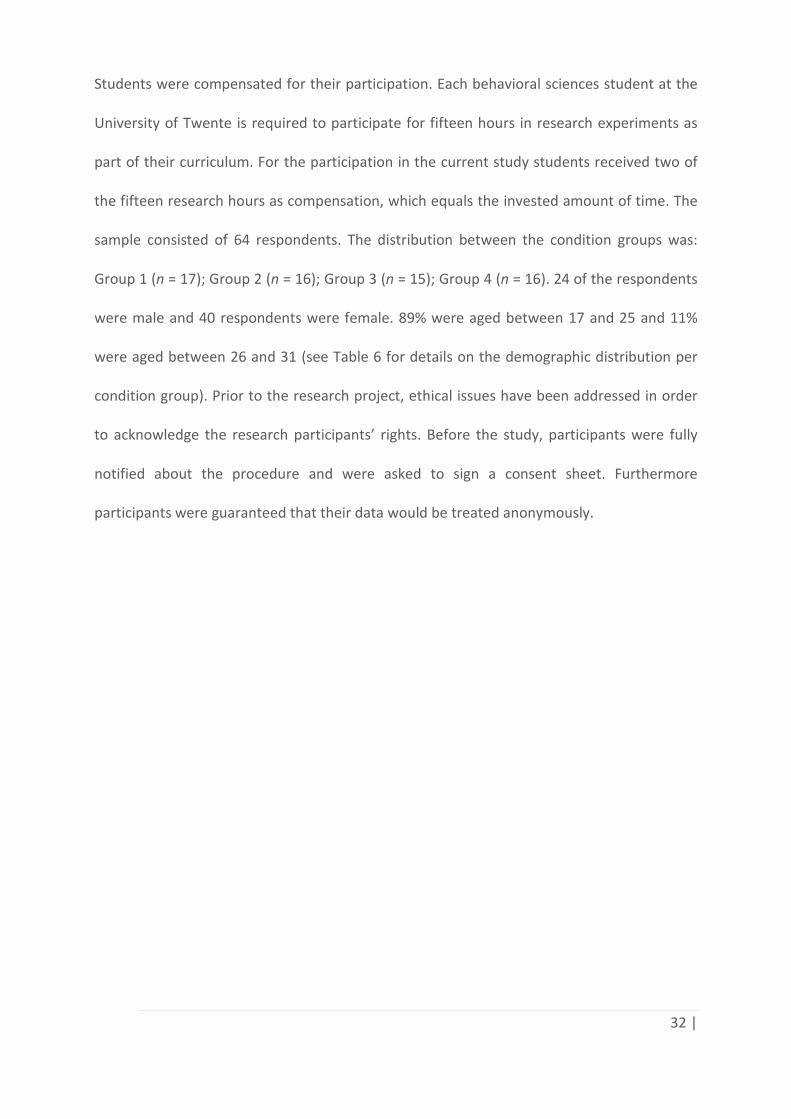
sample consisted of 64 respondents. The distribution between the condition groups was:
Group 1 (n = 17); Group 2 (n = 16); Group 3 (n = 15); Group 4 (n = 16). 24 of the respondents
were male and 40 respondents were female. 89% were aged between 17 and 25 and 11%
were aged between 26 and 31 (see Table 6 for details on the demographic distribution per
condition group). Prior to the research project, ethical issues have been addressed in order
to acknowledge the research participants’ rights. Before the study, participants were fully
notified about the procedure and were asked to sign a consent sheet. Furthermore
participants were guaranteed that their data would be treated anonymously.
33 |
Level 2
Positive Negative
Level 1
Positive
Condition group 1
Mean age: 20.65
Gender: F=58.8% M=41.2%
Condition group 2
Mean age: 21.87
Gender: F=56.3% M=43.8%
Negative
Condition group 3
Mean age: 21.38
Gender: F=73.3% M=26.7%
Condition group 4
Mean age: 21.38
Gender: F=62.5% M=37.5%
Table 6. Demographic distribution across manipulation levels.
In order to rule out any effects of age or gender a one‐way between‐groups analysis of
variance has been performed for both variables. Subjects were divided into 5 groups
according to their age (Group 1: 19 or less; Group 2: 22 or less; Group 3: 25 or less; Group 4:
28 or less and Group 5: 31 or less). There was no statistical significant difference at the p <
.05 level for the five age groups [F(4, 62) = ,211, p = .931]. The one‐way between‐groups
analysis of variance for the two gender groups (Group 1: male; Group 2: female) did neither
result in a significant difference at the p < .05 level [F(1, 62) = ,022, p = .882].
34 |
Chapter 4
‘Results’
35 |
4. Results
In the following chapter the results of the data analysis will be discussed. The data was
analysed using SPSS (Statistical Package for the Social Sciences) version 21. A principal
component analysis has been performed prior to other analyses. Due to the fact that no
useful clusters have been found the PCA was not included. This could have been caused by
the relative small sample size.
4.1. AC C URACY OF ME AS UR ING FAC TS LEVEL 1
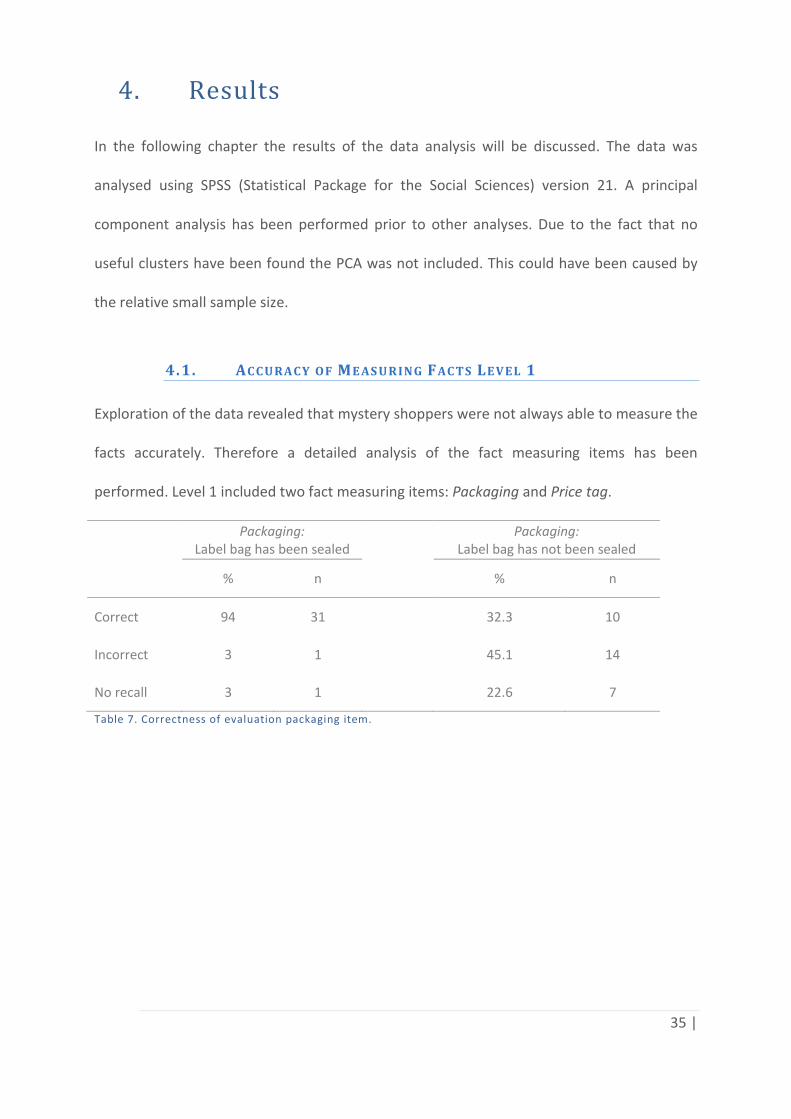
Exploration of the data revealed that mystery shoppers were not always able to measure the
facts accurately. Therefore a detailed analysis of the fact measuring items has been
performed. Level 1 included two fact measuring items: Packaging and Price tag.
Packaging: Label bag has been sealed
Packaging:
Label bag has not been sealed
% n % n
Correct 94 31 32.3 10
Incorrect 3 1 45.1 14
No recall 3 1 22.6 7
Table 7. Correctness of evaluation packaging item.
36 |
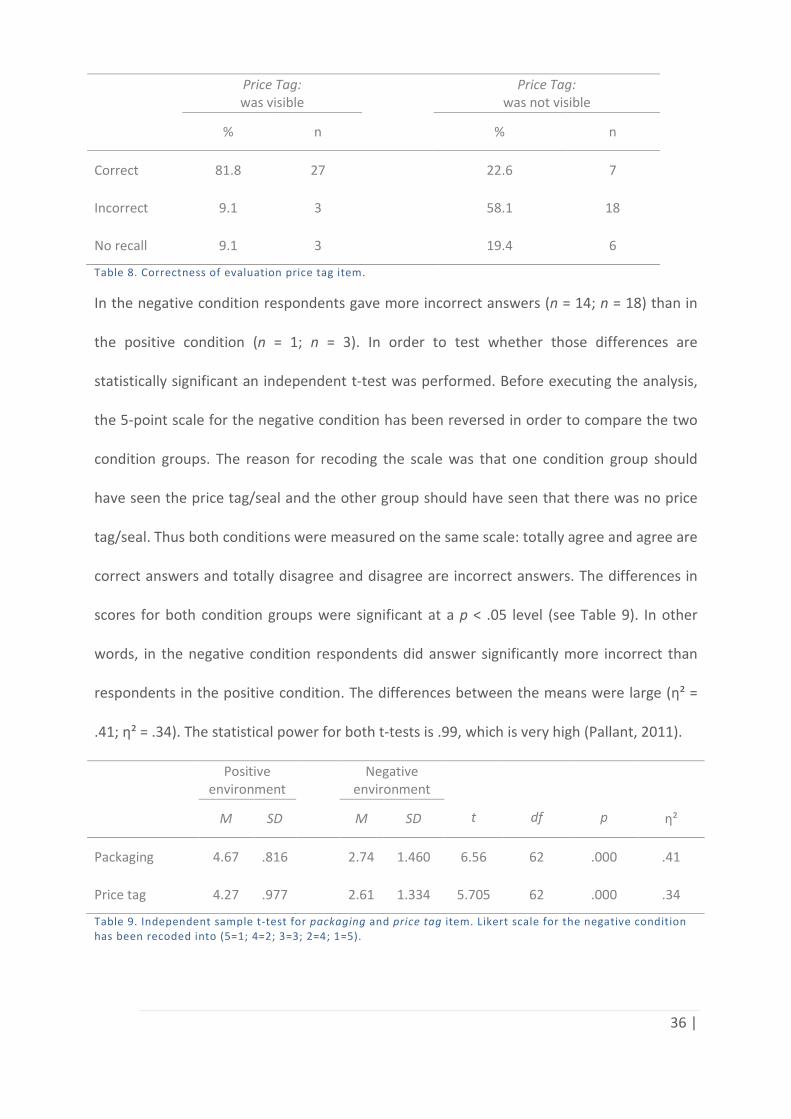
Price Tag: was visible
Price Tag:
was not visible
% n % n
Correct 81.8 27 22.6 7
Incorrect 9.1 3 58.1 18
No recall 9.1 3 19.4 6
Table 8. Correctness of evaluation price tag item.
In the negative condition respondents gave more incorrect answers (n = 14; n = 18) than in
the positive condition (n = 1; n = 3). In order to test whether those differences are
statistically significant an independent t‐test was performed. Before executing the analysis,
the 5‐point scale for the negative condition has been reversed in order to compare the two
condition groups. The reason for recoding the scale was that one condition group should
have seen the price tag/seal and the other group should have seen that there was no price
tag/seal. Thus both conditions were measured on the same scale: totally agree and agree are
correct answers and totally disagree and disagree are incorrect answers. The differences in
scores for both condition groups were significant at a p < .05 level (see Table 9). In other
words, in the negative condition respondents did answer significantly more incorrect than
respondents in the positive condition. The differences between the means were large (η² =
.41; η² = .34). The statistical power for both t‐tests is .99, which is very high (Pallant, 2011).
Positive environment
Negative environment
t
df
p
M SD M SD η²
Packaging 4.67 .816 2.74 1.460 6.56 62 .000 .41
Price tag 4.27 .977 2.61 1.334 5.705 62 .000 .34
Table 9. Independent sample t‐test for packaging and price tag item. Likert scale for the negative condition has been recoded into (5=1; 4=2; 3=3; 2=4; 1=5).
37 |
4.2. INFLUEN CES OF LE VEL 1
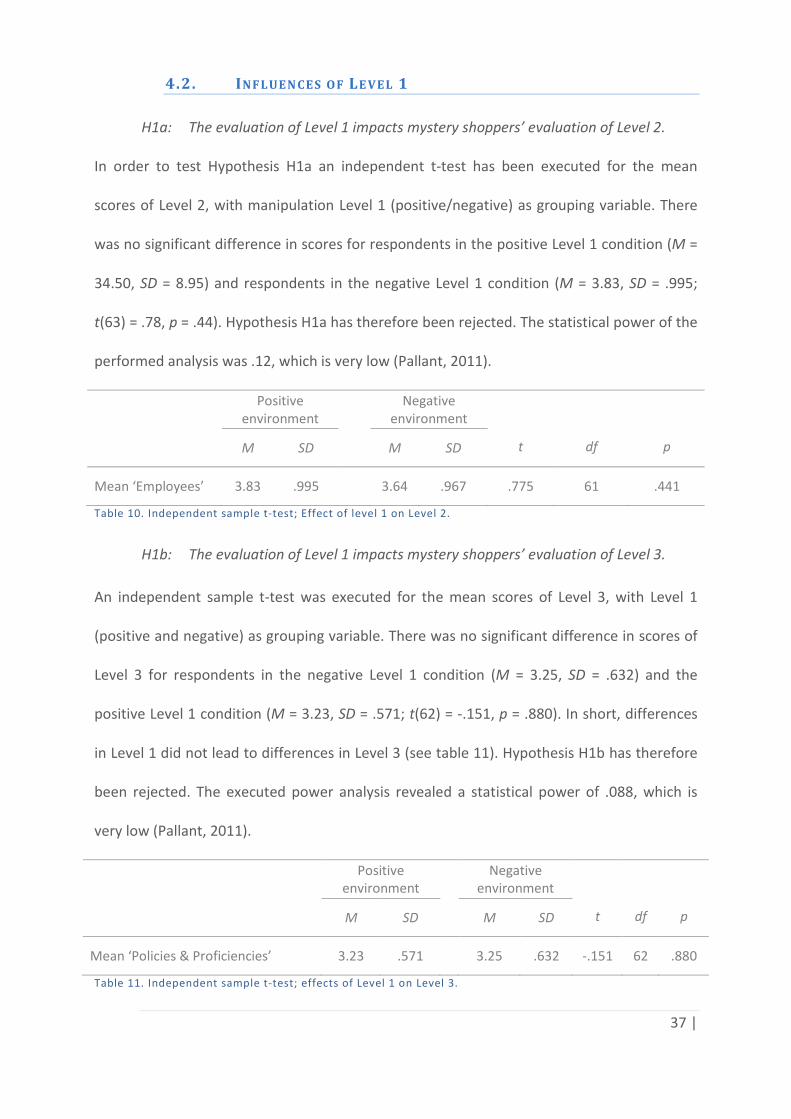
H1a: The evaluation of Level 1 impacts mystery shoppers’ evaluation of Level 2.
In order to test Hypothesis H1a an independent t‐test has been executed for the mean
scores of Level 2, with manipulation Level 1 (positive/negative) as grouping variable. There
was no significant difference in scores for respondents in the positive Level 1 condition (M =
34.50, SD = 8.95) and respondents in the negative Level 1 condition (M = 3.83, SD = .995;
t(63) = .78, p = .44). Hypothesis H1a has therefore been rejected. The statistical power of the
performed analysis was .12, which is very low (Pallant, 2011).
Positive environment
Negative environment
t
df
p M SD M SD
Mean ‘Employees’ 3.83 .995 3.64 .967 .775 61 .441
Table 10. Independent sample t‐test; Effect of level 1 on Level 2.
H1b: The evaluation of Level 1 impacts mystery shoppers’ evaluation of Level 3.
An independent sample t‐test was executed for the mean scores of Level 3, with Level 1
(positive and negative) as grouping variable. There was no significant difference in scores of
Level 3 for respondents in the negative Level 1 condition (M = 3.25, SD = .632) and the
positive Level 1 condition (M = 3.23, SD = .571; t(62) = ‐.151, p = .880). In short, differences
in Level 1 did not lead to differences in Level 3 (see table 11). Hypothesis H1b has therefore
been rejected. The executed power analysis revealed a statistical power of .088, which is
very low (Pallant, 2011).
Positive environment
Negative environment
t
df
p M SD M SD
Mean ‘Policies & Proficiencies’ 3.23 .571 3.25 .632 ‐.151 62 .880
Table 11. Independent sample t‐test; effects of Level 1 on Level 3.
38 |
4.3. AC C URACY OF ME AS UR ING FAC TS LEVEL 2
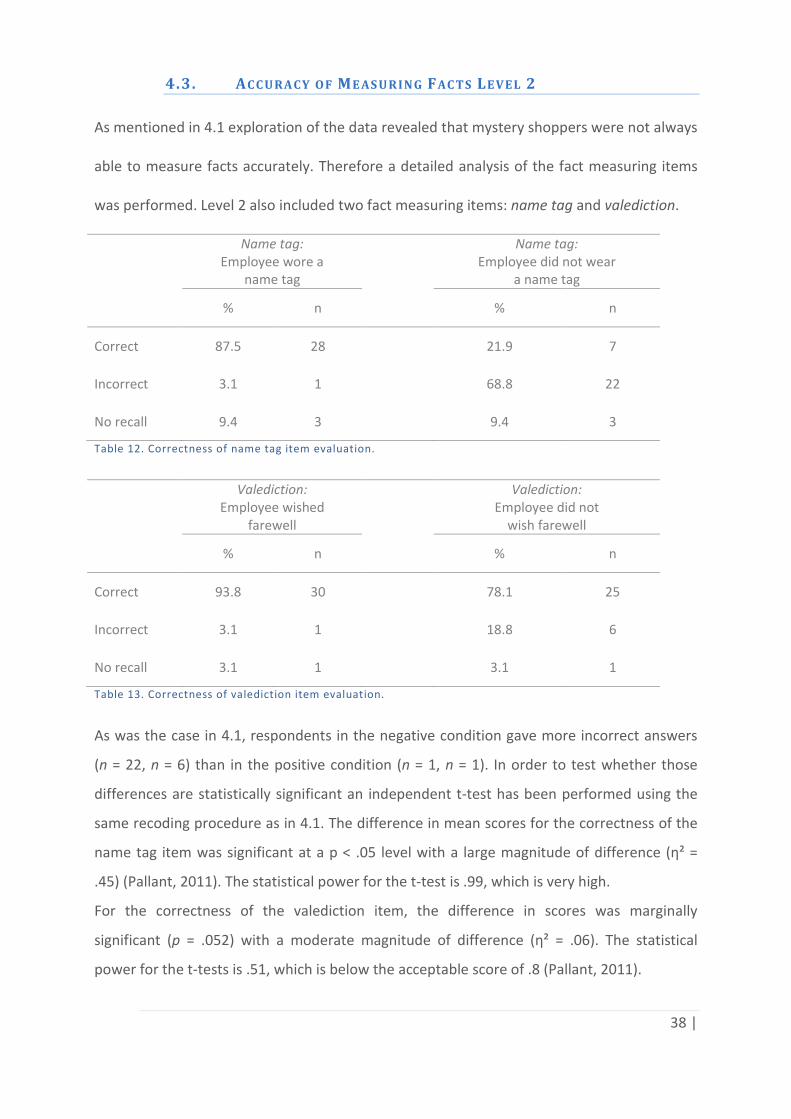
As mentioned in 4.1 exploration of the data revealed that mystery shoppers were not always
able to measure facts accurately. Therefore a detailed analysis of the fact measuring items
was performed. Level 2 also included two fact measuring items: name tag and valediction.
Name tag:
Employee wore a name tag
Name tag:
Employee did not wear a name tag
% n % n
Correct 87.5 28 21.9 7
Incorrect 3.1 1 68.8 22
No recall 9.4 3 9.4 3
Table 12. Correctness of name tag item evaluation.
Valediction:
Employee wished farewell
Valediction:
Employee did not wish farewell
% n % n
Correct 93.8 30 78.1 25
Incorrect 3.1 1 18.8 6
No recall 3.1 1 3.1 1
Table 13. Correctness of valediction item evaluation.
As was the case in 4.1, respondents in the negative condition gave more incorrect answers
(n = 22, n = 6) than in the positive condition (n = 1, n = 1). In order to test whether those
differences are statistically significant an independent t‐test has been performed using the
same recoding procedure as in 4.1. The difference in mean scores for the correctness of the
name tag item was significant at a p < .05 level with a large magnitude of difference (η² =
.45) (Pallant, 2011). The statistical power for the t‐test is .99, which is very high.
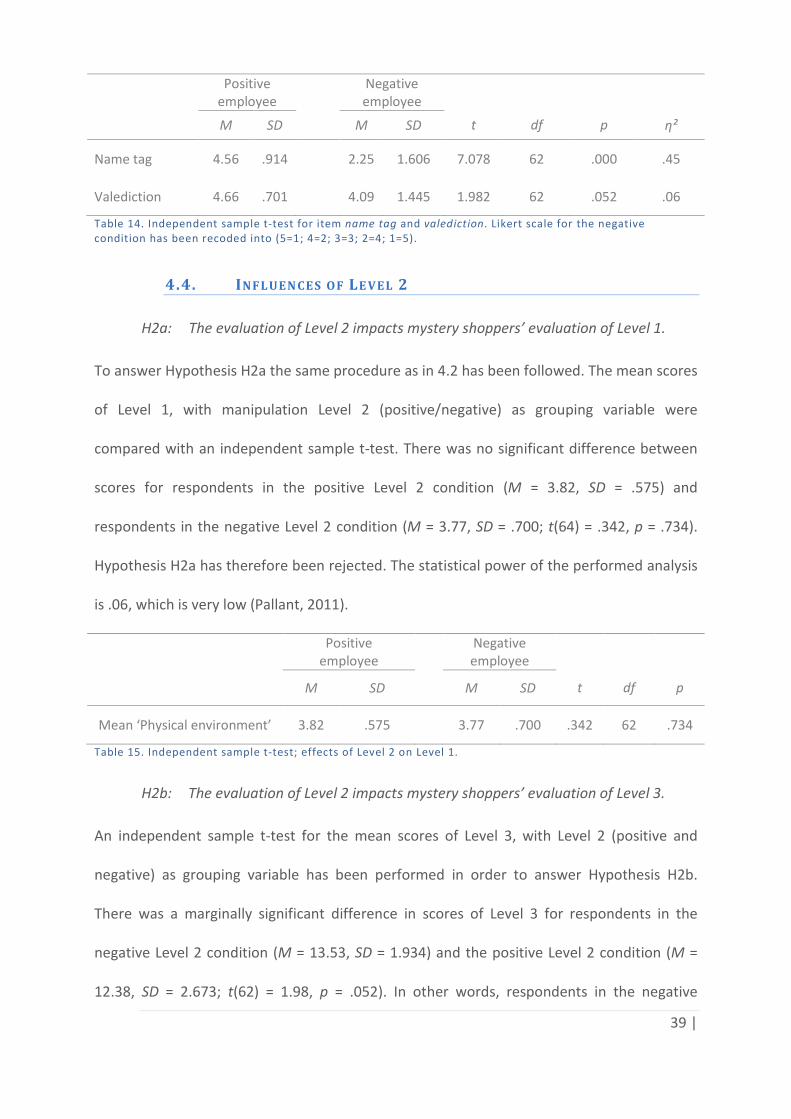
For the correctness of the valediction item, the difference in scores was marginally
significant (p = .052) with a moderate magnitude of difference (η² = .06). The statistical
power for the t‐tests is .51, which is below the acceptable score of .8 (Pallant, 2011).
39 |
Positive employee
Negative employee
t
df
p
M SD M SD η²
Name tag 4.56 .914 2.25 1.606 7.078 62 .000 .45
Valediction 4.66 .701 4.09 1.445 1.982 62 .052 .06
Table 14. Independent sample t‐test for item name tag and valediction. Likert scale for the negative condition has been recoded into (5=1; 4=2; 3=3; 2=4; 1=5).
4.4. INFLUEN CES OF LE VEL 2
H2a: The evaluation of Level 2 impacts mystery shoppers’ evaluation of Level 1.
To answer Hypothesis H2a the same procedure as in 4.2 has been followed. The mean scores
of Level 1, with manipulation Level 2 (positive/negative) as grouping variable were
compared with an independent sample t‐test. There was no significant difference between
scores for respondents in the positive Level 2 condition (M = 3.82, SD = .575) and
respondents in the negative Level 2 condition (M = 3.77, SD = .700; t(64) = .342, p = .734).
Hypothesis H2a has therefore been rejected. The statistical power of the performed analysis
is .06, which is very low (Pallant, 2011).
Positive employee
Negative employee
t
df
p M SD M SD
Mean ‘Physical environment’ 3.82 .575 3.77 .700 .342 62 .734
Table 15. Independent sample t‐test; effects of Level 2 on Level 1.
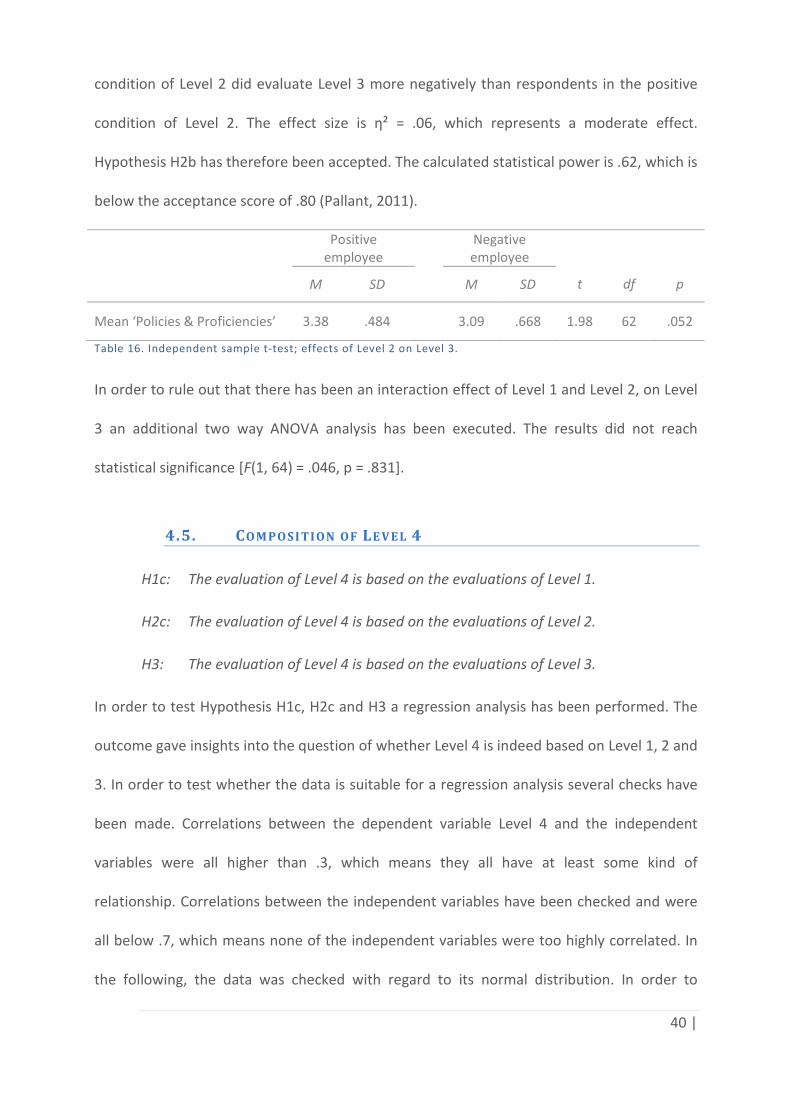
H2b: The evaluation of Level 2 impacts mystery shoppers’ evaluation of Level 3.
An independent sample t‐test for the mean scores of Level 3, with Level 2 (positive and
negative) as grouping variable has been performed in order to answer Hypothesis H2b.
There was a marginally significant difference in scores of Level 3 for respondents in the
negative Level 2 condition (M = 13.53, SD = 1.934) and the positive Level 2 condition (M =
12.38, SD = 2.673; t(62) = 1.98, p = .052). In other words, respondents in the negative
40 |
condition of Level 2 did evaluate Level 3 more negatively than respondents in the positive
condition of Level 2. The effect size is η² = .06, which represents a moderate effect.
Hypothesis H2b has therefore been accepted. The calculated statistical power is .62, which is
below the acceptance score of .80 (Pallant, 2011).
Positive employee
Negative employee
t
df
p M SD M SD
Mean ‘Policies & Proficiencies’ 3.38 .484 3.09 .668 1.98 62 .052
Table 16. Independent sample t‐test; effects of Level 2 on Level 3.
In order to rule out that there has been an interaction effect of Level 1 and Level 2, on Level
3 an additional two way ANOVA analysis has been executed. The results did not reach
statistical significance [F(1, 64) = .046, p = .831].
4.5. COM POSI TION OF LE V EL 4
H1c: The evaluation of Level 4 is based on the evaluations of Level 1.
H2c: The evaluation of Level 4 is based on the evaluations of Level 2.
H3: The evaluation of Level 4 is based on the evaluations of Level 3.
In order to test Hypothesis H1c, H2c and H3 a regression analysis has been performed. The
outcome gave insights into the question of whether Level 4 is indeed based on Level 1, 2 and
3. In order to test whether the data is suitable for a regression analysis several checks have
been made. Correlations between the dependent variable Level 4 and the independent
variables were all higher than .3, which means they all have at least some kind of
relationship. Correlations between the independent variables have been checked and were
all below .7, which means none of the independent variables were too highly correlated. In
the following, the data was checked with regard to its normal distribution. In order to
41 |
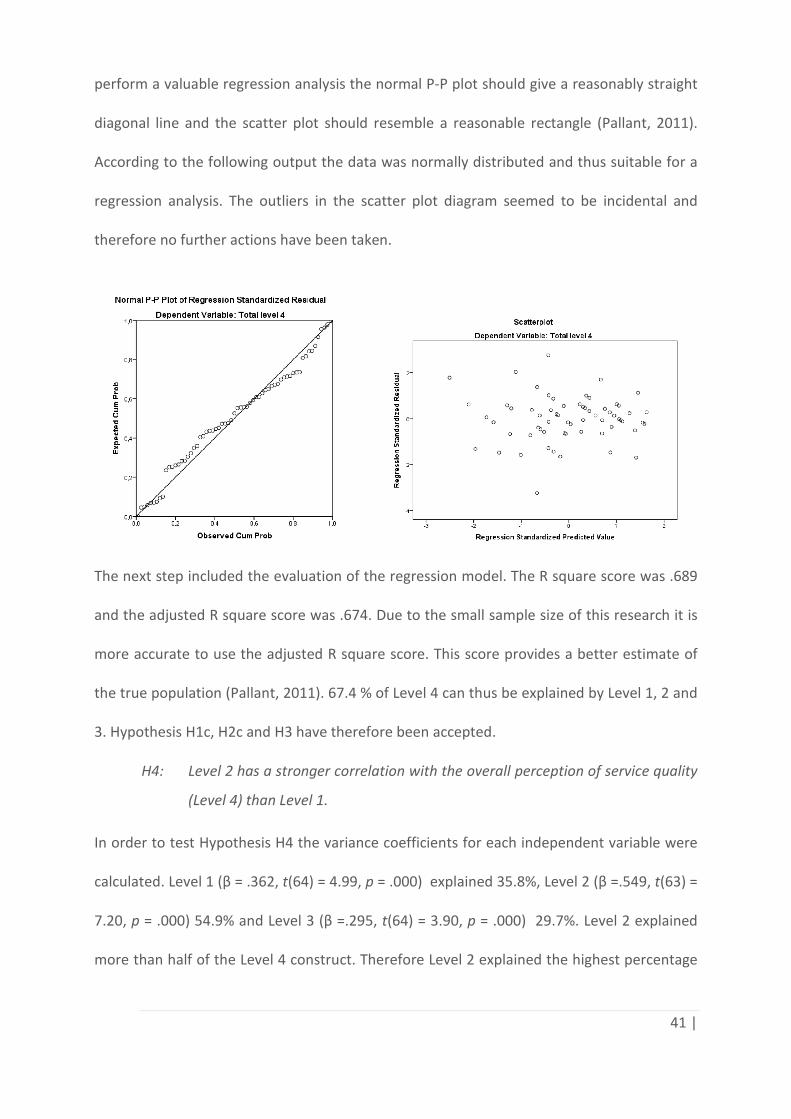
perform a valuable regression analysis the normal P‐P plot should give a reasonably straight
diagonal line and the scatter plot should resemble a reasonable rectangle (Pallant, 2011).
According to the following output the data was normally distributed and thus suitable for a
regression analysis. The outliers in the scatter plot diagram seemed to be incidental and
therefore no further actions have been taken.
The next step included the evaluation of the regression model. The R square score was .689
and the adjusted R square score was .674. Due to the small sample size of this research it is
more accurate to use the adjusted R square score. This score provides a better estimate of
the true population (Pallant, 2011). 67.4 % of Level 4 can thus be explained by Level 1, 2 and
3. Hypothesis H1c, H2c and H3 have therefore been accepted.
H4: Level 2 has a stronger correlation with the overall perception of service quality
(Level 4) than Level 1.
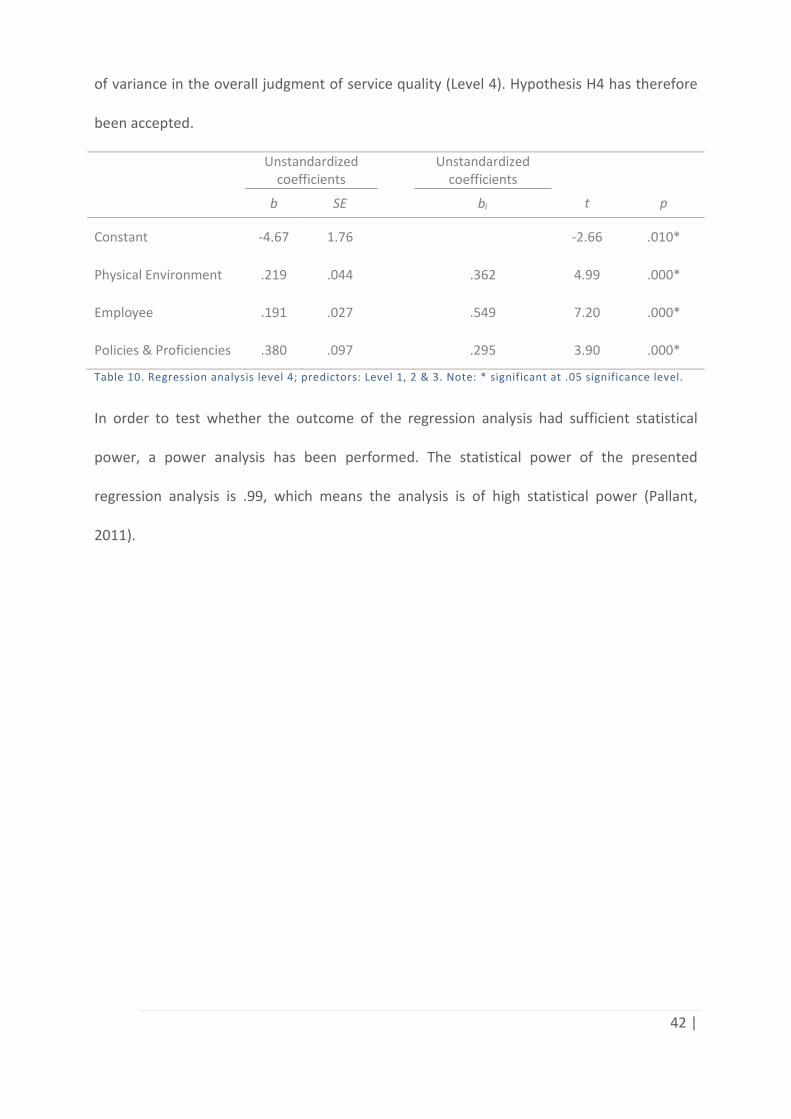
In order to test Hypothesis H4 the variance coefficients for each independent variable were
calculated. Level 1 (β = .362, t(64) = 4.99, p = .000) explained 35.8%, Level 2 (β =.549, t(63) =
7.20, p = .000) 54.9% and Level 3 (β =.295, t(64) = 3.90, p = .000) 29.7%. Level 2 explained
more than half of the Level 4 construct. Therefore Level 2 explained the highest percentage
42 |
of variance in the overall judgment of service quality (Level 4). Hypothesis H4 has therefore
been accepted.
Unstandardized coefficients
Unstandardized coefficients
t
p b SE bᵢ
Constant ‐4.67 1.76 ‐2.66 .010*
Physical Environment .219 .044 .362 4.99 .000*
Employee .191 .027 .549 7.20 .000*
Policies & Proficiencies .380 .097 .295 3.90 .000*
Table 10. Regression analysis level 4; predictors: Level 1, 2 & 3. Note: * significant at .05 significance level.
In order to test whether the outcome of the regression analysis had sufficient statistical
power, a power analysis has been performed. The statistical power of the presented
regression analysis is .99, which means the analysis is of high statistical power (Pallant,
2011).
43 |
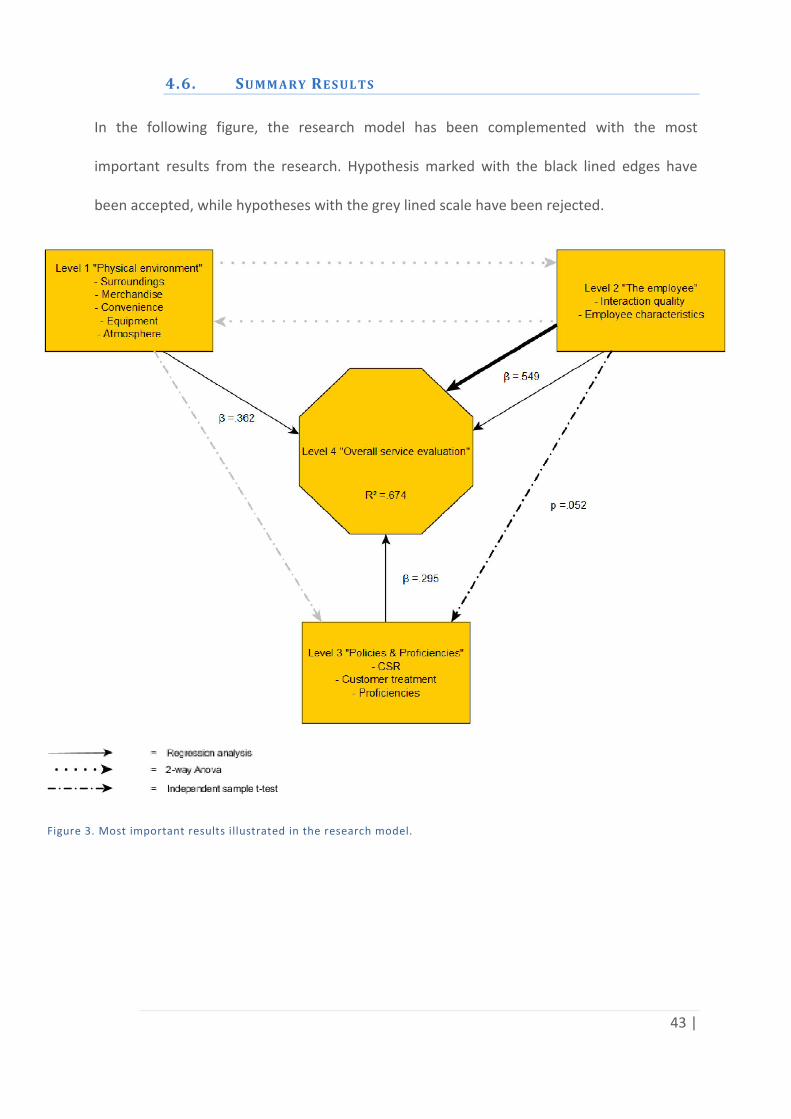
4.6. SUMM ARY RES UL TS
In the following figure, the research model has been complemented with the most
important results from the research. Hypothesis marked with the black lined edges have
been accepted, while hypotheses with the grey lined scale have been rejected.
Figure 3. Most important results illustrated in the research model.

44 |
Chapter 5
‘Discussion’
45 |
5. Discussion
Despite the extensive use of mystery shopping in several industries, researchers have rarely
attempted to test the method on its reliability or validity. Therefore the aim of the study was
to shed more light on the reliability of mystery shopping. This has been accomplished by
studying the weaknesses of the measurement instrument. As discussed earlier the
measurement instrument is the major weakness of the reliability of mystery shopping due to
the fact that it relies on persons. Based on the results of the current study it can be stated
that the reliability of mystery shopping is not restricted by the fact that people tend to
evaluate objects as a whole in order to maintain cognitive consistency (Halo Effect).
However several threats remain worrisome.
5.1. ABSE NCE OF THE HAL O EFFE C T IN SE R VICE EV ALUATI ONS
Based on the results of this study it can be stated that there are no Halo Effects between the
most important service levels: the physical environment and the employee. Nonetheless the
study did indicate a marginally significant effect (p = .052) of Level 2 on Level 3. This result
suggests an interdependency between Level 2 and 3, but no firm conclusions can be drawn.
Therefore further research is advisable in order to provide more insight into the dependency
of Level 3. With the exception of the effect of Level 2 on Level 3 no further
interdependencies have been found between the service levels. Therefore it can be stated
that mystery shoppers are able to evaluate Level 1 and Level 2 individually, in contrast to
previous assumptions drawn from the Halo Effect (Holbrook, 1983). A possible explanation
for this might be that participants of a mystery shopping study are specifically ordered to
evaluate service attributes independently prior to the actual observation. Mystery shoppers
are trained and asked to memorize the questionnaire prior to their visit, in order to focus on
46 |
the service attributes they have to evaluate (Wilson, 2001). This causes a more conscious
observation of individual service attributes by the mystery shoppers, which distinguishes
mystery shopping from customer surveys. Customer surveys do not enable service providers
to reveal bottlenecks, which can be traced back to the Halo Effect. Regular customers solely
form an overall impression, rather than a detailed memory of single service attributes. In
sum, the current study renders support for the fact that the use of mystery shopping is a
valuable addition to customer surveys and that mystery shoppings’ reliability is not
restricted by the Halo Effect. These findings partially contrast with the study of Wirtz (2001),
as discussed in section 2.4. The author managed to prove the influence of the Halo Effect
between attributes of different service levels. The results of Wirtz revealed that the
manipulated attribute “offered payment methods” (Level 3) caused a Halo Effect on three
other attributes: helpfulness of staff (Level 2), knowledgeability of staff (Level 2) and a
marginal effect on the physical environment (Level 1). The current study only found a
marginally significant effect (p = .052) of Level 2 on Level 3, rather than the other way
around.
5.2. COM POSI TION OF THE OVER ALL SER VI CE QUALI TY
The results of this study illustrated that the overall service quality evaluation is based on the
mystery shoppers evaluation of Level 1, 2 and 3. Based on the data it can be concluded that
67.4% of Level 4 can be predicted by those level evaluations. Level 1 predicts 36.2%, Level 2
predicts 54.9% and Level 3 29.5%.
The in section 2.4 discussed studies also found this effect for Level 1 and Level 2 (Kim &
Moon, 2009; Baker, Grewal, & Parasuraman, 1994). However the current study extends
those findings by managing to indicate that also Level 3 is a predictor of Level 4. Strikingly
47 |
was that Level 2 came out to be the most important predictor with more than half of the
predicting value. This confirms the finding of Wall and Berry (2007) that Level 2 is the most
important predictor of overall service quality and makes it possible to extend their findings
from the hospitality industry to the retail industry.
5.3. AC C URACY OF MYS TE R Y SHO PPE RS W HEN ME AS URING FAC TS
Mystery shoppers are expected to measure facts instead of perceptions (Wilson, 2001).
Several researches pointed out that Level 1 attributes measure facts and Level 2 attributes
measure observations based on the mystery shoppers’ interpretation. Level 1 attributes are
therefore considered to be more reliable and free from errors. This is supported by the
recommendations given by Finn and Kayandé (1999), where it has been stated that at least
11 mystery shoppers are needed to measure Level 1 attributes and at least 40 mystery
shoppers are needed to measure Level 2 attributes. However the current study showed
some worrisome outcomes regarding the correct evaluation of objective items. One item in
the measurement instrument asked the respondents to evaluate the following statement
‘the employee wore a name tag’. This item clearly asks for the evaluation of a fact and does
not require any interpretation from the mystery shopper. Exploration of the data revealed
that 87.5% (n = 28) of the respondents in the condition where the employee did wear a
name tag answered correct, 9.4% (n = 3) stated they could not recall and 3.1% (n = 1) of the
respondents gave the wrong answer. Strikingly only 27.9% (n = 7) of the respondents in the
condition where the employee did not wear a name tag answered correct, 9.4% (n = 3)
stated they did not recall and 68.8% (n = 22) gave the wrong answer. Notable is that when
the respondents had to disagree with the item and thus had to evaluate that there was no
name tag the amount of wrong answers was significantly higher than when the respondents
48 |
had to agree with the fact that the employee wore a name tag. A total of four fact measuring
items has been included in the questionnaire and three of those items (including name tag)
were answered significantly more incorrect in the negative condition group. The fourth item
revealed a marginally significant difference. An empirical study in 2006 also found a
worrisome amount of wrong answers given by mystery shoppers when they had to evaluate
items which were not actually present during their visit (Prinsen, Gosselt, Van Hoof, & De
Jong, 2006). Those findings lead to the assumption that either mystery shoppers find it
easier to agree with an item than to disagree and / or they find it hard to evaluate items
which were not present during their visit. This would have a large impact on the reliability of
mystery shopping and further research should address this problem.
5.4. MAN AG ERI AL IM PLIC ATIONS
This research supports the importance of Level 2 service attributes for the overall judgment
of service quality. As mentioned earlier, the regression analysis clearly revealed that the
employee is the most important predictor of respondents judgments about the overall
service quality. This is in line with prior research (Wall & Berry, 2007) and stresses the
importance of the employees in retail service encounters. Service providers should therefore
pay special attention to the training of their employees in order to achieve a satisfactory
overall service quality.
5.5. LIMI TATIONS
This study has some limitations that should be discussed. The service level categorizations
were based on service quality scales and a pretest was executed in order to ensure the
validity of the levels. Nonetheless the current researches’ main goal was to test the
49 |
reliability of mystery shopping and therefore some limitations to the generalized levels
cannot be ruled out. The sample size of the pretest was very small and in order to make a
well‐founded statement about the validity of the levels more research is needed. The second
limitation is the small sample size used in the main study. As the power analyses revealed,
the statistical power for the tests regarding the interdependencies of the service levels were
very low. Therefore the possibility that a second study using a larger sample might find
significant dependencies of the levels cannot be ruled out. In order to empirically prove the
absence of dependencies between the levels with an acceptable amount of statistical power,
80 participants per condition group are necessary, when an effect size of .25 is maintained.
Another limitation of the study is that all respondents were inexperienced mystery shoppers.
Even though each participant took part in a training prior to the research, a bias of their low
level of experience may not be ruled out. Another study using experienced mystery shoppers
might therefore lead to different results.
5.6. SUGG ESTI ONS FO R FUTURE RESE ARC H
Mystery shopping is exposed to several reliability threats. Those threats can take place
during three different stages in the research process: before the visit, during the visit and
after the visit. All three stages offer opportunities for further research regarding the validity
and reliability of mystery shopping. Before the mystery shopping visit, respondents take part
in a training in order to be well informed about predetermined service standards (Wilson,
2001). Those trainings may of course bias the mystery shoppers' evaluation. Empirical
research should test the influences of those trainings on the evaluations of service. During
the mystery shopping visit reliability may be threatened by the complexity of the script.
Additional research should establish some ground rules about the complexity of mystery
50 |
shopping scripts. During the current research the script did not involve a very complex
scenario. However 6% of the respondents did not recall that they had to ask for the
preparation of the hamburger. This biased the data, due to the fact that all these
respondents gave an evaluation about the knowledge level of the vendor even though they
had not managed to test that knowledge. Furthermore the ability of mystery shoppers to
accurately memorize their observations determines the reliability of mystery shopping.
Research revealed that mystery shopping involves three memorizing stages: the encoding
stage, the storage stage and the retrieval stage (Morrison, Colman, & Preston, 1997). At
each stage several influences may bias the memory process of the mystery shopper and
therefore the retrieved data. During the encoding stage physical factors and factors
regarding attention may influence the memory process. Additionally the own personal
experience, prejudices or social pressure may bias what a mystery shopper recalls after his
or her visit and finally the duration of the visit may influence the accuracy of the recall
(Morrison, Colman, & Preston, 1997). Future research should investigate those concerns.
Following the visit, the storage and retrieval stage are delicate points in time for valid data
collection. The storage stage defines the time lying between the actual exposure of
observations and the reporting time. The more time expires the more the memory becomes
reconstructive instead of reproductive (Morrison, Colman, & Preston, 1997). When mystery
shoppers reconstruct their visit, experiences from earlier shop visits may be used in order to
fill memory gaps. Further research should approach this problem and guidelines about the
maximum time between observation and reproduction should be set. Finally during the last
memory stage the reliability of mystery shopping may be restricted. Researchers pointed out
the fact that the format of the questionnaire, which is used to gather the final data, may
frame the observations of the mystery shoppers. Items may be too coarse as well as too
51 |
detailed (Morrison, Colman, & Preston, 1997; Wilson, 2001). Too detailed questions might
encourage mystery shoppers to reconstruct their memory and they might be so detailed that
they are suggestive and thus leading the mystery shopper to a certain answer (Morrison,
Colman, & Preston, 1997). Therefore research should approach this problem in order to
determine the optimal balance between coarse and detailed items. In sum, extensive further
research is needed in order to make a well‐founded statement about the validity and
reliability of mystery shopping as a method to evaluate service quality in retail settings.
5.7. CON CL USIONS
In the following paragraph the conclusions, which can be drawn based on the findings from
this research will be briefly summarized. The study combined the literature regarding
mystery shopping, service quality measurement and the Halo Effect and rendered more
insight into each of those research fields.
Mystery Shopping
The reliability of the method mystery shopping as a tool to measure service quality lacked
academic attention. Due to the current research it can be stated that the reliability of
mystery shopping is not restricted by the Halo Effect. Nonetheless further research is
needed to eliminate the remaining reliability concerns.
Halo Effect
Based on the findings of the current research it can be stated that the Halo Effect may be
prevented. If respondents are pointed at particular attributes, prior to the visit, their
evaluations are more conscious and swap‐over effects between levels of service quality are
eliminated. Therefore respondents seem to overcome the difficulties of handling possible
cognitive inconsistencies in this kind of scenario.
52 |
Service Quality Measurement
The research pointed out that mystery shopping is a valuable addition to customer surveys,
due to its ability to identify weak points in a service delivery process. Regular customers lack
conscious perception of individual service attributes and are therefore only capable to
reproduce an overall impression, which is very likely affected by the Halo Effect. Thus no
conclusions about single service attribute quality should be drawn based on customer
surveys.
5.8. AC KNOWLE DGE MEN TS
This Master Thesis has been the final part of my master program ‘Corporate Communication
Studies’, at the University of Twente. I would like to express my gratitude to some of the
people who made this thesis possible. First of all I would like to thank my research team, my
supervisors Dr. Jordy Gosselt and Dr. Joris van Hoof and my fellow student Sijbrand van der
Tang for their dedicated involvement and our pleasant meetings. Furthermore I would like to
thank the students working at the methodologie winkel for their professional advice on the
statistical issues I faced. Also I would like to thank Wilko and Lina for the time they spent
brainstorming and correcting my thesis and finally thank you to my family and my friends for
their encouraging words and their patience during my less motivated times.

53 |
Bibliography
Al‐allak, B. A., & Bekhet, H. A. (2011). Beyond SERVQUAL: A Paradigm Shift. Australian
Journal of Basic and Applied Sciences, 5(7), 129‐134.
Baker, J., Grewal, D., & Parasuraman, A. (1994). The Influence of Store Environment on
Quality Inferences and Store Image. Journal of the Academy of Marketing Science,
22(4), 328‐339.
Beck, J., & Miao, L. (2003). Mystery Shopping in Lodging Properties as a Measurement of
Service Quality. Journal of Quality Assurance in Hospitality & Tourism, 4(1‐2), 1‐21.
Beckwith, N. E., & Lehmann, D. R. (1975). The Importance of Halo Effects in Multi‐Attribute
Attitude Models. Journal of Marketing Research, 10(3), 265‐275.
Berry, L. L., Carbone, L. P., & Haeckel, S. H. (2002). Managing the Total Customer Experience.
MIT Sloan Management Review, 43(3), 85‐89.
Bitner, M. J. (1992). Servicescapes: The Impact of Physical Surroundings on Customers and
Employees. The Journal of Marketing, 56(2), 57‐71.
Brady, M. K., & Cronin, J. J. (2001). Some New Thoughts on Conceptualizing Perceived
Service Quality: A Hierarchical Approach. The Journal of Marketing, 65(3), 34‐49.
Calvert, P. (2005). It's a Mystery: Mystery Shopping in New Zealand's Public Libraries. Library
Review, 54(1), 24‐35.
Carrillat, F. A., Jaramillo, F., & Mulki, J. P. (2007). The Validity of the SERVQUAL and
SERVPERF Scales: A Meta‐Analytic View of 17 years of Research across Five
Continents. International Journal of Service Industry Management, 18(5), 472‐490.
Chiu, H. C., & Lin, N. P. (2004). A Service Quality Measurement Derived from the Theory of
Needs. The Service Industries Journal, 24(1), 187‐204.
Cronin, J. J., & Taylor, S. A. (1992). Measuring Service Quality: A Reexamination and
Extension. The Journal of Marketing, 58(1), 55‐68.
Dabholkar, P. A., Thorpe, D. I., & Rentz, J. O. (1996). A Measure of Service Quality for Retail
Stores: Scale Development and Validation. Journal of the Academy of Marketing
Science, 24(1), 3‐16.
ESOMAR. (2005). ESOMAR World research codes & guidelines: Mystery Shopping.
Opgeroepen op 3 14, 2013, van
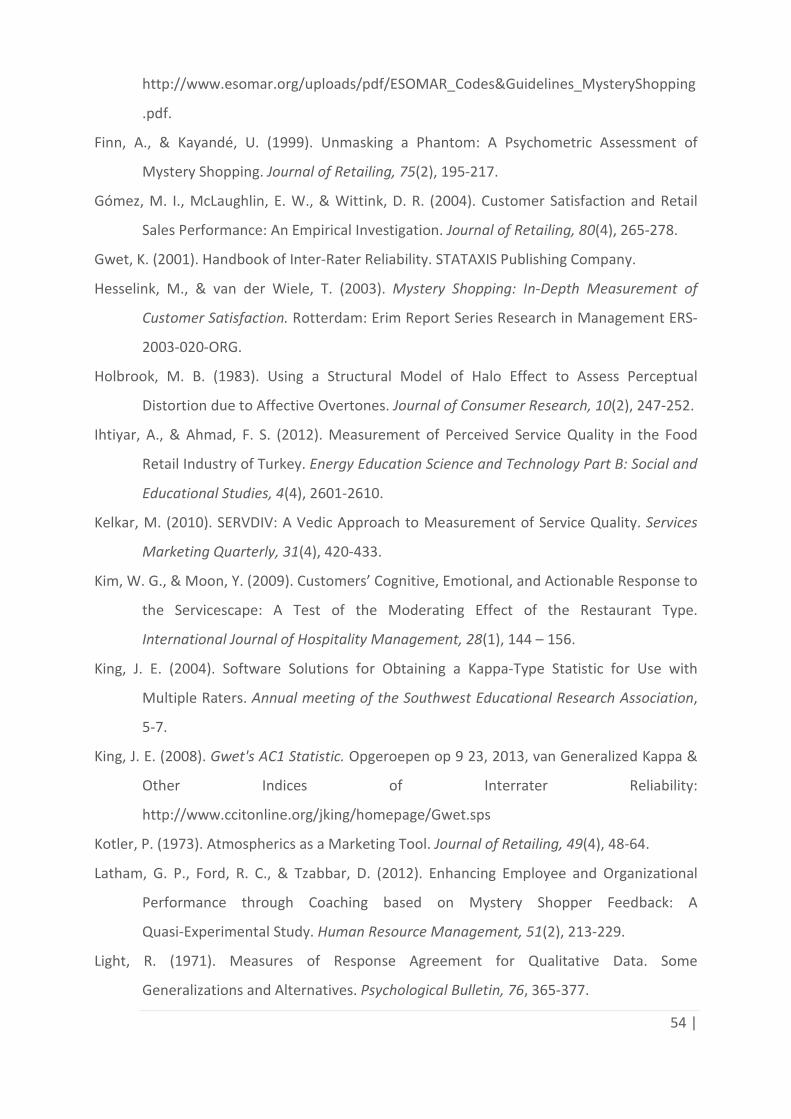
54 |
http://www.esomar.org/uploads/pdf/ESOMAR_Codes&Guidelines_MysteryShopping
.pdf.
Finn, A., & Kayandé, U. (1999). Unmasking a Phantom: A Psychometric Assessment of
Mystery Shopping. Journal of Retailing, 75(2), 195‐217.
Gómez, M. I., McLaughlin, E. W., & Wittink, D. R. (2004). Customer Satisfaction and Retail
Sales Performance: An Empirical Investigation. Journal of Retailing, 80(4), 265‐278.
Gwet, K. (2001). Handbook of Inter‐Rater Reliability. STATAXIS Publishing Company.
Hesselink, M., & van der Wiele, T. (2003). Mystery Shopping: In-Depth Measurement of
Customer Satisfaction. Rotterdam: Erim Report Series Research in Management ERS‐
2003‐020‐ORG.
Holbrook, M. B. (1983). Using a Structural Model of Halo Effect to Assess Perceptual
Distortion due to Affective Overtones. Journal of Consumer Research, 10(2), 247‐252.
Ihtiyar, A., & Ahmad, F. S. (2012). Measurement of Perceived Service Quality in the Food
Retail Industry of Turkey. Energy Education Science and Technology Part B: Social and
Educational Studies, 4(4), 2601‐2610.
Kelkar, M. (2010). SERVDIV: A Vedic Approach to Measurement of Service Quality. Services
Marketing Quarterly, 31(4), 420‐433.
Kim, W. G., & Moon, Y. (2009). Customers’ Cognitive, Emotional, and Actionable Response to
the Servicescape: A Test of the Moderating Effect of the Restaurant Type.
International Journal of Hospitality Management, 28(1), 144 – 156.
King, J. E. (2004). Software Solutions for Obtaining a Kappa‐Type Statistic for Use with
Multiple Raters. Annual meeting of the Southwest Educational Research Association,
5‐7.
King, J. E. (2008). Gwet's AC1 Statistic. Opgeroepen op 9 23, 2013, van Generalized Kappa &
Other Indices of Interrater Reliability:
http://www.ccitonline.org/jking/homepage/Gwet.sps
Kotler, P. (1973). Atmospherics as a Marketing Tool. Journal of Retailing, 49(4), 48‐64.
Latham, G. P., Ford, R. C., & Tzabbar, D. (2012). Enhancing Employee and Organizational
Performance through Coaching based on Mystery Shopper Feedback: A
Quasi‐Experimental Study. Human Resource Management, 51(2), 213‐229.
Light, R. (1971). Measures of Response Agreement for Qualitative Data. Some
Generalizations and Alternatives. Psychological Bulletin, 76, 365‐377.
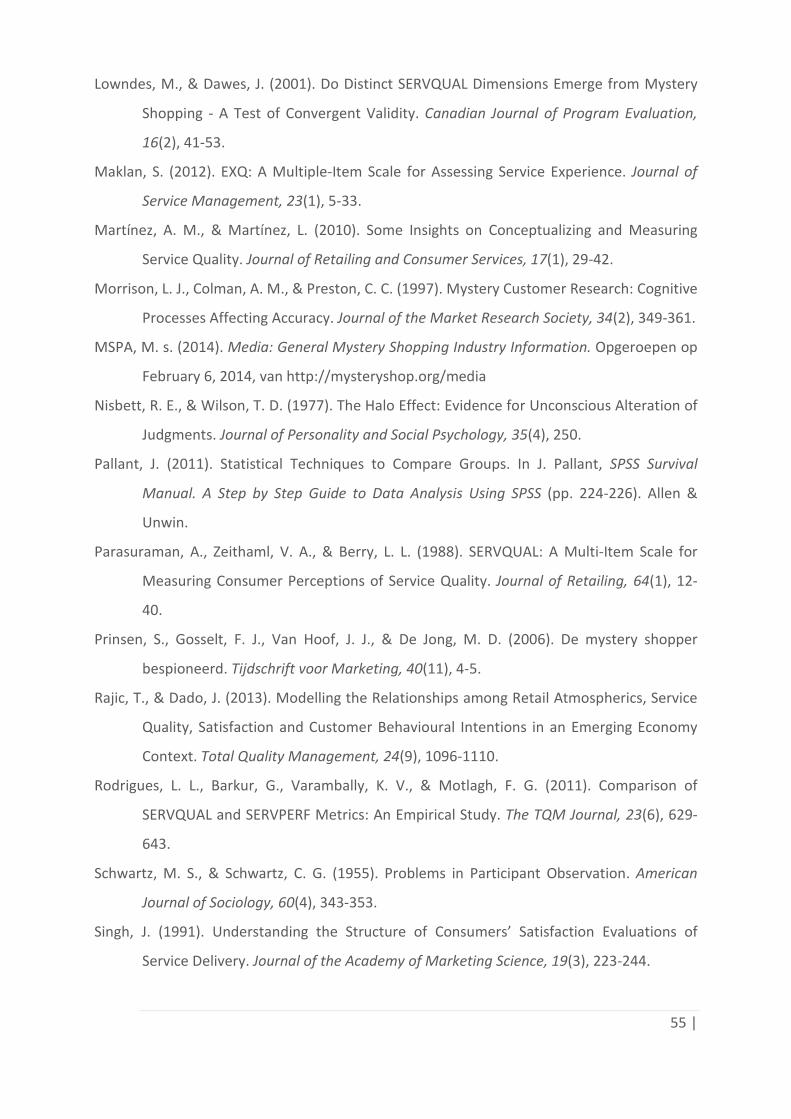
55 |
Lowndes, M., & Dawes, J. (2001). Do Distinct SERVQUAL Dimensions Emerge from Mystery
Shopping ‐ A Test of Convergent Validity. Canadian Journal of Program Evaluation,
16(2), 41‐53.
Maklan, S. (2012). EXQ: A Multiple‐Item Scale for Assessing Service Experience. Journal of
Service Management, 23(1), 5‐33.
Martínez, A. M., & Martínez, L. (2010). Some Insights on Conceptualizing and Measuring
Service Quality. Journal of Retailing and Consumer Services, 17(1), 29‐42.
Morrison, L. J., Colman, A. M., & Preston, C. C. (1997). Mystery Customer Research: Cognitive
Processes Affecting Accuracy. Journal of the Market Research Society, 34(2), 349‐361.
MSPA, M. s. (2014). Media: General Mystery Shopping Industry Information. Opgeroepen op
February 6, 2014, van http://mysteryshop.org/media
Nisbett, R. E., & Wilson, T. D. (1977). The Halo Effect: Evidence for Unconscious Alteration of
Judgments. Journal of Personality and Social Psychology, 35(4), 250.
Pallant, J. (2011). Statistical Techniques to Compare Groups. In J. Pallant, SPSS Survival
Manual. A Step by Step Guide to Data Analysis Using SPSS (pp. 224‐226). Allen &
Unwin.
Parasuraman, A., Zeithaml, V. A., & Berry, L. L. (1988). SERVQUAL: A Multi‐Item Scale for
Measuring Consumer Perceptions of Service Quality. Journal of Retailing, 64(1), 12‐
40.
Prinsen, S., Gosselt, F. J., Van Hoof, J. J., & De Jong, M. D. (2006). De mystery shopper
bespioneerd. Tijdschrift voor Marketing, 40(11), 4‐5.
Rajic, T., & Dado, J. (2013). Modelling the Relationships among Retail Atmospherics, Service
Quality, Satisfaction and Customer Behavioural Intentions in an Emerging Economy
Context. Total Quality Management, 24(9), 1096‐1110.
Rodrigues, L. L., Barkur, G., Varambally, K. V., & Motlagh, F. G. (2011). Comparison of
SERVQUAL and SERVPERF Metrics: An Empirical Study. The TQM Journal, 23(6), 629‐
643.
Schwartz, M. S., & Schwartz, C. G. (1955). Problems in Participant Observation. American
Journal of Sociology, 60(4), 343‐353.
Singh, J. (1991). Understanding the Structure of Consumers’ Satisfaction Evaluations of
Service Delivery. Journal of the Academy of Marketing Science, 19(3), 223‐244.
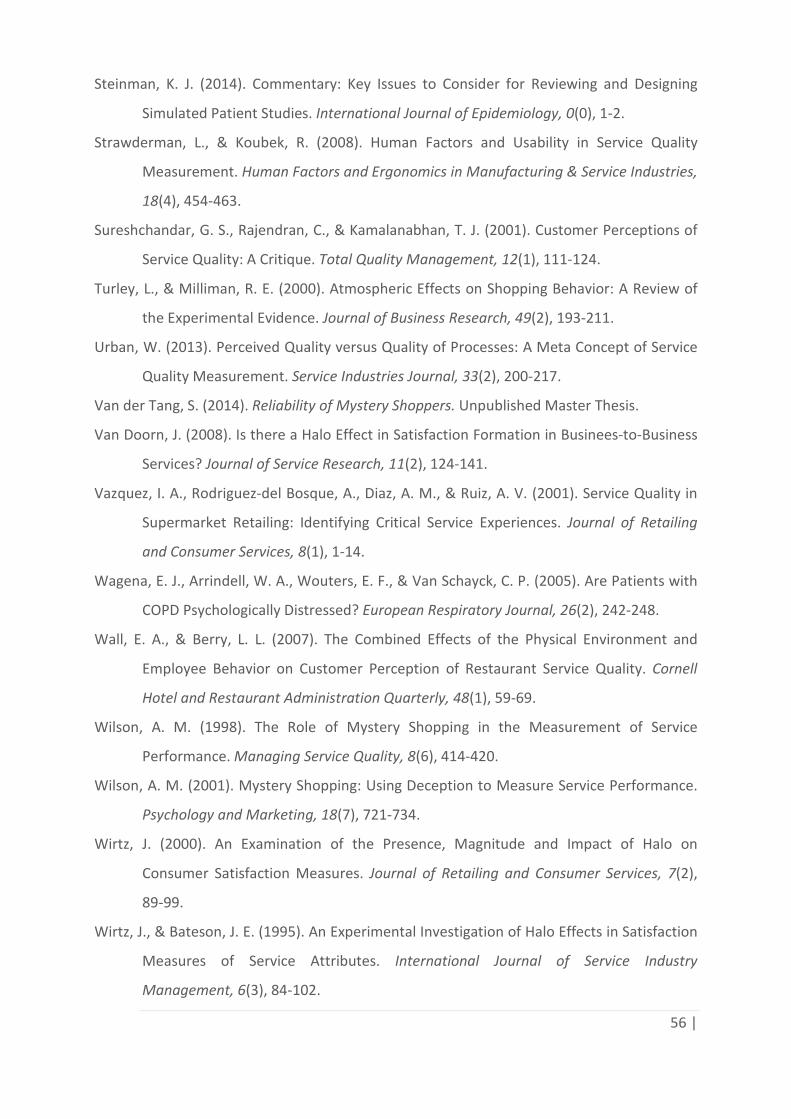
56 |
Steinman, K. J. (2014). Commentary: Key Issues to Consider for Reviewing and Designing
Simulated Patient Studies. International Journal of Epidemiology, 0(0), 1‐2.
Strawderman, L., & Koubek, R. (2008). Human Factors and Usability in Service Quality
Measurement. Human Factors and Ergonomics in Manufacturing & Service Industries,
18(4), 454‐463.
Sureshchandar, G. S., Rajendran, C., & Kamalanabhan, T. J. (2001). Customer Perceptions of
Service Quality: A Critique. Total Quality Management, 12(1), 111‐124.
Turley, L., & Milliman, R. E. (2000). Atmospheric Effects on Shopping Behavior: A Review of
the Experimental Evidence. Journal of Business Research, 49(2), 193‐211.
Urban, W. (2013). Perceived Quality versus Quality of Processes: A Meta Concept of Service
Quality Measurement. Service Industries Journal, 33(2), 200‐217.
Van der Tang, S. (2014). Reliability of Mystery Shoppers. Unpublished Master Thesis.
Van Doorn, J. (2008). Is there a Halo Effect in Satisfaction Formation in Businees‐to‐Business
Services? Journal of Service Research, 11(2), 124‐141.
Vazquez, I. A., Rodriguez‐del Bosque, A., Diaz, A. M., & Ruiz, A. V. (2001). Service Quality in
Supermarket Retailing: Identifying Critical Service Experiences. Journal of Retailing
and Consumer Services, 8(1), 1‐14.
Wagena, E. J., Arrindell, W. A., Wouters, E. F., & Van Schayck, C. P. (2005). Are Patients with
COPD Psychologically Distressed? European Respiratory Journal, 26(2), 242‐248.
Wall, E. A., & Berry, L. L. (2007). The Combined Effects of the Physical Environment and
Employee Behavior on Customer Perception of Restaurant Service Quality. Cornell
Hotel and Restaurant Administration Quarterly, 48(1), 59‐69.
Wilson, A. M. (1998). The Role of Mystery Shopping in the Measurement of Service
Performance. Managing Service Quality, 8(6), 414‐420.
Wilson, A. M. (2001). Mystery Shopping: Using Deception to Measure Service Performance.
Psychology and Marketing, 18(7), 721‐734.
Wirtz, J. (2000). An Examination of the Presence, Magnitude and Impact of Halo on
Consumer Satisfaction Measures. Journal of Retailing and Consumer Services, 7(2),
89‐99.
Wirtz, J., & Bateson, J. E. (1995). An Experimental Investigation of Halo Effects in Satisfaction
Measures of Service Attributes. International Journal of Service Industry
Management, 6(3), 84‐102.
57 |
Wu, B. T., & Petroshius, S. M. (1987). The Halo Effect in Store Image Measurement. Journal
of the Academy of Marketing Science, 15(3), 44‐51.

58 |
‘Appendix’
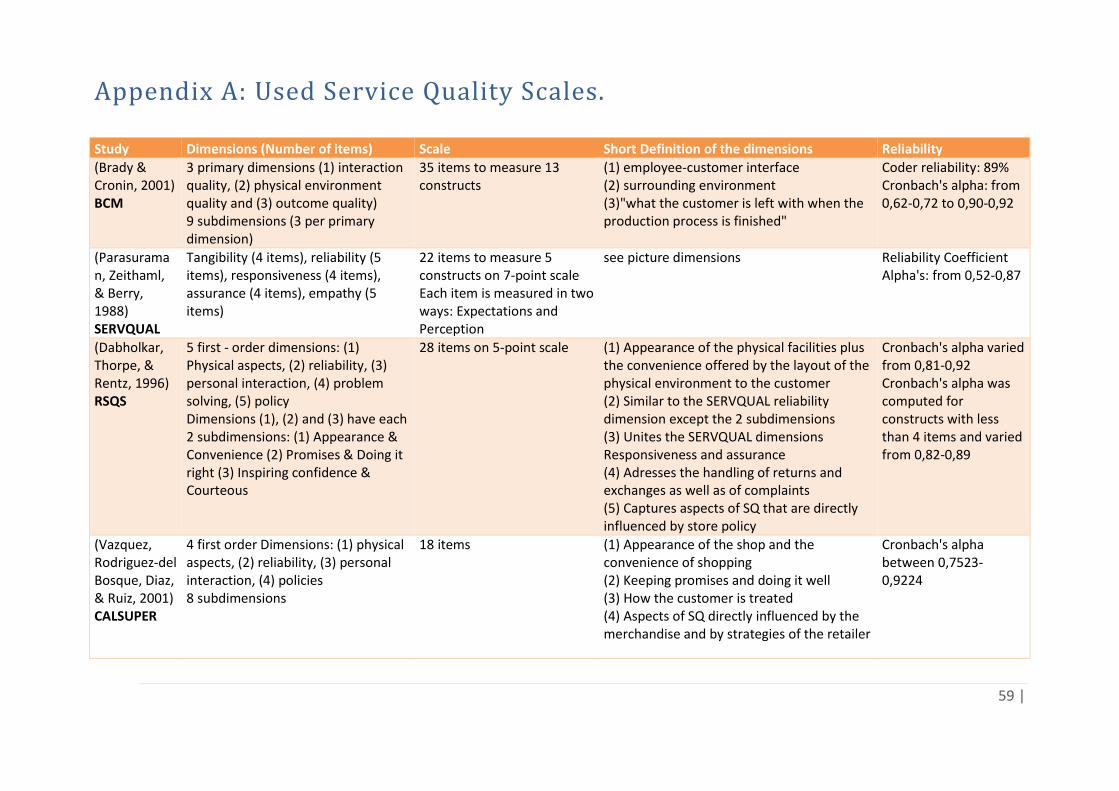
59 |
Appendix A: Used Service Quality Scales.
Study Dimensions (Number of items) Scale Short Definition of the dimensions Reliability
(Brady & Cronin, 2001) BCM
3 primary dimensions (1) interaction quality, (2) physical environment quality and (3) outcome quality) 9 subdimensions (3 per primary dimension)
35 items to measure 13 constructs
(1) employee‐customer interface (2) surrounding environment (3)"what the customer is left with when the production process is finished"
Coder reliability: 89% Cronbach's alpha: from 0,62‐0,72 to 0,90‐0,92
(Parasuraman, Zeithaml, & Berry, 1988) SERVQUAL
Tangibility (4 items), reliability (5 items), responsiveness (4 items), assurance (4 items), empathy (5 items)
22 items to measure 5 constructs on 7‐point scale Each item is measured in two ways: Expectations and Perception
see picture dimensions Reliability Coefficient Alpha's: from 0,52‐0,87
(Dabholkar, Thorpe, & Rentz, 1996) RSQS
5 first ‐ order dimensions: (1) Physical aspects, (2) reliability, (3) personal interaction, (4) problem solving, (5) policy Dimensions (1), (2) and (3) have each 2 subdimensions: (1) Appearance & Convenience (2) Promises & Doing it right (3) Inspiring confidence & Courteous
28 items on 5‐point scale (1) Appearance of the physical facilities plus the convenience offered by the layout of the physical environment to the customer (2) Similar to the SERVQUAL reliability dimension except the 2 subdimensions (3) Unites the SERVQUAL dimensions Responsiveness and assurance (4) Adresses the handling of returns and exchanges as well as of complaints (5) Captures aspects of SQ that are directly influenced by store policy
Cronbach's alpha varied from 0,81‐0,92 Cronbach's alpha was computed for constructs with less than 4 items and varied from 0,82‐0,89
(Vazquez, Rodriguez‐del Bosque, Diaz, & Ruiz, 2001) CALSUPER
4 first order Dimensions: (1) physical aspects, (2) reliability, (3) personal interaction, (4) policies 8 subdimensions
18 items (1) Appearance of the shop and the convenience of shopping (2) Keeping promises and doing it well (3) How the customer is treated (4) Aspects of SQ directly influenced by the merchandise and by strategies of the retailer
Cronbach's alpha between 0,7523‐ 0,9224
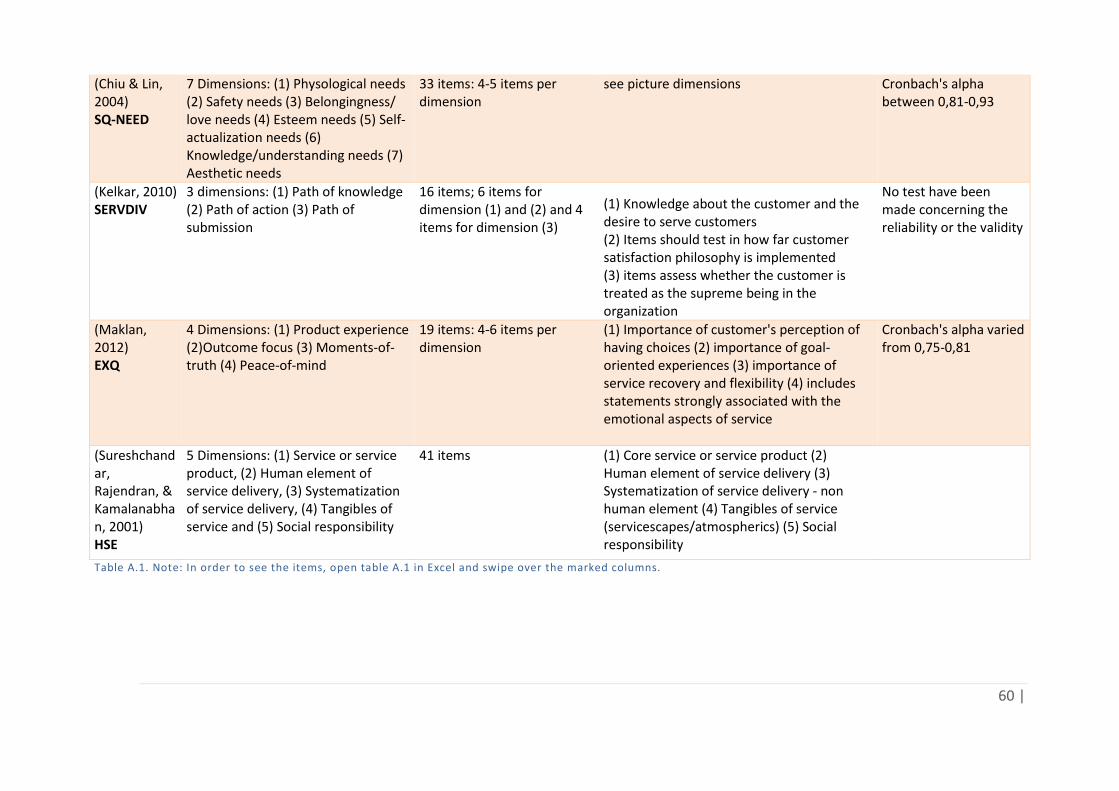
60 |
(Chiu & Lin, 2004) SQ-NEED
7 Dimensions: (1) Physological needs (2) Safety needs (3) Belongingness/ love needs (4) Esteem needs (5) Self‐actualization needs (6) Knowledge/understanding needs (7) Aesthetic needs
33 items: 4‐5 items per dimension
see picture dimensions Cronbach's alpha between 0,81‐0,93
(Kelkar, 2010) SERVDIV
3 dimensions: (1) Path of knowledge (2) Path of action (3) Path of submission
16 items; 6 items for dimension (1) and (2) and 4 items for dimension (3)
(1) Knowledge about the customer and the desire to serve customers (2) Items should test in how far customer satisfaction philosophy is implemented (3) items assess whether the customer is treated as the supreme being in the organization
No test have been made concerning the reliability or the validity
(Maklan, 2012) EXQ
4 Dimensions: (1) Product experience (2)Outcome focus (3) Moments‐of‐truth (4) Peace‐of‐mind
19 items: 4‐6 items per dimension
(1) Importance of customer's perception of having choices (2) importance of goal‐oriented experiences (3) importance of service recovery and flexibility (4) includes statements strongly associated with the emotional aspects of service
Cronbach's alpha varied from 0,75‐0,81
(Sureshchandar, Rajendran, & Kamalanabhan, 2001) HSE
5 Dimensions: (1) Service or service product, (2) Human element of service delivery, (3) Systematization of service delivery, (4) Tangibles of service and (5) Social responsibility
41 items (1) Core service or service product (2) Human element of service delivery (3) Systematization of service delivery ‐ non human element (4) Tangibles of service (servicescapes/atmospherics) (5) Social responsibility
Table A.1. Note: In order to see the items, open table A.1 in Excel and swipe over the marked columns.
61 |
Table 1 is based on the following sources:
Al‐allak, B. A., & Bekhet, H. A. (2011). Beyond SERVQUAL: A Paradigm Shift. Australian
Journal of Basic and Applied Sciences, 5(7), 129‐134.
Brady, M. K., & Cronin Jr, J. J. (2001). Some New Thoughts on Conceptualizing Perceived
Service Quality: A Hierarchical Approach. The Journal of Marketing, 65(3), 34‐49.
Chiu, H. C., & Lin, N. P. (2004). A Service Quality Measurement Derived from the Theory of
Needs. The Service Industries Journal, 24(1), 187‐204.
Cronin Jr, J. J., & Taylor, S. A. (1994). SERVPERF versus SERVQUAL: Reconciling Performance‐
Based and Perceptions‐Minus‐Expectations Measurement of Service Quality. The
Journal of Marketing, 58(1), 125‐131.
Dabholkar, P. A., Thorpe, D. I., & Rentz, J. O. (1996). A Measure of Service Quality for Retail
Stores: Scale Development and Validation. Journal of the Academy of Marketing
Science, 24(1), 3‐16.
Kelkar, M. (2010). SERVDIV: A Vedic Approach to Measurement of Service Quality. Services
Marketing Quarterly, 31(4), 420‐433.
Maklan, S. (2012). EXQ: A Multiple‐Item scale for Assessing Service Experience. Journal of
Service Management, 23(1), 5‐33.
Martínez, J. A., & Martínez, L. (2010). Some Insights on Conceptualizing and Measuring
Service Quality. Journal of Retailing and Consumer Services, 17(1), 29‐42.
Parasuraman, A. L. (1988). SERVQUAL: A Multiple‐Item Scale for Measuring Consumer
Perceptions of Service Quality. Journal of Retailing, 64(1), 12‐40.
Rodrigues, L. L., Barkur, G., Varambally, K. V. M., & Motlagh, F. G. (2011). Comparison of
SERVQUAL and SERVPERF Metrics: An Empirical Study. The TQM Journal, 23(6), 629‐
643.
Sureshchandar, G. S., Rajendran, C., & Kamalanabhan, T. J. (2001). Customer Perceptions of
Service Quality: A Critique. Total Quality Management, 12(1), 111‐124.
Vazquez, R., Rodrıguez‐Del Bosque, I. A., Ma Dıaz, A., & Ruiz, A. V. (2001). Service Quality in
Supermarket Retailing: Identifying Critical Service Experiences. Journal of Retailing
and Consumer Services, 8(1), 1‐14.
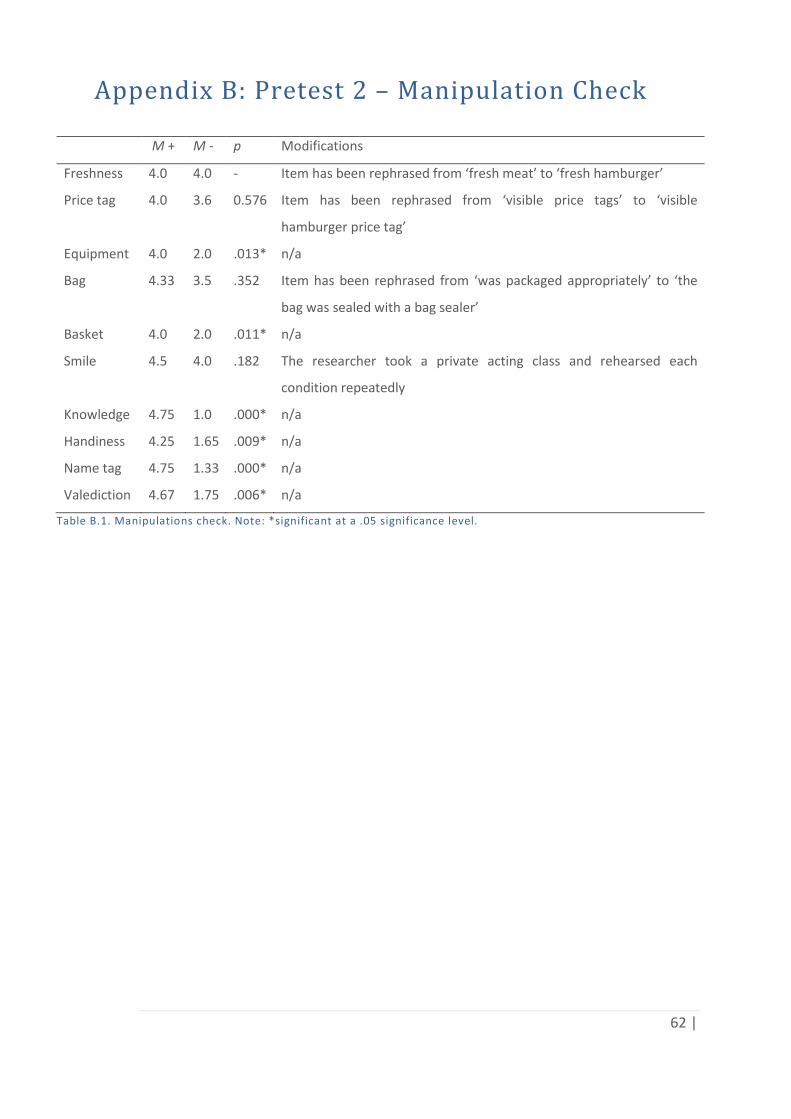
62 |
Appendix B: Pretest 2 – Manipulation Check
M + M ‐ p Modifications
Freshness 4.0 4.0 ‐ Item has been rephrased from ‘fresh meat’ to ‘fresh hamburger’
Price tag 4.0 3.6 0.576 Item has been rephrased from ‘visible price tags’ to ‘visible
hamburger price tag’
Equipment 4.0 2.0 .013* n/a
Bag 4.33 3.5 .352 Item has been rephrased from ‘was packaged appropriately’ to ‘the
bag was sealed with a bag sealer’
Basket 4.0 2.0 .011* n/a
Smile 4.5 4.0 .182 The researcher took a private acting class and rehearsed each
condition repeatedly
Knowledge 4.75 1.0 .000* n/a
Handiness 4.25 1.65 .009* n/a
Name tag 4.75 1.33 .000* n/a
Valediction 4.67 1.75 .006* n/a
Table B.1. Manipulations check. Note: *significant at a .05 significance level.
63 |
Appendix C: Research Booklet
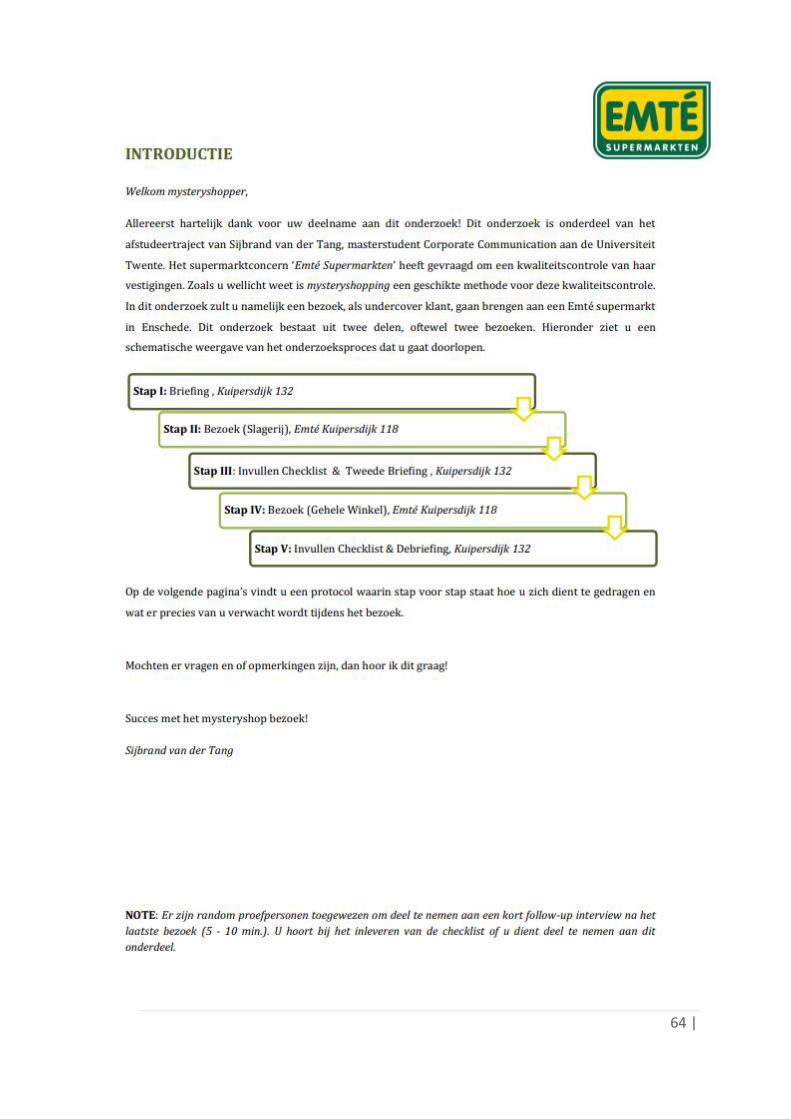
64 |
65 |
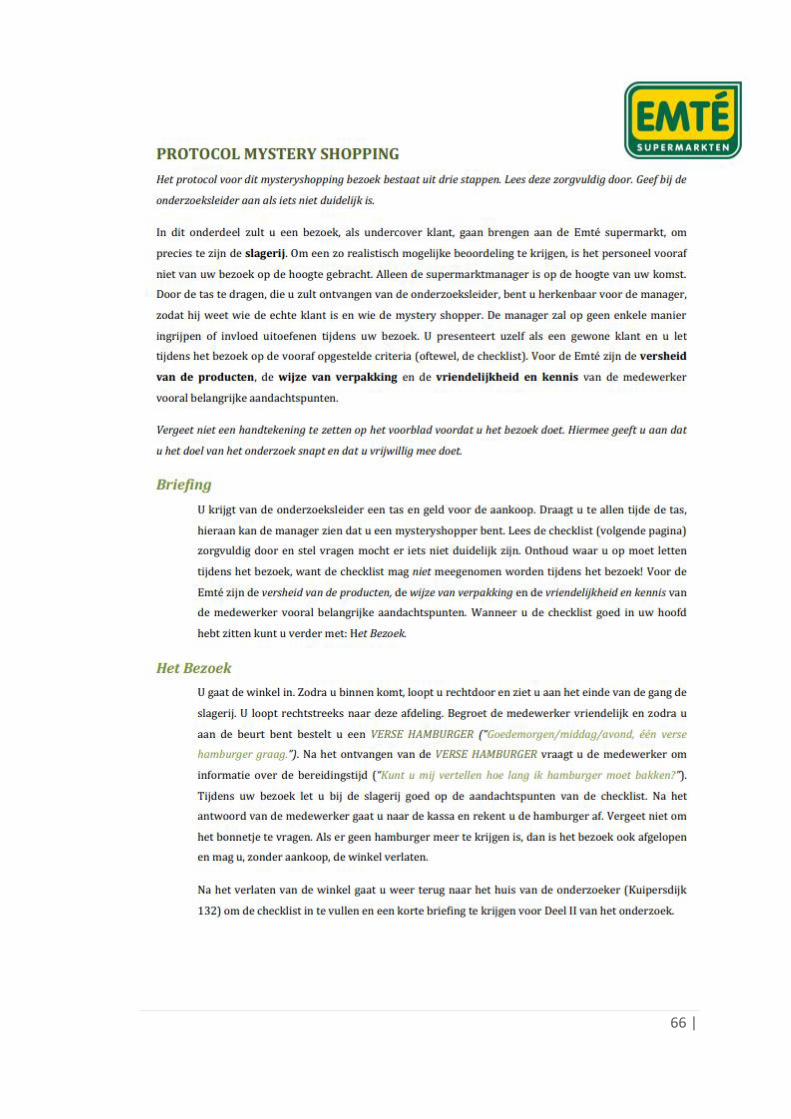
66 |
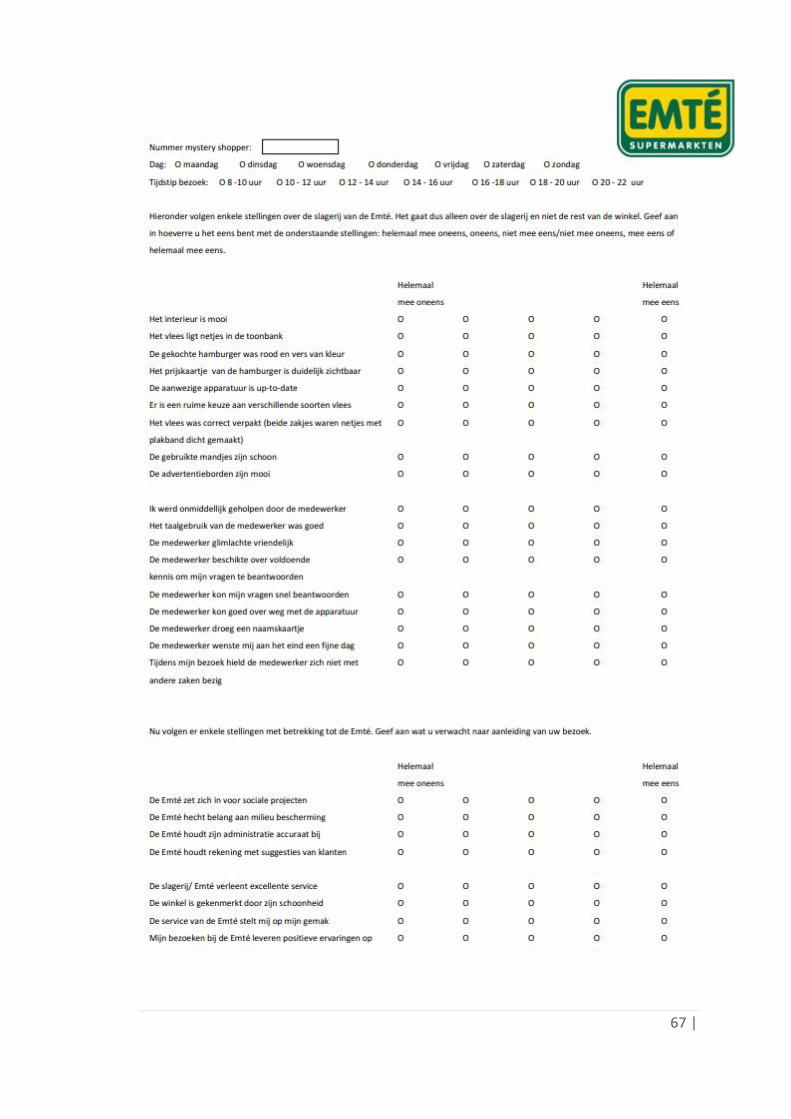
67 |
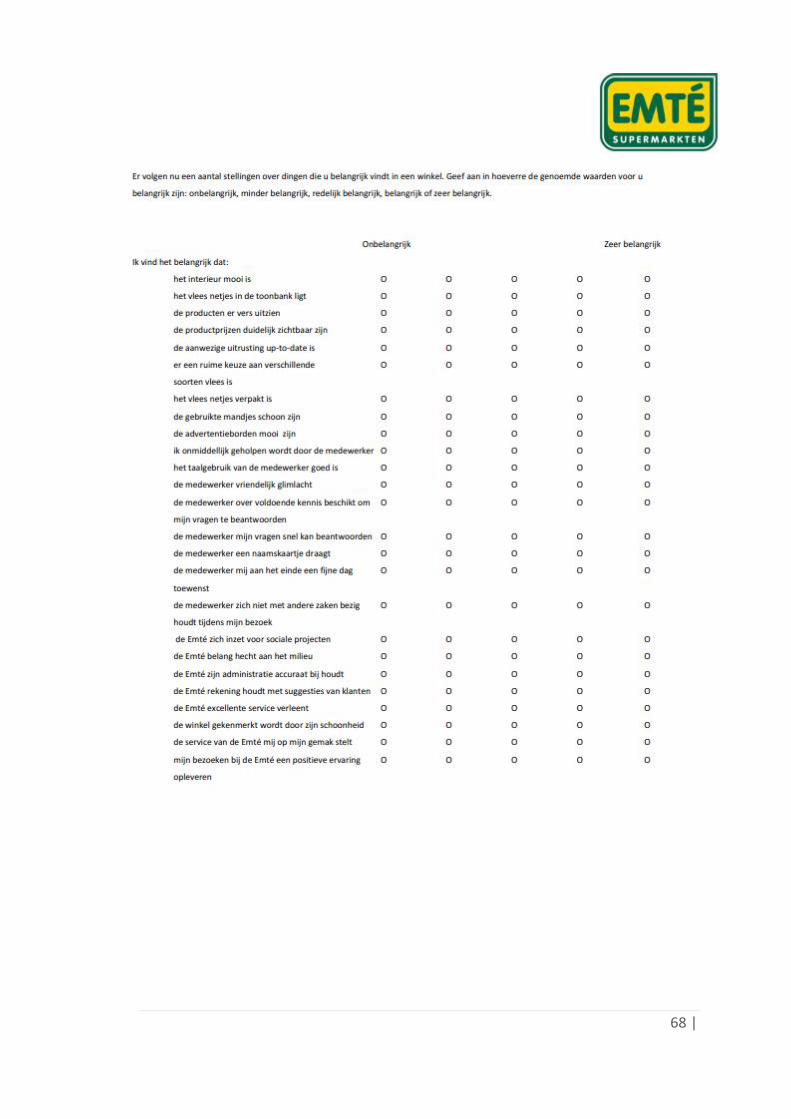
68 |
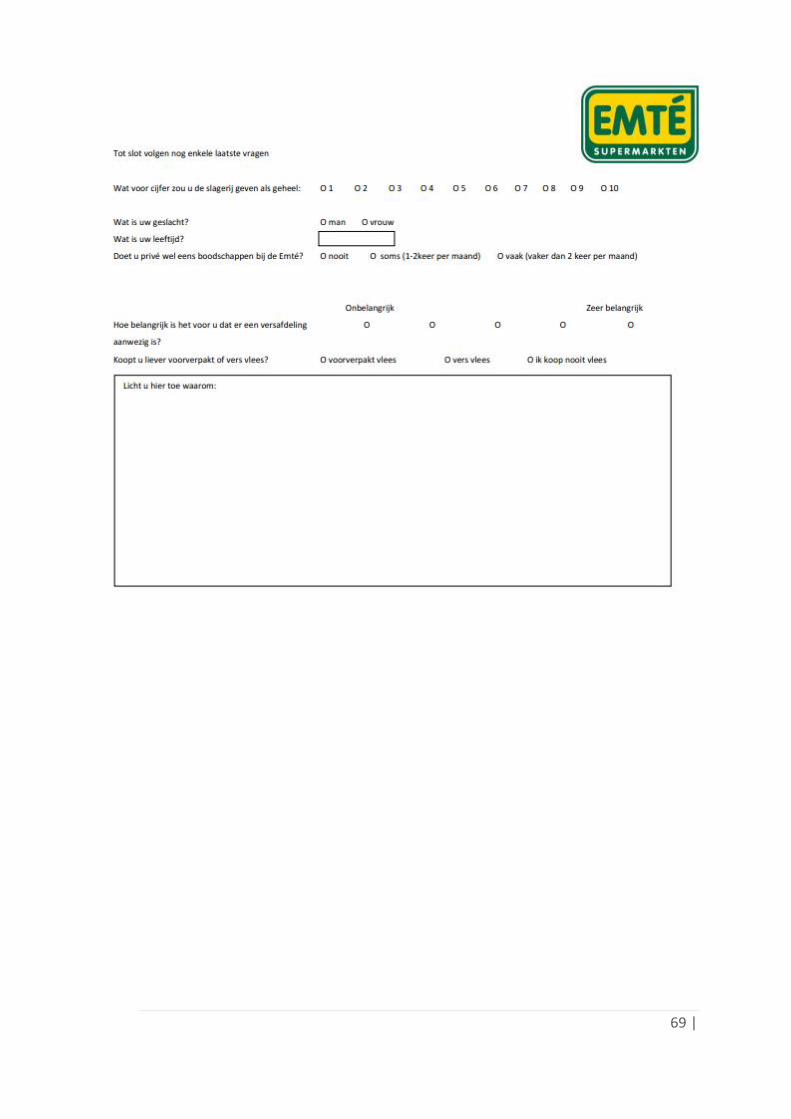
69 |
70 |
Appendix D: Item Selection
As discussed in section 2.1 a literature search on service quality models has been
conducted in order to develop a valid measurement instrument. The literature
search included 7 different service quality scales with a total of 213 items. First
identical items and items which were not considered relevant for the retail
industry were deleted (e.g. “getting a mortgage was really easy”).
Afterwards the pretest, as described in paragraph 3.1, has been carried out with
the remaining 158 items. Items which were assigned to the same service level by
all researchers have been considered most valid and were thus retained. Then
items measuring similar attribute properties were excluded (e.g. if 4 items
measured visual attractiveness of the physical environment only one has been
added to the next step). A total of 62 items remained.
Those items were evaluated based on a rating system in order to calculate a total
score for each item.
The rating scores for Level 1 (N = 15) and Level 2 items (N = 14) were based on the
following criteria. Each criterion had the same weighting factor.
Possibility to manipulate
Level 1 and Level 2 were supposed to be manipulated and thus the
included items needed to hold the possibility of being manipulable;
Controllability
The item must be controllable; in order to guarantee that during every
visit the manipulation was performed in the same way;
Objectivity
71 |
Objective items should be prioritized, due to the fact that objective items
do not require interpretation from the mystery shopper. This
interpretation of observation is a possible limitation to the reliability
(Prinsen, Gosselt, Van Hoof, & De Jong, 2006);
Applicability in the service setting
The item must be applicable to the butchery service setting;
Pretest match
As mentioned earlier items which were assigned to the same service level
by all researchers were considered most valid.
Level 3 (N = 18) and 4 (N = 15) items were not manipulated. Furthermore those
items are always based on interpretations of the mystery shopper and can thus
not be objective. Therefore, the scores for Level 3 and 4 were only based on the
last two criteria (applicability in the service setting and pretest match).
Finally the number of items included in the instrument for each level was
determined based on the following criteria:
Average number of items in mystery shopping research
The length of the questionnaire is crucial for the reliability of the data, due
to fact that mystery shoppers have to memorize their observations until
after the visit (Morrison, Colman, & Preston, 1997; Wilson, 1998). The
average number of used items is 40 (Van der Tang, 2014). Thus a
questionnaire of approximately 40 items is considered to be desirable;
Level 1 and Level 2 were measured with twice the amount of items
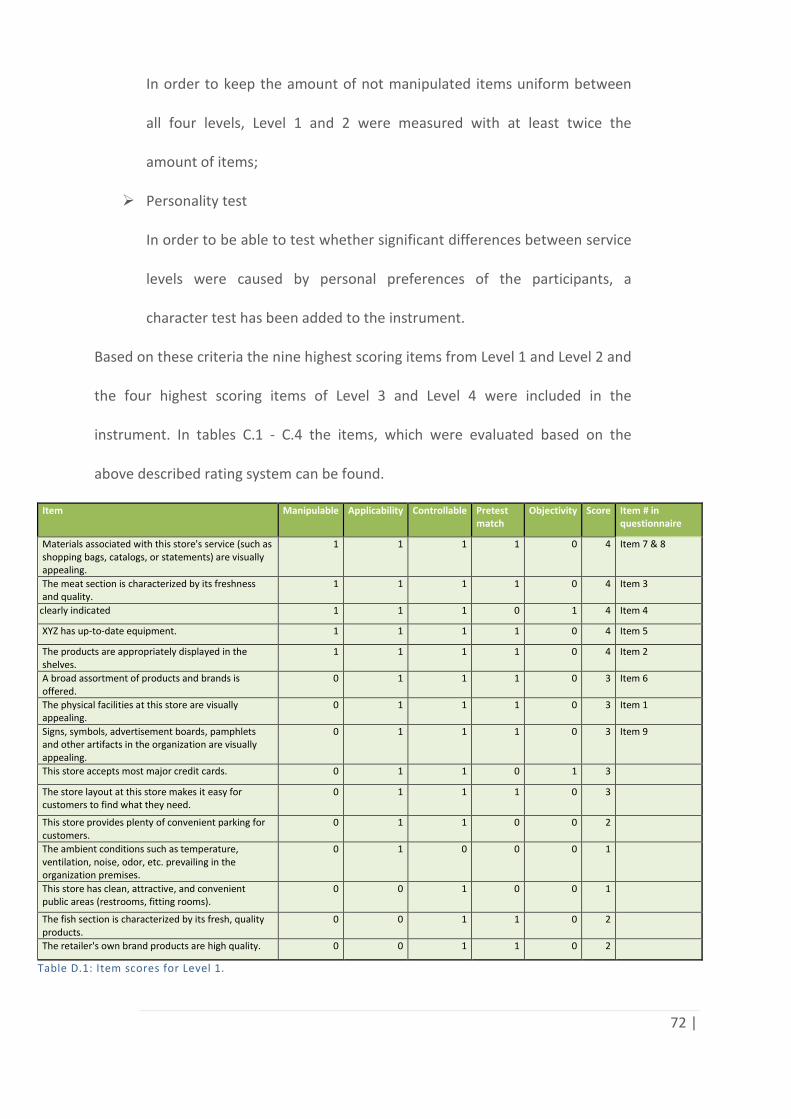
72 |
In order to keep the amount of not manipulated items uniform between
all four levels, Level 1 and 2 were measured with at least twice the
amount of items;
Personality test
In order to be able to test whether significant differences between service
levels were caused by personal preferences of the participants, a
character test has been added to the instrument.
Based on these criteria the nine highest scoring items from Level 1 and Level 2 and
the four highest scoring items of Level 3 and Level 4 were included in the
instrument. In tables C.1 ‐ C.4 the items, which were evaluated based on the
above described rating system can be found.
Item Manipulable Applicability Controllable Pretest match
Objectivity Score Item # in questionnaire
Materials associated with this store's service (such as shopping bags, catalogs, or statements) are visually appealing.
1 1 1 1 0 4 Item 7 & 8
The meat section is characterized by its freshness and quality.
1 1 1 1 0 4 Item 3
Prices are clearly indicated 1 1 1 0 1 4 Item 4
XYZ has up‐to‐date equipment. 1 1 1 1 0 4 Item 5
The products are appropriately displayed in the shelves.
1 1 1 1 0 4 Item 2
A broad assortment of products and brands is offered.
0 1 1 1 0 3 Item 6
The physical facilities at this store are visually appealing.
0 1 1 1 0 3 Item 1
Signs, symbols, advertisement boards, pamphlets and other artifacts in the organization are visually appealing.
0 1 1 1 0 3 Item 9
This store accepts most major credit cards. 0 1 1 0 1 3
The store layout at this store makes it easy for customers to find what they need.
0 1 1 1 0 3
This store provides plenty of convenient parking for customers.
0 1 1 0 0 2
The ambient conditions such as temperature, ventilation, noise, odor, etc. prevailing in the organization premises.
0 1 0 0 0 1
This store has clean, attractive, and convenient public areas (restrooms, fitting rooms).
0 0 1 0 0 1
The fish section is characterized by its fresh, quality products.
0 0 1 1 0 2
The retailer's own brand products are high quality. 0 0 1 1 0 2
Table D.1: Item scores for Level 1.
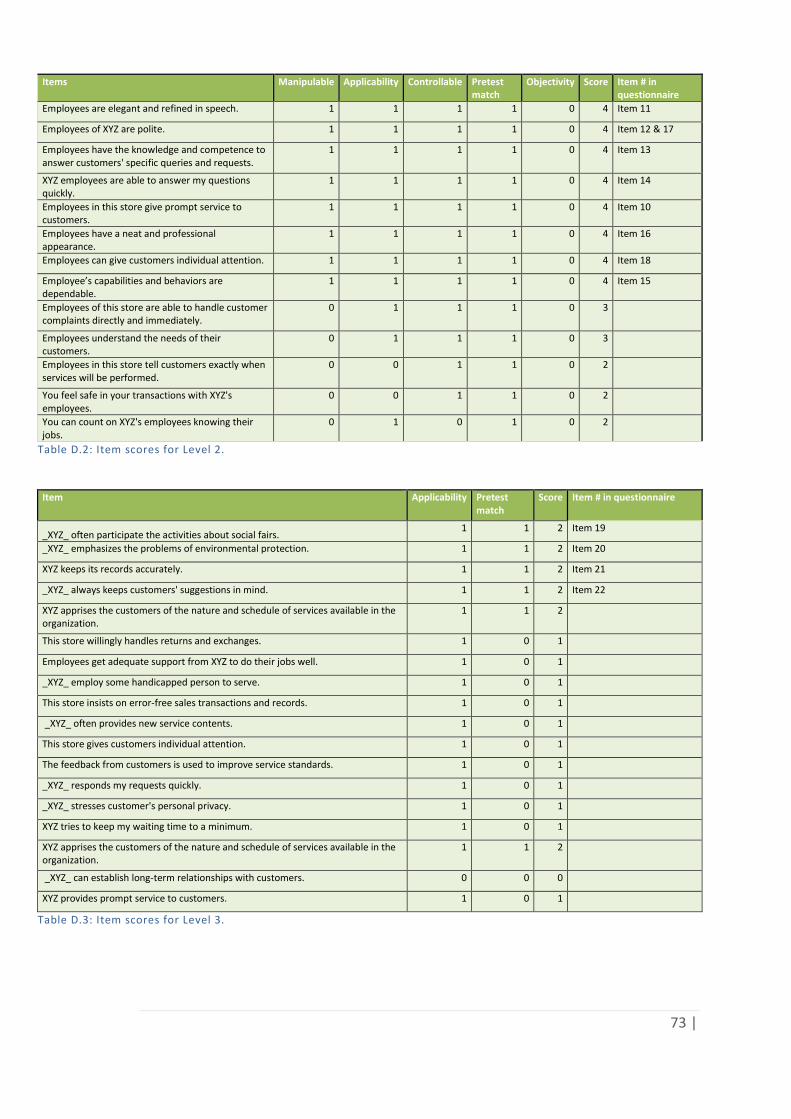
73 |
Items Manipulable Applicability Controllable Pretest match
Objectivity Score Item # in questionnaire
Employees are elegant and refined in speech. 1 1 1 1 0 4 Item 11
Employees of XYZ are polite. 1 1 1 1 0 4 Item 12 & 17
Employees have the knowledge and competence to answer customers' specific queries and requests.
1 1 1 1 0 4 Item 13
XYZ employees are able to answer my questions quickly.
1 1 1 1 0 4 Item 14
Employees in this store give prompt service to customers.
1 1 1 1 0 4 Item 10
Employees have a neat and professional appearance.
1 1 1 1 0 4 Item 16
Employees can give customers individual attention. 1 1 1 1 0 4 Item 18
Employee’s capabilities and behaviors are dependable.
1 1 1 1 0 4 Item 15
Employees of this store are able to handle customer complaints directly and immediately.
0 1 1 1 0 3
Employees understand the needs of their customers.
0 1 1 1 0 3
Employees in this store tell customers exactly when services will be performed.
0 0 1 1 0 2
You feel safe in your transactions with XYZ's employees.
0 0 1 1 0 2
You can count on XYZ's employees knowing their jobs.
0 1 0 1 0 2
Table D.2: Item scores for Level 2.
Item Applicability Pretest
match Score Item # in questionnaire
_XYZ_ often participate the activities about social fairs. 1 1 2 Item 19
_XYZ_ emphasizes the problems of environmental protection. 1 1 2 Item 20
XYZ keeps its records accurately. 1 1 2 Item 21
_XYZ_ always keeps customers' suggestions in mind. 1 1 2 Item 22
XYZ apprises the customers of the nature and schedule of services available in the organization.
1 1 2
This store willingly handles returns and exchanges. 1 0 1
Employees get adequate support from XYZ to do their jobs well. 1 0 1
_XYZ_ employ some handicapped person to serve. 1 0 1
This store insists on error‐free sales transactions and records. 1 0 1
_XYZ_ often provides new service contents. 1 0 1
This store gives customers individual attention. 1 0 1
The feedback from customers is used to improve service standards. 1 0 1
_XYZ_ responds my requests quickly. 1 0 1
_XYZ_ stresses customer's personal privacy. 1 0 1
XYZ tries to keep my waiting time to a minimum. 1 0 1
XYZ apprises the customers of the nature and schedule of services available in the organization.
1 1 2
_XYZ_ can establish long‐term relationships with customers. 0 0 0
XYZ provides prompt service to customers. 1 0 1
Table D.3: Item scores for Level 3.
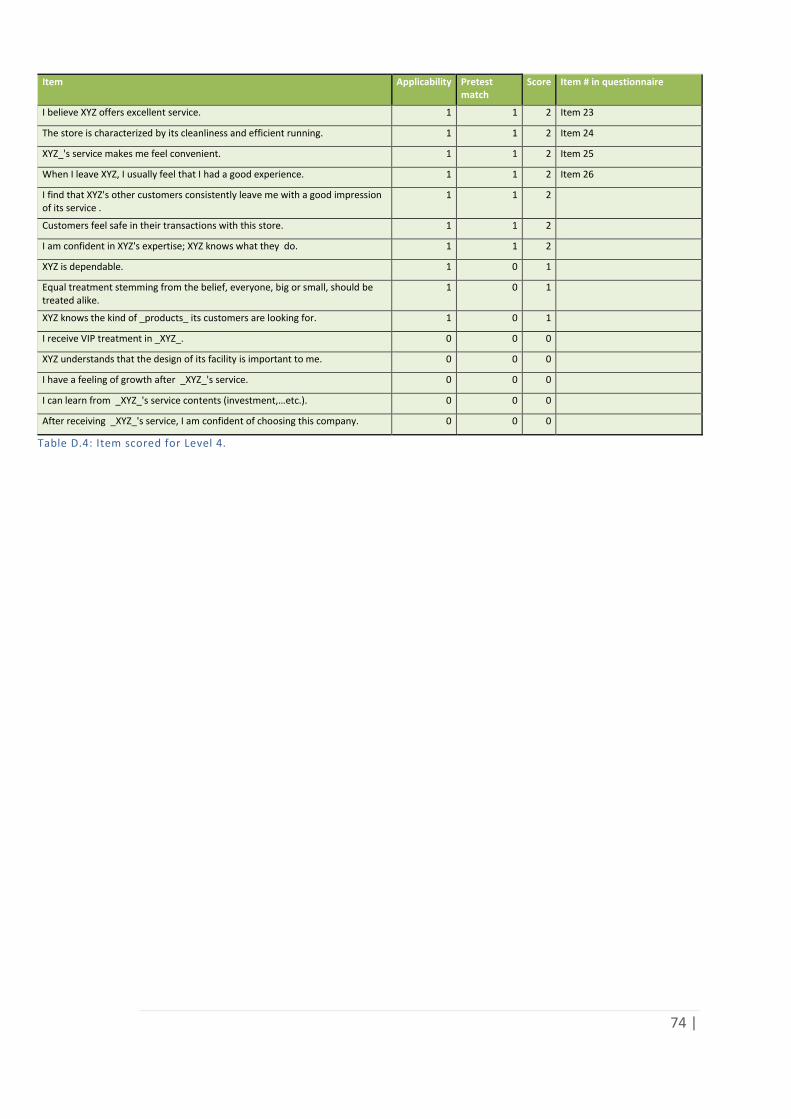
74 |
Item Applicability Pretest match
Score Item # in questionnaire
I believe XYZ offers excellent service. 1 1 2 Item 23
The store is characterized by its cleanliness and efficient running. 1 1 2 Item 24
XYZ_'s service makes me feel convenient. 1 1 2 Item 25
When I leave XYZ, I usually feel that I had a good experience. 1 1 2 Item 26
I find that XYZ's other customers consistently leave me with a good impression of its service .
1 1 2
Customers feel safe in their transactions with this store. 1 1 2
I am confident in XYZ's expertise; XYZ knows what they do. 1 1 2
XYZ is dependable. 1 0 1
Equal treatment stemming from the belief, everyone, big or small, should be treated alike.
1 0 1
XYZ knows the kind of _products_ its customers are looking for. 1 0 1
I receive VIP treatment in _XYZ_. 0 0 0
XYZ understands that the design of its facility is important to me. 0 0 0
I have a feeling of growth after _XYZ_'s service. 0 0 0
I can learn from _XYZ_'s service contents (investment,…etc.). 0 0 0
After receiving _XYZ_'s service, I am confident of choosing this company. 0 0 0
Table D.4: Item scored for Level 4.

75 |
Appendix E: Data Set