Scorecard And Dashboard And Metrics Oh My! - fmi*igf … · linked to TM1 •Inability to ... and...
62
Scorecard And Dashboard And Metrics ... Oh My! FMI PD Week 2012
-
Upload
dinhkhuong -
Category
Documents
-
view
221 -
download
0
Transcript of Scorecard And Dashboard And Metrics Oh My! - fmi*igf … · linked to TM1 •Inability to ... and...
Scorecard And Dashboard And Metrics ... Oh My! FMI PD Week 2012
Today’s presenters
Panelists:
Mario Malouin, Vice-President and Chief Financial Officer, Canadian Air
Transport Security Authority (CATSA)
Jean-Paul Lemieux, Director, Trade Commissioner Service (TCS) Planning and
Client Service Support Division, Department of Foreign Affairs and International
Trade Canada
Facilitators:
Cathy Green, Senior Managing Consultant, Strategy and Transformation, IBM
Canada
Liz Geiger, Associate Partner, Business Analytics and Optimization, Canadian
Public Sector and Health Market, IBM Canada
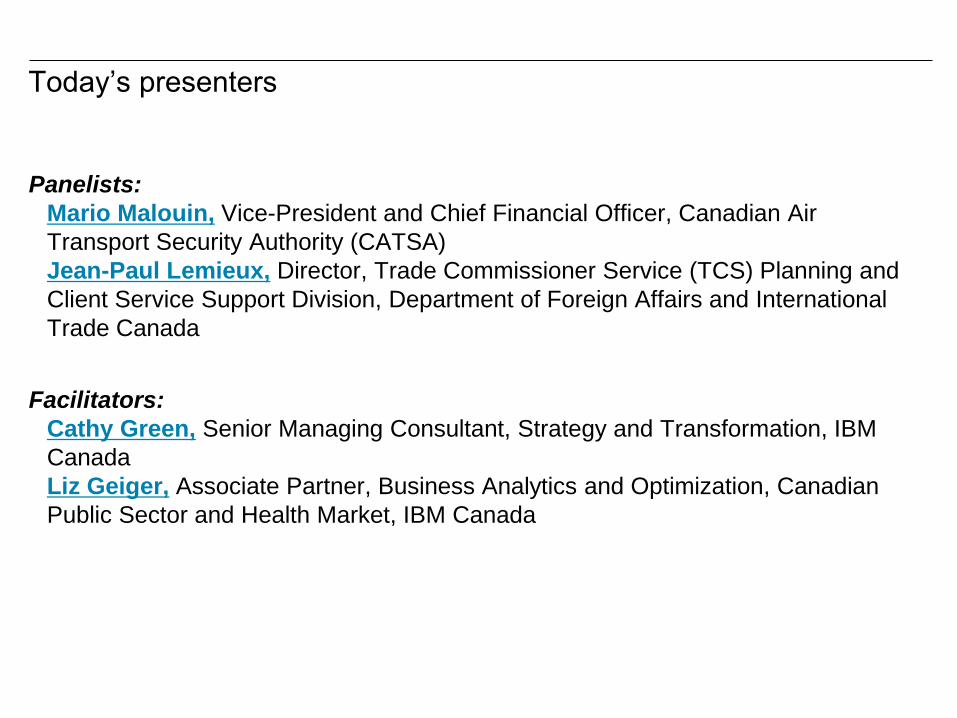
Governments are increasingly turning to performance information to deliver smarter outcomes What if …
Transportation and logistics
…could improve traffic flows and
reduce wait times and emissions?
Programs and services delivery …could predict current and future needs of citizens and design programs accordingly?
Program management …could gain critical insights to manage and maximize resources—people, capital and processes?
Central agencies and parliamentarians …could see how every tax dollar is spent?
Budgeting and finance …could have real-time insights into program budgets across jurisdictions to reduce spending responsibly?
Law enforcement …could have insights to beat
criminals to the scene?
Human resources …could attract and retain top-
performing employees by understanding drivers behind employee satisfaction?
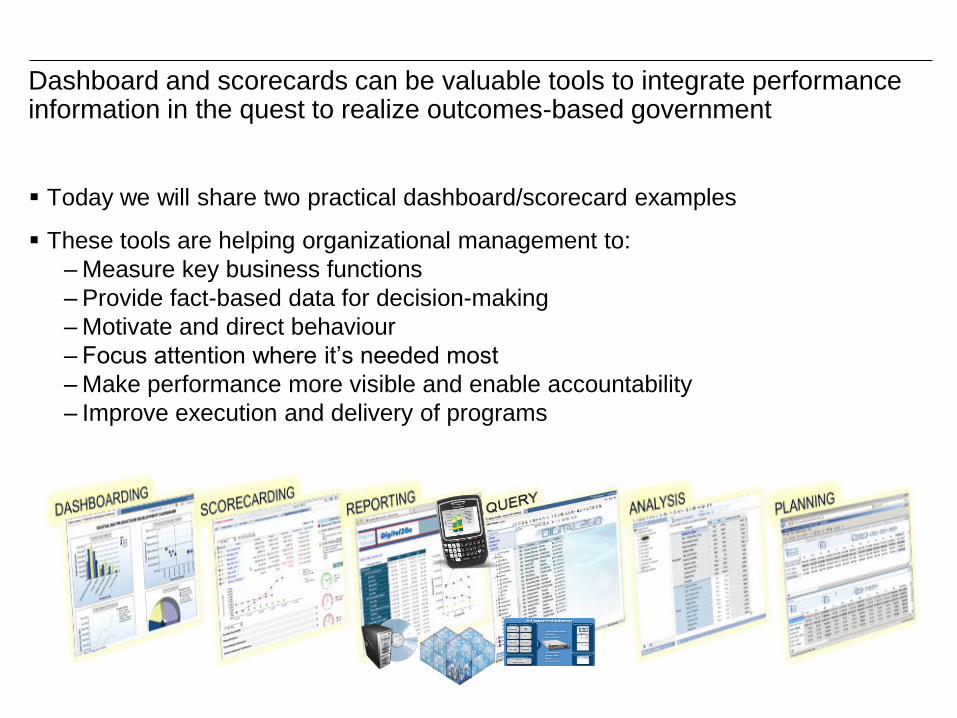
Dashboard and scorecards can be valuable tools to integrate performance information in the quest to realize outcomes-based government
Today we will share two practical dashboard/scorecard examples
These tools are helping organizational management to:
– Measure key business functions
– Provide fact-based data for decision-making
– Motivate and direct behaviour
– Focus attention where it’s needed most
– Make performance more visible and enable accountability
– Improve execution and delivery of programs
Agenda
CATSA – Operating in a Volatile, Uncertain, Complex and Ambiguous (VUCA)
World (25 minutes)
DFAIT – Performance Measurement Initiatives in Support of DFAIT's
Commercial Program (25 minutes)
Questions and Panel Discussion (20 minutes)
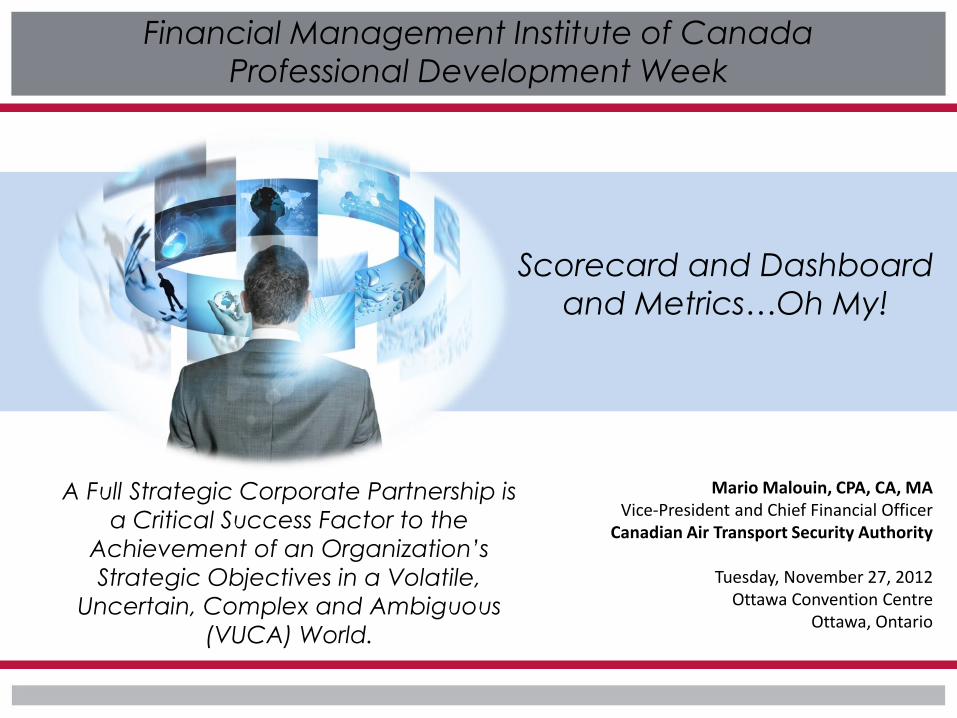
Mario Malouin, CPA, CA, MA Vice-President and Chief Financial Officer
Canadian Air Transport Security Authority
Tuesday, November 27, 2012 Ottawa Convention Centre
Ottawa, Ontario
Scorecard and Dashboard
and Metrics…Oh My!
A Full Strategic Corporate Partnership is
a Critical Success Factor to the
Achievement of an Organization’s
Strategic Objectives in a Volatile,
Uncertain, Complex and Ambiguous
(VUCA) World.
Financial Management Institute of Canada
Professional Development Week
7
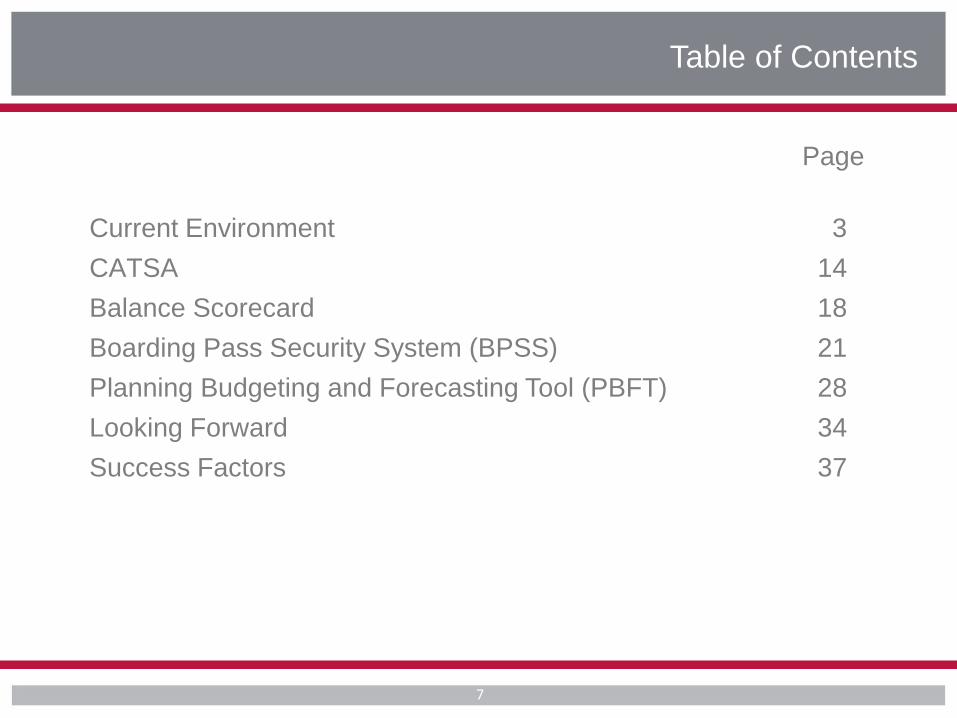
Table of Contents
Page
Current Environment 3
CATSA 14
Balance Scorecard 18
Boarding Pass Security System (BPSS) 21
Planning Budgeting and Forecasting Tool (PBFT) 28
Looking Forward 34
Success Factors 37
8
Current Environment
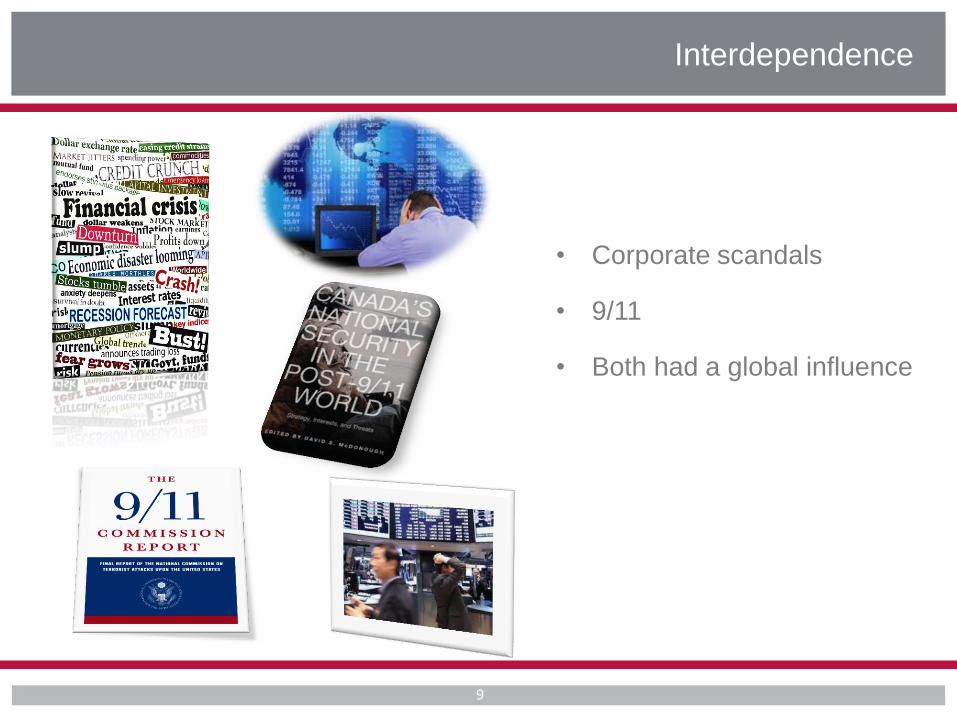
• Corporate scandals
• 9/11
• Both had a global influence
Interdependence
9
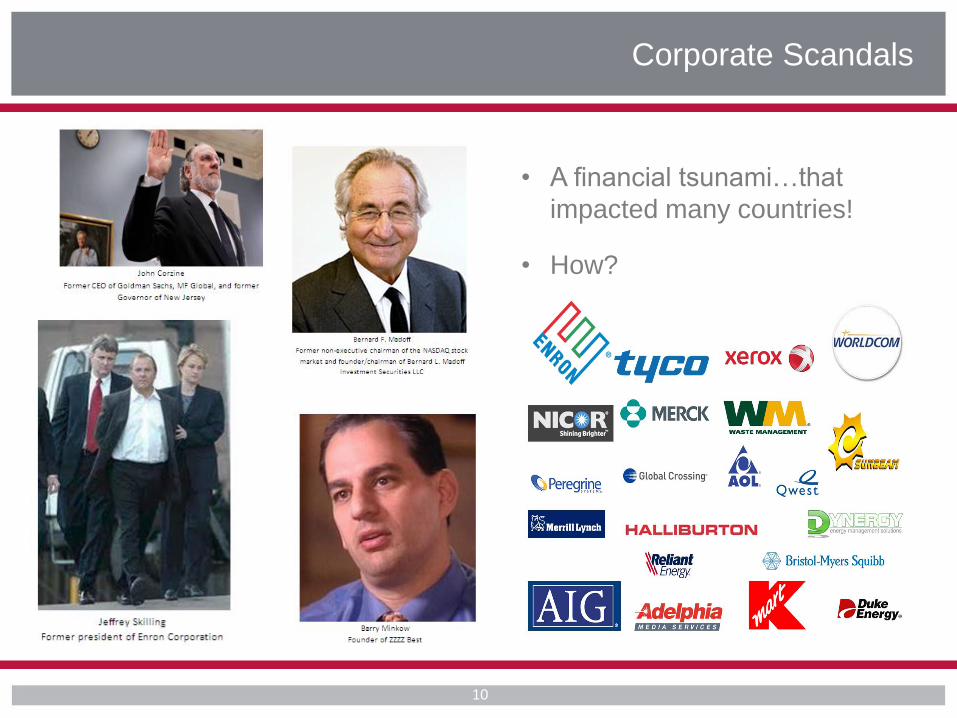
• A financial tsunami…that
impacted many countries!
• How?
Corporate Scandals
10
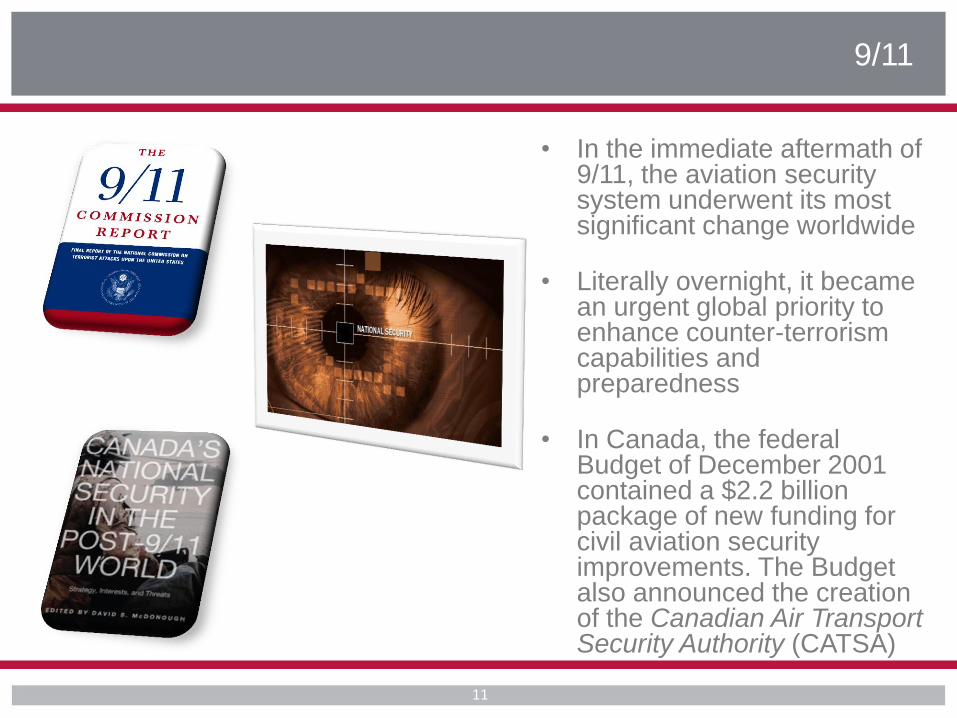
• In the immediate aftermath of 9/11, the aviation security system underwent its most significant change worldwide
• Literally overnight, it became an urgent global priority to enhance counter-terrorism capabilities and preparedness
• In Canada, the federal Budget of December 2001 contained a $2.2 billion package of new funding for civil aviation security improvements. The Budget also announced the creation of the Canadian Air Transport Security Authority (CATSA)
9/11
11
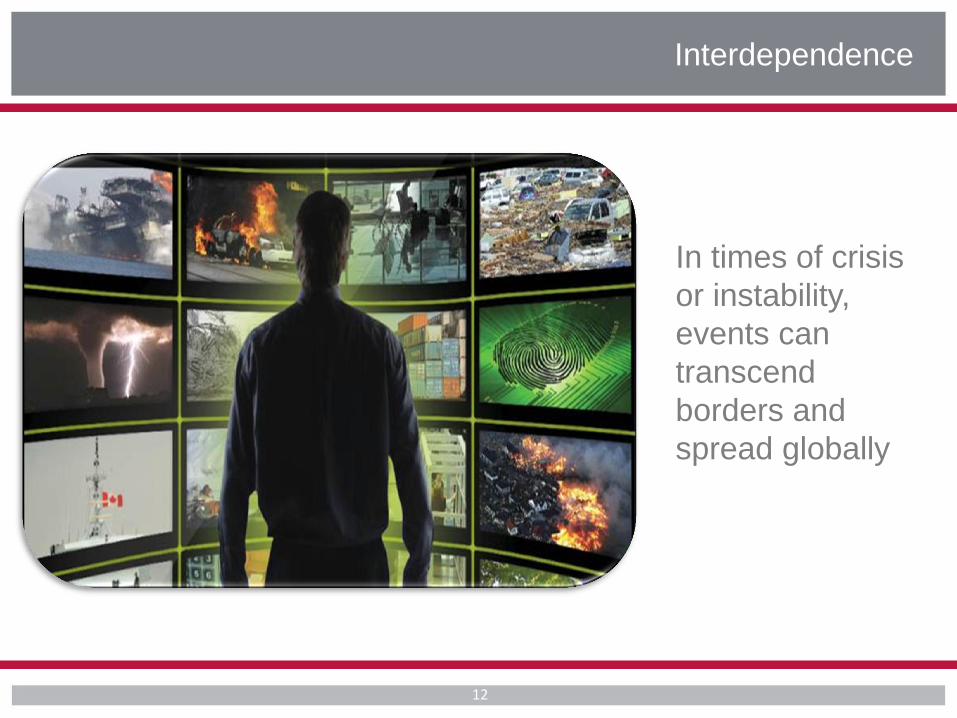
In times of crisis
or instability,
events can
transcend
borders and
spread globally
12
Interdependence
• Strong interdependence creates a
VUCA world
• In a VUCA world, top leaders are
faced with dilemmas that have no
solutions and yet they are still
required to make sound decisions
• Traditional leadership skills aren’t
enough
13
VUCA
Since we live in a VUCA world
in which financial resources are
more and more limited, CFOs
and finance function must
adapt. But how?
Adaptation
14
"The task of leadership is
to create an alignment of
strengths, making our
weaknesses irrelevant." - Peter Drucker
15
Alignment
• To guide a company, CFOs should be in tune with the markets, and
able to give early warning signals to the organization, and help the
organization think through how to adjust quickly enough to market
signals
• The Finance function should be a visionary in the business and not
just a storyteller
Alignment
16
"Growing complexity, talent
scarcity, and technology deficits
are most likely to put the finance
function’s effectiveness at risk."
CFO Research Services and
KPMG 2012 Global CFOs on
the Art of Constructive Change
17

18
19
CATSA
20
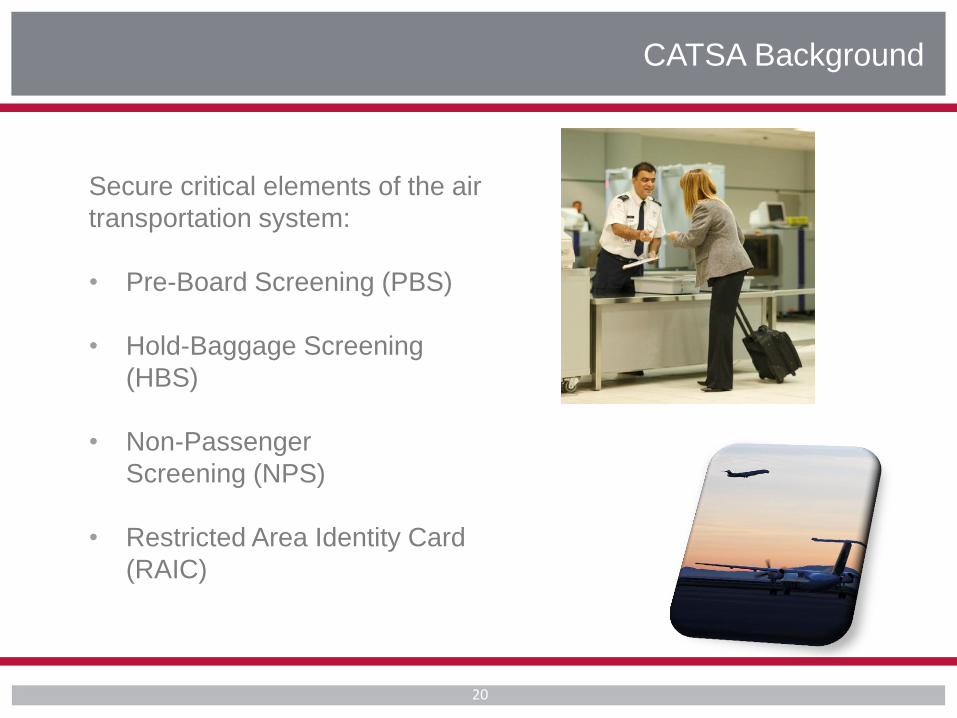
Secure critical elements of the air
transportation system:
• Pre-Board Screening (PBS)
• Hold-Baggage Screening
(HBS)
• Non-Passenger
Screening (NPS)
• Restricted Area Identity Card
(RAIC)
CATSA Background
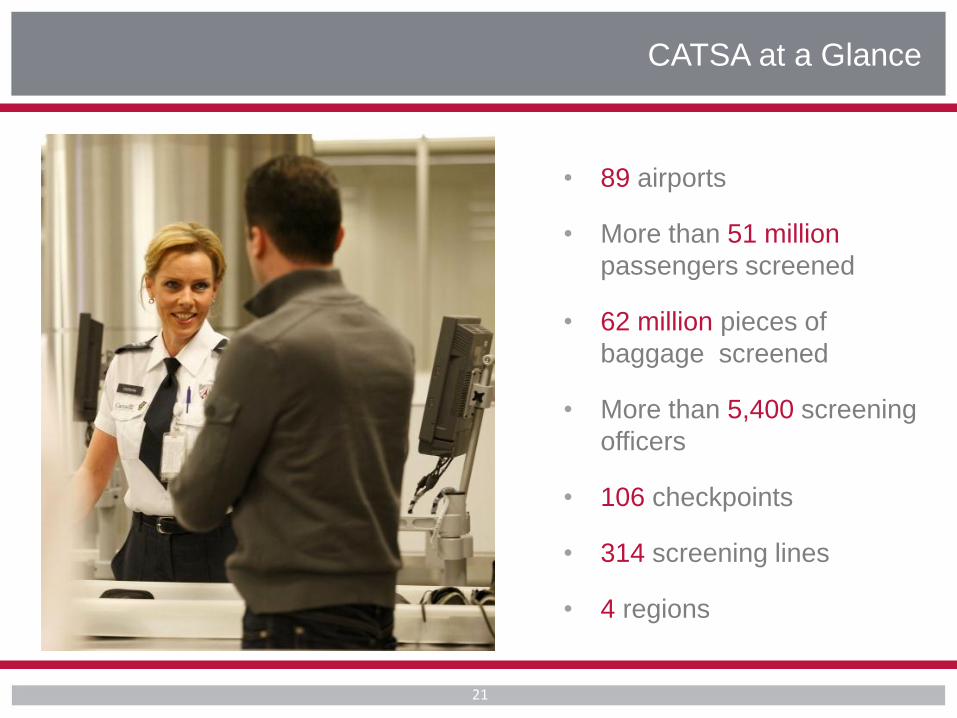
21
• 89 airports
• More than 51 million
passengers screened
• 62 million pieces of
baggage screened
• More than 5,400 screening
officers
• 106 checkpoints
• 314 screening lines
• 4 regions
CATSA at a Glance
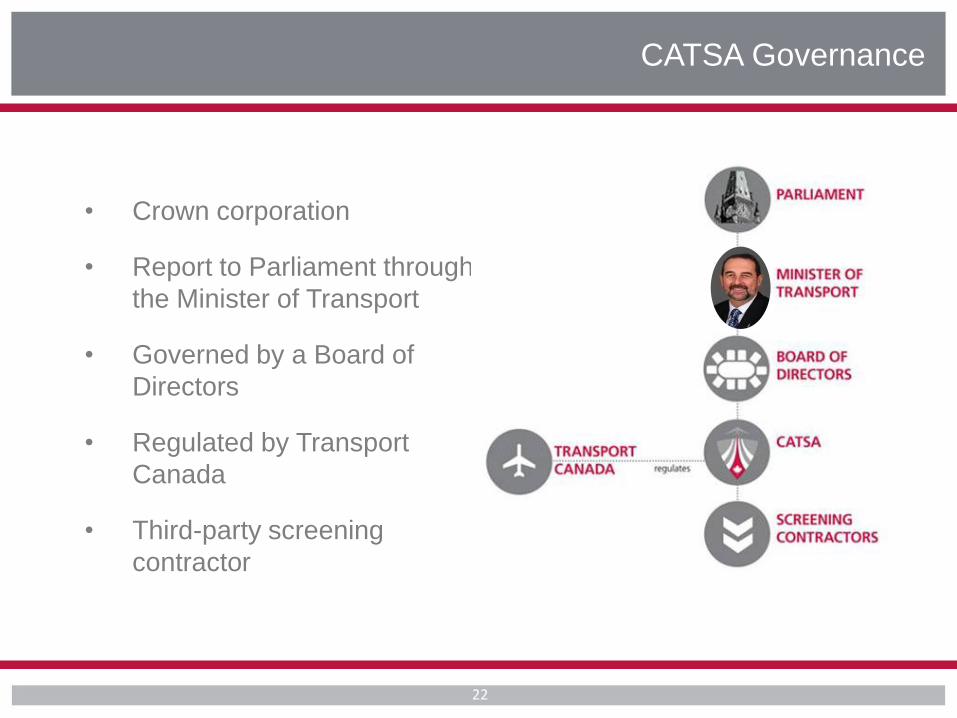
22
• Crown corporation
• Report to Parliament through
the Minister of Transport
• Governed by a Board of
Directors
• Regulated by Transport
Canada
• Third-party screening
contractor
CATSA Governance
23
Balance Scorecard
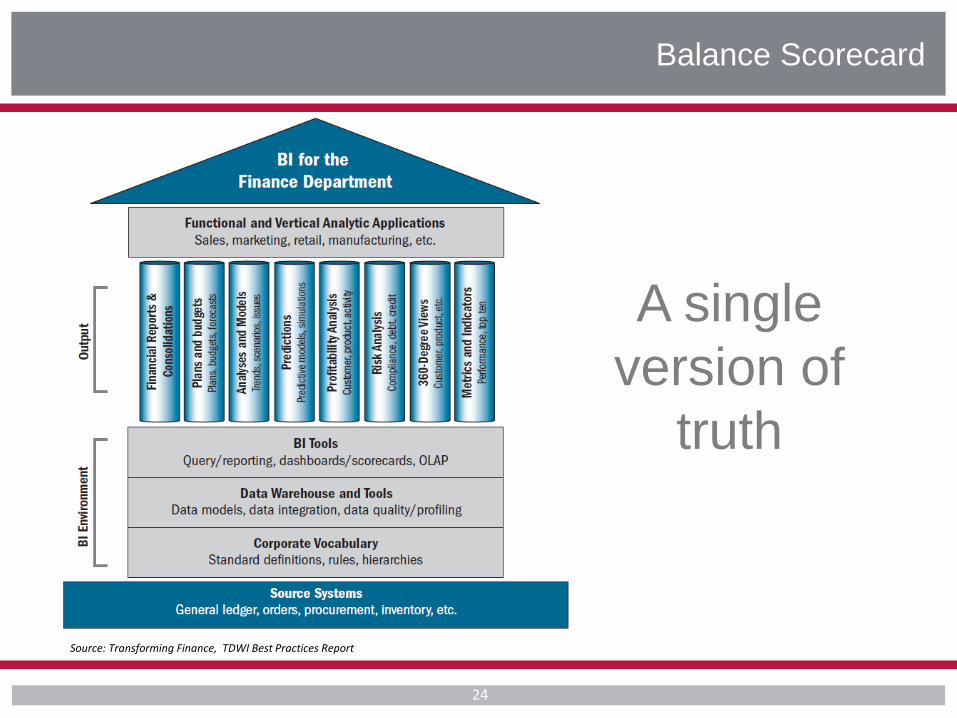
A single
version of
truth
Balance Scorecard
Source: Transforming Finance, TDWI Best Practices Report
24
25
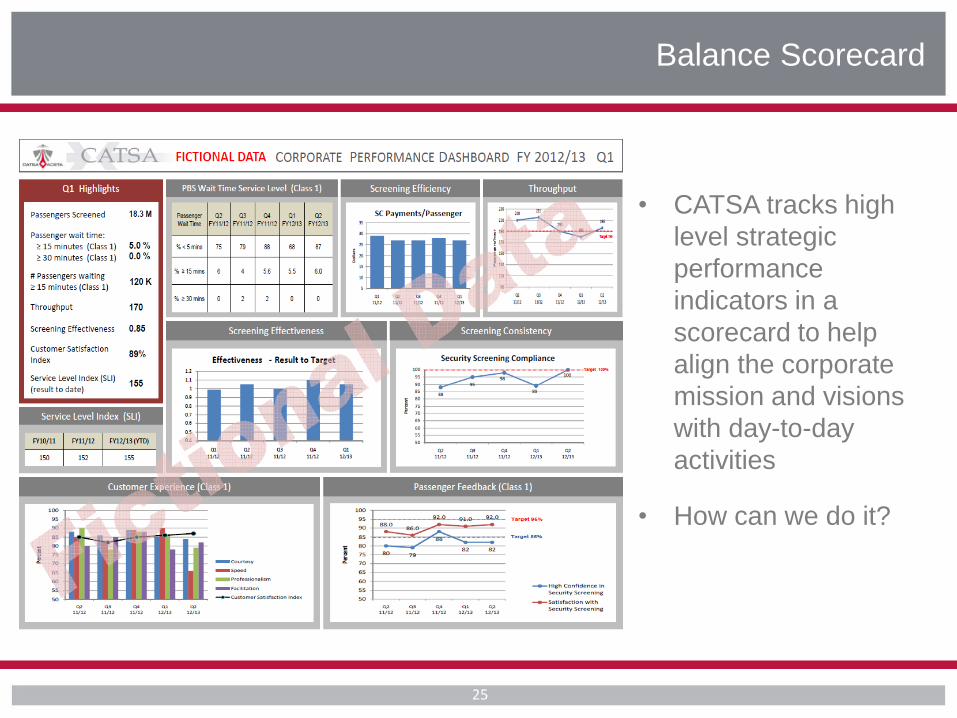
Balance Scorecard
• CATSA tracks high
level strategic
performance
indicators in a
scorecard to help
align the corporate
mission and visions
with day-to-day
activities
• How can we do it?
26
Boarding Pass Security System (BPSS)
27
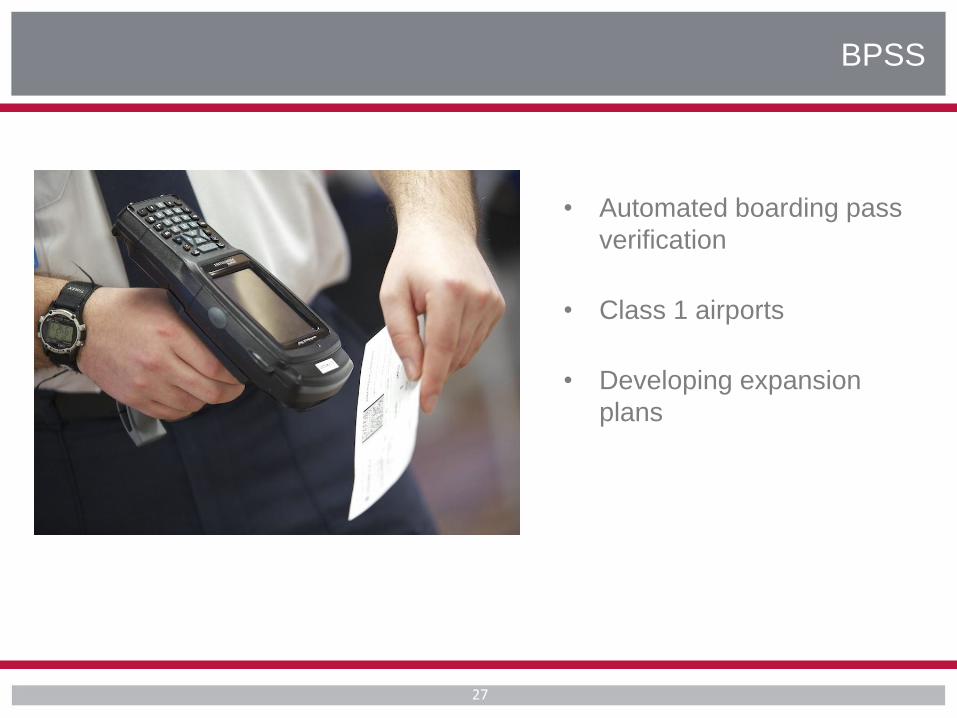
• Automated boarding pass
verification
• Class 1 airports
• Developing expansion
plans
BPSS
28
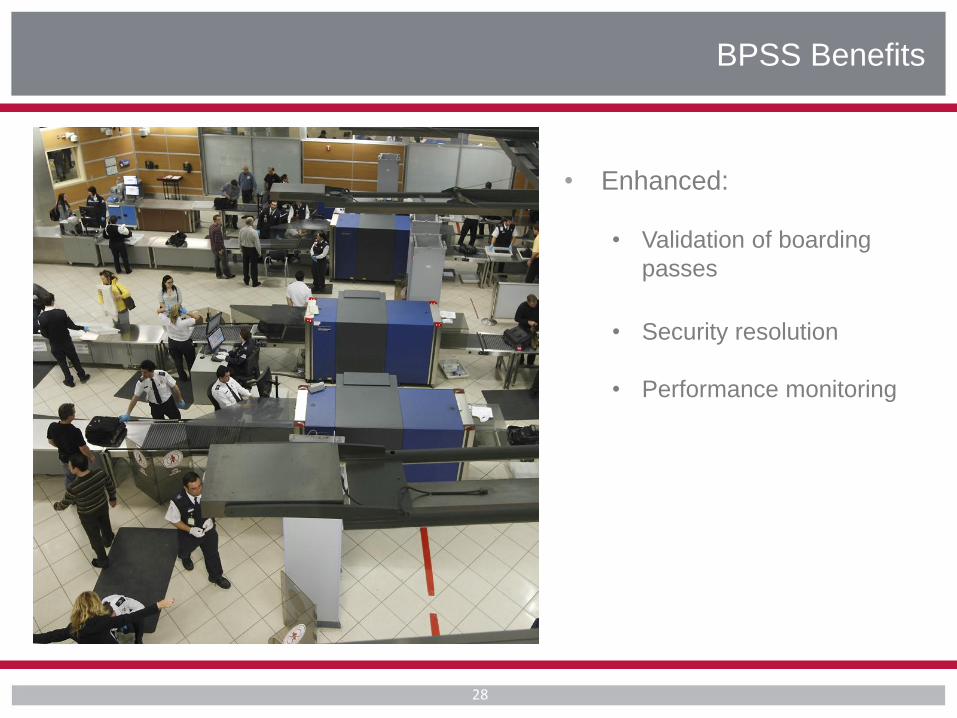
• Enhanced:
• Validation of boarding
passes
• Security resolution
• Performance monitoring
BPSS Benefits
29
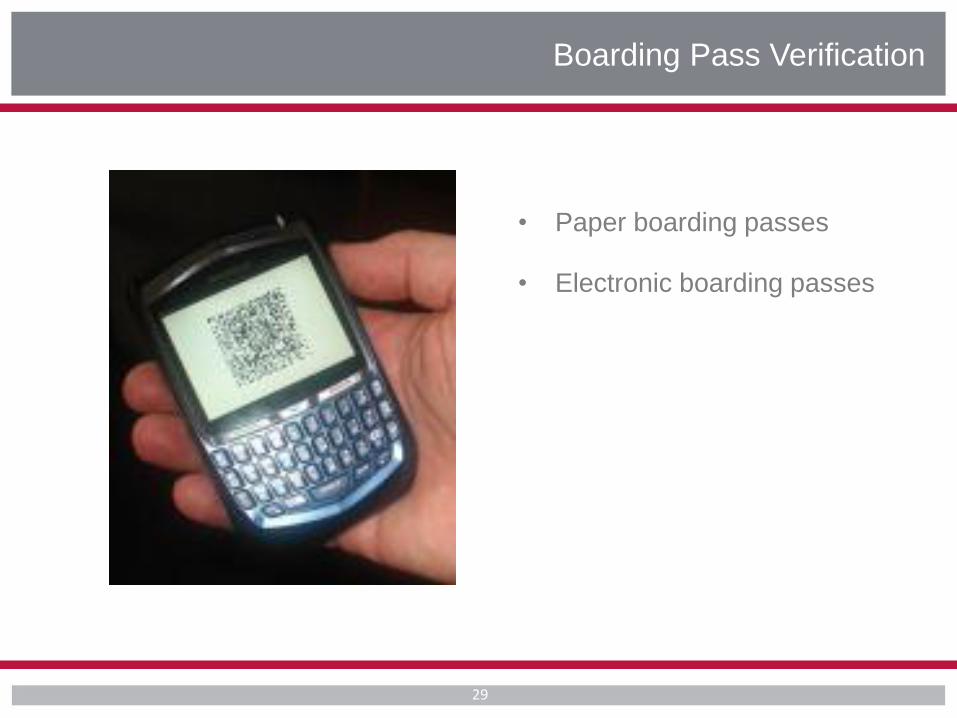
• Paper boarding passes
• Electronic boarding passes
Boarding Pass Verification
30
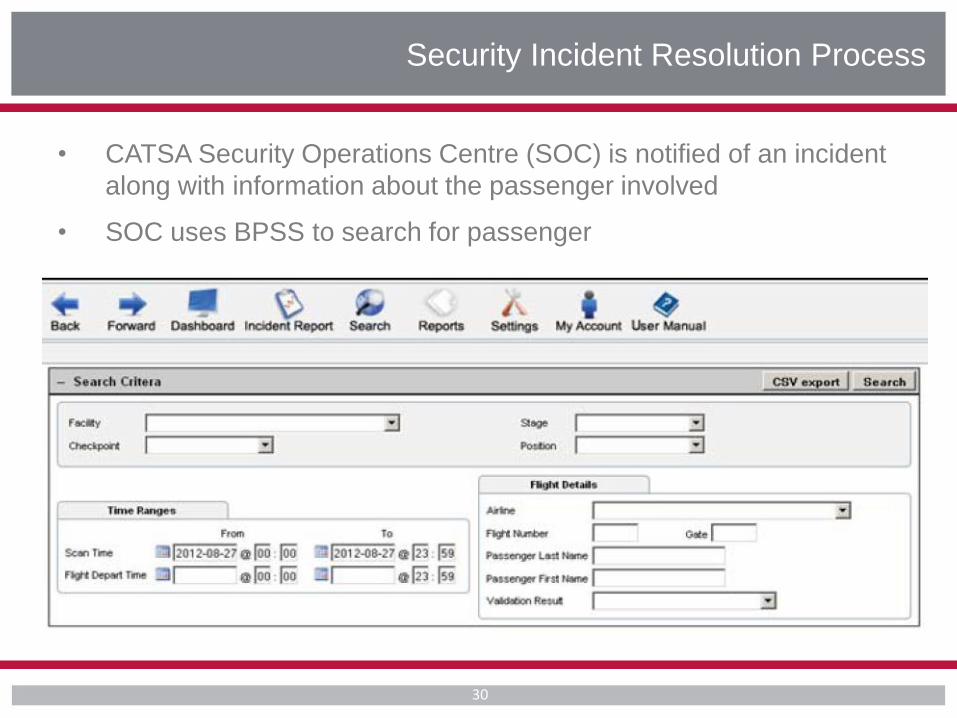
Security Incident Resolution Process
• CATSA Security Operations Centre (SOC) is notified of an incident
along with information about the passenger involved
• SOC uses BPSS to search for passenger
31
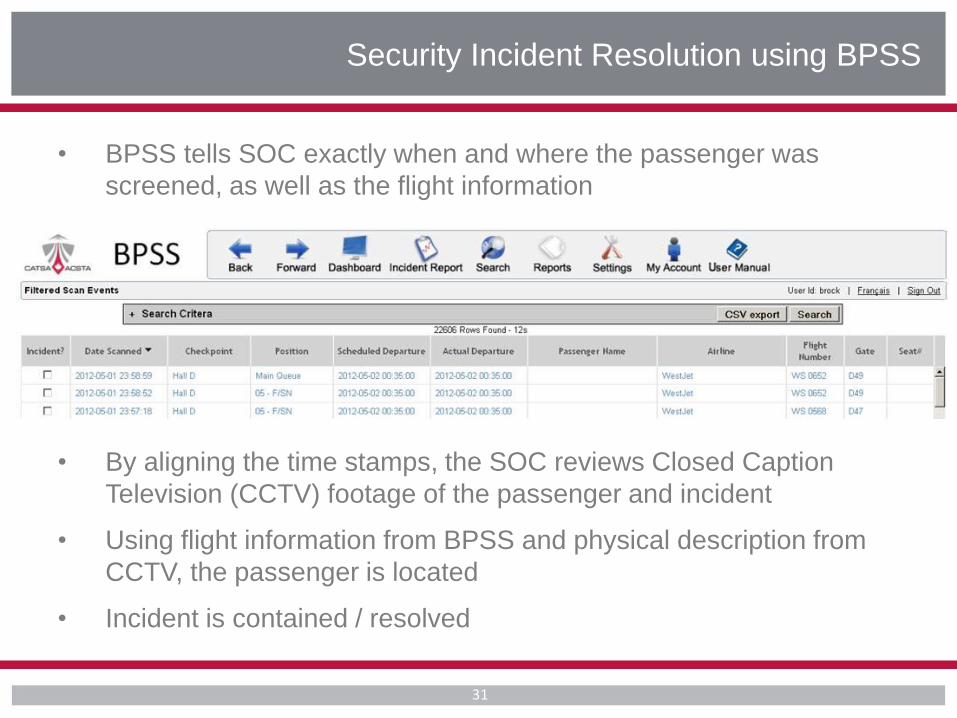
Security Incident Resolution using BPSS
• BPSS tells SOC exactly when and where the passenger was
screened, as well as the flight information
• By aligning the time stamps, the SOC reviews Closed Caption
Television (CCTV) footage of the passenger and incident
• Using flight information from BPSS and physical description from
CCTV, the passenger is located
• Incident is contained / resolved
32
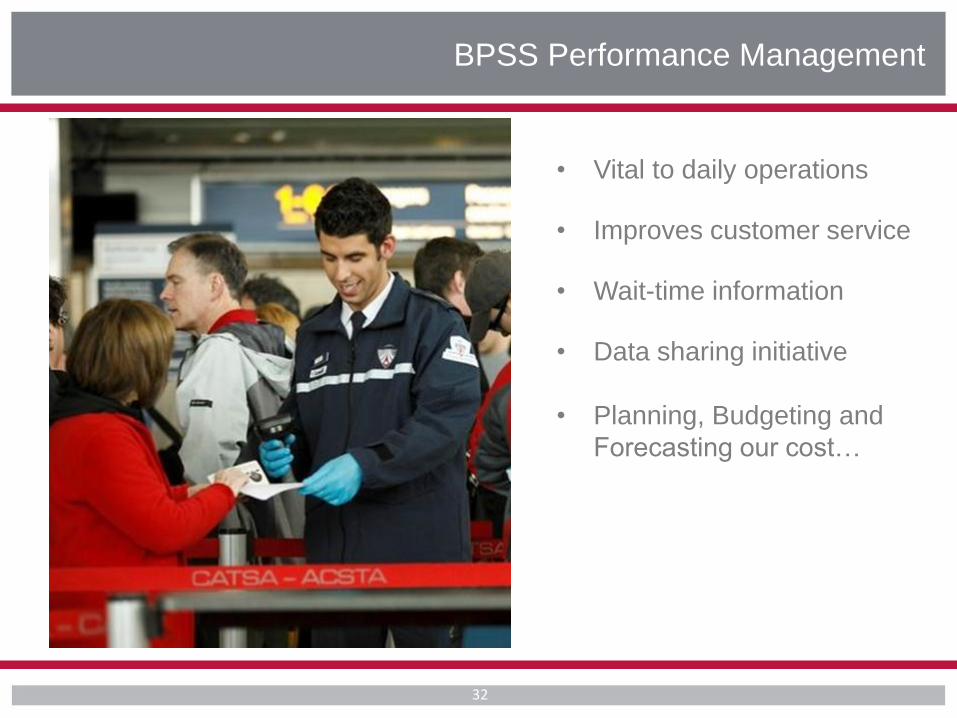
• Vital to daily operations
• Improves customer service
• Wait-time information
• Data sharing initiative
• Planning, Budgeting and
Forecasting our cost…
BPSS Performance Management
33
Planning Budgeting and Forecasting Tool (PBFT)
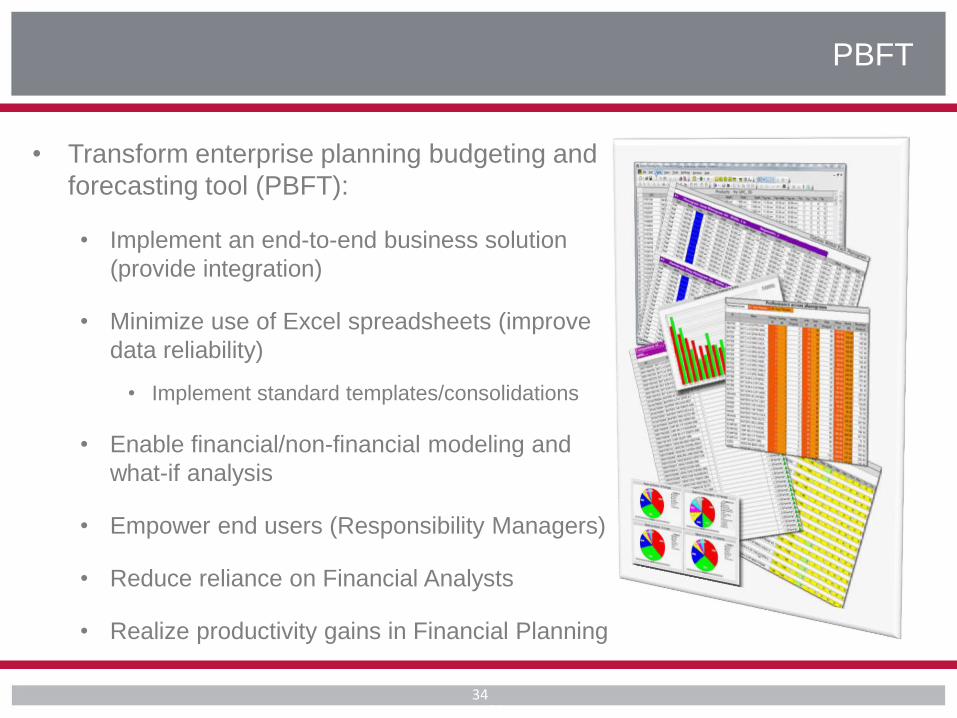
• Transform enterprise planning budgeting and
forecasting tool (PBFT):
• Implement an end-to-end business solution
(provide integration)
• Minimize use of Excel spreadsheets (improve
data reliability)
• Implement standard templates/consolidations
• Enable financial/non-financial modeling and
what-if analysis
• Empower end users (Responsibility Managers)
• Reduce reliance on Financial Analysts
• Realize productivity gains in Financial Planning
PBFT
34 34
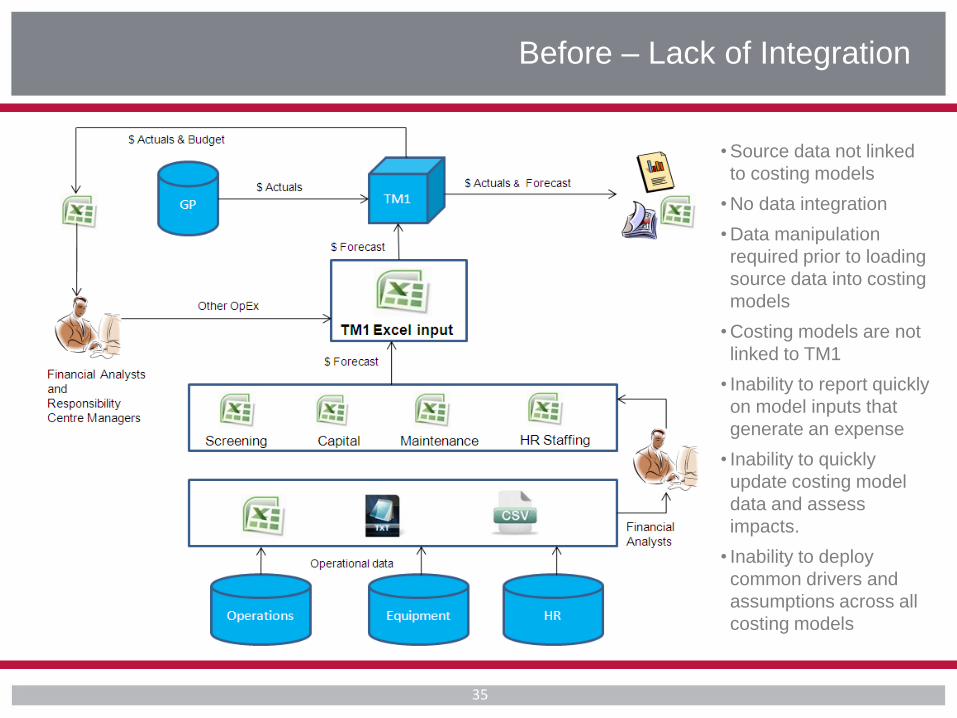
Before – Lack of Integration
35
• Source data not linked
to costing models
• No data integration
• Data manipulation
required prior to loading
source data into costing
models
• Costing models are not
linked to TM1
• Inability to report quickly
on model inputs that
generate an expense
• Inability to quickly
update costing model
data and assess
impacts.
• Inability to deploy
common drivers and
assumptions across all
costing models
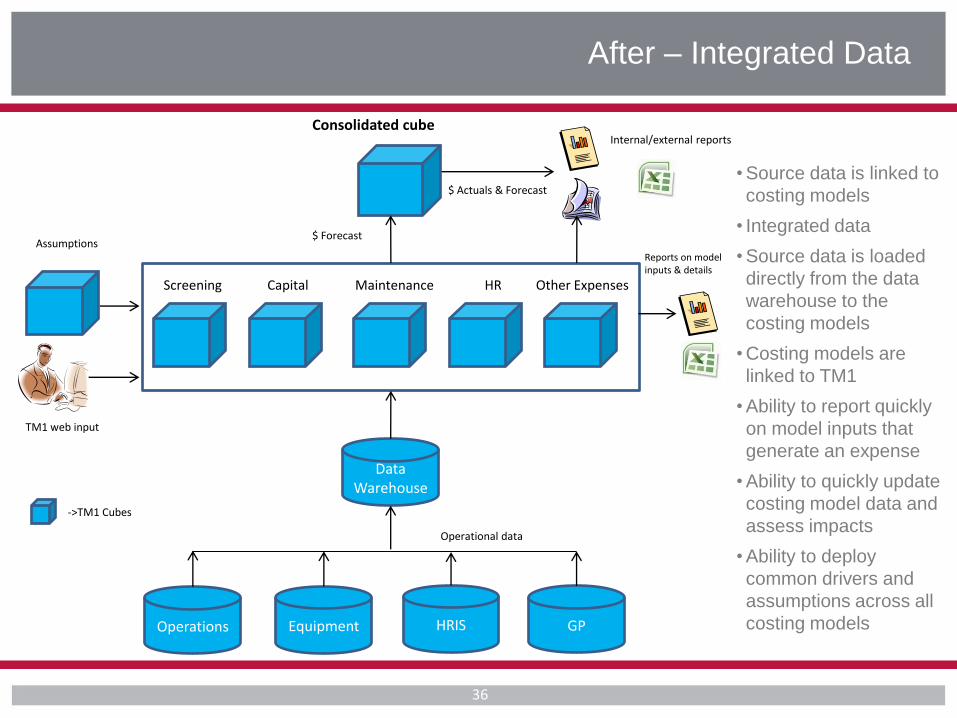
After – Integrated Data
36
Operations HRIS Equipment
$ Actuals & Forecast
Data Warehouse
Screening Capital Maintenance HR
GP
Other Expenses
Assumptions
Consolidated cube Internal/external reports
Reports on model inputs & details
->TM1 Cubes
TM1 web input
Operational data
$ Forecast
• Source data is linked to
costing models
• Integrated data
• Source data is loaded
directly from the data
warehouse to the
costing models
• Costing models are
linked to TM1
• Ability to report quickly
on model inputs that
generate an expense
• Ability to quickly update
costing model data and
assess impacts
• Ability to deploy
common drivers and
assumptions across all
costing models
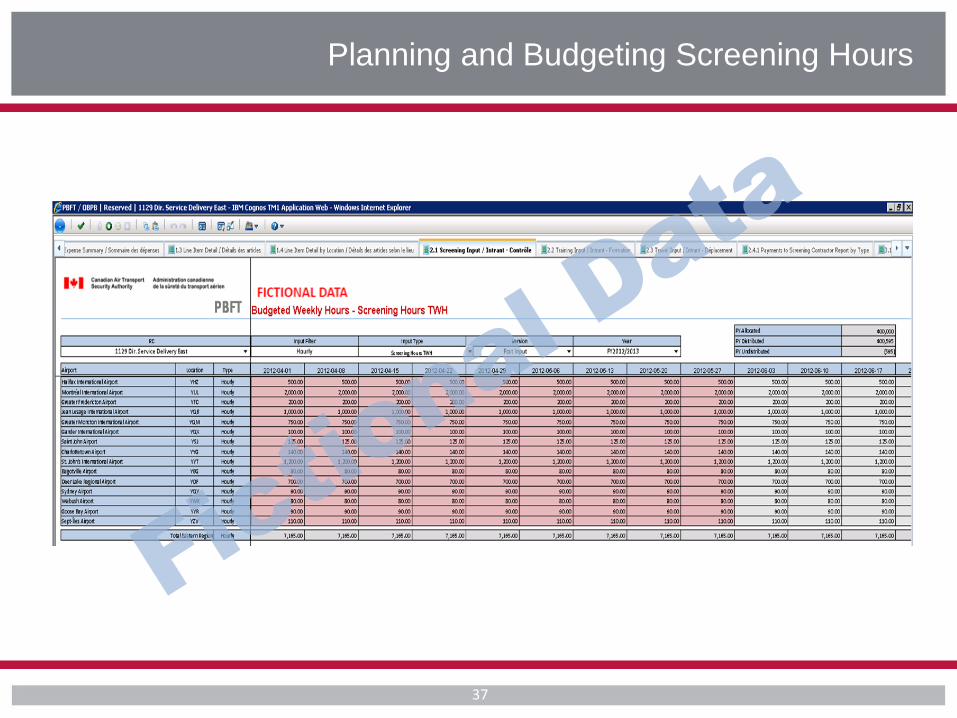
Planning and Budgeting Screening Hours
37
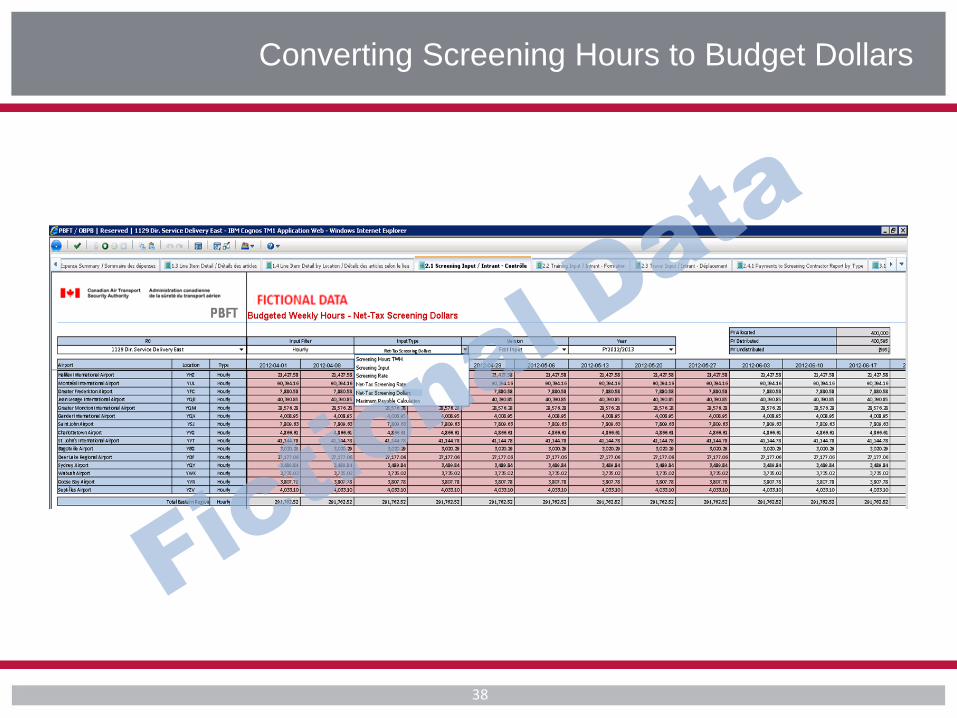
Converting Screening Hours to Budget Dollars
38
39
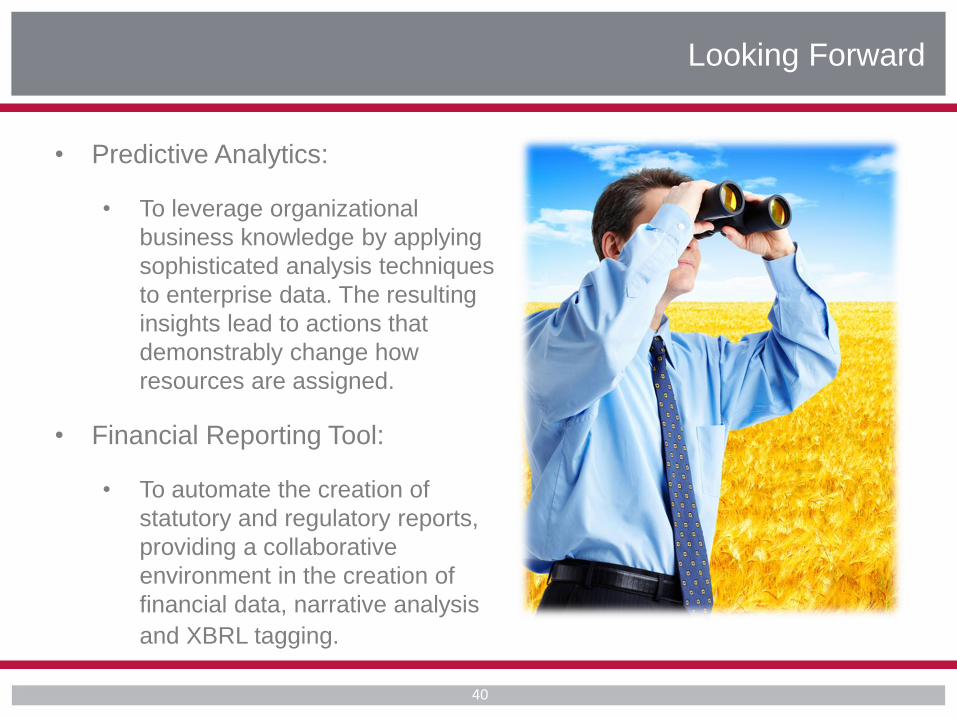
Looking Forward
40
• Predictive Analytics:
• To leverage organizational
business knowledge by applying
sophisticated analysis techniques
to enterprise data. The resulting
insights lead to actions that
demonstrably change how
resources are assigned.
• Financial Reporting Tool:
• To automate the creation of
statutory and regulatory reports,
providing a collaborative
environment in the creation of
financial data, narrative analysis
and XBRL tagging.
Looking Forward
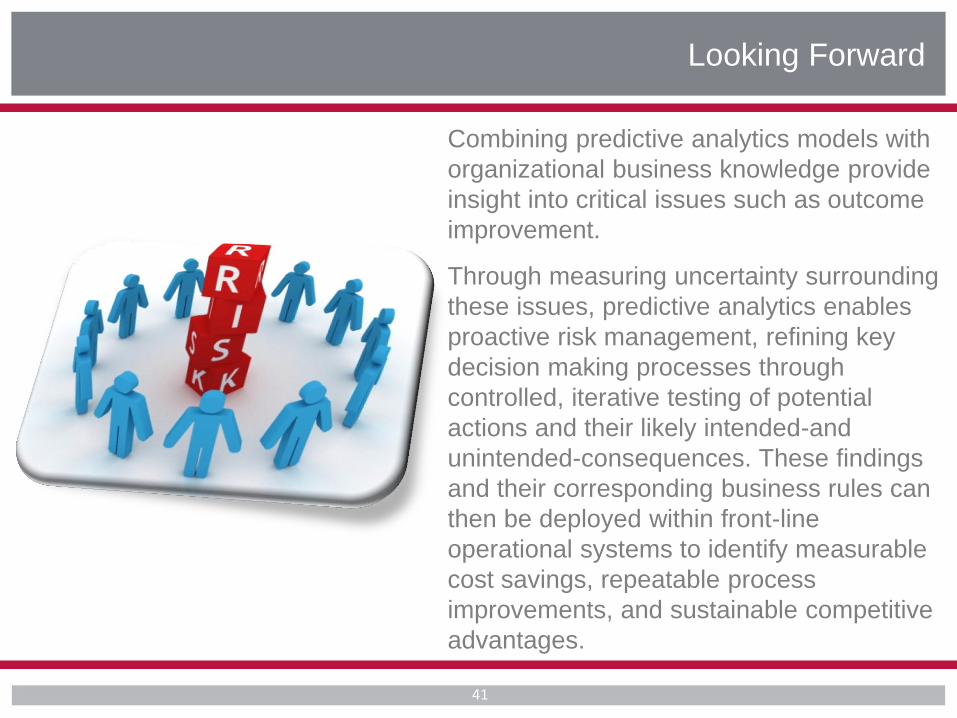
Combining predictive analytics models with
organizational business knowledge provide
insight into critical issues such as outcome
improvement.
Through measuring uncertainty surrounding
these issues, predictive analytics enables
proactive risk management, refining key
decision making processes through
controlled, iterative testing of potential
actions and their likely intended-and
unintended-consequences. These findings
and their corresponding business rules can
then be deployed within front-line
operational systems to identify measurable
cost savings, repeatable process
improvements, and sustainable competitive
advantages.
41
Looking Forward
42
Success Factors
43
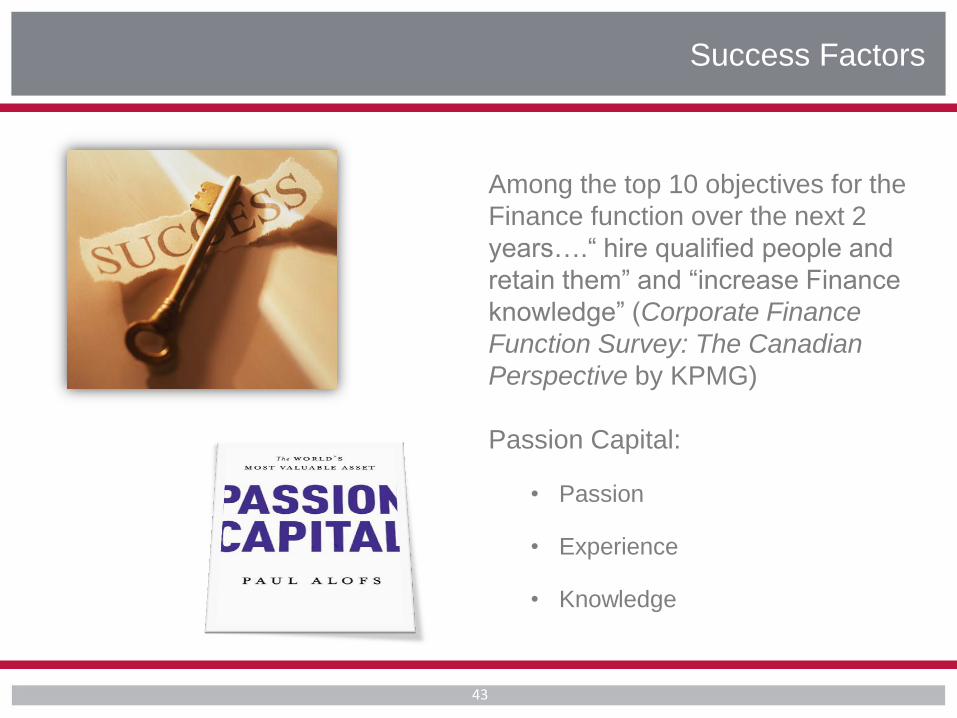
Among the top 10 objectives for the
Finance function over the next 2
years….― hire qualified people and
retain them‖ and ―increase Finance
knowledge‖ (Corporate Finance
Function Survey: The Canadian
Perspective by KPMG)
Passion Capital:
• Passion
• Experience
• Knowledge
Success Factors


Le Service des délégués
commerciaux du Canada Partout où vous faites des affaires
Initiatives de mesure de
rendement soutenant le
Programme commercial
du MAECI
Ministère des Affaires étrangères et du Commerce international
Direction de la Planification et de l’Appui aux services à la clientèle du SDC
IGF – 27 novembre 2012
46
Aperçu de la présentation
• Approche du Service des délégués commerciaux en matière de planification et de mesure du rendement
• Comment sommes-nous arrivés aux fiches de résultats pondérés et l’informatique décisionnelle?
• Tableau de bord de l’Expansion internationale des affaires
• Défis, réalisations et leçons retenues
47
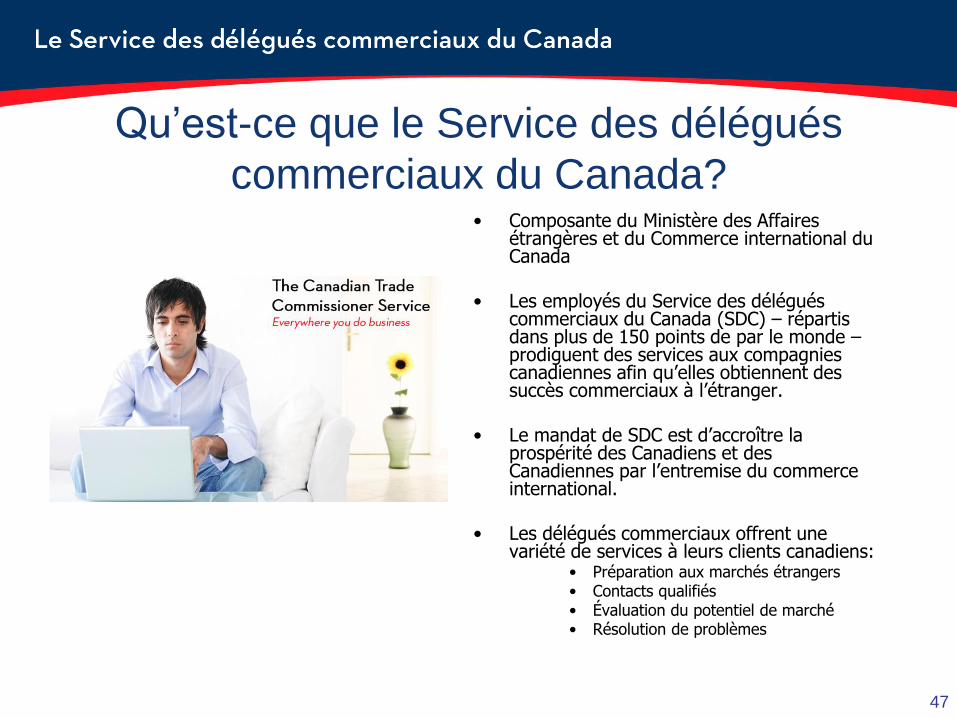
Qu’est-ce que le Service des délégués
commerciaux du Canada? • Composante du Ministère des Affaires
étrangères et du Commerce international du Canada
• Les employés du Service des délégués commerciaux du Canada (SDC) – répartis dans plus de 150 points de par le monde – prodiguent des services aux compagnies canadiennes afin qu’elles obtiennent des succès commerciaux à l’étranger.
• Le mandat de SDC est d’accroître la prospérité des Canadiens et des Canadiennes par l’entremise du commerce international.
• Les délégués commerciaux offrent une variété de services à leurs clients canadiens:
• Préparation aux marchés étrangers • Contacts qualifiés • Évaluation du potentiel de marché • Résolution de problèmes
48
La planification et la mesure du
rendement du programme commercial du
MAECI 1. Rigoureuse planification annuelle
des programmes commerciaux et
économiques
2. Utiliser les outils de mesure du
rendement
3. Gouvernance interne
4. S'assurer que les exigences de
responsabilité soient satisfaites
49
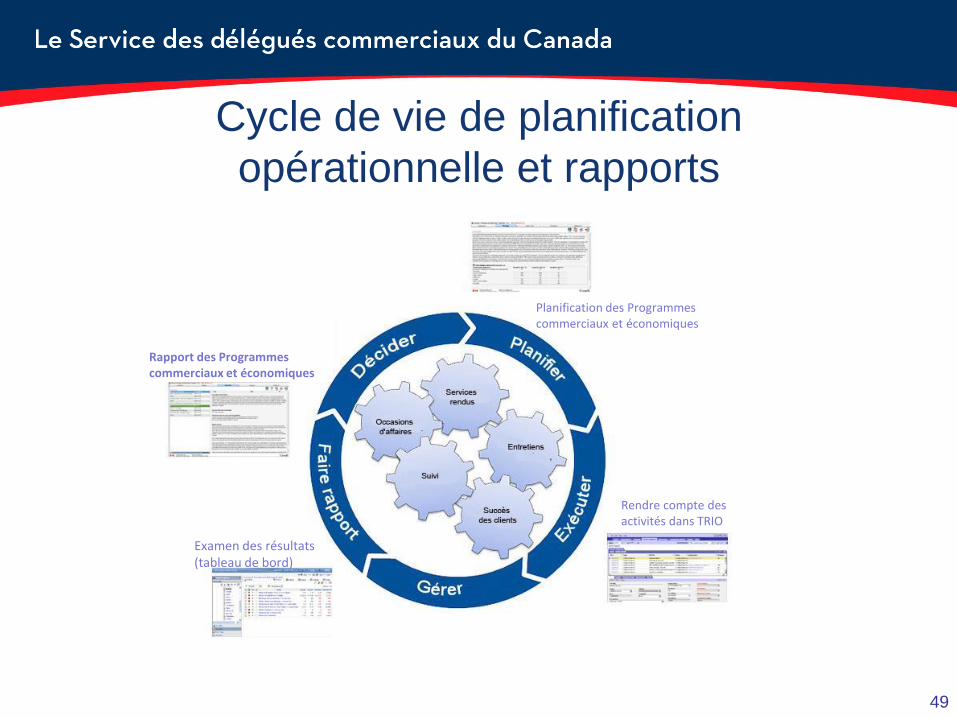
Cycle de vie de planification
opérationnelle et rapports
Examen des résultats (tableau de bord)
Rapport des Programmes commerciaux et économiques
Planification des Programmes commerciaux et économiques
Rendre compte des activités dans TRIO
50
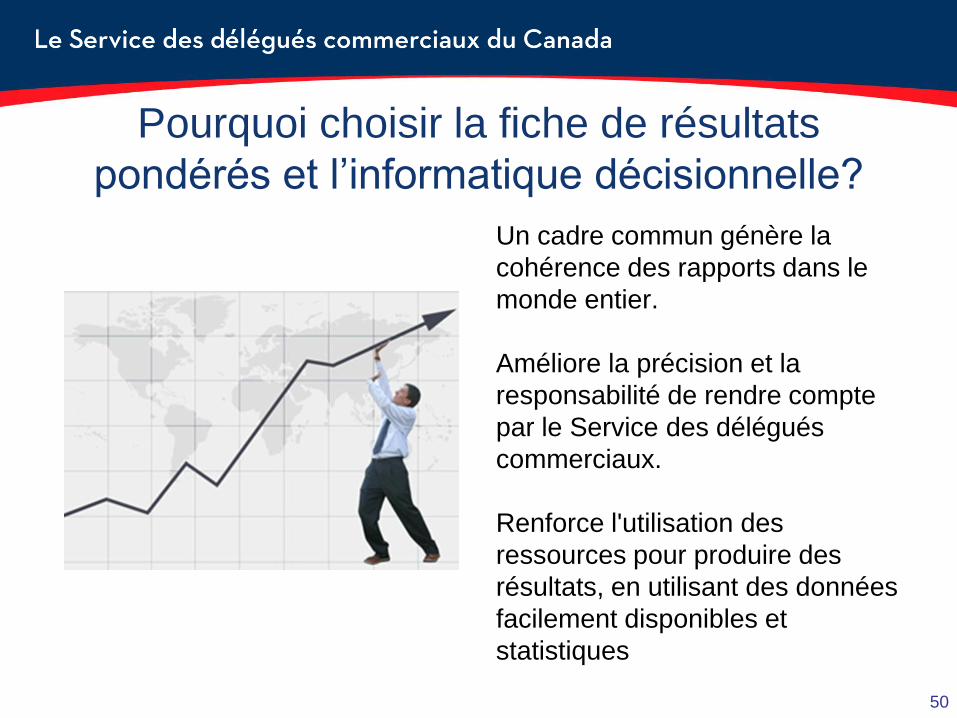
Pourquoi choisir la fiche de résultats
pondérés et l’informatique décisionnelle?
Un cadre commun génère la
cohérence des rapports dans le
monde entier.
Améliore la précision et la
responsabilité de rendre compte
par le Service des délégués
commerciaux.
Renforce l'utilisation des
ressources pour produire des
résultats, en utilisant des données
facilement disponibles et
statistiques
51
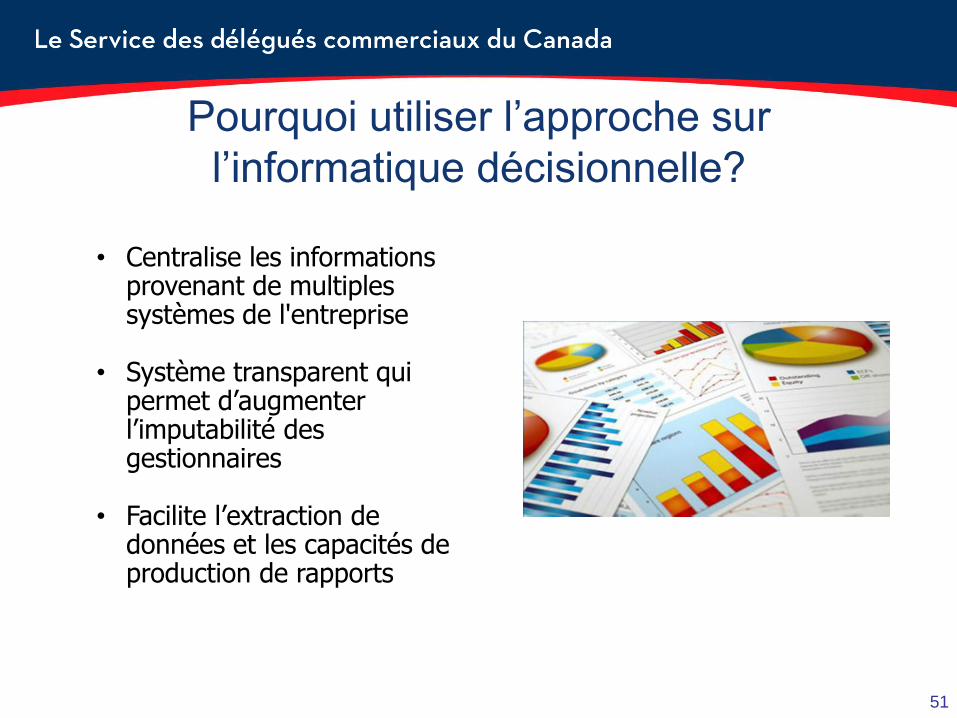
Pourquoi utiliser l’approche sur
l’informatique décisionnelle?
• Centralise les informations provenant de multiples systèmes de l'entreprise
• Système transparent qui permet d’augmenter l’imputabilité des gestionnaires
• Facilite l’extraction de données et les capacités de production de rapports
52
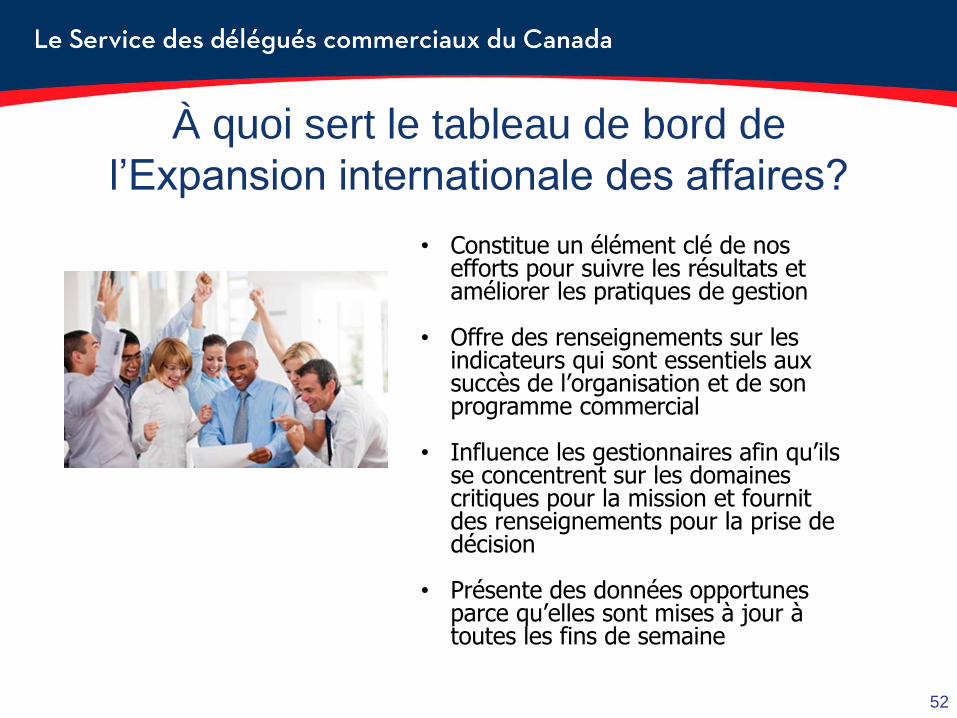
À quoi sert le tableau de bord de
l’Expansion internationale des affaires?
• Constitue un élément clé de nos efforts pour suivre les résultats et améliorer les pratiques de gestion
• Offre des renseignements sur les indicateurs qui sont essentiels aux succès de l’organisation et de son programme commercial
• Influence les gestionnaires afin qu’ils se concentrent sur les domaines critiques pour la mission et fournit des renseignements pour la prise de décision
• Présente des données opportunes parce qu’elles sont mises à jour à toutes les fins de semaine
53
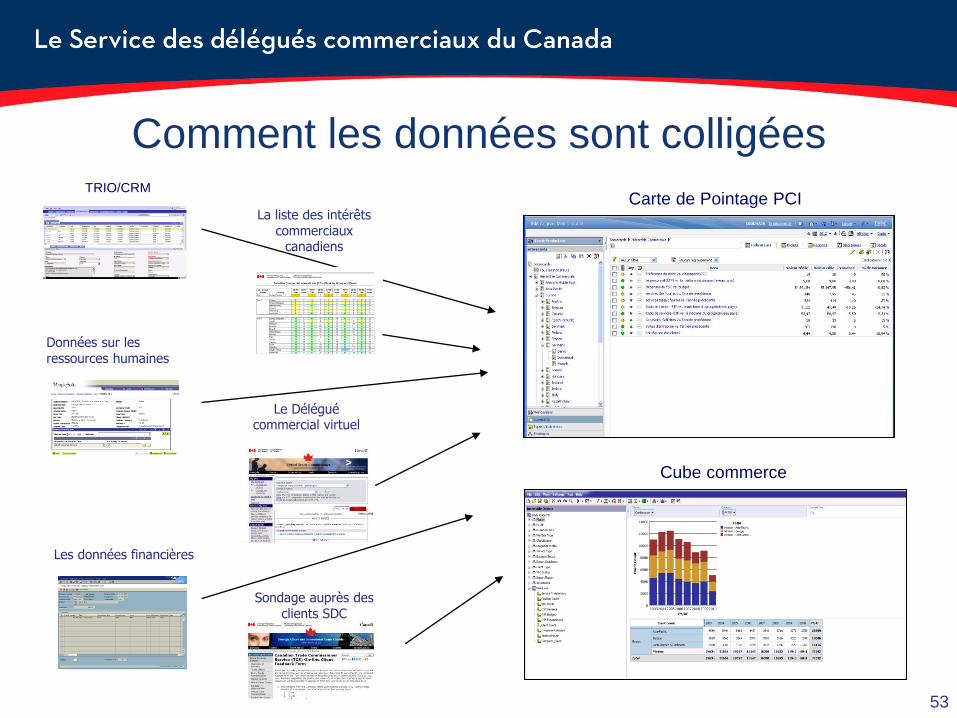
Comment les données sont colligées
Carte de Pointage PCI
Cube commerce
Les données financières
Données sur les ressources humaines
TRIO/CRM
La liste des intérêts commerciaux
canadiens
Le Délégué commercial virtuel
Sondage auprès des clients SDC
54
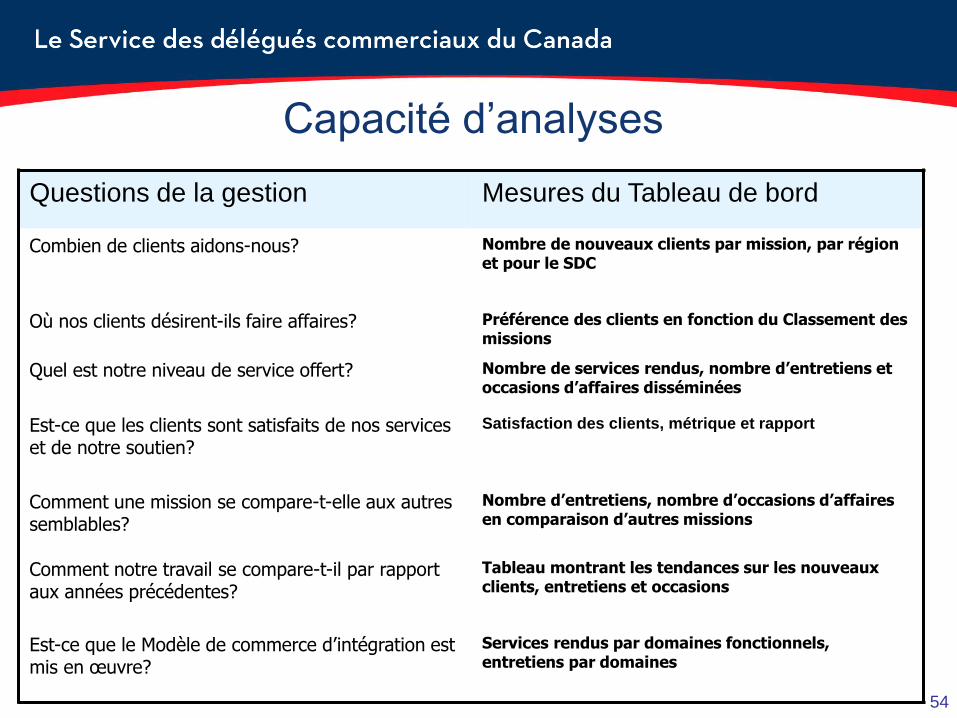
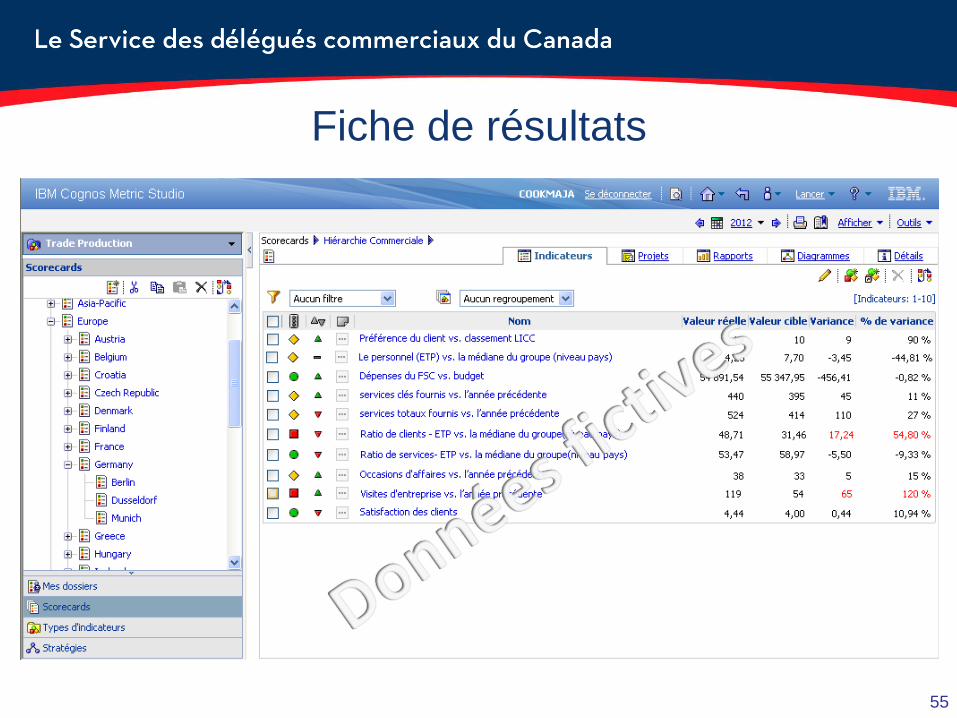
Questions de la gestion Mesures du Tableau de bord
Combien de clients aidons-nous? Nombre de nouveaux clients par mission, par région et pour le SDC
Où nos clients désirent-ils faire affaires? Préférence des clients en fonction du Classement des missions
Quel est notre niveau de service offert? Nombre de services rendus, nombre d’entretiens et occasions d’affaires disséminées
Est-ce que les clients sont satisfaits de nos services et de notre soutien?
Satisfaction des clients, métrique et rapport
Comment une mission se compare-t-elle aux autres semblables?
Nombre d’entretiens, nombre d’occasions d’affaires en comparaison d’autres missions
Comment notre travail se compare-t-il par rapport aux années précédentes?
Tableau montrant les tendances sur les nouveaux clients, entretiens et occasions
Est-ce que le Modèle de commerce d’intégration est mis en œuvre?
Services rendus par domaines fonctionnels, entretiens par domaines
Capacité d’analyses
55
Fiche de résultats
56
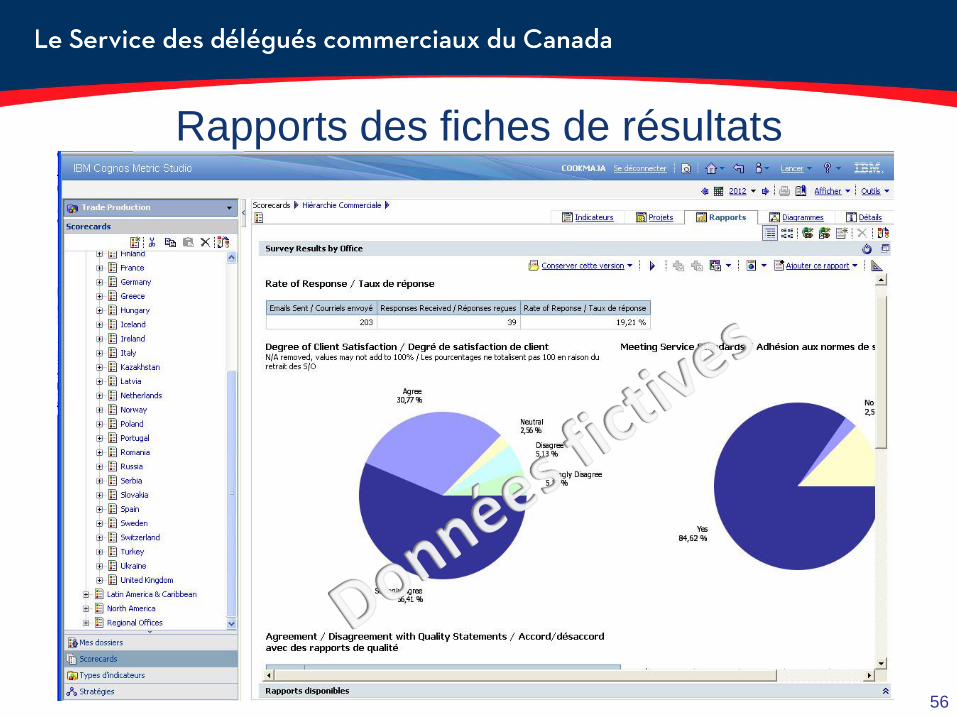
Rapports des fiches de résultats
57
Utilité pour la haute direction
• Rapport trimestriel au Conseil de
coordination du commerce international
• Exigences relatives aux rencontres de
breffage
• Données fiables et analyses pour les
équipes d’inspection des missions
• Analyse ad hoc pour des décisions
éclairées
58
Défis Clés
• Définitions/lignes directrices
• Uniformité des rapports
• Formation des
utilisateurs
59
Accomplissements du Tableau de bord
• Met l’accent sur l’imputabilité
• Expose l’importance de l’inscription des données
• Affermit la reddition de compte et améliore la qualité des données dans les systèmes d’entreprise
• Offre un accès rapide à des données pertinentes
60
Leçons retenues
• Tenir des consultations efficaces
• Travailler avec l’informatique pour harmoniser les systèmes corporatifs
• Transparence aide à améliorer la qualité des données et la comformité
• Apprendre des autres et partager les pratiques exemplaires avec les autres ministères
La haute gestion joue un rôle crucial pour mousser l’intérêt sur l’information liée au rendement :
L’information génère l’intérêt pour plus de renseignements
Leçons retenues
61
Avenir de l’informatique décisionnelle
Le MAECI a mis en place un comité de gouvernance sur les activités liées à l’informatique décisionnelle. On a lancé un projet pour trouver les spécialistes en la matière, qui verront à définir les indicateurs de rendement clés pour la création d’une fiche de résultats et d’un tableau de bord à l’échelon sous-ministre adjoint devant servir au Sous-ministre.
• Comité consultatif sur l’informatique décisionnelle

Questions
? ?
?