Scale-specific Hyperspectral Remote Sensing Approach in ... · Keywords: imaging hyperspectral...
14
PFG 2012 / 5, 0589 – 0602 Article Stuttgart, October 2012 © 2012 E. Schweizerbart'sche Verlagsbuchhandlung, Stuttgart, Germany www.schweizerbart.de DOI: 10.1127/1432-8364/2012/0141 1432-8364/12/0141 $ 3.25 Scale-specific Hyperspectral Remote Sensing Approach in Environmental Research AngelA lAusch, Leipzig,MArion P Ause, Tübingen,ines MerbAch &sArAh gwillyM- MArgiAnto, Halle,KArsten schulz, München,steffen zAchAriAs &rAlf sePPelt , Leipzig Keywords: imaging hyperspectral remote sensing, multi-scale analyses, vegetation monitoring well established in environmental research for more than three decades (Schaepmen et al. 2009). It provides a state-of-the-art meth- od for a variety of monitoring issues requiring 1 Introduction The application of optical remote sensing data from airborne and satellite sensors has been Summary: Hyperspectral remote-sensing data can contribute significantly to data analysis in research, opening up a wide spectrum for fields of applica- tion due to geometrical as well as spectral charac- teristics, e.g. in water status analysis, in the classi- fication of vegetation types, in the classification of physical-biochemical vegetation parameters, in classifying soil composition and structure, and in determining large-scale soil contamination. Hence, there is a tremendous demand for hyperspectral in- formation. However the use of commercial hyper- spectral data is associated with a number of prob- lems and a great deal of time and effort is required for research using hyperspectral data that spans different spatial and/or hierarchical as well as tem- poral scales. As a result few investigations have been conducted on the causal relationships between imaging hyperspectral signals and meaningful veg- etation variables over a longer monitoring period. At the Helmholtz Centre for Environmental Re- search (UFZ) Leipzig a scale-specific hyperspec- tral remote sensing based on the sensors AISA- EAGLE (400–970 nm) and AISA-HAWK (970– 2500 nm) has been set up. On three different scales (plot, local and regional) intensive investigations are being carried out on the spatio-temporal re- sponses of biophysical and biochemical state vari- ables of vegetation, soil and water compared to the hyperspectral response. This paper introduces and discusses the scale approach and demonstrates some preliminary examples from its implementa- tion. Zusammenfassung: Hyperspektraldaten stellen f ür die Forschung eine sehr bedeutsame Auswerte- grundlage dar, da sie aufgrund ihrer geometrischen als auch spektralen Eigenschaften eine Vielzahl unterschiedlicher Anwendungsgebiete, z.B. Ge- wässerzustandserfassung, Vegetationsklassifizie- rungen, Charakterisierung physikalisch-biochemi- scher Vegetationsparameter, Strukturierung und Zusammensetzung des Bodens, Erfassung von großflächigen Bodenkontaminationen, eröffnen. Es besteht somit ein sehr hoher Bedarf an Hyper- spektralinformationen. Der Einsatz von kommerzi- ellen Hyperspektraldaten ist jedoch mit einer Viel- zahl von Problemen verbunden. So sind Forschun- gen hinsichtlich unterschiedlicher räumlich/hierar- chischer als auch zeitlicher Skalen mit Hyperspek- traldaten nur sehr schwer möglich, andererseits existieren nur wenige Untersuchungen zu kausalen Zusammenhängen zwischen abbildenden Hyper- spektralsignalen und gesuchten Vegetationsvariab- len über einen langen Monitoringzeitraum. Am Helmholtz Zentrum f ür Umweltforschung (UFZ) Leipzig wurde eine skalenspezifische hyperspek- trale Fernerkundung auf Grundlage der Sensoren AISA-EAGLE (400–970 nm) und AISA-HAWK (970–2500 nm) etabliert. In drei unterschiedlichen Maßstabsbereichen (Grundst ück (plot), kommunal (local) und regional) werden intensive Untersu- chungen zum raum-zeitlichen Verhalten von bio- physikalischen und biochemischen Zustandsgrö- ßen von Vegetation, Boden und Wasser gegenüber hyperspectral response durchgef ührt. Im Artikel wird der Skalenansatz vorgestellt, diskutiert und erste Umsetzungsbeispiele gezeigt.
Transcript of Scale-specific Hyperspectral Remote Sensing Approach in ... · Keywords: imaging hyperspectral...

PFG 2012 / 5, 0589–0602 ArticleStuttgart, October 2012
© 2012 E. Schweizerbart'sche Verlagsbuchhandlung, Stuttgart, Germany www.schweizerbart.deDOI: 10.1127/1432-8364/2012/0141 1432-8364/12/0141 $ 3.25
Scale-specific Hyperspectral Remote SensingApproach in Environmental Research
AngelA lAusch, Leipzig, MArion PAuse, Tübingen, ines MerbAch & sArAh gwillyM-MArgiAnto, Halle, KArsten schulz, München, steffen zAchAriAs & rAlf sePPelt, Leipzig
Keywords: imaging hyperspectral remote sensing, multi-scale analyses, vegetation monitoring
well established in environmental researchfor more than three decades (Schaepmen etal. 2009). It provides a state-of-the-art meth-od for a variety of monitoring issues requiring
1 Introduction
The application of optical remote sensing datafrom airborne and satellite sensors has been
Summary: Hyperspectral remote-sensing data cancontribute significantly to data analysis in research,opening up a wide spectrum for fields of applica-tion due to geometrical as well as spectral charac-teristics, e.g. in water status analysis, in the classi-fication of vegetation types, in the classification ofphysical-biochemical vegetation parameters, inclassifying soil composition and structure, and indetermining large-scale soil contamination. Hence,there is a tremendous demand for hyperspectral in-formation. However the use of commercial hyper-spectral data is associated with a number of prob-lems and a great deal of time and effort is requiredfor research using hyperspectral data that spansdifferent spatial and/or hierarchical as well as tem-poral scales. As a result few investigations havebeen conducted on the causal relationships betweenimaging hyperspectral signals and meaningful veg-etation variables over a longer monitoring period.At the Helmholtz Centre for Environmental Re-search (UFZ) Leipzig a scale-specific hyperspec-tral remote sensing based on the sensors AISA-EAGLE (400–970 nm) and AISA-HAWK (970–2500 nm) has been set up. On three different scales(plot, local and regional) intensive investigationsare being carried out on the spatio-temporal re-sponses of biophysical and biochemical state vari-ables of vegetation, soil and water compared to thehyperspectral response. This paper introduces anddiscusses the scale approach and demonstratessome preliminary examples from its implementa-tion.
Zusammenfassung: Hyperspektraldaten stellenfür die Forschung eine sehr bedeutsame Auswerte-grundlage dar, da sie aufgrund ihrer geometrischenals auch spektralen Eigenschaften eine Vielzahlunterschiedlicher Anwendungsgebiete, z.B. Ge-wässerzustandserfassung, Vegetationsklassifizie-rungen, Charakterisierung physikalisch-biochemi-scher Vegetationsparameter, Strukturierung undZusammensetzung des Bodens, Erfassung vongroßflächigen Bodenkontaminationen, eröffnen.Es besteht somit ein sehr hoher Bedarf an Hyper-spektralinformationen. Der Einsatz von kommerzi-ellen Hyperspektraldaten ist jedoch mit einer Viel-zahl von Problemen verbunden. So sind Forschun-gen hinsichtlich unterschiedlicher räumlich/hierar-chischer als auch zeitlicher Skalen mit Hyperspek-traldaten nur sehr schwer möglich, andererseitsexistieren nur wenige Untersuchungen zu kausalenZusammenhängen zwischen abbildenden Hyper-spektralsignalen und gesuchten Vegetationsvariab-len über einen langen Monitoringzeitraum. AmHelmholtz Zentrum für Umweltforschung (UFZ)Leipzig wurde eine skalenspezifische hyperspek-trale Fernerkundung auf Grundlage der SensorenAISA-EAGLE (400–970 nm) und AISA-HAWK(970–2500 nm) etabliert. In drei unterschiedlichenMaßstabsbereichen (Grundstück (plot), kommunal(local) und regional) werden intensive Untersu-chungen zum raum-zeitlichen Verhalten von bio-physikalischen und biochemischen Zustandsgrö-ßen von Vegetation, Boden und Wasser gegenüberhyperspectral response durchgeführt. Im Artikelwird der Skalenansatz vorgestellt, diskutiert underste Umsetzungsbeispiele gezeigt.

590 Photogrammetrie • Fernerkundung • Geoinformation 5/2012
their lack of generality, which physical-basedapproaches promise to overcome. Since, quan-titative reflectance data are directly applied asinput variables, empirical approaches link-ing spectral vegetation indices (VI) and veg-etation parameters are less influenced by at-mospheric correction factors but are rathermore site-specific with atmospheric and sur-face characteristics at the time of data acquisi-tion (houborg & anderSon 2009). However,to validate quantitative studies using empiri-cal or physical based approaches in general,a tremendous effort is required from groundtruthing campaigns. In the case of fluctuatinginternal factors, e.g. phenological stages, andexternal factors, e.g. illumination conditions,spatial and spectral observation characteris-tics, affecting the canopy reflectance betweenthe imaging spectrometer campaigns, the es-tablished methods, parameter characteristics,e.g. pigment value range or coefficients arenot directly transferable to other applications,study sites or phenological stages. In terms oftransferring methods and awareness of impor-tant correlations, there is in particular a lackof knowledge about spatial scale-dependentinformation, which needs to be verified muchmore with real data and naturally occurringland surface heterogeneity effects.
In the setting of TERENO (terrestial en-vironmental observatories, www.tereno.net,ZachariaS et al. 2011) imaging hyperspec-tral airborne remote sensing plays a key rolein long-term monitoring on different scalesand in different regions. The Helmholtz Cen-tre for Environmental Research UFZ deliversknowledge about complex systems and rela-tionships in the environment by interlinkingthe natural, social and human sciences. In or-der to guarantee a comprehensive process-ori-ented research in landscapes and ecosystems,imaging spectrometer sensors that are able toconduct in-house optical remote sensing havebeen made available. The imaging hyperspec-tral remote sensing is based on the two sen-sors; AISA-EAGLE (400–970 nm) and AI-SA-HAWK (970–2500 nm) – Airborne Imag-ing Spectrometer for Applications (mäkiSara
et al. 1993) developed by SPECIM (SpectralImaging LTD., Finland). The sensors, whichhave a high geometric (0.5–5 m) and spectral(2.3–8.5 nm) resolution, are used on different
spatial information of the Earth’s surface. De-pending on the specific data product and an-cillary data, improvements in ecological, hy-drological and climate modelling have beenpossible over a wide range of spatial scales.Thereby, the reliability of final information orquantifications depends mainly on sensor-spe-cific limitations in terms of their spectral andspatial characteristics. Modern airborne imag-ing hyperspectral sensors open up many newdifferent fields of applications thanks to theirhigh geometric (< 5 m) and spectral (~ 5 nm)characteristics, e.g. monitoring the state ofaquatic ecosystems, quantifying biodiversity,retrieving biophysical-biochemical vegetationparameters, assessing soil structure and com-position, recording soil contamination overlarger areas. With the launch of the Germanhyperspectral satellite mission EnMAP (En-vironmental Mapping and Analyses Program)that is foreseen for 2015, a new imaging spec-trometer data format in terms of its spectral(6.5–10 nm) and geometric (30 m× 30 m spa-tial resolution) characteristics will be availa-ble (Stuffler et al. 2009). The EnMAP dataproduct on the regional scale and the possibil-ity of available multi-temporal data will en-able monitoring issues to be realized on theregional scale.
Knowledge about the retrieval of vegeta-tion parameters, e.g. leaf area index, pig-ments, photosynthesis activity, is generallyperformed with analytical, simulation or ex-perimental studies. Since, the latter requirestremendous effort in terms of cost, time andtechnical infrastructure, leaf and vegetationcanopy radiative transfer models (RTM) be-came a valuable method for investigating therelationship between narrow-band spectralfeatures and plant or vegetation canopy pa-rameters (Jacquemoud et al. 2009). This willbe able to be applied to a wide range of spe-cies and has the advantage that it can be ap-plied from the field level upwards. However,overlapping and confounding internal fac-tors, e.g. heterogeneity of the vegetation can-opy parameters, and external factors, e.g. theobservation angle, that influence the signal,can constrain the implementation of RTMwith studies involving field-scale heterogene-ity since RTM assume homogeneity. Empiri-cal analyses have therefore been criticized for

Angela Lausch et al., Scale-specific hyperspectral remote sensing approach 591
how these will change over the growing sea-son.The outlined issues are very difficult to ad-
dress in research practice and when focusingon the use of commercial hyperspectral data,the following obstacles arise:● Data is generally collected at one specific
spatial resolution due to costs and the timemanagement of the partner operating thesensor.
● Multi-temporal datasets are difficult to ob-tain over one growing cycle in the case oflimited sensor availability, e.g. competingcampaigns in terms of time, with appropri-ate clear sky conditions. For instance, theHyMap (Hyperspectral Mapper) campaignsin Germany over recent years were gener-ally conducted in July and August. A tem-poral monitoring of different vegetation pa-rameters is therefore not possible over theyear or an entire growth cycle.
● Furthermore, as a result of the researchquestion and the key parameters of inter-est, the requirements of the ground truthingdesign are comparatively clear. Field cam-paigns can often take many months or evenyears to plan because of the high effort oforganisation required in terms of staff, e.g.technicians, students, instrumentation, e.g.mobile plant and canopy analyser, labora-tory resources, e.g. pigment extraction, andancillary information, e.g. thematic maps.
To provide realistic and high quality data-sets and make progress in remote-sensinganalyses, imaging spectrometer data from thelandscape level, airborne and ground “seg-ment” are still not a separable union. There-fore, the key issues of the monitoring designpresented in this paper are i) to analyze thesensitivity of hyperspectral data to a widerange of physiological parameters and pheno-logical stages on different spatial scales, ii) toacquire knowledge about the temporal dy-namics of the above, and iii) to improve ourunderstanding about the overlaying effects forretrieving parameters on “real” data.
To address a wide range of these issues, ascale-specific remote sensing experiment wasset up, which is presented in the following sec-tion.
observation platforms in order to be able toobtain multi-scale (spatial) spectrometer data.A rotating mirror device enables use of thescan line sensors on a lifting platform and inlaboratory experiments. The permanent avail-ability of the sensors guarantees data acquisi-tion at any required time, e.g. a specific phe-nological stage, on the landscape scale usingdifferent aircrafts.
2 Research Issues andBackground
Knowledge acquired about the sensitivity ofhyperspectral reflectance data and plant orvegetation canopy parameters is generally ac-quired on a specific spatial observation scale.Many studies used field spectrometer data toanalyze appropriate relationships or to devel-op new spectral vegetation indices (bannari
et al. 2007). Relationships retrieved from radi-ative transfer models should be interpreted ortransferred with caution and the parameteri-zation, e.g. value ranges, observation settings,applied during the experiments should be tak-en into account (haboudane et al. 2004). Oneissue that is often not addressed is the influ-ence of the spatial observation scale on thereflectance signal in terms of its sensitivityto retrieved biochemical and biophysical pa-rameters. Hence, it is generally not clear withwhich accuracy quantitative results can be ex-pected from potential stakeholders. Thereforethe need arises to analyze real data at differentspatial observation scales and to test recentlyproved methods, e.g. radiative transfer mod-els, empirical models, and neural networks, interms of their performance.
Furthermore there is a lack of knowledgeabout the temporal behaviour of plant and veg-etation canopy reflectance characteristics overentire growing cycles from experimental dataon the landscape scale. Such basic monitor-ing experiments promise progress in under-standing the dynamics of overlaying effectsin particular, i.e. different plant and vegeta-tion parameters. Simulation experiments arevery valuable in providing basic understand-ing, although a validation of real data cannotbe substituted to finally understand the effectof combined effects under real conditions and

592 Photogrammetrie • Fernerkundung • Geoinformation 5/2012
3.2 Experimental Design
Scale 1 – Long term laboratoryvegetation monitoring experiments,plot scale (plant level, vegetationcanopy)
To examine causal relationships between im-aging hyperspectral signals and single plant orvegetation canopy parameters as well as theiroverlaying effects, the only appropriate meth-od is to conduct controlled laboratory experi-ments. By conducting such experiments, thespectral response of vegetation under differ-ent arbitrary scenarios, drought stress, CO2,heavy metal pollution, the effect of pesticidesetc., can be studied at frequent intervals, e.g.twice a week. Consequently, there is tremen-dous potential for model development and val-idation to retrieve plant and vegetation canopyparameters (leaf area index, chlorophyll a/bratio, photosynthesis activity, biomass, car-bon/nitrogen ratio, soil moisture). Further-more, a major advantage of this kind of labo-ratory experiments is that measurements arealways carried out under the same basic con-ditions such as light source and general geo-metric observation properties (2× 1000 Whalogen lamps, fixed angle of incidence anddistance sensor-object). A darkroom measur-ing approximately 3× 3× 3 m3 made of light-
3 Scale-specific MonitoringMethods
The concept of the scale-specific remote sens-ing experiment at the Helmholtz Centre forEnvironmental Research (UFZ) in Leipzig/Germany is based on data sampling fromthree different observation scales, which arepresented in Fig. 1. Scales 1 to 3 are outlinedin more detail in section 3.2. Scale 4, whichrepresents the final landscape scale will not bediscussed further in this paper.
All measurements were carried out with thesame imaging hyperspectral sensors whichare described in section 3.1. Selecting spatialground resolutions enables algorithms andtraining datasets to be transferred betweenscales. During the laboratory measurementswe were able to obtain the same footprint (ge-ometric resolution 50 cm× 50 cm) as at thelandscape level (scale 3).
3.1 Sensor Characteristics
Tab. 1 summarizes the main sensor propertiesof the UFZ’s hyperspectral sensors. The rele-vant spectral and geometric sensor propertiesthat are required depend on the research ob-jectives and the spatial observation scale.
Fig. 1: The concept of monitoring the biophysical–biochemical vegetation variables on differentspatial and temporal scales with the imaging hyperspectral sensors AISA-EAGLE/HAWK (modi-fied after lAusch et al. 2012).

Angela Lausch et al., Scale-specific hyperspectral remote sensing approach 593
Tab. 1: Characteristics of the hyperspectral sensors from the UFZ – AISA-EAGLE / HAWK.
Sensor head AISA-EAGLEVNIR
AISA-HAWK IISWIR
Weight 11 kg 18 kg
Dimensions (L/W/H) 380/220/55 mm 220/275/470 mm
Spectral range 400 – 970 nm 970 – 2500 nm
Spectral resolution 2.9 nm 8.5 nm
Max. spatial pixels 1024 320
Camera CCD Camera MCT Camera
SNR 350:1 – 1400:1 (depending on band configuration) 800:1 (peak)
Spectral binning options 1x 2x 4x 8x
Spectral bands 488 252 122 60 254
Spectral sampling/ band 1.25 nm 2.3 nm 4.6 nm 9.2 nm
Image rate 30 40 60 85
Focal length 23 mm 18.5 mm 9 mm 22.5 mm
FOV 29.9 degrees 36.7 degrees 62.1 degrees 24.0 degrees
Swath width 0.53 x altitude 0.66 x altitude 1.20 x altitude 0.43 x altitude
Ground resolution at1000 m altitude 0.52 m 0.65 m 1.2 m 1.34 m
Additional parts
Mirror scanner Mirror scanner for local applications (field plots)Mirror scanner forlocal applications(field plots)
FODIS Fiber Optic Down welling Irradiance SensorFiber Optic Downwelling Irradiance
Sensor
Fig. 2: Use of the imaging hyperspectral sensor AISA-EAGLE/HAWK in the laboratory, a) techni-cal configuration of AISA-EAGLE/HAWK in a lifting platform on the ceiling, b) construction of thelaboratory experiment with imaging hyperspectral sensors, c) vegetation scenarios of spring bar-ley experiment 2009 (DOY 117-201), d) RGB, CIR and NDVI (normalized difference vegetation in-dex) derived from the AISA-EAGLE hyperspectral image of spring barley (2009-04-27, 2009-07-13), e) quantification of vegetation indices derived from imaging hyperspectral AISA sensors – ex-ample NDVI.

594 Photogrammetrie • Fernerkundung • Geoinformation 5/2012
Scale 3 – Airborne remote sensing,local to regional scale (vegetation,populations, ecosystems)
To provide airborne imaging hyperspec-tral data for innovative studies related to prac-tice we opted to use a Cessna 207 or Piper forspatially extensive hyperspectral campaigns(Fig. 6) and a microlight aircraft (Trike, D-MUFZ, Fig. 4) as a sensor platform for smallscale, e.g. field scale, hyperspectral cam-paigns. Fig. 4 shows the hyperspectral sensorAISA-EAGLE together with the GPS/INS unitRT3100 (Oxford Technical Solutions LTD.,UK) fitted onto the microlight and the micro-light itself in operation. The advantages anddisadvantages of using a microlight as a sen-sor platform are listed below.
The advantages of using a microlight are:● flexibility in terms of time enabling a high
repetition rate of data acquisition● independence from outside bodies in terms
of project planning, since pilots and opera-tors are members of the staff of the researchinstitute
● economical use in terms of repairs andmaintenance
● its design, enabling a use in a wide rangeof areas abroad (it can be dismantled andtransported in containers together with thesensors)
● recording imaging of hyperspectral datawith high spatial (< 0.5 m) and temporalresolution
proof material was set up for the hyperspec-tral measurements. The use of this darkroomprevents any disruptive factors from havingan effect over the entire series of tests. Fig. 2shows the test set-up in the laboratory and ex-amples of imaging hyperspectral data fromthe available measurement tests on spring bar-ley under different drought stress scenarios.
Scale 2 – Lifting platform, plot to localscale (vegetation canopy)
Test plots with a surface area of < 20× 20 m2
can be examined using a lifting platform(Fig. 3). Both hyperspectral sensors (AISA-EAGLE/HAWK) are mounted onto the lift-ing platform at a height of 2–12 m above thevegetation. The aim of these tests is to recordthe causal relationships between spectral im-aging signals and the target parameters meas-ured, e.g. to derive biophysical and biochemi-cal canopy state variables such as LAI (leafarea index), chlorophyll content, vegetationwater content or nutrient status of vegetation,under ‘in-vitro’ conditions. With the liftingplatforms a long-term monitoring of differentvegetation plots is possible. Furthermore, wecan test the influence of different sensor an-gles, any bidirectional reflectance distributionfunction (BRDF) effects on the imaging spec-tral response and establish transfer functionsfrom scale 1 to scale 2.
Fig. 3: Using the hyperspectral sensor AISA-EAGLE/HAWK on lifting platforms over a) test plotsand b) lysimeters.

Angela Lausch et al., Scale-specific hyperspectral remote sensing approach 595
● sometimes difficult handling of the equip-ment
● limitation of the imaged area (maximumabout 10 km2)
Disadvantages of using a microlight are:● thermal lift affecting the microlight’s sta-
bility and thus limiting the time of opera-tion during the day
Fig. 6: a) Cessna 207, b) AISA-EAGLE/HAWK Dual sensor mount in the Cessna, c) data cube ofAISA-DUAL data, d) and e) “Region Rosslau” – RGB- and CIR-image – taken from the hyperspec-tral sensor AISA-EAGLE/HAWK, 400–2500 nm, 2 m ground resolution, 461 spectral bands, dateof recording 2010-09-23 with a Cessna 207.
Fig. 5: “Schleusenheger Wiesen” near Dessau recorded 2008-07-03 using the microlight aircraftof the UFZ, images from the hyperspectral sensor AISA-EAGLE, 400–970 nm, 1 m ground resolu-tion, 252 spectral bands: a) RGB-Image, b) CIR-image with data cube, c) CIR hyperspectral imagesubset.
Fig. 4: a) AISA-EAGLE (400–970 nm) and GPS/INS-RT3100 mounted onto the microlight aircraft(Trike, D-MUFZ) of the UFZ, b) Microlight aircraft of the UFZ – D-MUFZ, c) Microlight aircraft forrecording hyperspectral data – landscape level.
596 Photogrammetrie • Fernerkundung • Geoinformation 5/2012
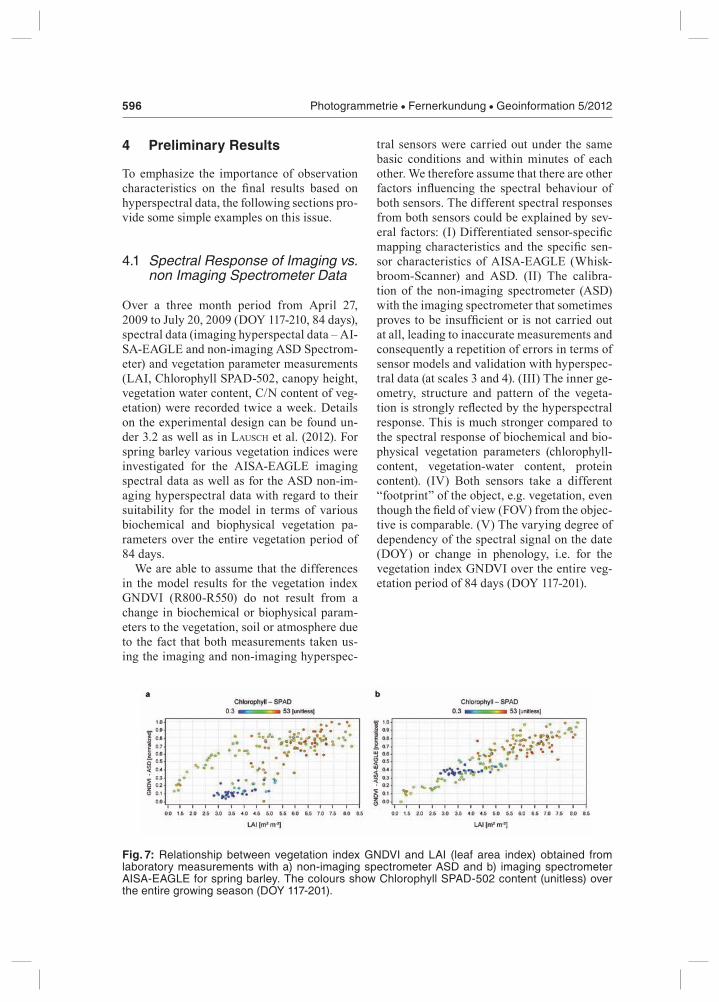
tral sensors were carried out under the samebasic conditions and within minutes of eachother. We therefore assume that there are otherfactors influencing the spectral behaviour ofboth sensors. The different spectral responsesfrom both sensors could be explained by sev-eral factors: (I) Differentiated sensor-specificmapping characteristics and the specific sen-sor characteristics of AISA-EAGLE (Whisk-broom-Scanner) and ASD. (II) The calibra-tion of the non-imaging spectrometer (ASD)with the imaging spectrometer that sometimesproves to be insufficient or is not carried outat all, leading to inaccurate measurements andconsequently a repetition of errors in terms ofsensor models and validation with hyperspec-tral data (at scales 3 and 4). (III) The inner ge-ometry, structure and pattern of the vegeta-tion is strongly reflected by the hyperspectralresponse. This is much stronger compared tothe spectral response of biochemical and bio-physical vegetation parameters (chlorophyll-content, vegetation-water content, proteincontent). (IV) Both sensors take a different“footprint” of the object, e.g. vegetation, eventhough the field of view (FOV) from the objec-tive is comparable. (V) The varying degree ofdependency of the spectral signal on the date(DOY) or change in phenology, i.e. for thevegetation index GNDVI over the entire veg-etation period of 84 days (DOY 117-201).
4 Preliminary Results
To emphasize the importance of observationcharacteristics on the final results based onhyperspectral data, the following sections pro-vide some simple examples on this issue.
4.1 Spectral Response of Imaging vs.non Imaging Spectrometer Data
Over a three month period from April 27,2009 to July 20, 2009 (DOY 117-210, 84 days),spectral data (imaging hyperspectal data –AI-SA-EAGLE and non-imaging ASD Spectrom-eter) and vegetation parameter measurements(LAI, Chlorophyll SPAD-502, canopy height,vegetation water content, C/N content of veg-etation) were recorded twice a week. Detailson the experimental design can be found un-der 3.2 as well as in lauSch et al. (2012). Forspring barley various vegetation indices wereinvestigated for the AISA-EAGLE imagingspectral data as well as for the ASD non-im-aging hyperspectral data with regard to theirsuitability for the model in terms of variousbiochemical and biophysical vegetation pa-rameters over the entire vegetation period of84 days.
We are able to assume that the differencesin the model results for the vegetation indexGNDVI (R800-R550) do not result from achange in biochemical or biophysical param-eters to the vegetation, soil or atmosphere dueto the fact that both measurements taken us-ing the imaging and non-imaging hyperspec-
Fig. 7: Relationship between vegetation index GNDVI and LAI (leaf area index) obtained fromlaboratory measurements with a) non-imaging spectrometer ASD and b) imaging spectrometerAISA-EAGLE for spring barley. The colours show Chlorophyll SPAD-502 content (unitless) overthe entire growing season (DOY 117-201).

Angela Lausch et al., Scale-specific hyperspectral remote sensing approach 597
4.3 Estimating phenological Stagesof Barley from Time SeriesMeasurements with an ImagingHyperspectral Sensor
The aim of another application for the ap-proach presented in this paper was to set upa model to predict the different phenologicalBBCH macro-stages of barley in the labora-tory on the plot scale and to transfer the bestmodel found to predict the phenological stag-es of barley to the landscape scale. To classifyphenology eight vitality and phenology-relat-ed vegetation parameters were obtained likefor example leaf area index (LAI), Chl-SPAD,C-content, N-content, C/N-content, canopychlorophyll content (CCC), gravimetric watercontent (GWC) and vegetation height (VH) atthe same time that all imaging spectral meas-urements (AISA-EAGLE) were conducted.These biochemical biophysical vegetation pa-rameters were examined according to theirsuitability to record images of various pheno-logical BBCH macro-stages of barley (Biolo-gische Bundesanstalt für Land- und Forstwirt-schaft, Bundessortenamt und CHemische In-dustrie) (Biologische Bundesanstalt für Land-und Forstwirtschaft 2001, hack et al. 1992).The predictive models were developed and
4.2 Monitoring of VegetationParameters and SpectralResponse over an entireflowering Period with the ImagingHyperspectral Sensor
Another study describes the same experimen-tal approach and the results from using theimaging hyperspectral sensor AISA (400–970 nm, 252 spectral bands) under controlledand comparable conditions in a laboratory tostudy the spectral response compared to dif-ferent biochemical and biophysical vegetationand soil parameters (LAI, Chl-SPAD-502,CCC, GWC, vegetation height, C/N-content)over an entire flowering period of spring bar-ley (Fig. 8 a–f). The spectrum of each hyper-spectral image was used to calculate a rangeof vegetation indices (VI’s) that have been re-corded in the literature. Furthermore, all com-binations of the 252 spectral bands were test-ed to calculate a range of vegetation differenceindices (VI’s(xy)) and reflectance value indices(R(X)) at the central wavelength (x nm) of eachband (R(x)). For all three index types we exam-ined the relationship with the vegetation varia-bles measured on the ground by using a cross-validation procedure.
Fig. 8: Long-term vegetation monitoring experiment on scale 1 – laboratory – plot scale of springbarley, DOY 117-210, a) vegetation index GNDVI – obtained from the imaging hyperspectral data– AISA-EAGLE, b) recorded biophysical vegetation parameter – leaf area index (LAI), c) GNDVIand LAI derived from the imaging spectrometer AISA-EAGLE, d) best regression model for esti-mating LAI quantified from GNDVI – AISA-EAGLE, e) transfer of the best regression model forestimating LAI – GNDVI to scale 3 – airborne – regional scale, modelling LAI in 1 m f) the samefor 3 m, recording date 2010-06-15.

598 Photogrammetrie • Fernerkundung • Geoinformation 5/2012
4.4 Spatial Heterogeneity Analysisusing an Imaging HyperspectralSensor
There are very few empirical studies that usehyperspectral data to support the hypothesisof deriving land surface variables from dif-ferent spatial scales. The goal of the currentstudy was to investigate the influence of dif-ferently recorded spatial scale hyperspectraldata on the reflectance behaviour and hetero-geneity of the vegetation. The hyperspectralsensors AISA-EAGLE/HAWK were mountedonto an aircraft to record spectral signaturesover a very short time sequence of a partic-ular day. The reflectance measurements werecollected at three different spatial resolutionsranging from 1 m to 3 m. The NDVI was as-certained from all image data. The NDVI het-erogeneity of all images was compared basedon methods of variography. Variogram mod-els of the NDVI heterogeneity were obtainedfrom the recorded spatial resolutions 1 m, 2 mand 3 m for grassland and deciduous forest(Fig. 10 a–e).
The results showed that the spatial NDVIpatterns of different recorded and scaled datado not correspond among each other. The
tested using four different vegetation indextypes: (I) Published VIs, (II) Reflectance VIsas well as (III) VI(xy) formula combinationsand (IV) a combination of all VIs.
To investigate a differentiation between thephenological BBCH macro-stages of springbarley, many well-known published VIs wereincluded in the analyses. Our results showthat the best prediction of the different mac-ro-stages results from a combination of thepublished VIs PRI (photochemical reflec-tance index), renormalized difference vegeta-tion index (RDVI) as well as the water bandindex (WBI) with a classification accuracy of82.39 %. The best predictive model of the phe-nological BBCH macro-stages was obtainedfrom a comprehensive model using all threeVIs – Published VIs, Reflectance VIs and acombination of formula VIs with a classifica-tion accuracy of 84.80 %. The best predictivemodel was subsequently used on airborne AI-SA-EAGLE hyperspectral data to model thephenological macro-stages of barley on thelandscape level (Fig. 9 e,f).
Fig. 9: Long term vegetation monitoring experiment on scale 1 – laboratory – plot scale of springbarley, DOY 117-210, a) quantification of different vegetation indices based on imaging hyperspec-tral data – AISA-EAGLE, b) BBCH-macro-stages of vegetation, c) spectral response from AISA-EAGLE for the BBCH macro-stages 2, 5, 7 and 9 for barley, d) predictive power of each spectralreflectance value (R(X)) at the central wavelength (x nm) of each band of the imaging AISA-EAGLEspectrometer to classify the phenological BBCH stages 2, 5, 7 and 9 of spring barley, transfer ofthe best model for predicting BBCH macro-stages to scale 3 – airborne – regional scale, e) air-borne AISA-EAGLE hyperspectral data – 1 m spatial resolution, recording date 2010-06-15,shown as a CIR-image, f) modelling the BBCH macro-stages based on the best model from scale1 – plot scale.

Angela Lausch et al., Scale-specific hyperspectral remote sensing approach 599
or wavelength. Confounding factors such asthe phenology of vegetation, BRDF measure-ments from vegetation geometry, and a num-ber of dynamic atmospheric effects etc. canspecifically be eliminated, as such parameterscan be considered to be relatively constantwithin the time frame of 2–3 hrs.
With our preliminary results we were ableto show that it is not only possible to combinesensors with different characteristics, e.g. AI-SA-EAGLE and ASD, geometrically, spectral-ly as well as temporally but also to apply theseprocess investigations over different scales.
A comparability of measuring equipmentwith different imaging optics and sensors isextremely difficult. Spectral sensors have dif-ferent (I) recording characteristics, (II) spec-tra and spatio-temporal recording characteris-tics as well as (III) FOV. Moreover, an attemptto introduce some conformity results in BRDFas well as species-specific spectral responses,which result from a difference in sensors andnot from a difference in processes. It is there-fore extremely difficult to separate these ef-fects.
By using the One Sensor At DifferentScales Approach we are able: a) to developsuitable stress-controlled long-term vegeta-tion indicators for selected target variables
NDVI patterns of different spectral data thatwere recorded showed slight changes. The im-plications behind these findings are that weneed to exercise caution when interpretingand combining spatial structures and spectralindices derived from satellite images with dif-ferently recorded geometric resolutions.
5 Conclusion and Outlook
The objective of this paper was to propose ourscaling method of combining hyperspectralremote sensing data from different spatial andtemporal scales and to point out the potentialof using only one and the same imaging hy-perspectral sensor as the input to plot the lo-cal, regional and landscape level.
The use of one hyperspectral sensor at dif-ferent temporal and spatial scales (“One Sen-sor At Different Scales” – OSADIS Approach,lauSch et al. 2012) offers the unique advan-tage of a true comparison of data at differentspatial scales as well as the transfer of processinformation obtained from long-term in-situmonitoring investigations. It is possible to in-vestigate the effect of different spatial, tempo-ral, spectral and directional scales of land sur-faces i.e. heterogeneity, vegetation phenology
Fig. 10: Calculation of NDVI from the AISA-EAGLE/HAWK (DUAL) hyperspectral data recordedwith different ground resolutions, recording date 2010-09-11, a) 1 m, b) 2 m, c) 3 m, Semivariance– NDVI for d) grassland and e) deciduous forest – derived from hyperspectral data (AISA-EAGLE/HAWK) recorded at a spatial resolution of 1 m, 2 m and 3 m.

600 Photogrammetrie • Fernerkundung • Geoinformation 5/2012
& uStin, S.l., 2009: PROSPECT plus SAILmodels: A review of use for vegetation charac-terization. – Remote Sensing of Environment113: 56–66.
lauSch, a., pauSe, m., merbach, i., ZachariaS, S.,doktor, d., Volk, m. & Seppelt, r., 2012: Anew multi-scale approach for monitoring vegeta-tion using remote sensing-based indicators inlaboratory, field and landscape. – EnvironmentalMonitoring and Assessment, doi: 10.1007/s10661-012-2627-8).
mäkiSara, k., meinander, m., rantaSuo, m., ok-konen, J., aikio, m., Sipola, k., pylkkö, p. &braam, b, 1993: Airborne Imaging Spectrome-ter for Applications (AISA). – Digest ofIGARSS’93 (2): 479–481, Tokyo, Japan.
Schaepman, m.e., uStin, S.l., plaZa, a.J., paint-er, t.h., VerrelSt, J. & liang, S.l., 2009: Earthsystem science related imaging spectroscopy. –An assessment. – Remote Sensing of Environ-ment 113: 123–137.
Stuffler, t., forSter, k., hofer, S., leipold, m.,Sang, b., kaufmann, h., penne, b., mueller, a.& chlebek, c., 2009: Hyperspectral imaging. –An advanced instrument concept for the En-MAP mission (Environmental Mapping andAnalysis Programme). – Acta Astronautica 65:1107–1112.
ZachariaS, S., bogena, h., Samaniego, l., maud-er, m., fuSS, r., pütZ, t., frenZel, m., Schwank,m, baeSSler, c., butterbach-bahl, k., benS,o., borg, e., brauer, e., dietrich, p., haJnSek,i., helle, g., kieSe, r., kunStmann, h., klotZ,S., munch, J.c, papen, h., prieSack, e., Schmid,h.p., Steinbrecher, r., roSenbaum, u., teutSch,g. & Vereecken, h., 2011: A network of terres-trial environmental observatories in Germany.– Vadose Zone Journal 10: 955–973.
Addresses of the Authors:
Dr. angela lauSch, Helmholtz Centre for Environ-mental Research –UFZ, Department Computation-al Landscape Ecology, Permoserstraße 15, D-04318Leipzig, Tel.: +49-341-235-1961, e-mail: [email protected]
Dr. marion pauSe, University of Tübingen, Water& Earth System Science Competence Centre, Kep-lerstrasse 17, D-72074 Tübingen, Tel.: +49-7071-2975240, e-mail: [email protected]
Dr. ineS merbach , Helmholtz Centre for Environ-mental Research – UFZ, Department of Commu-nity Ecology, Theodor-Lieser-Str. 4, D-06120Halle, Tel.: +49-345 558 5393, e-mail:[email protected]
like for example LAI, chlorophyll, photosyn-thesis activity, water content, nutrient contentetc. b) to realistically transfer the models ob-tained to the landscape level c) to record imag-ing hyperspectral information at different spa-tial scales, whereby we are able to achieve atrue comparison of the structural and processresults obtained d) to minimize the existingmagnitude of errors from geometrical, spec-tral and temporal effects due to sensor- andtemporal-specific differences e) to carry out atop-up and down-scaling through the determi-nation of scale-dependent correction factorsand transfer functions. f) With our scale ap-proach (OSADIS) we attempt to understandscales, structures, patterns and their temporalchanges better and in more depth and are ableto describe or quantify them at all.
References
bannari, a., khurShid, k.S., StaenZ, k. &SchwarZ, J.w., 2007: A comparison of hyper-spectral chlorophyll indices for wheat crop chlo-rophyll content estimation using laboratory re-flectance measurements. – IEEE TransactionsOn Geoscience And Remote Sensing 45: 3063–3074.
biologiSche bundeSanStalt für land- und forSt-wirtSchaft, 2001: Entwicklungsstadien mono-und dikotyler Pflanzen. – BBCH Monographie,http://www.jki.bund.de/index.php?id=1075&q=bbch (05.06.2012).
haboudane, d., miller, J.r., pattey, e., Zarco-teJada, p.J. & Strachan, i.b., 2004: Hyperspec-tral vegetation indices and novel algorithms forpredicting green LAI of crop canopies: Model-ing and validation in the context of precision ag-riculture. – Remote Sensing of Environment 90:337–352.
hack, h., bleiholder, h., buhr, l., meier, u.,Schnock-fricke, u., weber, e. & witZenber-ger, a., 1992: Einheitliche Codierung der phä-nologischen Entwicklungsstadien mono- unddikotyler Pflanzen. – Erweiterte BBCH-Skala,Allgemein. – Nachrichtenblatt Deutscher Pflan-zenschutzdienst 44: 265–270.
houborg, r. & anderSon, m.c., 2009: Utility of animage-based canopy reflectance modeling toolfor remote estimation of LAI and leaf chloro-phyll content at regional scales. – Journal of Ap-plied Remote Sensing 3: 259–274.
Jacquemoud, S., Verhoef, w., baret, f., bacour,c., Zarco-teJada, p.J., aSner, g.p., francoiS, c.

Angela Lausch et al., Scale-specific hyperspectral remote sensing approach 601
ment Monitoring and Exploration Technologies,Permoserstraße 15, D-04318 Leipzig, Tel.: +49-341-235-1381, e-mail: [email protected]
Prof. Dr. ralf Seppelt, Helmholtz Centre for Envi-ronmental Research – UFZ, Department Computa-tional Landscape Ecology, Permoserstraße 15,D-04318 Leipzig, Tel.: +49-341-235-1250, e-mail:[email protected]
Manuskript eingereicht: November 2011Angenommen: Mai 2012
Sarah gwillym-margianto, Helmholtz Centre forEnvironmental Research – UFZ, Department ofCommunity Ecology, Theodor-Lieser-Str. 4,D-06120 Halle, Tel.: +49-179-4784912, e-mail:[email protected]
Prof. Dr. karSten SchulZ, Department of Geogra-phy, Ludwig-Maximilians-Universität München,Luisenstr. 37, D-80333 München, Tel.: +49-89-2180-6681, e-mail: [email protected]
Dr. Steffen ZachariaS, Helmholtz Centre for Envi-ronmental Research – UFZ, Department Depart-