SACRAMENTO REGION FOOD HUB FEASIBILITY ANALYSIS … · SACRAMENTO REGION FOOD HUB FEASIBILITY...
14
SACRAMENTO REGION FOOD HUB FEASIBILITY ANALYSIS PROJECT SUMMARY November, 2014 Prepared by: Applied Development Economics, Inc. In partnership with: Foodpro International, Inc. The Hatamiya Group DH Consulting SACRAMENTO REGION FOOD HUB FEASIBILITY ANALYSIS A project of the Rural-Urban Connections Strategy (RUCS)
Transcript of SACRAMENTO REGION FOOD HUB FEASIBILITY ANALYSIS … · SACRAMENTO REGION FOOD HUB FEASIBILITY...
SACRAMENTO REGION FOOD HUB FEASIBILITY
ANALYSIS
PROJECT SUMMARY
November, 2014
Prepared by:
Applied Development Economics, Inc.
In partnership with:
Foodpro International, Inc. The Hatamiya Group
DH Consulting
SACRAMENTO REGION FOOD HUB FEASIBILITY ANALYSIS
A project of the
Rural-Urban Connections Strategy
(RUCS)
SACOG Regional Agricultural Infrastructure Project – Executive Summary 1 | P a g e
ABOUT THIS PROJECT
The six-county Sacramento region is America’s Farm to Fork Capital,
with a wealth and diversity of agricultural bounty that is unrivaled. It is
at the heart of one of the largest agricultural economies in the world.
Some of the region’s key assets include:
Almost 1.5 million acres of farmland, with more than 7,200
farms and ranches of all sizes1
Production of more than 150 crops totaling 3.4 million tons2
Farm gate value of crop production of $2.15 billion in 20133
An estimated $3.4 billion annual output in the overall
agriculture and food industry cluster value chain, employing
more than 37,000 workers in 20114
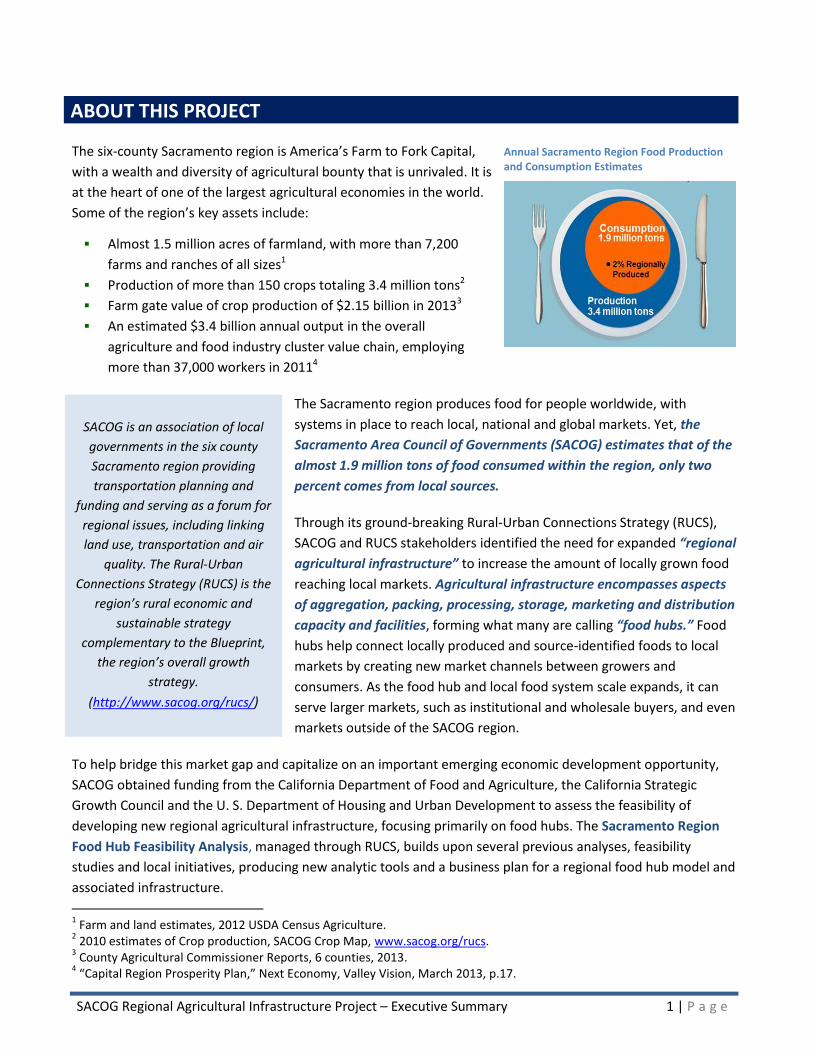
The Sacramento region produces food for people worldwide, with
systems in place to reach local, national and global markets. Yet, the
Sacramento Area Council of Governments (SACOG) estimates that of the
almost 1.9 million tons of food consumed within the region, only two
percent comes from local sources.
Through its ground-breaking Rural-Urban Connections Strategy (RUCS),
SACOG and RUCS stakeholders identified the need for expanded “regional
agricultural infrastructure” to increase the amount of locally grown food
reaching local markets. Agricultural infrastructure encompasses aspects
of aggregation, packing, processing, storage, marketing and distribution
capacity and facilities, forming what many are calling “food hubs.” Food
hubs help connect locally produced and source-identified foods to local
markets by creating new market channels between growers and
consumers. As the food hub and local food system scale expands, it can
serve larger markets, such as institutional and wholesale buyers, and even
markets outside of the SACOG region.
To help bridge this market gap and capitalize on an important emerging economic development opportunity,
SACOG obtained funding from the California Department of Food and Agriculture, the California Strategic Growth Council and the U. S. Department of Housing and Urban Development to assess the feasibility of
developing new regional agricultural infrastructure, focusing primarily on food hubs. The Sacramento Region
Food Hub Feasibility Analysis, managed through RUCS, builds upon several previous analyses, feasibility
studies and local initiatives, producing new analytic tools and a business plan for a regional food hub model and
associated infrastructure.
1 Farm and land estimates, 2012 USDA Census Agriculture.
2 2010 estimates of Crop production, SACOG Crop Map, www.sacog.org/rucs.
3 County Agricultural Commissioner Reports, 6 counties, 2013.
4 “Capital Region Prosperity Plan,” Next Economy, Valley Vision, March 2013, p.17.
SACOG is an association of local
governments in the six county
Sacramento region providing
transportation planning and
funding and serving as a forum for
regional issues, including linking
land use, transportation and air
quality. The Rural-Urban
Connections Strategy (RUCS) is the
region’s rural economic and
sustainable strategy
complementary to the Blueprint,
the region’s overall growth
strategy.
(http://www.sacog.org/rucs/)
Annual Sacramento Region Food Production and Consumption Estimates
SACOG Regional Agricultural Infrastructure Project – Executive Summary 2 | P a g e
SACOG developed the project’s tools, models and business plan as resources for entrepreneurs, jurisdictions,
developers, investors and other stakeholders to advance the development of regional agricultural
infrastructure. This expansion will enable the region to meet its stated goals to:
Improve the economic viability of local growers by creating new markets and increasing capacity;
Increase access to healthy foods, especially fresh produce, in underserved communities;
Help meet strong and growing consumer, business and institutional demand for fresh, local and
sustainably grown produce;
Keep important agricultural lands in production;
Strengthen the region’s many rural communities; and,
Increase business growth and job creation, a priority of the regional prosperity strategy, Next Economy.
To conduct the project, SACOG contracted with a consulting team (Project Team) led by Applied Development
Economics, Inc., in partnership with Foodpro International, Inc., the Hatamiya Group, and DH Consulting. The
Project Team, along with SACOG, prepared several interrelated reports, described below, which contain
findings resulting from detailed market and financial research, consultation and analyses.
SACRAMENTO REGION FOOD HUB FEASIILITY ANALYSIS REPORTS
Research Analysis of Food Hub Trends and Characteristics: Overview of national trends on food hubs,
market context including information on illustrative suppliers and institutional/business consumers of
fresh produce in the region, and examples of successful/promising types of hub business models.
Sacramento Region Food Hub Cost Estimate Analysis: Capital and operating costs for a prototypical
22,150 square foot hub enterprise with mid-scale aggregation, distribution and processing functions.
Sacramento Region Food Banks and Food Hub Development: Capability of food banks to incubate
and/or support a regional food hub, and their role in transforming the regional food system by sourcing
and promoting healthy, locally grown foods and expanding their own infrastructure/facilities.
Sacramento Region Food Hub Business Plan: A business model, financial feasibility analytic tools and
business plan for the proposed hub, including information on regional market demand, illustrative target
crops, and findings of the feasibility analysis. It is supplemented by the Financial Feasibility Toolkit, a
user manual that accompanies pro forma worksheets and illustrates how the business model feasibility
analysis works.
Impediments to Supplying Locally Grown Specialty Crops: Identification of barriers for both growers
and food hubs in building and scaling up the local food system, and analysis of possible economic
development incentives aimed at overcoming barriers for specialty crop market avenues.
SUMMARY
SACOG Regional Agricultural Infrastructure Project – Executive Summary 3 | P a g e
KEY FINDINGS
The Sacramento Region Market Opportunity
Fresh Produce Regional Demand
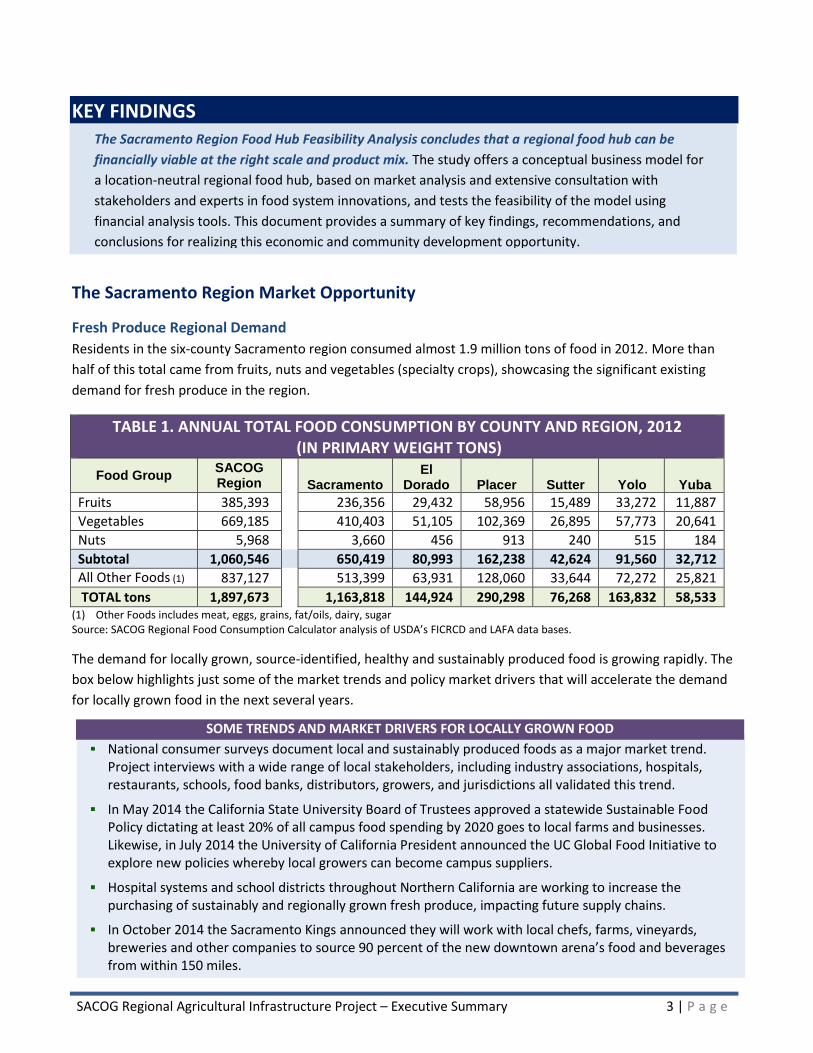
Residents in the six-county Sacramento region consumed almost 1.9 million tons of food in 2012. More than
half of this total came from fruits, nuts and vegetables (specialty crops), showcasing the significant existing
demand for fresh produce in the region.
TABLE 1. ANNUAL TOTAL FOOD CONSUMPTION BY COUNTY AND REGION, 2012 (IN PRIMARY WEIGHT TONS)
Food Group SACOG Region Sacramento
El Dorado Placer Sutter Yolo Yuba
Fruits 385,393 236,356 29,432 58,956 15,489 33,272 11,887
Vegetables 669,185 410,403 51,105 102,369 26,895 57,773 20,641
Nuts 5,968 3,660 456 913 240 515 184
Subtotal 1,060,546 650,419 80,993 162,238 42,624 91,560 32,712
All Other Foods (1) 837,127 513,399 63,931 128,060 33,644 72,272 25,821
TOTAL tons 1,897,673 1,163,818 144,924 290,298 76,268 163,832 58,533 (1) Other Foods includes meat, eggs, grains, fat/oils, dairy, sugar Source: SACOG Regional Food Consumption Calculator analysis of USDA’s FICRCD and LAFA data bases.
The demand for locally grown, source-identified, healthy and sustainably produced food is growing rapidly. The
box below highlights just some of the market trends and policy market drivers that will accelerate the demand
for locally grown food in the next several years.
SOME TRENDS AND MARKET DRIVERS FOR LOCALLY GROWN FOOD
National consumer surveys document local and sustainably produced foods as a major market trend. Project interviews with a wide range of local stakeholders, including industry associations, hospitals, restaurants, schools, food banks, distributors, growers, and jurisdictions all validated this trend.
In May 2014 the California State University Board of Trustees approved a statewide Sustainable Food Policy dictating at least 20% of all campus food spending by 2020 goes to local farms and businesses. Likewise, in July 2014 the University of California President announced the UC Global Food Initiative to explore new policies whereby local growers can become campus suppliers.
Hospital systems and school districts throughout Northern California are working to increase the purchasing of sustainably and regionally grown fresh produce, impacting future supply chains.
In October 2014 the Sacramento Kings announced they will work with local chefs, farms, vineyards, breweries and other companies to source 90 percent of the new downtown arena’s food and beverages from within 150 miles.
The Sacramento Region Food Hub Feasibility Analysis concludes that a regional food hub can be
financially viable at the right scale and product mix. The study offers a conceptual business model for
a location-neutral regional food hub, based on market analysis and extensive consultation with
stakeholders and experts in food system innovations, and tests the feasibility of the model using
financial analysis tools. This document provides a summary of key findings, recommendations, and
conclusions for realizing this economic and community development opportunity.
SACOG Regional Agricultural Infrastructure Project – Executive Summary 4 | P a g e
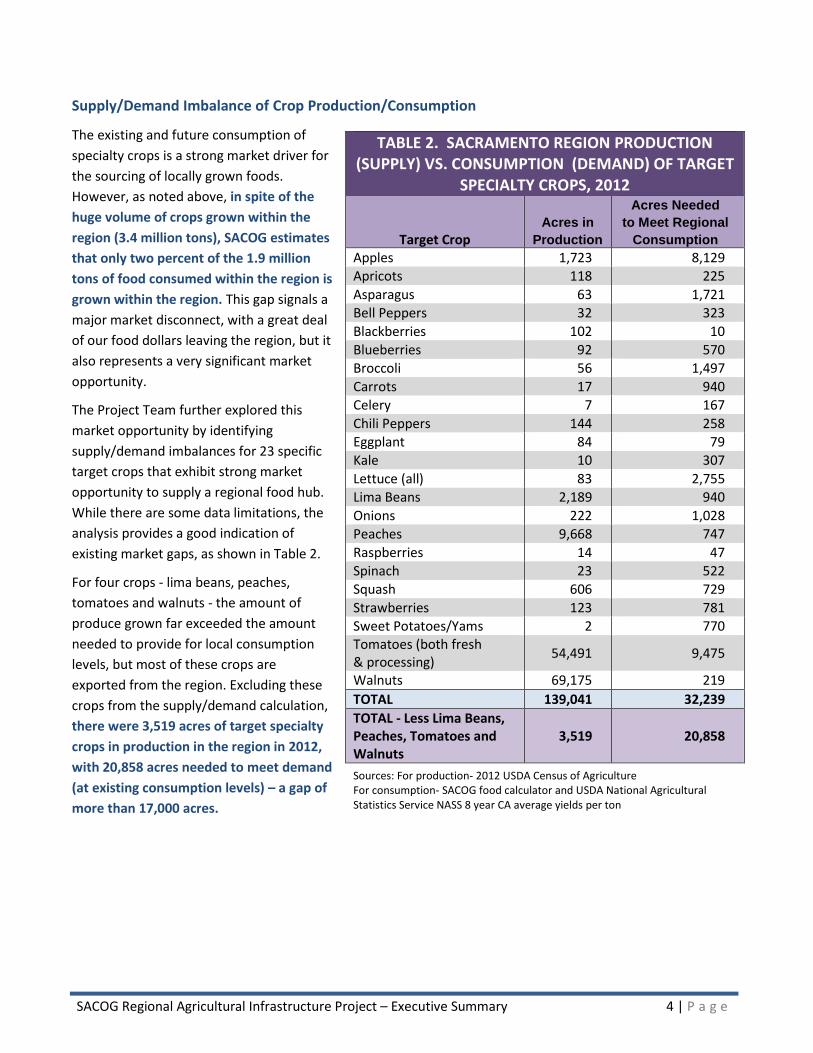
Supply/Demand Imbalance of Crop Production/Consumption
The existing and future consumption of
specialty crops is a strong market driver for
the sourcing of locally grown foods.
However, as noted above, in spite of the
huge volume of crops grown within the
region (3.4 million tons), SACOG estimates
that only two percent of the 1.9 million
tons of food consumed within the region is
grown within the region. This gap signals a
major market disconnect, with a great deal
of our food dollars leaving the region, but it
also represents a very significant market
opportunity.
The Project Team further explored this
market opportunity by identifying
supply/demand imbalances for 23 specific
target crops that exhibit strong market
opportunity to supply a regional food hub.
While there are some data limitations, the
analysis provides a good indication of
existing market gaps, as shown in Table 2.
For four crops - lima beans, peaches,
tomatoes and walnuts - the amount of
produce grown far exceeded the amount
needed to provide for local consumption
levels, but most of these crops are
exported from the region. Excluding these
crops from the supply/demand calculation,
there were 3,519 acres of target specialty
crops in production in the region in 2012,
with 20,858 acres needed to meet demand
(at existing consumption levels) – a gap of
more than 17,000 acres.
TABLE 2. SACRAMENTO REGION PRODUCTION (SUPPLY) VS. CONSUMPTION (DEMAND) OF TARGET
SPECIALTY CROPS, 2012
Target Crop Acres in
Production
Acres Needed
to Meet Regional
Consumption
Apples 1,723 8,129 Apricots 118 225
Asparagus 63 1,721 Bell Peppers 32 323
Blackberries 102 10
Blueberries 92 570 Broccoli 56 1,497
Carrots 17 940 Celery 7 167
Chili Peppers 144 258 Eggplant 84 79
Kale 10 307
Lettuce (all) 83 2,755
Lima Beans 2,189 940
Onions 222 1,028
Peaches 9,668 747
Raspberries 14 47
Spinach 23 522 Squash 606 729
Strawberries 123 781 Sweet Potatoes/Yams 2 770 Tomatoes (both fresh & processing)
54,491 9,475
Walnuts 69,175 219
TOTAL 139,041 32,239
TOTAL - Less Lima Beans, Peaches, Tomatoes and Walnuts
3,519 20,858
Sources: For production- 2012 USDA Census of Agriculture For consumption- SACOG food calculator and USDA National Agricultural Statistics Service NASS 8 year CA average yields per ton
SACOG Regional Agricultural Infrastructure Project – Executive Summary 5 | P a g e
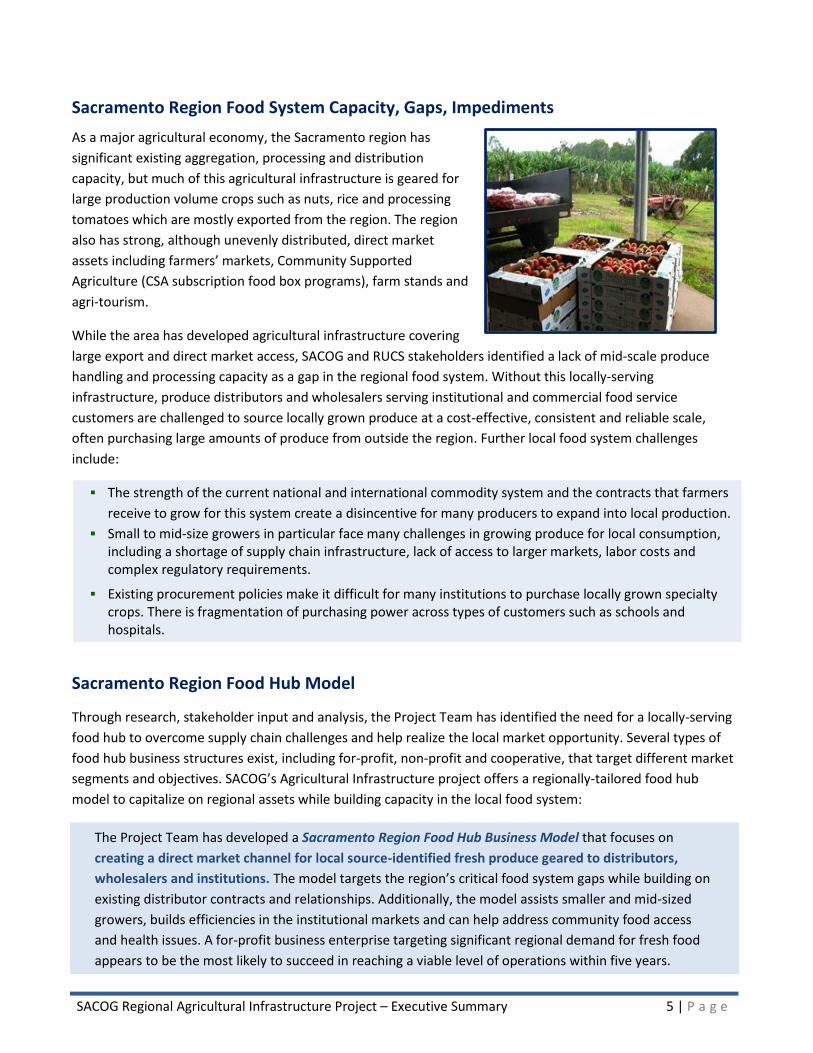
Sacramento Region Food System Capacity, Gaps, Impediments
As a major agricultural economy, the Sacramento region has
significant existing aggregation, processing and distribution
capacity, but much of this agricultural infrastructure is geared for
large production volume crops such as nuts, rice and processing
tomatoes which are mostly exported from the region. The region
also has strong, although unevenly distributed, direct market
assets including farmers’ markets, Community Supported
Agriculture (CSA subscription food box programs), farm stands and
agri-tourism.
While the area has developed agricultural infrastructure covering
large export and direct market access, SACOG and RUCS stakeholders identified a lack of mid-scale produce
handling and processing capacity as a gap in the regional food system. Without this locally-serving
infrastructure, produce distributors and wholesalers serving institutional and commercial food service
customers are challenged to source locally grown produce at a cost-effective, consistent and reliable scale,
often purchasing large amounts of produce from outside the region. Further local food system challenges
include:
The strength of the current national and international commodity system and the contracts that farmers
receive to grow for this system create a disincentive for many producers to expand into local production.
Small to mid-size growers in particular face many challenges in growing produce for local consumption, including a shortage of supply chain infrastructure, lack of access to larger markets, labor costs and complex regulatory requirements.
Existing procurement policies make it difficult for many institutions to purchase locally grown specialty crops. There is fragmentation of purchasing power across types of customers such as schools and hospitals.
Sacramento Region Food Hub Model
Through research, stakeholder input and analysis, the Project Team has identified the need for a locally-serving
food hub to overcome supply chain challenges and help realize the local market opportunity. Several types of
food hub business structures exist, including for-profit, non-profit and cooperative, that target different market
segments and objectives. SACOG’s Agricultural Infrastructure project offers a regionally-tailored food hub
model to capitalize on regional assets while building capacity in the local food system:
The Project Team has developed a Sacramento Region Food Hub Business Model that focuses on
creating a direct market channel for local source-identified fresh produce geared to distributors,
wholesalers and institutions. The model targets the region’s critical food system gaps while building on
existing distributor contracts and relationships. Additionally, the model assists smaller and mid-sized
growers, builds efficiencies in the institutional markets and can help address community food access
and health issues. A for-profit business enterprise targeting significant regional demand for fresh food
appears to be the most likely to succeed in reaching a viable level of operations within five years.
SACOG Regional Agricultural Infrastructure Project – Executive Summary 6 | P a g e
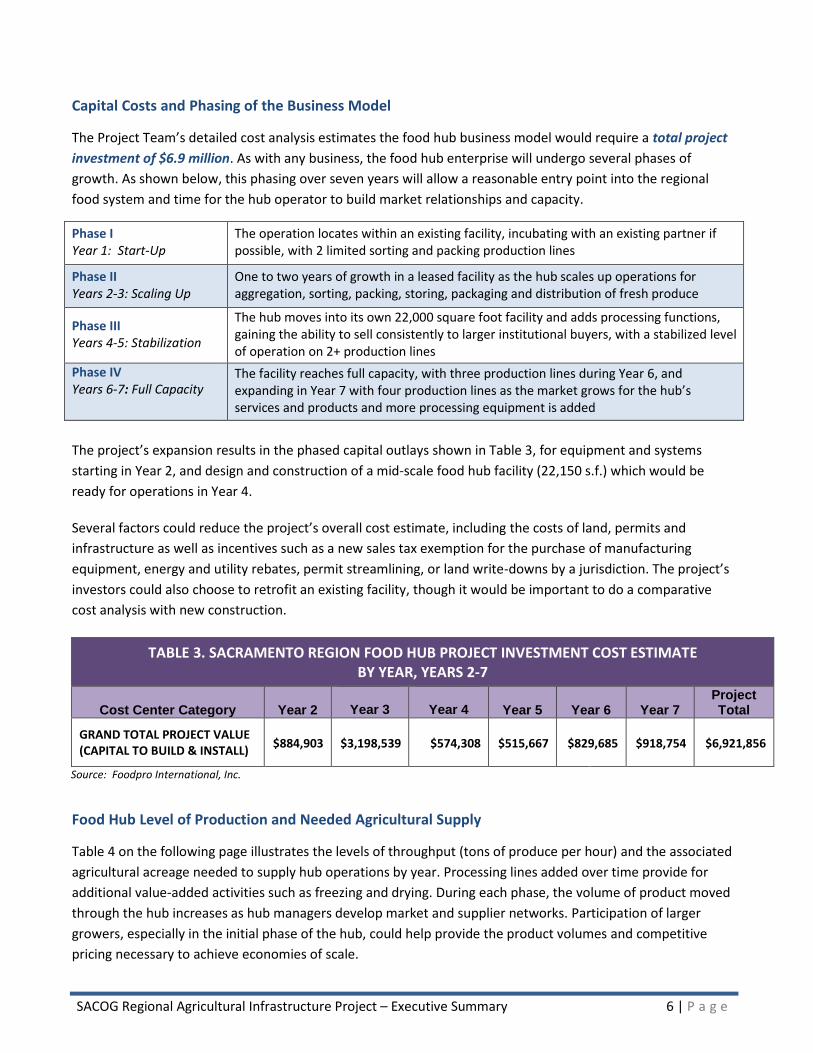
Capital Costs and Phasing of the Business Model
The Project Team’s detailed cost analysis estimates the food hub business model would require a total project
investment of $6.9 million. As with any business, the food hub enterprise will undergo several phases of
growth. As shown below, this phasing over seven years will allow a reasonable entry point into the regional
food system and time for the hub operator to build market relationships and capacity.
Phase I Year 1: Start-Up
The operation locates within an existing facility, incubating with an existing partner if possible, with 2 limited sorting and packing production lines
Phase II Years 2-3: Scaling Up
One to two years of growth in a leased facility as the hub scales up operations for aggregation, sorting, packing, storing, packaging and distribution of fresh produce
Phase III Years 4-5: Stabilization
The hub moves into its own 22,000 square foot facility and adds processing functions, gaining the ability to sell consistently to larger institutional buyers, with a stabilized level of operation on 2+ production lines
Phase IV Years 6-7: Full Capacity
The facility reaches full capacity, with three production lines during Year 6, and expanding in Year 7 with four production lines as the market grows for the hub’s services and products and more processing equipment is added
The project’s expansion results in the phased capital outlays shown in Table 3, for equipment and systems
starting in Year 2, and design and construction of a mid-scale food hub facility (22,150 s.f.) which would be
ready for operations in Year 4.
Several factors could reduce the project’s overall cost estimate, including the costs of land, permits and
infrastructure as well as incentives such as a new sales tax exemption for the purchase of manufacturing
equipment, energy and utility rebates, permit streamlining, or land write-downs by a jurisdiction. The project’s
investors could also choose to retrofit an existing facility, though it would be important to do a comparative
cost analysis with new construction.
TABLE 3. SACRAMENTO REGION FOOD HUB PROJECT INVESTMENT COST ESTIMATE BY YEAR, YEARS 2-7
Cost Center Category Year 2
Year 3
Year 4 Year 5 Year 6 Year 7
Project Total
GRAND TOTAL PROJECT VALUE (CAPITAL TO BUILD & INSTALL)
$884,903 $3,198,539 $574,308 $515,667 $829,685 $918,754 $6,921,856
Source: Foodpro International, Inc.
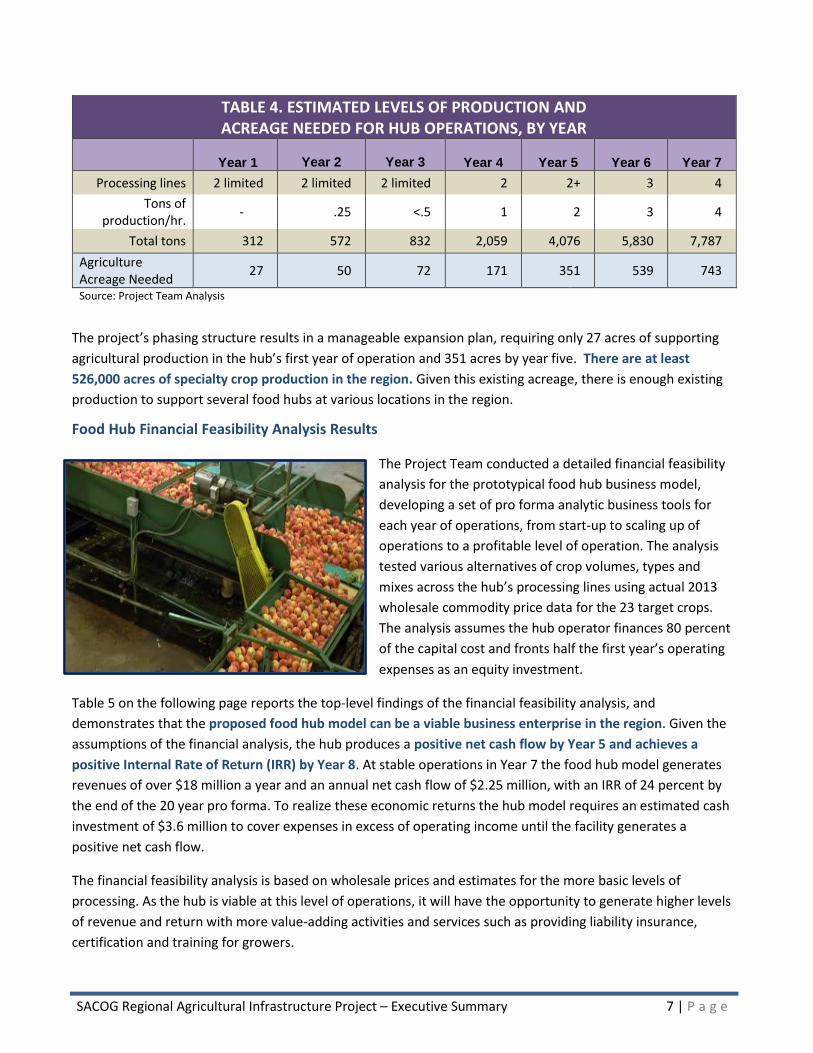
Food Hub Level of Production and Needed Agricultural Supply
Table 4 on the following page illustrates the levels of throughput (tons of produce per hour) and the associated
agricultural acreage needed to supply hub operations by year. Processing lines added over time provide for
additional value-added activities such as freezing and drying. During each phase, the volume of product moved
through the hub increases as hub managers develop market and supplier networks. Participation of larger
growers, especially in the initial phase of the hub, could help provide the product volumes and competitive
pricing necessary to achieve economies of scale.
SACOG Regional Agricultural Infrastructure Project – Executive Summary 7 | P a g e
TABLE 4. ESTIMATED LEVELS OF PRODUCTION AND ACREAGE NEEDED FOR HUB OPERATIONS, BY YEAR
Year 1
Year 2
Year 3 Year 4 Year 5 Year 6 Year 7
Processing lines 2 limited 2 limited 2 limited 2 2+ 3 4
Tons of production/hr.
- .25 <.5 1 2 3 4
Total tons 312 572 832 2,059 4,076 5,830 7,787
Agriculture Acreage Needed
27 50 72 171 351 539 743
Source: Project Team Analysis
The project’s phasing structure results in a manageable expansion plan, requiring only 27 acres of supporting
agricultural production in the hub’s first year of operation and 351 acres by year five. There are at least
526,000 acres of specialty crop production in the region. Given this existing acreage, there is enough existing
production to support several food hubs at various locations in the region.
Food Hub Financial Feasibility Analysis Results
The Project Team conducted a detailed financial feasibility
analysis for the prototypical food hub business model,
developing a set of pro forma analytic business tools for
each year of operations, from start-up to scaling up of
operations to a profitable level of operation. The analysis
tested various alternatives of crop volumes, types and
mixes across the hub’s processing lines using actual 2013
wholesale commodity price data for the 23 target crops.
The analysis assumes the hub operator finances 80 percent
of the capital cost and fronts half the first year’s operating
expenses as an equity investment.
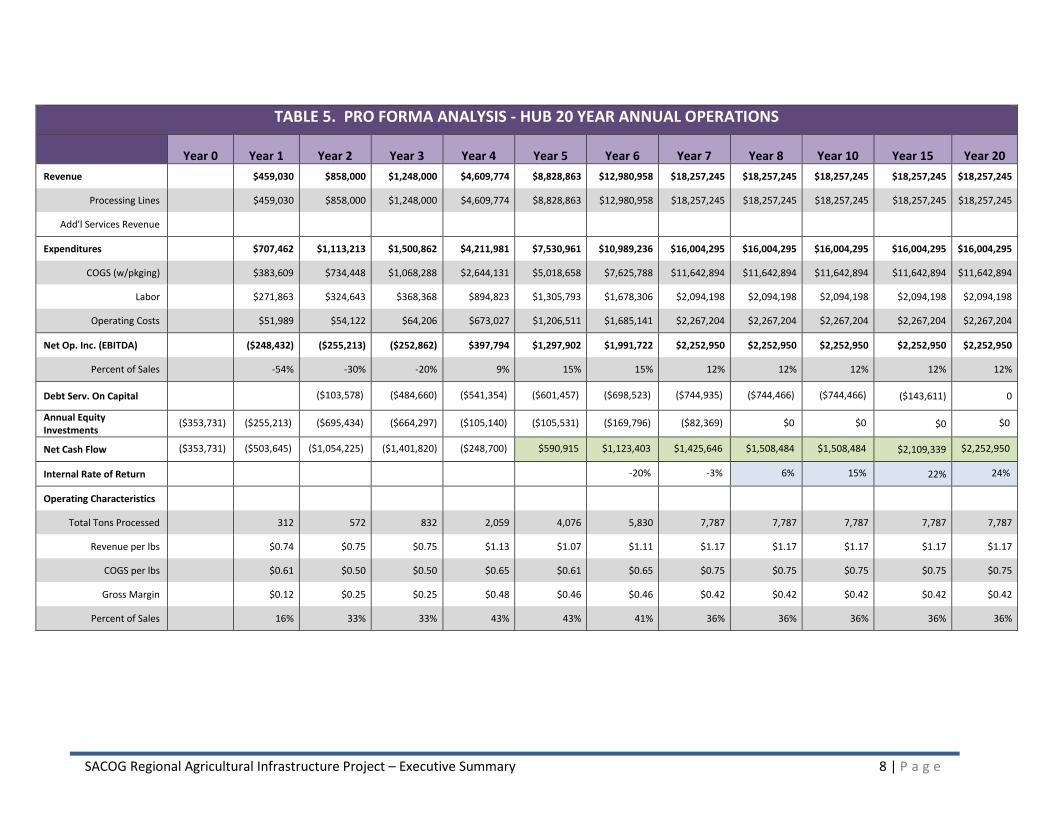
Table 5 on the following page reports the top-level findings of the financial feasibility analysis, and
demonstrates that the proposed food hub model can be a viable business enterprise in the region. Given the
assumptions of the financial analysis, the hub produces a positive net cash flow by Year 5 and achieves a
positive Internal Rate of Return (IRR) by Year 8. At stable operations in Year 7 the food hub model generates
revenues of over $18 million a year and an annual net cash flow of $2.25 million, with an IRR of 24 percent by
the end of the 20 year pro forma. To realize these economic returns the hub model requires an estimated cash
investment of $3.6 million to cover expenses in excess of operating income until the facility generates a
positive net cash flow.
The financial feasibility analysis is based on wholesale prices and estimates for the more basic levels of
processing. As the hub is viable at this level of operations, it will have the opportunity to generate higher levels
of revenue and return with more value-adding activities and services such as providing liability insurance,
certification and training for growers.
SACOG Regional Agricultural Infrastructure Project – Executive Summary 8 | P a g e
TABLE 5. PRO FORMA ANALYSIS - HUB 20 YEAR ANNUAL OPERATIONS
Year 0 Year 1 Year 2 Year 3 Year 4 Year 5 Year 6 Year 7 Year 8 Year 10 Year 15 Year 20
Revenue $459,030 $858,000 $1,248,000 $4,609,774 $8,828,863 $12,980,958 $18,257,245 $18,257,245 $18,257,245 $18,257,245 $18,257,245
Processing Lines $459,030 $858,000 $1,248,000 $4,609,774 $8,828,863 $12,980,958 $18,257,245 $18,257,245 $18,257,245 $18,257,245 $18,257,245
Add'l Services Revenue
Expenditures $707,462 $1,113,213 $1,500,862 $4,211,981 $7,530,961 $10,989,236 $16,004,295 $16,004,295 $16,004,295 $16,004,295 $16,004,295
COGS (w/pkging) $383,609 $734,448 $1,068,288 $2,644,131 $5,018,658 $7,625,788 $11,642,894 $11,642,894 $11,642,894 $11,642,894 $11,642,894
Labor $271,863 $324,643 $368,368 $894,823 $1,305,793 $1,678,306 $2,094,198 $2,094,198 $2,094,198 $2,094,198 $2,094,198
Operating Costs $51,989 $54,122 $64,206 $673,027 $1,206,511 $1,685,141 $2,267,204 $2,267,204 $2,267,204 $2,267,204 $2,267,204
Net Op. Inc. (EBITDA) ($248,432) ($255,213) ($252,862) $397,794 $1,297,902 $1,991,722 $2,252,950 $2,252,950 $2,252,950 $2,252,950 $2,252,950
Percent of Sales -54% -30% -20% 9% 15% 15% 12% 12% 12% 12% 12%
Debt Serv. On Capital
($103,578) ($484,660) ($541,354) ($601,457) ($698,523) ($744,935) ($744,466) ($744,466) ($143,611) 0
Annual Equity Investments
($353,731) ($255,213) ($695,434) ($664,297) ($105,140) ($105,531) ($169,796) ($82,369) $0 $0 $0 $0
Net Cash Flow ($353,731) ($503,645) ($1,054,225) ($1,401,820) ($248,700) $590,915 $1,123,403 $1,425,646 $1,508,484 $1,508,484 $2,109,339 $2,252,950
Internal Rate of Return -20% -3% 6% 15% 22% 24%
Operating Characteristics
Total Tons Processed 312 572 832 2,059 4,076 5,830 7,787 7,787 7,787 7,787 7,787
Revenue per lbs $0.74 $0.75 $0.75 $1.13 $1.07 $1.11 $1.17 $1.17 $1.17 $1.17 $1.17
COGS per lbs $0.61 $0.50 $0.50 $0.65 $0.61 $0.65 $0.75 $0.75 $0.75 $0.75 $0.75
Gross Margin $0.12 $0.25 $0.25 $0.48 $0.46 $0.46 $0.42 $0.42 $0.42 $0.42 $0.42
Percent of Sales 16% 33% 33% 43% 43% 41% 36% 36% 36% 36% 36%
SACOG Regional Agricultural Infrastructure Project – Executive Summary 9 | P a g e
TARGETED PROJECT FINDINGS
FOR INVESTORS
Hub Business Model
The Project Team found that a for-profit business model for a Sacramento region food hub is the best
approach. The Project Team considered a number of important factors in reaching this conclusion, including:
Diversity of current regional crop production as well as the potential for future production
Scalability of crop production mix and market distribution opportunities
Flexibility of the proposed food hub processing lines to meet market demand
Strong potential for short-term profitability and ongoing viability
Reasonable initial capital investment, and
Lack of need for public subsidy
The project’s pro forma shows that the hub needs to reach an expanded scale of operations to achieve
profitability and sustained viability over the long-term. Many nonprofit hubs across the country do not operate
at this projected level of scale and can face difficulty achieving the level of private capital investment needed
without some form of public subsidy. In contrast, the for-profit model helps overcome funding challenges and
offers flexibility to respond to market conditions and opportunities well into the future. The hub’s business
model is designed with the capacity to quickly adapt processing lines for different crop mixes depending on
market opportunities and emerging food trends.
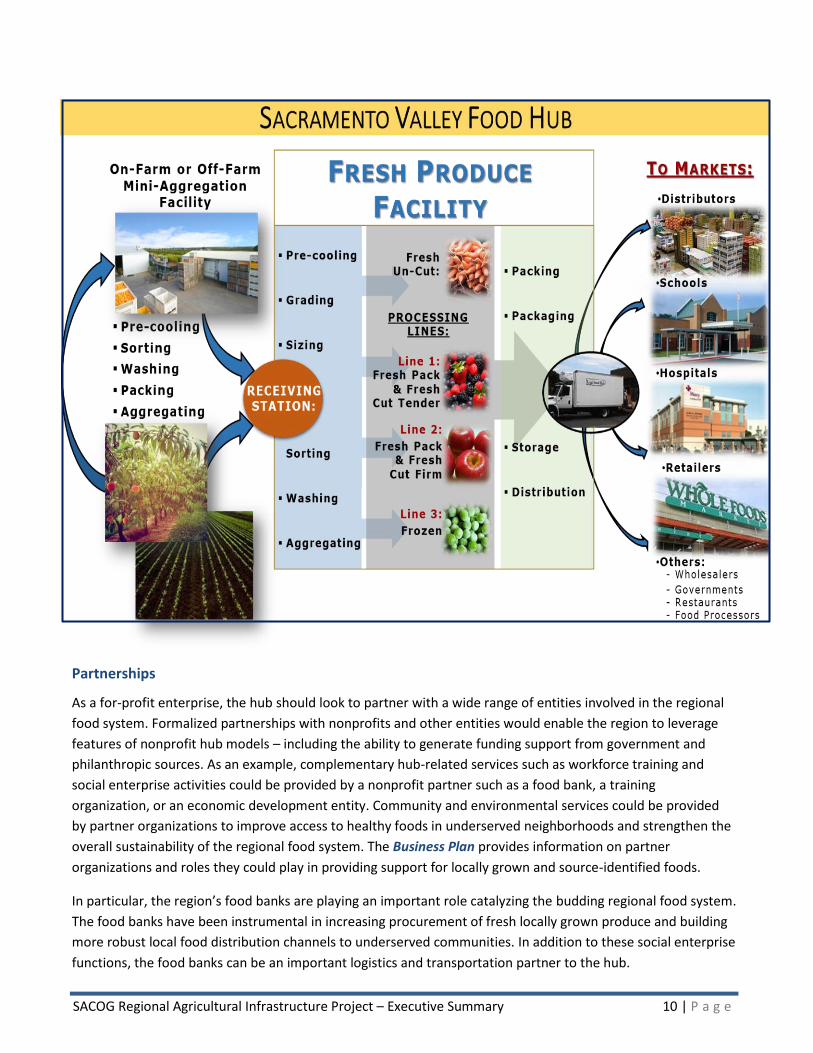
Hub Target Markets, Functions and Services
The hub’s business model provides a market channel for locally sourced and identified foods to access the
region’s institutional and large-customer markets using existing supply networks. To fill this market niche the
proposed Sacramento region hub model incorporates a continuum of activities and services beyond a basic hub
facility, including light food processing, marketing, branding and technical assistance to farmers. Two functions
are essential—marketing and creating a clear and compelling brand for the hub, and providing technical
assistance and capacity building to farmers. Research shows that growers working with food hubs improve their
business and crop planning, which often results in better financial outcomes. Emphasizing a strong relationship
with growers will help ensure a consistent, quality supply of produce, especially during the first few years of the
hub. The graphic below illustrates the hub’s proposed markets, functions and services, which are described in
detail in the Cost Estimate Analysis and Business Plan reports.
SACOG Regional Agricultural Infrastructure Project – Executive Summary 10 | P a g e
Partnerships
As a for-profit enterprise, the hub should look to partner with a wide range of entities involved in the regional
food system. Formalized partnerships with nonprofits and other entities would enable the region to leverage
features of nonprofit hub models – including the ability to generate funding support from government and
philanthropic sources. As an example, complementary hub-related services such as workforce training and
social enterprise activities could be provided by a nonprofit partner such as a food bank, a training
organization, or an economic development entity. Community and environmental services could be provided
by partner organizations to improve access to healthy foods in underserved neighborhoods and strengthen the
overall sustainability of the regional food system. The Business Plan provides information on partner
organizations and roles they could play in providing support for locally grown and source-identified foods.
In particular, the region’s food banks are playing an important role catalyzing the budding regional food system.
The food banks have been instrumental in increasing procurement of fresh locally grown produce and building
more robust local food distribution channels to underserved communities. In addition to these social enterprise
functions, the food banks can be an important logistics and transportation partner to the hub.
SACOG Regional Agricultural Infrastructure Project – Executive Summary 11 | P a g e
For Growers
Hub Target Crops, Consumption and Production
The project analysis used a set of market, consumption and production data bases and criteria to identify a
target list of 23 specialty crops that represent a strong market opportunity for the hub and for growers
supplying the hub (shown in Table 2). The list was refined using the following set of criteria for crop selection:
Are available locally or could be grown in the region
Have a high ratio between purchase and sales prices
Have a high potential for value-added activities
Extend the seasonality of fresh produce and provide year-round supply to the hub
Capture innovations in food trends
The pro forma analysis used 2013 farmgate commodity price data, which reflects the prices growers have
actually received; these prices are a good proxy for what growers could expect to receive from the hub for the
selected set of crops during early years of operation. The analysis suggests it would be profitable for farmers in
aggregate to grow for the hub at the pro forma prices. Table 4 above illustrates how the acreage requirement
to supply a local hub is minimal relative to the total amount of specialty crop production in the region. Overall,
many existing and new farmers already have indicated an interest to supply produce for a hub.
For Jurisdictions
Jurisdictions throughout the region have expressed support to expand and develop regional agricultural
infrastructure. While the food hub market and financial analyses show the hub can be a viable business
operation, local jurisdictions can help create an environment conducive to investment through site location,
infrastructure readiness, regulatory barriers removal and provision or leveraging of incentive programs. The
Business Plan identifies some key barriers and potential solution-oriented actions in zoning and local
permitting processes as well as financing options and overall regulatory compliance. Likewise, the Impediments
report delves into possible state and local incentives that local governments can employ so that farmers need
not shoulder the full burden of scaling up the local food system. These include local purchasing requirements,
sales tax exemptions, new hiring credits and permit streamlining.
The project analysis is location neutral, instead documenting key location criteria for site selection: the hub
itself should be centrally located to suppliers and customers, have access to major transportation routes, be on
a site that is fully serviced with infrastructure if possible, and have expansion potential, with five acres optimal.
Importantly, local jurisdictions should ensure that sites are appropriately zoned and serviced and that the
permitting process is supportive of agricultural and food-related businesses.
The project analysis indicates sufficient demand to support more than one hub in the region as hub operations
expand, regional demand for locally grown produce increases and markets outside of the region—most notably
the San Francisco Bay Area—also increase. As such, there is opportunity for several communities to benefit
from serving as a hub location.
SACOG Regional Agricultural Infrastructure Project – Executive Summary 12 | P a g e
CONCLUSIONS
The research reports, feasibility tools, hub business plan, analysis of impediments and incentives, and case
studies and models that are components of the Sacramento Region Food Hub Feasibility Analysis show that:
There is strong market demand and large gaps between the consumption of fresh produce and amount of produce sourced locally. This is an important economic development opportunity.
In order to meet this market opportunity and decrease the loss of food dollars outside the region, a food hub model that increases local sourcing for local markets offers a solution.
A key hub objective is to create a dedicated market channel primarily for large-scale consumers, including existing fresh produce distributors and wholesalers serving institutions such as schools and hospitals, and food banks, governments, businesses and other commercial and nonprofit customers which are seeking locally and sustainably grown, source-identified food.
A Sacramento region food hub can be a feasible business operation. The most promising model appears to be a for-profit business to reach the scale of operations needed for long term financial sustainability.
The conceptual hub business model demonstrates potential feasibility with basic aggregation, sorting, packing, storing and distribution functions, reaching a positive cash flow in five years and a positive Internal Rate of Return (IRR) after eight years. Increasing value-added activities such as a variety of niche processing will accelerate and increase the economics of the hub.
There is enough market demand in the region to support more than one hub as the system scales up over time.
There are continually emerging market drivers such as procurement and other policies by major institutions like universities and hospitals that will expand the market demand for locally sourced foods; the region must be prepared to handle this demand.
Knowledgeable staff and delivery of supportive services to growers, such as business planning, branding and marketing, and food safety training and certification, are vital components for the scaling up and long term success of the hub.
The conceptual hub model is a pilot that could be developed in many locales throughout the region, although ideally the hub should be centrally located to transportation facilities and markets.
Many jurisdictions throughout the region are interested in participating in food system-related economic development activities and need to ensure they are ready with sites, facilities, infrastructure, land use and zoning ordinances and other policies. The Business Plan provides information on financing resources that could be leveraged for development and operations of the hub.
The regional food system will be enhanced by collaboration among business, nonprofit, public and civic
sector partners, as described in the Business Plan, especially to address impediments to increasing
locally-oriented agricultural production, developing regional agricultural infrastructure and expanding
economic opportunity throughout the region.
SACOG Regional Agricultural Infrastructure Project – Executive Summary 13 | P a g e
SACRAMENTO REGION FOOD HUB FEASIBILITY ANALYSIS PROJECT TEAM
SACRAMENTO AREA COUNCIL OF GOVERNMENTS (SACOG):
DAVID SHABAZIAN RUCS Program Manager
GARETT BALLARD-ROSA Planner II
AMY LEE Planner II
www.sacog.org
APPLIED DEVELOPMENT ECONOMICS, INC.:
TRISH KELLY Principal
DOUG SVENSSON President www.adeusa.com
THE HATAMIYA GROUP:
LON HATAMIYA President & CEO
FOODPRO INTERNATIONAL, INC.:
BILL WASHBURN President
OLGA OSIPOVA Vice President of Technical Services
JOEL SVENDSEN Project Engineer
DH CONSULTING:
DAVE HARZOFF Principal
DH Consulting
Planning Economic
Development