Quarterly Market & Macro Overview / Outlook · Quarterly Market & Macro Overview / Outlook October...
26
Quarterly Market & Macro Overview / Outlook October 2019
Transcript of Quarterly Market & Macro Overview / Outlook · Quarterly Market & Macro Overview / Outlook October...

Quarterly Market & Macro Overview / Outlook
October 2019

2
Global Macro & Markets

A synchronized slowdown being seen in global growth in 2019, but some recovery expected in 2020
3
• IMF cut global growth forecast to 3.0% in 2019 vs 3.6% growth in 2018. However, some recovery expected in 2020.
• This was primarily due to growth slowdown expected in advanced economies esp. the US & Euro Area.
• US-China Trade war, geo-political events and Brexit keeps downside risks elevated, as per the IMF.
• Emerging economies growth also forecasted to slowdown to 3.9% in 2019 from 4.5% in 2018, but recover to 4.6% in 2020.
• IMF cut India’s GDP growth forecast for FY20 by 0.9% to 6.1%. However, it expects GDP growth to recover to 7% in FY21.
RBI also downgraded India’s GDP growth forecast for FY20 to 6.1% (from 6.9% earlier)
• IMF forecasts China’s GDP growth to slow down from 6.6% in 2018, to 6.1% in 2019 and further to 5.8% in 2020.
Source: IMF World Economic Outlook, Oct 2019. For India, fiscal year ended March is considered, so 2019 = FY20 and 2020 = FY21. For other countries it is calendar year.
IMF GDP growth forecast (in %)

Major central banks turn dovish due to growth concerns – leading to softening of global bond yields
4
• US Federal Reserve cut rates by 25 bps in its July 2019 meeting, making it the first rate cut in over a decade, and recently cut rates by another 25 bps in its Sep 2019 meeting.
• European Central Bank (ECB) in its Sep 2019 meeting, cut deposit rate to -0.5% from -0.4% and will restart bond purchases of 20 blnEuros a month from Nov 2019.
• As a result, global bond yields have softened considerably.
• Further dovishness in monetary policy of major global central banks will be beneficial for emerging markets (including India).
US Fed – Sep 2019 meeting projectionsGlobal 10 Yr Bond Yields (in %)
Source: US FOMC, Bloomberg

US-China trade war continues to escalate, and is a developing situation
5
Average weighted tariff rate on US imports from China
Source: OECD Economic Outlook Database
• The US–China trade war continued to escalate, although it is a developing situation, and there are hopes of some resolution to the same. Recentlythey reached an interim deal in which the US will not go ahead with hiking the tariff rate on $250 bln of China imports from 25% to 30% effectiveOct, in exchange for China buying agricultural products from the US.
• To sum up, the US has till now put tariffs on $550 bln of China imports, and China has till now retaliated by putting tariffs on $185 bln of US imports.
• Global trade has been impacted quite significantly as a result of the US-China trade war, and partially due to the economic slowdown.
Source: Credit Suisse
World Trade Growth (Goods & services, by volume)

Despite the recent correction, Indian equity market has fared relatively well over the past year, and also over the long term
6
• Despite the recent correction, India has managed to fare relatively well over the past year when compared to peer Asian markets.
• Over the long term (5 yrs & 10 yrs) too India has been among the top performing global markets.
• Other emerging markets that have fared well over the past year include Brazil & Russia.
• Developed markets fared better than emerging markets over the past year.
• Asian markets have underperformed over the past year, with South Korea, Malaysia, Japan, and Thailand emerging as the bottom performers within the region.

7
Govt. Reforms & Domestic Macro-economic Scenario

The govt. had announced a slew of measures to help and revive economic growth & improve investor sentiment
8
Large fiscal stimulus by slashing corporate tax rates
Higher surcharge on capital gains tax (announced in the Union Budget) rolled back for FPIs and domestic high net worth individuals
Measures for auto sector:- Additional 15% depreciation to be allowed on all vehicles purchased by March 2020 (to esp. benefit CV sector)
- Govt. also postponed increase in registration fee charges for vehicles to June 2020
PSU bank recapitalization of Rs. 70,000 crore would be released upfront—helping to improve liquidity and credit growth
Mega merger of 10 PSU banks into 4 large banks
Some other measures for housing and export sectors. GST rates cut for hotel industry.

Corporate tax rate cuts – A major reform that will help to boost manufacturing & investment
9
India Corporate Tax Rate trend – One of steepest cuts in ~20 yrs
Source: Kotak Institutional Equities, KPMG, Deloitte
• For domestic company, the corporate tax rate has been reduced to 22% (plus surcharge & cess, effective tax rate 25.17%), from 30% (plus surcharge& cess, effective tax rate 34.94%) earlier. However, it is applicable for companies that are not using any other tax incentives/exemptions.
• The corporate tax rate of new domestic company incorporated from Oct 2019, making new investment in manufacturing will be 15% (plussurcharge & cess, effective tax rate 17.01%)
This will help to attract private investment & capex.
For, global companies looking to diversify their manufacturing operations away from China (due to the ongoing US-China trade war), India is now anattractive proposition (from a taxation perspective).
Source: Credit Suisse
Base Corporate Tax Rate of Major Asian Economies (in %)

GDP growth has slowed down considerably in the past few quarters
10
• Q1 FY20 GDP growth further slowed down to5.0% YoY from 5.8% YoY in Q4 FY19
Slowdown in government spending andcapex growth (Investment)
Private consumption (~55% weight ofGDP) growth slowed to 3.1%
Government spending growth at 8.8%
• RBI in its October policy revised down the GDPgrowth estimate for FY20 to 6.1% (from 6.9%earlier)
Source: CSO, MOSPI
India Quarterly GDP Growth trend (%, YoY)
GDP Growth yoy %Q1FY19 Q2FY19 Q3FY19 Q4FY19 Q1FY20
Real GDP (market prices) 8.0 7.0 6.6 5.8 5.0
Private consumption 7.3 9.8 8.1 7.2 3.1
Government spending 6.6 10.9 6.5 13.1 8.8
Fixed Investment 13.3 11.8 11.7 3.6 4.0
Exports 10.2 12.7 16.7 10.6 5.7
Imports 11.0 22.9 14.5 13.3 4.2

Industrial Production has also been lackluster & volatile
Source: MOSPI, Phillip Capital
• Index of Industrial Production (IIP) has been lackluster and volatile, primarily due to slowdown in manufacturing sector (has highest weight of ~78% in IIP). Other sectors like electricity and mining have also seen a slowdown lately.
• For FYTD20 (upto August), IIP growth was lower at 2.4%YoY, compared to 5.3%YoY in the corresponding period, a year ago.
11

High Frequency Indicators: Auto sector sees slowdown
Source: SIAM, Spark Capital. LCV – Light Commercial Vehicle, MHCV = Medium & Heavy Commercial Vehicle
Monthly Passenger Vehicles Sales Growth(%YoY)
12
Monthly 2-Wheeler Sales Growth(%YoY)
Monthly Commercial Vehicles Sales Growth(%YoY) Monthly 3-Wheeler Sales Growth(%YoY)
-40%
-30%
-20%
-10%
0%
10%
20%
30%
40%
50%D
ec-
15
Feb
-16
Ap
r-1
6
Jun
-16
Au
g-1
6
Oct
-16
De
c-1
6
Feb
-17
Ap
r-1
7
Jun
-17
Au
g-1
7
Oct
-17
De
c-1
7
Feb
-18
Ap
r-1
8
Jun
-18
Au
g-1
8
Oct
-18
De
c-1
8
Feb
-19
Ap
r-1
9
Jun
-19
Au
g-1
9
-30%
-20%
-10%
0%
10%
20%
30%
40%
50%
De
c-1
5
Feb
-16
Ap
r-1
6
Jun
-16
Au
g-1
6
Oct
-16
De
c-1
6
Feb
-17
Ap
r-1
7
Jun
-17
Au
g-1
7
Oct
-17
De
c-1
7
Feb
-18
Ap
r-1
8
Jun
-18
Au
g-1
8
Oct
-18
De
c-1
8
Feb
-19
Ap
r-1
9
Jun
-19
Au
g-1
9
-100%
-50%
0%
50%
100%
150%
200%
De
c-1
5
Feb
-16
Ap
r-1
6
Jun
-16
Au
g-1
6
Oct
-16
De
c-1
6
Feb
-17
Ap
r-1
7
Jun
-17
Au
g-1
7
Oct
-17
De
c-1
7
Feb
-18
Ap
r-1
8
Jun
-18
Au
g-1
8
Oct
-18
De
c-1
8
Feb
-19
Ap
r-1
9
Jun
-19
Au
g-1
9
LCV MHCV
-60%
-40%
-20%
0%
20%
40%
60%
80%
100%
120%
De
c-1
5
Feb
-16
Ap
r-1
6
Jun
-16
Au
g-1
6
Oct
-16
De
c-1
6
Feb
-17
Ap
r-1
7
Jun
-17
Au
g-1
7
Oct
-17
De
c-1
7
Feb
-18
Ap
r-1
8
Jun
-18
Au
g-1
8
Oct
-18
De
c-1
8
Feb
-19
Ap
r-1
9
Jun
-19
Au
g-1
9

High Frequency Indicators: Deposit growth revives, while credit growth, steel, cement & coal output dips
Source: Spark Capital
Credit & Deposit Growth (%YoY)
13
Monthly Steel & Cement Output (%YoY) Monthly Coal Output (%YoY)
Credit to Deposit Ratio dips
10%
0%
5%
10%
15%
20%
25%
Credit growth (%) Deposit growth (%)
76%
64%
66%
68%
70%
72%
74%
76%
78%
80%
Credit/Deposit Ratio (%)
-10.0%
-5.0%
0.0%
5.0%
10.0%
15.0%
20.0%
Steel Cement
-30.0%
-25.0%
-20.0%
-15.0%
-10.0%
-5.0%
0.0%
5.0%
10.0%
15.0%
Coal

Softening crude prices a positive for a large net importing country like India
• Brent crude prices spiked to $69/bbl in the month of September, dueto drone attacks on a major Saudi refinery.
• This raised concerns of supply disruption—with Saudi Arabia beingone of the largest suppliers of crude oil. However, crude prices havenormalized lately.
• Global growth concerns and rising US crude production is keeping acap on crude prices, and helped them to soften.
• Softer crude prices is a positive for India, with India being a large netimporter of crude (accounts for ~50% of total imports).
Brent Crude Price ($/bbl.)
14
OPEC Crude Production (Mill. Barrels per day)
US Crude Production (Mill. Barrels per day)
Source: Bloomberg, CLSA

CPI Inflation & its Components (% YoY)
Inflation remains contained, and within RBI’s inflation target
15
• CPI headline inflation rose to 4.0%YoY in Sep 2019 from3.3%YoY in the previous month. This was primarily due torise in food inflation (weight of 39% in CPI) to 5.1%YoY inSep 2019, from 3.0%YoY in the previous month.
• However headline inflation remains contained within RBI’sinflation target of 4%(+/-2%).
• Meanwhile, core inflation (ex food & fuel) has continued tofall to 4.2%YoY in Sep 2019 from 4.5%YoY in Jul 2019.
• Fuel component continues to see disinflation due tosoftening of crude oil prices.
• In its October policy review, RBI’s inflation projection wasrevised slightly upwards to 3.4% for Q2 FY20 (from 3.1%earlier), while projections were retained for H2 FY20 at 3.5-3.7%.
Source: Nomura

16
Equity Markets, Valuations, Earnings & Flows

Domestically, it continues to be a narrow market over the past year. Consumer durables & banking were the top sectors; large-caps outperform the broader markets
17
• It continues to be a narrow market over the past year, with bulk of the Nifty returns being contributed by a handful of quality stocks.
Top 5 positive contributing stocks in Nifty index were all financials, and contributed 808 points.
Meanwhile the balance 45 stocks of Nifty index contributed (-)425 points.
• Large-caps outperformed their small/mid-cap counterparts over the past year
• The top performing sectors over the past year were consumer durables, banking, realty and capital goods
• The bottom performing sectors were auto, metals and pharma over the past year.
Source: Morning Direct
Source: Bloomberg
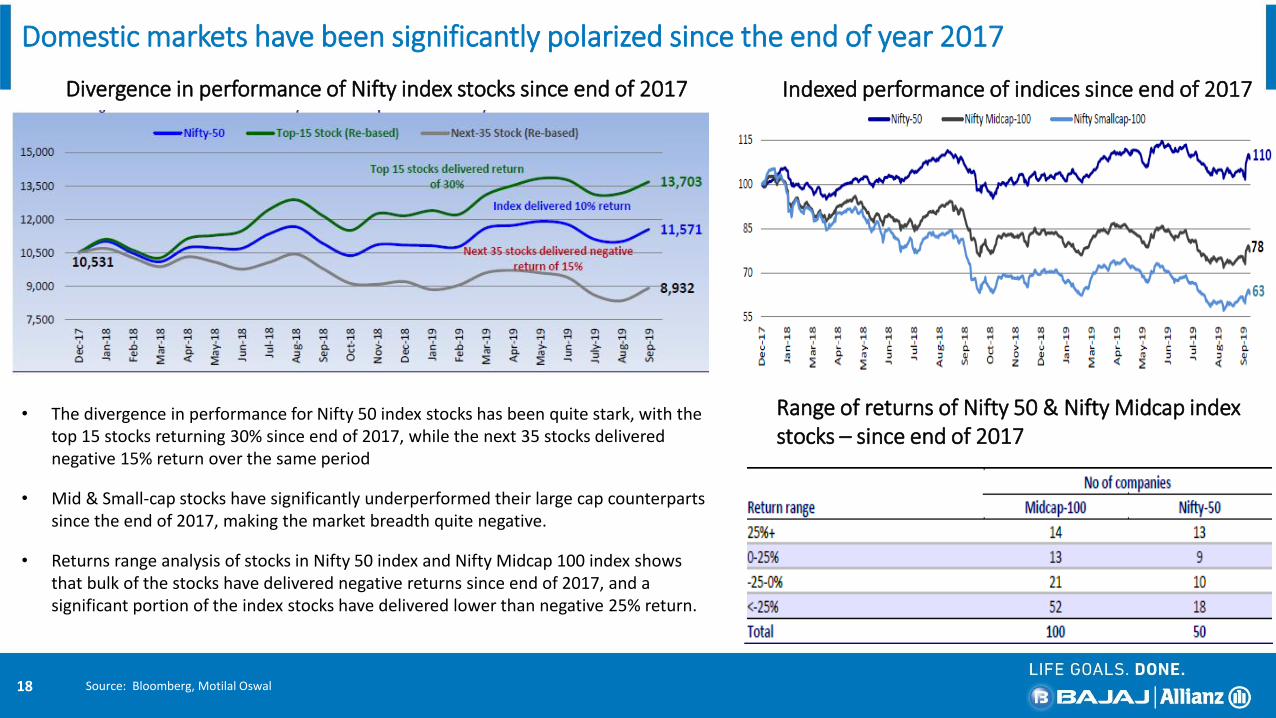
Domestic markets have been significantly polarized since the end of year 2017
Divergence in performance of Nifty index stocks since end of 2017
18
Indexed performance of indices since end of 2017
Range of returns of Nifty 50 & Nifty Midcap index stocks – since end of 2017
Source: Bloomberg, Motilal Oswal
• The divergence in performance for Nifty 50 index stocks has been quite stark, with the top 15 stocks returning 30% since end of 2017, while the next 35 stocks delivered negative 15% return over the same period
• Mid & Small-cap stocks have significantly underperformed their large cap counterparts since the end of 2017, making the market breadth quite negative.
• Returns range analysis of stocks in Nifty 50 index and Nifty Midcap 100 index shows that bulk of the stocks have delivered negative returns since end of 2017, and a significant portion of the index stocks have delivered lower than negative 25% return.
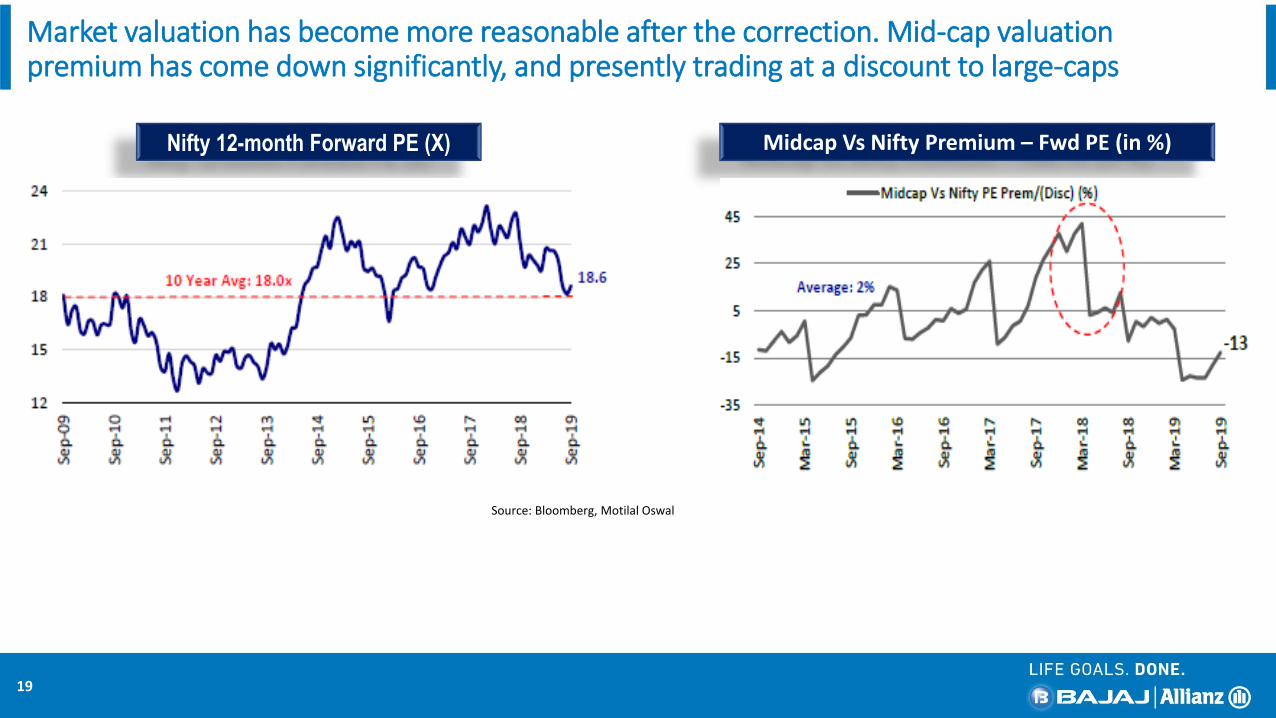
Nifty 12-month Forward PE (X)
Source: Bloomberg, Motilal Oswal
19
Midcap Vs Nifty Premium – Fwd PE (in %)
Market valuation has become more reasonable after the correction. Mid-cap valuation premium has come down significantly, and presently trading at a discount to large-caps

Corporate earnings growth to see a boost, post the corporate tax cuts . There is an upward revision of 5-6% in Nifty EPS growth to 21% in FY20
Nifty Earnings Per Share (EPS) Trend
Source: Bloomberg, Bajaj Allianz Research
20

FII flows became negative in Q2 FY20, while DIIs continue their strong buying
• DIIs, supported by strong equity inflow into MF schemes and some revival in insurance flows, have supported the markets.
• FIIs flows turned negative in Q2 FY20, after seeing strong inflows in the previous two quarters. However, FII flows turned positive in the month of Sep 2019.
21
DateFIIs
(INR Cr)
DIIs
(INR Cr)
MFs
(INR Cr)
Insurance
(INR Cr)
Sep-18 (9,623) 12,504 11,638 866
Oct-18 (27,623) 26,034 24,047 1,987
Nov-18 6,223 800 4,896 (4,095)
Dec-18 2,300 376 2,919 (2,543)
Jan-19 (505) 2,147 7,161 (5,014)
Feb-19 15,328 (566) 2,174 (2,740)
Mar-19 33,116 (13,930) (7,217) (6,713)
Apr-19 20,281 (4,219) (4,920) 700
May-19 9,826 5,316 5,191 126
Jun-19 1,033 3,643 6,107 (2,463)
Jul-19 (13,316) 20,395 15,084 5,311
Aug-19 (15,552) 20,934 17,407 3,527
Sep-19 6,674 12,491 10,961 1,530

22
Fixed Income Markets

India 10 Yr G-Sec Yield Vs Repo Rate (%)
Source: Bloomberg
• Bonds yields have softened considerably during the fiscal year on the back of monetary easing by RBI, benign inflation, sharp fall in global bond yields,liquidity turning positive, softening crude oil prices, foreign portfolio inflows in debt markets
• However, bond yields have risen lately due to fiscal stimulus announced by the government, raising concerns of some fiscal slippage.
• The RBI has cut policy rate (repo rate) 5 times since Feb 2019, by a cumulative 135 bps, and also changed the policy stance to “accommodative”. The latestrate cut was in the October 2019 monetary policy review by 25 bps.
• We believe that with inflation outlook being benign and RBI’s focus shifting to reviving growth, there is head-room for more policy action from the RBI.
23
Bond yields have softened on the back of monetary easing by the RBI

24
Liquidity conditions have improved significantly; rate transmission expected to improve
Source: RBI
Liquidity Adjustment Facility (LAF) – INR in Crore
• Liquidity in the banking system has turned positive since the month of June 2019, after being in deficit for a long time. Liquidity continued to be comfortable despite advance tax outflows in the month of September.
• RBI asked banks to benchmark new floating rate personal loans and SME loans to external benchmarks from October 2019.
• This, along with surplus liquidity and a dip in the credit-deposit ratio may help banks in faster transmission of the RBI rate cuts, compared to before.

Market Outlook & Strategy
•The cut in corporate tax rates, and tax rate of 17% for new manufacturing units makes India competitive with its Asian peers. This could help to attract private investment and FDI, with some manufacturing shifting out of China, amidst the trade war.
India Inc. taxation now competitive with peers
• The govt. has announced various measures to help revive economic growth, and provide a boost to manufacturing and investment activity.
• We expect economic growth to gradually recover in H2 FY20, and pick-up pace in FY21.Stimulus measures by govt.
•The cut in corporate tax rates to provide a boost to corporate earnings, and we now expect Nifty earnings growth at 21% for FY20. This will help to drive the markets going forward.
Corporate Earnings
• Investors should continue to invest systematically into equities.
• We continue to prefer large-caps, but also see some attractive bottom-up opportunities in the mid-cap segment—from a valuation perspective.
Equity investment strategy
•There is headroom for more policy action by the RBI, although it will be data dependant.
•We continue to prefer the shorter to medium term part of the yield curve.Debt Markets
• Eye needs to be kept on extent of global growth slowdown, US-China trade tariff developments, global monetary policy stance, geo-political events, and global risk appetite (as it will determine flows into emerging markets like India).
Factors to watch out for
25

DISCLAIMER: The contents of this presentation is confidential, may contain proprietary or privileged information and is intended for reserved recipient(s) for information Purpose only. Unintended recipients are
prohibited from taking action on the basis of information in this presentation and must delete all copies. The information provided is on “as is” basis and Bajaj Allianz disclaims any warranty, responsibility or
liability for the accuracy or completeness of this presentation and assumes no responsibility or liability for errors or omissions in the contents of the presentation. Bajaj Allianz reserves the right to make additions,
deletions, or modification to the contents of the presentation at any time without prior notice. In no event shall Bajaj Allianz be liable to any entity or individual for any direct, indirect, special, consequential, or
incidental claims or damages or any claims/damages whatsoever, whether in an action of contract, negligence or other tort, arising out of or in connection with the use of this Presentation or the contents of this
Presentation. Any reference to the aforesaid content shall be subject to formal written confirmation by Bajaj Allianz. No confidentiality or privilege is waived or lost by Bajaj Allianz by any mis-transmission of this
presentation. Any reference to "Bajaj Allianz" is a reference to Bajaj Allianz Life Insurance Company Limited. The Logo of Bajaj Allianz Life Insurance Co. Ltd. is provided on the basis of license given by Bajaj
Finserv Ltd. to use its “Bajaj” Logo and Allianz SE to use its “Allianz” logo. The Presentation is not intended to be construed as any advisory from Bajaj Allianz for any investment or any other purpose. Any
reliance of the same by the individual for any purpose, is on the sole independent understanding and requirement of the individual. The Public is advised to consult their advisor in regards to their investment. ©
Bajaj Allianz Life Insurance Co. Ltd. 2019.
Bajaj Allianz Life Insurance Co. Ltd., Regd. Office Address: Bajaj Allianz House, Airport Road, Yerawada, Pune – 411006, IRDAI Reg. No: 116, CIN : U66010PN2001PLC015959, Mail us : [email protected], Call on : Toll free no. 1800 209 7272/ Fax No: 02066026789
26