
Optimization of Injection Moulded Polymer Automotive ... · injection moulded polymer automotive...
38
5 Optimization of Injection Moulded Polymer Automotive Components Ribeiro, C.J. 1 and Viana, J.C. 2 1 PIEP – Innovation in Polymer Engineering 2 IPC – Institute for Polymers and Composites Department of Polymer Engineering, University of Minho, Guimarães, Portugal 1. Introduction The use of polymer materials in automotive applications is growing steadily in the last decades. Their use present several advantages such as reduced weight, high design flexibility and styling capabilities, good balance of properties (ductility, insulation, no corrosion), superior level of integration of functionalities, low processing costs. Automotive components (e.g., car interior, exterior and under-the-bonnet applications) are most often being manufactured in thermoplastic polymers by high-throughput processes, like injection moulding. The optimization of injection moulded polymer automotive components is a crucial design task for obtaining high quality, enhanced mechanical response and low cost components. This can be achieved by proper mould design, adequate material processing and by the knowledge of the relationships between the thermo- mechanical environment resulting from processing, the developed material morphology and the moulded component properties. In these activities, the availability of accurate process and in-service behaviour simulations and efficient optimization methods is of paramount importance. This chapter addresses the application of the engineering design optimization methods and tools to the design of automotive polymer components. It will present several case studies where the optimization of injection moulded polymer automotive components is achieved following different routes and methodologies. Namely: a. Mould cooling system layout optimization – a proper design of the mould cooling system is crucial for process productivity and part quality improvements. b. Optimization of automotive pillar geometry – the design of an automotive car pillar is done, optimizing its geometry for maximizing passenger safety (specifically, the minimization of the Head Injury Criteria, HIC). c. Relationships between processing and moulding mechanical properties – the establishment of these relationships allows the setting of processing conditions for a given property enhancement. d. Design with injection moulded fibre reinforced polymers, FRP – the design of injection moulded FRP components is a challenging engineering task, where processing effects must be taken into account effectively, either at in terms of using reliable experimental mechanical data and of selecting a pertinent constitutive model. www.intechopen.com
Transcript of Optimization of Injection Moulded Polymer Automotive ... · injection moulded polymer automotive...
5
Optimization of Injection Moulded Polymer Automotive Components
Ribeiro, C.J.1 and Viana, J.C.2 1PIEP – Innovation in Polymer Engineering
2IPC – Institute for Polymers and Composites
Department of Polymer Engineering, University of Minho, Guimarães,
Portugal
1. Introduction
The use of polymer materials in automotive applications is growing steadily in the last decades. Their use present several advantages such as reduced weight, high design flexibility and styling capabilities, good balance of properties (ductility, insulation, no corrosion), superior level of integration of functionalities, low processing costs. Automotive components (e.g., car interior, exterior and under-the-bonnet applications) are most often being manufactured in thermoplastic polymers by high-throughput processes, like injection moulding. The optimization of injection moulded polymer automotive components is a crucial design task for obtaining high quality, enhanced mechanical response and low cost components. This can be achieved by proper mould design, adequate material processing and by the knowledge of the relationships between the thermo-mechanical environment resulting from processing, the developed material morphology and the moulded component properties. In these activities, the availability of accurate process and in-service behaviour simulations and efficient optimization methods is of paramount importance. This chapter addresses the application of the engineering design optimization methods and tools to the design of automotive polymer components. It will present several case studies where the optimization of injection moulded polymer automotive components is achieved following different routes and methodologies. Namely: a. Mould cooling system layout optimization – a proper design of the mould cooling system is
crucial for process productivity and part quality improvements. b. Optimization of automotive pillar geometry – the design of an automotive car pillar is done,
optimizing its geometry for maximizing passenger safety (specifically, the minimization of the Head Injury Criteria, HIC).
c. Relationships between processing and moulding mechanical properties – the establishment of these relationships allows the setting of processing conditions for a given property enhancement.
d. Design with injection moulded fibre reinforced polymers, FRP – the design of injection moulded FRP components is a challenging engineering task, where processing effects must be taken into account effectively, either at in terms of using reliable experimental mechanical data and of selecting a pertinent constitutive model.
www.intechopen.com
New Trends and Developments in Automotive System Engineering
66
e. Impact behaviour of injection moulded long fibre reinforced thermoplastic, LFT - the establishment of the relationships between processing and the impact properties of LFT allows the enhancement of the mechanical response of structural automotive applications of these advanced polymers.
f. Multi-objective optimization of the mechanical behaviour of injection moulded components – the simultaneous enhancement of the mechanical response (e.g., stiffness, strength, toughness) of injection moulded components requires a judicious setting of the processing conditions.
In these case studies are proposed several design methodologies for the optimization of injection moulded polymer automotive components, making extensive use and integration of advanced design tools, such as, design of experiments, analysis of variance (ANOVA), injection moulding process simulations, structural simulations and optimization methods.
2. State-of-the-art
Automotive polymer components can be complex products. This high product complexity
level leads to high levels of design and manufacturing process complexities. The
implementation of advanced approaches to product development procedures in the
automotive industry is critical and has been persuaded increasingly driven by the high
needs for innovate and optimised products. The design of automotive polymer components
and their behaviour optimization are still nowadays plain of complexities and engineering
challenges. In this context, the use of computational simulations tools and optimization
procedures is becoming of paramount importance on the optimization process of injection
moulded polymer automotive components.
In the following are described, for each particular case study, their specific objectives and
main relevant works on the topic. All presented case studies aim at the optimization of the
mechanical response of injection moulded polymer components based on the intensive use
of computational tools.
2.1 Mould cooling system layout optimization Efficient injection mould design, mainly of the cooling system, is required for improved
productivity and manufacturing of high quality polymer products. The cooling phase
represents generally more than ¾ of the total cycle time. An efficient cooling system design
can therefore reduce considerably the cooling time, with significant increments upon the
process productivity. The proper design of the cooling system is also crucial in the heat
transfer process, with a strong influence on the part properties and quality:
• the cooling process influences markedly the morphology development and the mechanical properties of the moulded articles;
• the cooling process determines the material shrinkage and the development of thermal stresses in the final moulded product;
• a non-uniform cooling process results in part warpage;
• the cooling process affects part aesthetics (e.g., gloss) and the appearance of defects such as sink marks and voids.
The optimised design of the cooling systems of injection moulds has been performed over the last decades. Park and Know (Park, 1998) developed an algorithm to improve the performance of a cooling system by solving the thermal problem by the boundary element
www.intechopen.com
Optimization of Injection Moulded Polymer Automotive Components
67
method. They proposed that the optimization with respect to all the design variables (mould cooling system and processing conditions) at the same type is the most appropriate strategy. Process simulation tools are available for simulating all injection moulding cycle (filling, packing and cooling phases). Several cooling systems architectures can therefore be easily explored through simulations. Processing conditions can be optimised. The optimization of the mould cooling system is based normally in two main design objective functions (Park, 1998): a) minimization of the cooling time; and b) temperature uniformity over the part surface. The design variables include: inlet coolant temperature; inlet coolant flow rate; cooling channel diameter; and cooling channel location. Liang (Liang, 2002) uses a one-dimensional cooling analysis combined with the maximization of the heat absorption rate by
the coolant per unit area in order to optimise the cooling channel diameter, φ, the distance between cooling channels, a, and the distance between the cooling channel and the cavity wall, b. The numerical optimisation method has based on an alternate constraint coordinate
method. The optimal performance of the mould cooling system is achieved for a = b = 2φ. Li et al (Li, 2005) proposed the automation of the mould cooling system layout design by formulating a heuristic search process based on fuzzy evaluation of the cooling performance and of the manufacturability of candidate designs. A cooling performance index was defined to estimate of the effectiveness of the cooling circuit in carrying away the heat from the mould. Tang et al (Tang, 2007) used a design of experiments approach, based on the Taguchi method, to assess the effect of processing conditions (melt temperature, filling time, packing pressure and packing time) on the part warpage. Melt temperature is identified as the most effective parameter that should be kept at a low level. Lam et al (Lam, 2004) optimized both cooling system design and process condition simultaneously through an evolutionary algorithm. A genetic algorithm and process simulation code are integrated. The objective was to achieve a uniform cavity surface temperature distribution. Hassan et al (Hassan, 2009) adopted a cyclic transient cooling analysis using a finite volume method to analyse a T-shape polymer part. They investigated the effect of the cooling channels cross-section geometry and their location on the temperature profile along the cavity wall and on the polymer solidification degree, but no optimization routine was adopted. The results show that the cooling rate is improved as the cooling channels take the form of the product. Furthermore, they argued that the cooling system layout that minimise the cooling time does not necessary lead to an optimum temperature distribution on the product. Recent technological developments proposed conformal cooling as an alternative method
for a highly efficient cooling system. In this concept, the cooling channels conforms to the
shape of the cavity and core of the mould, providing a better heat transfer and resulting in a
lower cycle time and a more uniform cooling (Xu, 2001). The dynamic control of the mould
wall temperature has been also proposed as method to improve the process performance by
potential increments upon productivity and part quality (Kazmer, 2000).
In this chapter is presented a case study where injection mould filling simulations, design of
experiments and ANOVA techniques are integrated to optimise the cooling system of
injected mouldings.
2.2 Optimization of automotive pillar geometry Occupant safety is of paramount importance in the automotive industry due to the increasing of legal requirements and customer demands. (Lin, 2004). Recent standards (e.g., FMVSS-201) impose specific requirements to plastic components used in automotive
www.intechopen.com
New Trends and Developments in Automotive System Engineering
68
interiors, which have to afford impact protection for occupants, namely against head impact (e.g., pillars). The head injury criterion (HIC) is an analytical tool that is currently recognized to determine if the blow to the head exceeds a maximum tolerable threshold that causes severe injury. HIC is an acceleration-profile-based criterion that requires the knowledge of the time history of the magnitude of the linear deceleration of the centre of gravity of the head during impact. HIC defines the severity of impact to the head, being given by:
HIC = supt1 ,t2
1
t2 − t1a(t)dt
t1
t2∫⎡ ⎣ ⎢ ⎢
⎤ ⎦ ⎥ ⎥
2.5
× (t2 − t1)
⎧ ⎨ ⎪ ⎩ ⎪
⎫ ⎬ ⎪ ⎭ ⎪
(1)
where a(t) is the resultant acceleration of the centre of gravity of the head and (t2 – t1) is the time interval during the crash where the HIC value is maximised. Its value is determined between two-time points where the acceleration curve gives the maximum value of HIC. The corresponding time interval is considered as unlimited, (HIC), or equivalent to maxima of 36 ms (HIC36) or 15 ms (HIC15). In order to consider only the free motion head-form (FMH) during the simulation process, the HIC value needs to be converted to a dummy equivalent value HIC(d), expressed as:
HIC (d ) = 166 .4 + 0.75466 × HIC (2)
The National High Traffic Systems Authority, NHTSA, specifies that, in automotive interiors, the HIC(d) of the FMH should not exceed 1000, to be recognized as providing head impact protection under FMVSS-201. (FMVSS-201, 2007) (Gholami, 2002). The design criteria requires further a deceleration lower than 180 g´s (1 g = 9.81 m.s-2) in order to avoid severe occupant head injuries. The plastic components are therefore required to act as passive safety components. (FMVSS-201, 1997). The design of polymeric parts against impact loadings is determined mainly by the high interactions between the polymer behaviour and the component geometry (Viana, 2006). T. Gholami et al. investigated the response of energy absorbing polymeric egg-box like structures under an impact loading by conducting head impact simulations (Gholami, 2002). The behaviour of these structures under a range of conditions was also analysed and compared with other commonly available solutions for energy absorption by M. Ashmead et al. (Ashmead, 1998). M. Zerull et al. designed interior ribbed plastic components in order to meet FMVSS-201 standard requirements (Zerrul, 2000). In this work, the impact of an anthropomorphic mass in a polymeric pillar is simulated in a finite element code (ABAQUS) (Ribeiro, 2006). Several pillar geometries and material parameters are tested using numerical simulations in order to meet the standards’ requirements.
2.3 Relationships between processing and moulding mechanical properties The mechanical properties of moulded polymers are extremely dependent upon the processing method and conditions used to produce them. The processing thermomechanical conditions imposed to the melt governs the morphology development that affects the mechanical response of the moulded product. An injection moulded semicrystalline polymeric component shows a laminated morphology, featuring a very oriented skin layer and a highly crystalline core. A thicker skin layer results in a high stiffness, strength and
www.intechopen.com
Optimization of Injection Moulded Polymer Automotive Components
69
enhanced impact response (Viana, 1999; Cunha, 1995). A high degree of crystallinity results in a higher stiffness, but it is generally detrimental for the capability of the material to absorb energy in very short time intervals (van der Wal, 1998). A high level of molecular orientation is also beneficial in terms of impact strength, but it reduces the deformation capabilities of the mouldings (Viana, 1999; Cunha, 1995). The prediction of the morphology development of injection moulding has been revealed as an extremely hard task, mainly for semi-crystalline polymers. The current commercially available software codes do not compute polymer morphology, and therefore do not estimate the mechanical response of the moulded product. Methodologies to link process to mechanical simulations in the design workflow of automotive components are still under development (Wust, 2009). In order to be able of predicting the mechanical properties of injection moulded components a methodology based on thermomechanical indices has been proposed. These thermomechanical indices relate to main physical phenomena involved and aim at evaluating the morphology development (Cunha, 2000; Viana 2002):
• the cooling index, Y, characterises the thermal level of the moulding, being related to the degree of crystallinity of the mouldings. It is defined as the ratio between the superheating degree and the cooling difference:
ib
cb
TT
TTY −
−=
(3)
where Tb is the bulk temperature (the local average temperature through the moulding thickness), Tc the crystallization temperature, and Ti is the mould/polymer interface temperature.
• the thermo-stress index, τY, is the ratio between the level of molecular orientation imposed during mould filling (indirectly assessed by the shear stress at the solid/liquid
polymer interface, τw) and the level of molecular relaxation occurring during cooling (assumed proportional to Y), being defined as:
Y
wY
τ=τ
(4)
Thermomechanical indices are easily computed by mould filling simulations over the entire spatial domain of the component. They have been proposed as a promising route to establishing the relationships between processing and the moulding mechanical properties, supporting engineering design methodologies with polymers. In this chapter are established the relationships between the thermomechanical indices and the impact properties for an injection moulded disc geometry.
2.4 Design with injection moulded fibre reinforced polymers, FRP The demand from industry for injection moulded polymeric parts is increasing due to the capability of high-volume production, suitable material properties, high geometrical freedom of design and function integration, and reduced costs. The mechanical and physical properties of these moulded parts can be improved by the use of short fibre reinforced polymers, SFRP (Luts et al, 2009). Polymeric structural components can be produced with
www.intechopen.com
New Trends and Developments in Automotive System Engineering
70
SFRP. The design with these polymers is an intricate task because the polymer mechanical behaviour is difficult to characterise (e.g., impact) or to simulate (e.g., constitutive model). Furthermore, the effects of processing conditions (e.g., fibre orientation profiles) on the mechanical response need to be considered. As mechanical properties of SRFP injected parts depend upon fibre orientation, there is a big interest in validating and improving models which link the fibre orientations to mechanical properties (Vincent et al, 2005). In order to better design with FRP, this work shows a comparison between several constitutive models (linear, non-linear, isotropic, non-isotropic) in the structural simulations of an injection moulded FRP component. The computed behaviour was compared against experimental one. Different gating options were considered.
2.5 Impact behaviour of injection moulded long fibre reinforced thermoplastic, LFT Long fibre thermoplastics, LFT, are increasingly been used in load-bearing polymeric components due to their excellent properties (e.g., specific mechanical properties, impact resistance, corrosion resistance and design flexibility) and easy of process (e.g., complex shapes, function integration) (Jacobs, 2002). The mechanical properties of LFT are highly dependent upon the fibre content, the fibre orientation and length, the fibre-matrix interface and matrix morphology. The most influencing variable is much determined by the fibre content level: for high amount of fibres (typically of more that 10-15% of incorporation) the fibre orientation and length are the most relevant variables for the mechanical response; for low levels of incorporation (less than 10-15%) the matrix morphology becomes also a relevant variable. All the abovementioned variables are determined by the processing thermo-mechanical history (Krasteva, 2006). The complex relationships between the processing conditions and the mechanical properties
complicate the control of final composite part properties: accuracy, point-to-point variations,
high levels of anisotropy, etc. (Constable, 2002; Schijve, 2002). The prediction of the
mechanical properties of moulded LFTs is an intricate task. Currently, computer simulations
of the injection moulding process are able of computing the mechanical properties of fibre
reinforced polymers. The calculations are based on the prediction of fibre orientation and on
a micromechanical constitutive model. Elastic modulus and coefficient of thermal expansion
are locally computed through the moulding thickness and over its spatial domain. However,
and mainly for LFTs, the effect of fibre attrition during processing becomes an important
factor. Currently, commercial processing simulations codes are not able of predicting fibre
breakage during injection moulding.
In this chapter are established the relationships between the thermomechanical indices and
the mechanical properties of an injection moulded LFTs. This methodology is revealed as a
very interesting engineering approach to assess the mechanical properties of injection
moulded LFTs.
2.6 Multi-objective optimization of the mechanical behaviour of injection moulded components At present, the maximization of the mechanical properties of injection moulded components is done by tentative trial-and-errors or by the adoption of structured statistical techniques procedures (e.g., structured design of experiments) (Yang, 2007; Chen, 2009). The processing conditions are varied in order to achieve the best mechanical performance. However, different envisaged mechanical responses (e.g., stiffness and toughness) may require distinct
www.intechopen.com
Optimization of Injection Moulded Polymer Automotive Components
71
sets of processing conditions (Viana, 1999). Using similar methodologies, the maximization of the mechanical properties of injection moulded components can be performed also by computer simulations. The simulations allow the computation of the thermal and mechanical fields imposed to the polymer during processing, letting the calculation of thermomechanical indices that can be used to estimate the mechanical properties of the moulded component (Viana, 1999; Viana, 2002). These latter can be maximized by variation of the processing conditions, changes upon the part geometry, exploitation of different gating and cooling system options. Nevertheless, the absence of a global computer optimization methodology for maximization of the mechanical properties of injection moulded parts is evident. In fact, from an engineering design point of view, there still exits a hiatus between process simulation/optimization and mechanical simulation/optimization (Wust, 2009) that needs to be fulfilled. Several works of process optimization using different optimization strategies, such as, Artificial Neural Networks (ANN) and Genetic Algorithms (GA) have been reported. Lotti and Bretas (Lotti, 2003; Lotti, 2007) applied ANN to predict the morphology and the mechanical properties of an injection moulded part of different polymer systems as a function of the processing conditions (mould and melt temperatures and flow rate). Castro et al (Castro, 2003: Castro, 2007) combined process simulations, statistical testing, artificial neural networks (ANNs) and data envelopment analysis (DEA) to find the optimal compromises between multiple objectives on the settings of the injection moulding processing conditions. Turng and Peic (Turng, 2003) developed an integrated computer tool that couples a process simulation code with optimization algorithms to determine the optimal process variables for injection moulding. Latter, Zhou and Turng (Zhou, 2007) proposed novel optimization procedure based on a Gaussian process surrogate modelling approach and design of experiments applied to computer simulation for the optimization of the injection moulding process. The global optimal solutions were found based on a hybrid genetic algorithm. In both cases, only warpage and shrinkage of moulded components was minimised. Gaspar-Cunha and Viana (Gaspar-Cunha, 2005) coupled an optimization method based on evolutionary algorithms with process simulation code to set the processing conditions that maximise the mechanical properties of injection moulded components, More recently Fernandes et al. (Fernandes, 2010) used a similar approach to adjust the processing conditions in order to meet multiple process criteria (temperature difference on the moulding at the end of filling, the maximum cavity pressure, the pressure work, the volumetric shrinkage and the cycle time). In this chapter an automatic optimization methodology based on Multi-Objective Evolutionary Algorithms, MOEA, is used to optimize the mechanical behaviour of injection moulded components (Gaspar-Cunha, 2005). The thermomechanical indices are computed from mould filling simulations and related to the mechanical properties, the processing conditions being optimized in order to reach the best mechanical performance.
3. Presentation of case studies
3.1 Mould Cooling System Layout Optimization A computer simulation study was performed adopting a design of experiments approach based on the Taguchi method for the analyses of the influence of the mould cooling system design variables on the uniformity of moulding surface temperatures and on the shrinkage and warpage of the moulding (Viana, 2008).
www.intechopen.com
New Trends and Developments in Automotive System Engineering
72
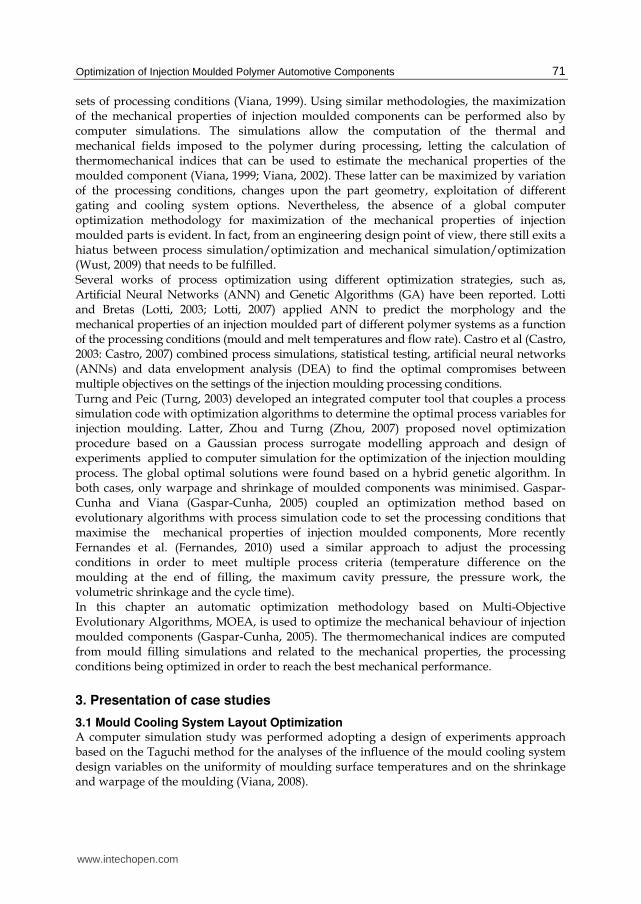
The moulded part is a centred gated rectangular box with 150 mm of length, 72 mm wide, 16 mm of lateral height and 1.5 mm of thickness. The injection moulding simulations were performed in Moldflow software using cooling-warping analysis. The polymer is a polypropylene, PP, Appryl 3120 MU5 from ATOFINA (with properties from Moldflow database). The geometrical cooling system design factors selected were (Fig. 1): cooling
channel diameter, φ [8, 12 mm]; distance between cooling channels centres, a [10, 14 mm]; distance between the cooling channels and mould cavity surface, b [20, 25 mm]; orientation of the cooling channels [horizontal (X-direction), vertical (Y-direction)]; symmetry of cooling channels [sym., non-sym.]; cooling channels length, L [10, 20 mm]; number of cooling channels [4, 6]. All these factors were varied in two levels according to the DOE orthogonal matrix (L8 Taguchi array) presented in Figure 1.
mould cavity
cooling channels
b
aφ
mould cavity
cooling channels
b
aφ
X directionY direction X directionY direction
Non-symmetric cooling channelsNon-symmetric cooling channels
φ a b orient. symm. L Nº(mm) (mm) (mm) (x, y) (mm)
R1 8 10 20 X yes 10 4
R2 8 10 20 Y No 20 6
R3 8 14 25 X yes 20 6
R4 8 14 25 Y No 10 4
R5 12 10 25 X No 10 6
R6 12 10 25 Y yes 20 4
R7 12 14 20 X No 20 4
R8 12 14 20 Y yes 10 6
Fig. 1. Cooling system design parameters.
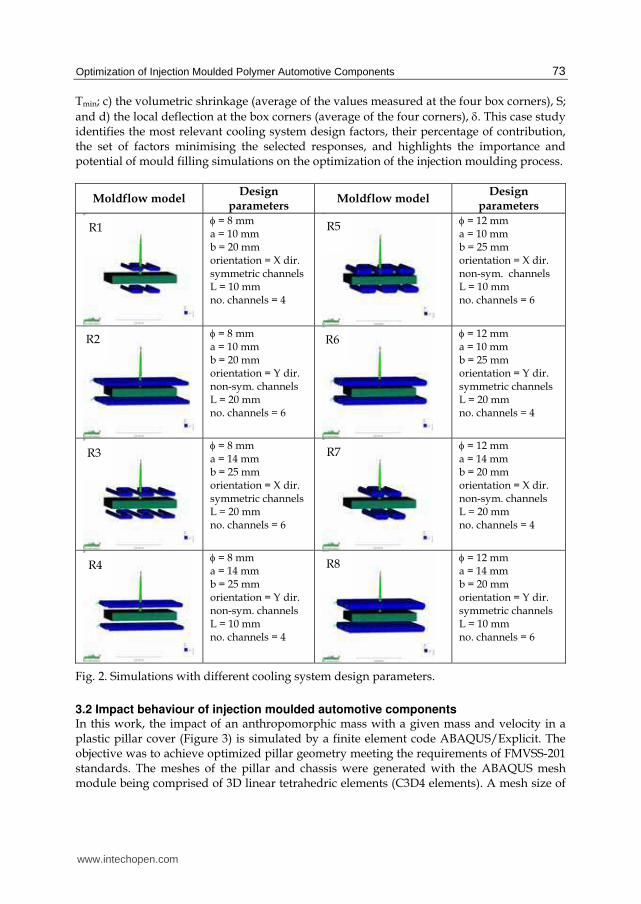
The other processing parameters were kept constant (melt temperature of 240 ºC, mould temperature of 50 ºC, injection flow rate of 43 cm3/s corresponding to an injection time of 0.64 s). Figure 2 shows the eight simulations models built, and respective changed design parameters. The results envisaged were: a) the maximum and minimum temperature in the
part, Tmax, and Tmin, respectively; b) the difference between these temperatures, ΔT= Tmax-
www.intechopen.com
Optimization of Injection Moulded Polymer Automotive Components
73
Tmin; c) the volumetric shrinkage (average of the values measured at the four box corners), S;
and d) the local deflection at the box corners (average of the four corners), δ. This case study identifies the most relevant cooling system design factors, their percentage of contribution, the set of factors minimising the selected responses, and highlights the importance and potential of mould filling simulations on the optimization of the injection moulding process.
Moldflow model Design
parameters Moldflow model
Design parameters
φ = 8 mm a = 10 mm b = 20 mm orientation = X dir. symmetric channels L = 10 mm no. channels = 4
φ = 12 mm a = 10 mm b = 25 mm orientation = X dir. non-sym. channels L = 10 mm no. channels = 6
φ = 8 mm a = 10 mm b = 20 mm orientation = Y dir. non-sym. channels L = 20 mm no. channels = 6
φ = 12 mm a = 10 mm b = 25 mm orientation = Y dir. symmetric channels L = 20 mm no. channels = 4
φ = 8 mm a = 14 mm b = 25 mm orientation = X dir. symmetric channels L = 20 mm no. channels = 6
φ = 12 mm a = 14 mm b = 20 mm orientation = X dir. non-sym. channels L = 20 mm no. channels = 4
φ = 8 mm a = 14 mm b = 25 mm orientation = Y dir. non-sym. channels L = 10 mm no. channels = 4
φ = 12 mm a = 14 mm b = 20 mm orientation = Y dir. symmetric channels L = 10 mm no. channels = 6
Fig. 2. Simulations with different cooling system design parameters.
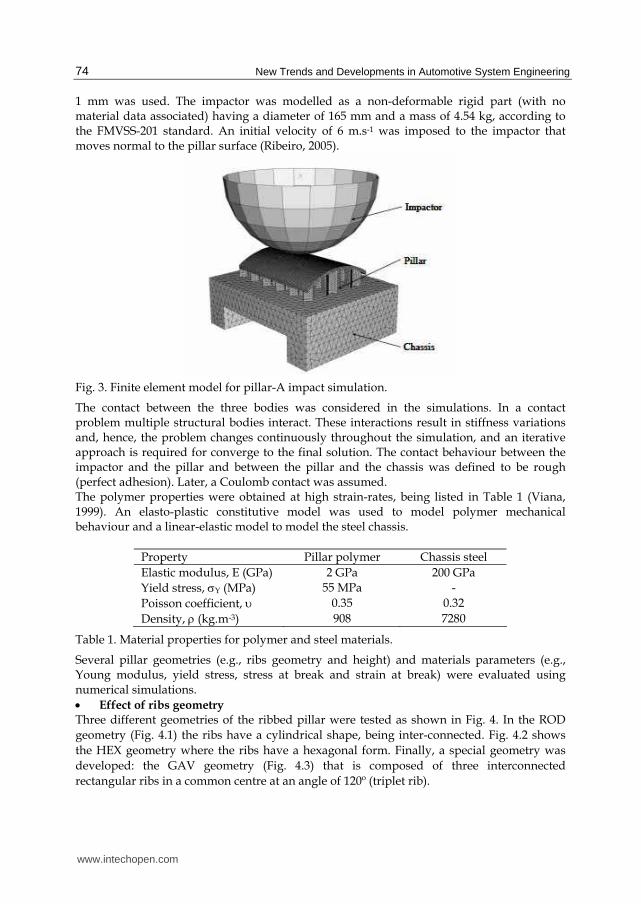
3.2 Impact behaviour of injection moulded automotive components In this work, the impact of an anthropomorphic mass with a given mass and velocity in a plastic pillar cover (Figure 3) is simulated by a finite element code ABAQUS/Explicit. The objective was to achieve optimized pillar geometry meeting the requirements of FMVSS-201 standards. The meshes of the pillar and chassis were generated with the ABAQUS mesh module being comprised of 3D linear tetrahedric elements (C3D4 elements). A mesh size of
R1
R2
R3
R4 R8
R7
R6
R5
www.intechopen.com
New Trends and Developments in Automotive System Engineering
74
1 mm was used. The impactor was modelled as a non-deformable rigid part (with no material data associated) having a diameter of 165 mm and a mass of 4.54 kg, according to the FMVSS-201 standard. An initial velocity of 6 m.s-1 was imposed to the impactor that moves normal to the pillar surface (Ribeiro, 2005).
Fig. 3. Finite element model for pillar-A impact simulation.
The contact between the three bodies was considered in the simulations. In a contact problem multiple structural bodies interact. These interactions result in stiffness variations and, hence, the problem changes continuously throughout the simulation, and an iterative approach is required for converge to the final solution. The contact behaviour between the impactor and the pillar and between the pillar and the chassis was defined to be rough (perfect adhesion). Later, a Coulomb contact was assumed. The polymer properties were obtained at high strain-rates, being listed in Table 1 (Viana, 1999). An elasto-plastic constitutive model was used to model polymer mechanical behaviour and a linear-elastic model to model the steel chassis.
Property Pillar polymer Chassis steel
Elastic modulus, E (GPa) 2 GPa 200 GPa
Yield stress, σY (MPa) 55 MPa -
Poisson coefficient, υ 0.35 0.32
Density, ρ (kg.m-3) 908 7280
Table 1. Material properties for polymer and steel materials.
Several pillar geometries (e.g., ribs geometry and height) and materials parameters (e.g., Young modulus, yield stress, stress at break and strain at break) were evaluated using numerical simulations.
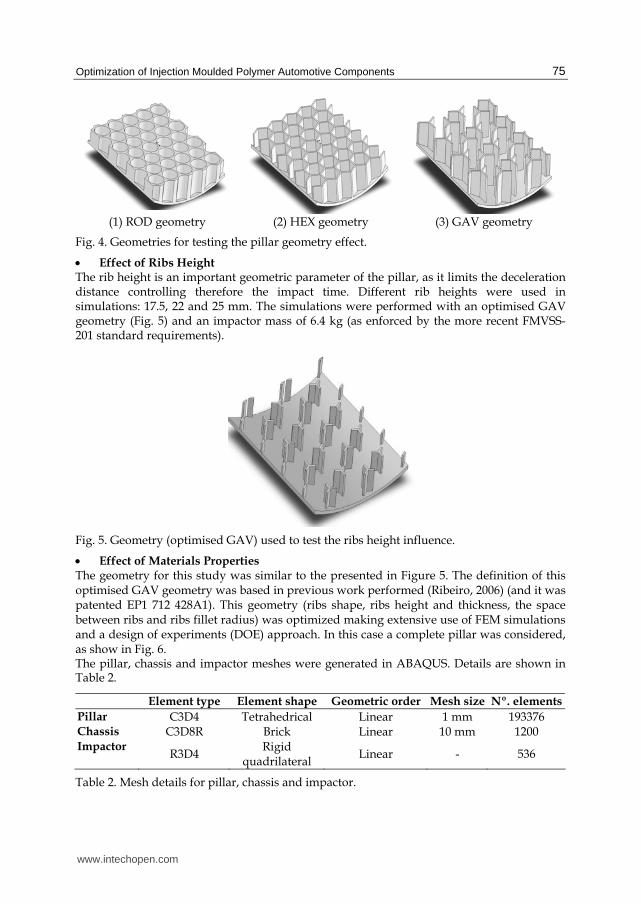
• Effect of ribs geometry Three different geometries of the ribbed pillar were tested as shown in Fig. 4. In the ROD
geometry (Fig. 4.1) the ribs have a cylindrical shape, being inter-connected. Fig. 4.2 shows
the HEX geometry where the ribs have a hexagonal form. Finally, a special geometry was
developed: the GAV geometry (Fig. 4.3) that is composed of three interconnected
rectangular ribs in a common centre at an angle of 120º (triplet rib).
www.intechopen.com
Optimization of Injection Moulded Polymer Automotive Components
75
(1) ROD geometry (2) HEX geometry (3) GAV geometry
Fig. 4. Geometries for testing the pillar geometry effect.
• Effect of Ribs Height The rib height is an important geometric parameter of the pillar, as it limits the deceleration distance controlling therefore the impact time. Different rib heights were used in simulations: 17.5, 22 and 25 mm. The simulations were performed with an optimised GAV geometry (Fig. 5) and an impactor mass of 6.4 kg (as enforced by the more recent FMVSS-201 standard requirements).
Fig. 5. Geometry (optimised GAV) used to test the ribs height influence.
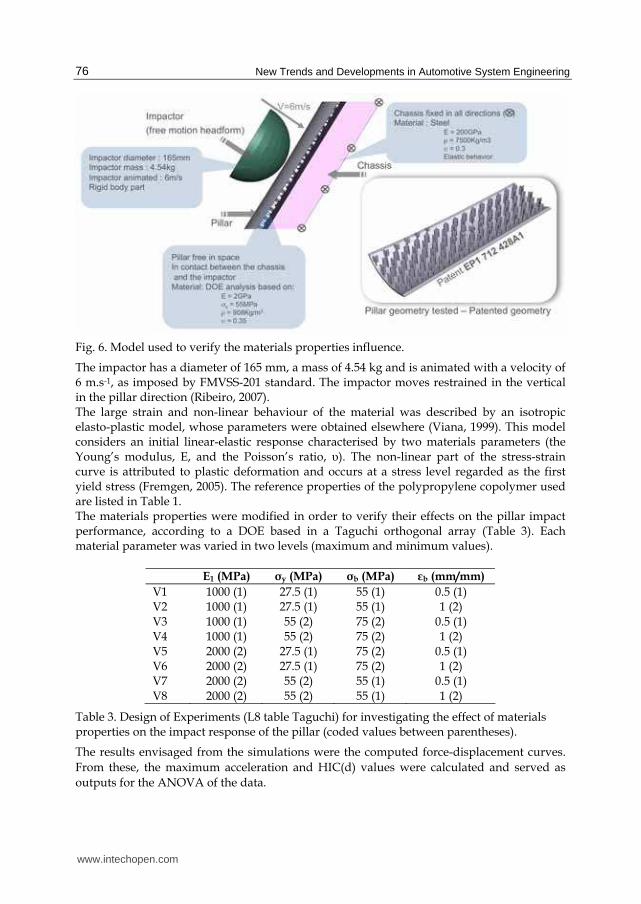
• Effect of Materials Properties The geometry for this study was similar to the presented in Figure 5. The definition of this optimised GAV geometry was based in previous work performed (Ribeiro, 2006) (and it was patented EP1 712 428A1). This geometry (ribs shape, ribs height and thickness, the space between ribs and ribs fillet radius) was optimized making extensive use of FEM simulations and a design of experiments (DOE) approach. In this case a complete pillar was considered, as show in Fig. 6. The pillar, chassis and impactor meshes were generated in ABAQUS. Details are shown in Table 2.
Element type Element shape Geometric order Mesh size Nº. elements
Pillar C3D4 Tetrahedrical Linear 1 mm 193376 Chassis C3D8R Brick Linear 10 mm 1200 Impactor
R3D4 Rigid
quadrilateral Linear - 536
Table 2. Mesh details for pillar, chassis and impactor.
www.intechopen.com
New Trends and Developments in Automotive System Engineering
76
Fig. 6. Model used to verify the materials properties influence.
The impactor has a diameter of 165 mm, a mass of 4.54 kg and is animated with a velocity of 6 m.s-1, as imposed by FMVSS-201 standard. The impactor moves restrained in the vertical in the pillar direction (Ribeiro, 2007). The large strain and non-linear behaviour of the material was described by an isotropic elasto-plastic model, whose parameters were obtained elsewhere (Viana, 1999). This model considers an initial linear-elastic response characterised by two materials parameters (the Young’s modulus, E, and the Poisson’s ratio, υ). The non-linear part of the stress-strain curve is attributed to plastic deformation and occurs at a stress level regarded as the first yield stress (Fremgen, 2005). The reference properties of the polypropylene copolymer used are listed in Table 1. The materials properties were modified in order to verify their effects on the pillar impact performance, according to a DOE based in a Taguchi orthogonal array (Table 3). Each material parameter was varied in two levels (maximum and minimum values).
E1 (MPa) σy (MPa) σb (MPa) εb (mm/mm)
V1 1000 (1) 27.5 (1) 55 (1) 0.5 (1) V2 1000 (1) 27.5 (1) 55 (1) 1 (2) V3 1000 (1) 55 (2) 75 (2) 0.5 (1) V4 1000 (1) 55 (2) 75 (2) 1 (2) V5 2000 (2) 27.5 (1) 75 (2) 0.5 (1) V6 2000 (2) 27.5 (1) 75 (2) 1 (2) V7 2000 (2) 55 (2) 55 (1) 0.5 (1) V8 2000 (2) 55 (2) 55 (1) 1 (2)
Table 3. Design of Experiments (L8 table Taguchi) for investigating the effect of materials properties on the impact response of the pillar (coded values between parentheses).
The results envisaged from the simulations were the computed force-displacement curves.
From these, the maximum acceleration and HIC(d) values were calculated and served as
outputs for the ANOVA of the data.
www.intechopen.com
Optimization of Injection Moulded Polymer Automotive Components
77
3.3 Relationships between processing and moulding mechanical properties This case study investigates the relationships between the processing thermomechanical environment, the developed morphology upon processing and the impact properties of injection moulded parts (Viana, 2009). This is done by the establishment of the relationships between two thermomechanical indices and the impact properties. The specimen is a lateral gated disc of 150 mm of diameter and 1.5 mm of thickness, injection moulded in PP copolymer. Several discs were injection moulded with variations of the injection flow rate, Qinj, the melt temperature, Tinj, and the mould temperature, Tw, in a total of
15 different processing conditions. The thermomechanical indices, Y and τY, were computed at the end of the filling phase using C-Mold software. The impact properties were assessed in an instrumented multiaxial plate deflection test, at 1 m/s and 23 ºC. The discs are clamped around a perimeter of 40 mm. The non-lubricated 25 kg striker has a hemispherical tip with a diameter of 10 mm. The envisaged impact properties are the peak force and energy, Fp and Up, respectively, that were measured from the recorded force-deflection curves.
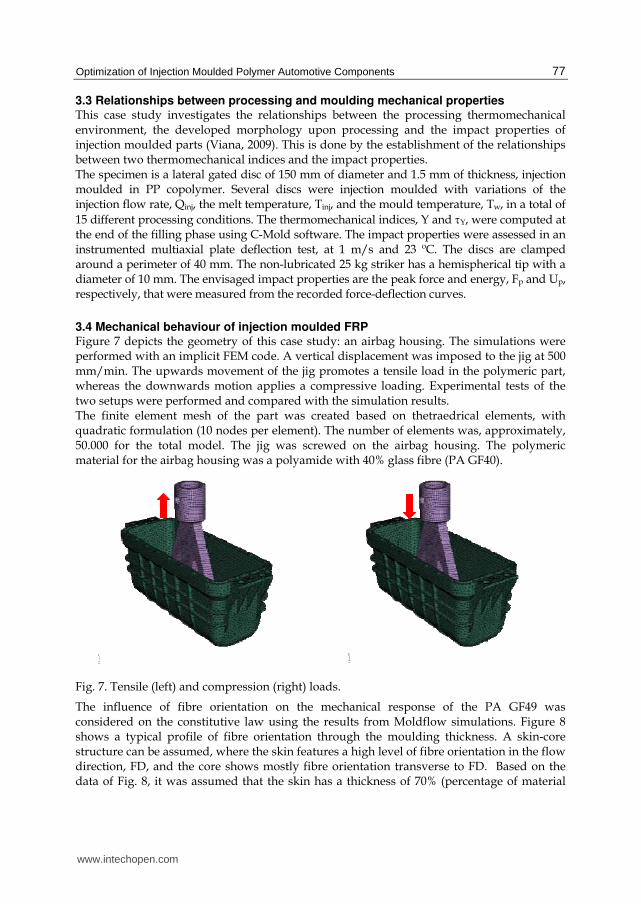
3.4 Mechanical behaviour of injection moulded FRP Figure 7 depicts the geometry of this case study: an airbag housing. The simulations were performed with an implicit FEM code. A vertical displacement was imposed to the jig at 500 mm/min. The upwards movement of the jig promotes a tensile load in the polymeric part, whereas the downwards motion applies a compressive loading. Experimental tests of the two setups were performed and compared with the simulation results. The finite element mesh of the part was created based on thetraedrical elements, with quadratic formulation (10 nodes per element). The number of elements was, approximately, 50.000 for the total model. The jig was screwed on the airbag housing. The polymeric material for the airbag housing was a polyamide with 40% glass fibre (PA GF40).
Fig. 7. Tensile (left) and compression (right) loads.
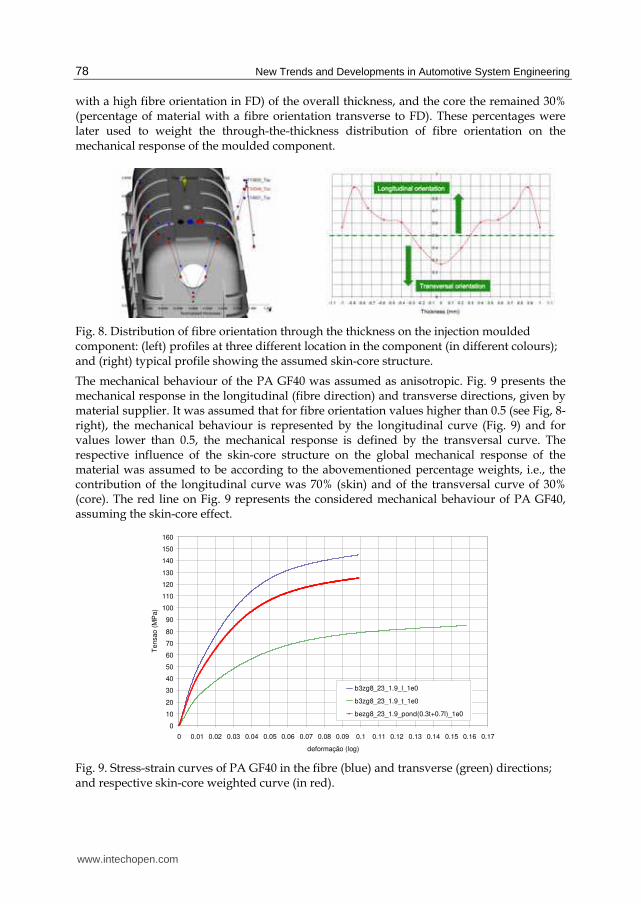
The influence of fibre orientation on the mechanical response of the PA GF49 was considered on the constitutive law using the results from Moldflow simulations. Figure 8 shows a typical profile of fibre orientation through the moulding thickness. A skin-core structure can be assumed, where the skin features a high level of fibre orientation in the flow direction, FD, and the core shows mostly fibre orientation transverse to FD. Based on the data of Fig. 8, it was assumed that the skin has a thickness of 70% (percentage of material
www.intechopen.com
New Trends and Developments in Automotive System Engineering
78
with a high fibre orientation in FD) of the overall thickness, and the core the remained 30% (percentage of material with a fibre orientation transverse to FD). These percentages were later used to weight the through-the-thickness distribution of fibre orientation on the mechanical response of the moulded component.
Fig. 8. Distribution of fibre orientation through the thickness on the injection moulded component: (left) profiles at three different location in the component (in different colours); and (right) typical profile showing the assumed skin-core structure.
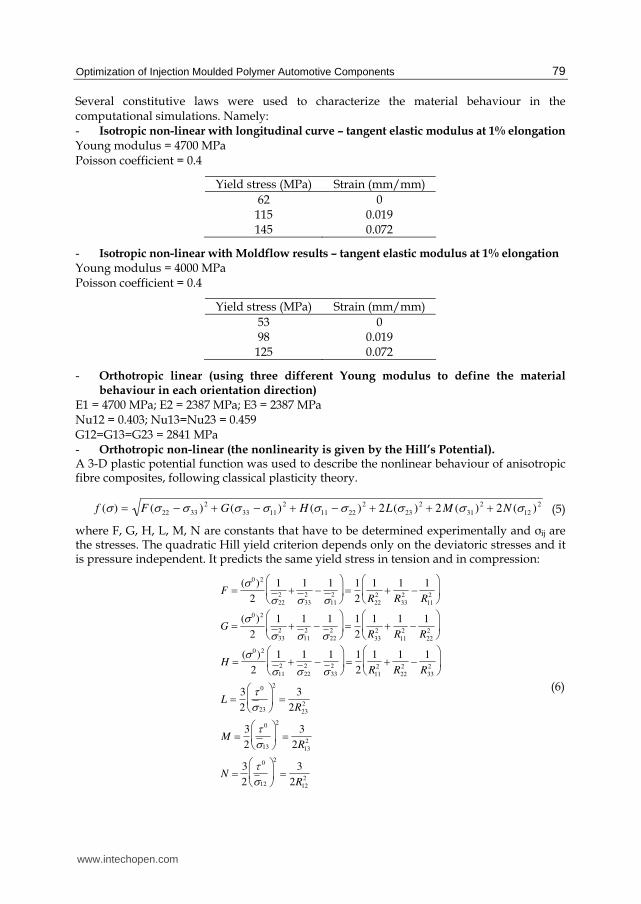
The mechanical behaviour of the PA GF40 was assumed as anisotropic. Fig. 9 presents the mechanical response in the longitudinal (fibre direction) and transverse directions, given by material supplier. It was assumed that for fibre orientation values higher than 0.5 (see Fig, 8-right), the mechanical behaviour is represented by the longitudinal curve (Fig. 9) and for values lower than 0.5, the mechanical response is defined by the transversal curve. The respective influence of the skin-core structure on the global mechanical response of the material was assumed to be according to the abovementioned percentage weights, i.e., the contribution of the longitudinal curve was 70% (skin) and of the transversal curve of 30% (core). The red line on Fig. 9 represents the considered mechanical behaviour of PA GF40, assuming the skin-core effect.
0
10
20
30
40
50
60
70
80
90
100
110
120
130
140
150
160
0 0.01 0.02 0.03 0.04 0.05 0.06 0.07 0.08 0.09 0.1 0.11 0.12 0.13 0.14 0.15 0.16 0.17
deformação (log)
Tensao (
MP
a)
b3zg8_23_1.9_l_1e0
b3zg8_23_1.9_t_1e0
bezg8_23_1.9_pond(0.3t+0.7l)_1e0
Fig. 9. Stress-strain curves of PA GF40 in the fibre (blue) and transverse (green) directions; and respective skin-core weighted curve (in red).
www.intechopen.com
Optimization of Injection Moulded Polymer Automotive Components
79
Several constitutive laws were used to characterize the material behaviour in the computational simulations. Namely: - Isotropic non-linear with longitudinal curve – tangent elastic modulus at 1% elongation Young modulus = 4700 MPa Poisson coefficient = 0.4
Yield stress (MPa) Strain (mm/mm)
62 0 115 0.019 145 0.072
- Isotropic non-linear with Moldflow results – tangent elastic modulus at 1% elongation Young modulus = 4000 MPa Poisson coefficient = 0.4
Yield stress (MPa) Strain (mm/mm)
53 0 98 0.019 125 0.072
- Orthotropic linear (using three different Young modulus to define the material behaviour in each orientation direction)
E1 = 4700 MPa; E2 = 2387 MPa; E3 = 2387 MPa Nu12 = 0.403; Nu13=Nu23 = 0.459 G12=G13=G23 = 2841 MPa - Orthotropic non-linear (the nonlinearity is given by the Hill’s Potential). A 3-D plastic potential function was used to describe the nonlinear behaviour of anisotropic fibre composites, following classical plasticity theory.
f (σ) = F (σ22 − σ33 )2 + G(σ33 − σ11)2 + H (σ11 − σ22 )2 + 2L(σ23 )2 + 2M (σ31)2 + 2N (σ12 )2
(5)
where F, G, H, L, M, N are constants that have to be determined experimentally and σij are the stresses. The quadratic Hill yield criterion depends only on the deviatoric stresses and it is pressure independent. It predicts the same yield stress in tension and in compression:
F = (σ0)2
2
1
σ22
2 + 1
σ33
2 − 1
σ11
2
⎛ ⎝ ⎜ ⎞
⎠ ⎟ = 1
2
1
R22
2+ 1
R33
2− 1
R11
2
⎛ ⎝ ⎜ ⎞
⎠ ⎟ G = (σ0)2
2
1
σ33
2 + 1
σ11
2 − 1
σ22
2
⎛ ⎝ ⎜ ⎞
⎠ ⎟ = 1
2
1
R33
2+ 1
R11
2− 1
R22
2
⎛ ⎝ ⎜ ⎞
⎠ ⎟ H = (σ0)2
2
1
σ11
2 + 1
σ22
2 − 1
σ33
2
⎛ ⎝ ⎜ ⎞
⎠ ⎟ = 1
2
1
R11
2+ 1
R22
2− 1
R33
2
⎛ ⎝ ⎜ ⎞
⎠ ⎟
L = 3
2
τ 0
σ23
⎛ ⎝ ⎜ ⎞
⎠ ⎟ 2
= 3
2R23
2
M = 3
2
τ 0
σ13
⎛ ⎝ ⎜ ⎞
⎠ ⎟ 2
= 3
2R13
2
N = 3
2
τ 0
σ12
⎛ ⎝ ⎜ ⎞
⎠ ⎟ 2
= 3
2R12
2
(6)
www.intechopen.com
New Trends and Developments in Automotive System Engineering
80
where each σij is the measured yield stress values when σ ij is applied as the only nonzero
stress component; σ0 is the user-defined reference yield stress; R11, R22, R33, R12, R13, and R23 are anisotropic yield stress ratios; and τ 0 = σ 0 / 3 . The six yield stress ratios are defined as follows:
R11 = σ11
σ0;R22 = σ22
σ0;R33 = σ33
σ0;R12 = σ12
τ 0;R13 = σ13
τ 0;R23 = σ23τ 0
(7)
The values for the non-linear orthotropic constitutive model were: E1 = 4700 MPa; E2 = 2387 MPa; E3 = 2387 MPa Nu12 = 0.403; Nu13=Nu23 = 0.459 G12=G13=G23 = 2841 MPa R11 = 1; R22 = 0.546; R33 = 0.546; R12 = 1.73; R13 = 0.946; R23 = 0.946 The main goal of this study was to select the best constitutive model describing the (anisotropic) mechanical behaviour of injection moulded components.
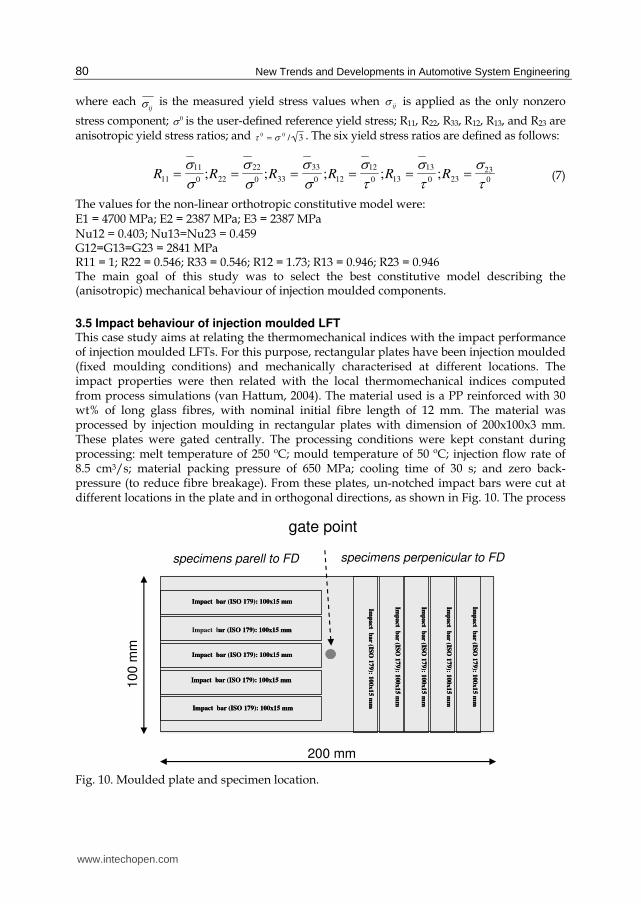
3.5 Impact behaviour of injection moulded LFT This case study aims at relating the thermomechanical indices with the impact performance of injection moulded LFTs. For this purpose, rectangular plates have been injection moulded (fixed moulding conditions) and mechanically characterised at different locations. The impact properties were then related with the local thermomechanical indices computed from process simulations (van Hattum, 2004). The material used is a PP reinforced with 30 wt% of long glass fibres, with nominal initial fibre length of 12 mm. The material was processed by injection moulding in rectangular plates with dimension of 200x100x3 mm. These plates were gated centrally. The processing conditions were kept constant during processing: melt temperature of 250 ºC; mould temperature of 50 ºC; injection flow rate of 8.5 cm3/s; material packing pressure of 650 MPa; cooling time of 30 s; and zero back-pressure (to reduce fibre breakage). From these plates, un-notched impact bars were cut at different locations in the plate and in orthogonal directions, as shown in Fig. 10. The process
200 mm
10
0 m
m
gate point
specimens perpenicular to FD specimens parell to FD
Imp
act b
ar (IS
O 1
79
): 10
0x1
5 m
m
Imp
act b
ar (IS
O 1
79
): 10
0x1
5 m
m
Imp
act b
ar (IS
O 1
79
): 10
0x1
5 m
m
Imp
act b
ar (IS
O 1
79
): 10
0x1
5 m
m
Imp
act b
ar (IS
O 1
79): 1
00x15 m
m
Impact bar (ISO 179): 100x15 mm
ar (ISO 179): 100x15 mm
Impact bar (ISO 179): 100x15 mm
Impact bar (ISO 179): 100x15 mm
Impact bar (ISO 179): 100x15 mm
Imp
act b
ar (IS
O 1
79
): 10
0x1
5 m
m
Imp
act b
ar (IS
O 1
79
): 10
0x1
5 m
m
Imp
act b
ar (IS
O 1
79
): 10
0x1
5 m
m
Imp
act b
ar (IS
O 1
79
): 10
0x1
5 m
m
Imp
act b
ar (IS
O 1
79): 1
00x15 m
m
Impact bar (ISO 179): 100x15 mm
Impact bar (ISO 179): 100x15 mm
Impact bar (ISO 179): 100x15 mm
Impact bar (ISO 179): 100x15 mm
Impact bar (ISO 179): 100x15 mm
Fig. 10. Moulded plate and specimen location.
www.intechopen.com
Optimization of Injection Moulded Polymer Automotive Components
81
simulations were performed using CMOLD software, allowing the computation at the end
of filling stage of the cooling index, the wall shear stress, τw, and frozen layer ratio, Sa. These variables were calculated at the locations where the impact tests were performed (middle of the impact bar). The un-notched impact bars of 15x100 mm were tested in an instrumented falling weight impact test machine, Rosand IFWIM type 5, at controlled room temperature (23 ºC), according to ISO179 standard. The support span was of 40 mm and the test velocity of 2 m/s. The line striker was lubricated with oil. From the recorded, Force-displacement, F-d, curve, the following values were measured: peak force, and energy, Fp an Up, and total energy, Ut.
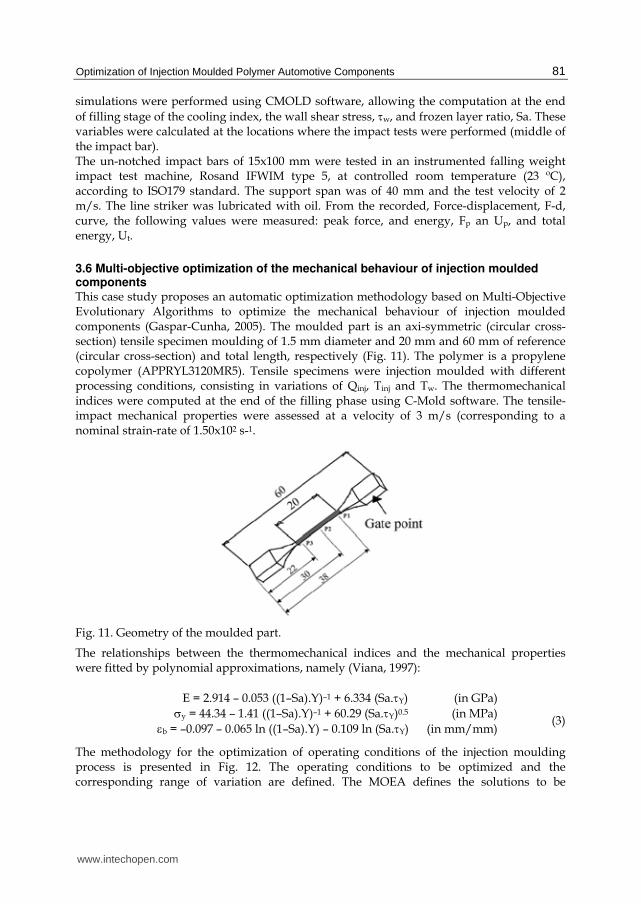
3.6 Multi-objective optimization of the mechanical behaviour of injection moulded components This case study proposes an automatic optimization methodology based on Multi-Objective Evolutionary Algorithms to optimize the mechanical behaviour of injection moulded components (Gaspar-Cunha, 2005). The moulded part is an axi-symmetric (circular cross-section) tensile specimen moulding of 1.5 mm diameter and 20 mm and 60 mm of reference (circular cross-section) and total length, respectively (Fig. 11). The polymer is a propylene copolymer (APPRYL3120MR5). Tensile specimens were injection moulded with different processing conditions, consisting in variations of Qinj, Tinj and Tw. The thermomechanical indices were computed at the end of the filling phase using C-Mold software. The tensile-impact mechanical properties were assessed at a velocity of 3 m/s (corresponding to a nominal strain-rate of 1.50x10² s-1.
Fig. 11. Geometry of the moulded part.
The relationships between the thermomechanical indices and the mechanical properties were fitted by polynomial approximations, namely (Viana, 1997):
E = 2.914 – 0.053 ((1–Sa).Y)–1 + 6.334 (Sa.τY) (in GPa)
σy = 44.34 – 1.41 ((1–Sa).Y)–1 + 60.29 (Sa.τY)0.5 (in MPa)
εb = –0.097 – 0.065 ln ((1–Sa).Y) – 0.109 ln (Sa.τY) (in mm/mm)
(3)
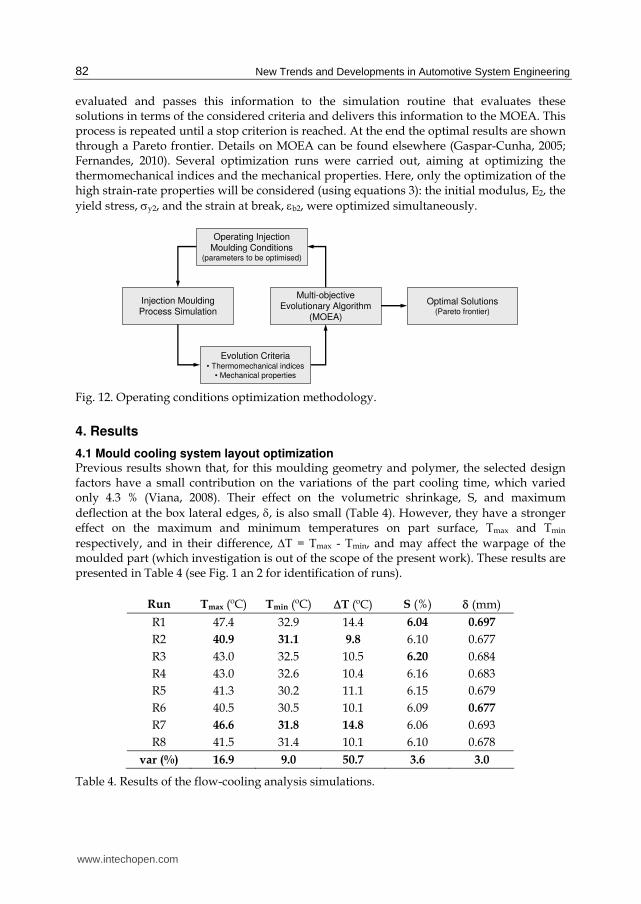
The methodology for the optimization of operating conditions of the injection moulding process is presented in Fig. 12. The operating conditions to be optimized and the corresponding range of variation are defined. The MOEA defines the solutions to be
www.intechopen.com
New Trends and Developments in Automotive System Engineering
82
evaluated and passes this information to the simulation routine that evaluates these solutions in terms of the considered criteria and delivers this information to the MOEA. This process is repeated until a stop criterion is reached. At the end the optimal results are shown through a Pareto frontier. Details on MOEA can be found elsewhere (Gaspar-Cunha, 2005; Fernandes, 2010). Several optimization runs were carried out, aiming at optimizing the thermomechanical indices and the mechanical properties. Here, only the optimization of the high strain-rate properties will be considered (using equations 3): the initial modulus, E2, the
yield stress, σy2, and the strain at break, εb2, were optimized simultaneously.
Multi-objectiveEvolutionary Algorithm
(MOEA)
Injection MouldingProcess Simulation
Evolution Criteria• Thermomechanical indices
• Mechanical properties
Operating InjectionMoulding Conditions
(parameters to be optimised)
Optimal Solutions(Pareto frontier)
Fig. 12. Operating conditions optimization methodology.
4. Results
4.1 Mould cooling system layout optimization Previous results shown that, for this moulding geometry and polymer, the selected design factors have a small contribution on the variations of the part cooling time, which varied only 4.3 % (Viana, 2008). Their effect on the volumetric shrinkage, S, and maximum
deflection at the box lateral edges, δ, is also small (Table 4). However, they have a stronger effect on the maximum and minimum temperatures on part surface, Tmax and Tmin
respectively, and in their difference, ΔT = Tmax - Tmin, and may affect the warpage of the moulded part (which investigation is out of the scope of the present work). These results are presented in Table 4 (see Fig. 1 an 2 for identification of runs).
Run Tmax (ºC) Tmin (ºC) ΔT (ºC) S (%) δ (mm) R1 47.4 32.9 14.4 6.04 0.697
R2 40.9 31.1 9.8 6.10 0.677
R3 43.0 32.5 10.5 6.20 0.684
R4 43.0 32.6 10.4 6.16 0.683
R5 41.3 30.2 11.1 6.15 0.679
R6 40.5 30.5 10.1 6.09 0.677
R7 46.6 31.8 14.8 6.06 0.693
R8 41.5 31.4 10.1 6.10 0.678
var (%) 16.9 9.0 50.7 3.6 3.0
Table 4. Results of the flow-cooling analysis simulations.
www.intechopen.com
Optimization of Injection Moulded Polymer Automotive Components
83
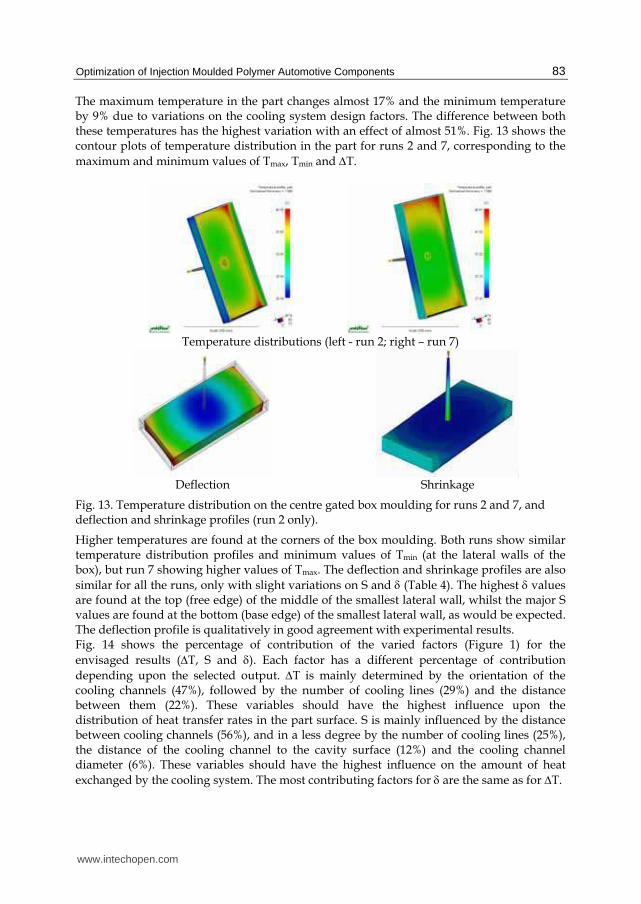
The maximum temperature in the part changes almost 17% and the minimum temperature by 9% due to variations on the cooling system design factors. The difference between both these temperatures has the highest variation with an effect of almost 51%. Fig. 13 shows the contour plots of temperature distribution in the part for runs 2 and 7, corresponding to the
maximum and minimum values of Tmax, Tmin and ΔT.
Temperature distributions (left - run 2; right – run 7)
Deflection
Shrinkage
Fig. 13. Temperature distribution on the centre gated box moulding for runs 2 and 7, and deflection and shrinkage profiles (run 2 only).
Higher temperatures are found at the corners of the box moulding. Both runs show similar temperature distribution profiles and minimum values of Tmin (at the lateral walls of the box), but run 7 showing higher values of Tmax. The deflection and shrinkage profiles are also
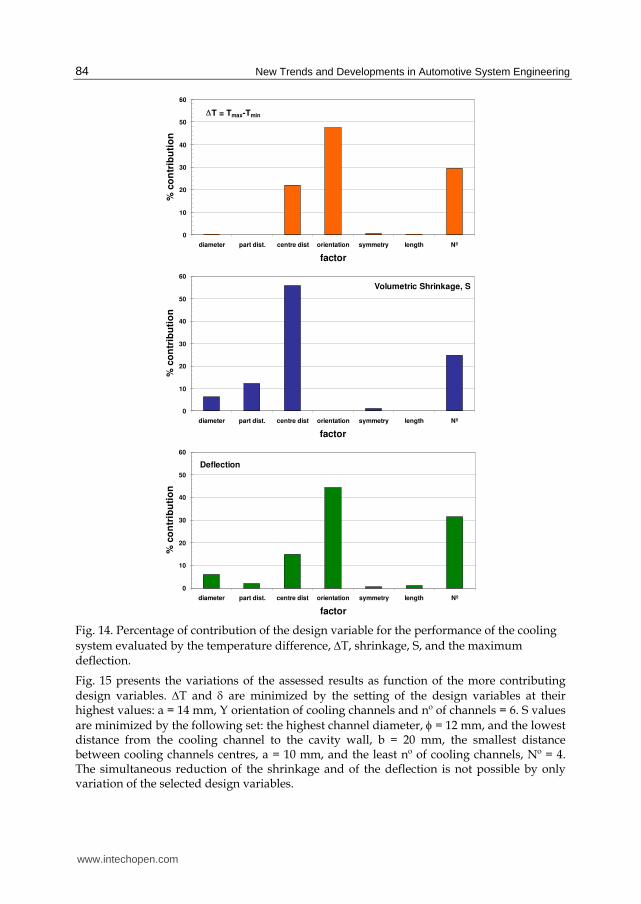
similar for all the runs, only with slight variations on S and δ (Table 4). The highest δ values are found at the top (free edge) of the middle of the smallest lateral wall, whilst the major S values are found at the bottom (base edge) of the smallest lateral wall, as would be expected. The deflection profile is qualitatively in good agreement with experimental results. Fig. 14 shows the percentage of contribution of the varied factors (Figure 1) for the
envisaged results (ΔT, S and δ). Each factor has a different percentage of contribution
depending upon the selected output. ΔT is mainly determined by the orientation of the cooling channels (47%), followed by the number of cooling lines (29%) and the distance between them (22%). These variables should have the highest influence upon the distribution of heat transfer rates in the part surface. S is mainly influenced by the distance between cooling channels (56%), and in a less degree by the number of cooling lines (25%), the distance of the cooling channel to the cavity surface (12%) and the cooling channel diameter (6%). These variables should have the highest influence on the amount of heat
exchanged by the cooling system. The most contributing factors for δ are the same as for ΔT.
www.intechopen.com
New Trends and Developments in Automotive System Engineering
84
ΔT = Tmax-Tmin
0
10
20
30
40
50
60
diameter part dist. centre dist orientation symmetry length Nº
factor
% c
on
trib
uti
on
Volumetric Shrinkage, S
0
10
20
30
40
50
60
diameter part dist. centre dist orientation symmetry length Nº
factor
% c
on
trib
uti
on
Deflection
0
10
20
30
40
50
60
diameter part dist. centre dist orientation symmetry length Nº
factor
% c
on
trib
uti
on
Fig. 14. Percentage of contribution of the design variable for the performance of the cooling
system evaluated by the temperature difference, ΔT, shrinkage, S, and the maximum deflection.
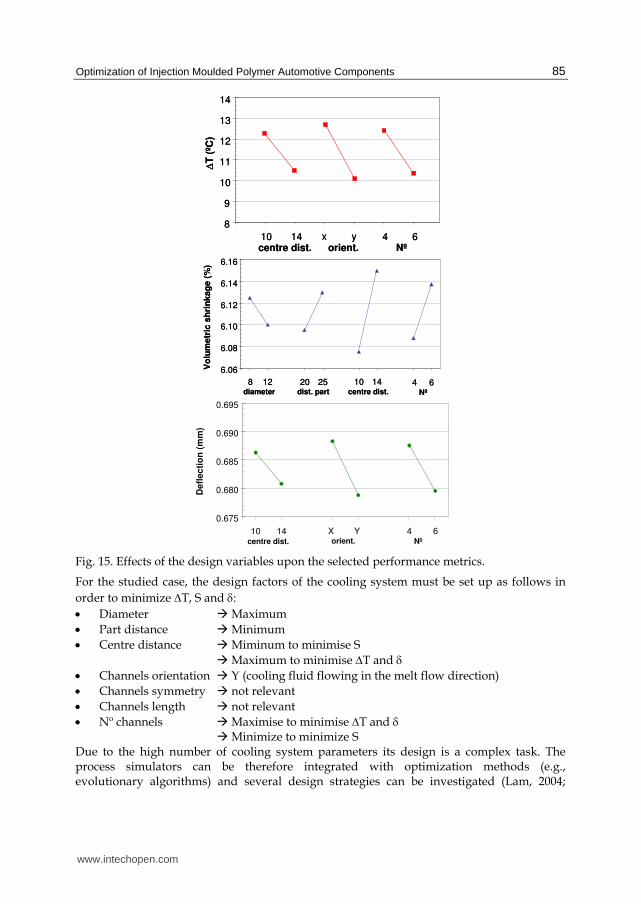
Fig. 15 presents the variations of the assessed results as function of the more contributing design variables. ΔT and δ are minimized by the setting of the design variables at their highest values: a = 14 mm, Y orientation of cooling channels and nº of channels = 6. S values
are minimized by the following set: the highest channel diameter, φ = 12 mm, and the lowest distance from the cooling channel to the cavity wall, b = 20 mm, the smallest distance between cooling channels centres, a = 10 mm, and the least nº of cooling channels, Nº = 4. The simultaneous reduction of the shrinkage and of the deflection is not possible by only variation of the selected design variables.
www.intechopen.com
Optimization of Injection Moulded Polymer Automotive Components
85
8
9
10
11
12
13
14
10 14 x y 4 6centre dist. orient. Nº
ΔT (º
C)
8
9
10
11
12
13
14
10 14 x y 4 6centre dist. orient. Nº
ΔT (º
C)
8 12 20 25 10 14 4 6diameter centre dist.dist. part Nº
6.06
6.08
6.10
6.12
6.14
6.16
Vo
lum
etr
ic s
hri
nk
ag
e (
%)
8 12 20 25 10 14 4 6diameter centre dist.dist. part Nº
6.06
6.08
6.10
6.12
6.14
6.16
Vo
lum
etr
ic s
hri
nk
ag
e (
%)
X Y10 14 4 6centre dist. orient. Nº
Defl
ec
tio
n (
mm
)
0.675
0.680
0.685
0.690
0.695
Fig. 15. Effects of the design variables upon the selected performance metrics.
For the studied case, the design factors of the cooling system must be set up as follows in
order to minimize ΔT, S and δ:
• Diameter å Maximum
• Part distance å Minimum
• Centre distance å Miminum to minimise S
å Maximum to minimise ΔT and δ
• Channels orientation å Y (cooling fluid flowing in the melt flow direction)
• Channels symmetry å not relevant
• Channels length å not relevant
• Nº channels å Maximise to minimise ΔT and δ å Minimize to minimize S
Due to the high number of cooling system parameters its design is a complex task. The process simulators can be therefore integrated with optimization methods (e.g., evolutionary algorithms) and several design strategies can be investigated (Lam, 2004;
www.intechopen.com
New Trends and Developments in Automotive System Engineering
86
Michelitsch, 2004; Pirc, 2009). Experience shows that savings potential of 10-40% can be attained in the injection moulding process through optimized mould cooling.
4.2 Impact behaviour of injection moulded automotive components The impact response of a ribbed plastic pillar when struck by a free motion head form (FMH) according to the FMVSS-201 standard was simulated in ABAQUS explicit code.
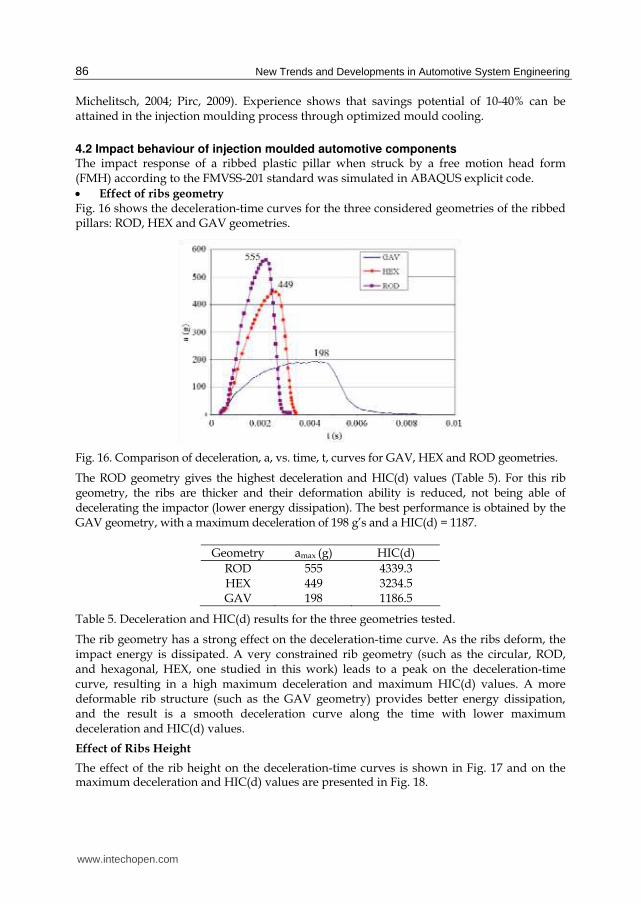
• Effect of ribs geometry Fig. 16 shows the deceleration-time curves for the three considered geometries of the ribbed pillars: ROD, HEX and GAV geometries.
Fig. 16. Comparison of deceleration, a, vs. time, t, curves for GAV, HEX and ROD geometries.
The ROD geometry gives the highest deceleration and HIC(d) values (Table 5). For this rib geometry, the ribs are thicker and their deformation ability is reduced, not being able of decelerating the impactor (lower energy dissipation). The best performance is obtained by the GAV geometry, with a maximum deceleration of 198 g’s and a HIC(d) = 1187.
Geometry amax (g) HIC(d)
ROD 555 4339.3 HEX 449 3234.5 GAV 198 1186.5
Table 5. Deceleration and HIC(d) results for the three geometries tested.
The rib geometry has a strong effect on the deceleration-time curve. As the ribs deform, the impact energy is dissipated. A very constrained rib geometry (such as the circular, ROD, and hexagonal, HEX, one studied in this work) leads to a peak on the deceleration-time curve, resulting in a high maximum deceleration and maximum HIC(d) values. A more deformable rib structure (such as the GAV geometry) provides better energy dissipation, and the result is a smooth deceleration curve along the time with lower maximum deceleration and HIC(d) values.
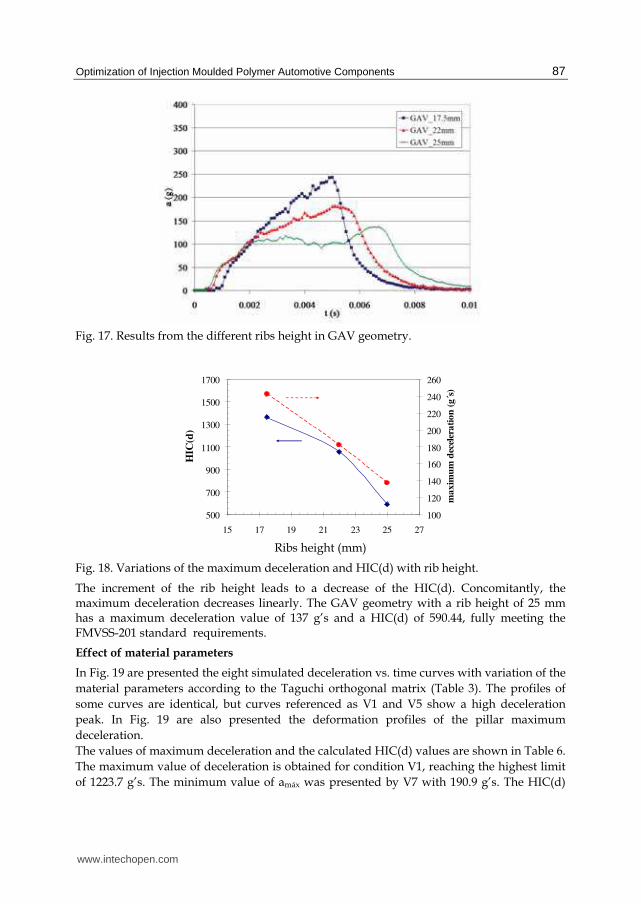
Effect of Ribs Height
The effect of the rib height on the deceleration-time curves is shown in Fig. 17 and on the maximum deceleration and HIC(d) values are presented in Fig. 18.
www.intechopen.com
Optimization of Injection Moulded Polymer Automotive Components
87
Fig. 17. Results from the different ribs height in GAV geometry.
500
700
900
1100
1300
1500
1700
15 17 19 21 23 25 27
HIC
(d)
100
120
140
160
180
200
220
240
260
ma
xim
um
dec
eler
ati
on
(g
´s)
Ribs height (mm)
Fig. 18. Variations of the maximum deceleration and HIC(d) with rib height.
The increment of the rib height leads to a decrease of the HIC(d). Concomitantly, the maximum deceleration decreases linearly. The GAV geometry with a rib height of 25 mm has a maximum deceleration value of 137 g’s and a HIC(d) of 590.44, fully meeting the FMVSS-201 standard requirements.
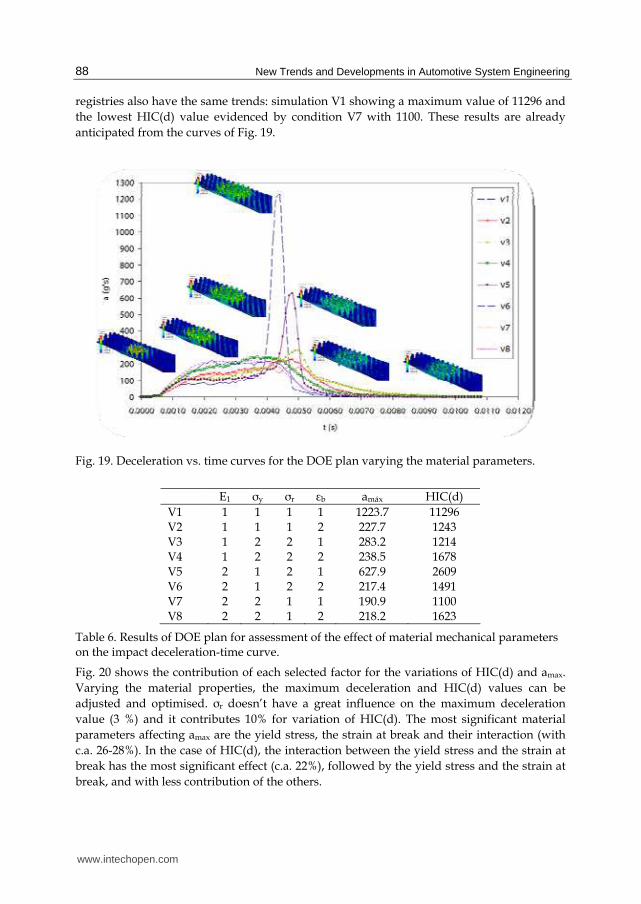
Effect of material parameters
In Fig. 19 are presented the eight simulated deceleration vs. time curves with variation of the
material parameters according to the Taguchi orthogonal matrix (Table 3). The profiles of
some curves are identical, but curves referenced as V1 and V5 show a high deceleration
peak. In Fig. 19 are also presented the deformation profiles of the pillar maximum
deceleration.
The values of maximum deceleration and the calculated HIC(d) values are shown in Table 6.
The maximum value of deceleration is obtained for condition V1, reaching the highest limit
of 1223.7 g’s. The minimum value of amáx was presented by V7 with 190.9 g’s. The HIC(d)
www.intechopen.com
New Trends and Developments in Automotive System Engineering
88
registries also have the same trends: simulation V1 showing a maximum value of 11296 and
the lowest HIC(d) value evidenced by condition V7 with 1100. These results are already
anticipated from the curves of Fig. 19.
Fig. 19. Deceleration vs. time curves for the DOE plan varying the material parameters.
E1 σy σr εb amáx HIC(d)
V1 1 1 1 1 1223.7 11296 V2 1 1 1 2 227.7 1243 V3 1 2 2 1 283.2 1214 V4 1 2 2 2 238.5 1678 V5 2 1 2 1 627.9 2609 V6 2 1 2 2 217.4 1491 V7 2 2 1 1 190.9 1100 V8 2 2 1 2 218.2 1623
Table 6. Results of DOE plan for assessment of the effect of material mechanical parameters on the impact deceleration-time curve.
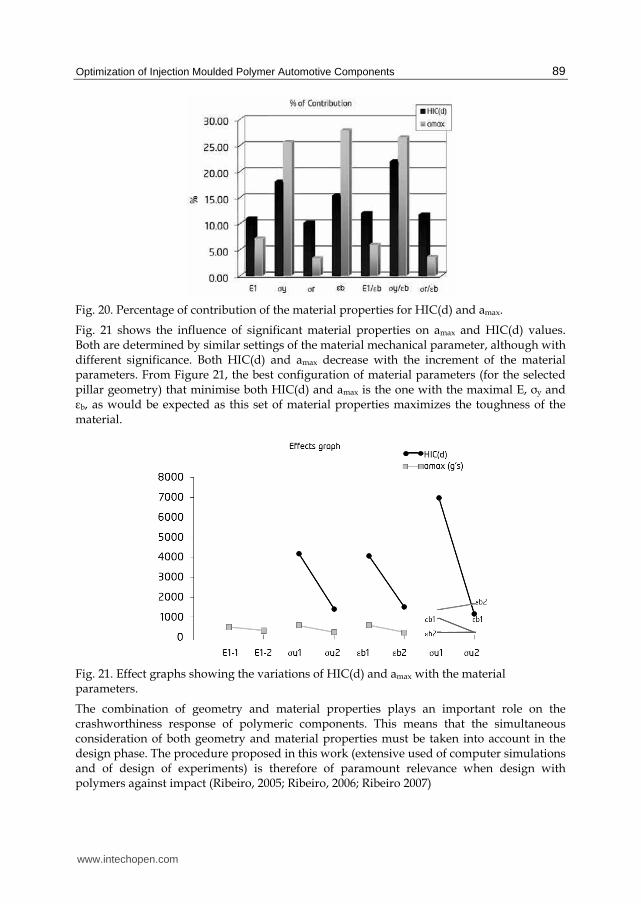
Fig. 20 shows the contribution of each selected factor for the variations of HIC(d) and amax.
Varying the material properties, the maximum deceleration and HIC(d) values can be
adjusted and optimised. σr doesn’t have a great influence on the maximum deceleration
value (3 %) and it contributes 10% for variation of HIC(d). The most significant material
parameters affecting amax are the yield stress, the strain at break and their interaction (with
c.a. 26-28%). In the case of HIC(d), the interaction between the yield stress and the strain at
break has the most significant effect (c.a. 22%), followed by the yield stress and the strain at
break, and with less contribution of the others.
www.intechopen.com
Optimization of Injection Moulded Polymer Automotive Components
89
Fig. 20. Percentage of contribution of the material properties for HIC(d) and amax.
Fig. 21 shows the influence of significant material properties on amax and HIC(d) values. Both are determined by similar settings of the material mechanical parameter, although with different significance. Both HIC(d) and amax decrease with the increment of the material parameters. From Figure 21, the best configuration of material parameters (for the selected pillar geometry) that minimise both HIC(d) and amax is the one with the maximal E, σy and εb, as would be expected as this set of material properties maximizes the toughness of the material.
Fig. 21. Effect graphs showing the variations of HIC(d) and amax with the material parameters.
The combination of geometry and material properties plays an important role on the crashworthiness response of polymeric components. This means that the simultaneous consideration of both geometry and material properties must be taken into account in the design phase. The procedure proposed in this work (extensive used of computer simulations and of design of experiments) is therefore of paramount relevance when design with polymers against impact (Ribeiro, 2005; Ribeiro, 2006; Ribeiro 2007)
www.intechopen.com
New Trends and Developments in Automotive System Engineering
90
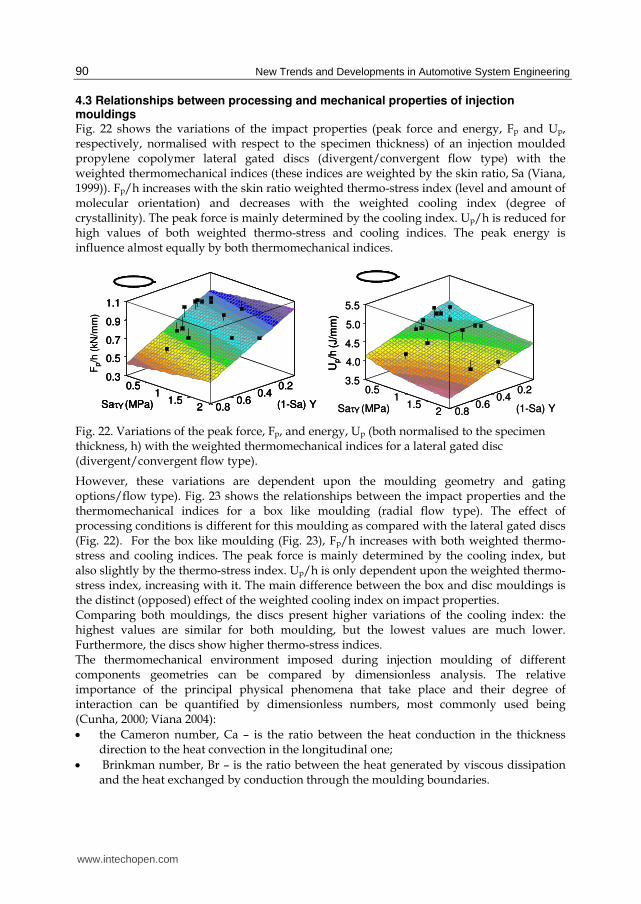
4.3 Relationships between processing and mechanical properties of injection mouldings Fig. 22 shows the variations of the impact properties (peak force and energy, Fp and Up, respectively, normalised with respect to the specimen thickness) of an injection moulded propylene copolymer lateral gated discs (divergent/convergent flow type) with the weighted thermomechanical indices (these indices are weighted by the skin ratio, Sa (Viana, 1999)). Fp/h increases with the skin ratio weighted thermo-stress index (level and amount of molecular orientation) and decreases with the weighted cooling index (degree of crystallinity). The peak force is mainly determined by the cooling index. Up/h is reduced for high values of both weighted thermo-stress and cooling indices. The peak energy is influence almost equally by both thermomechanical indices.
0.80.6
0.40.2
(1-Sa) Y21.5
10.5
Sa τY (MPa)
0.3
0.5
0.7
0.9
1.1
Fp/h
(kN
/mm
)
0.80.6
0.40.2
(1-Sa) Y21.5
10.5
Sa τY (MPa)
0.3
0.5
0.7
0.9
1.1
0.80.6
0.40.2
(1-Sa) Y21.5
10.5
Sa τY (MPa)
0.3
0.5
0.7
0.9
1.1
Fp/h
(kN
/mm
)
R2 =0.633
0.80.6
0.40.2
(1-Sa) Y21.5
10.5
Sa τY (MPa)
3.5
4.0
4.5
5.0
5.5
Up/h
(J/m
m)
R2 =0.633
0.80.6
0.40.2
(1-Sa) Y21.5
10.5
Sa τY (MPa)
3.5
4.0
4.5
5.0
5.5
Up/h
(J/m
m)
Up/h
(J/m
m)
Fig. 22. Variations of the peak force, Fp, and energy, Up (both normalised to the specimen thickness, h) with the weighted thermomechanical indices for a lateral gated disc (divergent/convergent flow type).
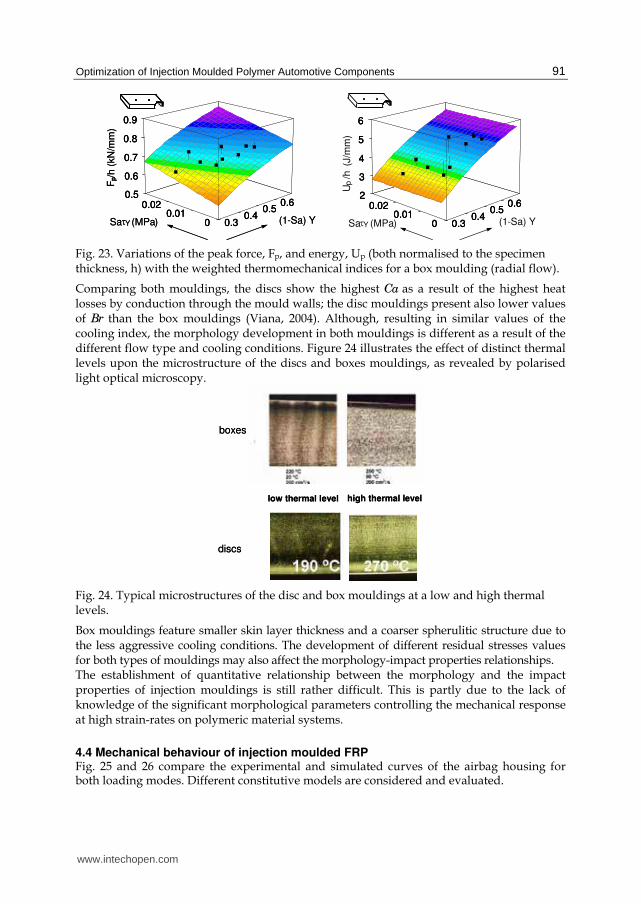
However, these variations are dependent upon the moulding geometry and gating options/flow type). Fig. 23 shows the relationships between the impact properties and the thermomechanical indices for a box like moulding (radial flow type). The effect of processing conditions is different for this moulding as compared with the lateral gated discs (Fig. 22). For the box like moulding (Fig. 23), Fp/h increases with both weighted thermo-stress and cooling indices. The peak force is mainly determined by the cooling index, but also slightly by the thermo-stress index. Up/h is only dependent upon the weighted thermo-stress index, increasing with it. The main difference between the box and disc mouldings is the distinct (opposed) effect of the weighted cooling index on impact properties. Comparing both mouldings, the discs present higher variations of the cooling index: the highest values are similar for both moulding, but the lowest values are much lower. Furthermore, the discs show higher thermo-stress indices. The thermomechanical environment imposed during injection moulding of different components geometries can be compared by dimensionless analysis. The relative importance of the principal physical phenomena that take place and their degree of interaction can be quantified by dimensionless numbers, most commonly used being (Cunha, 2000; Viana 2004):
• the Cameron number, Ca – is the ratio between the heat conduction in the thickness direction to the heat convection in the longitudinal one;
• Brinkman number, Br – is the ratio between the heat generated by viscous dissipation and the heat exchanged by conduction through the moulding boundaries.
www.intechopen.com
Optimization of Injection Moulded Polymer Automotive Components
91
Fp/h
(kN
/mm
)
(1-Sa) YSa τY (MPa) 0.30.4
0.50.6
00.01
0.020.5
0.6
0.7
0.8
0.9F
p/h
(kN
/mm
)
(1-Sa) YSa τY (MPa) 0.30.4
0.50.6
00.01
0.020.5
0.6
0.7
0.8
0.9
0.30.4
0.50.6
00.01
0.020.5
0.6
0.7
0.8
0.9
(1-Sa) YSa τY (MPa)
U /h
p(J
/mm
)
0.30.4
0.50.6
00.01
0.022
3
4
5
6
0.30.4
0.50.6
00.01
0.022
3
4
5
6
0.30.4
0.50.6
00.01
0.022
3
4
5
6
Fig. 23. Variations of the peak force, Fp, and energy, Up (both normalised to the specimen thickness, h) with the weighted thermomechanical indices for a box moulding (radial flow).
Comparing both mouldings, the discs show the highest Ca as a result of the highest heat losses by conduction through the mould walls; the disc mouldings present also lower values of Br than the box mouldings (Viana, 2004). Although, resulting in similar values of the cooling index, the morphology development in both mouldings is different as a result of the different flow type and cooling conditions. Figure 24 illustrates the effect of distinct thermal levels upon the microstructure of the discs and boxes mouldings, as revealed by polarised light optical microscopy.
low thermal level high thermal level
discs
boxes
low thermal level high thermal level
discs
boxes
Fig. 24. Typical microstructures of the disc and box mouldings at a low and high thermal levels.
Box mouldings feature smaller skin layer thickness and a coarser spherulitic structure due to the less aggressive cooling conditions. The development of different residual stresses values for both types of mouldings may also affect the morphology-impact properties relationships. The establishment of quantitative relationship between the morphology and the impact properties of injection mouldings is still rather difficult. This is partly due to the lack of knowledge of the significant morphological parameters controlling the mechanical response at high strain-rates on polymeric material systems.
4.4 Mechanical behaviour of injection moulded FRP Fig. 25 and 26 compare the experimental and simulated curves of the airbag housing for both loading modes. Different constitutive models are considered and evaluated.
www.intechopen.com
New Trends and Developments in Automotive System Engineering
92
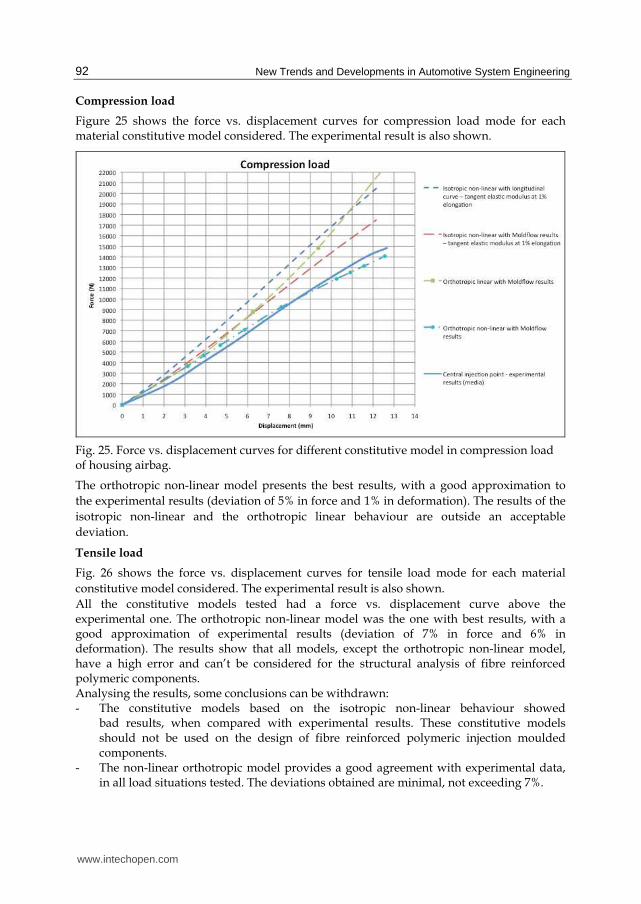
Compression load
Figure 25 shows the force vs. displacement curves for compression load mode for each material constitutive model considered. The experimental result is also shown.
Fig. 25. Force vs. displacement curves for different constitutive model in compression load of housing airbag.
The orthotropic non-linear model presents the best results, with a good approximation to
the experimental results (deviation of 5% in force and 1% in deformation). The results of the
isotropic non-linear and the orthotropic linear behaviour are outside an acceptable
deviation.
Tensile load
Fig. 26 shows the force vs. displacement curves for tensile load mode for each material
constitutive model considered. The experimental result is also shown.
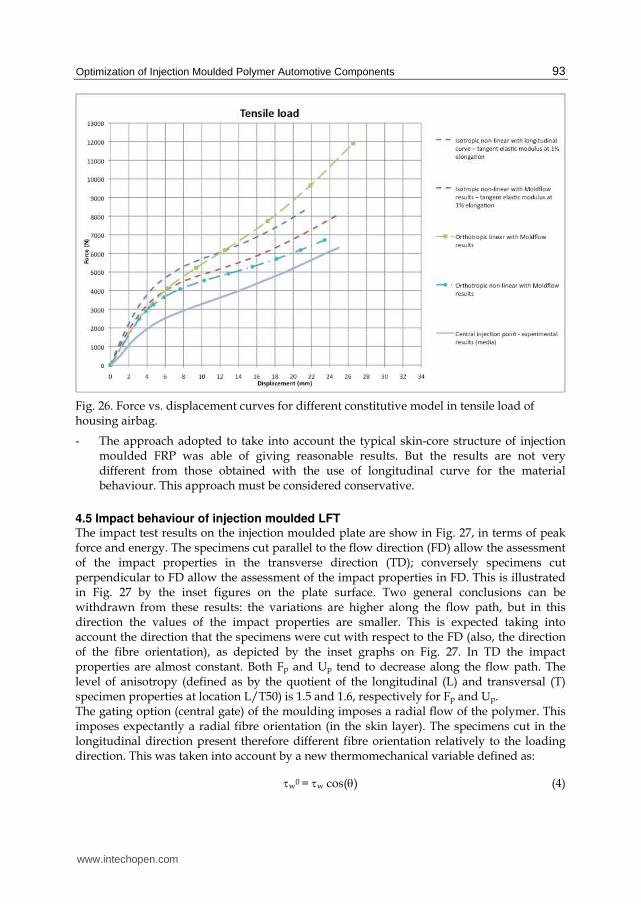
All the constitutive models tested had a force vs. displacement curve above the experimental one. The orthotropic non-linear model was the one with best results, with a good approximation of experimental results (deviation of 7% in force and 6% in deformation). The results show that all models, except the orthotropic non-linear model, have a high error and can’t be considered for the structural analysis of fibre reinforced polymeric components. Analysing the results, some conclusions can be withdrawn: - The constitutive models based on the isotropic non-linear behaviour showed
bad results, when compared with experimental results. These constitutive models should not be used on the design of fibre reinforced polymeric injection moulded components.
- The non-linear orthotropic model provides a good agreement with experimental data, in all load situations tested. The deviations obtained are minimal, not exceeding 7%.
www.intechopen.com
Optimization of Injection Moulded Polymer Automotive Components
93
Fig. 26. Force vs. displacement curves for different constitutive model in tensile load of housing airbag.
- The approach adopted to take into account the typical skin-core structure of injection moulded FRP was able of giving reasonable results. But the results are not very different from those obtained with the use of longitudinal curve for the material behaviour. This approach must be considered conservative.
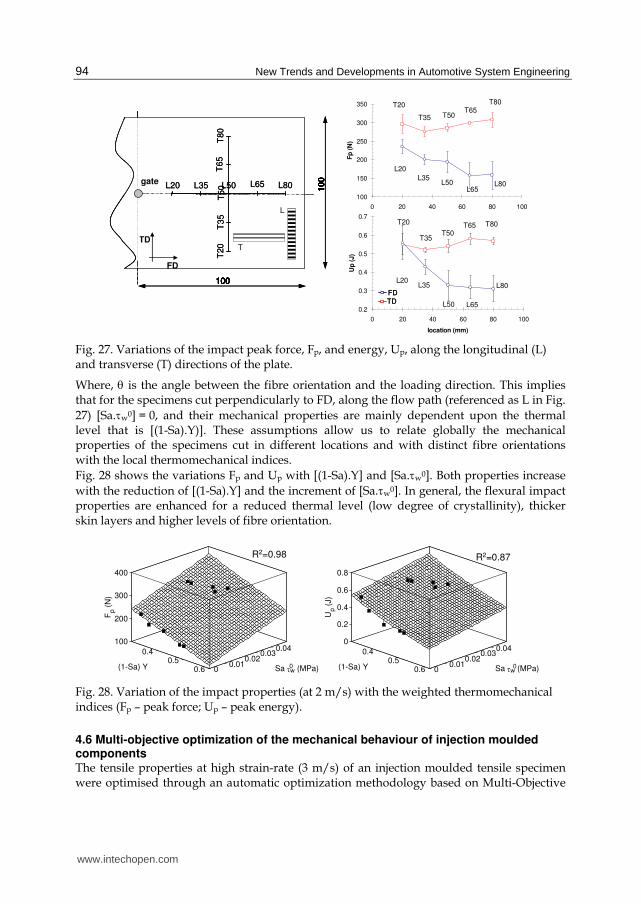
4.5 Impact behaviour of injection moulded LFT The impact test results on the injection moulded plate are show in Fig. 27, in terms of peak force and energy. The specimens cut parallel to the flow direction (FD) allow the assessment of the impact properties in the transverse direction (TD); conversely specimens cut perpendicular to FD allow the assessment of the impact properties in FD. This is illustrated in Fig. 27 by the inset figures on the plate surface. Two general conclusions can be withdrawn from these results: the variations are higher along the flow path, but in this direction the values of the impact properties are smaller. This is expected taking into account the direction that the specimens were cut with respect to the FD (also, the direction of the fibre orientation), as depicted by the inset graphs on Fig. 27. In TD the impact properties are almost constant. Both Fp and Up tend to decrease along the flow path. The level of anisotropy (defined as by the quotient of the longitudinal (L) and transversal (T) specimen properties at location L/T50) is 1.5 and 1.6, respectively for Fp and Up. The gating option (central gate) of the moulding imposes a radial flow of the polymer. This imposes expectantly a radial fibre orientation (in the skin layer). The specimens cut in the longitudinal direction present therefore different fibre orientation relatively to the loading direction. This was taken into account by a new thermomechanical variable defined as:
τw0 = τw cos(θ) (4)
www.intechopen.com
New Trends and Developments in Automotive System Engineering
94
100
150
200
250
300
350
0 20 40 60 80 100
location (mm)
Fp
(N
)
0.2
0.3
0.4
0.5
0.6
0.7
0 20 40 60 80 100
location (mm)
Up
(J)
FD
TD
100
100
gate
100
100
gate
100
100
gate
100
100
gateL20 L35 L50 L65 L80
T20
T35
T50
T65
T80
FD
TD
100
100
gate
100
100
gate
100
100
gate
100
100
gateL20 L35 L50 L65 L80L20 L35 L50 L65 L80
T20
T35
T50
T65
T80
T20
T35
T50
T65
T80
T20
T35 T50T65
T80
L20
L35L50
L65L80
T20
T35T50
T65 T80
L20L35
L50 L65
L80
TDFDTDFD
L
T
Fig. 27. Variations of the impact peak force, Fp, and energy, Up, along the longitudinal (L) and transverse (T) directions of the plate.
Where, θ is the angle between the fibre orientation and the loading direction. This implies that for the specimens cut perpendicularly to FD, along the flow path (referenced as L in Fig.
27) [Sa.τw0] = 0, and their mechanical properties are mainly dependent upon the thermal level that is [(1-Sa).Y)]. These assumptions allow us to relate globally the mechanical properties of the specimens cut in different locations and with distinct fibre orientations with the local thermomechanical indices.
Fig. 28 shows the variations Fp and Up with [(1-Sa).Y] and [Sa.τw0]. Both properties increase
with the reduction of [(1-Sa).Y] and the increment of [Sa.τw0]. In general, the flexural impact properties are enhanced for a reduced thermal level (low degree of crystallinity), thicker skin layers and higher levels of fibre orientation.
0.60.5
0.4
(1-Sa) Y 00.01
0.020.03
0.04
Sa τw (MPa)
100
200
300
400
Fp (
N)
R2=0.98
00.60.5
0.4
(1-Sa) Y 00.01
0.020.03
0.04
Sa τw (MPa)
100
200
300
400
Fp (
N)
R2=0.98
0 0.60.5
0.4
(1-Sa) Y 00.01
0.020.03
0.04
Sa τw (MPa)
0
0.2
0.4
0.6
0.8
Up (
J)
R2=0.87
00.60.5
0.4
(1-Sa) Y 00.01
0.020.03
0.04
Sa τw (MPa)
0
0.2
0.4
0.6
0.8
Up (
J)
R2=0.87
0
Fig. 28. Variation of the impact properties (at 2 m/s) with the weighted thermomechanical indices (Fp – peak force; Up – peak energy).
4.6 Multi-objective optimization of the mechanical behaviour of injection moulded components The tensile properties at high strain-rate (3 m/s) of an injection moulded tensile specimen were optimised through an automatic optimization methodology based on Multi-Objective
www.intechopen.com
Optimization of Injection Moulded Polymer Automotive Components
95
Evolutionary Algorithms (Gaspar-Cunha, 2005). The initial modulus, E2, yield stress, σy2,
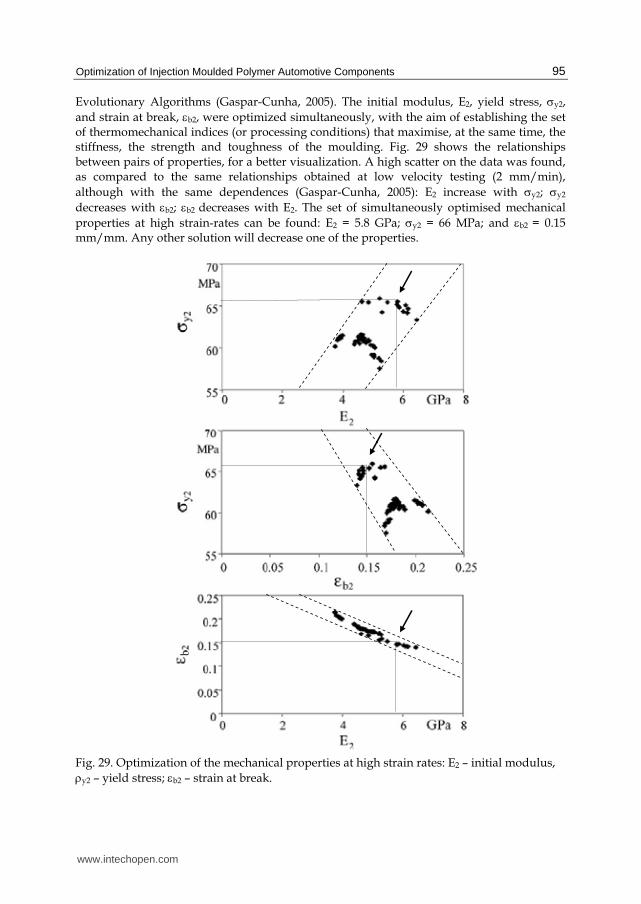
and strain at break, εb2, were optimized simultaneously, with the aim of establishing the set of thermomechanical indices (or processing conditions) that maximise, at the same time, the stiffness, the strength and toughness of the moulding. Fig. 29 shows the relationships between pairs of properties, for a better visualization. A high scatter on the data was found, as compared to the same relationships obtained at low velocity testing (2 mm/min),
although with the same dependences (Gaspar-Cunha, 2005): E2 increase with σy2; σy2
decreases with εb2; εb2 decreases with E2. The set of simultaneously optimised mechanical
properties at high strain-rates can be found: E2 = 5.8 GPa; σy2 = 66 MPa; and εb2 = 0.15 mm/mm. Any other solution will decrease one of the properties.
Fig. 29. Optimization of the mechanical properties at high strain rates: E2 – initial modulus,
ρy2 – yield stress; εb2 – strain at break.
www.intechopen.com
New Trends and Developments in Automotive System Engineering
96
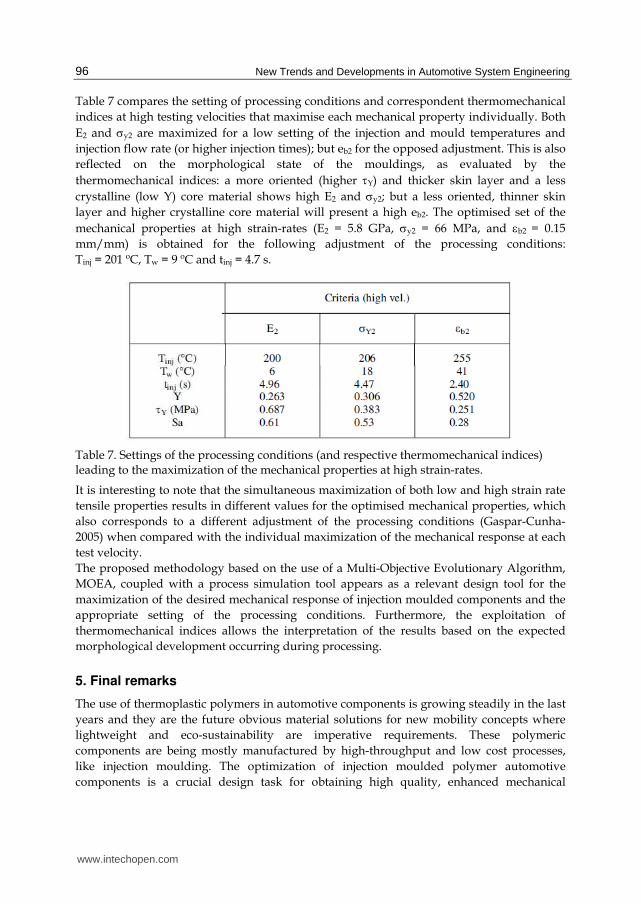
Table 7 compares the setting of processing conditions and correspondent thermomechanical
indices at high testing velocities that maximise each mechanical property individually. Both
E2 and σy2 are maximized for a low setting of the injection and mould temperatures and
injection flow rate (or higher injection times); but eb2 for the opposed adjustment. This is also
reflected on the morphological state of the mouldings, as evaluated by the
thermomechanical indices: a more oriented (higher τY) and thicker skin layer and a less
crystalline (low Y) core material shows high E2 and σy2; but a less oriented, thinner skin
layer and higher crystalline core material will present a high eb2. The optimised set of the
mechanical properties at high strain-rates (E2 = 5.8 GPa, σy2 = 66 MPa, and εb2 = 0.15
mm/mm) is obtained for the following adjustment of the processing conditions:
Tinj = 201 ºC, Tw = 9 ºC and tinj = 4.7 s.
Table 7. Settings of the processing conditions (and respective thermomechanical indices) leading to the maximization of the mechanical properties at high strain-rates.
It is interesting to note that the simultaneous maximization of both low and high strain rate
tensile properties results in different values for the optimised mechanical properties, which
also corresponds to a different adjustment of the processing conditions (Gaspar-Cunha-
2005) when compared with the individual maximization of the mechanical response at each
test velocity.
The proposed methodology based on the use of a Multi-Objective Evolutionary Algorithm,
MOEA, coupled with a process simulation tool appears as a relevant design tool for the
maximization of the desired mechanical response of injection moulded components and the
appropriate setting of the processing conditions. Furthermore, the exploitation of
thermomechanical indices allows the interpretation of the results based on the expected
morphological development occurring during processing.
5. Final remarks
The use of thermoplastic polymers in automotive components is growing steadily in the last
years and they are the future obvious material solutions for new mobility concepts where
lightweight and eco-sustainability are imperative requirements. These polymeric
components are being mostly manufactured by high-throughput and low cost processes,
like injection moulding. The optimization of injection moulded polymer automotive
components is a crucial design task for obtaining high quality, enhanced mechanical
www.intechopen.com
Optimization of Injection Moulded Polymer Automotive Components
97
response and low cost components. Two main optimization routes are normally addressed,
most of the time separately: the optimization of the injection moulding process and the
optimization of the properties of the injection moulded components. Nevertheless, the
adoption of a holistic approach, optimising simultaneously the manufacturing process (e.g.,
mould design, reduction of defective parts), and the component specifications (e.g.,
mechanical properties) is required. In this approach the knowledge of the relationships
between the processing thermo-mechanical environment, the polymer morphology and the
moulding properties is essential at the component design stage. Nowadays, the automotive
component design makes intensive use of computer simulations (e.g., process, functional,
structural). Improved part quality and reduced cost requirements demand the integration of
advanced simulation resources, of accurate process-properties relationships and of
optimization tools.
This chapter addressed the application of the engineering design optimization methods and
tools to the design of polymeric automotive polymer components moulded by the injection
moulding process. Different routes and methodologies were presented based on process
(injection moulding) and structural (mechanical response) simulations, on the processing-
properties relationships for unreinforced and reinforced polymer systems, on diverse
optimization methods (combined DOE/ANOVA statistical tools and multi-objective
evolutionary algorithms). Currently, there is a panoply of advanced tools available to the
automotive component designers that need to be intelligently combined in order to
efficiently design with polymeric materials. Besides part quality and cost reductions, next
engineering challenges will address eco-design concerns.
6. References
Ashmead, M., et al (1998) Advanced Materials for Enhanced Automotive Safety, Cellbond
Composites Ltd, Huntingdon, Cambridgeshire, SAE Techn. Papers, pp. 23-32
Castro, C.E., Cabrera-Rios, M., Lilly, B., Castro, J.M., Mount-Campbell (2003), Identifying
The Best Compromises Between Multiple Performance Measures In Injection
Molding (IM) Using Data Envelopment Analysis (DEA), J Integrated Design &
Process Science Archive, 7(1) pp. 77-86
Castro, C.E., Cabrera-Rios M, Castro JM, Lilly B (2007) Multiple Criteria Optimization With
Variability Considerations in Injection Molding, Polym Eng. Sci., 47(4), pp. 400-409
Chen C-P, Chuang M-T, Hsiao Y.H, Yang Y-K, Tsai C-H (2009) Simulation and experimental
study in determining injection molding process parameters for thin-shell plastic
parts via design of experiments analysis, Expert Systems with Applications, 36(7), pp.
10752-10759
Constable, RC, Kattas, LN (2002), Long glass fiber composites: rapid growth and change,
Proc. ANTEC’02, S. Francisco, USA
Cunha AM, Pouzada AS (1995) in Impact and dynamic fracture of polymers and composites,
ESIS19, ed. J.G. Williams and A. Pavan, Mech. Eng. Public., London, p. 315-325
Cunha AM, Godinho JS, Viana JC (2000) in Structure Development during polymer processing,
NATO-ASI series, v. 370, eds Cunha, A.M. and Fakirov S., Kluver Acad. Pub., p.
255-277
www.intechopen.com
New Trends and Developments in Automotive System Engineering
98
Fernandes C, Pontes AJ, Viana JC, Gaspar-Cunha A (2010) Using Multiobjective
Evolutionary Algorithms in the Optimization of Operating Conditions of Polymer
Injection Molding, Polym Eng. Sci., 50(8), pp. 1667-1678
FMVSS-201 (1997) Code of Federal Regulations – Transportation FMVSS-201. Standard Nº.
201: Occupant protection in interior impact.
Fremgen C, Mkrtchyan L, Hubera U, Maier M (2005), Sci. Techn. Adv. Mat., 6
Gaspar-Cunha A., Viana JC (2005) Using Multiobjective Evolutionary Algorithms to
Optimize Mechanical Properties of Injection Molded Parts, Intern. Polym. Proc., XX,
3, pp. 274-285
Gholami, T., et al (2002) Finite Element Analysis of Head Impact According to Extended
FMVSS-201, ABAQUS Users Conference, 23.-24. September, Wiesbaden, Germany
Hassan H, Regnier N, Lebot C, Pujos C, Defaye G (2009) Effect of cooling system on the
polymer temperature and solidification during injection molding, Applied Thermal
Eng., 29, pp. 1786–1791
Jacobs, A (2002) Car makers increase their use of composites, Reinf. Plastics, 48(2), p. 26-32
Kazmer DO (2000) Axiomatic design of the injection molding process, Proc. ICAD2000, 1st
Intern. Conf. Axiomatic Design, Cambridge, June 21-23, pp.123-129
Krasteva D, Hattum FWJ, Viana JC, Impact properties of injection moulded long fibre
reinforced polypropylene composites, Proc. 10th Portuguese conference on fracture, 22-
24 Feb., Guimaraes, Portugal
Lam, YC, Zhai LY, Tai K, Fok SC (2004) An evolutionary approach for cooling system
optimization in plastic injection moulding, Intern. J. Prod. Research, 42(10), pp. 2047-
2061
Li, CL, Li GC, Mok ACK (2005) Automatic layout design of plastic injection mould cooling
system , Computer-Aided Design, 37 (7) pp. 645-662
Liang J-Z (2002) An optimal design of cooling system for injection mold, Polymer-Plastics
Techn. Eng., 41(2), pp. 261-271
Lin, JZ, Pitrof, SM (2004) Analytical design of cockpit modules for safety and comfort, SAE
World Congress, Detroit, Michigan
Lotti C, Bretas, RES (2006) Correlations between Injection Molding Parameters, Morphology
and Mechanical Properties of PPS Using Artificial Neural Networks, Intern Polym
Proc, 2, pp. 104-115
Lotti C, Bretas RES (2007) Correlation between Injection Molding Parameters, Morphology
and Mechanical Properties of PPS/SEBS Blend Using Artificial Neural Networks,
Intern. Polymer Proc., 1, pp. 105-116
Luts W, Herrmann J, Kockelmann M, Hosseini HS, Jackel A, Schmauder S, Predak S, Busse
G (2009) Damage development in short-fiber reinforced injection molded
composites, Computational Materials Sci., 45(3), pp. 698-708
Michelitsch T, Mehnen J (2004) Evolutionary Optimization of Cooling Circuit Layouts Based
on the Electrolytic Tank Method. Proc. 4th CIRP Intern. Seminar on Intelligent
Computation Manuf. Eng. CIRP ICME '04, pp. 199-206 R. Teti (Ed.), Sorrento
Park SJ, Won TH (1998) Optimal Cooling System Design for the Injection Molding Process,
Polym. Eng. Sci., 28 (9)
www.intechopen.com
Optimization of Injection Moulded Polymer Automotive Components
99
Pirc N, Schmidt FM, Mongeau M, Bugarin F (2006) BEM-based cooling optimization for 3D
injection molding, Intern. J. Mechanical Sci., Proc. ASMDO’07, 48 (4), pp. 430-439
Ribeiro, CJ, Viana, JC, Vilaça, F, Azenha, J (2005) Design and simulation of automotive
pillars for occupant protection, AUTOPOLYMERS 2005, USA-Portuguese Workshop,
Charleston – USA: October 27-31
Ribeiro CJ, Viana JC, Vilaça F, Azenha J (2006) Design and simulation of automotive plastic
pillars for occupant protection, Plastic, Rubber Comp., 35(6)
Ribeiro, CJ, Viana, JC, Vilaça, F, Azenha, J (2007) Development of automotive plastic pillars
for preventing occupant injuries by finite element simulations: The role of material
properties, Proc. MATERIAIS 2007, IV Intern. Mat. Symp., Porto, PORTUGAL: April
1-4
Schijve, W (2002) Properties of long glass fibre polypropylene composites with length
distributions, Proc. ECCM-10, Brugge, Belgium
Tang SH, Tan YJ, Sapuan SM, Sulaiman S, Ismail N, Samin R (2007) The use of Taguchi
method in the design of plastic injection mould for reducing warpage, J. Mat. Proc.
Techn., 182, pp. 418–426
Turng LS, Peic M (2002) Computer-aided Process and Design Optimization for Injection
Molding, J Eng Manufacture, Proc. Institution Mech Eng Part B, 216(B12), pp. 1523-
1532
van der Wal A, Mulder JJ, Gaymans RJ (1998), Polymer, 39, p. 5477-548
van Hattum FWJ, Viana JC (2004) Optimising the mechanical performance of long fibre
thermoplastic composites through process modelling, 9th Portuguese Conf. Fracture,
Setúbal, Portugal
Viana, JC, Cunha, AM, Billon, N (1997) Polym. Intern. 43, p. 159
Viana JC, Cunha AM, Billon N (1999) Polym. Eng. Sci., 39, pp. 1463-1472
Viana JC, Cunha AM, Billon N (2002) The thermomechanical environment and the
microstructure of an injection moulded polypropylene copolymer, Polymer, 43, pp.
4185-4196
Viana JC (2004), Development of the skin layer in injection moulding: phenomenological
model, Polymer, 45, pp. 993–1005
Viana JC (2006) Polymeric materials for impact and energy dissipation, J. Plastics, Rubber
Comp, 35 (6/7) 260-267
Viana JC, (2008) Reduction of cycle time in injection moulding, Revista O Molde, CEFAMOL
July 2008 (in Portuguese and English)
Vincent M, Giroud T, Clarke T, Eberhardt C (2005) Description and modelling of fober
orientation in injection molding of fiber reinforced thermoplastics, Polymer, 46(17)
pp. 6719-6725.
Wust A, Hensel T, Jansen D (2009), Integrative optimization of injection-moulded parts, 7th
European LS-Dyna Conf, May, Salzburg, Austria
Xu X, Sach E, Allen S (2001), The Design of Conformal Cooling Channels in Injection
Moulding Tooling, Polym Eng Sci, 4(1), pp. 1269-1272
Yang Y-K (2007) Optimization of Injection-Molding Process of Short Glass Fiber and
Polytetrafluoroethylene Reinforced Polycarbonate Composites via Design of
Experiments Method: A Case Study, Mat. Manuf. Proc., 21 (8), pp. 915-921
www.intechopen.com

New Trends and Developments in Automotive System Engineering
100
Zerull, M., et al (2000) Using Suitable Plastic Components to Improve Vehicle Interior Safety
to Comply with FMVSS-201, SAE Techn. Papers, pp. 209-231.
Zhou J, Turng LS (2007) Process Optimization of Injection Molding Using an Adaptive
Surrogate Model With Gaussian Process Approach, Polym Eng Sci, 47(5), pp. 684-
694
www.intechopen.com
New Trends and Developments in Automotive System EngineeringEdited by Prof. Marcello Chiaberge
ISBN 978-953-307-517-4Hard cover, 664 pagesPublisher InTechPublished online 08, January, 2011Published in print edition January, 2011
InTech EuropeUniversity Campus STeP Ri Slavka Krautzeka 83/A 51000 Rijeka, Croatia Phone: +385 (51) 770 447 Fax: +385 (51) 686 166www.intechopen.com
InTech ChinaUnit 405, Office Block, Hotel Equatorial Shanghai No.65, Yan An Road (West), Shanghai, 200040, China
Phone: +86-21-62489820 Fax: +86-21-62489821
In the last few years the automobile design process is required to become more responsible and responsiblyrelated to environmental needs. Basing the automotive design not only on the appearance, the visualappearance of the vehicle needs to be thought together and deeply integrated with the “power†developed by the engine. The purpose of this book is to try to present the new technologies developmentscenario, and not to give any indication about the direction that should be given to the research in this complexand multi-disciplinary challenging field.
How to referenceIn order to correctly reference this scholarly work, feel free to copy and paste the following:
Ribeiro, C.J. and Viana, J.C. (2011). Optimization of Injection Moulded Polymer Automotive Components, NewTrends and Developments in Automotive System Engineering, Prof. Marcello Chiaberge (Ed.), ISBN: 978-953-307-517-4, InTech, Available from: http://www.intechopen.com/books/new-trends-and-developments-in-automotive-system-engineering/optimization-of-injection-moulded-polymer-automotive-components

© 2011 The Author(s). Licensee IntechOpen. This chapter is distributedunder the terms of the Creative Commons Attribution-NonCommercial-ShareAlike-3.0 License, which permits use, distribution and reproduction fornon-commercial purposes, provided the original is properly cited andderivative works building on this content are distributed under the samelicense.