One-Source Capture-Recapture: Models, applications …. M. Cru… · One-Source Capture-Recapture:...
25
1 Maarten Cruyff∗, Guus Cruts‡, Peter G.M. van der Heijden∗ , * Utrecht University ‡ Trimbos ISI 2011 One-Source Capture-Recapture: Models, applications and software
-
Upload
truongmien -
Category
Documents
-
view
237 -
download
0
Transcript of One-Source Capture-Recapture: Models, applications …. M. Cru… · One-Source Capture-Recapture:...
1
Maarten Cruyff∗, Guus Cruts‡,
Peter G.M. van der Heijden∗ ,
* Utrecht University
‡ Trimbos
ISI 2011
One-Source Capture-Recapture:
Models, applications and software
2
Outline
1. One-source data
2. Models and assumptions
3. Software
3
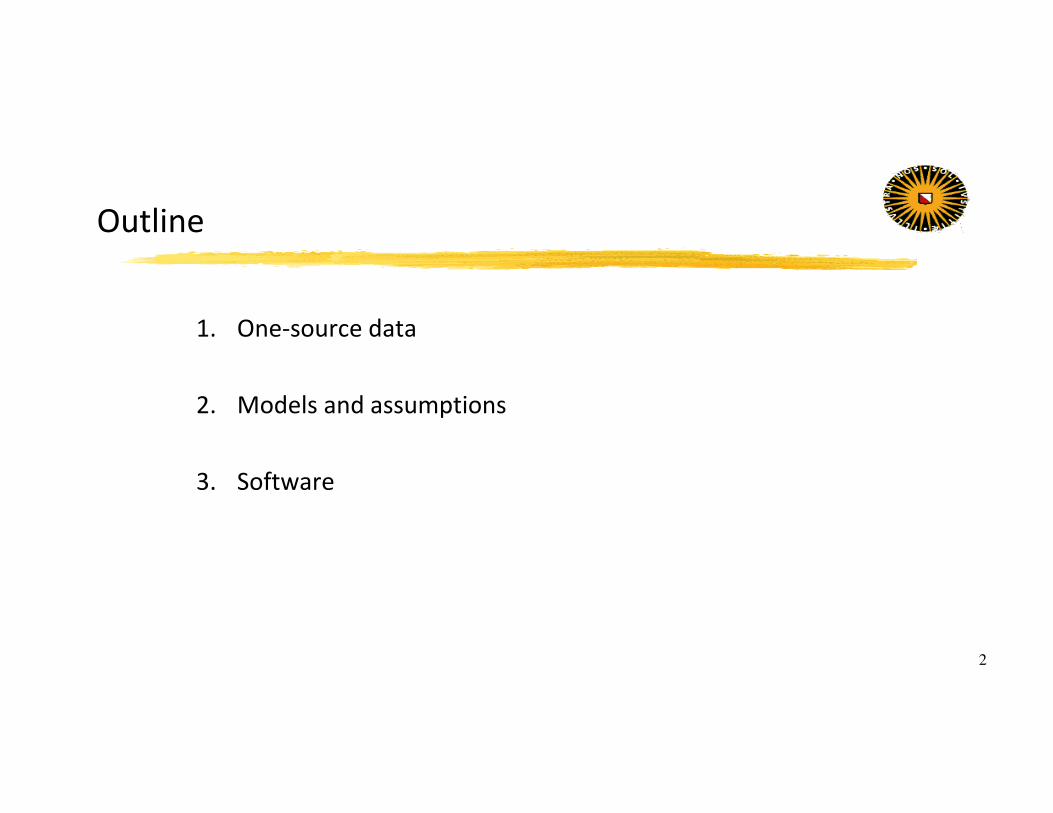
One-source CRC data
� Observed data �� � 1,2,3, . . ., � 1, . . . , �
� Individual event count
o drug-related hospital admissions
o visits at rehabilitation center
� Unobserved data �� � 0, � � � 1, . . . , �
o PDU not in hospital
o PDU not in rehabilitation
y
Hospital admissions
Rehabilitation
center
0 ? ?
1 1480 1206
2 155 474
3 41 198
4 11 95
5 10 29
6 3 19
7 2 5
8 0 2
9 0 0
10 1 1
11 2
4
Distributional assumption (1)
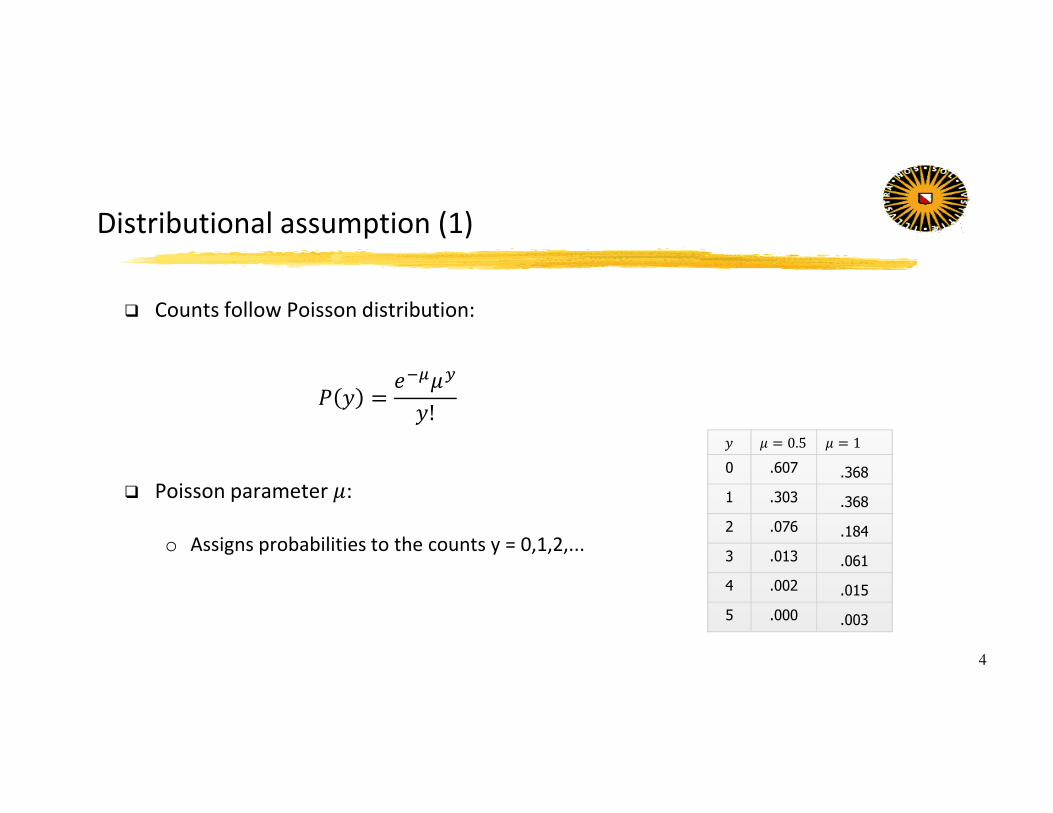
� Counts follow Poisson distribution:
� � ������
�!
� Poisson parameter �:
o Assigns probabilities to the counts y = 0,1,2,...
�� � 0.5 � � 1
0 .607 .368
1 .303 .368
2 .076 .184
3 .013 .061
4 .002 .015
5 .000 .003
5
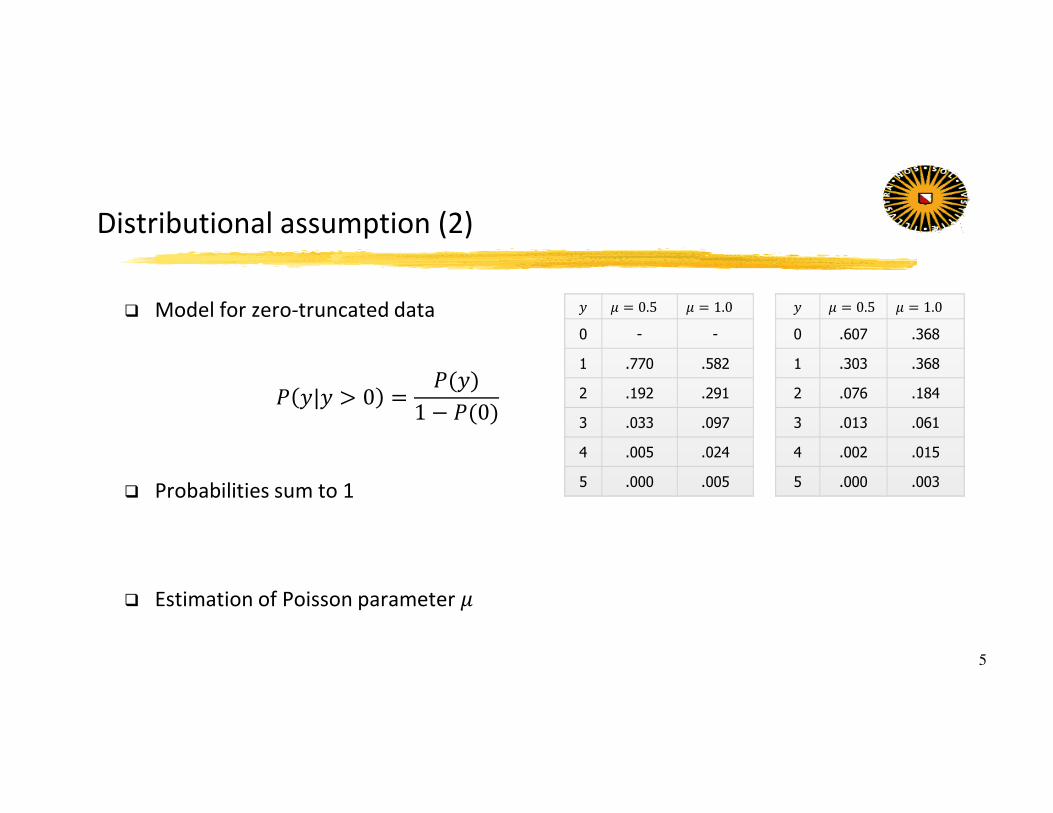
Distributional assumption (2)
� Model for zero-truncated data
� �|� � 0 �����
1 � ��0�
� Probabilities sum to 1
� Estimation of Poisson parameter �
�� � 0.5 � � 1.0
0 - -
1 .770 .582
2 .192 .291
3 .033 .097
4 .005 .024
5 .000 .005
�� � 0.5 � � 1.0
0 .607 .368
1 .303 .368
2 .076 .184
3 .013 .061
4 .002 .015
5 .000 .003
6
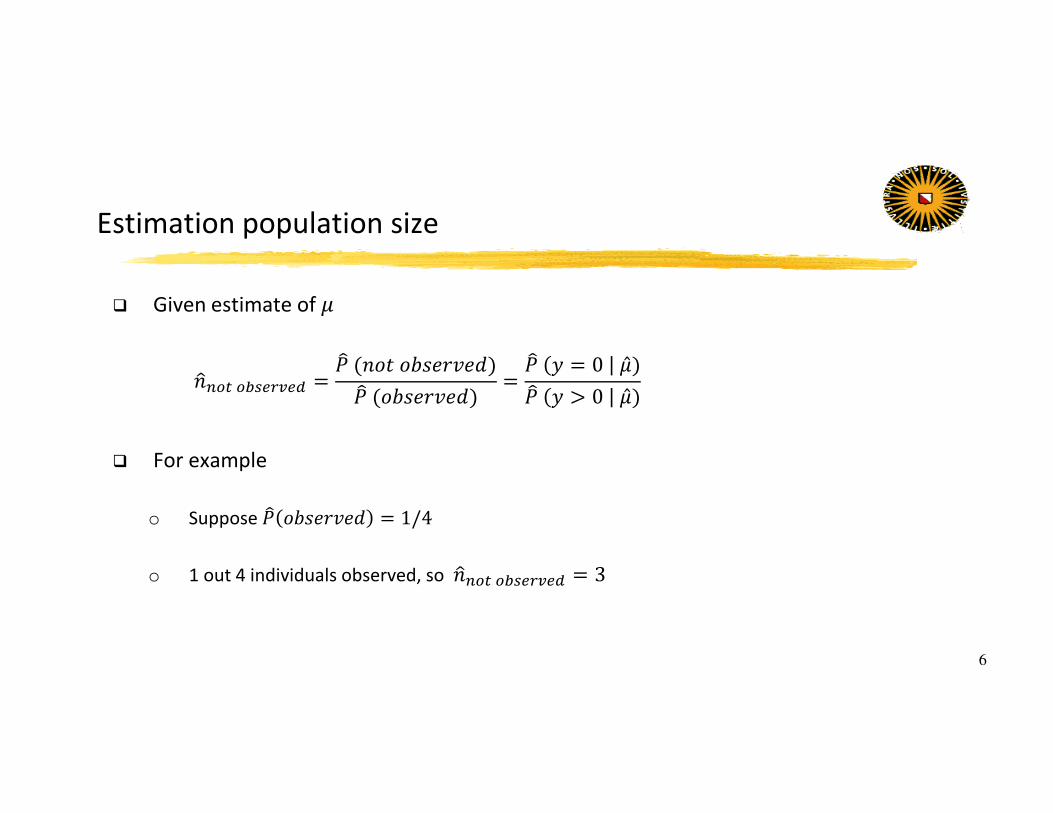
Estimation population size
� Given estimate of �
���� �!"#$%#& ��'��()(*+�,-�.�
�'�(*+�,-�.��
�' � � 0 �̂�
�' � � 0 �̂�
� For example
o Suppose �' (*+�,-�. � 1/4
o 1 out 4 individuals observed, so ���� �!"#$%#& � 3
7
Example hospital admissions (1)
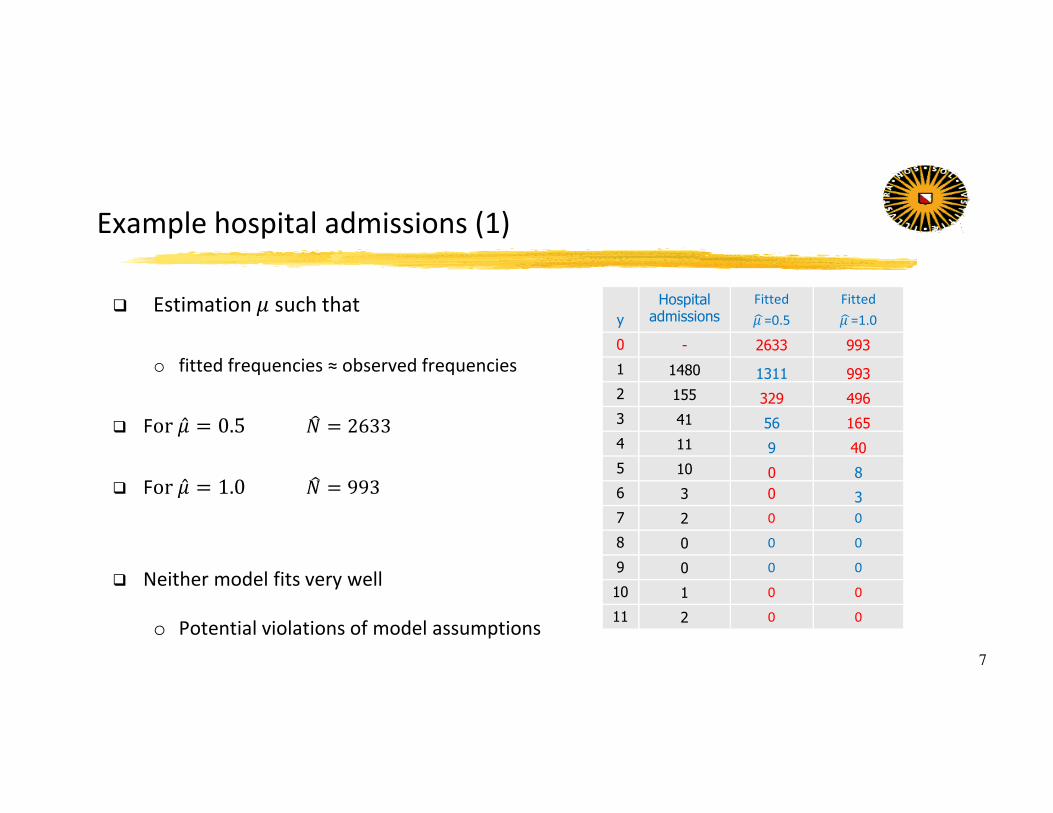
� Estimation � such that
o fitted frequencies ≈ observed frequencies
� For�̂ � 0.5�' � 2633
� For�̂ � 1.0�' � 993
� Neither model fits very well
o Potential violations of model assumptions
y
Hospital admissions
Fitted
� 6=0.5
Fitted
� 6=1.0
0 - 2633 993
1 1480 1311 993
2 155 329 496
3 41 56 165
4 11 9 40
5 10 0 8
6 3 0 3
7 2 0 0
8 0 0 0
9 0 0 0
10 1 0 0
11 2 0 0
8
Assumptions Poisson distribution
� Homogeneity
o Identical Poisson parameter for all � 1, . . , �
o If violated, underestimation population size
� Closed population
o Presence in population during entire observation period
o If violated, overestimation population size
9
Models for heterogeneity (1)
� Poisson regression model
o Each individual has its own Poisson parameter
�� � �7897:;<:97=;<=9...
o Insight in composition of population in terms of covariates
10
Models for heterogeneity (2)
� Negative binomial (regression) model
o Additional parameter allowing for more variation in counts (longer tail)
o Results in higher population size estimate
o Drawback: rarely estimable
11
Models for heterogeneity
� Zelterman (regression) model
o Estimation based on counts 1 and 2 only
o Rationale: use only counts closest to zero
o Population size estimate in between Poisson and negative binomial model
12
Model for open population (in progress)
� Recurrent events model
o Analysis of event history
o Requires additional data
� Example illegal immigrants (work in progress)
o Detention times
o Extradition
13
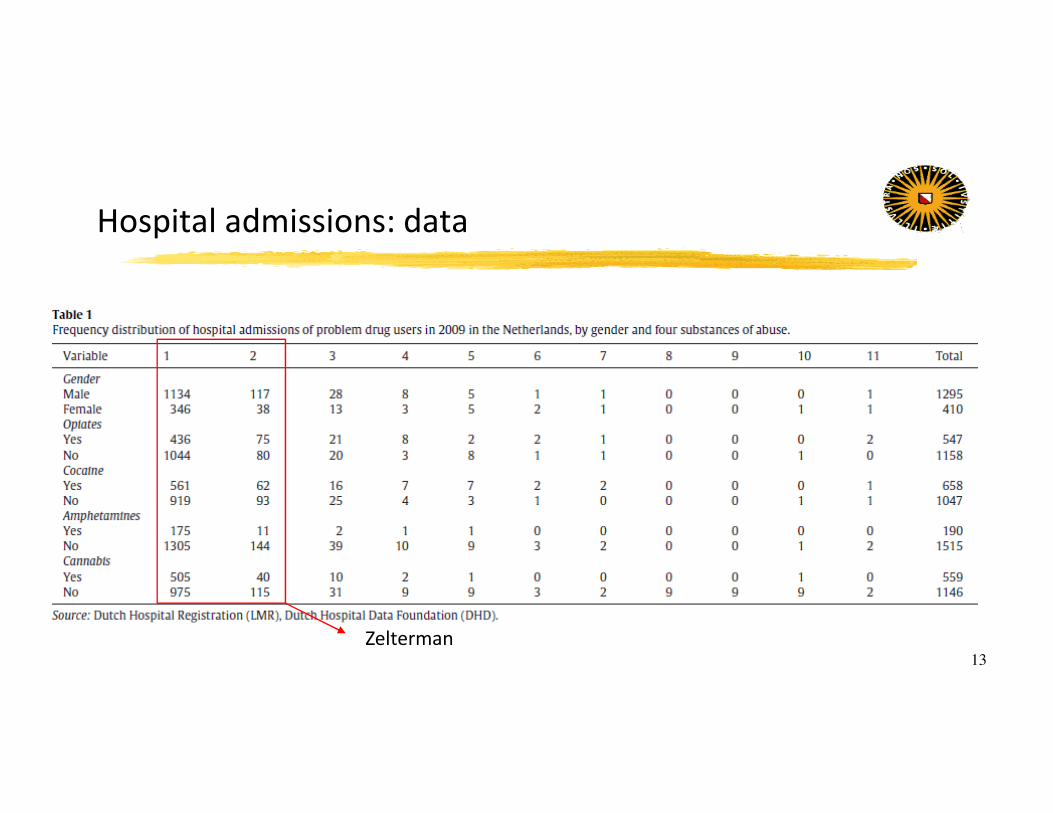
Hospital admissions: data
Zelterman

14
Parameter estimates
�> � 6695 �> � 10415
15
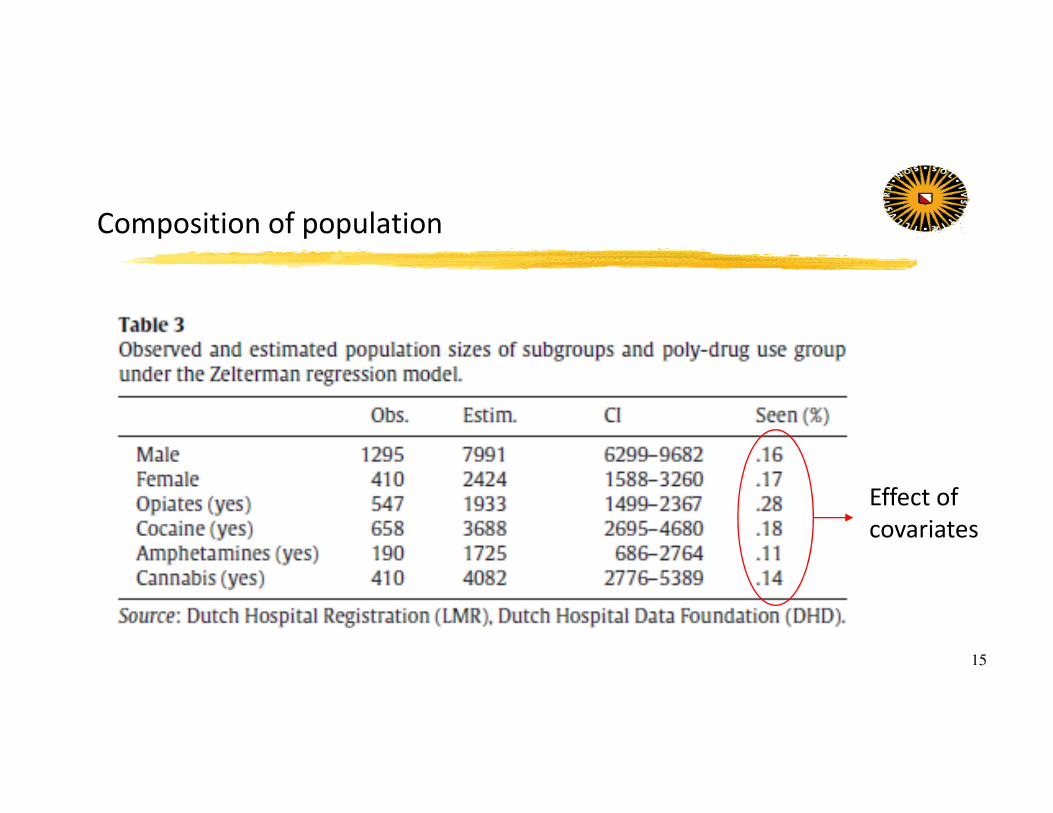
Composition of population
Effect of
covariates
16
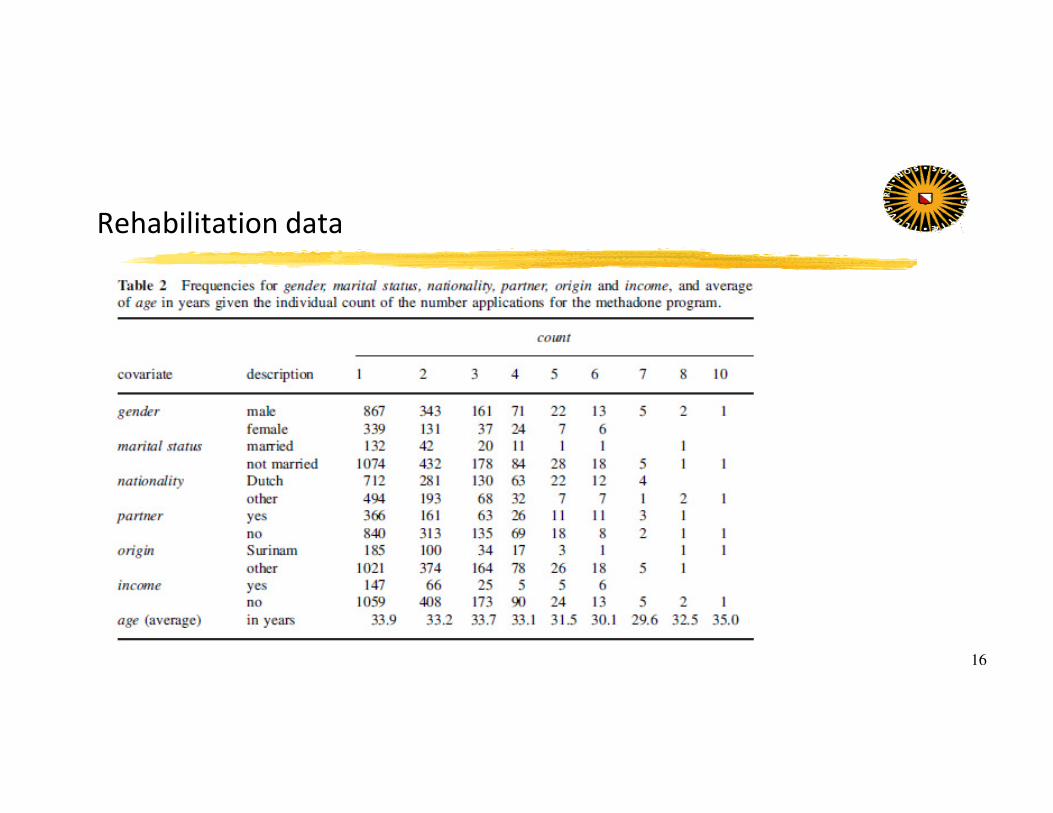
Rehabilitation data
17
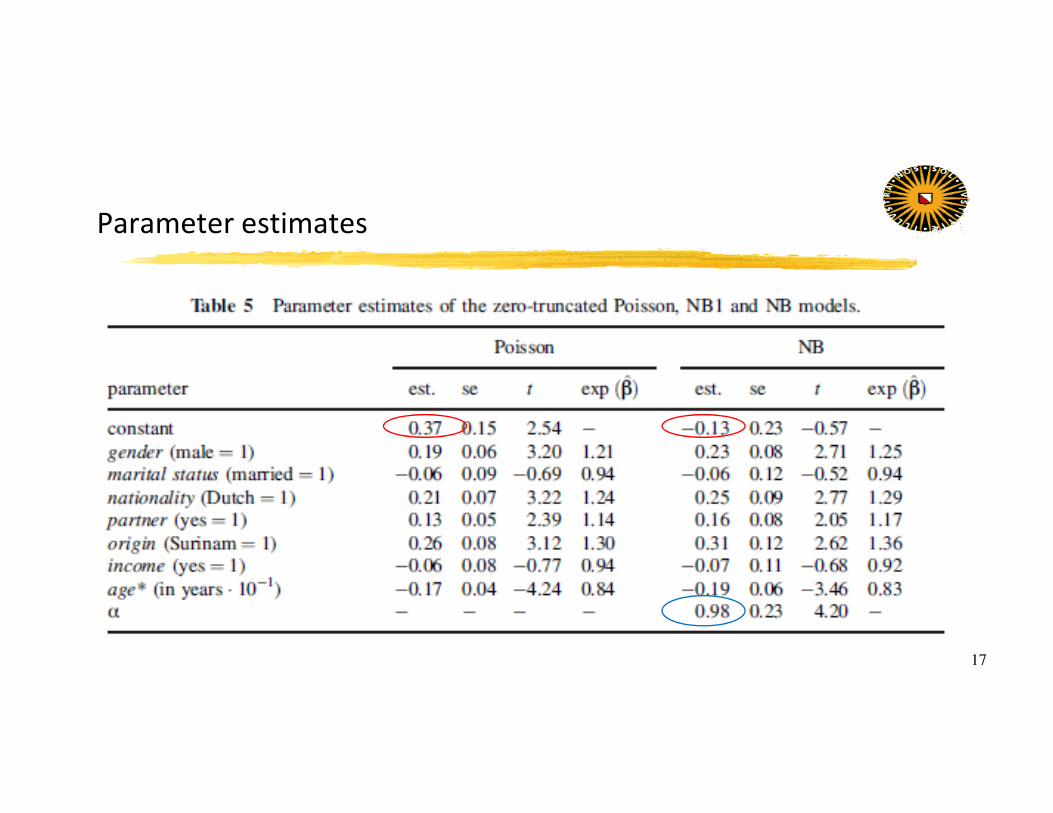
Parameter estimates
18
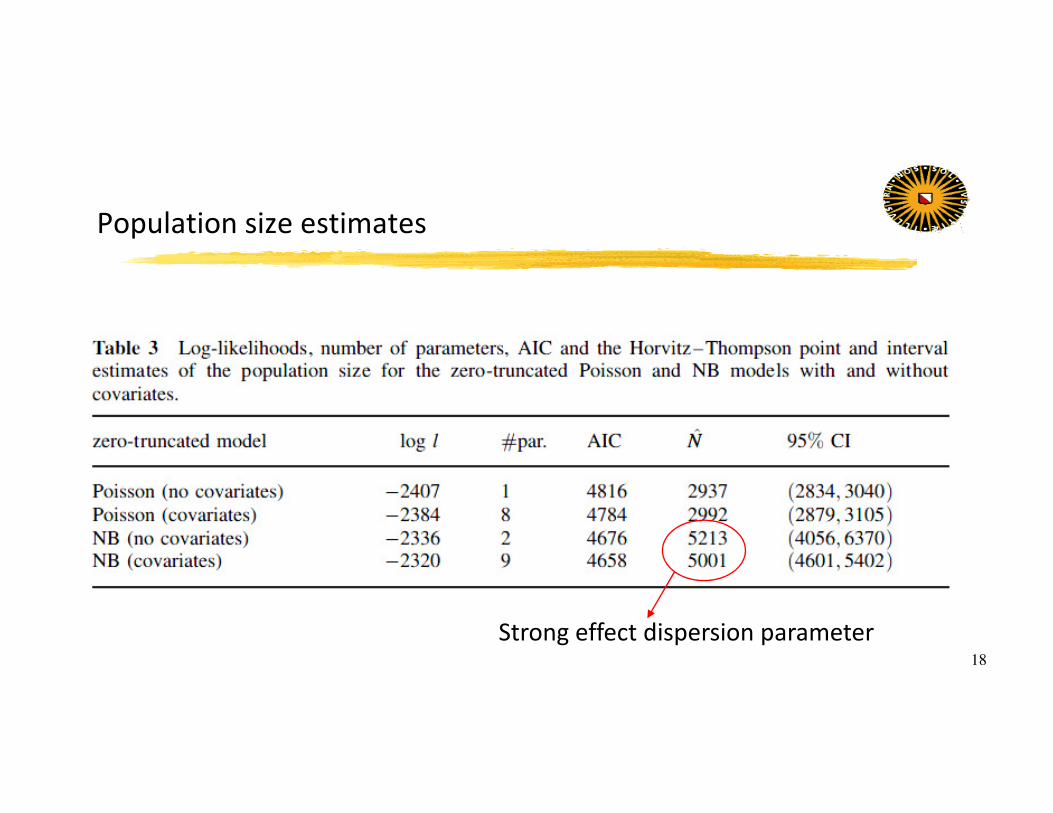
Population size estimates
Strong effect dispersion parameter
19
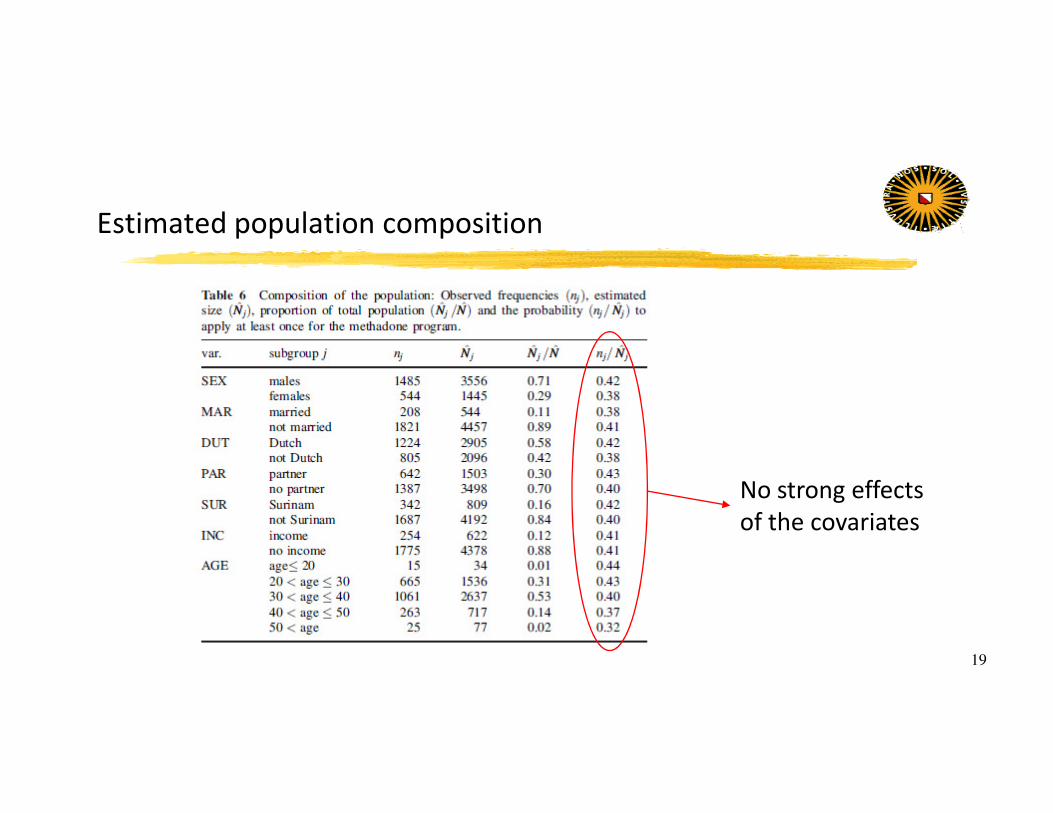
Estimated population composition
No strong effects
of the covariates
20
Software
� Truncated Poisson/negative binomial models
o R package GAMLSS (not straightforward)
o Simple r-code (next slides)
21
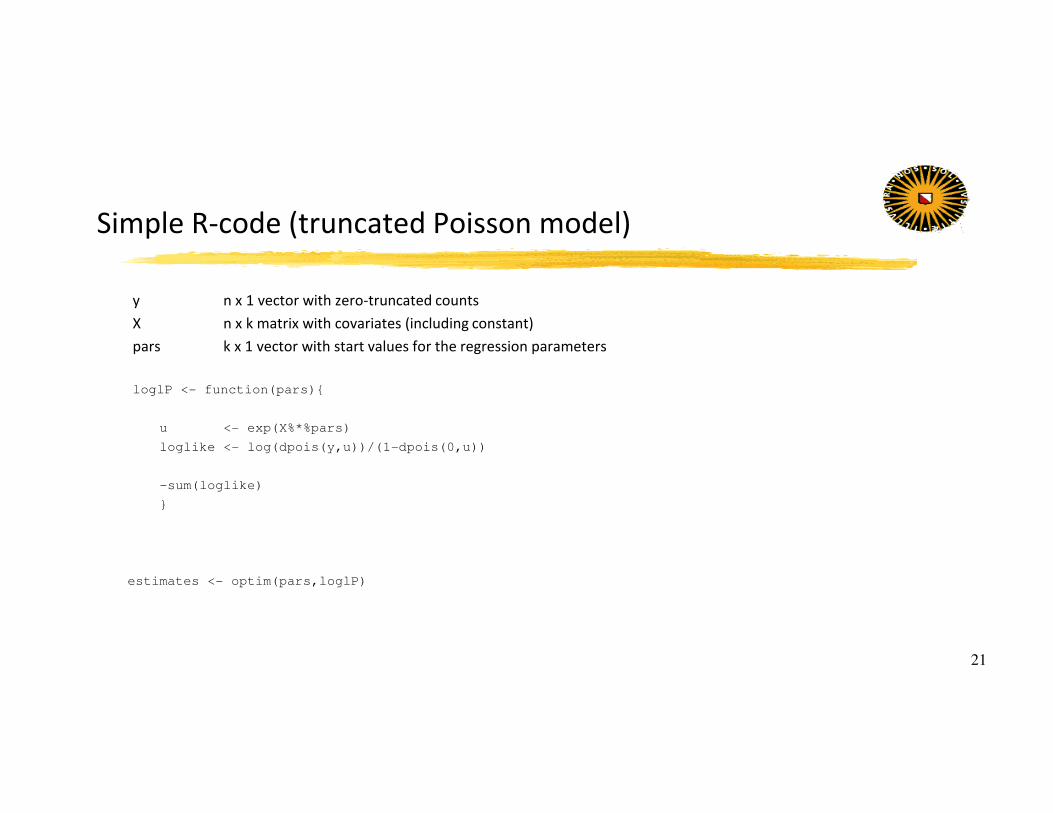
Simple R-code (truncated Poisson model)
y n x 1 vector with zero-truncated counts
X n x k matrix with covariates (including constant)
pars k x 1 vector with start values for the regression parameters
loglP <- function(pars){
u <- exp(X%*%pars)
loglike <- log(dpois(y,u))/(1-dpois(0,u))
-sum(loglike)
}
estimates <- optim(pars,loglP)
22
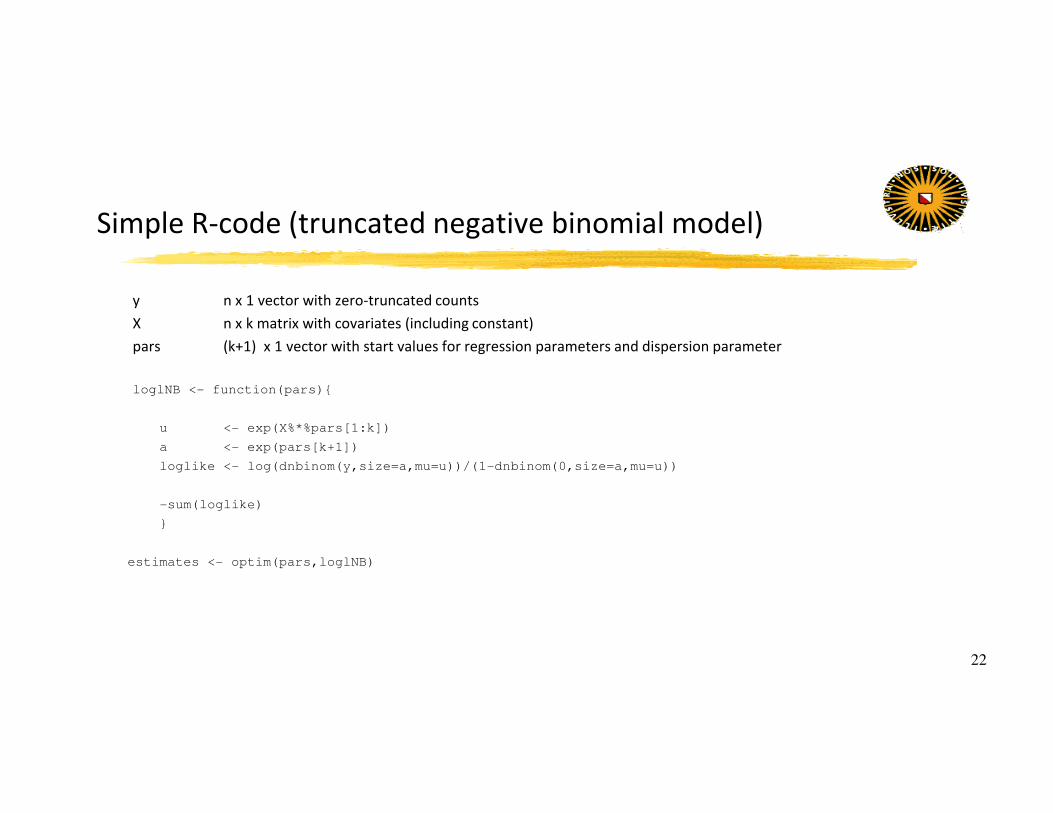
Simple R-code (truncated negative binomial model)
y n x 1 vector with zero-truncated counts
X n x k matrix with covariates (including constant)
pars (k+1) x 1 vector with start values for regression parameters and dispersion parameter
loglNB <- function(pars){
u <- exp(X%*%pars[1:k])
a <- exp(pars[k+1])
loglike <- log(dnbinom(y,size=a,mu=u))/(1-dnbinom(0,size=a,mu=u))
-sum(loglike)
}
estimates <- optim(pars,loglNB)
23
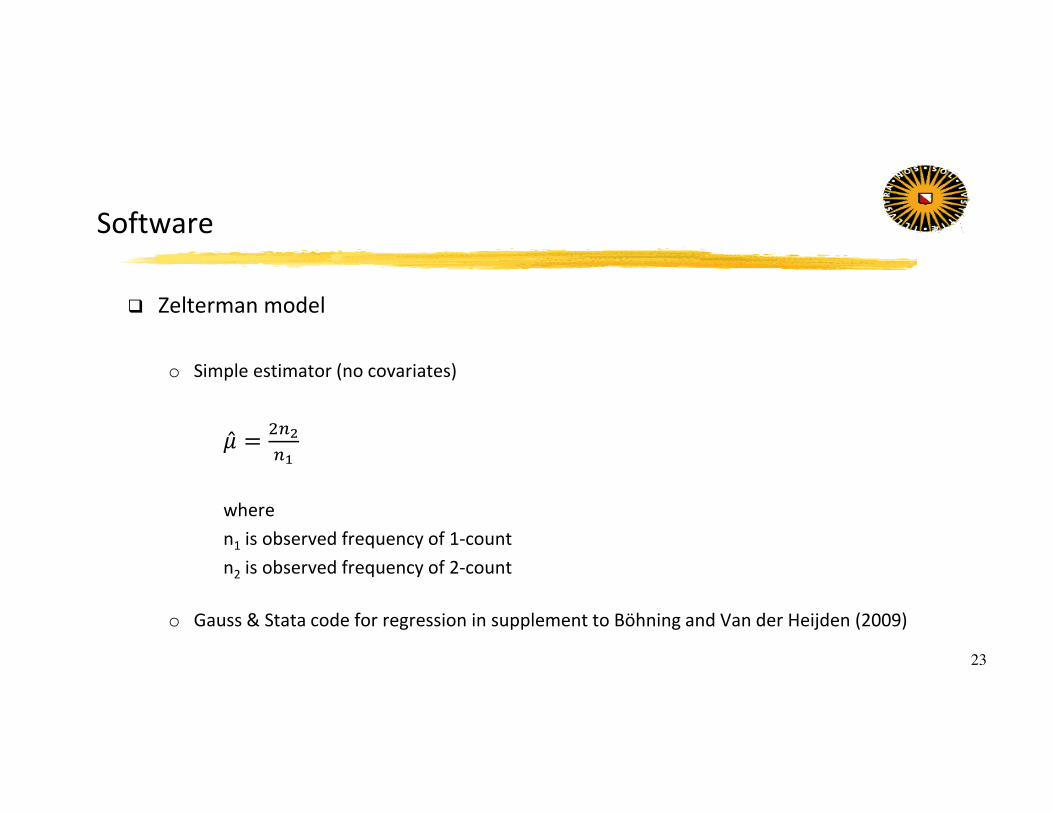
Software
� Zelterman model
o Simple estimator (no covariates)
�̂ �?�=
�:
where
n1 is observed frequency of 1-count
n2 is observed frequency of 2-count
o Gauss & Stata code for regression in supplement to Bӧhning and Van der Heijden (2009)
24
Conclusions
� One-source CRC well suited for PDU estimation
� Potential data sources
o Rehabilitation centers
o Hospital admissions
o Police records (drug-related offences)
� Software not straightforward, but possible
25
References
Boehning, D. And P.G.M. van der Heijden (2009). A Covariate Adjustment for Zero-truncated Approaches to Estimating the
Size of Hidden and Elusive Populations. Annals of Applied Statistics, 3, 595-610.
Cruyff, M.J.L.F. and P.G.M. van der Heijden. (2008). Point and interval estimation of the population size using a zero-
truncated negative binomial regression model. Biometrical Journal, 50 (6), 1035-1050.
Van der Heijden, P.G.M., Bustami, R., M. Cruyff, G. Engbersen and H. van Houwelingen (2003b). Point and interval
estimation of the truncated Poisson regression model. Statistical Modelling, 3, 305-322.
Van der Heijden, P.G.M., Cruts, G. and Cruyff, M. (in press) Methods for population size estimation of problem drug users
using a single registration. International Journal of Drug Policy,


![Estimating Deep Web Data Source Size by Capture-Recapture ... · Keywords Deep web, estimators, capture-recapture. 1 Introduction The deep web [5] is the web that is dynamically generated](https://static.fdocuments.net/doc/165x107/5f453c5cd82f9a26144f82e9/estimating-deep-web-data-source-size-by-capture-recapture-keywords-deep-web.jpg)