Molecular phylogenetics of the neotropical butterfly ... · 0.25 M EDTA and saturated NaCl...
10
Molecular phylogenetics of the neotropical butterfly subtribe Oleriina (Nymphalidae: Danainae: Ithomiini) Donna Lisa de-Silva a, * , Julia J. Day a , Marianne Elias b,c , Keith Willmott d , Alaine Whinnett a , James Mallet a a Department of Genetics, Evolution and Environment, University College London, Wolfson House, 4 Stephenson Way, London NW1 2HE, UK b Imperial College London, Silwood Park, Buckhurst Road, Ascot, Berkshire SL5 7PY, UK c CNRS, UMR 7205, Muséum National d’Histoire Naturelle, 45 Rue Buffon, CP50, 75005 Paris, France d McGuire Center for Lepidoptera, Florida Museum of Natural History, University of Florida, P.O. Box 112710, Gainesville, FL 32611-2710, USA article info Article history: Received 9 September 2009 Revised 22 December 2009 Accepted 9 January 2010 Available online 15 January 2010 Keywords: Lepidoptera Speciation Phylogeny Hybridization Geographic isolation Neotropics abstract The Oleriina is one of the most speciose subtribes of the neotropical nymphalid butterfly tribe Ithomiini. They are widely distributed across the Andes and Amazonian lowlands and like other ithomiines they are involved in complex mimicry rings. This subtribe is of particular interest because it contains the most diverse ithomiine genus, Oleria, as well as two genera, Megoleria and Hyposcada, that feed on hostplants not utilized elsewhere in the tribe. Here we present the first comprehensive species-level phylogeny for the Oleriina, representing 83% of recognised species in the group, and based on 6698 bp from eight mito- chondrial (mt) and nuclear (nc) genes. Topologies are largely congruent for ncDNA and the concatenated dataset and the genera Oleria, Hyposcada and Megoleria are recovered and well-supported, although strongly discordant genealogy between mtDNA and ncDNA suggest possible introgression among Hypos- cada and Megoleria. A fourth clade containing the type species of Ollantaya is consistently recovered, and this recently synonymized name is resurrected. Clear subdivisions within Oleria separate the genus into four species groups, onega, amalda, makrena and aegle, which also correspond to differing biogeographic and elevation range characteristics. Unlike other ithomiine genera, the Oleriina show homogeneity in mimetic wing pattern, in sharp con- trast to the emerging paradigm that mimetic shifts have enhanced diversification in the tribe. Our results show a potentially more important role for geographic isolation in the diversification of the Oleriina com- pared to other Ithomiini studied to date and provide a framework for more detailed biogeographical stud- ies, in addition to a rare opportunity for comparative analyses with other neotropical groups. Ó 2010 Elsevier Inc. All rights reserved. 1. Introduction The nymphalid butterfly tribe Ithomiini form a diverse and widespread neotropical group of approximately 370 species and over 1500 geographical races (Lamas, 2004; Willmott and Freitas, 2006). They are dominant members of complex mimicry rings that involve ithomiine, heliconiine, nymphaline and riodinid butterflies, notodontid day-flying moths and other insects (Beccaloni, 1997a). Adults of all Ithomiini use dehydropyrrolizidine alkaloids as defen- sive compounds, in the synthesis of pheromones to attract mates (Brown, 1987) and in the formation of aggregations of butterflies in ithomiine ‘pockets’ (Haber, 1978; Pinheiro et al., 2008). Most Ithomiini larvae feed on Solanaceae and the use of this family as a hostplant is seen as a key to the diversification of the butterfly group (Brown, 1987; Willmott and Freitas, 2006). Knowledge of their systematics, biology and distribution is rel- atively advanced and the tribe has provided excellent models in studies on mimicry (Beccaloni, 1997a,b; Joron et al., 2001; Will- mott and Mallet, 2004), biogeography (Elias et al., 2009), evolution (Whinnett et al., 2005a,b; Jiggins et al., 2006; Elias et al., 2007, 2008) and chemical ecology (Brown, 1987; Schultz et al., 2004). However, species-level molecular phylogenies have yet to be eluci- dated and currently only two out of 50 genera (Mallarino et al., 2005; Elias et al., 2009) have been completed. Ten Ithomiini subtribes (one unnamed) are currently recogni- sed based on morphological characteristics (Lamas, 2004; Willmott and Freitas, 2006) and molecular data (Brower et al., 2006). The subtribe Oleriina contains 63 species and is of particular interest because one of its three constituent genera, Oleria, is the most speciose ithomiine genus (52 species) (Lamas, 2004). In contrast, the other two genera are relatively depauperate, with nine species of Hyposcada (Willmott and Lamas, unpublished data) and two species of Megoleria (Willmott and Lamas, 2008) currently recogni- sed. The biogeography of this group is also of interest. Oleria and Hyposcada are both widely distributed, occurring from Mexico to Brazil at varying altitudes from sea level to 3000 m, with the for- mer genus diverse in both lowland and montane habitats. Con- 1055-7903/$ - see front matter Ó 2010 Elsevier Inc. All rights reserved. doi:10.1016/j.ympev.2010.01.010 * Corresponding author. Fax: +44 20 7679 5052. E-mail address: [email protected] (D.L. de-Silva). Molecular Phylogenetics and Evolution 55 (2010) 1032–1041 Contents lists available at ScienceDirect Molecular Phylogenetics and Evolution journal homepage: www.elsevier.com/locate/ympev
Transcript of Molecular phylogenetics of the neotropical butterfly ... · 0.25 M EDTA and saturated NaCl...
Molecular Phylogenetics and Evolution 55 (2010) 1032–1041
Contents lists available at ScienceDirect
Molecular Phylogenetics and Evolution
journal homepage: www.elsevier .com/locate /ympev
Molecular phylogenetics of the neotropical butterfly subtribe Oleriina(Nymphalidae: Danainae: Ithomiini)
Donna Lisa de-Silva a,*, Julia J. Day a, Marianne Elias b,c, Keith Willmott d, Alaine Whinnett a, James Mallet a
a Department of Genetics, Evolution and Environment, University College London, Wolfson House, 4 Stephenson Way, London NW1 2HE, UKb Imperial College London, Silwood Park, Buckhurst Road, Ascot, Berkshire SL5 7PY, UKc CNRS, UMR 7205, Muséum National d’Histoire Naturelle, 45 Rue Buffon, CP50, 75005 Paris, Franced McGuire Center for Lepidoptera, Florida Museum of Natural History, University of Florida, P.O. Box 112710, Gainesville, FL 32611-2710, USA
a r t i c l e i n f o
Article history:Received 9 September 2009Revised 22 December 2009Accepted 9 January 2010Available online 15 January 2010
Keywords:LepidopteraSpeciationPhylogenyHybridizationGeographic isolationNeotropics
1055-7903/$ - see front matter � 2010 Elsevier Inc. Adoi:10.1016/j.ympev.2010.01.010
* Corresponding author. Fax: +44 20 7679 5052.E-mail address: [email protected] (D.L. de-Silv
a b s t r a c t
The Oleriina is one of the most speciose subtribes of the neotropical nymphalid butterfly tribe Ithomiini.They are widely distributed across the Andes and Amazonian lowlands and like other ithomiines they areinvolved in complex mimicry rings. This subtribe is of particular interest because it contains the mostdiverse ithomiine genus, Oleria, as well as two genera, Megoleria and Hyposcada, that feed on hostplantsnot utilized elsewhere in the tribe. Here we present the first comprehensive species-level phylogeny forthe Oleriina, representing 83% of recognised species in the group, and based on 6698 bp from eight mito-chondrial (mt) and nuclear (nc) genes. Topologies are largely congruent for ncDNA and the concatenateddataset and the genera Oleria, Hyposcada and Megoleria are recovered and well-supported, althoughstrongly discordant genealogy between mtDNA and ncDNA suggest possible introgression among Hypos-cada and Megoleria. A fourth clade containing the type species of Ollantaya is consistently recovered, andthis recently synonymized name is resurrected. Clear subdivisions within Oleria separate the genus intofour species groups, onega, amalda, makrena and aegle, which also correspond to differing biogeographicand elevation range characteristics.
Unlike other ithomiine genera, the Oleriina show homogeneity in mimetic wing pattern, in sharp con-trast to the emerging paradigm that mimetic shifts have enhanced diversification in the tribe. Our resultsshow a potentially more important role for geographic isolation in the diversification of the Oleriina com-pared to other Ithomiini studied to date and provide a framework for more detailed biogeographical stud-ies, in addition to a rare opportunity for comparative analyses with other neotropical groups.
� 2010 Elsevier Inc. All rights reserved.
1. Introduction studies on mimicry (Beccaloni, 1997a,b; Joron et al., 2001; Will-
The nymphalid butterfly tribe Ithomiini form a diverse andwidespread neotropical group of approximately 370 species andover 1500 geographical races (Lamas, 2004; Willmott and Freitas,2006). They are dominant members of complex mimicry rings thatinvolve ithomiine, heliconiine, nymphaline and riodinid butterflies,notodontid day-flying moths and other insects (Beccaloni, 1997a).Adults of all Ithomiini use dehydropyrrolizidine alkaloids as defen-sive compounds, in the synthesis of pheromones to attract mates(Brown, 1987) and in the formation of aggregations of butterfliesin ithomiine ‘pockets’ (Haber, 1978; Pinheiro et al., 2008). MostIthomiini larvae feed on Solanaceae and the use of this family asa hostplant is seen as a key to the diversification of the butterflygroup (Brown, 1987; Willmott and Freitas, 2006).
Knowledge of their systematics, biology and distribution is rel-atively advanced and the tribe has provided excellent models in
ll rights reserved.
a).
mott and Mallet, 2004), biogeography (Elias et al., 2009), evolution(Whinnett et al., 2005a,b; Jiggins et al., 2006; Elias et al., 2007,2008) and chemical ecology (Brown, 1987; Schultz et al., 2004).However, species-level molecular phylogenies have yet to be eluci-dated and currently only two out of 50 genera (Mallarino et al.,2005; Elias et al., 2009) have been completed.
Ten Ithomiini subtribes (one unnamed) are currently recogni-sed based on morphological characteristics (Lamas, 2004; Willmottand Freitas, 2006) and molecular data (Brower et al., 2006). Thesubtribe Oleriina contains 63 species and is of particular interestbecause one of its three constituent genera, Oleria, is the mostspeciose ithomiine genus (52 species) (Lamas, 2004). In contrast,the other two genera are relatively depauperate, with nine speciesof Hyposcada (Willmott and Lamas, unpublished data) and twospecies of Megoleria (Willmott and Lamas, 2008) currently recogni-sed. The biogeography of this group is also of interest. Oleria andHyposcada are both widely distributed, occurring from Mexico toBrazil at varying altitudes from sea level to 3000 m, with the for-mer genus diverse in both lowland and montane habitats. Con-
D.L. de-Silva et al. / Molecular Phylogenetics and Evolution 55 (2010) 1032–1041 1033
versely, Megoleria is restricted to the high Andes of Colombia, Ecua-dor and Peru at altitudes ranging from 1200 to 2700 m.
Elucidating the systematics of the Ithomiini has proved particu-larly problematic because of their involvement in complex mim-icry rings and geographical polymorphism. Additionally,association of the sexes in Oleria is sometimes complicated by sex-ual dimorphism in mimicry pattern (Willmott and Mallet, 2004).
Fox (1956) first proposed the subtribe Oleriina (then considereda tribe called Oleriini) including Hyposcada, Oleria, Aeria and anundescribed genus, but Harvey (1991) revised the constituent gen-era to include Hyposcada, Oleria and two new undescribed generalater named Ollantaya (Brown and Freitas, 1994) and Megoleria(Constantino, 1999). The genus Ollantaya was synonymized withthe Oleria (Lamas, 2004), although recent morphological work sug-gests Ollantaya should be resurrected to include O. canilla, O. aegin-eta, H. olerioides and a fourth undescribed species from thePeruvian Andes (Willmott and Freitas, 2006).
Recent higher-level systematics of the Ithomiini using morpho-logical characters confirmed Oleriina as monophyletic and sister tothe Napeogenina and Ithomiina (Brown and Freitas, 1994; Will-mott and Freitas, 2006). The monophyly of this group is corrobo-rated from molecular data (Brower et al., 2006), based on2335 bp of the mitochondrial (mtDNA) cytochrome oxidase subunitsI and II (COI–COII) and the nuclear (ncDNA) genes, wingless andelongation factor 1-alpha (EF-1a). These data provide conflictingsignal regarding the relationships of Megoleria to other oleriines,with morphological characters suggesting that Megoleria is sisterto Hyposcada (Willmott and Freitas, 2006), while molecular dataplace Megoleria as sister to all other Oleriina (Brower et al.,2006). With the exception of Megoleria, there are few clear mor-phological synapomorphies supporting the remaining genera, andmolecular data thus offer a promising solution to resolve relation-ships within this group.
The first molecular phylogenetic study of the Oleriina included41 species (103 samples) based on 1619 bp of the mtDNA COI–COIIand the ncDNA genes, wingless and EF-1a (Whinnett, 2005), andrecovered the four genera, Oleria, Hyposcada, Megoleria and Ollanta-ya. Analyses using neighbour-joining (NJ) and maximum parsi-mony (MP) recovered Hyposcada as sister to all other Oleriina(Whinnett, 2005), whereas Bayesian inference (BI) of the concate-nated data identified Megoleria as sister to all other Oleriina as inBrower et al. (2006).
Here we present one of the first comprehensive molecular phy-logenetic analyses for any diverse butterfly tribe. Our sampling in-cludes 52 of the 63 known Oleriina species, based on six generegions comprising three mtDNA and five ncDNA genes for multi-ple individuals from the whole of the Oleriina subtribe. Our phylo-genetic hypotheses allow revision of the generic classification ofthe tribe as a basis for generic revisions currently in preparation.In addition, this study forms part of a collaborative effort to gener-ate species-level molecular phylogenetic hypotheses for the wholeof the Ithomiini (Mallarino et al., 2005; Elias et al., 2009). As a re-sult, we are also able to further assess the general importance ofbiogeographic processes identified as critical in the evolution ofthe few other tropical Andean butterfly genera studied to date(e.g., Willmott et al., 2001; Hall, 2005; Jiggins et al., 2006; Eliaset al., 2009).
2. Materials and methods
2.1. Taxon sampling
A total of 52 Oleriina species (Lamas, 2004; Willmott and La-mas, 2008), represented by 228 specimens were included in ourphylogenetic analyses. This includes 43 of the 52 known species
of Oleria, seven of nine species of Hyposcada and both species ofMegoleria. At least three samples of each species were sequencedwhere available. In order to maximize geographical coverage ofeach species and to test species validity as many subspecies as pos-sible were included: 87 of the 262 known Oleriina subspeciesincluding 64 of 188 subspecies of Oleria, 21 of 68 subspecies ofHyposcada and two of six subspecies of Megoleria. We were unableto obtain samples of 11 rare and/or geographically restricted spe-cies, including four undescribed species of Oleria, O. flora, O. simil-igena, O. synnova, O. thiemei, O. zea, H. attilodes and H. dujardini.
We used sequences of Ithomia salapia and Napeogenes pharo,and the more distantly related Mechanitis mazeus and Pseudoscadatimna, as outgroups (Brower et al., 2006). All outgroup sequencesfor the ncDNA genes, Ef1a and Wg and the mtDNA sequence forMechanitis mazeus were taken from Genbank. Samples are listedin Table S1 (Supplementary material).
2.2. Molecular methods
Samples were typically stored in 20% dimethylsulphoxide,0.25 M EDTA and saturated NaCl solution. Wings were removedand preserved as vouchers and are held in the Mallet Lab Collec-tions at University College London. Donated samples were driedor stored in alcohol. DNA was extracted from one third of the tho-rax or from legs of donated samples using Qiagen’s DNeasy Blood &Tissue Kit or Qiagen’s QIAamp DNA Micro Kit for small samples.The manufacturer’s protocol was followed with a minimum 3-hincubation period at 56 �C and a final elution volume of 200 ll or50 ll to concentrate DNA extracted from museum specimens.
Genes selected for sequencing are widely used across phyloge-netic studies of Lepidoptera and were selected to allow comparisonand use in further studies. As such, we amplified and sequencedeight gene regions: the mtDNA genes COI, leucine tRNA and COIIand the autosomal genes Wingless (Wg), Elongation factor 1-alpha(Ef1a), Tektin, Ribosomal Protein L5 (RpL5) and the sex-linked gene,Triose phosphate isomerase (Tpi) (Table 1). We used published prim-ers and modified these where a significant number of specimensfailed to amplify (Table S2). PCR primers used for gene amplifica-tion were also used for sequencing. PCR amplification conditionsare given in Table S2. Cycle sequencing products were purifiedand sequenced on an Applied Biosystems 3730xl DNA Analyserusing the manufacturer’s instructions.
The resulting chromatograms were edited using ChromasProv1.33 (Technelysium Pty Ltd.) and aligned in the program BioEdit(Hall, 1999) using ClustalW (Thompson et al., 1994). Heterozygousbase calls were coded using IUPAC ambiguity codes. Variablelength indels were found in RpL5 and Tpi. These regions werealigned by eye and inferred gaps were coded as missing data.
2.3. Phylogenetic analyses
Data were analysed using maximum parsimony (MP), maxi-mum likelihood (ML) and Bayesian inference (BI) for the individualmtDNA and ncDNA datasets as well as for the entire, concatenateddataset of 6698 bp totalling 232 taxa including four outgroups.
MP analyses were performed using TNT (Goloboff, 1999) usingthe New Technology search algorithm, implementing tree-fusing,tree-drifting, ratchet and sectorial searches. Bootstrap support(BS) was evaluated with 1000 replicates and 100 random taxonadditions. Traditional MP searches were also performed using aheuristic search with multiple random addition sequences and treebisection reconnection branch swapping. All characters wereequally weighted. Multiple equally most parsimonious trees weresummarised by a strict consensus tree in the program WinClada(Nixon, 1999). WinClada was also used to calculate the consistencyindex (CI) and retention index (RI).
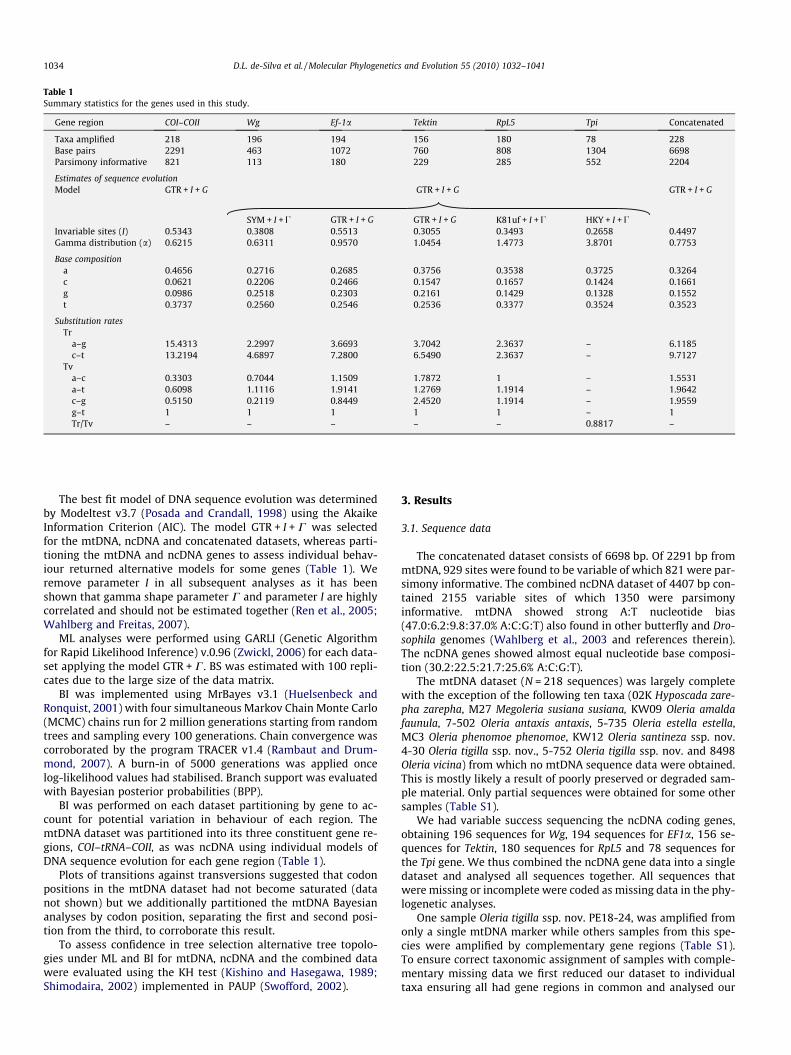
Table 1Summary statistics for the genes used in this study.
Gene region COI–COII Wg Ef-1a Tektin RpL5 Tpi Concatenated
Taxa amplified 218 196 194 156 180 78 228Base pairs 2291 463 1072 760 808 1304 6698Parsimony informative 821 113 180 229 285 552 2204
Estimates of sequence evolutionModel GTR + I + G GTR + I + G GTR + I + G
SYM + I + U GTR + I + G GTR + I + G K81uf + I + U HKY + I + UInvariable sites (I) 0.5343 0.3808 0.5513 0.3055 0.3493 0.2658 0.4497Gamma distribution (a) 0.6215 0.6311 0.9570 1.0454 1.4773 3.8701 0.7753
Base compositiona 0.4656 0.2716 0.2685 0.3756 0.3538 0.3725 0.3264c 0.0621 0.2206 0.2466 0.1547 0.1657 0.1424 0.1661g 0.0986 0.2518 0.2303 0.2161 0.1429 0.1328 0.1552t 0.3737 0.2560 0.2546 0.2536 0.3377 0.3524 0.3523
Substitution ratesTr
a–g 15.4313 2.2997 3.6693 3.7042 2.3637 – 6.1185c–t 13.2194 4.6897 7.2800 6.5490 2.3637 – 9.7127
Tva–c 0.3303 0.7044 1.1509 1.7872 1 – 1.5531a–t 0.6098 1.1116 1.9141 1.2769 1.1914 – 1.9642c–g 0.5150 0.2119 0.8449 2.4520 1.1914 – 1.9559g–t 1 1 1 1 1 – 1Tr/Tv – – – – – 0.8817 –
1034 D.L. de-Silva et al. / Molecular Phylogenetics and Evolution 55 (2010) 1032–1041
The best fit model of DNA sequence evolution was determinedby Modeltest v3.7 (Posada and Crandall, 1998) using the AkaikeInformation Criterion (AIC). The model GTR + I + C was selectedfor the mtDNA, ncDNA and concatenated datasets, whereas parti-tioning the mtDNA and ncDNA genes to assess individual behav-iour returned alternative models for some genes (Table 1). Weremove parameter I in all subsequent analyses as it has beenshown that gamma shape parameter C and parameter I are highlycorrelated and should not be estimated together (Ren et al., 2005;Wahlberg and Freitas, 2007).
ML analyses were performed using GARLI (Genetic Algorithmfor Rapid Likelihood Inference) v.0.96 (Zwickl, 2006) for each data-set applying the model GTR + C. BS was estimated with 100 repli-cates due to the large size of the data matrix.
BI was implemented using MrBayes v3.1 (Huelsenbeck andRonquist, 2001) with four simultaneous Markov Chain Monte Carlo(MCMC) chains run for 2 million generations starting from randomtrees and sampling every 100 generations. Chain convergence wascorroborated by the program TRACER v1.4 (Rambaut and Drum-mond, 2007). A burn-in of 5000 generations was applied oncelog-likelihood values had stabilised. Branch support was evaluatedwith Bayesian posterior probabilities (BPP).
BI was performed on each dataset partitioning by gene to ac-count for potential variation in behaviour of each region. ThemtDNA dataset was partitioned into its three constituent gene re-gions, COI–tRNA–COII, as was ncDNA using individual models ofDNA sequence evolution for each gene region (Table 1).
Plots of transitions against transversions suggested that codonpositions in the mtDNA dataset had not become saturated (datanot shown) but we additionally partitioned the mtDNA Bayesiananalyses by codon position, separating the first and second posi-tion from the third, to corroborate this result.
To assess confidence in tree selection alternative tree topolo-gies under ML and BI for mtDNA, ncDNA and the combined datawere evaluated using the KH test (Kishino and Hasegawa, 1989;Shimodaira, 2002) implemented in PAUP (Swofford, 2002).
3. Results
3.1. Sequence data
The concatenated dataset consists of 6698 bp. Of 2291 bp frommtDNA, 929 sites were found to be variable of which 821 were par-simony informative. The combined ncDNA dataset of 4407 bp con-tained 2155 variable sites of which 1350 were parsimonyinformative. mtDNA showed strong A:T nucleotide bias(47.0:6.2:9.8:37.0% A:C:G:T) also found in other butterfly and Dro-sophila genomes (Wahlberg et al., 2003 and references therein).The ncDNA genes showed almost equal nucleotide base composi-tion (30.2:22.5:21.7:25.6% A:C:G:T).
The mtDNA dataset (N = 218 sequences) was largely completewith the exception of the following ten taxa (02K Hyposcada zare-pha zarepha, M27 Megoleria susiana susiana, KW09 Oleria amaldafaunula, 7-502 Oleria antaxis antaxis, 5-735 Oleria estella estella,MC3 Oleria phenomoe phenomoe, KW12 Oleria santineza ssp. nov.4-30 Oleria tigilla ssp. nov., 5-752 Oleria tigilla ssp. nov. and 8498Oleria vicina) from which no mtDNA sequence data were obtained.This is mostly likely a result of poorly preserved or degraded sam-ple material. Only partial sequences were obtained for some othersamples (Table S1).
We had variable success sequencing the ncDNA coding genes,obtaining 196 sequences for Wg, 194 sequences for EF1a, 156 se-quences for Tektin, 180 sequences for RpL5 and 78 sequences forthe Tpi gene. We thus combined the ncDNA gene data into a singledataset and analysed all sequences together. All sequences thatwere missing or incomplete were coded as missing data in the phy-logenetic analyses.
One sample Oleria tigilla ssp. nov. PE18-24, was amplified fromonly a single mtDNA marker while others samples from this spe-cies were amplified by complementary gene regions (Table S1).To ensure correct taxonomic assignment of samples with comple-mentary missing data we first reduced our dataset to individualtaxa ensuring all had gene regions in common and analysed our
D.L. de-Silva et al. / Molecular Phylogenetics and Evolution 55 (2010) 1032–1041 1035
data using BI (data not shown). We compared mtDNA and ncDNAanalyses using all samples to the reduced dataset ensuring thatsamples clustered according to the reduced species tree. Addition-ally we ensured that Oleria tigilla formed a species clade with addi-tional samples in alternative mtDNA and ncDNA trees (Figs. S1–S4,S6 and S7) before including all Oleria tigilla samples in the com-bined dataset and analysing them together.
3.2. Phylogenetic analyses
The monophyly of the Oleriina is recovered with maximumsupport across all analyses (Fig. 1 and Figs. S1–S8). Constituentgenera, Oleria, Megoleria and Hyposcada and a clade containingthe Ollantaya species are recovered under BI and ML analyses byncDNA (Figs. S3 and S4) and the concatenated dataset (Fig. 1 andFig. S5). Support for these clades is strong under ncDNA (>94BPP, BS) but, with the exception of Ollantaya (100 BPP, 87 BS), rel-atively weak under the concatenated data. Resulting phylogenetichypotheses were found to be largely congruent from BI and MLanalyses. Partitioning of the mtDNA third codon position underBI had very little effect on tree topology. MP did not recover thesame level of resolution as BI and ML methods of phylogeneticinference (Figs. S6–S8). MP analyses of the concatenated datafound 24 most parsimonious trees supporting the genera Ollantaya(93 BS), Hyposcada (84 BS) and Megoleria (100 BS) but not Oleria;hence rendering the backbone of the resulting consensus largelyunresolved (Fig. S8). As such, we mainly discuss results from BIand ML analyses.
While phylogenetic hypotheses generated for the concatenated,mtDNA and ncDNA datasets are for the most part congruent (Fig. 1and Figs. S1–S5), there are areas of conflict between the mtDNAand ncDNA data. The ncDNA and concatenated datasets both re-cover similar results with each genus recovered as monophyletic.The concatenated and ncDNA datasets recover Hyposcada as sisterto a clade consisting of Megoleria, Ollantaya and Oleria. Support forthese relationships is good for the ncDNA data (>94 BPP and BS),but less so for the concatenated data. However, analyses of mtDNArender Hyposcada and Ollantaya paraphyletic, although support forthis hypothesis is weaker than that obtained by ncDNA. Furtherincongruence is found between ncDNA and mtDNA data as thephylogenetic hypothesis from the mtDNA alternatively embedsMegoleria within a clade containing Hyposcada taliata. Results foreach genus are discussed further in the following sections.
Comparison of alternative ML and BI trees for the mtDNA,ncDNA and concatenated data using the KH test recovered themtDNA and ncDNA trees as a significantly worse fit (Table 2). Assuch we represent the phylogenetic hypothesis of the BI consensusbased on the concatenated dataset (Fig. 1).
3.3. Oleria
A monophyletic Oleria is recovered with high support for BI ofmtDNA (Fig. S1) and BI and ML of ncDNA (Figs. S3 and S4), whereassupport is considerably weaker for ML of mtDNA (Fig. S2) and theconcatenated data (Fig. 1 and Fig. S5). Within this genus four spe-cies groups, makrena, amalda, onega and aegle, are recovered fromthe concatenated and ncDNA data under BI and ML analyses (Fig. 1and Figs. S3–S5), but mtDNA renders the amalda group non-mono-phyletic (Figs. S1 and S2). Support for these relationships is goodfor all datasets. The amalda group aside, support is generally stron-ger from the different partitions (BI > 72 BPP), than the concate-nated data.
Relationships between the species groups are generally notwell-supported under ML and the concatenated data (Figs. S2, S4and S5 and Fig. 1), although the clade onega and the clade unitingmakrena and amalda is consistently recovered across all datasets
and analyses (Figs. S1–S5). The position of aegle is unstable as thismonotypic taxon is alternatively recovered as sister to onega inncDNA (Figs. S3 and S4) and concatenated analyses, but is sisterto the clade (makrena, amalda) from mtDNA data (Figs. S1 and S2).
3.3.1. aegle species groupBI of mtDNA recovers the aegle group as sister to the amalda and
makrena species groups (81 BPP) (Fig. S1), whereas its position inthe ML and MP analyses is unresolved relative to the rest of theOleria (Figs. S2 and S6). Conversely, ncDNA recovers O. aegle as sis-ter to the onega group (94 BPP, ML 77 BS) as does the combinedncDNA and mtDNA data but with less support (Figs. S3–S5 andFig. 1).
3.3.2. onega species groupThe onega species group is recovered with high support when
datasets are analysed separately (BI 100 BPP; ML > 87 BS;MP > 82 BS) (Figs. S1–S4, S6 and S7), and while consistently recov-ered with the combined data, support is weaker (Fig. 1 and Figs. S5and S8). All internal relationships within the onega group are alsohighly congruent and well-supported across mtDNA analyses, withthe exception of the clade containing O. ilerdina, O. didymaea and O.onega subspecies, which is weakly supported under BI (Fig. S1) andunresolved under ML and MP (Figs. S2 and S6). This is also the caseunder ML of ncDNA where relationships between the aforemen-tioned species and O. astrea, O. quintina and O. alexina are unre-solved (Fig. S4).
3.3.3. amalda species groupThe amalda group is recovered as sister to the high-elevation
Andean makrena clade with good support under ncDNA and com-bined analyses (Fig. 1 and Figs. S3–S5). The resulting hypothesessplit the amalda group into two constituent clades, the first com-posed of O. zelica, O. rubescens and O. amalda and the second com-posed of O. estella, O. gunilla and O. sp. nov. 1. However, mtDNAdoes not support a monophyletic amalda, with the latter constitu-ent clade sister to the former (100 BPP) (Fig. S1). Relationships be-tween these clades are unclear from ML and MP analyses (Figs. S2and S6).
3.3.4. makrena species groupThis species group is recovered in all analyses and is relatively
well-supported. Interestingly, while there is good support for anumber of clades within the makrena group, in which topologiesare reasonably well resolved, branches deeper in this clade are veryshort and unsurprisingly those deeper nodes are largely unre-solved. The positions of O. deronda valida and O. derondina ssp.nov. are largely unresolved under all analyses, presumably becausethese taxa are represented by single museum specimens, fromwhich only COI could be sequenced.
BI of the combined dataset recovers the clade (O. bioculata, (O.attalia, O. cyrene)) as sister to ((O. tremona (O.tremona, O.makrena))(O. makrena, O. padilla)) (100% BPP) (Fig. 1). mtDNA strongly sup-ports this clade but O. bioculata is recovered as sister to the remain-ing clades (100 BPP) (Fig. S1). BI of ncDNA recovers theserelationships with the exception of O. attalia whose subspeciesare separated and presented as sisters (72 BPP) (Fig. S3).
The positions of O. boyeri and O. quadrata quadrata are unstable.BI of mtDNA places O. boyeri as sister to O. victorine (BPP > 74)(Fig. S1) and as sister to the rest of the makrena group (BPP 72)with ncDNA (Fig. S3). O. quadrata quadrata is recovered as sisterto an internal clade containing O. bioculata, O. cyrene, O. attalia, O.tremona, O. makrena and O. padilla in BI of mtDNA and ncDNA(Figs. S1 and S3), but the combined data place it as sister to O. vici-na (Fig. 1). The positions of both taxa are unresolved under ML andMP (Figs. S2, S4, S6 and S7).
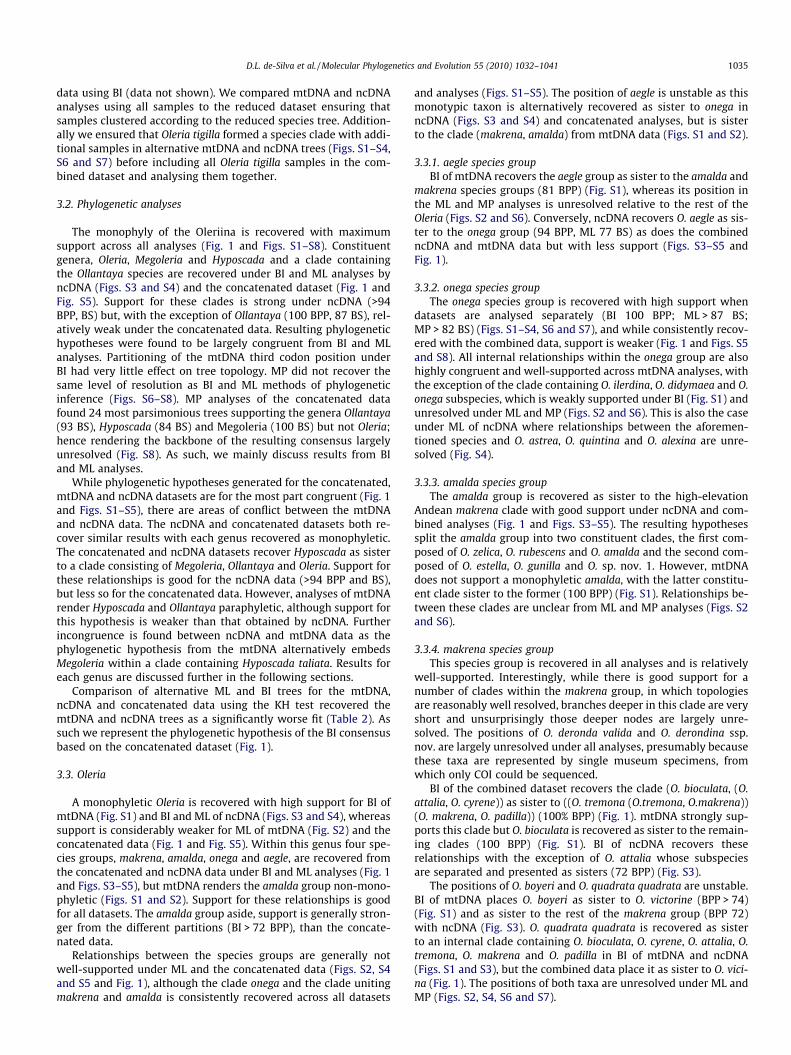
Fig. 1. Bayesian consensus tree of concatenated data with branch lengths proportional to the number of changes. The combined dataset consists of 228 taxa and 6698nucleotides. d indicates nodes with 100% BPP; s indicates nodes with >95% BPP; h indicates nodes with >75% BPP; w indicates nodes with >55% BPP.
1036 D.L. de-Silva et al. / Molecular Phylogenetics and Evolution 55 (2010) 1032–1041
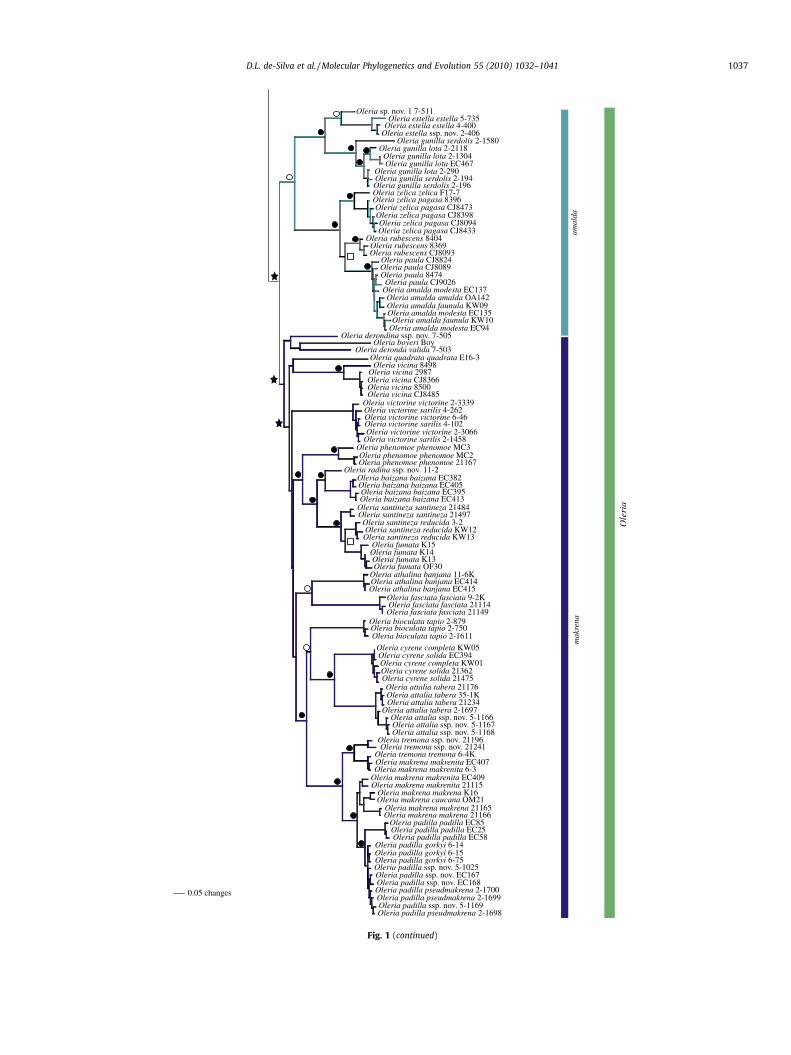
Fig. 1 (continued)
D.L. de-Silva et al. / Molecular Phylogenetics and Evolution 55 (2010) 1032–1041 1037
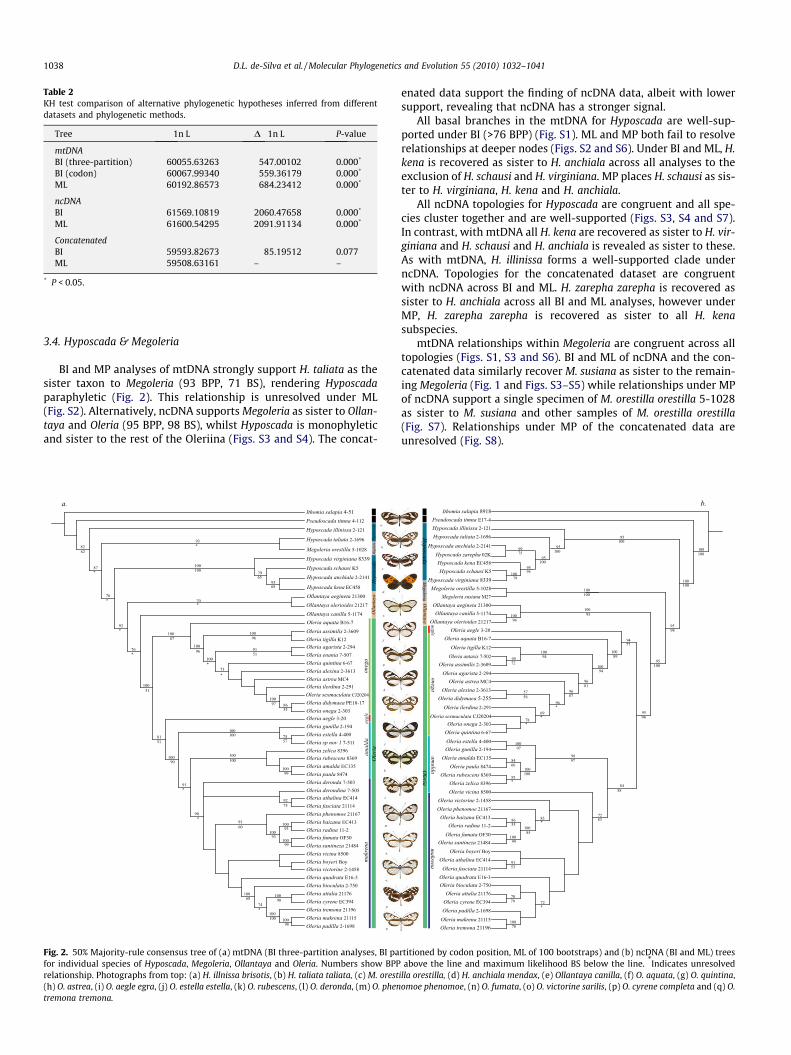
Table 2KH test comparison of alternative phylogenetic hypotheses inferred from differentdatasets and phylogenetic methods.
Tree �1n L D�1n L P-value
mtDNABI (three-partition) 60055.63263 547.00102 0.000*
BI (codon) 60067.99340 559.36179 0.000*
ML 60192.86573 684.23412 0.000*
ncDNABI 61569.10819 2060.47658 0.000*
ML 61600.54295 2091.91134 0.000*
ConcatenatedBI 59593.82673 85.19512 0.077ML 59508.63161 – –
* P < 0.05.
1038 D.L. de-Silva et al. / Molecular Phylogenetics and Evolution 55 (2010) 1032–1041
3.4. Hyposcada & Megoleria
BI and MP analyses of mtDNA strongly support H. taliata as thesister taxon to Megoleria (93 BPP, 71 BS), rendering Hyposcadaparaphyletic (Fig. 2). This relationship is unresolved under ML(Fig. S2). Alternatively, ncDNA supports Megoleria as sister to Ollan-taya and Oleria (95 BPP, 98 BS), whilst Hyposcada is monophyleticand sister to the rest of the Oleriina (Figs. S3 and S4). The concat-
Fig. 2. 50% Majority-rule consensus tree of (a) mtDNA (BI three-partition analyses, BI pafor individual species of Hyposcada, Megoleria, Ollantaya and Oleria. Numbers show BPPrelationship. Photographs from top: (a) H. illnissa brisotis, (b) H. taliata taliata, (c) M. orest(h) O. astrea, (i) O. aegle egra, (j) O. estella estella, (k) O. rubescens, (l) O. deronda, (m) O. phentremona tremona.
enated data support the finding of ncDNA data, albeit with lowersupport, revealing that ncDNA has a stronger signal.
All basal branches in the mtDNA for Hyposcada are well-sup-ported under BI (>76 BPP) (Fig. S1). ML and MP both fail to resolverelationships at deeper nodes (Figs. S2 and S6). Under BI and ML, H.kena is recovered as sister to H. anchiala across all analyses to theexclusion of H. schausi and H. virginiana. MP places H. schausi as sis-ter to H. virginiana, H. kena and H. anchiala.
All ncDNA topologies for Hyposcada are congruent and all spe-cies cluster together and are well-supported (Figs. S3, S4 and S7).In contrast, with mtDNA all H. kena are recovered as sister to H. vir-giniana and H. schausi and H. anchiala is revealed as sister to these.As with mtDNA, H. illinissa forms a well-supported clade underncDNA. Topologies for the concatenated dataset are congruentwith ncDNA across BI and ML. H. zarepha zarepha is recovered assister to H. anchiala across all BI and ML analyses, however underMP, H. zarepha zarepha is recovered as sister to all H. kenasubspecies.
mtDNA relationships within Megoleria are congruent across alltopologies (Figs. S1, S3 and S6). BI and ML of ncDNA and the con-catenated data similarly recover M. susiana as sister to the remain-ing Megoleria (Fig. 1 and Figs. S3–S5) while relationships under MPof ncDNA support a single specimen of M. orestilla orestilla 5-1028as sister to M. susiana and other samples of M. orestilla orestilla(Fig. S7). Relationships under MP of the concatenated data areunresolved (Fig. S8).
rtitioned by codon position, ML of 100 bootstraps) and (b) ncDNA (BI and ML) treesabove the line and maximum likelihood BS below the line. *Indicates unresolved
illa orestilla, (d) H. anchiala mendax, (e) Ollantaya canilla, (f) O. aquata, (g) O. quintina,omoe phenomoe, (n) O. fumata, (o) O. victorine sarilis, (p) O. cyrene completa and (q) O.
D.L. de-Silva et al. / Molecular Phylogenetics and Evolution 55 (2010) 1032–1041 1039
4. Discussion
4.1. Oleriina phylogeny and evolutionary history
Phylogenetic hypotheses for the Oleriina are largely concordantwith morphology and previous molecular analyses with the excep-tion of the relationships of Hyposcada and Megoleria. The former isrecovered as sister to all other Oleriina confirming the findings ofWhinnett (2005) but challenging those of Brower et al. (2006)and Willmott and Freitas (2006). Morphological analyses placeMegoleria as sister to Hyposcada and these as sister to all otherOleriina (Brown and Freitas, 1994; Willmott and Freitas, 2006),while higher-level molecular analyses found Megoleria to be sisterto all other Oleriina (Brower et al., 2006). The strongest charactersupporting a sister relationship for Hyposcada and Megoleria isthe shared use of the host plant family Gesneriaceae (Drummondand Brown, 1987; Willmott and Freitas, 2006), unique among theIthomiini, while Oleria feed on Solanaceae similar to most otherIthomiini. Our hypotheses suggest, instead, that Megoleria andHyposcada may independently have switched from Solanaceae toGesneriaceae, or that the ancestor of Oleria plus Ollantaya revertedfrom feeding on Gesneriaceae to Solanaceae. However, none ofthese datasets provide very strong support for relationships amongHyposcada, Megoleria and Oleria/Ollantaya, and it is unsurprisingthat there are alternative topologies.
The phylogenetic hypothesis based on mtDNA results in theparaphyly of Hyposcada; with H. taliata placed as sister to Megoleria(Fig. 2), whereas ncDNA, the combined data and morphology re-cover each genus as a well-supported clade (Figs. 1 and 2) (Will-mott and Freitas, 2006). Megoleria and H. taliata also sharebiogeographic and ecological similarities. Both groups are Andeanin distribution and occur sympatrically at elevations above1200 m (pers. obs.). They share near indistinguishable mimeticwing patterning distinct from other Hyposcada (Fig. 2) and poten-tially share the same larval host plant family (that of H. taliata isunknown but is assumed to be Gesneriaceae, as in other Hyposcadaand Megoleria) (Drummond and Brown, 1987). One possible expla-nation for the phylogenetic discordance between mtDNA andncDNA and morphology is that this shared mtDNA is the resultof ancient introgression together with the selective, perhaps adap-tive, introgression of loci for colour pattern and host plant use(Mallet, 2009). Introgression has been shown to affect some partsof butterfly genomes, while other regions affected by divergentselection remain largely isolated (Bull et al., 2006; Gompertet al., 2006; Kronforst et al., 2006; Mavárez et al., 2006; Mallet,2007). On the other hand, introgression seems rather unlikelyamong such distantly related taxa. The other alternative is thatthe shared ancestry of these taxa may have resulted in the reten-tion of an unusual ancient polymorphism. Further widespreadsampling and sequencing of additional markers together with coa-lescence-based methods can be used to determine which of thesescenarios is more likely.
4.2. Oleriina systematics
The ncDNA and concatenated dataset corroborate previousmorphological studies (Willmott and Freitas, 2006) in recoveringall currently recognised Oleriina genera as monophyletic. WithinOleria there is a basal split between a clade containing O. canilla,O. aegineta and O. olerioides, and a clade containing the remainingOleria species. Brown and Freitas (1994) described the genus Ollan-taya with type species O. canilla based on several putative morpho-logical synapomorphies, and also included O. aegineta and O.baizana within the genus. While O. baizana appears to be unrelatedto the other two species, Willmott and Freitas (2006) confirmed
that O. canilla and O. aegineta are morphologically distinct fromother Oleria, forming a clade sister to all other Oleria, along withO. olerioides and an additional undescribed species from Peru. Gi-ven that molecular divergence between these two clades is highin comparison with that among other Oleria clades, that bothgroups can be diagnosed by morphological synapomorphies (Will-mott and Freitas, 2006), and that the larva of O. aegineta is ratherdifferent from other known Oleria (Willmott and Elias, unpublisheddata), we resurrect the name Ollantaya for O. canilla, O. aegineta (re-vised status) and O. olerioides.
The phylogeny of Oleria is highly congruent across all analyses,with the consistent recovery of four main clades. O. aegle is recov-ered as sister to the amalda and makrena groups by mtDNA and it isrecovered as sister to the onega species group by ncDNA and by themuch stronger signal of the latter partition in the combined data-set. Although the relationship of O. aegle with other species groupsis inconclusive, it clearly clusters with remaining Oleria, confirmingits inclusion in the genus.
At the species-level, our study suggests the need for a revisionof species limits in Hyposcada and the Oleria onega group, at least.H. zarepha zarepha failed to cluster with any other Hyposcada taxa,and, in concert with morphological characters (Willmott and La-mas, unpublished data). This result suggests that Guianan H. zare-pha should be regarded as a species distinct from west AmazonianHyposcada kena (revised status). Our data also support the recogni-tion of H. kena as a species distinct from its west Andean sister, H.schausi (Lamas, 2004). Finally, marked molecular divergenceamong races of H. illinissa suggest that an intensive phylogeograph-ic study of this highly polymorphic species would be desirable totest the current classification. Within Oleria, both O. astrea and O.onega are polyphyletic, with different geographic races failing tocluster together, suggesting that at least some of these might rep-resent distinct species. mtDNA differentiation between Oleria oneg-a subspecies is around 6.5% (Whinnett et al., 2005b), which isnotably high given that divergences within butterfly species aretypically less than 2% (Brower, 1994).
4.3. Biogeography
One of the most remarkable features of the Oleriina is the rela-tive mimetic homogeneity of the group (Fig. 2). Most other Ithom-iini genera are diverse in wing pattern, with mimetic shifts oftenoccurring between sister species (e.g., Jiggins et al., 2006). In con-trast, within single communities of Oleria, most species mimicone another, with few co-mimics from other genera. The Oleriinaare thus in sharp contrast to the emerging paradigm that mimeticshifts have enhanced diversification in the tribe (Jiggins et al.,2006), being mimetically similar but highly diverse. We mighttherefore expect a more important role for geography and biolog-ical factors other than mimicry in Oleriina speciation.
The four species groups identified in Oleria are similar to thoseidentified in a preliminary morphological survey (Willmott,unpublished data), which suggests the monophyly of the amaldaand makrena groups and the phylogenetic isolation of O. aegle. Fur-thermore, the four species groups are characterised by differentpreferred elevation ranges (Table 3). The amalda group speciesare characteristic of montane foothill forests from 0 to 1550 m.The aegle group is represented by a single species found below500 m also in the Guianas and lower Amazon basin. The onegagroup species are found between 0 and 2100 m, though the greatmajority are characteristic of lowland Amazonian forests. In con-trast, the makrena group species are mostly high-elevation Andeancloud forest species found between 1000 and 2850 m (Table 3).
Although this pattern of broad elevational sympatry withinclades and regions is suggestive of diversification in situ drivenby ecological adaptation, on closer inspection there are many
Table 3Oleria species groups based on morphological and molecular analyses with known elevation range.
Oleria species groups
aegle amalda makrena onega
O. aegle 0–500 m O. amalda 0–1500 m O. athalina 1200–2700 m O. sp. nov. 4 0–500 mO. estella 600–1470 m O. attalia 1200–2400 m O. agarista 120–600 mO. gunilla 100–850 m O. baizana 2000–2450 m O. alexina 120–1300 mO. paula 30–1750 m O. sp. nov. 2 1310–2000 m O. antaxis 100–450 mO. rubescens 30–1540 m O. bioculata 1250–1600 m O. aquata 0–1100 mO. sp. nov. 1 500–1000 m O. boyeri 900–1475 m O. assimilis 120–900 mO. zelica 0–1550 m O. sp. nov. 3 1600–2400 m O. astrea 25–1000 m
O. cyrene 1600–2600 m O. didymaea 100–1200 mO. deronda 1400–2200 m O. enania 130–650 mO. derondina 1800–2850 m O. flora 100–820 mO. fasciata 1300–2200 m O. ilerdina 10–1400 mO. fumata 1000–2500 m O. onega 100–1550 mO. makrena 950–2500 m O. quintina 500–2100 mO. padilla 500–2500 m O. sexmaculata 120–600 mO. phenomoe 480–1835 m O. similigena 400–820 mO. quadrata 900–1550 m O. synnova 50–120 mO. radina 1700–2400 m O. thiemei 400–500 mO. santineza 1200–2400 m O. tigilla 12–1200 mO. tremona 1300–2400 mO. vicina 1200–2000 mO. victorine 25–1650 mO. zea 1200–2000 m
1040 D.L. de-Silva et al. / Molecular Phylogenetics and Evolution 55 (2010) 1032–1041
examples of geographically allopatric, or, in some cases, elevation-ally parapatric sister species. The amalda group has two allopatricsub-clades, the first comprising the transandean O. rubescens, O.zelica, O. paula and O. amalda and the second the Amazonian O.estella, O. gunilla and O. sp. nov. 1. Within these sub-clades, sisterspecies O. amalda and O. paula are geographically allopatric, whileO. gunilla and O. estella/O. sp. nov. 1 are elevationally allopatric.Among the highland O. makrena group, allopatric or only partiallysympatric sister species include O. makrena/O. padilla, O. vicina/O.victorine, O. radina/O. baizana, O. santineza/O. fumata and O. cy-rene/O. attalia. Among the lowland onega group, there are a notablenumber of species restricted to the Guianas, lower Amazon orsoutheastern Brazil, including O. antaxis, O. aquata, O. astrea, O.flora, O. similigena and one undescribed species. By contrast, forexample, only a single Ithomia and no Napeogenes species are re-stricted to these regions (Jiggins et al., 2006; Elias et al., 2009). BothO. aquata and O. astrea are sister to west Amazonian species orclades with which they are largely or completely allopatric.
Little or no support is shown for the relationships of the highelevation makrena group although internal clades uniting speciesare well-resolved suggesting rapid radiation of this group ratherthan insufficient data. Recent evidence suggests that young speciesmay be more prevalent in montane areas (Hall, 2005; Weir, 2006)and many taxa have been found to diversify into highland habitatsafter uplift of the Andes (Bates and Zink, 1994; Bleiweiss, 1998).
To conclude, our results hint at a potentially more importantrole for local geographic isolation in the diversification of Oleriinathan in other Ithomiini groups studied to date (e.g., Jiggins et al.,2006; Elias et al., 2009) and provide a framework for future moredetailed biogeographical studies. In addition, comparative studieswith other butterfly taxa in addition to groups such as reptiles(Torres-Carvajal, 2007), amphibians (Santos et al., 2009) and birds(Brumfield and Edwards, 2007), could improve our understandingof the general processes involved in colonisation and diversifica-tion within the planet’s most biodiverse region.
Acknowledgments
We thank Gerardo Lamas, Andrew Brower, Mauro Costa, LuzMiryam Gomez Piñeres, Chris Jiggins, Mathieu Joron for donationof specimens, André Freitas for DNA sequences and Geoff Martin
and Blanca Huertas for access to the NHM collections. Karina LucasSilva-Brandão, Paul Upchurch and Ziheng Yang provided helpfuldiscussions regarding statistical analyses. Fraser Simpson and Kan-chon Dasmahapatra assisted in the lab and Fraser provided photo-graphs for Fig. 2. K.W. acknowledges the support of the NationalGeographic Society (Research and Exploration Grant #5751-96),The Leverhulme Trust, National Science Foundation (DEB0103746, DEB 0639977, DEB 0639861), the Museo Ecuatorianode Ciencias Naturales and Ministerio del Ambiente in Quito, andJ. Hall, I. Aldas and R. Aldaz for help collecting Oleriina. M.E.acknowledges the support of The Leverhulme Trust, and the MuseoEcuatoriano de Ciencias Naturales and Ministerio del Ambiente inQuito. Permits for fieldwork in Peru were obtained from INRENA,Ministerio de Agricultura and D.L.de-S. and J.M. are grateful forpermission to work in the country. This work was funded by NERCstudentship no. NER/S/A/2005/13224 to D.L.de-S. and grants fromNERC, DEFRA-Darwin Initiative and BBSRC to J.M.
Appendix A. Supplementary data
Supplementary data associated with this article can be found, inthe online version, at doi:10.1016/j.ympev.2010.01.010.
References
Bates, J.M., Zink, R.M., 1994. Evolution into the Andes: molecular evidence forspecies relationships in the genus Leptopogon. The Auk 111 (3), 507–515.
Beccaloni, G.W., 1997a. Ecology, natural history and behaviour of ithomiinebutterflies and their mimics in Ecuador (Lepidoptera: Nymphalidae:Ithomiinae). Trop. Lepid. 8, 103–124.
Beccaloni, G.W., 1997b. Vertical stratification of ithomiine butterfly (Nymphalidae:Ithomiinae) mimicry complexes: the relationship between adult flight heightand larval host plant height. Biol. J. Linn. Soc. 62, 313–341.
Bleiweiss, R., 1998. Origins of hummingbird faunas. Biol. J. Linn. Soc. 65, 77–97.Brower, A.V.Z., 1994. Phylogeny of Heliconius butterflies inferred from
mitochondrial DNA sequences (Lepidoptera: Nymphalidae). Mol. Phylogenet.Evol. 3, 159–174.
Brower, A.V.Z., Freitas, A.V.L., Lee, M.-M., Silva-Brandão, K.L., Whinnett, A., Willmott,K.R., 2006. Phylogenetic relationships among the Ithomiini (Lepidoptera:Nymphalidae) inferred from one mitochondrial and two nuclear gene regions.Syst. Entomol. 31, 288–301.
Brown, K.S., 1987. Chemistry at the solanaceae/ithomiinae interface. Ann. MissouriBot. Gard. 74, 359–397.
Brown, K.S., Freitas, A.V.L., 1994. Juvenile stages of Ithomiinae: overview andsystematics (Lepidoptera: Nymphalidae). Trop. Lepid. 5 (1), 9–20.
D.L. de-Silva et al. / Molecular Phylogenetics and Evolution 55 (2010) 1032–1041 1041
Brumfield, R.T., Edwards, S.V., 2007. Evolution into and out of the Andes: a Bayesiananalysis of historical diversification in Thamnophilus antshrikes. Evolution 61(2), 346–367.
Bull, V., Beltrán, M., Jiggins, C.D., McMillan, W.O., Bermingham, E., Mallet, J., 2006.Polyphyly and gene flow between non-sibling Heliconius species. BMC Biol. 4,11.
Constantino, L.M., 1999. Nuevas especies, subespecies y un nuevo género deropalóceros del occidente de Colombia (Lepidoptera: Papilionidae,Nymphalidae, Charaxinae, Ithomiinae, Heliconiinae). Boletín Cientifico. Museode Historia Natural. Universidad de Caldas 3, 57–68.
Drummond, B.A., Brown, K.S., 1987. Ithomiinae (Lepidotera: Nymphalidae):summary of known larval food plants. Ann. Missouri Bot. Gard. 74, 341–358.
Elias, M., Gompert, Z., Jiggins, C., Willmott, K., 2008. Mutualistic interactions driveecological niche convergence in a diverse butterfly community. PLoS Biol. 6,e300.
Elias, M., Hill, R.I., Willmott, K., Dasmahapatra, K., Brower, A.V.Z., Mallet, J., Jiggins,C.D., 2007. Limited performance of DNA barcoding in a diverse community oftropical butterflies. Proc. R. Soc. Lond. B 274, 2881–2889.
Elias, M., Joron, M., Willmott, K., Silva-Brandão, K.L., Kaiser, V., Arias, C.F., GomezPiñeres, L.M., Uribe, S., Brower, A.V.Z., Freitas, A.V.L., Jiggins, C., 2009. Out of theAndes: patterns of diversification in clearwing butterflies. Mol. Ecol. 18, 1716–1729.
Fox, R.M., 1956. A monograph of the Ithomiidae (Lepidoptera). Part I. Bull. Am. Mus.Nat. Hist. 111, 1–76.
Goloboff, P.A., 1999. Analyzing large data sets in reasonable times: solutions forcomposite optima. Cladistics 15, 415–428.
Gompert, Z., Fordyce, J.A., Forister, M., Shapiro, A.M., Nice, C.C., 2006. Homoploidhybrid speciation in an extreme habitat. Science 314, 1923–1925.
Haber, W.A., 1978. Evolutionary Ecology of Tropical Mimetic Butterflies(Lepidoptera: Ithomiinae). Ph.D. Thesis, University of Minnesota, Minnesota.
Hall, J.P.W., 2005. Montane speciation patterns in Ithomiola butterflies (Lepidotera:Riodinidae): are they consistently moving up in the world? Proc. R. Soc. Lond. B272, 2457–2466.
Hall, T.A., 1999. BioEdit: a user-friendly biological sequence alignment editor andanalysis program for Windows 95/98/NT. Nucleic Acids Symp. Ser. 41, 95–98.
Harvey, D.J., 1991. Higher classification of the Nymphalidae. In: Nijhout, H.F. (Ed.),The Development and Evolution of Butterfly Wing Patterns. SmithsonianInstitution, Washington, pp. 255–273.
Huelsenbeck, J.P., Ronquist, F., 2001. MrBayes: Bayesian inference of phylogenetictrees. Bioinformatics 17, 754–755.
Jiggins, C.D., Mallarino, R., Willmott, K.R., Bermingham, E., 2006. The phylogeneticpattern of speciation and wing pattern change in neotropical Ithomia butterflies(Lepidoptera; Nymphalidae). Evolution 60 (7), 1454–1466.
Joron, M., Wynne, I.R., Lamas, G., Mallet, J., 2001. Variable selection and thecoexistence of multiple mimetic forms in Heliconius numata. Evol. Ecol. 13 (7/8),721–754.
Kishino, H., Hasegawa, M., 1989. Evaluation of the maximum likelihood estimate ofthe evolutionary tree topologies from DNA sequence data, and the branchingorder in the Hominoidea. J. Mol. Evol. 29, 170–179.
Kronforst, M.R., Young, L.G., Blume, L.M., Gilbert, L.E., 2006. Multilocus analysis ofadmixture and introgression among hybridizing Heliconius butterflies.Evolution 60, 1254–1268.
Lamas, G., 2004. Ithomiinae. In: Heppner, J.B. (Ed.), Atlas of Neotropical Lepidoptera.Checklist: Part 4A Hesperioidea – Papilionoidea. Association of TropicalLepidoptera. Scientific Publishers, Gainesville, FL.
Mallarino, R., Bermingham, E., Willmott, K.R., Whinnett, A., Jiggins, C.D., 2005.Molecular systematics of the butterfly genus Ithomia (Lepiodoptera:Ithomiinae): a composite phylogenetic hypothesis based on seven genes. Mol.Phylogenet. Evol. 34, 625–644.
Mallet, J., 2007. Hybrid speciation. Nature 446, 279–283.Mallet, J., 2009. Rapid speciation, hybridization and adaptive radiation in the
Heliconius melpomene group. In: Butlin, R., Bridle, J., Schluter, D. (Eds.),Speciation and Patterns of Diversity. Cambridge University Press, pp. 177–194.
Mavárez, J., Salazar, C., Bermingham, E., Salcedo, C., Jiggins, C.D., Linares, M., 2006.Speciation by hybridization in Heliconius butterflies. Nature 441, 868–871.
Nixon, K.C., 1999. The parsimony ratchet, a new method for rapid parsimonyanalysis. Cladistics 15, 407–414.
Pinheiro, C.E.G., Medri, Í.M., Salcedo, A.K.M., 2008. Why do the ithomiines(Lepidoptera, Nymphalidae) aggregate? Notes on a butterfly pocket in centralBrazil. Revista Brasileira de Entomologia 52 (4), 610–614.
Posada, D., Crandall, K., 1998. MODELTEST: testing the model of DNA substitution.Bioinformatics 14, 817–818.
Rambaut, A., Drummond, A.J., 2007. Tracer v1.4. <http://www.beast.bio.ed.ac.uk/Tracer>.
Ren, F.R., Tanaka, H., Yang, Z.H., 2005. An empirical examination of the utility ofcodon-substitution models in phylogeny reconstruction. Syst. Biol. 54, 808–818.
Santos, J.C., Coloma, L.A., Summers, K., Caldwell, J.P., Ree, R., Cannatella, D.C., 2009.Amazonian amphibian diversity is primarily derived from late Miocene Andeanlineages. PLoS Biol 7 (3), E56.
Schultz, S., Beccaloni, G., Brown Jr., K.S., Boppré, M., Freitas, A.V.L., Ockenfels, P.,Trigo, J.R., 2004. Semiochemicals derived from pyrrolizidine alkaloids in maleithomiine butterflies (Lepidoptera: Nymphalidae: Ithomiinae). Biochem. Syst.Ecol. 32, 699–713.
Shimodaira, H., 2002. An approximately unbiased test of phylogenetic treeselection. Syst. Biol. 53 (3), 492–508.
Swofford, D.L., 2002. PAUP�. Phylogenetic Analysis Using Parsimony (� and OtherMethods), Version 4.0b10. Sinauer Associates, Sunderland, MA.
Thompson, J.D., Higgins, D.G., Gibson, T.J., 1994. CLUSTAL W: improving thesensitivity of progressive multiple sequence alignment through sequenceweighting, position-specific gap penalties and weight matrix choice. NucleicAcids Res. 22, 4673–4680.
Torres-Carvajal, O., 2007. Phylogeny and biogeography of a large radiation ofAndean lizards (Iguania, Stenocercus). Zool. Scripta 36, 311–326.
Wahlberg, N., Freitas, A.V.L., 2007. Colonization of and radiation in South Americaby butterflies in the subtribe Phyciodina (Lepidoptera: Nymphalidae). Mol.Phylogenet. Evol. 44, 1257–1272.
Wahlberg, N., Weingartner, E., Nylin, S., 2003. Towards a better understanding ofthe higher systematics of Nymphalidae (Lepidoptera: Papilionoidea). Mol.Phylogenet. Evol. 28, 473–484.
Weir, J., 2006. Divergent timing and patterns of species accumulation in lowlandand highland neotropical birds. Evolution 60 (4), 842–855.
Whinnett, A., 2005. The Phylogeography and Molecular Evolution of IthomiineButterflies. Unpublished Thesis, University College London, UK.
Whinnett, A., Willmott, K.R., Brower, A.V.Z., Simpson, F., Lamas, G., Mallet, J., 2005a.Mitochondrial DNA provides an insight into the mechanisms drivingdiversification in the ithomiine butterfly Hyposcada anchiala (Lepidoptera:Nymphalidae, Ithomiinae). Eur. J. Entomol. 102, 633–639.
Whinnett, A., Zimmermann, M., Willmott, K.R., Herrera, N., Mallarino, R., Simpson,F., Joron, M., Lamas, G., Mallet, J., 2005b. Strikingly variable divergence timesinferred across an Amazonian butterfly ‘suture zone’. Proc. R. Soc. Lond. B 272,2525–2533.
Willmott, K.R., Freitas, A.V.L., 2006. Higher-level phylogeny of the Ithomiinae(Lepidoptera: Nymphalidae): classification, patterns of larval hostplantcolonization and diversification. Cladistics 22, 297–368.
Willmott, K.R., Hall, J.P.W., Lamas, G., 2001. Systematics of Hypanartia (Lepidoptera:Nymphalidae: Nymphalinae), with a test for geographical speciationmechanisms in the Andes. Syst. Entomol. 26, 369–399.
Willmott, K.R., Lamas, G., 2008. A revision of the genus Megoleria (Lepidoptera:Nymphalidae; Ithomiinae). Trop. Lepid. Res. 18 (1), 46–59.
Willmott, K.R., Mallet, J., 2004. Correlations between adult mimicry and larval hostplants in ithomiine butterflies. Proc. R. Soc. Lond. B: Biol. Lett. 271 (S5), S266–S269.
Zwickl, D.J., 2006. Genetic Algorithm Approaches for the Phylogenetic Analysis ofLarge Biological Sequence Datasets under the Maximum Likelihood Criterion.Ph.D. Dissertation, The University of Texas at Austin.