Modelling of microstructural evolution in multi ... · Modelling of microstructural evolution in...
17
•
-
Upload
hoangkhuong -
Category
Documents
-
view
216 -
download
0
Transcript of Modelling of microstructural evolution in multi ... · Modelling of microstructural evolution in...
Loughborough UniversityInstitutional Repository
Modelling of microstructuralevolution in multi-layered
overlay coatings
This item was submitted to Loughborough University's Institutional Repositoryby the/an author.
Citation: KARUNARATNE, M., 2017. Modelling of microstructural evolutionin multi-layered overlay coatings. Journal of Materials Science, 52 (20), pp.12279-12294.
Additional Information:
• This is an Open Access Article. It is published by Springerunder the Creative Commons Attribution 4.0 Unported Li-cence (CC BY). Full details of this licence are available at:http://creativecommons.org/licenses/by/4.0/
Metadata Record: https://dspace.lboro.ac.uk/2134/25855
Version: Published
Publisher: c© The Authors. Published by Springer Verlag
Rights: This work is made available according to the conditions of the CreativeCommons Attribution 4.0 International (CC BY 4.0) licence. Full details of thislicence are available at: http://creativecommons.org/licenses/ by/4.0/
Please cite the published version.
COMPUTATION
Modelling of microstructural evolution in multi-layered
overlay coatings
M. S. A. Karunaratne1,* , M. A. E. Jepson1, N. J. Simms2, J. R. Nicholls2, and R. C. Thomson1
1Department of Materials, Loughborough University, Loughborough, Leicestershire LE11 3TU, UK2Power Engineering Centre, Cranfield University, Cranfield, Bedfordshire MK43 0AL, UK
Received: 26 January 2017
Accepted: 6 July 2017
Published online:
17 July 2017
� The Author(s) 2017. This
article is an open access
publication
ABSTRACT
Functionally graded, multi-layered coatings are designed to provide corrosion
protection over a range of operating conditions typically found in industrial gas
turbines. A model incorporating diffusion, equilibrium thermodynamics and
oxidation has been developed to simulate the microstructural evolution within a
multi-layered coating system. The phase and concentration profiles predicted by
the model have been compared with an experimental multi-layered system
containing an Al-rich outer layer, a Cr-enriched middle layer and an MCrAlY-
type inner layer deposited on a superalloy substrate. The concentration distri-
bution and many microstructural features observed experimentally can be
predicted by the model. The model is expected to be useful for assessing the
microstructural evolution of multilayer coated systems which can be potentially
used on industrial gas turbine aerofoils.
Introduction
To enable progressively higher firing temperatures
and pressures in industrial gas turbines, the alloys
used in their hot gas paths have needed considerable
development since the 1960s. Initially, these devel-
opments coupled increased resistance to creep and
fatigue with better oxidation and hot corrosion
resistance. However, since the 1970s, base alloys have
been developed with increasingly optimised
mechanical load capabilities, but at the cost of
reduced corrosion resistance, through lowering Cr
content and by addition of Al, Ti and refractory
metals (Al and Ti support the formation of c0, while
refractory metal additions provide solid solution
strengthening to the c phase). Thus, coatings that
protect the base alloys from the surrounding envi-
ronment have become critical parts of hot gas path
components. Coatings have been developed to pro-
vide either: (a) a hot corrosion/oxidation-resistant
barrier, and/or (b) a low conductivity thermal barrier
coating (TBC) to reduce cooling air requirements
and/or base alloy operating temperatures. With the
increasingly large gas–metal temperature difference,
the roles of coating systems have become more
important.
Different types of coatings have been developed to
meet the needs of particular types of gas turbine
environments, and these have been reviewed else-
where, e.g. [1, 2]. However, the design of current gas
Address correspondence to E-mail: [email protected]
DOI 10.1007/s10853-017-1365-2
J Mater Sci (2017) 52:12279–12294
Computation
turbine components is such that a wide range of
conditions can be experienced by a single component.
Without a TBC, variations in gas and metal temper-
atures, local gas compositions and flow regimes can
result in conditions that cause oxidation, Type I and
Type II hot corrosion at different locations on a sur-
face of a single component. Thus, coating systems are
needed that can resist the different degradation
routes. This has provided the driving force for the
development of ‘SMART’ coatings that are able to
resist multiple degradation routes. One route to
develop such coatings is using the functionally gra-
ded materials concept where multi-layered coatings
are generated on a component surface [3–5]. In this
approach, each layer has a specific role to play in
providing the coating with its desired properties (e.g.
Fig. 1). However, a particular concern for such com-
plex coating systems is their thermal stability; during
operation at high temperatures, the distinct coating
layers need to be maintained for long periods and not
degrade via interdiffusion or surface reactions.
Computer modelling has been successfully applied
in many areas of nickel-based superalloys such as
thermodynamics [6–8], solidification [9, 10],
microstructural evolution [11, 12] and prediction of
physical properties [10, 13]. A modelling capability
that can predict microstructural evolution processes
in coating structures is extremely valuable and can
assist the development process of advanced coating
systems such as SMART coatings. The development
of a microstructural simulation model for coated
superalloy systems was reported earlier [12], and the
model was validated against a number of experi-
mental single-layered coating systems [12, 13]. In this
work, the capability of the model has been extended
further to incorporate multi-layered coatings and the
developed model is used to examine the thermal
stability of a trial, functionally graded, multi-layered
coating system from an early stage of a coating
development process.
Experimental procedure
An example of a chemically graded coating structure
was used for this study. An argon-shrouded plasma
spray process was used to deposit a NiCrAlY base
coating on a superalloy substrate. This was followed
by a second step aimed at surface treating the as-
sprayed NiCrAlY to form a chromium-rich interlayer
(this step is proprietary, but is designed to produce a
continuous inner zone containing some 60 wt% Cr).
Then, an aluminising treatment was carried out to
develop an outer b-NiAl [3, 4]. Details of heat treat-
ments carried out during the processing of this multi-
layered coating system are also proprietary.
The coated samples [3] presented within this article
are used for model verification purposes only and
belong to an early generation of multilayer coatings.
Work is ongoing to improve these coatings for use
within relevant industrial applications. The aim of
this research is to demonstrate the applicability and
validity of a model developed for simulating multi-
layered coating systems which can potentially be
used for gas turbine components.
The samples had been subjected to a proprietary
high-temperature coating treatment anneal followed
by ageing in air -300 vpm SOx either at 700 �C(Sample 1) or 900 �C (Sample 2) for 500 h. The aged
samples were mounted in a low-temperature curing,
edge-retaining resin, ensuring that the coating
deposition direction was parallel to the surface of the
mount. The mounted samples were ground and
polished using oil-based preparation procedures
using successively finer silicon carbide paper and
finally 9-, 3- and 1-lm diamond polish. To ensure that
the specimens were suitable for electron microscopy
characterisation, they were coated with a thin layer of
gold. This layer was applied using a Quorum
Al rich zone(Enhanced oxidation and Type I protection)
Cr enriched zone(Enhanced Type II hot corrosion protection)
MCrAlY Coating(Standard oxidation and hot corrosion protection)
Alloy substrate
Oxide scale
Figure 1 Illustration of a typical multilayer coating configuration
(not to scale).
12280 J Mater Sci (2017) 52:12279–12294
Technologies Emitech SC7640 sputter coater with a
coating time of approximately 20 s.
Scanning electron microscopy was carried out
using a Leo 1530VP field emission gun scanning
electron microscope (FEGSEM) operating in
backscattered electron (BSE) mode with an acceler-
ating voltage of 20 kV and a working distance of
approximately 10 mm. The detector used was a
4-quadrant detector operating with all quadrants in
their normal operation mode. For energy-dispersive
X-ray spectroscopy (EDS), an EDAX TEAM Pegasus
system was used and the concentration profiles of the
coating were obtained by using the multipoint (ma-
trix) function where a matrix of 10 rows of 50 analysis
areas was collected and each column of the matrix
was averaged to give a smooth curve suitable for
comparison to the model output.
Preparation of transmission electron microscopy
samples was carried out using focused ion beam
(FIB) milling which allowed site-specific transmis-
sion electron microscope (TEM) sample preparation.
These samples, measuring approximately 25 lm9 5 lm, were produced using an FEI Nova Nanolab
600 operating at an accelerating voltage of 30 kV
throughout, with the assistance of an Omniprobe
micromanipulator for lamella extraction. Lamellae
were attached to copper half-grids using platinum
deposition and polished using a final beam current
of 300 pA to a thickness of less than 200 nm.
Examination of TEM specimens was carried out
using a JEOL 2000FX microscope operating at an
accelerating voltage of 200 kV. Images were collected
using a Gatan Erlangshen charge-coupled digital
camera, and EDS data were collected using an Oxford
Instruments Inca system.
Simulation model
Diffusion model
Due to the planar nature of interfaces between coat-
ing layers and also between coating layers and the
substrate, diffusion occurring in a typical multilayer
coating system could be approximated by a one-di-
mensional model. Hence, the diffusion of elements
within coating layers and substrate was modelled
using the 1-D multicomponent representation of
Fick–Onsager law [14, 15] given by Eq. (1)
oCi
ot¼Xn�1
j¼1
~Dnij
o2Cj
ox2þ
Xn�1
k¼1
o
oCk
~Dnik
oCk
ox
!oCj
ox
( )ð1Þ
where i, j and k are chemical elements. The interdif-
fusion coefficient matrix ~Dnij is expressed in relation to
a solvent n, which is Ni for the present system, and Ci
represents the concentration of element i.
Diffusion coefficients
Interdiffusion coefficients in Ni-FCC phase were
obtained from the indicated references for elements:
Co [16], Mo [17], Ti [18], Re [19], W [19], Ta [19], Al
[20] and Cr [21]. For the c0 phase, diffusion coeffi-
cients reported in [22] for Al, [23] for Ti, and [24] for
Co and Cr, were incorporated. For the b phase dif-
fusion coefficients of Al provided in [25] were used.
Since diffusion data were unavailable for elements
within TCP phases and, and since diffusivity was
expected to be slow in ordered TCP phases and BCC
a-Cr phase, their diffusion coefficients were assumed
to be a fraction (5%) of that in the FCC-Ni phase. The
concentration dependences of diffusion coefficients
were modelled by fitting third-degree polynomials to
published data, and their temperature dependences
were modelled by assuming Arrhenius behaviour.
Full details of the modelling process and fitted
parameters are given in [11] and hence not repeated
here. For each node, an effective diffusion coefficient
for each element was calculated by taking a volume
weighted average of concentration-dependent diffu-
sion coefficients in each phase.
Oxidation model
For oxidation, the model proposed by Meier et al. for
a Ni–Co–Cr-based bond coat was used [26]. The
model assumes that only Al is oxidised at the coating
surface and the diffusion of elements within the
oxide was not considered in the current model. For
isothermal oxidation, the boundary condition at the
oxide/coating interface is given in [26] as the rate of
Al consumption, where the thickness d of the oxide
scale in is given by Eq. (2)
d ¼ exp Q1
T0� 1
T
� �� �t
� �nð2Þ
where Q is a constant and equal to 27777.4, T is the
temperature in Kelvin, T0 is 2423.7 K, t is time in
seconds and n is equal to 0.332. The scale thickness
J Mater Sci (2017) 52:12279–12294 12281
predicted by the simulation was validated against
those given by (2), and these values were found to be
in excellent agreement with each other across the
time-step values used in current simulations.
Thermodynamic model
The thermodynamic equilibrium calculations were
performed using the application interface [27] of
MTDATA [6]. The MTDATA program consists of a
numerical technique for the minimisation of Gibbs
free energy of a chemical system and was used in
conjunction with a thermodynamic database for Ni-
based superalloys, Ni-DATA [7, 8]. The code calls the
MTDATA application interface at each time step,
with the concentration at each node in the diffusion
grid sequentially. The thermodynamic calculations,
in turn, return a description of equilibrium phases
which are likely to be present at each node. This
description includes the fractional phase constitution
and the composition within each of the phases.
Each thermodynamic calculation is computation-
ally expensive because of the inclusion of a large
number of elements and alloy phases. Furthermore,
there is a requirement to perform a large number of
such calculations due to the need to solve at each
spatial grid point at every time step. Therefore, to
address these problems, the simulations were per-
formed in parallel so as to minimise the computa-
tional run time. This was achieved by partitioning the
spatial grid points among multiple processors, which
was possible as the thermodynamic calculations at
each spatial grid point were independent.
Grid Scheme
In the model, the differential terms in (1) were
replaced by their finite-difference (F-D) equivalents
as detailed in [26]. The explicit scheme was used to
solve for concentrations of all elements. At the start,
the F-D grid zones were located only in areas where
concentration gradients were expected to be steep. It
allowed computational resources to be concentrated
more efficiently only where chemistry was changing,
i.e. (a) near the outer oxidation layer, (b) between
coating layers and (c) near the coating layer/sub-
strate boundary. In all cases, interdiffusion zones
were created. Initially, regions away from these zones
had zero concentration gradients, and hence no con-
centration changes occurred as interdiffusion fluxes
were absent. The presence of semi-infinite boundary
conditions at termini of each grid zone was assumed,
except near the oxidation/coating interface where the
boundary condition was provided by the scale for-
mation process instead.
The F-D grid zones were expanded dynamically
into the coating layers (or substrate) as the concen-
tration fields extended with time [26]. The interface
between the outer coating layer and the oxide scale
was treated as a moving phase boundary, using the
scheme suggested in [28]. The expansion of zones
continued until any two neighbouring zones over-
lapped (soft impingement) and from that stage, the
diffusion zones were merged together to form a sin-
gle zone.
Simulation conditions
The multilayer coating system consisted of three
layers on a superalloy substrate. The outermost and
central layers were Al- and Cr-enriched, respectively,
and the innermost layer was a NiCrAlY. The samples
had been subjected to a proprietary high-temperature
coating treatment anneal followed by ageing in air
-300 vpm SOx either at 700 �C (Sample 1) or 900 �C(Sample 2) for 500 h. These thermal treatments were
simulated using the model. The two samples had
received different treatment conditions when the
outer layers were deposited [4], hence resulting in
compositional differences in that layer as illustrated
in Table 1. The substrate composition was deter-
mined to be Ni–7.4Al–9Co–6Cr–0.6Mo–6.5Ta–1.0Ti–
3.0Re–6.0 W (wt%) using EDS, and this composition
was used in the simulations.
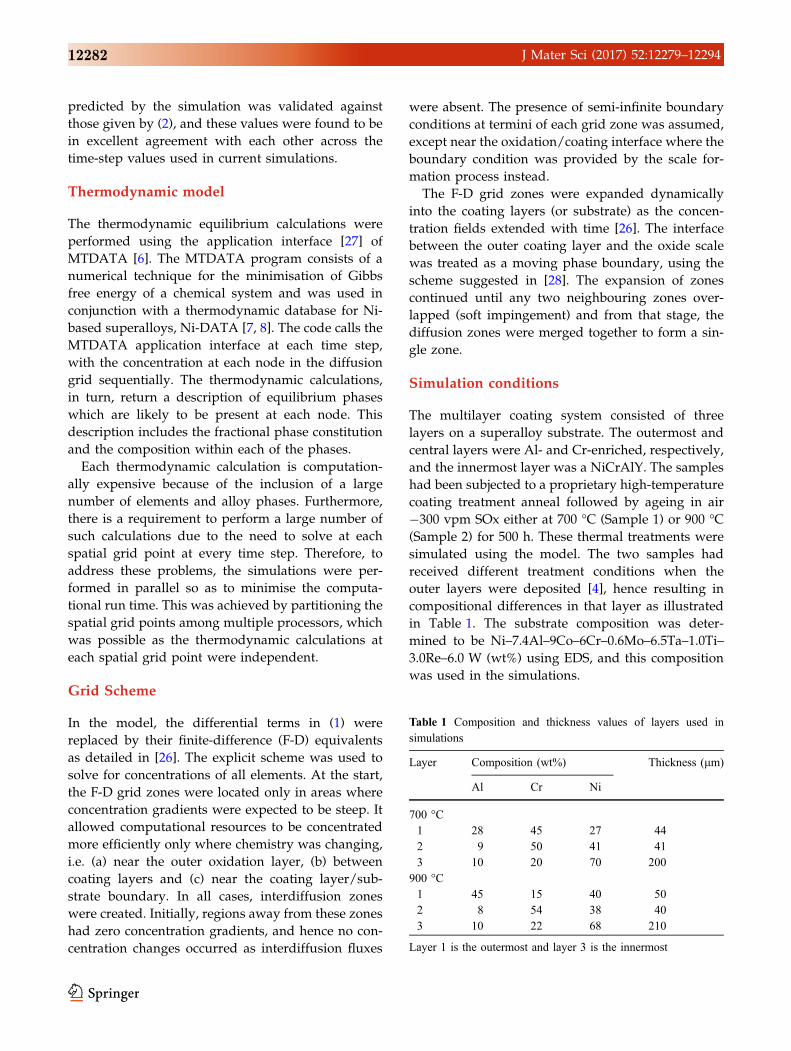
Table 1 Composition and thickness values of layers used in
simulations
Layer Composition (wt%) Thickness (lm)
Al Cr Ni
700 �C1 28 45 27 44
2 9 50 41 41
3 10 20 70 200
900 �C1 45 15 40 50
2 8 54 38 40
3 10 22 68 210
Layer 1 is the outermost and layer 3 is the innermost
12282 J Mater Sci (2017) 52:12279–12294
The initial grid layout consisted of four equispaced
grid zones, each having 36 grid points; from outer to
inner zone the grid spacings were 0.13, 0.24, 0.79 and
1.14 at 700 �C and 0.14, 0.26, 0.71 and 1.2 at 900 �C.The time step for the simulations was varied in
accordance with stability criteria for the explicit
finite-difference solution scheme, e.g. [26]. The den-
sity of the outer coating layer and partial molar vol-
ume of Al in the coating were assumed to be
7754 kg/m3 and 7.1 9 10-6 m3/mol. An initial scale
thickness of 0.3 lm was allowed to be present in the
samples. Other conditions used with the model can
be found in [11].
Results and discussion
Microstructure of aged multilayer coatings
Coating microstructure
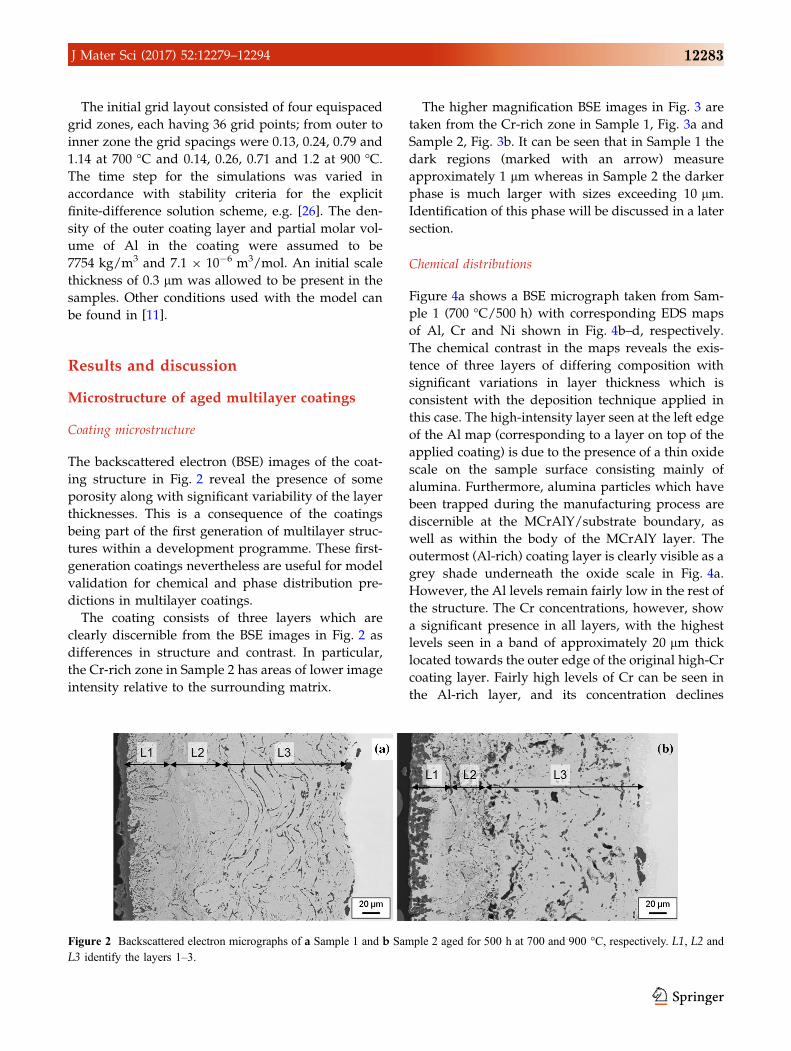
The backscattered electron (BSE) images of the coat-
ing structure in Fig. 2 reveal the presence of some
porosity along with significant variability of the layer
thicknesses. This is a consequence of the coatings
being part of the first generation of multilayer struc-
tures within a development programme. These first-
generation coatings nevertheless are useful for model
validation for chemical and phase distribution pre-
dictions in multilayer coatings.
The coating consists of three layers which are
clearly discernible from the BSE images in Fig. 2 as
differences in structure and contrast. In particular,
the Cr-rich zone in Sample 2 has areas of lower image
intensity relative to the surrounding matrix.
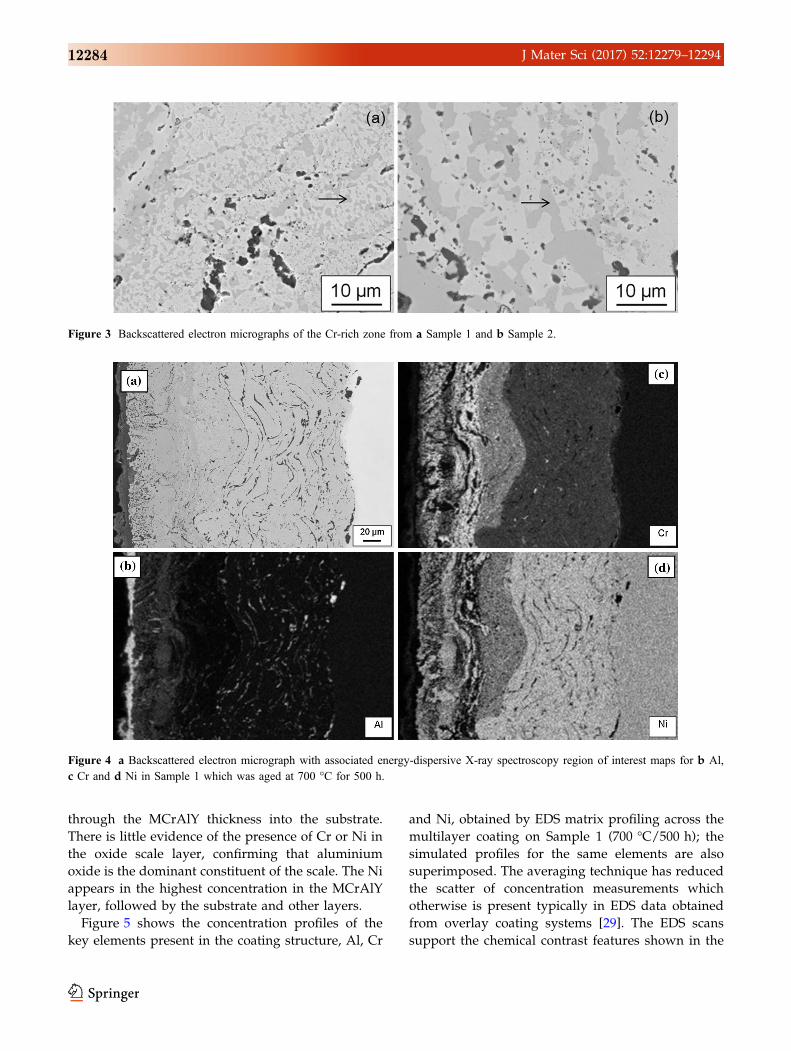
The higher magnification BSE images in Fig. 3 are
taken from the Cr-rich zone in Sample 1, Fig. 3a and
Sample 2, Fig. 3b. It can be seen that in Sample 1 the
dark regions (marked with an arrow) measure
approximately 1 lm whereas in Sample 2 the darker
phase is much larger with sizes exceeding 10 lm.
Identification of this phase will be discussed in a later
section.
Chemical distributions
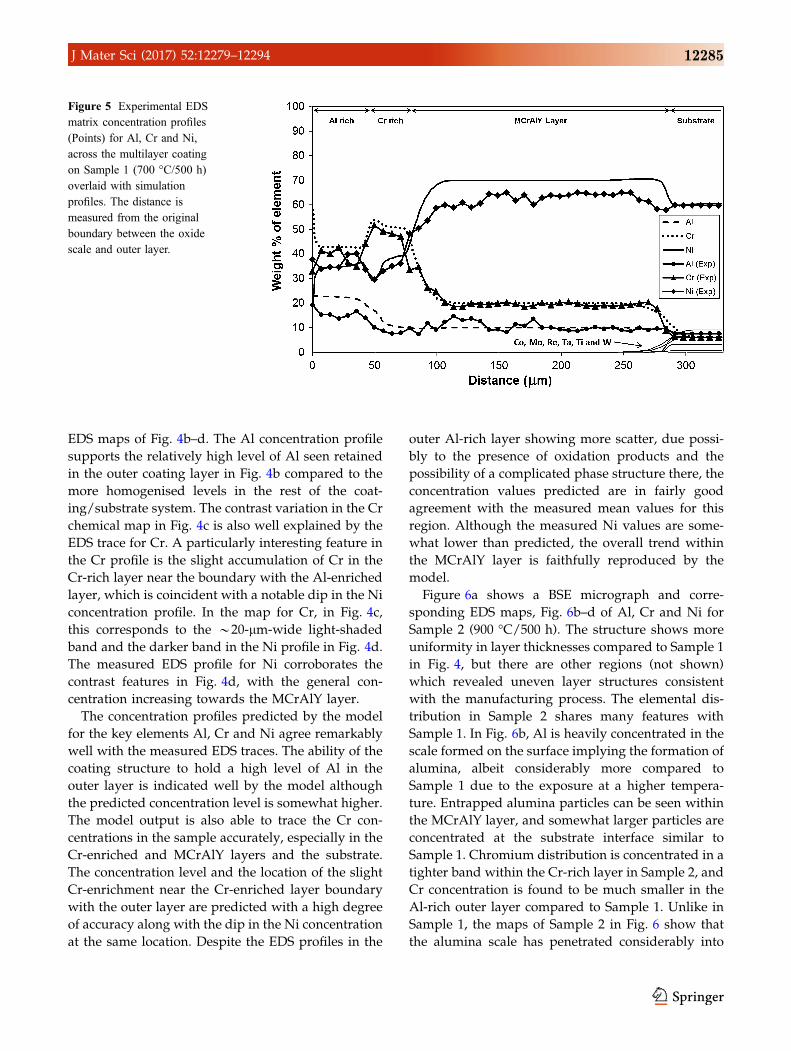
Figure 4a shows a BSE micrograph taken from Sam-
ple 1 (700 �C/500 h) with corresponding EDS maps
of Al, Cr and Ni shown in Fig. 4b–d, respectively.
The chemical contrast in the maps reveals the exis-
tence of three layers of differing composition with
significant variations in layer thickness which is
consistent with the deposition technique applied in
this case. The high-intensity layer seen at the left edge
of the Al map (corresponding to a layer on top of the
applied coating) is due to the presence of a thin oxide
scale on the sample surface consisting mainly of
alumina. Furthermore, alumina particles which have
been trapped during the manufacturing process are
discernible at the MCrAlY/substrate boundary, as
well as within the body of the MCrAlY layer. The
outermost (Al-rich) coating layer is clearly visible as a
grey shade underneath the oxide scale in Fig. 4a.
However, the Al levels remain fairly low in the rest of
the structure. The Cr concentrations, however, show
a significant presence in all layers, with the highest
levels seen in a band of approximately 20 lm thick
located towards the outer edge of the original high-Cr
coating layer. Fairly high levels of Cr can be seen in
the Al-rich layer, and its concentration declines
Figure 2 Backscattered electron micrographs of a Sample 1 and b Sample 2 aged for 500 h at 700 and 900 �C, respectively. L1, L2 and
L3 identify the layers 1–3.
J Mater Sci (2017) 52:12279–12294 12283
through the MCrAlY thickness into the substrate.
There is little evidence of the presence of Cr or Ni in
the oxide scale layer, confirming that aluminium
oxide is the dominant constituent of the scale. The Ni
appears in the highest concentration in the MCrAlY
layer, followed by the substrate and other layers.
Figure 5 shows the concentration profiles of the
key elements present in the coating structure, Al, Cr
and Ni, obtained by EDS matrix profiling across the
multilayer coating on Sample 1 (700 �C/500 h); the
simulated profiles for the same elements are also
superimposed. The averaging technique has reduced
the scatter of concentration measurements which
otherwise is present typically in EDS data obtained
from overlay coating systems [29]. The EDS scans
support the chemical contrast features shown in the
Figure 3 Backscattered electron micrographs of the Cr-rich zone from a Sample 1 and b Sample 2.
Figure 4 a Backscattered electron micrograph with associated energy-dispersive X-ray spectroscopy region of interest maps for b Al,
c Cr and d Ni in Sample 1 which was aged at 700 �C for 500 h.
12284 J Mater Sci (2017) 52:12279–12294
EDS maps of Fig. 4b–d. The Al concentration profile
supports the relatively high level of Al seen retained
in the outer coating layer in Fig. 4b compared to the
more homogenised levels in the rest of the coat-
ing/substrate system. The contrast variation in the Cr
chemical map in Fig. 4c is also well explained by the
EDS trace for Cr. A particularly interesting feature in
the Cr profile is the slight accumulation of Cr in the
Cr-rich layer near the boundary with the Al-enriched
layer, which is coincident with a notable dip in the Ni
concentration profile. In the map for Cr, in Fig. 4c,
this corresponds to the *20-lm-wide light-shaded
band and the darker band in the Ni profile in Fig. 4d.
The measured EDS profile for Ni corroborates the
contrast features in Fig. 4d, with the general con-
centration increasing towards the MCrAlY layer.
The concentration profiles predicted by the model
for the key elements Al, Cr and Ni agree remarkably
well with the measured EDS traces. The ability of the
coating structure to hold a high level of Al in the
outer layer is indicated well by the model although
the predicted concentration level is somewhat higher.
The model output is also able to trace the Cr con-
centrations in the sample accurately, especially in the
Cr-enriched and MCrAlY layers and the substrate.
The concentration level and the location of the slight
Cr-enrichment near the Cr-enriched layer boundary
with the outer layer are predicted with a high degree
of accuracy along with the dip in the Ni concentration
at the same location. Despite the EDS profiles in the
outer Al-rich layer showing more scatter, due possi-
bly to the presence of oxidation products and the
possibility of a complicated phase structure there, the
concentration values predicted are in fairly good
agreement with the measured mean values for this
region. Although the measured Ni values are some-
what lower than predicted, the overall trend within
the MCrAlY layer is faithfully reproduced by the
model.
Figure 6a shows a BSE micrograph and corre-
sponding EDS maps, Fig. 6b–d of Al, Cr and Ni for
Sample 2 (900 �C/500 h). The structure shows more
uniformity in layer thicknesses compared to Sample 1
in Fig. 4, but there are other regions (not shown)
which revealed uneven layer structures consistent
with the manufacturing process. The elemental dis-
tribution in Sample 2 shares many features with
Sample 1. In Fig. 6b, Al is heavily concentrated in the
scale formed on the surface implying the formation of
alumina, albeit considerably more compared to
Sample 1 due to the exposure at a higher tempera-
ture. Entrapped alumina particles can be seen within
the MCrAlY layer, and somewhat larger particles are
concentrated at the substrate interface similar to
Sample 1. Chromium distribution is concentrated in a
tighter band within the Cr-rich layer in Sample 2, and
Cr concentration is found to be much smaller in the
Al-rich outer layer compared to Sample 1. Unlike in
Sample 1, the maps of Sample 2 in Fig. 6 show that
the alumina scale has penetrated considerably into
Figure 5 Experimental EDS
matrix concentration profiles
(Points) for Al, Cr and Ni,
across the multilayer coating
on Sample 1 (700 �C/500 h)
overlaid with simulation
profiles. The distance is
measured from the original
boundary between the oxide
scale and outer layer.
J Mater Sci (2017) 52:12279–12294 12285
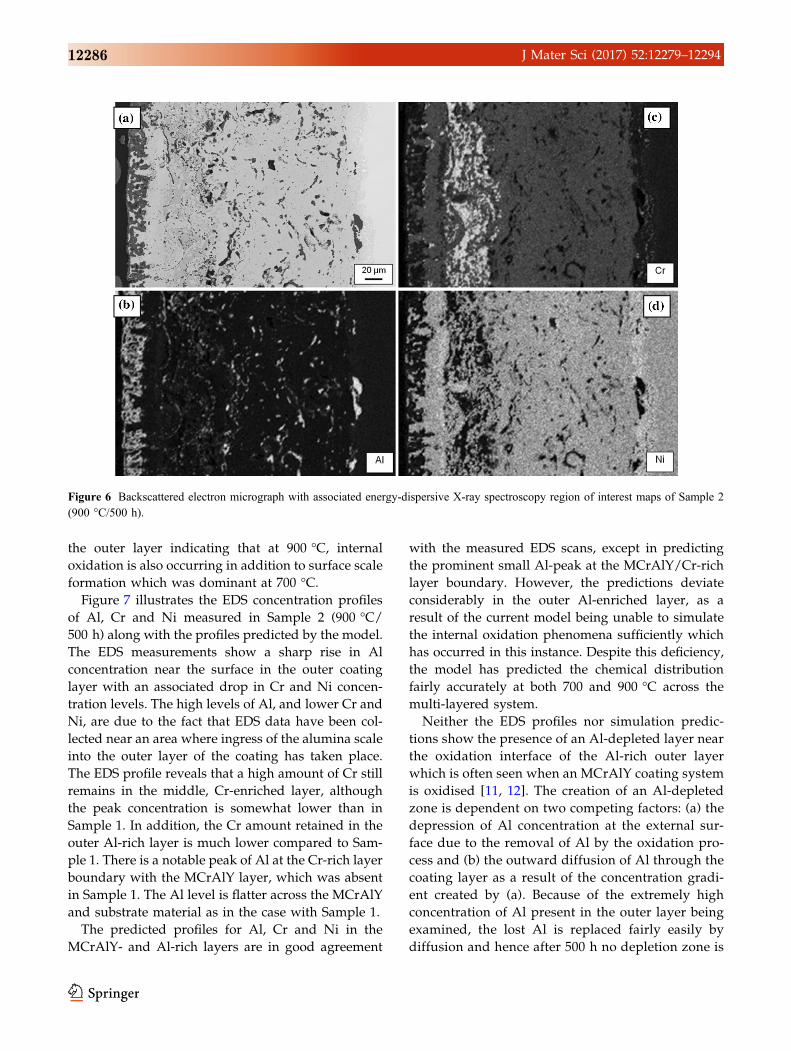
the outer layer indicating that at 900 �C, internal
oxidation is also occurring in addition to surface scale
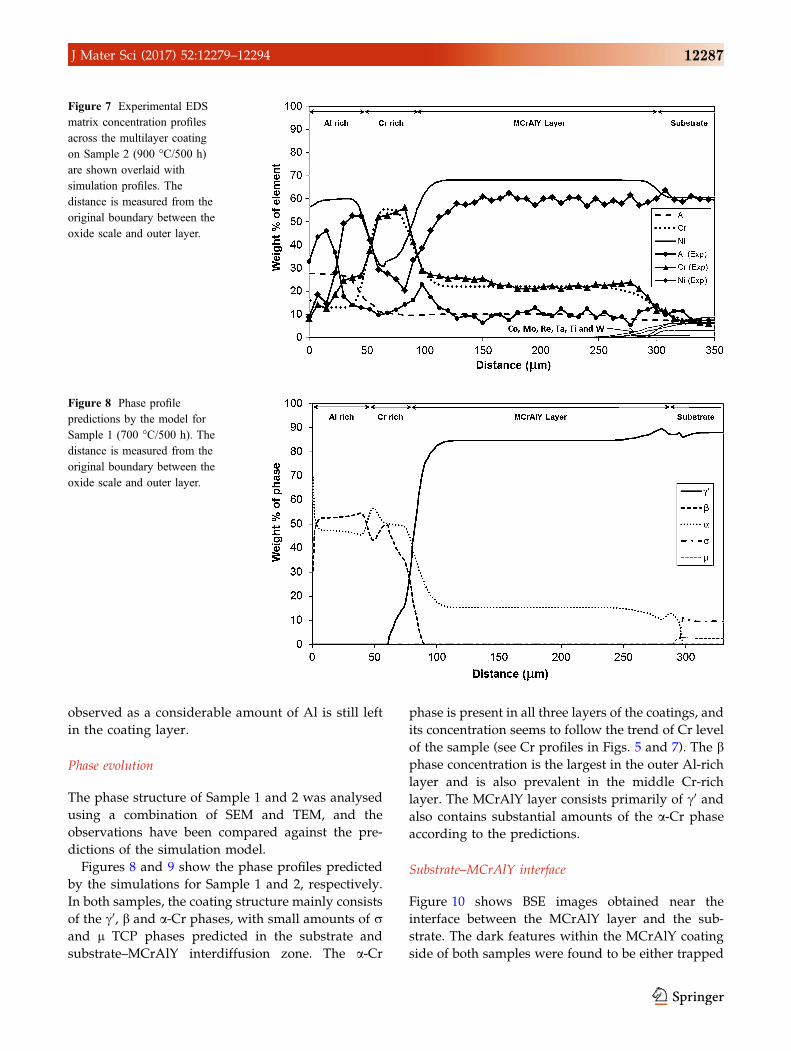
formation which was dominant at 700 �C.Figure 7 illustrates the EDS concentration profiles
of Al, Cr and Ni measured in Sample 2 (900 �C/500 h) along with the profiles predicted by the model.
The EDS measurements show a sharp rise in Al
concentration near the surface in the outer coating
layer with an associated drop in Cr and Ni concen-
tration levels. The high levels of Al, and lower Cr and
Ni, are due to the fact that EDS data have been col-
lected near an area where ingress of the alumina scale
into the outer layer of the coating has taken place.
The EDS profile reveals that a high amount of Cr still
remains in the middle, Cr-enriched layer, although
the peak concentration is somewhat lower than in
Sample 1. In addition, the Cr amount retained in the
outer Al-rich layer is much lower compared to Sam-
ple 1. There is a notable peak of Al at the Cr-rich layer
boundary with the MCrAlY layer, which was absent
in Sample 1. The Al level is flatter across the MCrAlY
and substrate material as in the case with Sample 1.
The predicted profiles for Al, Cr and Ni in the
MCrAlY- and Al-rich layers are in good agreement
with the measured EDS scans, except in predicting
the prominent small Al-peak at the MCrAlY/Cr-rich
layer boundary. However, the predictions deviate
considerably in the outer Al-enriched layer, as a
result of the current model being unable to simulate
the internal oxidation phenomena sufficiently which
has occurred in this instance. Despite this deficiency,
the model has predicted the chemical distribution
fairly accurately at both 700 and 900 �C across the
multi-layered system.
Neither the EDS profiles nor simulation predic-
tions show the presence of an Al-depleted layer near
the oxidation interface of the Al-rich outer layer
which is often seen when an MCrAlY coating system
is oxidised [11, 12]. The creation of an Al-depleted
zone is dependent on two competing factors: (a) the
depression of Al concentration at the external sur-
face due to the removal of Al by the oxidation pro-
cess and (b) the outward diffusion of Al through the
coating layer as a result of the concentration gradi-
ent created by (a). Because of the extremely high
concentration of Al present in the outer layer being
examined, the lost Al is replaced fairly easily by
diffusion and hence after 500 h no depletion zone is
Figure 6 Backscattered electron micrograph with associated energy-dispersive X-ray spectroscopy region of interest maps of Sample 2
(900 �C/500 h).
12286 J Mater Sci (2017) 52:12279–12294
observed as a considerable amount of Al is still left
in the coating layer.
Phase evolution
The phase structure of Sample 1 and 2 was analysed
using a combination of SEM and TEM, and the
observations have been compared against the pre-
dictions of the simulation model.
Figures 8 and 9 show the phase profiles predicted
by the simulations for Sample 1 and 2, respectively.
In both samples, the coating structure mainly consists
of the c0, b and a-Cr phases, with small amounts of rand l TCP phases predicted in the substrate and
substrate–MCrAlY interdiffusion zone. The a-Cr
phase is present in all three layers of the coatings, and
its concentration seems to follow the trend of Cr level
of the sample (see Cr profiles in Figs. 5 and 7). The bphase concentration is the largest in the outer Al-rich
layer and is also prevalent in the middle Cr-rich
layer. The MCrAlY layer consists primarily of c0 andalso contains substantial amounts of the a-Cr phase
according to the predictions.
Substrate–MCrAlY interface
Figure 10 shows BSE images obtained near the
interface between the MCrAlY layer and the sub-
strate. The dark features within the MCrAlY coating
side of both samples were found to be either trapped
Figure 7 Experimental EDS
matrix concentration profiles
across the multilayer coating
on Sample 2 (900 �C/500 h)
are shown overlaid with
simulation profiles. The
distance is measured from the
original boundary between the
oxide scale and outer layer.
Figure 8 Phase profile
predictions by the model for
Sample 1 (700 �C/500 h). The
distance is measured from the
original boundary between the
oxide scale and outer layer.
J Mater Sci (2017) 52:12279–12294 12287
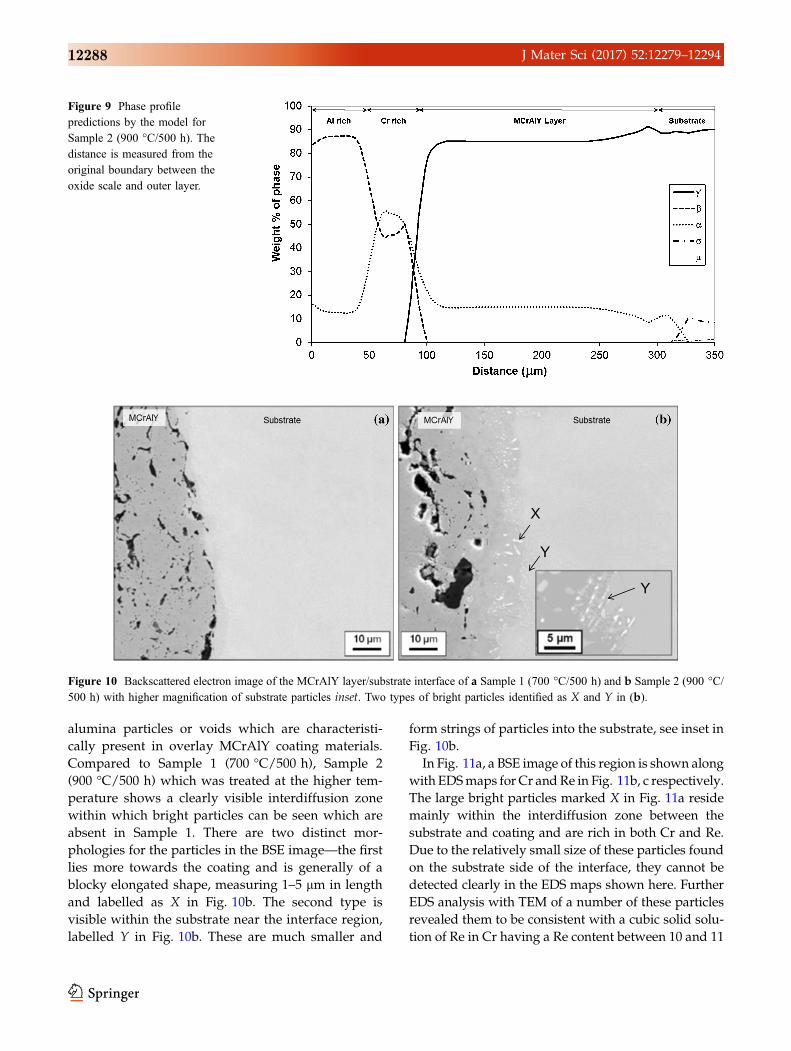
alumina particles or voids which are characteristi-
cally present in overlay MCrAlY coating materials.
Compared to Sample 1 (700 �C/500 h), Sample 2
(900 �C/500 h) which was treated at the higher tem-
perature shows a clearly visible interdiffusion zone
within which bright particles can be seen which are
absent in Sample 1. There are two distinct mor-
phologies for the particles in the BSE image—the first
lies more towards the coating and is generally of a
blocky elongated shape, measuring 1–5 lm in length
and labelled as X in Fig. 10b. The second type is
visible within the substrate near the interface region,
labelled Y in Fig. 10b. These are much smaller and
form strings of particles into the substrate, see inset in
Fig. 10b.
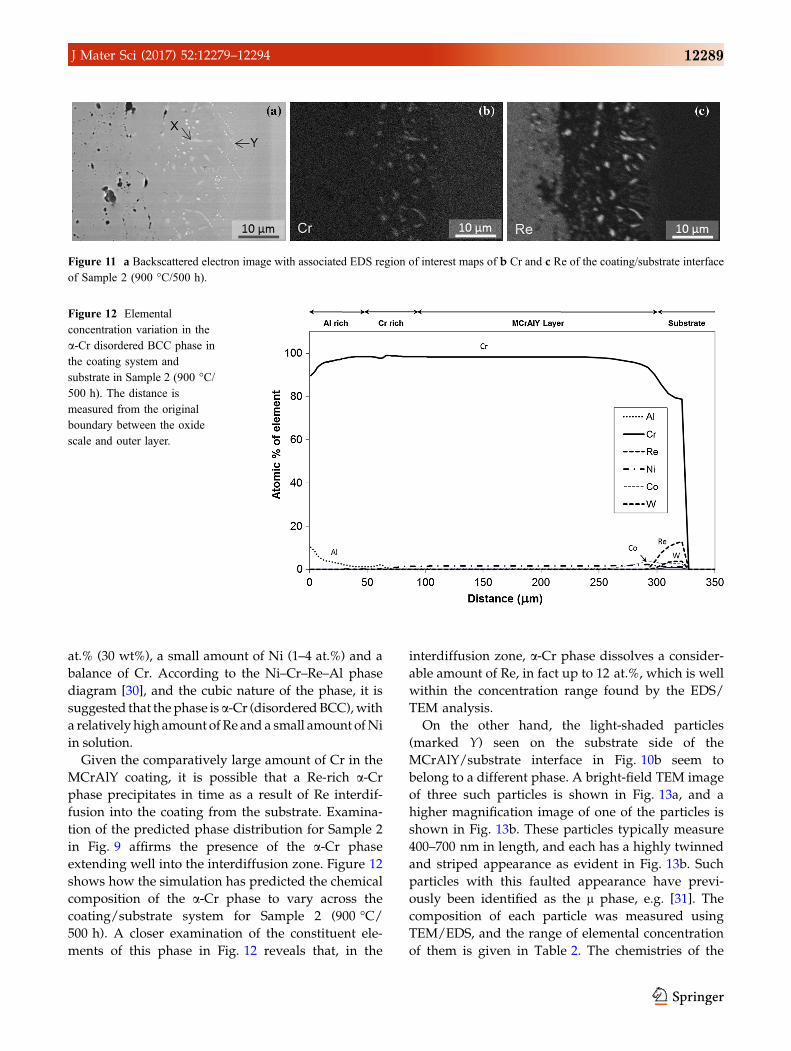
In Fig. 11a, a BSE image of this region is shown along
with EDSmaps for Cr andRe in Fig. 11b, c respectively.
The large bright particles marked X in Fig. 11a reside
mainly within the interdiffusion zone between the
substrate and coating and are rich in both Cr and Re.
Due to the relatively small size of these particles found
on the substrate side of the interface, they cannot be
detected clearly in the EDS maps shown here. Further
EDS analysis with TEM of a number of these particles
revealed them to be consistent with a cubic solid solu-
tion of Re in Cr having a Re content between 10 and 11
Figure 9 Phase profile
predictions by the model for
Sample 2 (900 �C/500 h). The
distance is measured from the
original boundary between the
oxide scale and outer layer.
Figure 10 Backscattered electron image of the MCrAlY layer/substrate interface of a Sample 1 (700 �C/500 h) and b Sample 2 (900 �C/500 h) with higher magnification of substrate particles inset. Two types of bright particles identified as X and Y in (b).
12288 J Mater Sci (2017) 52:12279–12294
at.% (30 wt%), a small amount of Ni (1–4 at.%) and a
balance of Cr. According to the Ni–Cr–Re–Al phase
diagram [30], and the cubic nature of the phase, it is
suggested that the phase is a-Cr (disorderedBCC),with
a relatively high amount ofRe and a small amount ofNi
in solution.
Given the comparatively large amount of Cr in the
MCrAlY coating, it is possible that a Re-rich a-Crphase precipitates in time as a result of Re interdif-
fusion into the coating from the substrate. Examina-
tion of the predicted phase distribution for Sample 2
in Fig. 9 affirms the presence of the a-Cr phase
extending well into the interdiffusion zone. Figure 12
shows how the simulation has predicted the chemical
composition of the a-Cr phase to vary across the
coating/substrate system for Sample 2 (900 �C/500 h). A closer examination of the constituent ele-
ments of this phase in Fig. 12 reveals that, in the
interdiffusion zone, a-Cr phase dissolves a consider-
able amount of Re, in fact up to 12 at.%, which is well
within the concentration range found by the EDS/
TEM analysis.
On the other hand, the light-shaded particles
(marked Y) seen on the substrate side of the
MCrAlY/substrate interface in Fig. 10b seem to
belong to a different phase. A bright-field TEM image
of three such particles is shown in Fig. 13a, and a
higher magnification image of one of the particles is
shown in Fig. 13b. These particles typically measure
400–700 nm in length, and each has a highly twinned
and striped appearance as evident in Fig. 13b. Such
particles with this faulted appearance have previ-
ously been identified as the l phase, e.g. [31]. The
composition of each particle was measured using
TEM/EDS, and the range of elemental concentration
of them is given in Table 2. The chemistries of the
Figure 11 a Backscattered electron image with associated EDS region of interest maps of b Cr and c Re of the coating/substrate interface
of Sample 2 (900 �C/500 h).
Figure 12 Elemental
concentration variation in the
a-Cr disordered BCC phase in
the coating system and
substrate in Sample 2 (900 �C/500 h). The distance is
measured from the original
boundary between the oxide
scale and outer layer.
J Mater Sci (2017) 52:12279–12294 12289
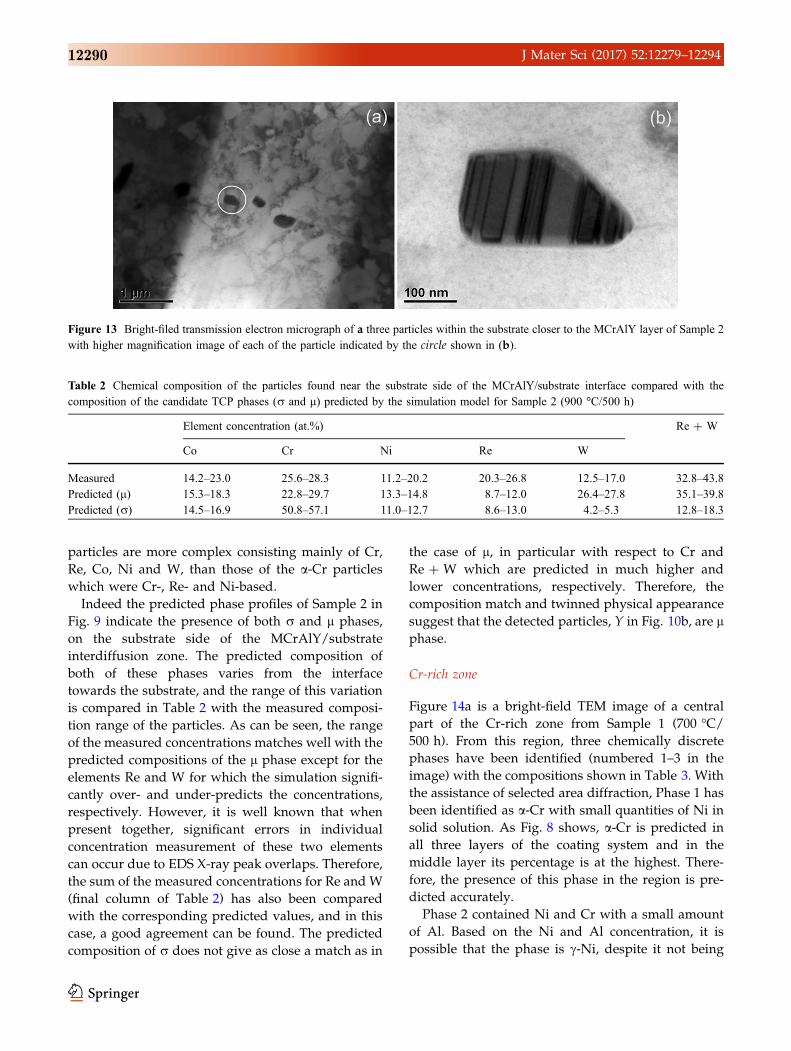
particles are more complex consisting mainly of Cr,
Re, Co, Ni and W, than those of the a-Cr particles
which were Cr-, Re- and Ni-based.
Indeed the predicted phase profiles of Sample 2 in
Fig. 9 indicate the presence of both r and l phases,
on the substrate side of the MCrAlY/substrate
interdiffusion zone. The predicted composition of
both of these phases varies from the interface
towards the substrate, and the range of this variation
is compared in Table 2 with the measured composi-
tion range of the particles. As can be seen, the range
of the measured concentrations matches well with the
predicted compositions of the l phase except for the
elements Re and W for which the simulation signifi-
cantly over- and under-predicts the concentrations,
respectively. However, it is well known that when
present together, significant errors in individual
concentration measurement of these two elements
can occur due to EDS X-ray peak overlaps. Therefore,
the sum of the measured concentrations for Re and W
(final column of Table 2) has also been compared
with the corresponding predicted values, and in this
case, a good agreement can be found. The predicted
composition of r does not give as close a match as in
the case of l, in particular with respect to Cr and
Re ? W which are predicted in much higher and
lower concentrations, respectively. Therefore, the
composition match and twinned physical appearance
suggest that the detected particles, Y in Fig. 10b, are lphase.
Cr-rich zone
Figure 14a is a bright-field TEM image of a central
part of the Cr-rich zone from Sample 1 (700 �C/500 h). From this region, three chemically discrete
phases have been identified (numbered 1–3 in the
image) with the compositions shown in Table 3. With
the assistance of selected area diffraction, Phase 1 has
been identified as a-Cr with small quantities of Ni in
solid solution. As Fig. 8 shows, a-Cr is predicted in
all three layers of the coating system and in the
middle layer its percentage is at the highest. There-
fore, the presence of this phase in the region is pre-
dicted accurately.
Phase 2 contained Ni and Cr with a small amount
of Al. Based on the Ni and Al concentration, it is
possible that the phase is c-Ni, despite it not being
Figure 13 Bright-filed transmission electron micrograph of a three particles within the substrate closer to the MCrAlY layer of Sample 2
with higher magnification image of each of the particle indicated by the circle shown in (b).
Table 2 Chemical composition of the particles found near the substrate side of the MCrAlY/substrate interface compared with the
composition of the candidate TCP phases (r and l) predicted by the simulation model for Sample 2 (900 �C/500 h)
Element concentration (at.%) Re ? W
Co Cr Ni Re W
Measured 14.2–23.0 25.6–28.3 11.2–20.2 20.3–26.8 12.5–17.0 32.8–43.8
Predicted (l) 15.3–18.3 22.8–29.7 13.3–14.8 8.7–12.0 26.4–27.8 35.1–39.8
Predicted (r) 14.5–16.9 50.8–57.1 11.0–12.7 8.6–13.0 4.2–5.3 12.8–18.3
12290 J Mater Sci (2017) 52:12279–12294
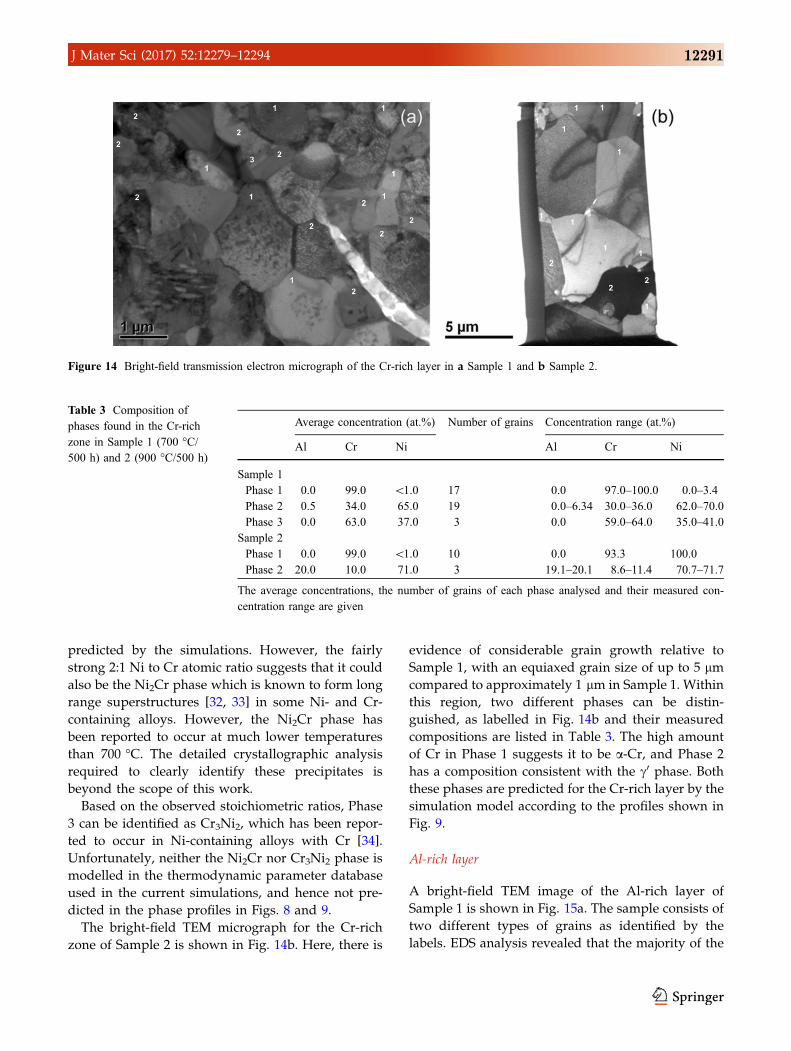
predicted by the simulations. However, the fairly
strong 2:1 Ni to Cr atomic ratio suggests that it could
also be the Ni2Cr phase which is known to form long
range superstructures [32, 33] in some Ni- and Cr-
containing alloys. However, the Ni2Cr phase has
been reported to occur at much lower temperatures
than 700 �C. The detailed crystallographic analysis
required to clearly identify these precipitates is
beyond the scope of this work.
Based on the observed stoichiometric ratios, Phase
3 can be identified as Cr3Ni2, which has been repor-
ted to occur in Ni-containing alloys with Cr [34].
Unfortunately, neither the Ni2Cr nor Cr3Ni2 phase is
modelled in the thermodynamic parameter database
used in the current simulations, and hence not pre-
dicted in the phase profiles in Figs. 8 and 9.
The bright-field TEM micrograph for the Cr-rich
zone of Sample 2 is shown in Fig. 14b. Here, there is
evidence of considerable grain growth relative to
Sample 1, with an equiaxed grain size of up to 5 lmcompared to approximately 1 lm in Sample 1. Within
this region, two different phases can be distin-
guished, as labelled in Fig. 14b and their measured
compositions are listed in Table 3. The high amount
of Cr in Phase 1 suggests it to be a-Cr, and Phase 2
has a composition consistent with the c0 phase. Boththese phases are predicted for the Cr-rich layer by the
simulation model according to the profiles shown in
Fig. 9.
Al-rich layer
A bright-field TEM image of the Al-rich layer of
Sample 1 is shown in Fig. 15a. The sample consists of
two different types of grains as identified by the
labels. EDS analysis revealed that the majority of the
Figure 14 Bright-field transmission electron micrograph of the Cr-rich layer in a Sample 1 and b Sample 2.
Table 3 Composition of
phases found in the Cr-rich
zone in Sample 1 (700 �C/500 h) and 2 (900 �C/500 h)
Average concentration (at.%) Number of grains Concentration range (at.%)
Al Cr Ni Al Cr Ni
Sample 1
Phase 1 0.0 99.0 \1.0 17 0.0 97.0–100.0 0.0–3.4
Phase 2 0.5 34.0 65.0 19 0.0–6.34 30.0–36.0 62.0–70.0
Phase 3 0.0 63.0 37.0 3 0.0 59.0–64.0 35.0–41.0
Sample 2
Phase 1 0.0 99.0 \1.0 10 0.0 93.3 100.0
Phase 2 20.0 10.0 71.0 3 19.1–20.1 8.6–11.4 70.7–71.7
The average concentrations, the number of grains of each phase analysed and their measured con-
centration range are given
J Mater Sci (2017) 52:12279–12294 12291
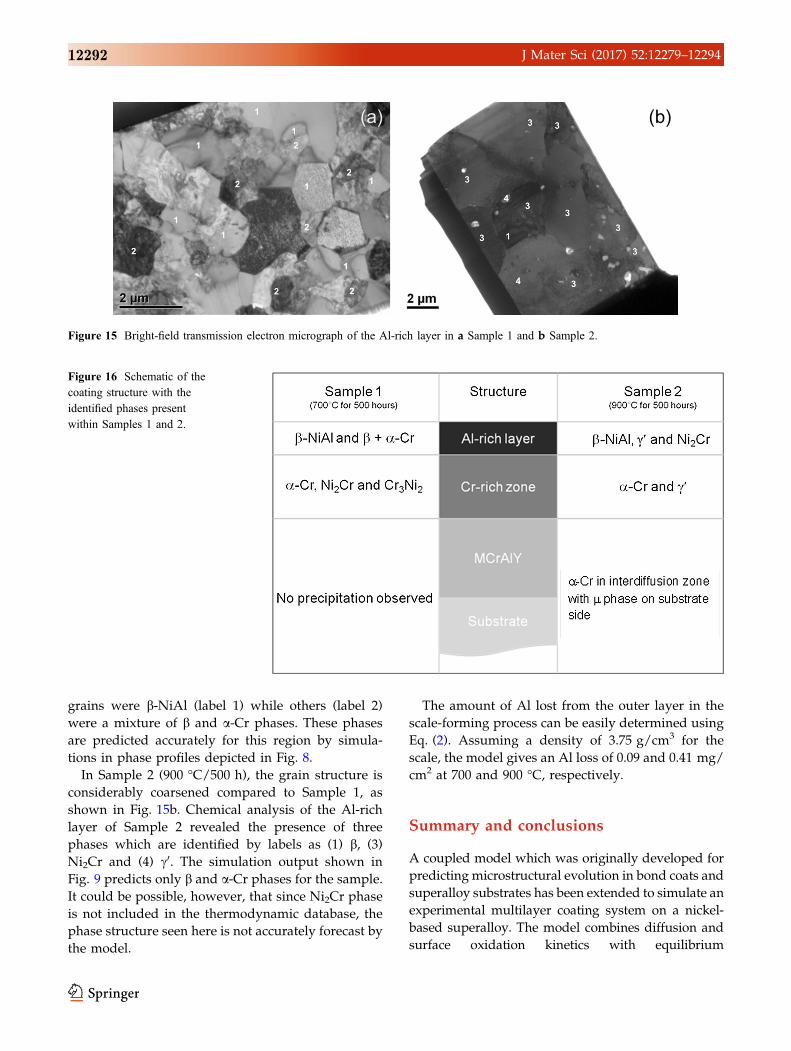
grains were b-NiAl (label 1) while others (label 2)
were a mixture of b and a-Cr phases. These phases
are predicted accurately for this region by simula-
tions in phase profiles depicted in Fig. 8.
In Sample 2 (900 �C/500 h), the grain structure is
considerably coarsened compared to Sample 1, as
shown in Fig. 15b. Chemical analysis of the Al-rich
layer of Sample 2 revealed the presence of three
phases which are identified by labels as (1) b, (3)
Ni2Cr and (4) c0. The simulation output shown in
Fig. 9 predicts only b and a-Cr phases for the sample.
It could be possible, however, that since Ni2Cr phase
is not included in the thermodynamic database, the
phase structure seen here is not accurately forecast by
the model.
The amount of Al lost from the outer layer in the
scale-forming process can be easily determined using
Eq. (2). Assuming a density of 3.75 g/cm3 for the
scale, the model gives an Al loss of 0.09 and 0.41 mg/
cm2 at 700 and 900 �C, respectively.
Summary and conclusions
A coupled model which was originally developed for
predicting microstructural evolution in bond coats and
superalloy substrates has been extended to simulate an
experimental multilayer coating system on a nickel-
based superalloy. The model combines diffusion and
surface oxidation kinetics with equilibrium
Figure 15 Bright-field transmission electron micrograph of the Al-rich layer in a Sample 1 and b Sample 2.
Figure 16 Schematic of the
coating structure with the
identified phases present
within Samples 1 and 2.
12292 J Mater Sci (2017) 52:12279–12294
thermodynamics to predict the development of con-
centrationandphaseprofilesusing theageinghistoryof
the multilayer system. The coating structure studied
consisted of an Al-rich outer layer, Cr-rich inner layer
andMCrAlY layer on top of aNi-based superalloy. The
two samples studied had undergone a controlled age-
ing at 700 and 900 �C for 500 hwhichwas simulated by
the model.
The model-predicted concentration profiles for
each ageing condition were compared with EDS
measurements, and good agreement was found for
the key elements of the multilayer structure, Al, Cr
and Ni. The phase evolution predicted by the simu-
lations was compared with the microstructure
revealed at key locations of the samples using SEM
and TEM techniques. Good agreement between
modelling and experimental results was found for a
number of important phases.
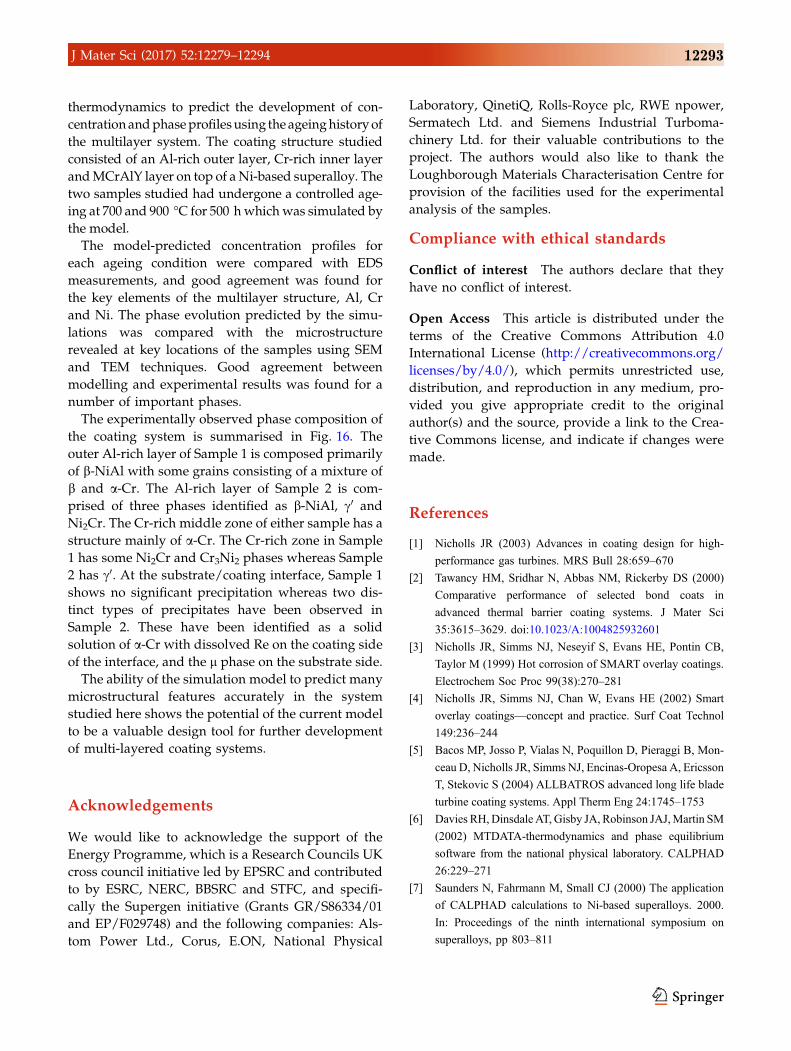
The experimentally observed phase composition of
the coating system is summarised in Fig. 16. The
outer Al-rich layer of Sample 1 is composed primarily
of b-NiAl with some grains consisting of a mixture of
b and a-Cr. The Al-rich layer of Sample 2 is com-
prised of three phases identified as b-NiAl, c0 andNi2Cr. The Cr-rich middle zone of either sample has a
structure mainly of a-Cr. The Cr-rich zone in Sample
1 has some Ni2Cr and Cr3Ni2 phases whereas Sample
2 has c0. At the substrate/coating interface, Sample 1
shows no significant precipitation whereas two dis-
tinct types of precipitates have been observed in
Sample 2. These have been identified as a solid
solution of a-Cr with dissolved Re on the coating side
of the interface, and the l phase on the substrate side.
The ability of the simulation model to predict many
microstructural features accurately in the system
studied here shows the potential of the current model
to be a valuable design tool for further development
of multi-layered coating systems.
Acknowledgements
We would like to acknowledge the support of the
Energy Programme, which is a Research Councils UK
cross council initiative led by EPSRC and contributed
to by ESRC, NERC, BBSRC and STFC, and specifi-
cally the Supergen initiative (Grants GR/S86334/01
and EP/F029748) and the following companies: Als-
tom Power Ltd., Corus, E.ON, National Physical
Laboratory, QinetiQ, Rolls-Royce plc, RWE npower,
Sermatech Ltd. and Siemens Industrial Turboma-
chinery Ltd. for their valuable contributions to the
project. The authors would also like to thank the
Loughborough Materials Characterisation Centre for
provision of the facilities used for the experimental
analysis of the samples.
Compliance with ethical standards
Conflict of interest The authors declare that they
have no conflict of interest.
Open Access This article is distributed under the
terms of the Creative Commons Attribution 4.0
International License (http://creativecommons.org/
licenses/by/4.0/), which permits unrestricted use,
distribution, and reproduction in any medium, pro-
vided you give appropriate credit to the original
author(s) and the source, provide a link to the Crea-
tive Commons license, and indicate if changes were
made.
References
[1] Nicholls JR (2003) Advances in coating design for high-
performance gas turbines. MRS Bull 28:659–670
[2] Tawancy HM, Sridhar N, Abbas NM, Rickerby DS (2000)
Comparative performance of selected bond coats in
advanced thermal barrier coating systems. J Mater Sci
35:3615–3629. doi:10.1023/A:1004825932601
[3] Nicholls JR, Simms NJ, Neseyif S, Evans HE, Pontin CB,
Taylor M (1999) Hot corrosion of SMART overlay coatings.
Electrochem Soc Proc 99(38):270–281
[4] Nicholls JR, Simms NJ, Chan W, Evans HE (2002) Smart
overlay coatings—concept and practice. Surf Coat Technol
149:236–244
[5] Bacos MP, Josso P, Vialas N, Poquillon D, Pieraggi B, Mon-
ceau D, Nicholls JR, Simms NJ, Encinas-Oropesa A, Ericsson
T, Stekovic S (2004) ALLBATROS advanced long life blade
turbine coating systems. Appl Therm Eng 24:1745–1753
[6] Davies RH,Dinsdale AT,Gisby JA, Robinson JAJ,Martin SM
(2002) MTDATA-thermodynamics and phase equilibrium
software from the national physical laboratory. CALPHAD
26:229–271
[7] Saunders N, Fahrmann M, Small CJ (2000) The application
of CALPHAD calculations to Ni-based superalloys. 2000.
In: Proceedings of the ninth international symposium on
superalloys, pp 803–811
J Mater Sci (2017) 52:12279–12294 12293
[8] Saunders N (1996) Phase diagram calculations for Ni-based
superalloys. In: Proceedings of the eighth international
symposium on superalloys, pp 101–110
[9] Wang W, Kermanpur A, Lee PD, McLean M (2003) Simu-
lation of dendritic growth in the platform region of single
crystal superalloy turbine blades. J Mater Sci 38:4385–4391.
doi:10.1023/A:1026303720544
[10] Saunders N, Miodownik AP, Schille J-P (2004) Modelling of
the thermo-physical and physical properties for solidification
of Ni-based superalloys. J Mater Sci 39:7237–7243. doi:10.
1023/B:JMSC.0000048737.32055
[11] Karunaratne MSA, Ogden SL, Kenny SD, Thomson RC
(2009) A multicomponent diffusion model for prediction of
microstructural evolution in coated Ni based superalloy
systems. Mater Sci Technol 25:287–299
[12] Karunaratne MSA, Di Martino I, Ogden SL, Oates DL,
Thomson RC (2012) Modeling of microstructural evolution
in an MCrAlY overlay coating on different superalloy sub-
strates. Metall Mater Trans A 43:774–788
[13] Karunaratne MSA, Kyaw S, Jones A, Morrell R, Thomson
RC (2016) Modelling the coefficient of thermal expansion in
Ni-based superalloys and bond coatings. J Mater Sci
51:4213–4226. doi:10.1007/s10853-015-9554-3
[14] Fick A (1855) Ueber diffusion. Ann Phys Chem 94:59–86
[15] Onsager L (1945) Theories and problems of liquid diffusion.
Ann NY Acad Sci 46:241–265
[16] Ustad T, Sorum H (1973) Interdiffusion in the Fe–Ni, Ni–Co
and Fe–Co systems. Phys Status Solidi A 20:285–294
[17] Karunaratne MSA, Reed RC (2005) Interdiffusion of nio-
bium and molybdenum in nickel between 900–1300 degrees
C. Defects Diffus Forum 237–240:420–425
[18] Komai N, Watanabe M, Horita Z, Sano T, Nemoto M (1998)
Analytical electron microscopy study of Ni/Ni-8 mol % Ti
diffusion couples. Acta Metall 46:4443–4451
[19] Karunaratne MSA, Carter P, Reed RC (2000) Interdiffusion
in the face-centred cubic phase of the Ni–Re, Ni–Ta and Ni–
W systems between 900 and 1300 Celsius. Mater Sci Eng, A
281:229–233
[20] Swalin RA, Martin RA (1956) Solute diffusion in nickel-base
substitutional solid solutions. Trans AIME 206:567–572
[21] Davin A, Leroy V, Coutsouradis D, Habraken L (1963)
Comparison of the diffusion of some substitution elements in
nickel and cobalt. Cobalt 19:51–56
[22] Ikeda T, Almazouzi A, Numakura H, Koiwa M, Sprengel W,
Nakajima H (1997) Interdiffusion in Ni3Al. Defects Diffus
Forum 143–147:275–278
[23] St Frank, Sodervall U, Chr Herzig (1997) Self- and impurity
diffusion of Ni, Ga, Ge, Ti, Nb and B in the L12-type
intermetallic compound Ni3Al. Defects Diffus Forum
143–147:245–250
[24] Minamino Y, Jung SB, Yamane T, Hirao K (1992) Diffusion
of cobalt, chromium and titanium in Ni/Ni3Al. Metall Mater
Trans A 23:2783–2790
[25] Wei H, Sun XF, Zheng Q, Guan HR, Hu ZQ (2004) Esti-
mation of interdiffusivity of the NiAl phase in Ni–Al binary
system. Acta Mater 52:2645–2651
[26] Meier SM, Nissley DM, Sheffler KD (1991) Thermal barrier
coating life prediction model development, (phase II final
report). NASA Lewis Research Center, National Aeronautics
and Space Administration. NASA Contractor Report.
18911/NAS3-23944
[27] Davies RH, Dinsdale AT, Gisby JA (1998) MTDATA
handbook: application interface programming guide.
National Physical Laboratory. Teddington, Middlesex TW11
0LW, UK
[28] Murray WD, Landis F (1959) Numerical and machine
solutions of transient heat-conduction problems involving
melting or freezing part I-method of analysis and sample
solutions. Trans ASME 81:106–112
[29] Starink MJ, Thomson RC (2001) The effect of high tem-
perature exposure on dendritic segregation in a convention-
ally cast Ni based superalloy. J Mater Sci 36:5603–5608.
doi:10.1023/A:1012513615622
[30] Huang W, Chang YA (1999) A thermodynamic description
of the Ni–Al–Cr–Re system. Mater Sci Eng, A 259:110–119
[31] Karunaratne MSA, Rae CF, Reed RC (2001) The
Microstructural instability of an experimental nickel-base
superalloy. Metall Mater Trans A 32:2409–2421
[32] Baer HG (1958) Uberstruktur und K-Zustand im system
nickel–chrom. Z Metallkd 49:614–622
[33] Bagaryatskii YA, Tiapkin YD (1958) The atomic structure of
solid solutions of chromium in nickel. Dokl Akad Nauk
SSSR 122(5):806–809
[34] Xie Y, Zhou L, Guo J, Ye H (2008) Effect of heat treatment
on the microstructure of multiphase NiAl-based alloy.
J Mater Sci Technol 24:245–250
12294 J Mater Sci (2017) 52:12279–12294