
Literature review on the impacts on Environment …...Literature review on the impacts on...
202
i Literature review on the impacts on Environment Protection and Biodiversity Conservation Act 1999 (Cth) protected species by large mid-water trawl vessels. Prepared for The Department of Sustainability, Environment, Water, Population and Communities on behalf of the Expert Panel on a Declared Commercial Fishing Activity. GPO Box 787, Canberra, ACT, 2601 6 March 2015 PROJECT REFERENCE: JN13076 Elgin Associates Pty Ltd ABN 59123488639
Transcript of Literature review on the impacts on Environment …...Literature review on the impacts on...
i
Literature review on the impacts on Environment Protection and Biodiversity Conservation Act 1999 (Cth) protected species by large mid-water trawl
vessels.
Prepared for
The Department of Sustainability, Environment, Water, Population and Communities on behalf of the Expert Panel on a Declared Commercial Fishing Activity.
GPO Box 787, Canberra, ACT, 2601
6 March 2015 PROJECT REFERENCE: JN13076
Elgin Associates Pty Ltd
ABN 59123488639

ii
Document Information
Authors: Luke Finley (Elgin Associates Pty Ltd)
Rebecca McIntosh (Elgin Associates Pty Ltd)
Sheryl Hamilton (Latitude 42 Environmental Consultants Pty Ltd)
Barry Baker (Latitude 42 Environmental Consultants Pty Ltd)
Citation: Finley, L., McIntosh, R., Hamilton, S. and Baker, B. (2013). Literature Review on the impacts on Environment Protection and Biodiversity Conservation Act 1999 (Cth) protected species by large mid-water trawl vessels.’ Report prepared by Elgin Associates for the Department of Sustainability, Environment, Water, Population and Communities (on behalf of the expert panel) 17 June 2013.
Submission Date: 6 March 2015
Project: Elgin JN13076: Literature Review: Impacts on Environment Protection and Biodiversity Conservation Act 1999 protected species by large mid-water trawl vessels
Contact: Elgin Associates Pty Ltd ABN 59123488639 Level 4, 11 Morrison St, Hobart, TAS, 7000 Telephone: +61 417 598807 Fax: +61 3 86486336 www.elgin.com.au
Record of Report Distribution
No of copies
Status Date Prepared for:
1 Digital Draft 27 May 2013 Expert Panel
1 Digital Final (Rev1) 17 June 2013 Expert Panel
1 Digital Final (Rev2) 6 March 2015 Department of the Environment
1 Digital Final (Rev2) 9 July 2015 Department of the Environment (public release)

iii
Contents
1 Pinnipeds ....................................................................................................................................... 1 1.1 Brief Description ................................................................................................................................ 3 1.2 Pinnipeds at risk of interactions with large pelagic trawlers in Australian waters ........................... 3
1.2.1 Australian fur seal (Arctocephalus pusillus doriferus) ............................................................... 3 1.2.2 New Zealand fur seal (Arctophoca forsteri) ............................................................................... 4 1.2.3 Australian sea lion (Neophoca cinerea) ..................................................................................... 5 1.2.4 Southern elephant seal (Mirounga leonina).............................................................................. 7
1.3 Conservation status of the species nationally ................................................................................... 9 1.4 Description of the nature and extent of interactions between trawl fisheries and group/species ... 9
1.4.1 Incidental bycatch in fisheries ................................................................................................... 9 1.4.2 Entanglement in discarded netting ........................................................................................... 9 1.4.3 Prey depletion and habitat degradation ................................................................................. 10 1.4.4 Changes to pinniped behaviour during or following fishing activities .................................... 11 1.4.5 Illegal culling ............................................................................................................................ 11
1.5 International interactions between pinnipeds and trawl fisheries .................................................. 11 1.5.1 What is the result of interactions between group and trawl gear/fishing operations ........... 11 1.5.2 International - South America, South Africa, United States of America ................................. 12 1.5.3 International - New Zealand .................................................................................................... 13
1.6 Australian interactions between pinnipeds and trawl fisheries ...................................................... 16 1.6.1 Southern and Eastern Scalefish and Shark Fishery (SESSF) ..................................................... 17 1.6.2 Small Pelagic Fishery (SPF) ....................................................................................................... 19
1.7 Are there any bycatch mitigation devices or measures? ................................................................. 19 1.7.1 Exclusion devices ..................................................................................................................... 20 1.7.2 Observer programs, Bycatch Limits, Codes of Conduct, Vessel Management Plans and Spatial and Temporal fishery closures ................................................................................................................ 24 1.7.3 Has the effectiveness of mitigation measures being investigated? ........................................ 26 1.7.4 Are there organisations working on mitigation? ..................................................................... 33
1.8 Recommended management needs and research ideas ................................................................. 33 1.9 Limitations in the review process .................................................................................................... 35 1.10 References (Pinnipeds) ..................................................................................................................... 36
2 Cetaceans ..................................................................................................................................... 44 2.1 Brief description ............................................................................................................................... 46 2.2 Large whales at risk of interactions with large pelagic trawlers in Australian waters ................... 46
2.2.1 Sei whale (Balaenoptera borealis) ........................................................................................... 46 2.2.2 Blue whale (Balaenoptera musculus) ...................................................................................... 47 2.2.3 Fin whale (Balaenoptera physalus).......................................................................................... 47 2.2.4 Southern right whale (Eubalaena australis) ............................................................................ 48 2.2.5 Humpback whale (Megaptera novaeangliae) ......................................................................... 48 2.2.6 Bryde’s whale (Balaenoptera edeni)........................................................................................ 49 2.2.7 Sperm whale (Physeter macrocephalus) ................................................................................. 50
2.3 Small cetaceans at risk of interactions with large pelagic trawlers in Australian waters ............... 50 2.3.1 Common dolphin (Delphinus delphis)...................................................................................... 50 2.3.2 Bottlenose dolphin (Tursiops truncatus) ................................................................................. 51 2.3.3 Indo-Pacific (IP) bottlenose dolphin (Tursiops aduncus) ......................................................... 51

iv
2.3.4 Striped dolphin (Stenella coeruleoalba) .................................................................................. 52 2.3.5 Risso's dolphin (Grampus griseus) ........................................................................................... 52 2.3.6 Fraser's dolphin (Lagenodelphis hosei) ................................................................................... 53 2.3.7 Hourglass dolphin (Lagenorhynchus cruciger) ........................................................................ 53 2.3.8 Southern right whale dolphin (Lissodelphis peronii) ............................................................... 53 2.3.9 Pantropical spotted dolphin (Stenella attenuata) ................................................................... 54 2.3.10 Dusky dolphin (Lagenorhynchus obscurus) ............................................................................. 54 2.3.11 Short-finned pilot whale (Globicephala macrorhynchus) ........................................................ 55 2.3.12 Long-finned pilot whale (Globicephala melas) ........................................................................ 55 2.3.13 Killer whale (Orcinus orca) ....................................................................................................... 56
2.4 Conservation status of the species nationally ................................................................................. 56 2.5 Description of the nature and extent of interactions between cetaceans and trawl fisheries ........ 56
2.5.1 Incidental bycatch in fisheries ................................................................................................. 56 2.5.2 Entanglement in discarded netting ......................................................................................... 59 2.5.3 Boat strike ................................................................................................................................ 59 2.5.4 Vessel noise ............................................................................................................................. 60 2.5.5 Predation of cetaceans ............................................................................................................ 60 2.5.6 Prey depletion ......................................................................................................................... 60 2.5.7 Changes to cetacean behaviour during or following fishing activities .................................... 61
2.6 International interactions between cetaceans and trawl fisheries ................................................. 61 2.6.1 United States ........................................................................................................................... 61 2.6.2 North-east Atlantic (Western Europe) .................................................................................... 62 2.6.3 Mediterranean and Black Seas ................................................................................................ 62 2.6.4 Western Africa ......................................................................................................................... 63 2.6.5 Latin America (South-western Atlantic Ocean, Southern South America, Eastern South Pacific) 64 2.6.6 New Zealand ............................................................................................................................ 64
2.7 Australian interactions between cetaceans and trawl fisheries ...................................................... 65 2.7.1 What is the result of interactions between cetaceans and trawl gear / fishing operations ... 66 2.7.2 Tasmania and the Small Pelagic Fishery (SPF) ......................................................................... 66 2.7.3 Western Australian Pilbara Trawl Fishery ............................................................................... 66 2.7.4 Regional differences in the groups impacted by trawl fisheries ............................................. 67
2.8 Cetacean bycatch mitigation devices / measures? ......................................................................... 67 2.8.1 Internationally ......................................................................................................................... 67 2.8.2 Nationally ................................................................................................................................. 70
2.9 Has the effectiveness of mitigation measures been investigated? ................................................. 71 2.10 Are there organisations working on mitigation? ............................................................................. 72
2.10.1 Success stories? ....................................................................................................................... 73 2.11 Gaps in the literature and areas of research to address these ........................................................ 73 2.12 Reliability of data / source of information....................................................................................... 74 2.13 Limitations in the review process .................................................................................................... 74 2.14 References (Cetaceans).................................................................................................................. 106
3 Sharks ........................................................................................................................................ 112 3.1 Brief description ............................................................................................................................. 114 3.2 Sharks at risk of interactions with large pelagic trawlers in Australian waters ............................ 114
3.2.1 Grey Nurse Shark (Carcharias taurus) – East coast population ............................................. 114
v
3.2.2 Grey Nurse shark (Carcharias taurus) – West coast population ........................................... 115 3.2.3 Whale shark (Rhincodon typhus) ........................................................................................... 115 3.2.4 White shark (Carcharodon carcharias) .................................................................................. 116 3.2.5 Basking shark (Cetorhinus maximus) ..................................................................................... 117 3.2.6 School shark (Galeorhinus galeus)......................................................................................... 117 3.2.7 Longfin Mako shark (Isurus paucus) ...................................................................................... 118 3.2.8 Shortfin Mako shark (Isurus oxyrinchus) ............................................................................... 118 3.2.9 Porbeagle or Mackerel Shark (Lamna nasus) ........................................................................ 118 3.2.10 Other species of conservation interest that may be listed in future? ................................... 119
3.3 Description of the nature and extent of interactions between sharks and trawl fisheries ........... 119 3.3.1 Risk of sharks being captured in mid-water trawl gear ......................................................... 120 3.3.2 The implications for sharks captured in a trawl net .............................................................. 120 3.3.3 Risk to sharks of entanglement in discarded netting ............................................................ 121 3.3.4 Risk of sharks to boat strike ................................................................................................... 121 3.3.5 Does vessel noise affect sharks? ........................................................................................... 122
3.4 International interactions between sharks and trawl fisheries ..................................................... 122 3.4.1 United States ......................................................................................................................... 122 3.4.2 Western Africa ....................................................................................................................... 122 3.4.3 Asia ........................................................................................................................................ 123 3.4.4 Mediterranean ....................................................................................................................... 123 3.4.5 South America ....................................................................................................................... 124 3.4.6 Atlantic Ocean ....................................................................................................................... 124 3.4.7 Indian Ocean .......................................................................................................................... 125 3.4.8 New Zealand .......................................................................................................................... 125
3.5 Australian interactions between sharks and trawl fisheries ......................................................... 126 3.5.1 Spatial overlap between shark distribution and fishing zones of the Small Pelagic Fishery . 126
3.6 What is the result of interactions between sharks and trawl gear / fishing operations ............... 126 3.6.1 Impact of trawling on survivorship of shark bycatch ............................................................ 127 3.6.2 Effect of discards on shark behaviour ................................................................................... 127 3.6.3 Regional differences in the groups impacted by trawl fisheries ........................................... 128
3.7 Shark bycatch mitigation devices/measures and their effectiveness ............................................ 129 3.7.1 Turtle Excluder Device – Northern Prawn Trawl, Australia ................................................... 129 3.7.2 Tunnel excluder and filter grid - Mauritania ......................................................................... 129 3.7.3 Turtle excluder – United States ............................................................................................. 129 3.7.4 Size selection by mitigation devices ...................................................................................... 130 3.7.5 Other research regarding influence of BRDs and TEDS on shark bycatch ............................. 130 3.7.6 Novel research and lessons from non-trawl fisheries ........................................................... 131
3.8 National guidelines for mitigating shark bycatch.......................................................................... 132 3.9 Are there organisations working on mitigation? ........................................................................... 133
3.9.1 Success stories? ..................................................................................................................... 134 3.10 Suggested areas of research to address gaps in knowledge ......................................................... 134 3.11 Conclusion ...................................................................................................................................... 136 3.12 Limitations ..................................................................................................................................... 137 3.13 References (Sharks) ....................................................................................................................... 138
4 Seabirds ..................................................................................................................................... 144 4.1 Brief description ............................................................................................................................. 146

vi
4.2 Seabirds at risk of interactions with large pelagic trawlers in Australian waters ......................... 147 4.3 Conservation status of the species nationally ............................................................................... 147 4.4 Incidental bycatch in fisheries........................................................................................................ 150
4.4.1 Trawl bycatch ......................................................................................................................... 150 4.4.2 Spatial overlap between seabird distribution and fishing zones........................................... 151 4.4.3 Illegal culling .......................................................................................................................... 151 4.4.4 Prey depletion and competition for food .............................................................................. 151 4.4.5 Dependence on fishery discards and offal discharge ............................................................ 151
4.5 Australian interactions between seabirds and trawl fisheries ...................................................... 152 4.5.1 Southern and Eastern Scalefish and Shark Fishery (SESSF) ................................................... 153 4.5.2 Small Pelagic Fishery (SPF) ..................................................................................................... 154
4.6 Are there any bycatch mitigation devices or measures? ............................................................... 154 4.6.1 Internationally ....................................................................................................................... 154 4.6.2 Nationally ............................................................................................................................... 156
4.7 Are there organisations working on mitigation? If so, who and what. ......................................... 157 4.8 Suggested areas of research to address gaps in knowledge ......................................................... 157 4.9 Reliability of data / source of information..................................................................................... 158 4.10 Limitations in the review process .................................................................................................. 158 4.11 References (Seabirds) .................................................................................................................... 159 4.12 Appendix 4.1: ACAP Review of Seabird Bycatch Mitigation Measures for Trawl Fisheries ........... 165
5 Turtles ........................................................................................................................................ 166 5.1 Brief description ............................................................................................................................. 168 5.2 Turtles at risk of interactions with large pelagic trawlers in Australian waters ............................ 169
5.1.1 Loggerhead turtle (Caretta caretta) ...................................................................................... 169 5.1.2 Leatherback turtle (Dermochelys coriacea) ........................................................................... 170 5.1.3 Green turtle (Chelonia mydas) .............................................................................................. 171 5.1.4 Hawksbill turtle (Eretmochelys imbricata) ............................................................................ 172
5.3 Conservation status of the species nationally ............................................................................... 173 5.4 Description of the nature and extent of interactions between turtles and trawl fisheries ........... 173 5.5 International interactions between turtles and trawl fisheries ..................................................... 173
5.1.5 United States ......................................................................................................................... 173 5.1.6 Mauritania ............................................................................................................................. 175 5.1.7 Mediterranean ....................................................................................................................... 175
5.6 Australian interactions between turtles and trawl fisheries ......................................................... 175 5.1.8 Northern Prawn Fishery ........................................................................................................ 176 5.1.9 East Coast Otter Trawl Fishery .............................................................................................. 176 5.1.10 Ocean Trawl Fishery off N.S.W. ............................................................................................. 177 5.1.11 Coral Sea Fishery .................................................................................................................... 177
5.7 Threats to turtles by fishing operations or other risks ................................................................... 177 5.1.12 Boat strike .............................................................................................................................. 177 5.1.13 Marine debris ........................................................................................................................ 178
5.8 Regional differences in the groups impacted by trawl fisheries .................................................... 178 5.1.14 In the Small Pelagic Fishery (SPF) .......................................................................................... 179
5.9 Are there any turtle mitigation devices or measures?................................................................... 179 5.1.15 Turtle exclusion devices......................................................................................................... 179 5.1.16 Spatial and temporal area closures ....................................................................................... 181

vii
5.1.17 Vessel communication ........................................................................................................... 182 5.1.18 TurtleWatch ........................................................................................................................... 182 5.1.19 Turtle catch limits and triggers .............................................................................................. 182 5.1.20 Trade embargos ..................................................................................................................... 183 5.1.21 Observer programs and logbook data ................................................................................... 183 5.1.22 Individual Vessel Management Plans .................................................................................... 184 5.1.23 Reduced tow times ................................................................................................................ 184 5.1.24 Resuscitation and Release ..................................................................................................... 184 5.1.25 Mitigation and Loggerhead turtles ........................................................................................ 185
5.10 National application of mitigation methods ................................................................................. 185 5.11 Is the effectiveness of mitigation measures being investigated? .................................................. 186
5.1.26 Internationally ....................................................................................................................... 186 5.1.27 Nationally ............................................................................................................................... 187
5.12 Recommended management needs or research ideas .................................................................. 187 5.13 Conclusion ...................................................................................................................................... 189 5.14 Limitations in the review process .................................................................................................. 189 5.15 References (Turtles) ....................................................................................................................... 192
1
1 Pinnipeds
Literature review on the impacts on Environment Protection and Biodiversity Conservation Act 1999 (Cth)
protected species by large mid-water trawl vessels.
Chapter 1: Pinnipeds
Prepared for
The Department of Sustainability, Environment, Water, Population and Communities on behalf of the Expert Panel on a Declared Commercial Fishing Activity.
GPO Box 787, Canberra, ACT, 2601
Project Reference: JN13076
Elgin Associates Pty Ltd
ABN 59123488639

2
Chapter Information
Chapter written by: Sheryl Hamilton (Latitude 42 Environmental Consultants Pty Ltd)
Reviewed by: Barry Baker (Latitude 42 Environmental Consultants Pty Ltd)
Luke Finley (Elgin Associates Pty Ltd)
Rebecca McIntosh (Elgin Associates Pty Ltd)
Project: Elgin JN13076: Literature Review: Impacts on Environment Protection and Biodiversity Conservation Act 1999 protected species by large mid-water trawl vessels
Contact: Elgin Associates Pty Ltd ABN 59123488639 Level 4, 11 Morrison St, Hobart, TAS, 7000 Telephone: +61 417 598807 Fax: +61 3 86486336 www.elgin.com.au
3
1. Pinnipeds
1.1 Brief Description
Pinnipeds are aquatic carnivorous mammals that come ashore to breed, give birth, and nurse their young. They tend to be highly mobile, opportunistic predators that utilise a wide range of benthic and pelagic foraging habitats, and base their foraging strategies on prior experience and situational decision-making (Baylis et al. 2008). They forage in shallow coastal waters, across the continental shelf and in oceanic waters beyond the shelf edge.
Three families of living pinnipeds are recognized: Phocidae (earless seals or true seals), Otaridae (eared or fur seals and sea lions) and Odobenidae (walrus). This literature review focuses on pinnipeds that are at high risk of interaction with factory trawlers in Australia and specifically in the Small Pelagic Fishery (SPF) area. Of the ten species of seals that occur in Australian waters (including the Australian Antarctic Territory, Macquarie Island, Heard Island and MacDonald Island), three (all otariid species) are known to occur in the SPF area: Australian sea lions (Neophoca cinerea), New Zealand fur seals (Arctophoca forsteri) and Australian fur seals (Arctocephalus pusillus doriferus) (Table 1.1).
In Australia, the southern elephant seal, Mirounga leonina, predominantly breeds on sub-Antarctic Macquarie Island. This species historically bred in Tasmania on King Island but the population was exterminated by the sealing industry (DPIPWE 2012b). There have been several births of southern elephant seals recorded in Tasmania in recent years (DPIPWE 2012b). As breeding numbers potentially increase around Tasmania in the future, there is the potential for this species to interact with fisheries in southern Australia. Therefore, a brief species profile for the southern elephant seal is provided. However, as the southern elephant seal is not currently at high risk of interaction with factory trawlers in the SPF region, no further specific consideration has been given to this species in this review.
Another six species have been recorded in the region (sub-antarctic fur seal Arctophoca tropicalis, Antarctic fur seal Arctophoca gazella , crab-eater seal Lobodon carcinophagus, leopard seal Hydrurga leptonyx, Ross seal Ommatophoca rossi and Weddell seal Leptonychotes weddelli) but, as these species primarily breed on Antarctic pack-ice or sub-Antarctic Australian territories and only occasionally haul out on southern Australian beaches or reefs (DSEWPaC 2012a), they are not included in this review.
The species descriptions below provide population numbers that are typically based on estimates of annual pup production because there are more of this age class ashore at any one time compared to juveniles or adults, and they are easily surveyed (Shaughnessy et al. 2011; McIntosh et al. 2012).
1.2 Pinnipeds at risk of interactions with large pelagic trawlers in Australian waters
1.2.1 Australian fur seal (Arctocephalus pusillus doriferus)
Conservation status: Listed as marine under the EPBC Act (Table 1.1).
Population estimate: The Australian fur seal is found from the coast of New South Wales, down around Tasmania to Victoria and South Australia (Shaughnessy 1999). Australian fur seals are endemic to south-eastern Australian waters and mostly breed on Bass Strait islands in Tasmania and Victoria (Kirkwood et al. 2005).
In 2007, Australian fur seal pups were recorded at 20 locations: 10 previously known colonies, 3 new colonies and 7 haul-out sites where pups are occasionally born (Kirkwood et al. 2010). The 10 established colonies were in Victoria (Lady Julia Percy Island, Seal Rocks, The Skerries, Kanowna Island), Tasmania

4
(Judgment Rocks, Moriarty Rocks, Reid Rocks, West Moncoeur Island, Tenth Island) and South Australia (North Casuarina Island, Shaughnessy et al. 2010). Two colonies adjacent to the Victorian coast, Seal Rocks and Lady Julia Percy Island, accounted for 51% of live pups estimated (Kirkwood et al. 2010). It was estimated that a total of 26,000 Australian fur seal pups were born in 2007. Applying a multiplier to translate pup numbers into an estimate of population size resulted in a conservative population estimate of 120,000 individuals (Kirkwood et al. 2010).
Distribution and key habitats within Australian waters: Australian fur seals forage over the continental shelf and do not appear to use waters greater than 200 m (Goldsworthy and Page 2009). The estimated at-sea spatial distribution of Australian fur seal annual prey consumption in south-eastern Australian waters is shown in Figure 4 of Goldsworthy et al. (2003).
An additional distribution map for the Australian fur seal can be found at the IUCN Red List http://maps.iucnredlist.org/map.html?id=2060 (Hofmeyr and Gales 2008).
Feeding and/or breeding ecology relevant to interactions in the SPF: Australian fur seals in Bass Strait and southern Tasmania are predominately benthic feeders and consume a wide range of pelagic fish and cephalopod species (Hindell and Pemberton 1997; Goldsworthy et al. 2003; Hume et al. 2004; in Shaughnessy et al. 2010). Dietary studies of males on Kangaroo Island also indicate that they mainly feed on benthic and demersal species (redbait, leatherjacket, red rock cod, jack mackerel and flathead) which occur on or near the benthos (Page et al. 2005). Redbait, jack mackerel and blue mackerel are important prey species for Australian fur seals from Seal Rocks, Lady Julia Percy Island and The Skerries (Deagle et al. 2009).
Risk profile: The Australian fur seal distribution overlaps with the fishing zones of the SPF particularly Zones D, A and C. There is a risk of direct interaction with trawl fishing operations.
Small pelagic fish (e.g. redbait, jack and blue mackerel) are important in the diet of the Australian fur seal.
The Australian fur seal population is stable or increasing.
1.2.2 New Zealand fur seal (Arctophoca forsteri)
Conservation status: Listed as marine under the EPBC Act (Table 1.1).
Population estimate: The New Zealand fur seal is found in West Australia, South Australia, Tasmania and New Zealand. In Australia, New Zealand fur seals mainly breed on rocky islands off South Australia and the southern coast of Western Australia. Large breeding populations (more than 80% of the national pup production for the species) are found in South Australian waters at North and South Neptune Islands, Kangaroo Island and Liguanea Island (Goldsworthy and Page 2009, DSEWPaC 2012a). Since 1989 (24 years of monitoring), pup numbers in the Cape Gantheaume Wilderness Protection Area, Kangaroo Island, South Australia have increased by more than 10.6% per annum (Goldsworthy and Shaughnessy 2013).
In Tasmania, the New Zealand fur seal mainly occurs on the west and south coasts with a small number breeding on remote islands off the south coast. The total population in Tasmania is 350-450 with about 100 pups born annually (DPIPWE 2012a). The New Zealand fur seal is listed as rare under Tasmania’s Threatened Species Protection Act 1995 due the small population in this state.
Western Australian colonies are centred on the islands of the Recherche Archipelago with the westernmost population near Cape Leeuwin. It is thought that the range of the species is expanding in Western Australia with greater numbers of animals hauling out and breeding on the south-west coast in recent years (Goldsworthy and Page 2009; DSEWPaC 2012a).

5
In 1998/99, the total population estimate of New Zealand fur seals in Western Australia was 15,100 (Gales et al. 2000). Based on an annual pup production of 17,622, the total population estimate of New Zealand fur seals in South Australia is estimated to be >83,800 (Goldsworthy and Page 2007).
Distribution and key habitats within Australian waters: New Zealand fur seal pup foraging activity is localised to near-colony waters (Baylis et al. 2005). Satellite tracking of New Zealand fur seals from Cape Gantheaume indicates adult females forage on the continental shelf, adult males generally forage over the continental shelf slope, and juveniles forage predominantly in oceanic waters 200–1,500 km from Kangaroo Island (Page et al. 2006).
During the austral autumn, lactating New Zealand fur seals from Cape Gantheaume mainly foraged on the continental shelf (114 ± 44 km from the colony), in a region associated with the Bonney upwelling and, during winter months, mainly foraged in oceanic waters in a region associated with the Subtropical Front (460 ± 138 km from the colony) (Baylis et al. 2008).
The estimated distribution of foraging effort by New Zealand fur seals in South Australia is presented in Figure 2 in Goldsworthy and Page (2007). Some degree of foraging effort occurs in all shelf, slope and oceanic waters off South Australia (Goldsworthy and Page 2007). See also Figures 4, 5 and 6 in Goldsworthy and Page (2009) showing estimated at-sea distribution of adult male, adult female and juvenile New Zealand fur seals in South Australian waters.
An additional distribution map for the New Zealand fur seal can be found at the IUCN Red List http://maps.iucnredlist.org/map.html?id=41664 (Goldsworthy and Gales 2008a).
Feeding and/or breeding ecology relevant to interactions in the SPF: New Zealand fur seals feed on fish (e.g. redbait and jack mackerel), squid and also seabirds in pelagic waters along the continental shelf, although adult male fur seals also forage in deeper waters (Goldsworthy and Page 2009).
Dietary studies of New Zealand fur seals that hauled out on Kangaroo Island indicated that some adult females foraged near the benthos, with benthic prey species comprising an average of 16.5% of their diet (Page et al. 2005).
Risk profile: The New Zealand fur seal distribution overlaps with the fishing zones of the SPF, predominantly in South Australian waters and particularly in the vicinity of SE, S and SW of Kangaroo Island and Lower Eyre Peninsula and the Bonney Upwelling. There is a risk of direct interaction with trawl fishing operations.
The New Zealand fur seal population is increasing and range is expanding although the population in southern Tasmania is listed as rare under Tasmanian state legislation.
1.2.3 Australian sea lion (Neophoca cinerea)
Conservation status: Listed as Vulnerable and marine under the EPBC Act (Table 1.1).
Population estimate: The Australian sea lion is Australia’s only endemic seal species and its least numerous. The breeding range extends from Houtman Abrolhos Islands, Western Australia to The Pages Islands, east of Kangaroo Island, South Australia (Gales et al. 1994). The Australian sea lion population has not recovered from past hunting, and it appears that sub-populations at some breeding sites may be in decline (Goldsworthy et al. 2009).
Most of the known Australian sea lion colonies are small, producing less than 25 pups per breeding season. Eight breeding colonies (all in South Australia) produce more than 100 pups each year (Goldsworthy et al. 2009; DSEWPaC 2012a).

6
In South Australia, based on surveys between 2004 and 2008 for 39 breeding colonies and 9 haul-out sites where pups are recorded occasionally, it was estimated that 3,119 Australian sea lion pups were born per breeding cycle (Shaughnessy et al. 2011). With the addition of 503 pups produced in Western Australia, the overall estimate of pup abundance for the species is 3,622 which, based on a multiplier of 4.08, gives a total Australian population estimate of 14,780 animals (Shaughnessy et al. 2011).
Distribution and key habitats within Australian waters: The estimated distribution of foraging effort by Australian sea lions in South Australia is presented in Figure 2 in Goldsworthy and Page (2007) with the greatest density of foraging effort occurring in waters adjacent to breeding colonies. With the exception of the South-east and Northern Gulf waters, some level of foraging effort occurs in almost all near-coastal waters from east of Kangaroo Island and into the Great Australian Bight (Goldsworthy and Page 2007).
A model of the distribution of the foraging effort of the South Australian population of Australian sea lions can be found in Figure 7.15, Goldsworthy et al. (2010). The estimated spatial distribution of Australian sea lion annual prey consumption on continent shelf and slope waters along southern Australia is provided in Figure 6, Goldsworthy et al. (2003).
An additional distribution map for the Australian sea lion can be found at the IUCN Red List http://maps.iucnredlist.org/map.html?id=14549 (Goldsworthy and Gales 2008b).
Migration of adult and juvenile males has been recorded on the west coast of Western Australia between breeding colonies in the Jurien Bay area and non-breeding sites on islands near Perth (Gales et al. 1992).
Feeding and/or breeding ecology relevant to interactions in the SPF: Studies of dive behaviour using satellite trackers and Time Depth Recorders (TDRs), and dietary information show that Australian sea lions are principally benthic foragers. Australian sea lions feed on the continental shelf in the region, most commonly in depths of 20–100 m (Shaughnessy 1999). They consistently dive to the ocean floor, with the deepest dives at just over 100 m (Goldsworthy et al. 2009). Lactating females from Seal Bay foraged on the continental shelf and travelled an average of 37 km to areas where dives were deepest, with the deepest recorded at 105 m (Costa and Gales 2003). Younger animals (up to age 23 months) concentrated their diving in shallower waters (Fowler et al. 2007). While at sea, females and juveniles dive almost continually through the day and night. Less is known about males’ feeding behaviour, but they are recorded to dive deeper.
Adult males concentrate around to 100m depth contour but maximum dive depths ranged from 68-144 m (Goldsworthy et al. 2009).
Australian sea lions feed on a wide variety of prey, including fish, cephalopods (squid, cuttlefish and octopus), sharks, rays, rock lobster and penguins with many prey items identified as benthic species (McIntosh et al. 2006; Goldsworthy et al. 2009). Many of the species identified in the diet are benthic, supporting the dive behaviour studies that this species is principally a benthic forager.
Australian sea lions are unique among pinnipeds in having large numbers of small breeding colonies, low reproductive rates, an unusually long breeding cycle of 17–18 months, temporally asynchronous breeding across its range (Gales et al. 1994), high site fidelity and poor dispersal (Campbell et al. 2008a; Lowther et al. 2012). Genetic research into the population structure of Australian sea lions has found evidence of a strong sex bias in dispersal, with females having high natal site fidelity and males dispersing between colonies over a range of 200 km (Campbell et al. 2008a, Lowther et al. 2012). This results in genetically isolated populations which increases the risk of local extinction, especially at sites with low population numbers. There is also evidence of low pup survival rates that increases their vulnerability (McIntosh et al. 2013).
7
Risk profile: The Australian sea lion distribution overlaps with the fishing zones of the SPF (particularly Zones B and C) with most activity in South Australian waters. There is a risk of direct interaction with trawl fishing operations.
The Australian Sea-lion is at risk from any incidental mortality from fisheries interactions due to its small population size, small subpopulations with high metapopulation structure and complex breeding dynamics.
1.2.4 Southern elephant seal (Mirounga leonina)
Conservation status: Listed as Vulnerable and marine under the EPBC Act.
Population estimate: Southern elephant seals have a nearly circumpolar distribution in the southern hemisphere (Campagna 2008). In Australia, the species breeds on Macquarie Island where there is an estimated population of 86,000 animals (DPIPWE 2012b). In recent years, there have been several births of southern elephant seals recorded in Tasmania (Maatsuyker Island, Dover, Bruny Island) (DPIPWE 2012b).
Distribution and key habitats within Australian waters: Distribution maps for the southern elephant seal can be found at the IUCN Red List http://maps.iucnredlist.org/map.html?id=13583 (Campagna 2008) and http://www.environment.gov.au/cgi-bin/sprat/public/publicspecies.pl?taxon_id=26 (DSEWPaC 2012e).
Feeding and/or breeding ecology relevant to interactions in the SPF: Southern elephant seals once bred on King Island, Tasmania but the population was completely decimated by the sealing industry (DPIPWE 2012b). As southern elephant seals now live far from human population centres and have minimal interactions with commercial fisheries, there are few threats and conflicts (Campagna 2008). Intensive fishing could potentially deplete important prey stocks although relatively little is known about their feeding habits (Campagna 2008). Prey consists of approximately 75% squid (not a target species in the SPF) and 25% fish (Campagna 2008). Foraging elephant seals combine exceptionally deep diving with long-distance traveling, covering millions of square kilometres while traversing a wide range of oceanographic regions during periods of up to seven months at sea (Campagna 2008). This species has been caught in low numbers in trawl fisheries elsewhere (Thompson et al. 2013 - one animal caught in 2002/03 in New Zealand trawl fisheries; Tuck et al. 2013 - one caught in the mackerel icefish trawl fishery in 2002/03 and, in the Patagonian toothfish trawl fishery, one caught in 2001/02 and one in 2002/03).
Risk profile: In the future, the breeding population of southern elephant seals may increasingly recolonise parts of Tasmania. At present, the numbers of this species recorded around Tasmania are very small.
Currently, the southern elephant seal is not considered at high risk of interaction with trawlers in the SPF area. Therefore, no further consideration has been given to this species in this review.

8
Table 1.1. Relevant EPBC Act listed Australian pinniped species and known fisheries interactions in Australia.
Species 2010 IUCN Red List of Threatened Species
EPBC Act 1999 listing
Summary of Australian trawl interaction References
Australian fur seal
Arctocephalus pusillus doriferus
Least Concern Marine
Small Pelagic Fishery: In January 2005-February 2006, fur seals entered the net in >50% of mid-water trawl operations with an observed mortality rate of 0.12 seals per shot using bottom-opening seal excluder devices.
Southern and Eastern Scalefish and Shark Fishery (SESSF): The areas fished by the SESSF overlap with the distributions of the Australian fur seal. The Commonwealth Trawl Sector (CTS), in particular, is known to interact with this species.
Known to interact directly with trawlers fishing in the winter blue grenadier trawl fishery of western Tasmania, Australia (SESSF).
Lyle and Willcox 2008
Woodhams and Vieira 2012b
Hamer and Goldsworthy 2006; Tilzey et al. 2006
New Zealand fur seal
Arctophoca forsteri Least Concern Marine
Southern and Eastern Scalefish and Shark Fishery: The areas fished by the SESSF overlap with the distributions of the New Zealand fur seal. The CTS, in particular, is known to interact with this species.
Woodhams and Vieira 2012b
Australian sea lion
Neophoca cinerea Endangered
Vulnerable; Marine
Southern and Eastern Scalefish and Shark Fishery: The areas fished by the SESSF overlap with the distributions of the Australian sea lion. The CTS and Shark Gillnet Sector, in particular, are known to interact with this species.
Woodhams and Vieira 2012b
Goldsworthy et al. 2009

9
1.3 Conservation status of the species nationally (See Table 1.1)
1.4 Description of the nature and extent of interactions between trawl fisheries and group/species
Pinnipeds interact with fisheries internationally and in Australian waters. Interactions with fisheries range from disruption of natural behaviour to potential for prey depletion and incidental mortality. Primary sources of pinniped mortality include incidental bycatch in fisheries (mainly gillnets and trawls) and entanglement in discarded gear.
Globally among pinnipeds, fisheries interactions are the dominant, currently recognized threat. For most threatened taxa, direct or indirect fisheries interactions are identified as the primary, or an important secondary, threat (Kovacs et al. 2012). Fishing-related mortality is considered the most severe and immediate threat to pinniped populations worldwide. Global reviews of seal–fishery interactions identified an increase from 16 affected seal species in the early 1980s (Northridge 1984, 1991 in Hamer and Goldsworthy 2006; Woodley and Lavigne 1991) to 36 in the early 1990s (Wickens 1995 in Hamer and Goldsworthy 2006), although these figures may in part be explained by an increased awareness.
1.4.1 Incidental bycatch in fisheries
Direct interactions between fishing gear and marine mammals (cetaceans and pinnipeds) occur in many fisheries worldwide and may result in incidental capture and mortality of some individuals (Read et al. 2006; Reeves et al. 2013).
Globally the bycatch of marine mammals is estimated to be in the hundreds of thousands of individuals. However, due to the absence of information from many fisheries, the reliability of estimates are uncertain and almost certainly conservative (Read et al. 2006). In order to adequately quantify marine mammal bycatch a high level of observer coverage is usually required. In practice, for many fisheries, observer coverage is inadequate or non-existent, resulting in the majority of bycatch records being anecdotal (and potentially under-reported) rather than quantitative (Morizur et al. 1999).
Although gillnet fisheries account for the bulk of the bycatch, varying levels of pinniped bycatch also occur in many trawl fisheries worldwide (Morizur et al. 1999; Wilkinson et al. 2003; Read et al. 2006).
Seals and commercial fisheries often target the same food resource and interact at a more focussed spatial and temporal scale leading to ‘operational interactions’ between seals and fisheries when seals come into direct contact with fishing gear (Hamer and Goldsworthy 2006; Tilzey et al. 2006). An increase in seal numbers observed at the surface is assumed to be proportional to the increased risk of by-catch and mortality incidences at trawlers (Hamer and Goldsworthy 2006; Tilzey et al. 2006).
Key points: Pinnipeds targeting prey species often overlap spatially and temporally with fisheries targeting the same prey species. Adequate observer coverage is required to accurately quantify pinniped bycatch in fisheries.
1.4.2 Entanglement in discarded netting
Trawl nets contribute considerably to marine debris and many marine mammals become caught in trawl netting (Macfadyen et al. 2009; Pichel et al. 2012). Such marine debris is also known as ‘ghost netting’. Mortalities may arise from drowning and/or a prolonged demise including impaired foraging, increased drag, emaciation, infection, haemorrhage, and severe tissue damage.

10
Based on a study at Kangaroo Island, Page et al. (2004) estimated that approximately 64 sea lions and 295 New Zealand fur seals die each year in southern Australia from entanglement, mostly in lost or discarded fishing gear. New Zealand fur seals are most frequently entangled in packing tape (30%) and trawl net (28%) fragments whereas Australian sea lions are most commonly entangled in monofilament gillnet (55%) and 11% trawl fragments (Page et al. 2004). Entanglement in marine debris is likely to be a significant source of mortality for Australian sea lions and may be contributing to their lack of recovery across parts of their range (Page et al. 2004). It is estimated that 0.2–1.3 per cent of the population becomes entangled in debris (Page et al. 2004). The Threat Abatement Plan for the Impacts of Marine Debris on Vertebrate Marine Life (DEWHA 2009) lists Australian sea lions as being adversely affected by ingestion of, or entanglement in, harmful marine debris.
There is a relatively high incidence of entanglement in fishing equipment for the Australian fur seal. At haul-out sites in southern Tasmania, the incidence of entanglement was 1.9%, and at Tenth Island in the Bass Strait, it was a minimum of 0.6% (Pemberton et al. 1992). At Seal Rocks, Victoria, a high incidence of entanglement (up to 1.2%) was also observed (Prendergast and Johnson 1996 in DSEWPaC 2012c).
The fishing gear fouling the reefs and beaches of the North-western Hawaiian Islands (NWHI) and entangling Hawaiian monk seals (Monachus schauinslandi) only rarely includes types used in Hawaiian fisheries. For example, trawl net and monofilament gillnet accounted for approximately 35% and 34% of the debris removed from reefs in the NWHI by weight, and trawl net alone accounted for 88% of the debris by frequency and yet there are no commercial trawl fisheries in Hawaii (Carretta et al. 2009).
Key points: Entanglement may occur via interactions with discarded nets. Discarded trawl nets can impact environments and species great distances from where they were initially discarded or lost.
1.4.3 Prey depletion and habitat degradation
Little is known about trophic interactions in Australian waters between fisheries and otariids (fur seals and sea lions), either through direct competition for the same stocks or through more subtle competition involving alteration of the trophic structure (DSEWPaC 2012a; Goldsworthy et al. 2003). However, it is considered that commercial fishing operations (particularly for rock lobster) may have reduced the availability of prey for Australian sea lions (DEWHA 2010).
The impacts of trawl-based fisheries on benthic ecological communities are rather poorly understood. Demersal trawling may have a significant impact on prey availability for Australian sea lions through disturbance to benthic communities. In Western Australia, there are trawl based fisheries in proximity to the Abrolhos Islands breeding population of Australian sea lions and a limited trawl-based fishery on the south coast of Western Australia within the foraging range of a number of breeding populations. In South Australia, there are trawl based fisheries for western king prawns and for demersal finfish species in the Great Australian Bight and South East Trawl fisheries. It is unknown whether these activities may be impacting on the viability of Australian sea lion populations (Goldsworthy et al. 2009).
Trawl fisheries in the Bering Sea have reduced fish stocks and changed the species composition of the region’s fauna (National Research Council 1996 in Reeves et al. 2003). This has been implicated in the rapid decline in Steller sea lion (Eumetopias jubatus) abundance, which in turn may have forced killer whales to switch from preying on them to preying increasingly on sea otters (Enhydra lutris). Now the population of sea otters along the Aleutian Islands has collapsed (Estes et al. 1998 in Reeves et al. 2003), and it is hard to foresee the next development in this “ecological cascade,” probably driven at least to some extent by the world’s largest trawl-fishing fleet (Reeves et al. 2003).
11
Key points: Otariids often target the same prey species as those targeted by mid-water trawl fisheries. Demersal trawl fisheries may impact on benthic ecological communities and, hence, prey availability for some pinniped species.
1.4.4 Changes to pinniped behaviour during or following fishing activities
Trawl fisheries provide a reliable food source from bycatch and offal disposal. Trawlers may provide a concentrated source of food in an otherwise patchy environment (food patch). Food patches provided by mid-water trawlers may impact on the behaviour of marine mammals through alterations in food distribution, availability, and predictability, affecting related social interactions and population demographics (Pace et al. 2012). Results from dietary analysis of Australian fur seals killed in the blue grenadier fishery off western Tasmania indicate that seals feeding within the fishing ground are targeting the trawling operation to feed on commercially targeted species (blue grenadier, spotted warehou) (Tilzey et al. 2006).
Key point: The concentration of prey items during or following fishing activities is known to attract feeding otariids.
1.4.5 Illegal culling
Commercial and recreational fishing may regard fur seals as competitors and pests (Shaughnessy 1999). Fishermen in Victoria claimed that seals drastically reduce stocks of commercially viable fish although this was not substantiated by evidence from fishery statistics or by dietary studies (Warneke 1982 in DSEWPaC 2012c). Seals that interfere with fishing gear may be shot by commercial and recreational fishermen, but there is no information regarding the extent of current illegal culling (Pemberton and Shaughnessy 1993 in DSEWPaC 2012c; Shaughnessy 1999). Recoveries of tagged juvenile seals (n = 88) indicated that 66% of deaths resulted from drowning in nets and traps or from gunshot wounds, although the full extent of this mortality in the overall population is not known (Warneke 1975 in DSEWPaC 2012c). In August 2006, about 40 fur seals were shot by two fishermen on Kanowna Island in Wilsons Promontory National Park at the southernmost point of Victoria (Russell 2006 in DSEWPaC 2012c).
Key point: Illegal culling of pinnipeds is known to occur.
1.5 International interactions between pinnipeds and trawl fisheries
1.5.1 What is the result of interactions between group and trawl gear/fishing operations
Woodley and Lavigne (1991) undertook a literature review on incidental catches of pinnipeds by commercial fisheries using both passive and active fishing gear. Incidental catches in active gear appear at least partially responsible for the decline of northern sea lions (Eumetopias jubatus) in the North Pacific. Incidental bycatch is also considered to have had detrimental impacts on New Zealand sea lions (Phocarctos hookeri) off the Auckland Islands, harbor seals (P. vitulina concolor) off Newfoundland and Alaska, grey seals (Halichoerus grypus) in the eastern Baltic and for endangered Mediterranean (Monachus monachus) and Hawaiian (M. schauinslandi) monk seals (Woodley and Lavigne 1991; Carretta et al. 2009, 2013).
Several factors appear to influence incidental catches of pinnipeds, including behavioural traits of individual species, age of individuals, fishing gear type, and the temporal and spatial overlap of a species' range with fishing activities. Incidental catches appear to occur at least occasionally wherever seal distribution and fishing effort overlap, but are most prevalent where a species' range coincides temporally and spatially with intense fisheries activities (Loughlin et al. 1983; Piatt and Nettleship 1987; Lien et al. 1988 in Woodley and Lavigne 1991). Certain seal species also have a propensity for being taken in fishing gear because of their

12
behavioural traits. For example, northern sea lions and Cape fur seals are known to follow and to interfere with fishing gear (Loughlin et al. 1983; Shaughnessy 1985 in Woodley and Lavigne 1991).
1.5.2 International - South America, South Africa, United States of America
The following information on interactions between pinnipeds and trawl fisheries was identified:
• Interactions between the South American sea lion (Otaria flavescens) and the bottom-trawling industrial fishery fleet in south-central Chile (Reyes et al. 2013). In 2004, 6.3 sea lions/working day (1.2 sea lions/trawl) were recorded during observations of the incidental sea lion catch in the trawls. These were the first records of sea lion incidental bycatch by the trawler fleet along the south-east Pacific coast of Chile;
• Interactions between the South America sea lion and the Argentinian national fishing fleet along the Atlantic Patagonian coast with annual mortality rates of 170-600 sea lions (Crespo et al. 1997; Dans et al. 2003). Sea lions were recorded as bycatch in nearly all types of trawl including mid-water trawling by factory vessels;
• Interactions between Cape fur seals (A. pusillus pusillus) and the South African trawl fisheries - offshore demersal, inshore demersal, and mid-water fisheries (Wickens and Sims 1994). Seal mortality is mainly caused by drowning in trawl nets and ranged from 2,524 to 3,636 seals of both sexes per year. Interactions between the Cape fur seal and the pelagic purse seine fishery off South Africa are reported but current bycatch levels in the mid-water trawl fisheries are uncertain (David and Wickens 2003);
• The total estimated incidental bycatch of Steller sea lions during 1966-1988 in foreign and joint-venture trawl fisheries operating off Alaska was over 20,000 animals (Perez and Loughlin 1991 in NMFS 2008). A particularly high level of bycatch occurred in the 1982 Shelikof Strait walleye pollock joint venture fishery when U.S. trawlers killed an estimated 958 to 1,436 sea lions (Loughlin and Nelson 1986 in NMFS 2008). The estimated bycatch in this fishery declined to fewer than 400 animals per season in 1983 and 1984, probably due to changes in fishing techniques and in the area and times fished (NMFS 2008). Fewer than 100 sea lions per year were estimated to have been taken during 1985-1987 and the level of incidental mortality has continued to decline. In 2002, the minimum estimated incidental mortality rate in commercial fisheries was 29.5 sea lions per year (Angliss and Outlaw 2005 in NMFS 2008);
• Interactions between pinniped species and United States fisheries are provided in National Marine Fisheries Service (2011);
• Interactions between pinnipeds (California sea lions Zalophus californianus californianus, harbor seals Phoca vitulina richardsi, northern elephant seals Mirounga angustirostris, Guadalupe fur seals Arctocephalus townsendi, northern fur seals Callorhinus ursinus and Hawaiian monk seals Monachus schauinslandi) and trawl fisheries are summarised in Carretta et al. (2013), and;
• A recent review of bycatch in 49 United States fisheries included an assessment of seven commercial trawl fisheries (Zollett 2009). Pinniped species were identified as bycatch in the following fisheries: mid-Atlantic bottom trawl (grey seal, harp seal, harbor seal), Northeast mid-water trawl (harbor seal) and Northeast bottom trawl (grey seal, harp seal, harbor seal) (see Table S3 in Supplement 1, available at: www.int-res.com/articles/suppl/n009p049_app.pdf).

13
1.5.3 International - New Zealand
There is a large volume of work on mitigation techniques and their efficacy in reducing the incidental bycatch of New Zealand sea lions in trawl fisheries operating in southern New Zealand. This work is directly applicable to the mitigation of otariid bycatch in Australian fisheries. Therefore, from the international perspective, this review has a strong focus on bycatch information and mitigation for otariids in New Zealand trawl fisheries. The bycatch data provided below are from reliable government observer programs collated and analysed in grey literature by independent government consultants.
New Zealand sea lion interactions with trawl fisheries
Over the last twenty years, four commercial fisheries have been implicated in the observed decline of New Zealand sea lions through the incidental bycatch of animals in trawl nets. These are the Auckland Islands squid trawl fishery, the Auckland Islands non-squid trawl fishery (mostly targeting scampi), the southern blue whiting trawl fishery which operates near Campbell Island, and the Stewart-Snares shelf trawl fisheries.
The Auckland Islands squid fishery is an annual trawl fishery that uses a combination of bottom and mid-water trawls across the shelf at bottom depths of about 150 – 250m. The level of New Zealand sea lion incidental mortality in the Auckland Islands squid fishery (SQU6T) has been monitored by government observers since 1988 (Wilkinson et al. 2003). High numbers of incidental mortalities have been recorded in the past with peaks in the mean estimated number of captures in 1995/96 and 1996/97 of 131 and 142 respectively (Thompson et al. 2013; Table 1.2).
Table 1.2: Annual trawl effort, observer coverage, observed numbers of sea lions captured, observed capture rate (sea lions per 100 trawls), estimated New Zealand sea lion captures, interactions, and the estimated strike rate (with 95% confidence intervals), in the Auckland Islands Squid Trawl Fishery . Copied from Table A-14, Thompson et al. (2013).
In the most recent fisheries assessments, Thompson et al. (2013), the Auckland Islands ‘scampi trawl’ has been assessed separately from the Auckland Islands ‘non-squid trawl’. The Auckland Islands scampi fishery total annual trawl effort for the most recent five seasons of data (2006/07-2010/11) ranged from 940-1,457 tows (Thompson et al. 2013). This fishery records relatively low levels of interactions with New Zealand sea

14
lions with the annual mean estimated captures for 2006/07 to 2010/11 ranging from 6-10 animals (Thompson et al. 2013; Table 1.3). The Auckland Islands non-squid trawl fishery (defined as all tows in the Auckland Islands part of the SQU6T fishing area not targeting squid or scampi) primarily targets orange roughy and hoki (Thompson et al. 2013). The total annual trawl effort in this fishery for the most recent five seasons of data (2006/07-2010/11) ranged from 38-147 tows (Thompson et al. 2013). This fishery records low levels of interactions with New Zealand sea lions with 0-3 annual mean estimated captures from 1995/96 to 2010/11 and no mean estimated captures since 2004/05 (Thompson et al. 2013; Table 1.3).
The Stewart-Snares shelf trawl fisheries primarily targets squid but also hoki, jack mackerel and barracouta (MAF 2012). The total annual trawl effort for the most recent five seasons of data (2006/07-2010/11) ranged from 2,456-3,498 tows (Thompson et al. 2013). The annual mean estimated captures of New Zealand sea lions for all trawl effort on the southern end of the Stewart-Snares shelf for 2006/07 to 2010/11 ranged from 1-4 animals (Thompson et al. 2013; Table 1.3).
The southern blue whiting trawl fishery operates around the Campbell Island Rise (Thompson et al. 2013) and near a breeding colony of New Zealand sea lions on Campbell Island. Catches are taken mostly by semi-pelagic trawling methods. The total annual trawl effort in the Campbell Island southern blue whiting fishery for 2007-2011 ranged from 544-815 tows (Thompson et al. 2013). New Zealand sea lions have been recorded as bycatch in the fishery with the annual mean estimated captures for 2007 to 2011 ranging from 1-24 animals with a strong male bias in killed animals. (Thompson et al. 2013; Table 1.3).
The New Zealand sea lion bycatch rates and total estimates for all New Zealand trawl fisheries from 1995/96 to 2010/11 are summarised in Table 1.4.
Table 1.3: Estimated New Zealand sea lion captures and interactions, in 2009-10 and 2010-11, in the five New Zealand trawl ‘strata’ used in fisheries estimations. Copied from Table 10, Thompson et al. (2013).

15
Table 1.4: Annual trawl effort, observer coverage, observed numbers of New Zealand sea lions captured, observed capture rate (sea lions per 100 trawls), estimated sea lion captures, interactions, and the estimated strike rate (with 95% confidence intervals), from all New Zealand trawl fisheries. Copied from Table A-13, Thompson et al. (2013).
New Zealand fur seal interactions with trawl fisheries
The increase in the size and expansion of the New Zealand fur seal population in New Zealand has led to a corresponding increase in the amount of interaction between seals and humans (Baker et al. 2010). Of particular concern is the interaction between seals and fisheries, which includes the perceived consumption of target fish species, damage to fishing gear, and the incidental death of seals in fishing operations (Lalas and Bradshaw 2001; Boren et al. 2006).
The New Zealand fur seal is regularly captured in trawl fisheries in New Zealand (Thompson et al. 2013). Fur seals are caught in a wide range of trawl fisheries, and across a wide geographic range. For the period between 1 October 2002 and 30 September 2011, the hoki trawl fishery (mainly mid-water trawl, http://www.fish.govt.nz/en-nz/Publications/State+of+our+fisheries/Managing+Our+Catch/Hoki.htm) had the highest observed New Zealand fur seal captures as well as the highest fishing effort (Thompson et al. 2013; see 1.5). In the fishery region, hoki is a common prey item of the New Zealand fur seal (Boren 2010). Between 1 October 2002 and 30 September 2011, the southern blue whiting trawl fishery had the highest capture rate with over seven fur seals caught per 100 tows (Table 1.5). The high fur seal capture rate in southern blue whiting trawl fisheries was mainly due to the high capture rate observed around Bounty Islands, where southern blue whiting were the main target. More detailed statistics on each fishery are provided in Appendix D, Thompson et al. (2013). The New Zealand deepwater trawl industry implemented a voluntary code of practice to try and mitigate fur seal mortality although annual fur seal bycatch remains significant (Baird and Smith 2007).
The New Zealand fur seal bycatch rates and total estimates for all New Zealand trawl fisheries from 2002/03 to 2010/11 are summarised in Table 1.6.
Key points: Trawl fishing operations that strongly overlap with the foraging range of fur seals and sea lions account for most bycatch.
There is a relationship between seal prey items and a fishery’s target species and the level of interaction between seals and fishery operations.

16
Table 1.5: New Zealand fur seal bycatch data for New Zealand trawl fisheries by target fishery for the period between 1 October 2002 and 30 September 2011. Included are total trawl effort, observed trawl effort, observer coverage (%), observed New Zealand fur seal captures and fur seal capture rate (number of captures per 100 tows). Data are sorted in decreasing order of the number of captures. Copied from Table 8, Thompson et al. (2013).
Table 1.6: New Zealand fur seal captures in all trawl fisheries in New Zealand. Annual trawl effort, observer coverage, observed numbers of fur seals captured, observed capture rate (fur seals per 100 trawls), estimated fur seal captures, and the estimated capture rate (with 95% confidence intervals), in all trawl fisheries, excluding flatfish targets. Copied from Table A-2, Thompson et al. (2013).
1.6 Australian interactions between pinnipeds and trawl fisheries In Australia, Australian fur seals, New Zealand fur seals and Australian sea lions have all been recorded interacting with, and forming bycatch in a range of Australian fisheries, including trawl fisheries (Page et al. 2004; Hamer and Goldsworthy 2006; Goldsworthy and Page 2007).
Currently, the main threat to Australian sea lions is through interaction with demersal gillnet and trap fisheries. Bycatch in rock lobster and shark gillnet fisheries has been identified as a key threat to the species (Goldsworthy et al. 2010). South Australian populations of the Australian sea lion occur entirely in the Gillnet and Shark Hook Sector of the Southern and Eastern Scalefish and Shark Fishery (SESSF) (DSEWPaC 2012a). Young sea-lions have also been recorded drowning in southern rock lobster pots (Gales et al. 1992,
17
Campbell et al. 2008b) and are attracted to bait, caught lobsters and discarded bait (Goldsworthy et al. 2010).
1.6.1 Southern and Eastern Scalefish and Shark Fishery (SESSF)
The Southern and Eastern Scalefish and Shark Fishery (SESSF) is a multi-species multi-gear fishery situated off the south-east coast of Australia. The SESSF has the following trawl sectors: Commonwealth Trawl Sector (CTS), East Coast Deepwater Trawl Sector (ECDTS), and Great Australian Bight Trawl Sector (GABTS) (Woodhams and Vieira 2012b).
The areas fished by the SESSF overlap with the distributions of the Australian fur seal, New Zealand fur seal and Australian sea lion (Woodhams and Vieira 2012b). The CTS and Shark Gillnet Sector, in particular, are known to interact with these species.
The CTS extends from State waters out to the EEZ from Barranjoey Point southward around NSW, Victorian and Tasmanian waters to Cape Jervis in South Australia (Tuck et al. 2013). The major component of the CTS is the South East Trawl (SET) fishery, which comprises 59 Boat Statutory Fishing Rights that use predominantly otter board trawl and Danish seine methods. In discussing trawling, often a distinction is made between highly targeted shots at single species aggregations (e.g. blue grenadier) compared to generalist shots for multi-species catches (Tuck et al. 2013).
In 1999, the Australian Fisheries Management Authority (AFMA) allowed factory trawlers (using mid-water trawls) into the winter blue grenadier fishery off the west coast of Tasmania (part of the CTS) to ensure the full utilisation of the total allowable catch (AFMA 1999 in Hamer and Goldsworthy 2006). Factory trawlers experienced a high Australian fur seal bycatch mortality rate in their first year of operation, with 89 seals caught from 665 trawl events (AFMA 1999, Tilzey 2002 and Tilzey et al. 2004 in Hamer and Goldsworthy 2006; Tilzey et al. 2006). Seals compete with fishers for blue grenadier that are the same size as those that are commercially targeted and conflicts between fishers and seals had been the cause of seal culls in the past (DSEWPaC 2012c).
The levels of fur seal bycatch experienced in the SET were unverified until the advent of an Integrated Scientific Monitoring Program (ISMP) in 1993 that regularly placed scientific observers on board vessels (Tilzey et al. 2006).
Between 1993 and 2000, data collected by the ISMP and its precursor (the Scientific Monitoring Program) indicated that an average of 720 fur seals could be caught incidentally by wet-boats each year (NSSG and Stewardson 2007). Wet-boats are small demersal trawlers (18–23 m) operating in the CTS, which store their catches using ice/brine with no freezing/processing capacity (SETFIA 2009). In 2011, interactions with two sea lions, five New Zealand fur seals, 22 Australian fur seals and 226 seals of unknown species were recorded in the CTS and Gillnet, Hook and Trap Sector (GHaT). Of these, all Australian sea lions, all Australian fur seals and 7 of the 8 New Zealand fur seals were reported as being dead. Of the 226 unidentified seals, 66 were reported as having been released alive. Approximately 88% of all pinniped interactions in 2011 were reported while trawling (either CTS or GABTS) (Woodhams and Vieira 2012b). One seal was entangled in trawl gear in the GABTS in 2011 and was reported as dead, although anecdotal reports suggest that it was a decayed carcass at the time of capture (Moore and Vieira 2012).
Based on ISMP data, there has been an apparent decrease in the number of observed interactions (although not mortalities) between Australian fur seals and the SET of the CTS (Table 1.8) (Tuck et al. 2013). However, given the limitations of the historical ISMP design and the infrequency and variability of TEP species distributions, it is difficult to detect any real trends in interactions (Tuck et al. 2013).

18
AFMA publishes quarterly reports of logbook interactions with ‘Threatened, Endangered and Protected’ (TEP) species on its website (AFMA 2012). The recorded interactions between seals and the CTS in 2012 are shown in Table 1.7.
Table 1.7: Summary of observed seal interactions in the South East Trawl fishery for 2005, 2006, 2009 and 2010 (mortalities in brackets). Copied from Table 20.6, Tuck et al. (2013).
2005 2006 2009 2010
949 observed shots 855 observed shots 633 observed shots 706 observed shots
Eared Seals - - 1 (1) -
Australian fur seal
175 (28) 100 (5) 293 (27) 24 (20)
New Zealand fur seal
- - - 11 (10)
Table 1.8: Number of interactions between seals and all fisheries in the Commonwealth Trawl Sector of the SESSF in 2012 (from logbook data; AFMA 2012, http://www.afma.gov.au/managing-our-fisheries/environment-and-sustainability/protected-species/). Note that this preliminary data includes all fisheries in the CTS.
Time period # of interactions Life status
1 January - 31 March 2012 14 Australian fur seals
1 NZ fur seal
28 unclassified seals
3 alive, 4 dead
Dead
5 alive, 23 dead
1 April - 30 June 2012 41 Australian fur seals
25 unclassified seals
4 alive, 37 dead
7 alive, 18 dead
1 July - 30 Sept 2012 Bottom otter trawl:
19 Australian fur seals
3 NZ fur seals
14 unclassified seals
Mid-water otter-trawl:
6 Australian fur seals
3 alive, 16 dead
3 dead
2 alive, 12 dead
1 alive, 5 dead
1 October - 31 Dec 2012 13 Australian fur seals
12 unclassified seals
1 alive, 12 dead
1 alive, 11 dead
Total 176 seals
19
1.6.2 Small Pelagic Fishery (SPF)
The Australian SPF targets Australian sardine, blue mackerel , jack mackerel and redbait using purse-seine and mid-water trawlers to catch fish (Moore and Skirtun 2012). The SPF extends from southern Queensland to southern Western Australia and is divided into four management zones (A, B, C and D). Mid-water trawling was trialled in Tasmania during 2001 for the SPF and commercial mid-water trawl operations commenced in late 2002, with redbait the primary target species (Lyle and Willcox, 2008). At the commencement of the fishery, a ‘soft’ rope-mesh Seal Excluder Device (SED) and a high level of observer coverage was used (see Section 8).
Ecological risk assessments have been undertaken separately for mid-water trawl and purse-seine fishing methods.
Interactions with marine mammals (fur seals and cetaceans) were identified as a key environmental concern for the mid-water trawl fishery (Moore and Skirtun 2012). AFMA commissioned a study conducted from January 2006 to February 2007 using underwater video information for almost 100 trawls, representing over 700 hours of video footage (Lyle and Willcox 2008). This study quantified the nature and extent of interactions and evaluated potential mitigation strategies and found that fur seals entered the net in >50% of mid-water trawl operations, with an observed mortality rate of 0.12 seals per shot for nets using bottom-opening SEDs (Lyle and Willcox 2008). Given the high level of interactions with fur seals (despite deployment of SEDs), this study indicated that more effective SEDs were needed for the mid-water trawl (Moore and Skirtun 2012).
Of the 184 seal interactions with mid-water trawl gear reported during 2001-2010, 175 were incidentally caught during scientific projects aimed to determine the type and frequency of interactions and to assess the performance of various excluder devices as a means to mitigate seal and dolphin interactions (Tuck et al. 2013). Most of the seals were believed to be Australian fur seals, with 145 (79%) reported as surviving the interaction. There have been no reported incidental interactions between fur seal and the mid-water trawl fisheries of the SPF since 2007 (based on observer coverage of <13% mid-water trawl shots per annum since 2007) (AFMA 2011, AFMA 2012, Tuck et al. 2013). The lack of reported interactions coincides with a reduction in effort in the fishery, a decline in observer coverage as well as no mid-water trawl fishery catches in 2011 (Tuck et al. 2013).
As the SPF region covers all the breeding locations and known foraging ranges of Australian fur seals, New Zealand fur seals and Australian sea lions in Australia, and there have been known interactions between seals and other trawlers in the SPF, all three species are at risk from interactions with any proposed fishery in the SPF region.
1.7 Are there any bycatch mitigation devices or measures? Pinniped bycatch levels have been reduced through implementation of improved exclusion device design, codes of conduct for trawl operations and increased marine mammal observer coverage. There is a large volume of work on mitigation techniques and their efficacy in reducing the incidental bycatch of pinnipeds in trawl fisheries operating in Australia and New Zealand. Despite a detailed on-line literature search, there was limited international literature available on pinniped-specific mitigation to reduce trawl fishery bycatch. It is possible that there is more information available in grey literature that was not able to be accessed as part of this review. Most fisheries mitigation work internationally has focussed on other marine mammals in trawl fisheries or, for pinnipeds in gillnet fisheries. For pinnipeds species internationally, gillnet fisheries account for the bulk of the bycatch (Morizur et al. 1999; Wilkinson et al. 2003; Read et al. 2006).

20
From 1990 to 1999, annual pinniped mortality in the USA in fisheries was estimated at 3,187 individuals (7,341 SE), with the vast majority (98%) occurring in gillnet fisheries (Moore et al. 2009).
Based on the pinniped-specific work on mitigation of bycatch in trawl fisheries that has been carried out in Australia and New Zealand, coupled with the authors having access to relevant grey literature on the Australasian work, this review has a strong focus on mitigation devices and measures implemented and tested in Australia and New Zealand.
1.7.1 Exclusion devices
Seal exclusion devices (SED) in Australia:
Specific management actions in the SESSF have focused on reducing fur seal interactions in the winter fishery for blue grenadier where the use of seal excluder devices (SED, Figure 1.1) has been mandatory since 2005 (Woodhams and Vieira 2012b). AFMA require factory trawlers to include a SED in trawl nets as the principal gear modification for mitigating seal bycatch (Tilzey 2002 in Hamer and Goldsworthy 2006). The SED comprises a stainless steel grid placed in front of the cod-end and an escape hatch some 5 m ahead of the grid (Hamer and Goldsworthy 2006; Tilzey et al. 2006). In principal, the SED allows the uninterrupted passage of fish through to the cod-end while prohibiting the entry and facilitating the escape of seals, subsequently reducing the risk to seals of drowning (Hamer and Goldsworthy 2006). The changed fishing practices appear to have reduced the incidence of seal bycatch in the mid-water trawl nets of factory vessels (Woodhams and Vieira 2012a).
SEDs have also been utilised in the SPF (Lyle and Willcox 2008). A list of the management measures implemented from 2001-2011 in the SPF to minimise bycatch is presented in Table 19.1 of Tuck et al. (2013). However, note that there has been almost zero effort in the mid-water trawl fishery since 2009.
Because of their smaller vessel and net size, wet-boats that operate in the CTS have reduced ability to apply mitigation methods such as SEDs. Reliably estimating and reducing the level of interactions remains an issue (Woodhams and Vieira 2012a). SETFIA conducted a trial of three different SED designs on wet-boats using underwater video footage to examine the results (SETFIA 2009; Tuck et al. 2013). The trials of a flexible SED design suitable for use in smaller nets were reasonably successful (SETFIA 2009). However, each SED suffered from the problem of skates getting stuck on the vertical bars, and on at least two of these occasions, this resulted in the loss of large quantities of commercial species through the escape hatch (Tuck et al. 2013). Of the three SED designs, the ‘Bennett’ SED showed most promise as it was easy for the crew to handle, stowed neatly onto the net drum and maintained a rigid shape during towing although further work was suggested to get the correct water flow, improve posture and to more easily allow unwanted catch such as seals and large skates through the escape hatch (SETFIA 2009; Tuck et al. 2013). Using large grids on the relatively small wet-boats has proved problematic and more recently, SETFIA has initiated a project to investigate the use of shortened trawl codends to reduce the bycatch of seals (Tuck et al. 2013).

21
Figure 1.1: Schematic of seal exclusion device (SED) configuration used in trawls nets by factory trawlers off western Tasmania (Courtesy: Hoki Fishery Management Company NZ) - figure copied from Hamer and Goldsworthy 2006.
Sea Lion Excluder Device (SLED) - New Zealand work:
Due to high levels of bycatch of New Zealand sea lions in the Auckland Islands Squid Trawl Fishery, a sea lion exclusion device (SLED) was developed that aimed to direct New Zealand sea lions out of the trawl net system prior to entering the cod-end where the target catch is retained (Roe and Meynier 2012; Wilkinson et al. 2003). Similar to a SED, the SLED comprises an additional section of netting inserted between the lengthener and cod-end of a trawl net with an angled two or three part metal grid that aims to direct sea lions to an escape hole in the top of the net and exclude them from the trawl cod end (Abraham 2011; Middleton and Breen 2011; Roe and Meynier 2012). Since 2004/05, there has been widespread use of government-approved, standardised SLEDs in the Auckland Island Squid Fishery (MAF 2012). Although not mandatory, the use of SLEDs is required by the current industry body, applied fleet wide and monitored by fishery observers (MAF 2012). Following the introduction of SLEDs, it has been difficult to estimate the number of NZ sea lions interacting with SLEDs and the survival rates of those that escape (MAF 2012).
SLEDs are known to be effective in allowing most New Zealand sea lions to exit a trawl but some are retained and drowned and there has been concern that some may escape but not survive the encounter e.g. due to life-threatening injuries from collisions with grids (MAF 2012). Following the introduction of SLEDs, the mean estimated number of New Zealand sea lions captured in the Auckland Islands Squid Fishery per year declined from 14-142 for 1995/96 to 2001/02 (i.e. pre SLED deployment) to 4-31 for the period 2004/05 to 2010/11 (i.e. post SLED deployment) (Thompson et al. 2013). In 2010/11 there were no observed captures and four mean estimated captures (0-11 95% CI) (Thompson et al. 2013) and no observed captures in the 2011/12 season (MPI unpubl. data; NB: estimated capture statistics yet to be published for the 2011/12 season).
SLED/SED design refinements:
In the SPF mid-water trawl fishery, Browne et al. (2005) identified several aspects of SED design for improvement with the most notable being the material and orientation of the mesh barrier. While the rope mesh used in the SED did not appear to cause harm to the seals it was not effective in guiding them out of the net. The mesh was not sufficiently rigid and under the weight of a seal, deformed considerably, sometimes leading to partial entanglements. Furthermore, the vertical orientation of the barrier provided no passive assistance in directing the seals out through the escape opening. As a consequence the cargo
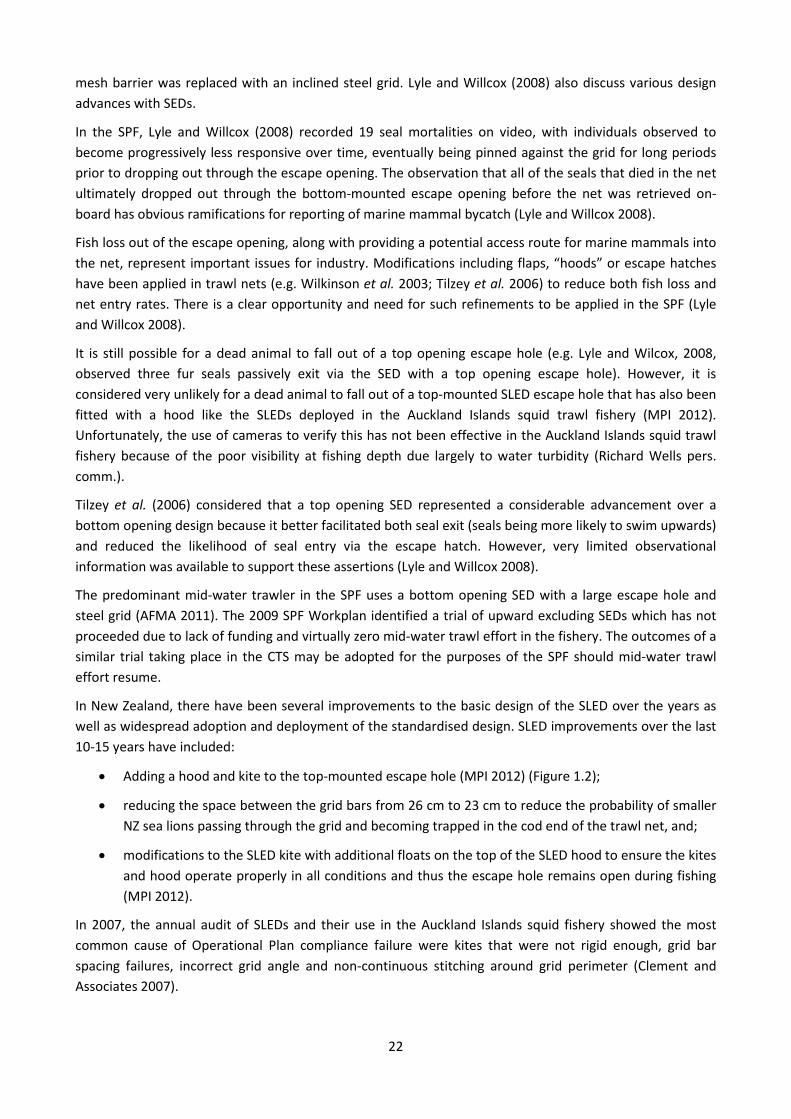
22
mesh barrier was replaced with an inclined steel grid. Lyle and Willcox (2008) also discuss various design advances with SEDs.
In the SPF, Lyle and Willcox (2008) recorded 19 seal mortalities on video, with individuals observed to become progressively less responsive over time, eventually being pinned against the grid for long periods prior to dropping out through the escape opening. The observation that all of the seals that died in the net ultimately dropped out through the bottom-mounted escape opening before the net was retrieved on-board has obvious ramifications for reporting of marine mammal bycatch (Lyle and Willcox 2008).
Fish loss out of the escape opening, along with providing a potential access route for marine mammals into the net, represent important issues for industry. Modifications including flaps, “hoods” or escape hatches have been applied in trawl nets (e.g. Wilkinson et al. 2003; Tilzey et al. 2006) to reduce both fish loss and net entry rates. There is a clear opportunity and need for such refinements to be applied in the SPF (Lyle and Willcox 2008).
It is still possible for a dead animal to fall out of a top opening escape hole (e.g. Lyle and Wilcox, 2008, observed three fur seals passively exit via the SED with a top opening escape hole). However, it is considered very unlikely for a dead animal to fall out of a top-mounted SLED escape hole that has also been fitted with a hood like the SLEDs deployed in the Auckland Islands squid trawl fishery (MPI 2012). Unfortunately, the use of cameras to verify this has not been effective in the Auckland Islands squid trawl fishery because of the poor visibility at fishing depth due largely to water turbidity (Richard Wells pers. comm.).
Tilzey et al. (2006) considered that a top opening SED represented a considerable advancement over a bottom opening design because it better facilitated both seal exit (seals being more likely to swim upwards) and reduced the likelihood of seal entry via the escape hatch. However, very limited observational information was available to support these assertions (Lyle and Willcox 2008).
The predominant mid-water trawler in the SPF uses a bottom opening SED with a large escape hole and steel grid (AFMA 2011). The 2009 SPF Workplan identified a trial of upward excluding SEDs which has not proceeded due to lack of funding and virtually zero mid-water trawl effort in the fishery. The outcomes of a similar trial taking place in the CTS may be adopted for the purposes of the SPF should mid-water trawl effort resume.
In New Zealand, there have been several improvements to the basic design of the SLED over the years as well as widespread adoption and deployment of the standardised design. SLED improvements over the last 10-15 years have included:
• Adding a hood and kite to the top-mounted escape hole (MPI 2012) (Figure 1.2);
• reducing the space between the grid bars from 26 cm to 23 cm to reduce the probability of smaller NZ sea lions passing through the grid and becoming trapped in the cod end of the trawl net, and;
• modifications to the SLED kite with additional floats on the top of the SLED hood to ensure the kites and hood operate properly in all conditions and thus the escape hole remains open during fishing (MPI 2012).
In 2007, the annual audit of SLEDs and their use in the Auckland Islands squid fishery showed the most common cause of Operational Plan compliance failure were kites that were not rigid enough, grid bar spacing failures, incorrect grid angle and non-continuous stitching around grid perimeter (Clement and Associates 2007).

23
It is apparent that the use of exclusion devices as a mitigation method is not an “off the shelf” solution and may be deemed fishery dependant, with the characteristics of the animal to be excluded and the fishery, and correct usage by fishers, having a major effect on potential efficacy (Cawthorn 2008).
Figure 1.2: Schematic diagram of a sea lion exclusion device (SLED) used in the Auckland Islands squid fishery. The SLED consists of a mid-section of netting with a metal grid and an opening (escape hole) above it. The grid directs sea lion to the escape hole, enabling them to exit the net. The forward-facing hood above the escape hole is designed so that only actively swimming sea lion escape the net. The hood is held open by floats, and a strip of material known as a kite. A cover net may be fitted over the escape hole to close the SLED. Copied from Thompson et al. (2013).
Exclusion devices used in other international fisheries:
Pinniped bycatch has been identified in mid-Atlantic bottom trawl (grey seal, harp seal, harbor seal), Northeast mid-water trawl (harbor seal) and Northeast bottom trawl (grey seal, harp seal, harbor seal) fisheries in the United States (Zollett 2009). All of these fisheries have either regulatory or recommended voluntary measures to reduce bycatch of protected species with turtle excluder devices (TEDs) the best known method for bycatch reduction in trawl fisheries (Zollett 2009). Zollett (2009) reported that excluder devices for marine mammals had not been tested or implemented in the United States. However, Carretta et al. 2013) reported that, in 2007 and 2008, four northern fur seals were incidentally killed in California waters during scientific sardine trawling operations conducted by the National Marine Fisheries Service, (NMFS, Southwest Regional Office, unpublished data). Following other marine mammal deaths, including one northern fur seal, in April 2008 trawls, NMFS scientists implemented an initial mitigation plan which included use of 162 dB acoustic pingers (for cetacean bycatch mitigation), a marine mammal watch, and scheduling trawls to occur when the ship first arrived on station to avoid attracting animals to a stationary vessel (Carretta et al. 2013). However, two additional northern fur seals were killed in subsequent 2008 trawls. In 2009, a marine mammal excluder device was added to the trawls and no additional deaths were observed during 42 trawls (Carretta et al. 2013).
In 2004, the United Kingdom reported to the Commission for the Conservation of Antarctic Marine Living Resources (CCAMLR) on the bycatch of fur seals (Arctocephalus gazella) in the krill fishery around South Georgia, and on mitigation methods that were being developed and deployed to avoid fur seal deaths in the fishery (Hooper et al. 2005). Mitigation measures for fur seal bycatch were tested for krill vessels fishing around South Georgia in the 2004 fishing season (Hooper et al. 2005). The range of measures were categorised into four approaches: physical barriers (panels of netting) excluding seals from entering the net; physical barriers (panels of netting) positioned within the net accompanied by escape channels or openings; manufactured seal-exclusion devices in front of the codend that were composed of a separator

24
grill that deflected seals to an escape opening; fishing gear configured with panels of a mesh size adequate to allow seals to escape (i.e. the forward part of the roof of the net had three large mesh panels inserted into it of mesh size 16 m and a further 2 panels of mesh size 4 m which appeared to allow the seals to escape alive and unharmed). It was considered that in all the above four cases, the incidence of seal entanglements during the 2004 season was either eliminated or greatly reduced (Hooper et al. 2005). CCAMLR has endorsed the recommendations of its Scientific Committee regarding the reduction of seal bycatch in the krill trawl fishery through the use of excluder devices (Anon 2006; NMFS 2011,).
Zeeberg et al. (2006) and National Marine Fisheries Service (2011) provide information on marine mammal mitigation in trawl fisheries in northwest Africa and USA, respectively, with a focus on cetacean and/or turtle excluder devices. In southern Africa, it appears that most bycatch mitigation is focussed on seabirds, turtles and sharks (e.g. Peterson et al. 2008). Bycatch mitigation literature that is predominantly focussed on cetacean, shark, turtle and seabird mitigation has been encapsulated in other relevant chapters of this review.
Key points: The use and design of SEDs appears to be fishery dependant, with the characteristics of the animal to be excluded and the fishery having a major effect on potential efficacy.
Orientation of the SED escape hole is important.
Compliance with SED/SLED approved design and operational use (as defined for individual fisheries) are critical to the success in reducing bycatch of pinnipeds.
1.7.2 Observer programs, Bycatch Limits, Codes of Conduct, Vessel Management Plans and Spatial and Temporal fishery closures
In some fisheries, voluntary codes of practice have been developed and adopted by industry to minimise the level of interactions with seals or sea lions. This may include practices such as steaming away from areas where marine mammals are sighted prior to shooting the trawl net; switching off aft gantry lights during night trawling, when not in use; closing the trawl opening when hauling to minimise opportunities for seals to enter the net; and converting fish offal to meal or incinerate or alternatively dispose of while the vessel is moving and not engaged in fishing operations, away from trawling grounds (AFMA undated - TEP fact sheet).
Observer programs are important as they provide more reliable catch rates and may enable trawling behaviour to alter in the presence of pinnipeds. Adequate observer coverage coupled with crew training enables real time management of incidents. High levels of observer coverage also contribute to confidence in annual bycatch estimates.
Harvest (‘bycatch’) limits or Potential Biological Removal (PBR) limits may be set for a fishery (Wade 1998; Carretta et al. 2013). For New Zealand fur seals in New Zealand, estimates of PBRs have been calculated for two geographical areas where deepwater commercial trawl fisheries are active and concern exists about fishery and fur seal interactions (Hamilton and Baker unpubl. data).
During 2009, AFMA developed the South East Trawl Fishery Bycatch and Discarding Workplan (board trawl and Danish seine) (AFMA 2009) to identify strategies that would:
• Respond to high ecological risks assessed through AFMA’s Ecological Risk Assessment for the Effect of Fishing (ERAEF) and other assessment processes;
• Avoid interactions with species listed under the Environment Protection and Biodiversity Conservation Act 1999 (EPBC Act);
• Reduce discarding of target species to as close to zero as practically possible, and;

25
• Minimise overall bycatch in the fishery over the long-term.
Modifications to fishing practices appear to have substantially reduced the incidence of seal bycatch in the mid-water nets of factory vessels. In 2007, the South East Trawl Fishing Industry Association (SETFIA) released an updated trawl industry code of conduct for responsible fishing and an industry code of practice to minimise interactions with seals (SETFIA 2007). The codes aim to address the environmental impacts of the fishery generally, and particularly interactions between the trawl fishery and seals.
The Code of Fishing Practice aimed at avoiding seals in the blue grenadier fishery appeared to halve the incidence of seal bycatch in this fishery (Tilzey et al. 2006). The Code of Fishing Practice included the following:
• The vessel steamed at an average speed of 10–12 knots for at least 40 minutes prior to shooting the gear regardless of the number of seals observed;
• If seals were still present, gear deployment was delayed and the vessel continued steaming at 10–12 knots for a further 20 minutes;
• Fish meshed in the net (stickers) were removed prior to shooting the gear;
• All shooting and hauling was carried out as rapidly as possible;
• The vessel often made a sharp turn when shooting the bottom trawl to keep the net closed on descent;
• During fishing the gear was not lifted into the top 150 m of the water column to make turns or a change in direction;
• After hauling the vessel turned 90–180 degrees immediately after the net was on deck;
• The vessel steamed away from the hauling area at an average speed of 10–12 knots for at least 40 minutes after hauling, regardless of the estimated time of the next shot;
• When fixing the net or streaming it for cleaning, the cod-end was always open and the SED escape hatch closed. The mouth of the trawl was always on board at this time, and;
• The discarding of fish, processing offal, or domestic waste on fishing grounds was rigorously avoided.
In the winter blue grenadier fishery, Hamer and Goldsworthy (2006) identified swell height, visibility and barometric pressure to be the most important environmental variables influencing the numbers of seals at fishing vessels. In particular, an increase in swell height and visibility and a decrease in barometric pressure, which combined constitute a general deterioration in weather conditions, were found to be correlated with an increase in seals observed at the surface from the vessel. These results highlight the need for additional modifications to fishing practices conducted by factory trawlers in this fishery. In particular, commercial fishing activity should cease during rough weather when seal numbers appear to be greatest, particularly if the number of seals observed at the surface is considered as a reliable surrogate indicator of the number of animals potentially interacting with the trawl net beneath the surface (Hamer and Goldsworthy 2006).
Management and mitigation measures in the Auckland Islands Squid Fishery in New Zealand have included spatial/temporal closures of the fishery, the introduction of codes of practice and imposition of sea lion mortality limits (MAF 2012). Individual vessels and operators are informed about risk from fishing operations in regard to what appear to be foraging areas of New Zealand sea lions, fishing practices when congregations of animals are present, and a focus on management of fishmeal plants and offal control. Management of offal discharge and reducing losses of fish from the nets is very important in reducing the

26
number of New Zealand sea lions that are attracted to a vessel, and all vessels have offal management procedures and recommended fishing practices that are detailed in individual Vessel Management Plans (Deepwater Group 2011). A management regime based on output controls was introduced (Wilkinson et al. 2003) where a ‘Fisheries-Related Mortality Limit’, the upper limit for the number of NZ sea lions that can be annually killed, was set (Chilvers 2008). A 12 nautical mile trawl Marine Reserve was established around the Auckland Islands (Wilkinson et al. 2003). Since 1992, annual Operational Plans have defined the management regime for each year including the required observer coverage to allow a statistically robust estimation of incidental captures, the Fisheries-Related Mortality Limit and steps to be taken if the estimated NZ sea lion mortality from squid fishing for that season approaches the limit (Wilkinson et al. 2003). The fishery has been mandatorily closed by Government fisheries managers seven times since when the limit has been reached, although the decision to close was overturned by court orders in 2003 and 2004 (Robertson and Chilvers 2011).
The recent use of effective mitigation measures (with no SLED use) in the Southern Blue Whiting Trawl Fishery in New Zealand ensured that no New Zealand sea lions were observed caught (with a preliminary estimate of around 70% observer coverage) in the 2012 fishing season (Ministry of Primary Industries unpubl. data). In particular, as well as a focus on management of fishmeal plants and offal control, individual vessels and operators are informed about the increased risk from fishing operations in what appear to be foraging areas of sea lions and, when congregations of animals are present, fishing practices are halted. Crew are required to keep the time that fishing gear is on the surface to an absolute minimum. Adequate observer coverage has been critical in enabling a full and accurate assessment of New Zealand sea lion bycatch. In addition, immediate reporting of all captures has been crucial in enabling assessment of risk and interaction levels in real time and vessels are required to inform fisheries managers immediately on any sea lion capture event so the appropriate management response can be considered (Deepwater Group 2011).
For mid-water trawl boats there is an observer coverage target of 20% of shots, and observer coverage of the first 10 trips for new boats entering the fishery, or existing boats moving into significantly new areas (AFMA 2011). The 2009 Workplan for bycatch and discards management in the SPF included the development and implementation of individual vessel management plans (VMP) to minimise TEP species interactions and record procedures for reporting on catch and wildlife interactions (AFMA 2011).
Mitigation to reduce the bycatch of the Steller sea lion in trawl fisheries has largely focussed on establishing no-transit and no-trawl areas (NMFS 2008). Vessel Monitoring Systems (VMS) are implemented on federally licensed groundfish vessels involved in pollock, cod and Atka mackerel fisheries. The VMS tracks fishing vessels, providing real-time information on vessel location and violation of no-transit and no-trawl areas (NMFS 2008).
1.7.3 Has the effectiveness of mitigation measures being investigated?
The effectiveness of SEDs in mitigating pinniped bycatch in Australian trawl fisheries has been investigated. Due to the particular relevance of these studies to the objectives of this literature review, the details of key reports and publications are summarised below.
Exclusion devices - Australian SESSF (winter blue grenadier fishery):
The inclusion of SEDs in fishing gear used by factory trawlers in the winter blue grenadier fishery and the concomitant reduction in the Australian fur seal bycatch rate between 2000 and 2002 led to the conclusion that SEDs were responsible for the observed reduction of seal bycatch and mortality on factory trawlers (Tilzey 2002 in Hamer and Goldsworthy 2006; Tilzey et al. 2006). Tilzey et al. (2006) identified that the perceived success of the SEDs must be validated firstly by quantifying the incidence of sub-surface net entry

27
by fur seals and secondly by comparing the incidence of bycatch and mortality that occurred during trawl events that had the SED attached with those that did not.
A multi-year study was undertaken to assess fishing practices and SEDs to mitigate seal bycatch by factory trawlers in the winter blue grenadier fishery with the following study objectives (Tilzey et al. 2006). From 2000-2002:
• assess the potential usefulness of SEDs in reducing seal bycatch in this fishery;
• improve the effectiveness of SEDs in blue grenadier trawl nets in reducing seal mortalities and minimising losses of fish;
• assess the effectiveness of fishing techniques aimed at minimising seal bycatch;
• gather biological information from all seal fatalities;
• achieve full observer coverage of freezer-trawler activities during the 2001 and 2002 winter grenadier fishery and monitor seal numbers around vessels and all seal-trawl interactions; and
• gather information on seal movement/residence-time in the winter grenadier fishery.
In 2003:
• further trial the most promising SED design;
• further trial the use of only a grid to prevent seal access to the cod-end;
• gather further information on seal movement/residence-time in the fishery, and;
• make further observations on when/how seals entered the trawl net.
The findings of this study are presented in Hamer and Goldsworthy (2006; peer-reviewed publication) and Tilzey et al. (2006 - final report to the Australian Government).
Hamer and Goldsworthy (2006) reported on the environmental and operational aspects of the fishery associated with increased numbers of seals observed at the surface, and determined the incidence of net entry to establish the effectiveness of the currently used SED at reducing bycatch and mortalities (sub-surface net interactions were examined using a submersible video camera). The blue grenadier is predominantly caught at depths between 300m and 600 m (Tilzey 1994 in Hamer and Goldsworthy 2006). Dive data for Australian fur seals is limited. A single record of 102m maximum depth for an adult male (Hindell and Pemberton 1997) and 164m mean max depth for adult females (Arnould and Hindell 2001) suggest they are unlikely to forage naturally on blue grenadier due to lack of vertical overlap. However, blue grenadier may become available during fishing operations, when they are hauled into the upper water column within the trawl net and the period that the net is above approximately 200m depth (during both shooting and hauling) is likely to be when seals are at greatest risk of becoming caught (Hamer and Goldsworthy 2006).
Hamer and Goldsworthy (2006) reported that:
• seal numbers increased when weather conditions deteriorated (see Section 7);
• seal numbers increased when the number of nearby vessels and trawl frequency increased, but decreased when vessel speed increased;
• seal numbers increased as the distance from the nearest breeding colony and haul-out site decreased;

28
• only one seal was detected entering and exiting the net mouth during monitored tows suggesting that reduced bycatch may not be necessarily attributable to SED use;
• the reduction in seal by-catch recorded in the factory trawler component of this fishery since 1999 has been attributed to the introduction of SEDs - this seems unlikely considering that all but one net entry resulted in bycatch;
• the reduction in seal bycatch was more likely due to a reduction in the incidence of seal–net interactions;
• seal bycatch mortality on the FV Aoraki also occurs during shooting. While this study indicates that seals are equally as likely to become caught in the trawl net during shooting, the low incidence of bycatch recorded emphasises the need to continue investigating subsurface interactions;
• all seal bycatch occurred during the day and almost half occurred during shooting;
• mortalities were significantly higher during shooting compared with hauling and mortality rates were similar between tows with the SED attached and those without;
• it appears that seal bycatch is reduced when haul speeds are kept low - this contravenes recommendation in the Code of Fishing Practice, that nets should be hauled as quickly as possible to reduce the time that it remains within the diving range of fur seals (South East Trawl Fishing Industry Association SETFIA 2000/updated 2007);
• net hauling should be as fast as possible below maximum dive depth of the seals (about 200 m) to reduce the length of time available for Australian fur seals to reach the vessel, but should then proceed at speeds that are slower that the minimum average swimming speeds for fur seals (about 7.2 km/h) to reduce likelihood of seals becoming bycatch in the upper water column;
• to facilitate this hauling procedure, an improved method of determining net velocity through the water column is necessary, and;
• changes to the Code of Fishing Practice would be unwise until a dedicated investigation of the relationship between haul speed and seal by-catch incidence is undertaken.
Tilzey et al. (2006) experimented with SEDs and with different SED designs. Problems of fish-loss via the SED escape hatch and net blockage via the SED grid were encountered and solved by changes in SED design. The forward-facing ‘top-hatch’ SED had a significantly lower occurrence of seal bycatch than other SED designs and nets without a SED. An overall seal bycatch survival rate of 48% was achieved in nets fitted with SEDs, compared to zero for nets without a SED, largely because the SEDs prevented seals entering the cod-end where most drownings probably occur (Tilzey et al. 2006). However, SED performance remains largely unquantified because underwater video footage is limited and the numbers of seals interacting with the trawl net and successfully exiting the net via the SED escape hatch during this study were unknown. Obtaining significant results on SED performance by comparing replicate sets of trawl shots with and without a SED is difficult, because of the generally low level of seal bycatch and the complex suite of factors influencing seal interactions with the trawl net (Tilzey et al. 2006).
Exclusion devices - SPF (mid-water trawl):
Mid-water trawling was trialled off the east coast of Tasmania during 2001 using the pair trawl method, the success of which lead to the introduction of a purpose built mid-water trawler into the fishery in late 2002 (Lyle and Willcox 2008). From the commencement of operations, the mid-water trawl net included a ‘soft’ rope-mesh SED (Browne et al. 2005). No marine mammal bycatch was reported until October 2004, at

29
which time 14 dolphin mortalities occurred in two separate hauls east of Flinders Island. Modifications were made to the exclusion device (enlarging and moving the escape opening from the underside to the top of the net) in an attempt to make it easier for dolphins to exit the trawl. In addition, a code of conduct was adopted which included not setting the trawl if dolphins were visible around the vessel and moving at least ten kilometres from the area prior to setting the gear. In response to the dolphin mortalities, AFMA implemented 100% observer coverage of fishing operations and established the Cetacean Mitigation Working Group (CMWG) which had a primary role of identifying strategies to mitigate cetacean bycatch for inclusion in the SPF Bycatch Action Plan and to provide advice on research needs to develop mitigation measures. Further dolphin and seal mortalities were recorded (11 dolphins and three incidents of seal mortality in the trawl net in 2005/06, Lyle and Willcox 2006). An underwater camera system was deployed on the trawl net in the vicinity of the SED between June and September 2005 to better understand the behaviour of marine mammals in relation to the fishing gear (Browne et al. 2005). This pilot study indicated a high incidence of seal interactions whilst the net was fishing. Seals were observed entering and exiting through the SED escape opening to feed in the net (Browne et al. 2005). Browne et al. (2005) provided recommendations regarding the application of underwater video technology along with changes to the SED design, identifying the need for a rigid grid that was angled to direct megafauna towards the escape opening.
The Lyle and Willcox (2008 - grey literature, federal government commissioned report) study implemented recommendations from Browne et al. (2005) and aimed to quantify and characterise the nature and extent of the marine mammal bycatch in the SPF, and advance the development of mitigation strategies for mid-water trawlers to reduce mortalities of marine mammals in the trawl gear. The objectives of the Lyle and Willcox (2008) study were to determine the type and frequency of interactions between dolphins and seals and mid-water trawl gear based on underwater video observations; determine the incidence of dolphin and seal capture in mid-water trawl nets and, where feasible, investigate potential contributing factors; trial and assess the performance of various exclusion devices as options to mitigate dolphin and seal mortalities; and identify factors such as changes in net geometry during trawl fishing operations that present potential risks to dolphins and seals.
Lyle and Willcox (2006) reported that:
• Underwater video information for almost 100 trawls, representing over 700 hours of video footage was obtained (January 2006 – February 2007);
• Fur seals entered the body of the trawl in over half of all monitored shots, though interaction rates peaked at over 70% during autumn and winter and were below 25% at other times of the year. Seasonality may, in part at least, be the result of habituation, since seals appeared to become increasingly adept at entering the net to forage during periods of sustained fishing activity within localised areas;
• An estimated 151 seals were sighted inside the net in the vicinity of the SED and most seals entered via the net mouth and only a small proportion (13%) entered through the escape opening;
• Conversely, the greatest majority (64%) exited the net via the escape opening, relatively few (22%) exited out of the net mouth;
• Seals entered the net throughout the trawl operation (i.e. setting, during the fishing phase, during turns, hauling and while the catch was being pumped out). The highest rate of interactions occurred whilst the net was being set;

30
• numerically the majority of seals (62%) entered the net whilst it was fishing at depth (trawling typically occurs in shelf waters < 150 m), this particular operational phase accounting for the bulk (73%) of the trawl duration;
• Since trawling typically occurs in shelf waters (< 150 m), at depths within the dive capability of fur seals, the trawl effectively remains accessible to seals throughout the entire operation;
• Most interactions occurred at night, reflecting the concentration of trawl effort during the hours of darkness. When standardised for effort, this diurnal pattern was no longer evident, suggesting that the probability of interactions occurring was unaffected by time of day;
• The performance of bottom and top opening SED configurations were examined - due to operational limitations were unable to adequately trial the top opening design;
• SED configuration had no influence on interaction rates. However, by increasing the size of the escape opening, such that there was no floor in the net immediately in front of the excluder grid, a three-fold reduction in lethal interactions was achieved;
• By comparison with other Australian trawl fisheries the overall seal mortality rate is high in this fishery, around 0.19 seals per shot, though when the large escape opening was used this dropped to 0.12 per shot, which is comparable to the upper range for the winter blue grenadier fishery;
• All seal mortalities eventually fell out of the escape exit prior to the net being brought on-board the vessel, suggesting that many would not have been observed without the camera system and hence the scope of the bycatch issue would have been understated, even with a high level of observer coverage, and;
• There is considerable scope for further refinement in SED design, including the need to examine the suitability of a top escape opening and to investigate options to reduce the ingress of marine mammals and loss of fish out of the escape opening. Such refinements as the inclusion of an escape hatch and/or a hood over the escape hole warrant consideration.
Exclusion devices - New Zealand’s Auckland Islands squid trawl fishery:
Following the widespread deployment of SLEDs in the Auckland Islands squid trawl fishery, the observed fishing mortality and estimated captures of New Zealand sea lions have declined. However, there remains substantial uncertainty and scepticism about the efficacy of SLEDs and whether ‘cryptic’ mortality is occurring with claims that some animals that had escaped from the net could have suffered mortality-causing head trauma from hitting the SLED’s hard grid (Robertson and Chilvers 2011).
To assess the efficacy of SLEDs in reducing incidental mortality of New Zealand sea lions in the Auckland Islands squid trawl fishery, a number of research projects and reviews of data have been undertaken.
An experimental approach where sea lions were trapped after passing through a SLED:
To assess whether SLEDs allowed for the escape of sea lions and whether sea lions survived the process, a Government-led experiment was carried out where New Zealand sea lions were deliberately trapped and drowned after passing through a SLED (Wilkinson et al. 2003). The closed ‘cover-net’ was installed over the escape hole to retain and, if they had escaped alive, necessarily drown animals that had successfully negotiated the SLED. For a small number of these sea lions, video footage was obtained of the animal passing through the SLED (Wilkinson et al. 2003). The sea lion carcasses were subsequently necropsied to assess injuries (Gibbs et al. 2001 in Wilkinson et al. 2003; Gibbs et al. 2003).
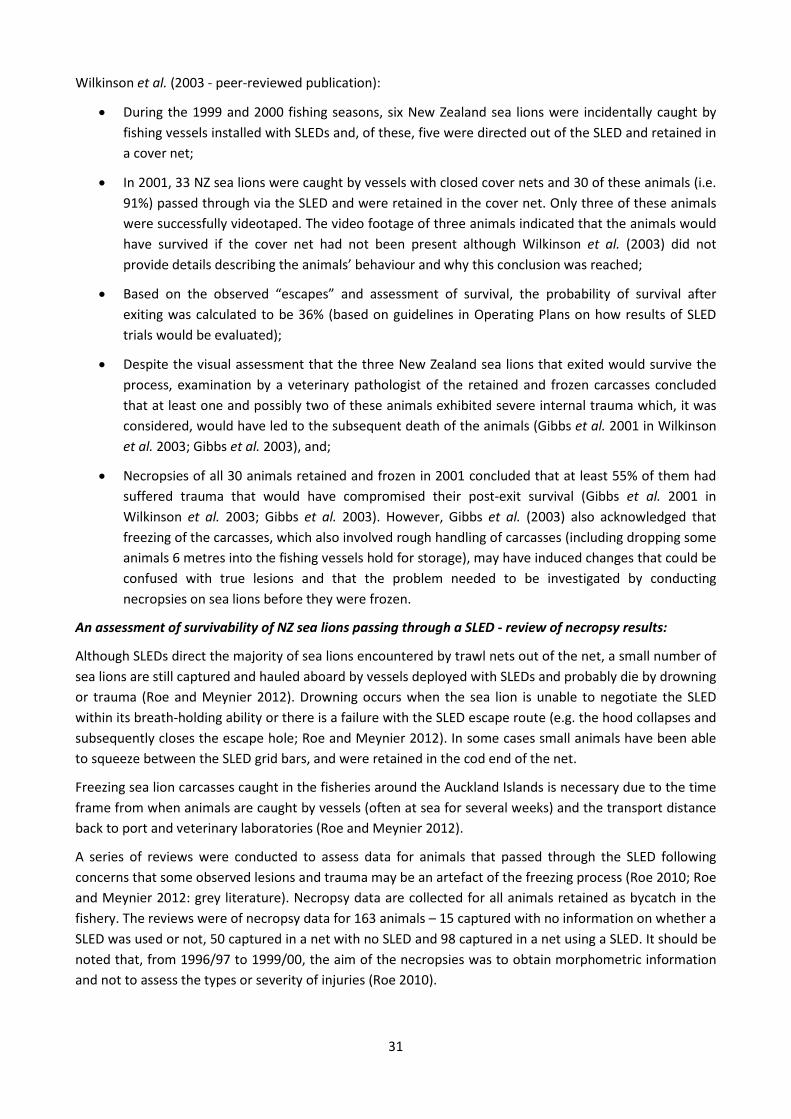
31
Wilkinson et al. (2003 - peer-reviewed publication):
• During the 1999 and 2000 fishing seasons, six New Zealand sea lions were incidentally caught by fishing vessels installed with SLEDs and, of these, five were directed out of the SLED and retained in a cover net;
• In 2001, 33 NZ sea lions were caught by vessels with closed cover nets and 30 of these animals (i.e. 91%) passed through via the SLED and were retained in the cover net. Only three of these animals were successfully videotaped. The video footage of three animals indicated that the animals would have survived if the cover net had not been present although Wilkinson et al. (2003) did not provide details describing the animals’ behaviour and why this conclusion was reached;
• Based on the observed “escapes” and assessment of survival, the probability of survival after exiting was calculated to be 36% (based on guidelines in Operating Plans on how results of SLED trials would be evaluated);
• Despite the visual assessment that the three New Zealand sea lions that exited would survive the process, examination by a veterinary pathologist of the retained and frozen carcasses concluded that at least one and possibly two of these animals exhibited severe internal trauma which, it was considered, would have led to the subsequent death of the animals (Gibbs et al. 2001 in Wilkinson et al. 2003; Gibbs et al. 2003), and;
• Necropsies of all 30 animals retained and frozen in 2001 concluded that at least 55% of them had suffered trauma that would have compromised their post-exit survival (Gibbs et al. 2001 in Wilkinson et al. 2003; Gibbs et al. 2003). However, Gibbs et al. (2003) also acknowledged that freezing of the carcasses, which also involved rough handling of carcasses (including dropping some animals 6 metres into the fishing vessels hold for storage), may have induced changes that could be confused with true lesions and that the problem needed to be investigated by conducting necropsies on sea lions before they were frozen.
An assessment of survivability of NZ sea lions passing through a SLED - review of necropsy results:
Although SLEDs direct the majority of sea lions encountered by trawl nets out of the net, a small number of sea lions are still captured and hauled aboard by vessels deployed with SLEDs and probably die by drowning or trauma (Roe and Meynier 2012). Drowning occurs when the sea lion is unable to negotiate the SLED within its breath-holding ability or there is a failure with the SLED escape route (e.g. the hood collapses and subsequently closes the escape hole; Roe and Meynier 2012). In some cases small animals have been able to squeeze between the SLED grid bars, and were retained in the cod end of the net.
Freezing sea lion carcasses caught in the fisheries around the Auckland Islands is necessary due to the time frame from when animals are caught by vessels (often at sea for several weeks) and the transport distance back to port and veterinary laboratories (Roe and Meynier 2012).
A series of reviews were conducted to assess data for animals that passed through the SLED following concerns that some observed lesions and trauma may be an artefact of the freezing process (Roe 2010; Roe and Meynier 2012: grey literature). Necropsy data are collected for all animals retained as bycatch in the fishery. The reviews were of necropsy data for 163 animals – 15 captured with no information on whether a SLED was used or not, 50 captured in a net with no SLED and 98 captured in a net using a SLED. It should be noted that, from 1996/97 to 1999/00, the aim of the necropsies was to obtain morphometric information and not to assess the types or severity of injuries (Roe 2010).

32
To look at effects of freezing and thawing, an experiment was conducted in 2008 and 2009 using five chilled and five frozen New Zealand fur seals that were all recovered from trawl nets without exclusion devices in the Cook Strait hoki fishery. Although these were small samples sizes, this experiment showed that some lesions originally thought to be due to trauma were artefacts of freezing (Roe and Meynier 2012).
Roe and Meynier (2012) conducted a review of necropsy data to determine whether it was possible to apply a consistent set of trauma criteria across all necropsied NZ sea lions using archived records (i.e. ‘revised criteria’). The use of a SLED did not seem to affect either the overall reported trauma severity or the prevalence of head bruising and also that the pattern of bruising involving the sternum, shoulders and axillae appears to be unrelated to SLED use (Roe and Meynier 2012). Based on the revised criteria, 49% (80/163) had moderate or severe trauma that could have compromised the likelihood of survival if the animal had been able to exit the net (Roe and Meynier 2010). However, many ‘injuries’ that were observed on dead animals were thought to have occurred well before death and the assessment was also compromised by the knowledge that some lesions originally thought to be due to trauma were actually artefacts of freezing (Roe and Meynier 2012). Therefore, it was considered that there was no evidence in the necropsy data that necropsied animals died as a direct result of trauma or that they sustained trauma that would have been severe enough to affect their survival if they had been able to escape rather than drown in the net (Roe 2010).
Although based on a very small sample size, Middleton and Breen (2011 - grey literature) considered the original assessment by Wilkinson et al. (2003) that the three animals videoed in cover nets after escaping via the SLED were likely to have survived, must be assumed to stand. This determination of survival was questioned by Gibbs et al. (2001 - in Wilkinson et al. 2003) solely on the basis of necropsy results. However, it has now been established that the lesions considered to be evidence of “acute blunt trauma” in these animals are artefacts of freezing and a reliable assessment of survivability via necropsy is not possible for this fishery due to the post-capture handling of carcasses (including the necessity of freezing carcasses).
The assessment of necropsy data has been complicated and drawn out over several years which may have contributed to some remaining public perception in New Zealand that SLED impacts cause life-threatening trauma in New Zealand sea lions. However, the current expert opinion is that the observed trauma on reported animals was due to artefacts of freezing and not collisions with fishing gear.
Re-analysis of video footage of fur seals passing through a Seal Exclusion Device (SED):
The behaviour and responses of fur seals to SED interactions in the SPF may provide some information to help assess the possible nature of New Zealand sea lion and SLED interactions and, in particular, the potential of head trauma injuries that may result from head-first collisions with a metal grid (Lyle 2011). Therefore, Lyle 2011 (grey literature) undertook a review of underwater video footage from 2006/07 (Lyle and Willcox 2008) of interactions between fur seals and SEDs deployed in the Australian SPF. This review aimed to record the nature (i.e. whether seals struck the grid, the speed at which they struck and where on the grid the impact occurred) and potential consequences of collisions with a rigid steel grid (Lyle 2011).
Interactions with the SED were described for 132 seals although the clarity and quality of the footage influenced how much information could be obtained for each interaction (Lyle 2011). The review of the fur seal video footage showed that about one third of the seals that entered via the mouth of the trawl approached the SED head-first and most of them experienced a head-first collision with the grid (usually the upper half of the SED grid) and usually the angle of the head was more or less perpendicular to the grid (Lyle 2011). Impact velocities were also estimated with first interaction head-first impacts occurring at a slightly faster speed (average of 3.5 m/s with a range of 2.9-6.1 m/s) than subsequent head-first collisions

33
(Lyle 2011). There was no significant difference in the mortality rates between seals that had at least one head-first collision with the SED grid and those that did not contact the SED head-first (Lyle 2011).
Lyle (2011) did not discuss the implications of the assessment of the video footage on the extent and nature of impact injuries or the subsequent survival of fur seals as there had been no post-interaction or post-mortem examination of the seals during the original study.
Biomechanical study – simulating the impact of sea lions hitting the metal grid of a SLED:
Ponte et al. (2010 - grey literature) used a validated method for measuring head impact injury in human pedestrians (‘crash tests’) with scaling and extrapolating to account for the relative head and brain mass of the New Zealand sea lion to assess the likelihood of Mild Traumatic Brain Injury (i.e. ‘concussion’) to a sea lion as a result of a head impact with SLED stainless steel grid. For particular impact locations on the SLED grid, the likelihood of a brain injury, based on swim speed and effective sea lion head mass, was determined using the ‘crash test’ results (Ponte et al. 2010).
The ‘crash test’ results indicated that a sea lion impacting with the grid may incur some sort of brain injury and the risk of life-threatening brain injury may be higher than 85% for a female sea lion in a 10 m/s (based on trawl speed of 2 m/s and estimated burst speed of an adult sea lion of 8 m/s) collision with the SLED grid at the stiffest location tested (Ponte et al. 2010). However, this impact speed probably represents the worst case scenario, especially if Lyle’s (2011) fur seal interaction speeds are considered indicative of New Zealand sea lion interactions, and may be more dependent on individual sea lion behaviour than the grid design (Industrial Research Ltd 2011 - grey literature).
Modelling the risk of sea lions suffering mild traumatic brain injury after striking a SLED grid:
Using modelling simulations and the results from the ‘crash-test’ methodology (Ponte et al. 2010) and the re-analysis of video footage of fur seals interacting with SEDs (Lyle 2011), Abraham (2011 - grey literature) developed a simulation-based probabilistic model to estimate the risk of a sea lion suffering a mild traumatic brain injury when striking a SLED grid. Abraham (2011) estimated the probability that a sea lion interacting with a SLED (single collision) suffers Mild Traumatic Brain Injury was less than 5%.
MPI (2012) consider that the research and assessments on SLED efficacy (reviewed above), provide robust evidence that SLEDs greatly increase the survival probability of those sea lions that enter a trawl net. The weight of evidence is that SLEDs are effective in reducing the incidental mortality of New Zealand sea lions in the Auckland Islands squid fishery. This is supported by the biological information available that shows New Zealand sea lion adult survival at the Auckland Islands is high (Chilvers and MacKenzie 2010) which may not be the case if the fishery was still having a direct impact on the population.
1.7.4 Are there organisations working on mitigation?
The Deepwater Group Pty Ltd in New Zealand has been working on refining the SLED to reduce bycatch of New Zealand sea lions and commissioning research to test the efficacy of this mitigation measure.
1.8 Recommended management needs and research ideas
• The identified mitigation measures, particularly the correct use of exclusion devices, have all contributed to reduced pinniped bycatch in trawl fisheries. For the SPF large freezer trawler fishery, SEDs will require testing and reconfiguration until a fishery specific practical and viable SED design is identified, and;
• Industry consultation and education is important to meet management goals and effectively reduce incidental bycatch.

34
Hamer and Goldsworthy (2006) recommendations based on work on factory trawlers in the winter blue grenadier fishery off western Tasmania:
• need for additional modifications to fishing practices conducted by factory trawlers in this fishery;
• recommend that commercial fishing activity cease during rough weather when seal numbers appear to be greatest, particularly if the number of seals observed at the surface is considered as a reliable surrogate indicator of the number of animals potentially interacting with the trawl net beneath the surface;
• a buffer zone that prohibits or restricts fishing activity within a specified proximity to Hibbs Point should also be considered as a precautionary approach, although it was impossible to determine from this investigation what an appropriate distance would be;
• recommend further trials of SEDs effectiveness be conducted in conjunction with sub-surface video equipment, so that the incidence of net entry can be directly compared with seal bycatch and mortalities in order to calculate rates;
• This study found that seal bycatch mortality also occurs during shooting whereas most previous studies assumed that seal by-catch occurs exclusively during hauling. Although it appears that seals are equally as likely to become caught in the trawl net during shooting, the low incidence of bycatch recorded emphasises the need to continue investigating subsurface interactions, and;
• future research should also focus on seal bycatch reduction during shooting by trialling devices that hold the net mouth closed until the net reaches the fishing depth.
From Lyle and Willcox (2008): There is considerable scope to further refine the SED design used in the SPF. SED orientation, size and type of escape opening are refinements that could be examined.
• A key requirement for the exclusion grid is that it is angled sufficiently to readily deflect megafauna
towards the exit, other studies have recommended an angle of around 45o, which is substantially
greater than currently used in the fishery;
• The effectiveness of a top opening escape option requires further investigation, both for its potential to better facilitate the exit of marine mammals (towards the surface) and to address the issue of bycatch drop-out. In the absence of underwater observations, bycatch will be under-reported with the current bottom opening configuration, regardless of the level of observer coverage;
• Considerable refinement in grid design is required to overcome operational issues relating to implementing a top opening system. For factory trawlers with extensive trawl deck space it is feasible to have relatively large and sophisticated SED configurations which can be stowed safety on deck;
• As evidenced in the pilot study (Browne et al. 2005) and to a lesser extent here, an open escape exit can provide a ready point of access for seals. This coupled with issues of fish loss suggest that further refinements are required to the exit and there are a range of hood and exit hatch designs available that have been trialled in other fisheries, and;
• For bottom opening configurations there is a need to investigate options to reduce the likelihood that seal and other megafauna mortalities fall out of the net prior to being identified and recorded. Any such options must not impede the exit of healthy specimens.
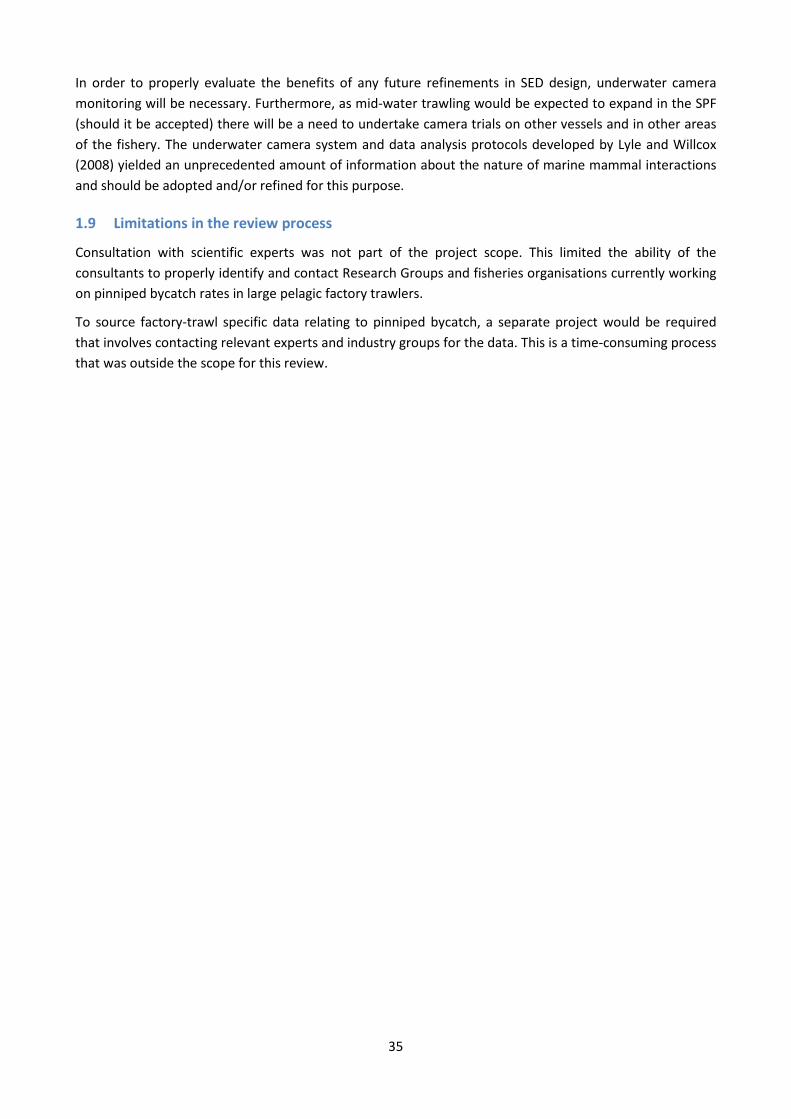
35
In order to properly evaluate the benefits of any future refinements in SED design, underwater camera monitoring will be necessary. Furthermore, as mid-water trawling would be expected to expand in the SPF (should it be accepted) there will be a need to undertake camera trials on other vessels and in other areas of the fishery. The underwater camera system and data analysis protocols developed by Lyle and Willcox (2008) yielded an unprecedented amount of information about the nature of marine mammal interactions and should be adopted and/or refined for this purpose.
1.9 Limitations in the review process
Consultation with scientific experts was not part of the project scope. This limited the ability of the consultants to properly identify and contact Research Groups and fisheries organisations currently working on pinniped bycatch rates in large pelagic factory trawlers.
To source factory-trawl specific data relating to pinniped bycatch, a separate project would be required that involves contacting relevant experts and industry groups for the data. This is a time-consuming process that was outside the scope for this review.

36
1.10 References (Pinnipeds) Abraham, E.R. 2011. Probability of Mild Traumatic Brain Injury for sea lions interacting with SLEDs. Final Research Report for Ministry of Fisheries project SRP2011-03 (Unpublished report held by the Ministry of Fisheries, Wellington). 21 pp.
Anon. 2006. Convention for the Conservation of Antarctic Marine Living Resources (Basic Instrument for the Commission for the Conservation of Antarctic Marine Living Resources CCAMLR). Page 7. NOAA, NMFS. http://www.nmfs.noaa.gov/ia/intlagree/docs/CCAMLR%2005.doc (Accessed 15/6/2013).
Arnould, J.P.Y. and Hindell, M.A. 2001. Dive behaviour, foraging locations and maternal-attendance patterns of Australian fur seals (Arctocephalus pusillus doriferus). Canadian Journal of Zoology 79: 35–48.
Australian Fisheries Management Authority (AFMA). (undated). Threatened, Endangered and Protected (TEP) Species Management Fact Sheet No. 1 Seals and Sea lions. http://www.afma.gov.au/wp-content/uploads/2010/06/factsheet1_sealssealions.pdf (Accessed 31/5/2013).
AFMA. 2009. South East Trawl Fishery Bycatch and Discarding Workplan, 01 July,2009 to 30 June, 2011. Australian Fisheries Management Authority, URL http://www.afma.gov.au/wp-content/uploads/2010/06/set_bwp_2009_06_16.pdf
AFMA. 2011. Small Pelagic Fishery Bycatch and discarding workplan 2011 - 2013. Australian Government, Australian Fisheries Management Authority.
AFMA. 2012. Protected species interaction reports from AFMA logbooks http://www.afma.gov.au/managing-our-fisheries/environment-and-sustainability/protected-species/ (Accessed 31/5/2013).
Baird, S.J. and Smith, M.H. 2007. Incidental capture of New Zealand fur seals (Arctocephalus forsteri) in commercial fisheries in New Zealand waters, 2003-04 and 2004-05. New Zealand Aquatic Environment and Biodiversity Report No. 14. 98pp
Baker, C.S., Chilvers, B.L., Constantine, R., DuFresne, S., Mattlin, R., van Helden, A. and Hitchmough, R. 2010. Conservation status of New Zealand Marine Mammals (suborders Cetacea and Pinnipedia), 2009. New Zealand Journal of Marine and Freshwater Research 44: 101–115.
Baylis, A.M.M., Page, B. and Goldsworthy, S.D. 2008. Effect of seasonal changes in upwelling activity on the foraging locations of a wide-ranging central-place forager, the New Zealand fur seal. Canadian Journal of Zoology 86: 774–89.
Baylis, A.M.M., Page, B., Peters, K., McIntosh, R., McKenzie, J. and Goldsworthy, S. 2005. The ontogeny of diving behaviour in New Zealand fur seal pups (Arctocephalus forsteri). Canadian Journal of Zoology 89: 1149–1161.
Boren, L.J. 2010. Diet of New Zealand fur seals (Arctocephalus forsteri): a summary. Department of Conservation Research and Development Series 319. Department of Conservation, Wellington.
Boren, L.J., Muller, C.G. and Gemmell, N.J. 2006. Colony growth and pup condition of the New Zealand fur seal (Arctocephalus forsteri) on the Kaikoura coastline compared with other east coast colonies. Wildlife Research 33: 497-505.
Browne, A., Welsford, D. and Lyle, J. 2005. Monitoring marine mammal interactions in the Small Pelagic Fishery: Stage one pilot study. Report to the Australian Fisheries Management Authority, 19pp.

37
Campagna, C. (IUCN SSC Pinniped Specialist Group) 2008. Mirounga leonina. In: IUCN 2012. IUCN Red List of Threatened Species. Version 2012.2. <www.iucnredlist.org>. Downloaded on 13 June 2013.
Campbell, R.A., Gales, N.J., Lento, G.M., and Baker, C.S. 2008a. Islands in the sea: extreme female natal site fidelity in the Australian sea lion, Neophoca cinerea. Biology Letters 4: 139–142.
Campbell, R., Holley, D., Christianopoulos, D., Caputi, N. and Gales, N.J. 2008b. Mitigation of incidental mortality of Australian sea lions in the West Coast Rock Lobster Fishery. Endangered Species Research 5: 345–358.
Carretta, J.V., Forney, K.A., Lowry, M.S., Barlow, J., Baker, J., Johnston, D., Hanson, B., Brownell Jr. R.L, Robbins, J., Mattila, D.K., Ralls, K., Muto, M.M., Lynch, D. and Carsell, L. 2009. U.S. Pacific Marine Mammal Stock Assessments: 2009. NOAA-TM-NMFS-SWFSC-453 U. S. Department of Commerce, National Oceanic and Atmospheric Administration, National Marine Fisheries Service, Southwest Fisheries Science Centre.
Carretta, J.V., Oleson, E., Weller, D.W., Lang, A.R., Forney, K.A., Baker, J., Hanson, B., Martien, K., Muto, M.M., Lowry, M.S., Barlow, J., Lynch, D., Carswell, L., Brownell Jr., R. L., Mattila, D. K. and Hill, M.C.. 2013. U.S. Pacific Marine Mammal Stock Assessments: 2012. U.S. Department of Commerce, NOAA Technical Memorandum, NMFS-SWFSC-504. 378 p.
Cawthorn, M. 2008. Review of Worldwide Best Practice Mitigation Devices for Pinniped Incidental Captures in Trawls. Clement and Associates Ltd. A report commissioned by the Department of Conservation, New Zealand.
Chilvers, B.L. 2008. New Zealand sea lions Phocarctos hookeri and squid trawl fisheries: bycatch problems and management options. Endangered Species Research.5: 193–204.
Chilvers, B.L. and MacKenzie, D. 2010. Age- and sex-specific survival estimates incorporating tag loss for New Zealand sea lions, Phocarctos hookeri. Journal of Mammalogy 91(3): 758-767.
Clement and Associates Ltd. 2007. Squid Trawl Fleet Sea Lion Escape Device Audit. A report commissioned by Department of Conservation, September-October 2007. Clement and Associates Ltd, Nelson, New Zealand.
Costa, D. P., and Gales, N.J. 2003. Energetics of a benthic diver: seasonal foraging ecology of the Australian sea lion, Neophoca cinerea. Ecological Monographs 73:27–43.
Crespo, E.A., Pedraza, S.N., Dans, S.L, Alonso, M.K., Reyes, L.M., Garcia, N.A., Coscarella, M., Schiavini, A.C.M. 1997. Direct and Indirect Effects of the Highseas Fisheries on the Marine Mammal Populations in the Northern and Central Patagonian Coast. Northwest Atlantic Fisheries Science 22: 189–207.
David, J. and Wickens, P. 2003. Management of Cape fur seals and fisheries in South Africa. In: Gales, N., Hindell, M. and Kirkwood, R. (eds). Marine Mammals; Fisheries, Tourism and Management Issues. p 116-135. CSIRO Publishing, Melbourne.
Dans, S., L., Alonso, M.K., Crespo, E.A., Pedraza, S.N. and Garcia, N.A. 2003. Interactions between marine mammals and high seas fisheries in Patagonia: An intergrated approach. In: Gales, N., Hindell, M. and Kirkwood, R. (eds). Marine Mammals. Fisheries, Tourism and Management Issues, pp. 100-115. Melbourne: CSIRO Publishing.
Deagle, B.E., Kirkwood, R. and Jarman, S.N. 2009. Analysis of Australian fur seal diet by pyrosequencing prey DNA in faeces. Molecular Ecology 18: 2022–2038.
Deepwater Group. 2011. Operation procedures Marine Mammals. October 2011, Deepwater Group Ltd, New Zealand.
38
Department of the Environment, Water, Heritage and the Arts (DEWHA). 2009. Threat Abatement Plan for the Impacts of Marine Debris on Vertebrate Marine Life. Commonwealth of Australia. http://www.environment.gov.au/biodiversity/threatened/publications/tap/marine-debris.html
DEWHA. 2010. Draft Recovery Plan for the Australian Sea-lion (Neophoca cinerea). DEWHA, Commonwealth of Australia.
Department of Primary Industries, Parks, Water and the Environment (DPIPWE). 2012a. New Zealand fur seal fact sheet. http://www.dpiw.tas.gov.au/inter.nsf/webpages/bhan-53k7c8?open (Accessed 17/5/13).
DPIPWE. 2012b. Southern elephant seal fact sheet. http://www.dpiw.tas.gov.au/internnsf/WebPages/BHAN-53K6XV?open (Accessed 13/6/13).
Department of Sustainability, Environment, Water, Population and Communities (DSEWPaC). 2012a. Species report card - pinnipeds. Supporting the marine bioregional plan for the South-west Marine Region.
DSEWPaC. 2012b. SPRAT: New Zealand fur seals.
http://www.dpiw.tas.gov.au/inter.nsf/webpages/bhan-53k7c8?open (Accessed 28/05/13).
DSEWPaC. 2012c. SPRAT: Australian fur seals.
http://www.environment.gov.au/cgi-bin/sprat/public/publicspecies.pl?taxon_id=21 (Accessed 28/05/13).
DSEWPaC. 2012d. SPRAT: Sea lions.
http://www.environment.gov.au/cgi-bin/sprat/public/publicspecies.pl?taxon_id=22. (Accessed 28/05/13).
DSEWPaC. 2012e. SPRAT: Southern elephant seal.
http://www.environment.gov.au/cgi-bin/sprat/public/publicspecies.pl?taxon_id=26 (Accessed 16/06/13).
Fowler, S.L., Costa, D.P. and Arnould, J.P. 2007. Ontogeny of movements and foraging ranges in the Australian sea lion. Marine Mammal Science 23: 598-614.
Gales, N.J., Cheal, A.J., Pobar, G.J. and Williamson, P. 1992. Breeding biology and movements of Australian sea-lions, Neophoca cinerea, off the west coast of Western Australia. Wildlife Research. 19: 405-416.
Gales, N. J., Shaughnessy, P. D., and Dennis, T. E. 1994. Distribution, abundance and breeding cycle of the Australian sea lion Neophoca cinerea (Mammalia: Pinnipedia). Journal of Zoology 234: 353–370.
Gales, N.J., Haberley, B, and Collins, P. 2000. Changes in the abundance of New Zealand fur seals, Arctocephalus forsteri, in Western Australia. Wildlife Research 27: 165–168.
Gibbs, N.J., Duignan, P.J. and Jones, G.W. 2003. Part 3: Autopsy report for 2000/01 In: Duignan, P.J., Gibbs, N.J. and Jones, G.W. 2003. Autopsy of pinnipeds incidentally caught in fishing operations 1997/98, 1999/2000, and 2000/01. Department of Conservation, New Zealand, Science Internal Series 118.106 pp.
Goldsworthy, S. D., Bulman, C., He, X., Larcombe, J., and Littnan, C. 2003. Trophic interactions between marine mammals and Australian fisheries: an ecosystem approach (pp. 62–99). In: Gales, N., Hindell, M. and Kirkwood, K. (eds) Marine Mammals: Fisheries, Tourism and Management Issues. CSIRO Publishing: Melbourne.
Goldsworthy, S. and Gales, N. (IUCN SSC Pinniped Specialist Group) 2008a. Arctocephalus forsteri. In: IUCN 2012. IUCN Red List of Threatened Species. Version 2012.2. <www.iucnredlist.org>. Downloaded on 12 June 2013.

39
Goldsworthy, S. and Gales, N. (IUCN SSC Pinniped Specialist Group) 2008b. Neophoca cinerea. In: IUCN 2012. IUCN Red List of Threatened Species. Version 2012.2. <www.iucnredlist.org>. Downloaded on 12 June 2013
Goldsworthy, S.D., McKenzie, J., Shaughnessy, P.D., McIntosh, R.R., Page, B. and Campbell, R. 2009. An update of the report: understanding the impediments to the growth of Australian sea lion populations. SARDI Aquatic Sciences Publication Number F2008/000847-1. SARDI Research Report Series No. 356, pp. 175. South Australian Research and Development Institute, Adelaide.
Goldsworthy, S.D. and Page, B. 2007. A risk-assessment approach to evaluating the significance of seal bycatch in two Australian fisheries. Biological Conservation 139: 269-285.
Goldsworthy, S.D. and Page, B. 2009. A Review of the Distribution of Seals in South Australia, South Australian Research and Development Institute (Aquatic Sciences), Adelaide, SARDI Publication No. F2009/000368-1, 21pp. South Australian Research and Development Institute, Adelaide.
Goldsworthy, S.D., Page B., Shaughnessy, P..D and Linnane, A. 2010. Mitigating seal interactions in the SRLF and the Gillnet Sector SESSF in South Australia, report to the Fisheries Research and Development Institute, South Australian Research and Development Institute (Aquatic Sciences), publication no. F2009/000613-1, Research Report Series no. 405, Adelaide.
Goldsworthy, S.D., and Shaughnessy, P.D. 2013. Abundance of New Zealand fur seal pups in the Cape Gantheaume Wilderness Protection Area, Kangaroo Island: 2011-12 breeding season. Report to Nature Foundation, South Australia. South Australian Research and Development Institute, Adelaide.
Hamer, D.J. and Goldsworthy, S.D. 2006. Seal–fishery operational interactions: Identifying the environmental and operational aspects of a trawl fishery that contribute to by-catch and mortality of Australian fur seals (Arctocephalus pusillus doriferus). Biological Conservation 130: 517-529.
Hindell, M. A., and Pemberton, D. 1997. Successful use of a translocation program to investigate diving behavior in a male Australian fur seal, Arctocephalus pusillus doriferus. Marine Mammal Science 13: 219–228.
Hofmeyr, G. and Gales, N. (IUCN SSC Pinniped Specialist Group) 2008. Arctocephalus pusillus. In: IUCN 2012. IUCN Red List of Threatened Species. Version 2012.2. <www.iucnredlist.org>. Downloaded on 12 June 2013.
Hooper, J., Clark, J.M, Charman, C. and Agnew, D. 2005. Seal mitigation measure on trawl vessels fishing for krill in CCAMLR subarea 48.3. CCAMLR Science 12 2005: 195–205.
Hume, F., Hindell, M. A., Pemberton, D., and Gales, R. 2004. Spatial and temporal variation in the diet of a high trophic level predator, the Australian fur seal (Arctocephalus pusillus doriferus). Marine Biology 144: 407–415.
Industrial Research Ltd (Banerjee, B.). 2011. Review of CAR report on impact characteristics of a SLED grid. Report No. 36690492.01. Report for DeepWater Group Ltd, New Zealand.
Kirkwood, R., Gales, R., Terauds, A., Arnould, J.P.Y., Pemberton, D., Shaughnessy, P., Mitchell, A.T. and Gibbens, J. 2005. Pup production and population trends of the Australian fur seal (Arctocephalus pusillus doriferus). Marine Mammal Science 21: 260–282.
Kirkwood, R., Pemberton, D., Gales, R., Hoskins, A.J., Mitchell, T., Shaughnessy, P.D. and Arnould, J.P.Y. 2010. Continued population recovery by Australian fur seals. Marine and Freshwater Research. 61: 695-701.
40
Kovacs, K.M., Aguilar, A., Aurioles, D., Burkanov, V., Campagna, C., Gales, N., Gelatt, T., Goldsworthy, S.D., Goodman, S.J., Hofmeyr, G.J.G., Onen, T.A., Lowry, L., Lydersen, C., Schipper, J., Sipil, T., Southwell, C., Stuart, S., Thompson, D. and Trillmich, F. 2012. Global threats to pinnipeds. Marine Mammal Science 28(2): 414-436.
Lalas, C. and Bradshaw, C.J.A. 2001. Folklore and chimerical numbers: Review of a millennium of interaction between fur seals and humans in the New Zealand region. New Zealand Journal of Marine and Freshwater Research 35(3): 477-497.
Lowther, A.D., Harcourt, R.G., Goldsworthy, S.D. and Stow, A. 2012. Population structure of adult female Australian sea lions is driven by fine-scale foraging site fidelity. Animal Behaviour 83(3): 691-701
Lyle, J.M. 2011. Fur seal interactions with SED excluder device. SRP2010-03: Report for Ministry for Fisheries, Wellington, New Zealand.
Lyle, J. M. and Willcox, S.T. 2008. Dolphin and seal interactions with mid-water trawling in the Small Pelagic Fishery, including an assessment of bycatch mitigation strategies. Final Report Project R05/0996 Tasmanian Aquaculture and Fisheries Institute and Australian Fisheries Management Authority.
Macfadyen, G., Huntington, T. and Cappell, R. 2009. Abandoned, lost or otherwise discarded fishing gear. UNEP Regional Seas Reports and Studies No. 185 and FAO Fisheries and Aquaculture Technical Paper No. 523. FAO and UNEP.
McIntosh, R.R., Arthur, A.D., Dennis, T., Berris, M., Shaughnessy, P.D. and Teixeira, C.E.P. 2013. Survival estimates for the Australian sea lion: Negative correlation of sea surface temperature with cohort survival to weaning. Marine Mammal Science 29: 84-108.
McIntosh, R. R., Page, B. and Goldsworthy, S.D. 2006. Dietary analysis of regurgitates and stomach samples from free-living Australian sea lions. Wildlife Research 33: 661–669.
McIntosh, R.R., Goldsworthy, S.D., Shaughnessy, P.D., Kennedy, C.W., and Burch, P. 2012. Estimating pup production in a mammal with an extended and aseasonal breeding season, the Australian sea lion (Neophoca cinerea). Wildlife Research 39: 137–148.
Middleton, D.A.J. and Breen, P.A. 2011. Reviewing the Review of the Review: comments on the Sea Lion Necropsy. Expert Panel Review Report, New Zealand.
Ministry of Agriculture and Forestry (MAF). 2012. Aquatic Environment and Biodiversity Annual Review 2011: a summary of environmental interactions between fisheries and the aquatic environment. Fisheries Management Science Team, Wellington, New Zealand.
Ministry for Primary Industries (MPI). 2012. Squid (SQU6T) - Final advice paper. New Zealand.
Moore, A. and Skirtun, M. 2012. Chapter 7: Small Pelagic Fishery. In: Woodhams, J., Vieira, S. and Stobutzki, I. (eds). 2012. Fishery status reports 2011, Australian Bureau of Agricultural and Resource Economics and Sciences, Canberra.
Moore, A. and Vieira, S. 2012. Chapter 11: Great Australian Bight Trawl Sector. . In: Woodhams, J., Vieira, S. and Stobutzki, I. (eds). 2012. Fishery status reports 2011, Australian Bureau of Agricultural and Resource Economics and Sciences, Canberra.
Moore, J.M., Wallace, B., Lewison, R.L., Zydelis, R., Cox, T. and Crowder, L. 2009. A review of marine mammal, sea turtle and seabird bycatch in USA fisheries and the role of policy in shaping management. Marine Policy 33: 435–451.

41
Morizur, Y., Berrow, S.D., Tregenza, N.J.C., Couperus, A.S. and Pouvreau, S. 1999. Incidental catches of marine-mammals in pelagic trawl fisheries of the northeast Atlantic. Fisheries Research 41: 297-307.
National Marine Fisheries Service (NMFS). 2011. Recovery Plan for the Steller sea lion (Eumetopias jubatus): Eastern and western distinct population segments - Revision. National Oceanic and Atmospheric Administration
NMFS. 2011. U.S. National Bycatch Report (W. A. Karp, L. L. Desfosse, S. G. Brooke, Editors). U.S. Dep. Commer., National Oceanic and Atmospheric Administration
NOAA Tech. Memo. NMFS-F/SPO-117E, 508 p.
National Seal Strategy Group (NSSG) and Stewardson, C. 2007. National assessment of interactions between humans and seals: fisheries, aquaculture and tourism, DAFF, Canberra.
Pace, D.S., Pulcin, i.M. and Triossi, F. 2012. Anthropogenic food patches and association patterns of Tursiops truncatus at Lampedusa Island, Italy. Behavioral Ecology 23(2): 254-264.
Page, B., McKenzie, J., and Goldsworthy, S. D. 2005. Dietary resource partitioning among sympatric New Zealand and Australian fur seals. Marine Ecology Progress Series 293: 283–302.
Page, B., McKenzie, J., McIntosh, R., Baylis, A., Morrissey, A., Calvert, N., Haase, T., Berris, M., Dowie, D., Shaughnessy, P.D. and Goldsworthy, S.D. 2004. Entanglement of Australian sea lions and New Zealand fur seals in lost fishing gear and other marine debris before and after government and industry attempts to reduce the problem. Marine Pollution Bulletin 49: 33–42.
Page, B., McKenzie, J., Sumner, M. D., Coyne, M., and Goldsworthy, S. D. 2006. Spatial separation of foraging habitats among New Zealand fur seals. Marine Ecology Progress Series 323: 263–279.
Pemberton, D., Brothers, N.P. and Kirkwood, R. 1992. Entanglement of Australian fur seals in man-made debris in Tasmanian waters. Wildlife Research 19: 151-159.
Peterson, S., Nel, D., Ryan, P. and Underhill, L. 2008. Understanding and Mitigating Vulnerable Bycatch in southern African Trawl and Longline Fisheries. WWF South Africa Report Series – 2008/Marine/002.
Pichel, W.G., Veenstra, T.S., Churnside, J.H., Arabini, E., Friedman, K.S., Foley, D.G., Brainard, R.E., Kiefer, D., Ogle, S., Clemente-Colon, P. and Li, X.F. 2012. GhostNet marine debris survey in the Gulf of Alaska - Satellite guidance and aircraft observations. Marine Pollution Bulletin 65: 28-41.
Ponte, G., van den Berg, A. and Anderson, R.W.G. 2010. Impact characteristics of the New Zealand Fisheries sea lion exclusion device stainless steel grid. Centre for Automotive Safety Research, The University of Adelaide, Australia.
Read, A.J., Drinker, P. and S. Northridge. 2006. Bycatch of marine mammals in U.S. and global fisheries. Conservation Biology 20: 163–169.
Reeves, R.R., McClellan, K. and Werner, T.B. 2013. Marine mammal bycatch in gillnet and other entangling net fisheries, 1990 to 2011. Endangered Species Research, 20: 71–97.
Reeves, R.R., Smith, B.D., Crespo, E.A. and Notarbartolo di Sciara, G. 2003. Dolphins, whales and porpoises: 2002–2010 conservation action plan for the world’s cetaceans. IUCN/SSC Cetacean Specialist Group.
Reyes, P., Hucke-gaete, R. and Torres-Florez, J.P. 2013. First observations of operational interactions between bottom-trawling fisheries and South American sea lion, Otaria flavescens in south-central Chile. Journal of the Marine Biological Association of the United Kingdom 93(2): 489–494.

42
Robertson, B.C. and B.L. Chilvers. 2011. The population decline of the New Zealand sea lion Phocarctos hookeri: a review of possible causes. Mammal Review 41: 253-275.
Roe, W.D. 2010 External review of NZ sea lion bycatch necropsy data and methods. Meeting held at the Institute of Veterinary, Animal and Biomedical Sciences, Massey University Palmerston North, New Zealand, June 9th and 10th 2010. AEWG2010-93.
Roe, W.D. and Meynier, L. 2012. Review of necropsy records for bycaught NZ sea lions (Phocarctos hookeri), 2000–2008. New Zealand Aquatic Environment and Biodiversity Report No. 98. 43 pp.
Shaughnessy, P.D. 1999. The Action Plan for Australian Seals. Environment Australia, Canberra.
Shaughnessy, P., Kirkwood, R., Cawthorn, M., Kemper, C. and Pemberton, D. 2003. Pinnipeds, cetaceans and fisheries in Australia: A review of operational interactions. In: Gales, N.J., Hindell, M. and Kirkwood, R. (eds). 2003. Marine Mammals. Fisheries, Tourism and Management Issues pp. 136-152. CSIRO Publishing, Melbourne.
Shaughnessy, P.D., McIntosh, R.R., Goldsworthy, S.D., Dennis, T.E. and Berris, M. 2006. Trends in abundance of Australian sea lions, Neophoca cinerea, at Seal Bay, Kangaroo Island, South Australia. In: Trites, A.W., Atkinson, S.K., DeMaster, D.P., Fritz, L.W., Gelatt, T.S., Rea, L.D. and Wynne, K.M. (eds). 2006. Sea lions of the world. Alaska Sea Grant College Program, University of Alaska, Fairbanks, Alaska, 325–351.
Shaughnessy, P.D., McKenzie, J., Lancaster, M.L., Goldsworthy, S.D. and Dennis, T.E. 2010. Australian fur seals establish haulout sites and a breeding colony in South Australia. Australian Journal of Zoology 58(2): 94–103.
Shaughnessy, P.D., Goldsworthy, S.D., Hamer, D.J., Page, B., and McIntosh, R.R. 2011. Australian sea lions Neophoca cinerea at colonies in South Australia: distribution and abundance, 2004 to 2008. Endangered Species Research 13: 87–98.
South East Trawl Fishing Industry Association (SETFIA). 2007. Code of fishing practice to minimise incidental by-catch of marine mammals in the South East Trawl Fishery, South East Trawl Fishing Industry Association, Tasmania. 12pp
SETFIA. 2009. Trials of Seal Excluder Devices (SEDs) on a South East Trawl Fishery Wet Boat. Natural Heritage Trust National Investment Stream Project. Sub-project of Project 44144 – National Strategies to Address Marine Wildlife Bycatch Issues in Australian Fisheries. 22pp.
Thompson, F.N. and E.R. Abraham. 2010. Estimation of the capture of New Zealand sea lions (Phocarctos hookeri) in trawl fisheries, from 1995–96 to 2008–09. New Zealand Aquatic Environment and Biodiversity Report 66, Wellington.
Thompson, F.N., Berkenbusch, K. and Abraham, E.R. 2013. Marine mammal bycatch in New Zealand trawl fisheries, 1995–96 to 2010–11. New Zealand Aquatic Environment and Biodiversity Report No. 105. Ministry for Primary Industries, New Zealand.
Tilzey, R. Goldsworthy, S. Cawthorn, M., Calvert,N., Hamer,D., Russell,S., Shaughnessy,P., Wise, B., and Stewardson, C. 2006. Assessment of seal–fishery interactions in the winter blue grenadier fishery off west Tasmania and the development of fishing practices and Seal Exclusion Devices to mitigate seal bycatch by factory trawlers. Final report to Fisheries Research and Development Corporation (FRDC). Project no. 2001/008. February 2006. 69pp

43
Tuck G.N., Knuckey, I. and Klaer, N.L. 2013. Informing the review of the Commonwealth Policy on Fisheries Bycatch through assessing trends in bycatch of key Commonwealth fisheries. Fisheries Research and Development Corporation final report 2012/046. 240p.
Wade, P.R. 1998. Calculating limits to the allowable human-caused mortality of Cetaceans and Pinnipeds. Marine Mammal Science 14(1): 1-37.
Wickens, P.A. and Sims, P.F. 1994. Trawling Operations and South African (Cape) Fur Seals, Arctocephaus pusillus pusilus. Marine Fisheries Review 56(3)
Wilkinson, I., Burgess, J., and Cawthorn, M. 2003. New Zealand sea lions and squid – managing fisheries impacts on a threatened marine mammal. In: Gales, N., Hindell, M. and Kirkwood, R. (eds). Marine mammals: Fisheries, tourism and management issues, pp. 192–207. CSIRO Publishing, Melbourne.
Woodhams, J, and Vieira, S. 2012a. Overview. In: Woodhams, J., Vieira, S. and Stobutzki, I. (eds). 2012. Fishery status reports 2011. Australian Bureau of Agricultural and Resource Economics and Sciences, Canberra.
Woodhams, J, and Vieira, S. 2012b. Chapter 8: Southern and Eastern Scalefish and Shark Fishery. In: Woodhams, J., Vieira, S. and Stobutzki, I. (eds). 2012. Fishery status reports 2011. Australian Bureau of Agricultural and Resource Economics and Sciences, Canberra.
Woodley, T. H. and Lavigne, D. M. 1991. Incidental capture of pinnipeds in commercial fishing gear. International Marine Mammal Association Technical Report 91-01: 35 pp.
Zeeberg, J., Corten, A. and De Graaf, E. 2006. Bycatch and release of pelagic megafauna in industrial trawler fisheries off Northwest Africa. Fisheries Research 78: 186-195.
Zollett, E.A. 2009. Bycatch of protected species and other species of concern in US east coast commercial fisheries. Endangered Species Research 9: 49–59.

44
2 Cetaceans
Literature review on the impacts on Environment Protection and Biodiversity Conservation Act 1999 (Cth)
protected species by large mid-water trawl vessels.
Chapter 2: Cetaceans
Prepared for
The Department of Sustainability, Environment, Water, Population and Communities on behalf of the Expert Panel on a Declared Commercial Fishing Activity.
GPO Box 787, Canberra, ACT, 2601
Project Reference: JN13076
Elgin Associates Pty Ltd
ABN 59123488639
45
Chapter Information
Chapter written by:
Rebecca McIntosh (Elgin Associates Pty Ltd)
Reviewed by: Luke Finley (Elgin Associates Pty Ltd)
Barry Baker (Latitude 42 Environmental Consultants Pty Ltd)
Sheryl Hamilton (Latitude 42 Environmental Consultants Pty Ltd)
Project: Elgin JN13076: Literature Review: Impacts on Environment Protection and Biodiversity Conservation Act 1999 protected species by large mid-water trawl vessels
Contact: Elgin Associates Pty Ltd ABN 59123488639 Level 4, 11 Morrison St, Hobart, TAS, 7000 Telephone: +61 417 598807 Fax: +61 3 86486336 www.elgin.com.au

46
2. Cetaceans
2.1 Brief description Cetaceans include the whales, dolphins and porpoises. Cetaceans are long-lived, have low reproductive rates and require long-term studies to understand their demography, therefore populations may decline to low levels before management action is taken (Thompson et al., 2013).
The Small Pelagic Fishery Ecological Risk Assessment for mid-water trawls identified 7 dolphin species at high risk, 35 species at medium risk and one at low risk to fishing activity in the SPF (AFMA, 2010) (Table 2.).
Table 2.1 includes all listed Australian cetacean species and their recorded interactions with trawl fisheries both internationally and nationally, as well as an assessment of their likelihood of interacting with large mid-water trawl vessels in the Australian SPF. This assessment is based on the life history of the species and recorded interactions with trawl fisheries (of varying vessel size and gear) in the literature. Of the 46 species and sub-species or genera (provided where the species was not reported) identified in Table 2.1, specific life history descriptions are provided for seven species of large whale and 13 species of dolphin. These species were selected for detailed species descriptions because they were identified as high risk for the SPF and/or were identified to have interacted with trawl fisheries internationally and/or nationally. The species descriptions have been separated into two categories:
1. large whales (7 species) are described as a group because they share the same threat from trawl fisheries. Sei, blue, fin, southern right, humpback, Bryde’s and sperm whales are all at risk from trawlers from collision and/or entanglement in discarded nets, and some from prey depletion. Several of these species have also been recorded interacting with trawl fisheries internationally and nationally (Table 2.).
2. small cetaceans (13 species) are described as a group based on the risk assessment provided in Table 2.1. Common and bottlenose dolphins are the most likely species of small cetacean to interact with trawl fisheries, but several other pelagic species may also interact internationally and/or nationally (Table 2.1).
2.2 Large whales at risk of interactions with large pelagic trawlers in Australian waters
2.2.1 Sei whale (Balaenoptera borealis)
Conservation status: Listed as Vulnerable under the EPBC Act (Table 2.1).
Population estimate: No abundance estimates available for Australia. The southern hemisphere population was estimated to be 11,000 in 1979 (http://www.iucnredlist.org/details/2475/0). Infrequently recorded in Australian waters, but mostly recorded offshore (see global range map http://maps.iucnredlist.org/map.html?id=2475). Sei whales can be confused with Bryde’s whales, which has led to uncertainties in their distribution.
Distribution and key habitats within Australian waters: This species has been recorded in the Bonney Upwelling in South Australia and near the coast and south of Tasmania, and at 37°S south of South Australia (Bannister 2008); no mating or calving sites have been identified in Australian waters.
Feeding and/or breeding ecology relevant to interactions in the SPF: This species skim feeds on planktonic crustacean such as copepods in mid-latitudes and krill in higher latitudes, often observed swimming horizontally near the surface, which increases the risk of boat strike.

47
Risk profile: The Sei whale’s distribution overlaps with the fishing zones of the SPF, particularly in the vicinity of the Bonney Upwelling, SA. There is a risk of boat strike and entanglement in discarded netting.
2.2.2 Blue whale (Balaenoptera musculus)
Conservation status: Listed as Endangered under the EPBC Act (Table 2.1). In Australian non-polar waters and the SPF, this is mainly the Pygmy blue whale subspecies (Balaenoptera musculus subspecies brevicauda).
Population estimate: No reliable population estimates for Australian region, but they are estimated to be in the hundreds (Bannister et al., 2007). 32 individuals have been observed at the Bonney Upwelling (Gill, 2002) and 12 have been tagged in Western Australia (Double et al., 2012).
Distribution and key habitats within Australian waters: Blue whales occur around the Australian continent at various times of year (see range map http://maps.iucnredlist.org/map.html?id=2477). There are feeding aggregation areas for blue whales in Australia, one in southern Australia in the Bonney Upwelling (and surrounding areas) from Nov–Apr, and one in Western Australia at the Perth Canyon from Dec–Apr. Microsatellite loci and mitochondrial DNA revealed no significant genetic structure between the two aggregations, suggesting that these whales are likely to belong to the same breeding stock (Attard et al., 2010). The cumulative area of these key sites is approximately 29,300 km² and overlaps with the fishing zones of the SPF. Breeding areas are poorly understood; breeding occurs during winter and early spring.
Feeding and/or breeding ecology relevant to interactions in the SPF: Blue Whales feed singly or in small groups and their primary food source is krill. Calves are weaned in summer feeding grounds at approximately seven months old. Blue Whales also migrate to tropical areas of high localised biological production to feed.
Risk profile: The Blue whale’s distribution overlaps with the fishing zones of the SPF, particularly in the vicinity of the Bonney Upwelling, SA. There is a risk of boat strike and entanglement in discarded netting.
2.2.3 Fin whale (Balaenoptera physalus)
Conservation status: Listed as Vulnerable under the EPBC Act (Table 2.1).
Population estimate: Numbers have declined in the Southern Hemisphere from ~500,000 prior to commercial harvesting, to approximately 25,000 currently. The IUCN Redlist states a global decline of 70% in the last three generations (1929-2007) with much of this occurring in the Southern Hemisphere (http://www.iucnredlist.org/details/2478/0).
Distribution and key habitats within Australian waters: Fin Whales are widely distributed between latitudes 20–65° in the Southern Hemisphere and are generally observed singly or in small groups, with pods of 6–10 seen occasionally. The range overlaps with the SPF (see range map http://maps.iucnredlist.org/map.html?id=2478). At known feeding grounds aggregations of over 100 whales may be observed. Fin whales are thought to migrate between Australian waters and Antarctic feeding areas (the Southern Ocean); subantarctic feeding areas (the Southern Subtropical Front); and possibly to tropical breeding areas that are largely unknown (Indonesia, the northern Indian Ocean and south-west South Pacific Ocean waters). There are no known mating or calving areas in Australian waters, however, the sighting of a cow and calf in the Bonney Upwelling in April 2000 and the stranding of two Fin whale calves in South Australia suggest that this area may be important to the species' reproduction, perhaps as a provisioning area for mothers with calves prior to their southern migration (Gill, 2002). The Bonney Upwelling occurs in the SPF.

48
Feeding and/or breeding ecology relevant to interactions in the SPF: Fin whales feed mainly on krill and some other planktonic crustaceans in the southern hemisphere, and elsewhere may also feed on fish, frequently lunging or sometimes skim feeding at or near the surface. Fin whales are known to dive to 230 m to feed. The surface feeding behaviour makes Fin whales susceptible to ship strike (Laist et al., 2001) and diving depths may overlap with depths where trawl nets are set.
Risk profile The Fin whale’s distribution overlaps with the fishing zones of the SPF, particularly in the vicinity of the Bonney Upwelling, SA. There is a risk of boat strike and entanglement in discarded netting.
2.2.4 Southern right whale (Eubalaena australis)
Conservation status: Listed as Endangered under the EPBC Act (Table 2.1).
Population estimate: Recent estimate of the population size in Australia is about 3,500 in 2009 (Bannister, 2011). The estimated annual rate of increase for the Australian population is approximately 6.8% per annum (Bannister, 2011). However, genetic data indicate that there are two subpopulations: the southwest Australian subpopulation was estimated to be about 2,900 whales in 2009 and is increasing (Bannister, 2011). In contrast, there is no evidence of a corresponding increase in the southeast Australian subpopulation, which is smaller.
Distribution and key habitats within Australian waters: Southern right whales are distributed in the southern hemisphere generally between 20°S and 60-65°S (see range map http://maps.iucnredlist.org/map.html?id=8153). Principally found around the southern coastline off southern Western Australia and far west South Australia, their range extends from Sydney and Perth, including off Tasmania, with individuals recorded further north in Queensland and Western Australia. Major calving areas are located in Western Australia at Doubtful Island Bay (34°10'S, 119°40'E), east of Israelite Bay (33°15'S, 124°10'E); and in South Australia at Head of Bight (31°30'S, 131°10'E). Smaller numbers of calving females are recorded intermittently in Victoria at Warrnambool (38°23'S, 142°29'E); South Australia at Encounter Bay (35°34'S, 138°37'E) and Fowlers Bay (31°59'S, 132°34'E); and Western Australia at Twilight Cove (32°17'S, 126°05'E), Flinders Bay (34°20'S, 115°15'E), Albany/Cape Riche area (35°2'S 118°E), Yokinup Bay/Cape Arid area (33°25'S 123°E) (SEWPaC, 2013). Areas used intermittently include a number of locations on the Western Australian coast west of Israelite Bay between more regular calving grounds, Sleaford Bay (South Australia), Port Fairy and Portland (Victoria), Eden (NSW), and Maria Island and Bruny Island (Tasmania). All these areas overlap with the SPF.
Feeding and/or breeding ecology relevant to fishery interactions in the SPF: This species feeds on euphausids at higher latitudes and copepods and other crustaceans at latitudes below 40°S associated with the Subtropical Front, with likely feeding grounds between about 32°S and 65°S. Feeding is thought to occur principally during the austral summer, but most likely extends into spring and autumn. The surface feeding behaviour makes southern right whales susceptible to ship strike and diving depths may overlap with depths where trawl nets are set (SEWPaC, 2013).
Risk profile: The Southern right whale’s distribution overlaps with the fishing zones of the SPF. There is a risk of boat strike and entanglement in discarded netting.
2.2.5 Humpback whale (Megaptera novaeangliae)
Conservation status: Listed as Vulnerable under the EPBC Act (Table 2.1).
Population estimate: The East coast E1 population has been estimated to be >14,000 in 2010 (Noad et al., 2011), and about 28,000 for the Western Australia D population in 2008 (Hedley et al., 2011; Salgado Kent

49
et al., 2012). The Australian populations appear to be growing consistently at approximately 10% per annum.
Distribution and key habitats within Australian waters: There are two subpopulations of humpback whales in Australian waters, an east coast population and a west coast population. These whales migrate annually between tropical Australian waters where they breed and calve in winter, and their feeding grounds near Antarctica. Key areas in Australian waters are the Great Barrier Reef complex, Queensland; and the Kimberley region, Western Australia (SEWPaC, 2013) (see also http://www.iucnredlist.org/details/13006/0).
Feeding and/or breeding ecology relevant to interactions in the SPF: Much information is available on the migration routes of this species; for details see Figure 1 in the Humpback Whale Recovery Plan 2005-2010 (DEH, 2005). Krill is the major component of the diet, with additional opportunistic feeding on schools of small fish observed along the Australian coast (Bannister et al., 1996). Humpback whales are gulp lunge-feeders. Their surface activities and shallow travelling dives make them susceptible to ship strike.
Risk profile: The Humpback whale’s distribution overlaps with the fishing zones of the SPF, particularly during their migration up the east coast. There is a risk of boat strike and entanglement in discarded netting.
2.2.6 Bryde’s whale (Balaenoptera edeni)
Conservation status: Bryde’s whale is listed as a migratory species and a cetacean species under the EPBC Act (Table 2.1).
Population estimate: The total number of mature Bryde's whales within Australian waters is unknown but may be less than 10,000, although Bryde’s whale are sometimes confused with sei whales which have caused inaccurate abundance and harvest estimates for both species. The number of species and subspecies is still unknown leading to further uncertainty (http://www.iucnredlist.org/details/2476/0).
Distribution and key habitats within Australian waters: Bryde’s whales occur in temperate to tropical waters, with an oceanic and an inshore form, bounded by latitudes 40° N and 40° S, or the 20 °C isotherm; they have been recorded in all Australian states except the Northern Territory (SEWPaC, 2013) (see map of range at http://maps.iucnredlist.org/map.html?id=2476). The coastal form of Bryde's Whale appears to be limited to the 200 m depth isobar, moving in conjunction with suitable prey. The offshore form is found in deeper water (500–1,000 m). No specific feeding or breeding grounds have been discovered off Australia.
Feeding and/or breeding ecology relevant to interactions in the SPF: The inshore form is considered resident in waters containing suitable prey stocks of pelagic shoaling fishes, while the offshore form appears to undergo extensive migrations between subtropical and tropical waters during the winter months. Inshore coastal forms appear to breed and give birth throughout the year, while the offshore form appears to have a protracted breeding and calving season over several months during winter.
Bryde's whale inshore form feeds on schooling fishes, such as pilchard, anchovy, sardine, mackerel, herring and others. In contrast, the larger offshore form appears to feed on small crustaceans, pelagic red crabs (Pleuroncodes) and cephalopods. Bryde's whales frequently exploit the activities of other predators, swimming through and engulfing 'boils' of fish herded by other species. They are therefore often found with flocks of sea birds, as well as with other cetaceans, seals and sharks in areas of high fish abundance.
Risk profile: The Bryde whales’ distribution overlaps with the fishing zones of the SPF in New South Wales and Western Australia, particularly the pelagic feeding inshore form. There is a risk of boat strike and entanglement in discarded netting. Future expansion of pelagic fisheries, particularly those targeting
50
schooling pelagic fishes, may result in increased direct and indirect fisheries interactions with Bryde's whales.
2.2.7 Sperm whale (Physeter macrocephalus)
Conservation status: The sperm whale is listed as a migratory species and as a cetacean species under the EPBC Act (Table 2.1).
Population estimate: The abundance of sperm whales in Australian waters is unknown. Females live in stable matrilineal family units, whereas mature male sperm whales are usually solitary in higher latitudes nearer polar regions. The average sperm whale school size contains about 25 animals, although aggregations have been reported numbering several thousand individuals. Based on a generation length of 27.5 yr, it is estimated that there has been approximately a two-thirds reduction in the global pre-whaling stock size over the past three generations resulting from commercial whaling. Regional and global population trends are largely unknown with no evidence of recovery in the Australian region (SEWPaC, 2013) http://www.iucnredlist.org/details/41755/0).
Distribution and key habitats within Australian waters: Sperm whales have been recorded from all Australian states (see range map http://maps.iucnredlist.org/map.html?id=41755). Females and young male sperm whales are restricted to warmer waters, generally north of approximately 45° S, while older males travel to and from colder waters and to the edge of the Antarctic pack-ice. Sperm whales tend to inhabit offshore areas with a water depth of 1,000 m or more, and are uncommon in waters less than 300 m deep (SEWPaC, 2013) http://www.iucnredlist.org/details/41755/0).
Feeding and/or breeding ecology relevant to interactions in the SPF: Concentrations of sperm whales are found where the seabed rises steeply from great depth, and are probably associated with concentrations of major food in areas of upwelling. The main food for sperm whales comprises a wide range of oceanic cephalopods, frequently taken at depth. While sperm whales feed primarily on large and medium sized squids, the list of documented food items is fairly long and diverse. Prey items include medium and large-sized demersal fishes, including rays, sharks and many teleosts (Table 2.1).
Risk profile: Sperm whales may be sensitive to disturbance by anthropogenic noise, but research to date has shown variable responses to noise. Sperm whales overlap spatially with the SPF, but they do not commonly interact in trawl fisheries.
2.3 Small cetaceans at risk of interactions with large pelagic trawlers in Australian waters
2.3.1 Common dolphin (Delphinus delphis)
Conservation status: This species is listed as a cetacean under the EPBC Act (Table 1).
Population estimate: Population sizes in Australia are unknown, but they are likely to be abundant (http://www.iucnredlist.org/details/6336/0). There are an estimated 100,000 off northwestern Europe, over 300,000 off western North America, and 3 million in the eastern Pacific (http://www.nmfs.noaa.gov/pr/species/mammals/cetaceans/commondolphin_shortbeaked.htm.
Distribution and key habitats within Australian waters: The short-beaked common dolphin is an offshore, pelagic dolphin. They are found in all Australian waters (http://maps.iucnredlist.org/map.html?id=6336) but there are two main clusters, with one cluster in the southern south-eastern Indian Ocean and another in the Tasman Sea. Populations of short-beaked common dolphins are genetically differentiated between those found in waters off south-eastern Tasmania and South Australia that are located within the SPF, and

51
are separated by ~1500 km (Bilgmann et al., 2008). This is a significant finding because it has implications for the management of these populations and for mitigating threatening processes such as mortality as fisheries bycatch (Hamer et al., 2008).
Feeding and/or breeding ecology relevant to interactions in the SPF: Mainly occurring in medium water depths over the continental shelf, they are associated with upwelling areas and areas where surface water temperatures are between 10°C and 20°C. They are also located in conjunction with small epipelagic fishes such as anchovies and sardines, which are a prey source. In New Zealand, common dolphins have been observed to feed in association with Australasian gannets, and on rare occasions, with minke, sei and Bryde's whales. The main anthropogenic threats likely to affect common dolphin populations include indirect catches in trawl, gillnet, purse-seine and trap fisheries, entanglements in debris, intentional killing and overfishing (SEWPaC, 2013).
Risk profile: The Common dolphin’s distribution overlaps with the fishing zones of the SPF and they are known to commonly interact with trawl fisheries (Table 2.1). Interactions include herding fish into nets, taking fish swimming in the net mouth and incidental capture in trawl nets. Identified as Level 2 PSA Residual Risk – Medium in the SPF.
2.3.2 Bottlenose dolphin (Tursiops truncatus)
Conservation status: This species is listed as a cetacean under the EPBC Act (Table 2.1).
Population estimate: There are no population estimates, but it is likely to be common in offshore waters of south-eastern and southern Australia (http://www.iucnredlist.org/details/22563/0). Some local minimum population estimates are available, but no estimates for rates of population change (http://www.dolphinresearch.org.au/bottlenose.php).
Distribution and key habitats within Australian waters: Bottlenose dolphins occur in the world’s tropical and sub-tropical oceans (http://maps.iucnredlist.org/map.html?id=22563). Bottlenose dolphins have been recorded in Queensland, NSW, Tasmania, South Australia and south-western Western Australia, in areas that overlap with the SPF. They are usually found offshore in waters deeper than 30 m.
Feeding and/or breeding ecology relevant to interactions in the SPF: Their diet consists of fish, squid and crustaceans. They hunt in groups herding prey, and have highly variable group sizes (2–20 and/or 100–1,000’s), but can hunt alone as well. The main anthropogenic threats likely to affect Australian bottlenose dolphin populations include indirect catches in trawl, gillnet, purse-seine and trap fisheries, entanglements in debris, intentional killing and overfishing.
Risk profile: The Bottlenose dolphin’s distribution overlaps with the fishing zones of the SPF and they are known to commonly interact with trawl fisheries (Table 2.1). Interactions include herding fish into nets, taking fish swimming in the net mouth and incidental capture in trawl nets. Identified as Level 2 PSA Residual Risk – High in the SPF.
2.3.3 Indo-Pacific (IP) bottlenose dolphin (Tursiops aduncus)
Conservation status: This species is listed as a cetacean under the EPBC Act (Table 2.1).
Population estimate: There are no population estimates in the Australian region (http://www.iucnredlist.org/details/41714/0). However, it is likely that this species is common in inshore and nearshore waters of eastern, western and northern Australia (SEWPaC, 2013).
Distribution and key habitats within Australian waters: They are distributed more or less continuously around the eastern and northern mainland from southern New South Wales to central Western Australia

52
(http://maps.iucnredlist.org/map.html?id=41714), occurring coastally and in estuarine environments in the following areas: eastern Indian Ocean, Tasman Sea, Coral Sea, and Arafura/Timor Seas. Small populations inhabiting inshore waters of south-eastern Australia may be semi-isolated from neighbouring populations due to high site fidelity and philopatry.
Feeding and/or breeding ecology relevant to interactions in the SPF: This species feeds on a variety of fish and cephalopods, but in specific areas a few species may dominate the diet and they have been observed taking advantage of human activities such as feeding behind trawlers (Corkeron, 1990).
Risk profile: The IP bottlenose dolphin’s distribution overlaps with the fishing zones of the SPF in New South Wales and Western Australia and they are known to commonly interact with trawl fisheries. Interactions include incidental capture in trawl nets (Table 2.1). Identified as Level 2 PSA Residual Risk – High in the SPF.
2.3.4 Striped dolphin (Stenella coeruleoalba)
Conservation status: This species is listed as a cetacean under the EPBC Act (Table 2.1).
Population estimate: There are no population estimates, but the species is potentially abundant in Australian waters (http://www.iucnredlist.org/details/20731/0).
Distribution and key habitats within Australian waters: Few records are available for this species in Australian waters: 4-5 records from Western Australia, including the most southerly, from Augusta in south-western Western Australia; two records from NSW; and two from southern Queensland (SEWPaC, 2013) (see global range map http://maps.iucnredlist.org/map.html?id=20731).
Feeding and/or breeding ecology relevant to interactions in the SPF: Prey are small (<300 mm length), and include mesopelagic fish, shrimp and cephalopods. Striped dolphins are gregarious, and are usually seen in schools of a few hundred, though groups of up to several thousand individuals occur. Striped dolphins may feed at depths of about 200 m or may take prey species that normally live at such depths when they come to surface at night.
Risk profile: The striped dolphin’s distribution overlaps with the fishing zones of the SPF. While they were identified as Level 2 PSA Residual Risk – High in the SPF, they have been rarely observed in Australia. No records of incidental capture or fisheries interactions were identified for this species in the literature (Table 1).
2.3.5 Risso's dolphin (Grampus griseus)
Conservation status: This species is listed as a cetacean under the EPBC Act (Table 2.1).
Population estimate: There are no population estimates available. Approximately 175,000 individuals occur in the eastern tropical Pacific, with similarly high densities in all areas where surveys have been conducted (http://www.iucnredlist.org/details/9461/0).
Distribution and key habitats within Australian waters: They have been recorded in Australia in all states except Tasmania and Northern Territory (SEWPaC, 2013). This species is found in water depths of 180–1,500 m depths from 60°S to 60°N (http://maps.iucnredlist.org/map.html?id=9461). The only resident population in Australia appears to be Fraser Island, Queensland. This species is observed over the continental shelf and particularly over steep sections of the continental slope. They prefer warm-temperate to tropical oceans. Calving likely occurs in summer, but there are no identified calving areas in Australia.
Feeding and/or breeding ecology relevant to interactions in the SPF: Risso’s dolphins are gregarious and pelagic, living in groups of 25 up to several hundred. Their diet mainly consists of squid, octopus and fish.

53
Risk profile: The Risso’s dolphin distribution overlaps with the fishing zones of the SPF. Their preference for warmer water reduces the area of spatial overlap with the SPF to the east coast of Australia. Where there is overlap, there is a risk of incidental capture in nets. This species has been incidentally captured in mid-water trawl fisheries in the U.S. (Table 2.1). Identified as Level 2 PSA Residual Risk – High in the SPF.
2.3.6 Fraser's dolphin (Lagenodelphis hosei)
Conservation status: This species is listed as a cetacean under the EPBC Act (Table 2.1).
Population estimate: The population in the eastern tropical Pacific has been estimated at a maximum of 289,000 animals (http://www.iucnredlist.org/details/11140/0). The species is potentially abundant in Australian waters, but the population size is unknown.
Distribution and key habitats within Australian waters: Fraser’s dolphin occurs in the north of Australia from northern New South Wales to central Western Australia. It occurs north of 30° S and 500- 1,000 m (http://maps.iucnredlist.org/map.html?id=11140).
Feeding and/or breeding ecology relevant to interactions in the SPF: Fraser's dolphin typically occurs in pelagic or oceanic habitat, and may be found along the outer continental shelf or slope. Fraser's dolphin feeds on mesopelagic fish, squid and crustaceans. Fish appear to form the most important component.
Risk profile: The Fraser’s dolphin distribution overlaps with the fishing zones of the SPF in its north-eastern extent. Their preference for warmer water reduces the area of spatial overlap with the SPF to the north east coast of Australia. Where there is overlap, there is a risk of incidental capture in nets because of their pelagic nature. Identified as Level 2 PSA Residual Risk – High in the SPF. No records of incidental capture or fisheries interactions were identified for this species in the literature (Table 2.1).
2.3.7 Hourglass dolphin (Lagenorhynchus cruciger)
Conservation status: This species is listed as a cetacean under the EPBC Act (Table 2.1).
Population estimate: There are no population estimates available but this species may be relatively abundant judging by the frequency of sightings (SEWPaC, 2013).
Distribution and key habitats within Australian waters: Probably circumpolar in pelagic waters of the Subantarctic and Antarctic zones, south of the Subtropical Convergence. Most records occur between 45°S and 65°S (http://maps.iucnredlist.org/map.html?id=11144).
Feeding and/or breeding ecology relevant to interactions in the SPF: Very limited data, diet consists of fish and squid.
Risk profile: The hourglass dolphin distribution only overlaps with the fishing zones of the SPF south of Tasmania. Where there is overlap, there is a risk of incidental capture in nets. Identified as Level 2 PSA Residual Risk – High in the SPF. No records of incidental capture or fisheries interactions were identified for this species in the literature (Table 2.1).
2.3.8 Southern right whale dolphin (Lissodelphis peronii)
Conservation status: This species is listed as a cetacean under the EPBC Act (Table 2.1).
Population estimate: There are no population estimates available (http://www.iucnredlist.org/details/12126/0).
Distribution and key habitats within Australian water: This species is found off southern continental Australia, most commonly between 30°S and 65°S (http://www.iucnredlist.org/details/12126/0). The range

54
overlaps completely with the SPF (http://maps.iucnredlist.org/map.html?id=12126). The southern right whale dolphin is a pelagic species, generally occurring between the Subtropical and Subantarctic Convergences.
Feeding and/or breeding ecology relevant to interactions in the SPF: Group size ranges from 1–1000, with an average group size of 52 animals. Myctophids and other mesopelagic fish, squid and crustaceans have been recorded, and euphausiids are possible prey.
Risk profile: The southern right whale dolphin distribution overlaps with the fishing zones of the SPF. Where there is overlap, there is a risk of incidental capture in nets. Identified as Level 2 PSA Residual Risk – High in the SPF. No records of incidental capture or fisheries interactions were identified for this species in the literature (Table 2.1).
2.3.9 Pantropical spotted dolphin (Stenella attenuata)
Conservation status: This species is listed as a migratory species and as a cetacean species under the EPBC Act (Table 2.1).
Population estimate: There are no reliable population estimates for this species in Australian waters.
Distribution and key habitats within Australian waters: Pantropical spotted dolphins have been recorded off the Northern Territory, Western Australia down south to Augusta, Queensland and New South Wales (http://maps.iucnredlist.org/map.html?id=20729). Pantropical spotted dolphins are commonly found in oceanic tropical zones between about 40° N and 40° S, inhabiting both near-shore and oceanic habitats (http://www.iucnredlist.org/details/20729/0).
Feeding and/or breeding ecology relevant to interactions in the SPF: Pantropical spotted dolphins feed mainly on small epipelagic and mesopelagic fish, and squids. One threat is the possible illegal and incidental catches by fishers in northern Australian waters (SEWPaC, 2013).
Risk profile: The pantropical spotted dolphin’s distribution overlaps with the fishing zones of the SPF in the southern extent of their range. There is a risk of incidental capture in nets and prey species can overlap with fishery target species. Incidental capture in trawl nets has occurred in Malaysia (Table 2.1). Identified as Level 2 PSA Residual Risk – Medium in the SPF.
2.3.10 Dusky dolphin (Lagenorhynchus obscurus)
Conservation status: This species is listed as a migratory species and as a cetacean species under the EPBC Act (Table 2.1).
Population estimate: There are no reliable estimates of population size in Australian waters. Low stranding rates suggest they are uncommon in Australian waters.
Distribution and key habitats within Australian waters: The dusky dolphin is found in the waters of the Southern Hemisphere including coastal and offshore areas (http://maps.iucnredlist.org/map.html?id=11146). They occur in apparently disjunct subpopulations in the waters off Tasmania and southern Australia (http://www.iucnredlist.org/details/11146/0). Mothers and young typically remain in shallow areas where they can protect the young (SEWPaC, 2013).
Feeding and/or breeding ecology relevant to interactions in the SPF: Some of their most common foods include red cod, lantern fish, anchovies, jack mackerel and blue grenadier. They hunt in large pods of 100–1,000’s individuals, foraging both day and night and they are highly acrobatic. Anthropogenic threats include fishing interactions and boat collision (not common).
55
Risk profile: The dusky dolphin’s distribution and diet overlaps with the fishing zones of the SPF. There is a risk of incidental capture in nets, but they are uncommon in Australian waters. Incidental capture in trawl nets has occurred internationally (Table 2.1). Identified as Level 2 PSA Residual Risk – Low in the SPF.
2.3.11 Short-finned pilot whale (Globicephala macrorhynchus)
Conservation status: This species is listed as a cetacean under the EPBC Act (Table 2.1).
Population estimate: There are few observations of short-finned pilot whales in Australia and the population size is unknown; they are globally abundant (http://www.iucnredlist.org/details/9249/0).
Distribution and key habitats within Australian waters: Short-finned pilot whales occur in tropical to temperate oceanic waters 40°S to 50°N (http://www.iucnredlist.org/details/9249/0, http://maps.iucnredlist.org/map.html?id=9249).
Feeding and/or breeding ecology relevant to interactions in the SPF: They form small groups of 10–30 individuals and can form groups of several hundred. This species is prone to mass stranding. They are often associated with bottlenose dolphins. Calving peaks in spring and autumn in the Southern Hemisphere. This species feeds mainly on squid, cuttlefish octopus and some fish, with their distribution and movements thought to be regulated by prey abundance. They dive deeply during the day and more shallowly at night because of the vertical migration of their prey.
Risk profile: The short-finned pilot whale’s distribution overlaps with the fishing zones of the SPF. Incidental capture in trawl nets has been reported (Table 2.1). Identified as Level 2 PSA Residual Risk – Medium in the SPF.
2.3.12 Long-finned pilot whale (Globicephala melas)
Conservation status: This species is listed as a cetacean under the EPBC Act (Table 2.1).
Population estimate: There are two populations in the world, one is in the North Atlantic and the other is in the Southern Hemisphere, however very little is known of the Southern Hemisphere population. They are considered to be relatively abundant. Population size is unknown in Australian waters http://www.iucnredlist.org/details/9250/0).
Distribution and key habitats within Australian waters: They are typically recorded in waters off Southern Australia where they overlap with the SPF, but have been recorded in all states except the Northern Territory (http://maps.iucnredlist.org/map.html?id=9250). No long-finned pilot whale calving areas are known for Australian waters.
Feeding and/or breeding ecology relevant to interactions in the SPF: This species travel in stable pods of 10–50 individuals, but they can form pods of over 1,000 individuals, bunching up when travelling and spreading out when feeding. They generally inhabit offshore waters, only occasionally venturing inshore. The species may exhibit seasonal behaviour that is important to management. For example, this species is prone to mass stranding, with 60% of mass stranding events occurring from December to March (SEWPaC, 2013).
Risk profile: The long-finned pilot whale’s distribution overlaps with the fishing zones of the SPF. Incidental capture in trawl nets has been reported (Table 2.1). Identified as Level 2 PSA Residual Risk – Medium in the SPF.
56
2.3.13 Killer whale (Orcinus orca)
Conservation status: This species is listed as a migratory species and as a cetacean species under the EPBC Act (Table 2.1).
Population estimate: Killer whales in Australian waters may occur in severely fragmented populations. The total number of mature animals within Australian waters is unknown (http://www.iucnredlist.org/details/15421/0). Killer whale groups are stable and their size is typically <30, with a pod composition of 20% adult male, 40–50% adult females and 30–40% immatures and juveniles. Most killer whales are seen along the continental slope and on the shelf; calving areas are not known in Australian waters (SEWPaC, 2013).
Distribution and key habitats within Australian waters: This top trophic level carnivore is present in all states of Australia, but is most often sighted around Tasmania (SEWPaC, 2013) (http://maps.iucnredlist.org/map.html?id=15421).
Feeding and/or breeding ecology relevant to interactions in the SPF: Threats to killer whales include pollution, targeted hunting and illegal killing, and interactions with fisheries, including the potential for incidental capture. Incidental deaths in fishing nets have not been reported in Australian waters (SEWPaC, 2013).
Risk profile: The killer whales’ distribution overlaps with the fishing zones of the SPF, mainly in Tasmania. They are most commonly reported as scavengers around trawl vessels rather than as incidental bycatch (Table 2.1). Identified as Level 2 PSA Residual Risk – Medium in the SPF.
2.4 Conservation status of the species nationally (Refer Table 2.1)
2.5 Description of the nature and extent of interactions between cetaceans and trawl fisheries
Cetaceans commonly interact with fisheries internationally and in Australian waters, with interactions ranging from disruption of natural behaviour to potential prey depletion or incidental mortality. Examples of cetacean mortality include: incidental bycatch in fisheries for small cetaceans (longlines, gillnets, trawls); boat strike; and entanglement in discarded fisheries gear.
There is a paucity of information regarding cetacean abundance, population structure, and spatial and temporal habitat use. This presents difficulties for mitigating threats to cetaceans, especially when behaviour of individuals and pods of cetaceans is highly variable in time and space, and highly variable among species. Mitigation may need to be determined on a fishery-by-fishery or location-by-location basis. Spatial and/or temporal fishery closures should consider that cetaceans migrate to distant feeding or calving grounds, and, whilst they may be absent from Australian waters at some times, they are also abundant at other times.
2.5.1 Incidental bycatch in fisheries
Overview
Fishing-related mortality is considered the most severe and immediate threat to populations of small cetaceans worldwide (Jaiteh et al., 2012; Moore et al., 2009; Notarbartolo di Sciari & Birkun, 2010; Read et al., 2006; Reeves et al., 2013; Zollett & Rosenberg, 2005). While cetacean bycatch rates have been reduced in some fisheries (Hall et al., 2000; Read et al., 2006), the frequency and intensity of interactions is likely to

57
increase because of human population growth, increasing industrialization of fisheries, and their expansion into new areas, such as the high seas (Read et al., 2006). Gillnets are a major risk factor to cetaceans: at least 75% of odontocete species, 64% of mysticetes, 66% of pinnipeds, and all sirenians and marine mustelids have been recorded as gillnet bycatch over the past 20-plus years (Reeves et al., 2013). In U.S. fisheries between 1990-1999, 84% of cetacean bycatch occurred in gillnets, despite the fleet including large industrialised pelagic trawlers (Read et al., 2006). Longline fisheries are the main threat to odontocetes (toothed whales, dolphins and porpoises) with 20 species identified in bycatch globally between 1964 and 2010 (Hamer et al., 2012). Purse seine fishing also results in dolphin bycatch globally and in Australia (Hamer et al., 2008). With regard to large whales, documented incidental mortality in fishing gear has been reported to occur sporadically on some occasions for sperm whales (Physeter macrocephalus) off Chile, Peru and Ecuador and for Humpback whales (Megaptera novaeangliae) in Ecuador (Hucke-Gaete et al., 2002).
Trawling
Trawlers are often considered less of a threat to cetaceans, however 25 cetacean species (two mysticete, 23 odontocete) have died from interactions with working trawls or discarded trawling gear (Fertl & Leatherwood, 1997; Hamer et al., 2012). Incidental takes of cetaceans exist in most areas where trawling occurs, for example, the North Sea, Bering Sea, Atlantic Ocean, Gulf of Mexico, Gulf of California, Mediterranean Sea, Indian Ocean, and waters off Australia and New Zealand (Fertl & Leatherwood, 1997). Differences in susceptibility of certain cetacean species to interact with fishing activities have been attributed to differences in behaviour (such as migratory pathways intersecting fishing zones and/or the use of common feeding grounds for prey that are also targeted by fisheries) and targeted prey species (Couperus, 1997).
Because many variables contribute to the incidental bycatch of cetaceans in trawl fisheries, understanding interactions and how to mitigate against them is difficult. Environmental factors may be important: such as seasonal variation in catch availability, oceanic features, or weather conditions. Operational activity is important: vessel and net size and haul, tow speed and duration, net depth, diurnal patterns of trawling, distance of vessel from the coast or continental shelf, single vessel or pairtrawling. Cetacean behaviour and presence are equally important: group size, group genetic differentiation, age distribution and sex ratio, temporal and spatial overlap with the fishery, and individual behaviour and skill. Inexperience and youth may also contribute to dolphin mortality (Chilvers & Corkeron, 2001; Fernández-Contreras et al., 2010; Fertl & Leatherwood, 1997).
High-risk trawling techniques
Cetaceans are more often caught in mid-water trawls than in bottom trawls (Crespo et al., 1997; Fertl & Leatherwood, 1997; Hall et al., 2000; Ross & Isaac, 2004), and three reasons have been suggested for this:
1. Mid-water nets generally target small pelagic fish species, which are often the same species preyed upon by marine mammals.
2. Mid-water gear is generally towed at relatively high speeds.
3. Finally, mid-water trawls are generally much larger than most demersal trawls.
Pairtrawlers account for about 50% of all cetacean catches in waters off New Zealand, with gillnets and single trawlers making up the remainder (Fertl & Leatherwood, 1997). Pairtrawlers work by towing the net between two vessels, the nets have higher headlines and greater overall dimensions and they tow them faster than single trawlers (Fertl & Leatherwood, 1997). The expansion of trawl fisheries may have

58
contributed to an increase in the rate of marine mammal bycatch. For example, improvements in fishing technology, such as the introduction of large freezing and factoring vessels, have allowed vessels to fish with larger gear, for longer and farther from shore, thus increasing the likelihood of interactions with cetaceans (Crespo et al., 1997; Zollett & Rosenberg, 2005). Trawls with a larger circumference have a larger net opening and the greater extension of their rigging parts (bridles and doors) likely provides a significant herding effect for large marine predators such as cetaceans (Zeeberg et al., 2006).
Key point: Cetaceans are more often caught in mid-water trawls and the larger the net opening and/or the faster the vessel(s), the greater the risk.
The implications for cetaceans captured in a trawl net
Cetacean mortality occurs when individuals enter the net and become trapped, typically when the boat stops ‘hauling’ and the trawl entrance collapses ‘haulback’, or when the net is being put into the water ‘shot’ because the net is relatively shapeless and slow-moving at this time. It is likely that many trapped cetaceans are alive when caught, but die before the nets are checked (Fertl & Leatherwood, 1997). Long haul times also increase the risk of drowning (Du Fresne et al., 2007). Dolphins may also have their rostrums caught in the net while pulling out fish, they sometimes drown when they are caught around the tail stock in the hanging line of the trawl and have also been caught in turtle exclusion devices (Fertl & Leatherwood, 1997). In fisheries that use fish pumps to empty the catch from the net, no cetacean bycatch is observed because the ability of the observer to record marine mammal catches is compromised (Morizur et al., 1999). Cetaceans would be too large to pass through the pump and, in the case of the UK fisheries, the final emptying of the cod-end occurred outboard and thus any bycatch may have gone unobserved, particularly during the night (Ross & Isaac, 2004). Pulses in strandings of dolphins (particularly short-beaked common and Atlantic white-sided dolphins (Delphinus delphis and Lagenorhynchus acutus, respectively) on the western and northern coasts of Europe have coincided in space and time with pelagic trawl fishing (Kuiken et al., 1994; Reeves et al., 2003). The assumption for such strandings, also based on net patterns on the skin of the carcasses, is that the animals were caught in the trawls and released dead from the nets, washing ashore in large numbers. Incidents of large numbers of cetacean bycatch mortalities may be unreported in vessel logbooks.
Key point: Cetacean bycatch may not be recorded if target species are pumped from the net because bycatch is not retained onboard. Logbook records often provide underestimates of bycatch.
Spatial overlap between cetacean distribution and fishing zones
Interactions with fisheries often depend on which group’s spatial and temporal habitat use overlaps with the working fishery. The bottlenose dolphin (Tursiops truncatus) is the cetacean species most often documented to feed in association with trawls (Broadhurst, 1998; Fertl & Leatherwood, 1997). Cetaceans may not be feeding on the same target species of the fishery but an associated non-target species or may be attracted to discards made available by fishing activity (Fertl & Leatherwood, 1997; Morizur et al., 1999). There are four feeding patterns typically used: (1) foraging behind working boats, (2) entering working trawl nets to feed (3) feeding on discards or fish fallen from the net, and (4) feeding on prey attracted to vessels (Fernández-Contreras et al., 2010; Fertl & Leatherwood, 1997; Morizur et al., 1999; Northridge et al., 2005). The majority of cetaceans feeding around trawls feed behind working trawlers (refer to Appendix 3 in Fertl and Leatherwood 1997).
Key point: Cetaceans targeting prey species often overlap spatially and temporally with fisheries targeting the same prey species.

59
2.5.2 Entanglement in discarded netting
Trawl nets contribute considerably to marine debris and many marine mammals become caught in trawl netting (Fertl & Leatherwood, 1997; Macfadyen et al., 2009; Moore et al., 2013; Pichel et al., 2012; Reeves et al., 2003; Shaughnessy et al., 2003; van der Hoop et al., 2013). Such marine debris is also known as ‘Ghost netting’. Trawl netting may also be consumed by large whales (Fertl & Leatherwood, 1997). Fishers often use a technique termed ‘cutting out’ living entangled animals, whereby the netting around the entangled animal is cut out of the primary net, causing the animal to be released still entangled. Mortalities may arise from drowning and/or a prolonged demise including impaired foraging, increased drag, emaciation, infection, haemorrhage, and severe tissue damage. Larger whales carrying fixed trap and net gear are subject to a very slow demise, averaging 6 months in the case of the North Atlantic right whale (Eubalaena glacialis), or in some cases, several years (Moore & van der Hoop, 2012). In the North Atlantic, between 1980 and 2004, aerial surveys detected that at least 73% of 493 individuals of large whale species sighted were or had been entangled in fishing gear at least once. The number of entanglements ranged from 1 to 6 per individual (Moore & van der Hoop, 2012). Entanglement in drift net is a primary conservation concern for Cuvier’s beaked whales (Ziphius cavirostris) and Sperm whales (Physeter macrocephalus) in Mediterranean and Black seas (Notarbartolo di Sciari & Birkun, 2010). In Australia cetacean species observed entangled in marine debris include Bottlenose dolphins, Common dolphins, Humpback whales and Southern right whales (Shaughnessy et al., 2003). However these entanglements are typically from gillnets (dolphins) and rope from crayfish pots (large whales) (Shaughnessy et al., 2003).
Key point: Entanglement may occur via interactions with discarded nets, or by animals being cut away following capture in larger working fishing nets so that fishers can continue without interruption.
2.5.3 Boat strike
Boat strike from large vessels is known to kill cetaceans and fishing vessels pose a significant risk to large whales (Bannister et al., 1996). Ship strikes on cetaceans in Australian waters are not well documented, but are considered to be common (Bannister et al., 1996). All sizes and types of vessels can hit whales; most lethal or severe injuries are caused by ships 80 m or longer; whales usually are not seen beforehand or are seen too late to be avoided; and most lethal or severe injuries involve ships travelling 14 km or faster (Laist et al., 2001). Of 11 species known to be hit by ships, fin whales are struck most frequently; right whales, humpback whales, sperm whales, and gray whales are hit commonly (Laist et al., 2001). Smaller inshore cetaceans are more at risk of boat strike from small fast vessels (Jensen et al., 2009; Redfern et al., 2013).
As the numbers of Humpback and Southern right whales wintering in Australian coastal waters continue to rise, incidents involving those two species are likely to become more frequent. A general problem in determining the causes of death is that floating carcasses or moribund animals can also be struck by vessels, thus confounding interpretations of signs of trauma during necropsies (Reeves et al., 2003). Ship strike is a primary threat to Fin whales and Sperm whales in the Mediterranean and Black Seas (Notarbartolo di Sciari & Birkun, 2010) and is a listed as a threat to Australian large whale species listed by the EPBC Act (SEWPaC, 2013)). For shipping routes off the coast of southern California, whale-habitat models were developed and ship-strike risk assessed for Humpback, Blue, and Fin whales (Redfern et al., 2013). Risk of strike was dependant on the density and distribution of whales in an area (Redfern et al., 2013).
Ramming whales has been used as a deterrent by fisherman in Chile. This became evident by a confirmed case of the near-ramming a group of eight Blue whales (Hucke-Gaete et al., 2002). Lack of ability of fishers to differentiate species can increase risk to baleen whales. Artisanal fishers in Chile often confuse baleen whales for Sperm whales, which are thus vulnerable to the fishers retaliatory actions which include
60
shooting, ramming or using explosives (Hucke-Gaete et al., 2002). Beached washed carcasses of cetaceans can also show evidence of physical, thought to be caused during the release from fishing nets (Moore et al., 2013).
Key point: Cetacean migratory pathways and habitat usage should be considered when assessing the likelihood of boat strike.
2.5.4 Vessel noise
Increased underwater noise can reduce habitat quality for cetaceans (Jensen et al., 2009). Of greatest concern are situations in which heavy vessel traffic, seismic testing, dredging, and drilling occur in or near areas where cetacean populations engage in vital activities such as calving, calf-rearing, resting, and feeding. Cetaceans are known to react to noise, but it has proven extremely difficult to quantify the effects and establish thresholds of disturbance at which the animals will begin to abandon preferred areas or experience impaired health, reproduction, or longevity (Reeves et al., 2003)
2.5.5 Predation of cetaceans
The aggregation of several predators feeding off prey patches provided by trawlers may increase the chance of cetaceans being targeted by sharks or killer whales (Chilvers & Corkeron, 2001). At least one dolphin was known to have been bitten by a shark while following a trawler (Corkeron, 1990).
2.5.6 Prey depletion
There is concern that over-fishing by trawl fisheries may cause a depletion of prey for cetaceans and adversely impact population rates (Fertl & Leatherwood, 1997; Moore et al., 2013; Reeves et al., 2003). Because trawling takes the target species as well as many by-caught species, it can remove species throughout the entire food web. Populations of cetaceans in areas of heavy trawl-fishing, such as the Bering Sea, Mediterranean Sea, and Gulf of Mexico have suffered from overfishing (Fertl & Leatherwood, 1997; Notarbartolo di Sciari & Birkun, 2010; Reeves et al., 2003).
“Fleets of large bottom and mid-water trawlers and jigging vessels, especially those with factories on board, possess fishing capacities that allow them to exploit biological systems at unprecedented levels and rates. From the late 1980s to late 1990s, the fleet of large trawlers targeting common hake (Merluccius hubbsi) and shrimp in the south-western Atlantic Ocean grew to about 200 vessels, and biomass extraction increased from about 0.3–1.2 million tons per year. During the mid-1990s, some seven tons of bycatch were discarded (dumped back into the sea) per day per vessel, with each vessel fishing for an average of 300 days per year. The hake fishery involves the capture of more than 40 non-target species in coastal waters and at least 20 in offshore shelf waters. Therefore, even if the hake and shrimp stocks targeted by trawlers were themselves unimportant as prey for cetaceans (in fact they are important, Koen Alonso et al. 1998, 2000), some of the by-caught species certainly would be. This situation is only one example of what is undoubtedly a more widespread phenomenon” (Reeves et al., 2003).
Bearzi et al. (2008) document the precipitous decline of the Short-beaked common dolphin in the coastal waters of the Eastern Ionian Sea across 13 yrs. While 150 animals were present in the study area (1,050 km2) in 1996, only 15 were observed in 2007. A 12 mo assessment of fishing effort and catch, together with circumstantial evidence, suggests that the decline was caused largely by prey depletion resulting from overfishing, and largely due to purse-seining (Bearzi et al., 2008).
Over-fishing of stocks and inadequate management and enforcement, often due to or exacerbated by economic difficulties are serious, widespread problems in most countries of the African Eastern Atlantic Basin and Macaronesia. For instance, trawl surveys conducted in the Gulf of Guinea since 1977 and other
61
regional stock assessments indicate that the fish biomass in near-shore and offshore waters has declined by at least 50% (van Waerebeek, 2007). Such dramatically reduced prey availability could have significant negative consequences on the average health of a population and its recruitment potential. Since 2006, there has been a strong increase in the presence of Chinese, Korean and Japanese trawlers witnessed off the coast of Cameroon, which do not respect any existing fisheries regulations (CMS Secretariat, 2012).
Key point: Cetaceans often target the same prey species as those targeted by mid-water trawl fisheries. Overfishing of stocks in one area may hinder feeding or provisioning of cetacean species and have led to population declines in some species internationally.
2.5.7 Changes to cetacean behaviour during or following fishing activities
Trawl fisheries provide a reliable food source from bycatch disposal, referred to in this review as offal management, and catch depredation for cetaceans such as dolphins (Fertl & Leatherwood, 1997). Trawlers may provide a concentrated source of food in an otherwise patchy environment (food patch) or provide a preferred prey item otherwise unavailable to small cetaceans (Couperus, 1994; Fertl & Leatherwood, 1997; Morizur et al., 1999). Food patches provided by mid-water trawlers may impact on the behaviour of marine mammals through alterations in food distribution, availability, and predictability, affecting related social interactions and population demographics (Chilvers & Corkeron, 2001; Pace et al., 2012).
Dolphins can detect food patches left by trawlers’ via the sound of the engines (Chilvers & Corkeron, 2001). Many reports suggest increased interactions at night; this has been attributed to more trawling activity at this time and/or less alert dolphins at the surface (Crespo et al., 1997; Fertl & Leatherwood, 1997). Bottlenose dolphins, in groups up to fifty animals, have been observed exploiting fish that were attracted to illumination of surface waters by the vessel’s deck lights (Zollett & Rosenberg, 2005). Females with calves have been observed following shrimp boats, and it has been speculated that the calves learn this foraging behaviour and that mothers may utilize the extra energy resources for lactation (Shane et al., 1986 in Fertl & Leatherwood, 1997).
Anthropogenic concentrations of food (including offal from fish processing vessels) can cause changes in animal behaviour. A study from Moreton Bay, Queensland, identified two dolphin communities within a broader population: one that fed in association with trawlers and another that did not (Chilvers and Corkeron 2001). Approximately 30-40 killer whales were observed scavenging off discards from 10 Dutch mid-water freezer trawlers (71 m stern trawler, 14 m front net mesh diameter) in the Shetlands Islands. The trawlers were fishing for mackerel and the killer whales were feeding on fish that slipped through the net mesh or slipped overboard during hauling or shooting the net (Couperus, 1994).
Key point: the concentration of prey items during or following fishing activities is known to attract feeding cetaceans.
2.6 International interactions between cetaceans and trawl fisheries Table 2.2 summarises international trawl fisheries that were identified with cetacean interactions, the available statistics and the reliability and source of the information. There are many gaps in the data, especially for gear in use during incidental capture events. Regions with considerable, high quality information in Table 2.2 have more detail provided in the text below.
2.6.1 United States
For cetacean bycatch in the US, dolphins and porpoises constituted the vast majority of interactions. Most marine mammal bycatch occurred in gillnets (84%). Bycatch of cetaceans occurred in (21%) of trawls,

62
although gillnets were responsible for the highest mortality (Geijer & Read, 2013). The estimates of bycatch were negatively biased, because observer programmes were not implemented in all fisheries that take marine mammals as bycatch. Tables 2.3 and 2.4 describe the 2012 bycatch species for the various trawl fisheries in the U.S.
Observer data was used from 2003-2006 to examine marine mammal bycatch for the mid-water trawl fisheries (Single and pair trawl). A quasi-Poisson GAM bycatch rate model indicated that the most significant predictors of marine mammal bycatch were the latitude where fishing occurred and depth of the water column (D. L. Palka pers. comm, Northeast Fisheries Science Center, 166 Water Street, Woods Hole, MA 02543 in National Marine Fisheries Service, 2011, no further results provided in the 2011 report).
Key point: Latitude and ocean depth were identified as important predictors of marine mammal interactions with fisheries in the USA.
2.6.2 North-east Atlantic (Western Europe)
Between 1989 and 1994 the size of the Dutch pelagic trawl fleet in the North-east Atlantic varied from 11 to 13 freezer trawlers, and an additional nine vessels were operating for the same Dutch company under foreign flags (three German, three British and three French) (Couperus, 1997). Fishing areas were in the North Sea and around the British Isles along the continental shelf. The average annual catch of the Dutch fleet has been in the order of 300,000 metric tons (Couperus, 1997). There was a 12% increase (420,000 t) in fish landings on the previous year despite a decrease in vessels from were 18 to 16 (Ross & Isaac, 2004). This demonstrates the great effort the pelagic factory vessels are able to apply to a fishery.
Cetacean bycatch occurred when trawling for mackerel:
1) at or near the continental shelf edge
2) either at night or in the early morning even though more hauling operations occurred during daylight
3) using a fishing depth between 100 m and 400 m
4) using a haul duration from 4.5 hours to over 12 hours
5) with sharp vessel turns (turning on the doors) (Couperus, 1997).
Key points: Pelagic factory trawlers can exert a large amount of effort on a fishery. Proximity to the shelf edge, hauling time, fishing depth and sharp vessel turns were identified as the key factors involved in the incidental capture of cetaceans.
2.6.3 Mediterranean and Black Seas
In the Mediterranean Sea, the Common Dolphin population has declined by more than 50% over the past 30–45 years and the population was listed as Endangered on the IUCN Red List of Threatened Species in 2003 (Bearzi et al., 2008). Although the decline was linked to prey depletion by purse seining, Spanish fleets have been prohibited from using pelagic trawls by national legislation as part of a management plan to reduce further population decline (Ross & Isaac, 2004).
Galicia (northwest Spain) is a well-known fishing area with a large fishing fleet. Bycatch of dolphins was considered rare. In 2001 and 2002 a study by Fernández-Contreras (2010) showed the annual bycatch was 394 dolphins (95% confidence interval (CI) 230–632), most commonly of short-beaked common dolphins. Hauling time, fishing depth, and season of the year were identified as the key factors involved in the incidental capture. The dolphins were most vulnerable to trawls at night from May to September (mean 348 dolphins, 95% CI 200–590) with just a few interactions from October to April (mean 46 dolphins, 95% CI
63
0–132) around the continental shelf break. Most of the dolphins in the bycatch were males, and the average age was 13.4±4.4 years for males and 11.5±4.8 years for females. The sex ratio supported the notion that bachelor groups existed in the area. It was expected that this level of bycatch could be reduced significantly if trawlers were restricted to operating in water deeper than 250 m and likely avoided entirely if they were restricted to water deeper than 300 m (Fernández-Contreras et al., 2010).
Key point: Hauling time, fishing depth, and season of the year were identified as the key factors involved in the incidental capture.
2.6.4 Western Africa
Between 40 and 70 foreign trawlers (Russian, Lithuanian, and Icelandic) including 5–10 European (Dutch and Irish) pelagic freezer-factory trawlers (net openings of 90 × 50 m) operate out of NW Africa, all together yielding more than 500,000 tons of small pelagic fish per year. The pelagic freezer-factory trawlers operate nearly year-round and are amongst the largest fishing vessels in the world with installed horse power for trawling and freezing between 9,000 and 18,000 hp. This example provides a rare example of information for vessels of a similar size to those of interest for this review and their interaction with cetaceans. In the Mauritanian Exclusive Economic Zone (EEZ, 200 nm) they operate within miles of each other, fully exploiting the fish stocks that rank amongst the most productive and most intensively fished areas in the world (Zeeberg et al., 2006).
The conservation situation of small cetaceans in western Africa is not well known and few fisheries in western Africa are known to have been surveyed for small cetacean bycatch. Zeeberg et al. (2006) presents pelagic megafauna bycatch rates observed during more than 1,400 trawl sets off Mauritania, NW Africa, between October 2001 and May 2005. The observed trawl sets represent 4–88% of the fishing effort of the Dutch pelagic freezer-factory trawlers in a particular month. Cetaceans make up 8% of the megafauna bycatch, which occurs almost exclusively at night (Zeeberg et al., 2006). Additionally, in summers or years with low sardine abundance, bycatch of non-target species increases because the vessels continue to trawl while searching for the target species, this also happens when searching at night if target species has dispersed and fishers are searching for catch (Zeeberg et al., 2006).
There was also a strong seasonal relationship with cetacean incidental bycatch linked to the return of the migrating sardines. Trawlers in spring incidentally captured pods of 10–20 short-finned pilot whales or groups of 5–30 dolphins. The transit of sardines through the region appears to increase megafauna bycatch rates in all types of fisheries, with the combined international trawler fleet (40–70 vessels) accounting for a substantial part of the larger, oceanic animals (Zeeberg et al., 2006).
The majority of cetaceans captured in pelagic trawler fisheries are the smaller dolphins that live near the sea surface (as opposed to larger, diving dolphin species) (Zeeberg et al., 2006). Freezer-factory trawler bycatch in the Mauritanian EEZ was 70–720 dolphins between 2001–2005, mostly common dolphins. This is considerable, but comparable to bycatch in European waters (see Morizur et al., 1999), and probably less than the international moratoria of 1–1.7% of the relevant abundance estimates (Zeeberg et al., 2006). There was no discussion of whether these boats had any cetacean bycatch mitigation in place.
Key point: Cetaceans made up 8% of the megafauna bycatch from freezer-factory trawlers, which occurs almost exclusively at night. There was also a strong seasonal relationship with cetacean incidental bycatch linked to the return of the migrating sardines.
64
2.6.5 Latin America (South-western Atlantic Ocean, Southern South America, Eastern South Pacific)
Many species of small cetaceans are taken incidentally in fisheries developed along the coastal border of Brazil, Uruguay and Argentina, Chile, Peru and Ecuador. In Ecuador, tuna trawlers have been recently reported to catch hundreds of Bottlenose dolphins in a single operation (Hucke-Gaete et al., 2002). In Brazil, Uruguay and Argentina, the Franciscana dolphin (Pontoporia blainvillei) is the species of greatest concern and the Tucuxi (Sotalia fluviatilis) has also experienced relatively high levels of incidental mortality in some areas (Hucke-Gaete et al., 2002). Other cetacean species incidentally captured in Latin American fisheries are Burmeister’s porpoise (Phocoena spinipinnis), dusky dolphin (Lagenorhynchus obscurus), Peale’s dolphin (L. australis), Commerson’s dolphin (Cephalorhynchus commersonii), Chilean dolphin (C. Eutropia), Short beaked common dolphin (Delphinus delphis), Long-beaked common dolphin (D. capensis), Pantropical spotted dolphin (Stenella attenuate), Southern elephant seal (Mirounga leonina), and spectacled porpoise (Australophocoena dioptrica) (Hucke-Gaete et al., 2002; Reeves et al., 2013).
Trawl fishery interactions with cetaceans in the Antarctic Peninsula region are uncommon. The Patagonian toothfish fishery has reported interactions with Sperm whales (P. macrocephalus) and Killer whales (Orcinus orca), and one unidentified fishery recorded an interaction with a Blue whale (Balaenoptera musculus).
Data on trawl interactions and cetacean bycatch are sparse, but exist for the Argentinian trawl fishery (Table 2.2). From 1992-1995, six large factory vessels (length 74 m, 1,663 m3 hold, 48 days trip duration) operated from Ushuaia, fishing for Patagonian grenadier (Macruronus magellanicus) and southern blue whiting (Micromesistius australis) for "surimi" (mid-water and bottom trawlers) (Crespo et al., 1997). Fishing areas were located between Burdwood Bank (most fishing occurs at 200 m depth) and the shelf between Malvinas Island and Tierra del Fuego, areas of cold-water currents. Factory vessels used diurnal bottom trawling, with a net mouth of 3–7 m high and 42–52 m wide (Crespo et al., 1997). There were also nocturnal mid-water factory trawlers using a net mouth 20 m high and 40 m wide for shrimp, and 42 m wide and 42 m high for hake (Crespo et al., 1997). Shrimp boats had the largest interaction with cetaceans (see Table 2.2 for data). The estimated mean and median of the total annual dusky dolphin bycatch 2002–2003 were 107 and 103 dolphins/yr, respectively. The comparisons between annual bycatch rates and critical population values lead to the conclusion that dusky dolphin catches may be low in absolute numbers, but they are very close to allowable limits or they exceeded the thresholds (Dans et al., 2003b). It is important to consider that while bycatch rates may be considered to be low, they may exceed sustainable limits for a population.
The Argentine hake fishery collapsed during the 1990’s due to overfishing and the number of mid-water trawls was reduced, thereby indirectly reducing the incidental catch of dolphins. In 1994 there were 20 factory trawlers fishing in Patagonia, in 2001 there were 12 (Dans et al., 2003b).
Key point: Cetacean bycatch in trawls are uncommon in factory trawlers fishing in Patagonian waters, but mostly occur in the shrimp trawlers (40 × 40 m net mouth). It is important to consider that while bycatch rates may be considered to be low, they may exceed sustainable limits for a population.
2.6.6 New Zealand
In New Zealand Hector’s dolphins, Common dolphins, Dusky dolphins, Bottlenose dolphins, Killer whales, and pilot whales have been captured in trawl fisheries (Fertl & Leatherwood, 1997; Thompson et al., 2013).
The primary threat to Maui’s and Hector’s dolphins is as bycatch in commercial gillnet and trawl fisheries (Reynolds, 2008). New Zealand’s endemic and threatened Hector’s dolphins overlap with gillnet and trawl
65
fisheries throughout their geographic range. For example, while there is no quantitative estimate for the number of dolphins caught in trawl fisheries, the number of reported catches and the level of fishing effort suggest that bycatch in trawl fisheries could be substantial (Dawson and Slooten, 2005). Fishing mortality is considered to be an important regulator of the dolphin populations. Without it, all populations are projected to increase, with the total population approximately doubling by 2050 and reaching half of its 1970 population size in just under 40 years (Slooten & Dawson, 2010).
Mid-water and bottom trawling for the commercial fish species jack mackerel (Trachurus novaezelandiae) resulted in incidental mortalities of Common dolphin (Table 2.2). Annual trawl effort in the jack mackerel fishery has increased dramatically since the late nineties, from 405 trawls by three vessels in the 1995/96 fishing year, to 2164 trawls by eight vessels in the 2006/07 fishing year. Observed dolphin captures have also increased over the period, with 11 dolphins caught during observed tows in 2006/07 (Table 2.2). The jack mackerel trawl fishery, operating off the west coast of the North Island, was responsible for 91% of observed dolphin mortalities in trawl fisheries from 1995 to 2007. There were 0.8 capture events per 100 observed tows in the 2006/07 fishing year. Dolphins are often caught in groups; the mean number killed in a single capture event was 2.5 dolphins. Four covariates explained variation in the probability of a capture event occurring during a trawl:
(1) headline depth, the depth of the top of the trawl net;
(2) trawl duration, time spent trawling, from shooting the net to hauling;
(3) light condition at haul time, which depended on the time of day and the illumination of the moon; and,
(4) geographic location of the tow: north or south of Mount Taranaki.
Headline depth was the variable that explained most of the dolphin bycatch, with more dolphins being caught when the headline depth was shallower. Most bycatch occurred shallower than 40 m, the model estimated that deepening the headline depth of a tow by 21 metres would have halved the probability of a dolphin capture event (Thompson & Abraham, 2009).
Key point: Mid-water and bottom trawling resulted in incidental mortalities of Common dolphin. Headline depth was the variable that explained most of the dolphin bycatch.
2.7 Australian interactions between cetaceans and trawl fisheries The Australian Small Pelagic Fishery (SPF) targets Australian sardine (Sardinops sagax), Blue mackerel (Scomber australasicus), Jack mackerels (Trachurus declivis, T. murphyi) and Redbait (Emmelichthys nitidus). These target species occur in the diet of some odontocetes (toothed whales and dolphins). The SPF uses Purse-seine and mid-water trawlers to catch fish (Moore & Skirtun, 2012). The SPF extends from southern Queensland to southern Western Australia and is divided into four management zones. Most fishing effort occurs in Zone A (Tas) with mid-water trawling for redbait most common since 2002. Seven cetacean species are identified as high risk (level 2, PSA Residual Risk) for the SPF (Table 2.1) (AFMA, 2010).
The Southern and Eastern Scalefish and Shark Fishery also have trawl sectors, including the Great Australian Bight Trawl Fishery (GABTF) (GABIA, 2010) that includes waters from the 200 m isobar, from Kangaroo Island S.A. to the south western corner of W.A. The main target species in the GABTF are Bight Redfish and Deepwater Flathead which are primarily caught with demersal trawl. Several other gear types are permitted in the GABTF; otter trawl, mid-water trawl and pair trawl. There is also a developing slope fishery in which Western Gemfish and other slope species are targeted sporadically. The GABTF is a relatively small fishery with only ten boat statutory fishing rights (SFRs) and six companies. Daily fishing logs are used to
66
report catches and fisheries observers are used at times. The fishery also makes all efforts possible to retrieve lost fishing gear. If this is not possible, then it is required to be reported, with the position, to the Rescue Coordination Centre (RCC Australia) (GABIA, 2010).
2.7.1 What is the result of interactions between cetaceans and trawl gear / fishing operations
Minimising catches of non-target animals in a trawl fishery reduces the impact on a marine community and may help to sustain the fishery resource in the long term. Hence the desirability for trawls that minimise impacts on non-target species while maintaining catches of target species (Brewer et al., 1996).
Dolphins interact with trawlers in a number of Australian trawl fisheries though mortalities tend to be rare, or rarely reported (Bannister et al., 1996; Shaughnessy et al., 2003). In the Moreton Bay prawn trawl fishery, net entanglement of bottlenose dolphins is rare but typically includes juveniles (Chilvers and Corkeron 2001). In the demersal trawl fishery in the Pilbarra WA, dolphins are occasionally taken as bycatch (Shaughnessy et al., 2003; Stephenson et al. 2008).
2.7.2 Tasmania and the Small Pelagic Fishery (SPF)
Pelagic factory trawlers commenced fishing operations for blue grenadier (Macruronus novaezelandiae) off the west coast of Tasmania in 1997 (Shaughnessy et al., 2003). No details were provided for the size or capacity of the vessels. Following the death of over 80 seals in 1999, seal bycatch was identified as an important issue for that fishery.
Mid-water trawling was trialled in Tasmania during 2001 for the Small Pelagic Fishery (SPF) and commercial mid-water trawl operations commenced in late 2002, with redbait the primary target species (Lyle & Willcox, 2008). At the commencement of the fishery, a ‘soft’ rope-mesh Seal Excluder Device (SED) and a high level of observer coverage was used. In 2004, 14 dolphin mortalities occurred in two separate incidents east of Flinders Island. After this, full observer coverage was applied to the fishery and other dolphin bycatch mitigation methods applied, including that the gear would not be set if dolphins were sighted around the vessel, and the vessel would steam at least 10 kilometres away from areas where dolphins were present before setting the gear. However, a further 3 dolphin mortalities occurred in mid-2005. From Jan 2006 – Feb 2007, Lyle and Willcox (2008) obtained underwater video information for almost 100 trawls, representing over 700 hours of video footage. No interactions with dolphins were observed or reported over the entire study period, highlighting that such interactions are rare and unpredictable.
A total of 25 dolphin mortalities (with mid-water trawls) were reported during 2001-2009. There have been no reported incidental interactions with dolphins since June 2005, following the introduction of bycatch management measures (Tuck et al., 2013). In 2011, the SPF reported no cetacean incidental bycatch, however it must be noted that this coincides with a reduction in fishing effort (no mid-water trawl fishery catches in 2011), a decline in observer coverage (Moore & Skirtun, 2012; Tuck et al., 2013).
2.7.3 Western Australian Pilbara Trawl Fishery
The Pilbara Trawl Fishery targets demersal scalefish species and is situated in the Pilbara region in the north west of Australia. It occupies the waters north of latitude 21°35’ S and between longitudes 114°9’36 E and 120° E. The incidental catch of bottlenose dolphins in this fishery in 2006 equated to an annual bycatch of approximately 43 dolphins per year (Stephenson et al., 2008).
The observer coverage was 1,384 shots out of the total number for the period of the survey of 2,719 shots. A semi-flexible exclusion grid was successful in reducing bottlenose dolphin bycatch (Stephenson et al.,
67
2008). With the grid deployed the dolphin catch was 9 in 1,156 shots, a reduction from the dolphin catch rate in 2005 without grids, which was 15.2 per 1,000 shots (Stephenson et al., 2008). The dolphins were generally caught in daylight hours, with 84% of the dolphins caught between 7:00 and 20:00. This temporal pattern was not related to the time of winch-up as fishing and winch-up occurred over the whole 24 hour period. Net depth (50-80 m) did not affect dolphin capture rate. A higher relative frequency of dolphin captures was observed in shallower water, but that was related to the fishing effort expended not the net depth (Stephenson et al., 2008).
During the 1,384 shots observed, video footage was obtained for 446 shots, with most of the footage obtained by grid trial staff. The footage showed images of behaviour of dolphins entering and exiting the net or on the outside of the net in nearly all of the 446 tapes. The video footage indicated that in almost all cases the dolphins backed down into the net to a position about 3 m from the grid and later swam upstream out of the net. Very few dolphins were seen swimming head-first towards the grid, and those that did turned around before reaching the grid and swam out the mouth of the net. Seven dolphins were recorded interacting with the grid or escape opening. Three assumed to have escaped alive and four were in distress and were assumed to have died (Stephenson et al., 2008). The underwater video footage of the behaviour of the dolphins, showing them backing towards the grid, appears to indicate that the dolphins readily detect the selection grid. The pressure wave generated by the grid is probably effective in allowing the dolphin to detect its proximity to the grid (Stephenson et al., 2008).
2.7.4 Regional differences in the groups impacted by trawl fisheries
Cetacean abundance and population trends are largely unknown. Population groups are identified by genetics and can be very large and broad ranging or quite restricted. Because of these complexities, each fishery should consider the individual cetacean species and populations of those species that may be impacted on an individual basis.
The large whales listed as likely to interact with trawling in the SPF (Table 2.) typically migrate through the area (e.g. humpback whales) or feed at the upwelling areas such as the Bonney Upwelling (SA) and the Perth Canyon in W.A. 13 small cetacean species were identified as resident with in the boundaries of the SPF, however their ranking of likelihood of interacting (low, moderate or high, Table 2.1) with a large mid-water trawl vessel in the SPF depended not only on their range, but also on their diet, behaviour and whether interactions exist with trawl fisheries in other countries (Table 2.2).
2.8 Cetacean bycatch mitigation devices / measures?
2.8.1 Internationally
Techniques for reducing cetacean bycatch
Bycatch varies depending on a number of factors including target and bycatch species, fishing gear configurations, and fishing areas (Kennelly & Broadhurst, 2002). Behavioural differences between species and even populations suggest different solutions may be needed to address bycatch (Zollett, 2009a). Cetacean bycatch mitigation is being constantly argued and new devices developed, with current management measures including operational or behavioural alterations to some fisheries. Zeeberg et al. (2006) stated that operational changes such as gear adaptation may achieve immediate results at low cost. Behavioural changes such marine reserves, closed seasons, or adaptive, bycatch limiting trawling habits are difficult to implement. To ensure the sustainability of trawler fisheries, excluders should be standard rigging on pelagic trawlers, especially in months with maximum animal abundance. However, scientists from the Marine Mammal Society state in a letter to the New Zealand Government (Reynolds, 2008) that the only

68
conservation measure that has proven to reduce by-catches of all small cetaceans in trawl fisheries over the long term is separation of nets and animals in time and/or space.
Gear mitigation possibilities include transmission of sounds to frighten small cetaceans away; large mesh nets across the net mouth to discourage cetacean entry; and cod-end escape devices, but the success of these has been limited (Fertl & Leatherwood, 1997). Ensuring that mitigation devices do not affect fish catches is paramount, such that measures are readily accepted by the fishing industry (Morizur et al., 1999).
Cetacean exclusion devices
Cetacean exclusion devices generally include an escape hatch that is used in conjunction with a large diameter mesh barrier and can be detected by dolphins (Northridge et al., 2005; Werner et al., 2006). Although individual dolphins could potentially escape using a tunnel, cetaceans are less likely to enter a narrow (3–4 m) release route because of claustrophobia, which has been observed among cetaceans in marine mammal parks and purse seine fishery for tuna. At present there exists no solution to filter or deter cetaceans from the net opening. The most practical way to reduce cetacean bycatch, then, is to have an exit in the net’s top panel because dolphins had been observed to seek an exit in the upper part of the trawl (Zeeberg et al., 2006). The design of the escape tunnel provided in Figure 2 by Zeeberg et al. (2006) is thought to enable the cetaceans to reverse and accelerate upwards to reach the water surface (Zeeberg et al., 2006). Other references state that dolphins (bottlenose) prefer to exit at the bottom of the net (Zollett & Rosenberg, 2005). Further information is required on the escape behaviour of dolphin species that are known to interact with trawl nets.
Zeeberg et al. (Zeeberg et al., 2006) tested a tunnel exclusion device in the Mauritania (West Africa) trawl fleet. This was not successful for cetaceans, while only making up 8% of the retained bycatch, zero were released alive.
Northridge et al. (2005) from the University of St Andrews describe the developmental stages of a dolphin escape devices for trial in trawl nets. It is unknown whether research has advanced on this device.
Acoustic pingers
Acoustic pingers are primarily used for gillnet fisheries (Carretta & Barlow, 2011). In the noise-saturated environment of a pelagic trawler, the effect of “pingers” on cetaceans has not yet been demonstrated (Werner et al., 2006; Zeeberg et al., 2006).
Observer programs and altering trawler behaviour
Independent observer programs are important, because they provide more reliable catch rates and may enable trawling behaviour to alter in the presence of cetaceans. Both Morizur (1999) and Fernández-Contreras et al. (2010) suggest that dolphins are caught because they failed to abandon the gear when the net was hauled. Dolphin by-catches increased during the night or on nights with little light (no moon) (Du Fresne et al., 2007; Morizur et al., 1999; Waring et al., 1990). A total winch time > 24 minutes was important to minimise drowning of captured cetaceans (Du Fresne et al., 2007). Modifications to the haul-back procedure may reduce bycatch, as might fishing only during the day, but confining trawling to daylight hours is impossible to enforce and not yet of established benefit (Fertl & Leatherwood, 1997). Most trawling occurs at night in Tasmania, and most dolphin bycatch also occurred at night. When the analysis was altered to control for this bias towards diurnal trawling activity, the diurnal relationship with cetacean bycatch was no longer apparent and it was clear that they were incidentally captured day and night (Lyle & Willcox, 2008).

69
The net depth has been one of the most important factors affecting the degree of common dolphin bycatch in three studies (Du Fresne et al., 2007; Fernández-Contreras et al., 2010; Thompson et al., 2013). The majority of dolphin bycatch occurred at depths > 40 m (Thompson et al., 2013) and < 115 m (Du Fresne et al., 2007). The consensus is that common dolphin bycatch is reduced at less than 180–250 m and unlikely at 300 m net depth (60 m in Thompson et al. (2013).
Depth of the water column has been shown to affect levels of cetacean bycatch (National Marine Fisheries Service, 2011). Fishing on or near the continental shelf edge was also important (Couperus, 1997; Fernández-Contreras et al., 2010; Waring et al., 1990). Season of fishing was also important, i.e. summer or winter (Fernández-Contreras et al., 2010; Waring et al., 1990).
It has been stated that a sharp vessel turn (turning on the doors) can increase dolphin bycatch (Couperus, 1997). This may be the case; however, dolphin bycatch can still occur when trawlers are travelling at an even towing speed, performed in a straight line. A pairtrawler in the NE Atlantic incidentally captured 23 dolphins from 32 tows while travelling at an even speed, in a straight line (Northridge et al., 2005).
Time and area closures
Time and area closures may be an effective tool for reducing bycatch in areas with relatively high bycatch; however, the utility of closures will be fishery specific. Successful mitigation relies on knowledge of temporal and spatial uses of habitats and overlap with fisheries. Closures can cause gear shifts or can displace the effort elsewhere, causing problems for other species and/or populations (Zollett & Rosenberg, 2005).
Harvest limits
Harvest limits or Potential Biological Removal (PBR) limits may be set for a fishery (Hall et al., 2000; Wade, 1998). The International Whaling Commission (IWC) (Anon, 1996) agreed that, following the precautionary principal, cetacean by-catch should in no case exceed one half of the maximum growth rate of a population. Because populations of pelagic cetaceans may be large, and because fisheries may overlap, they may be impacted by more than one fishery. For example, most cetaceans are at risk from gillnets and the future expansion of pelagic gillnet use in Australian waters (SEWPaC, 2013) and many odontocetes are at risk from longline and gillnet fisheries (Hamer et al., 2012; Shaughnessy et al., 2003). Potential Biological Removal (PBR) models need to take all forms of anthropogenic mortality into account, not only fishery data and not independently for each fishery.
Reducing cetacean entanglement and ship strike
Identifying feeding, migration and nursing grounds for whales is important and fishing should be avoided in these areas (Hucke-Gaete et al., 2002). Remote sensing technologies may provide means to reduce ship strikes while simultaneously allowing certain maritime commerce and other activities to proceed with limited biological and economic impact. However, low whale detection rates and constraints on the effective range of some devices to provide ample warning and response times for mariners may limit their utility in this context. In addition, development, installation, maintenance, and/or operation may be cost prohibitive in some cases (Silber et al., 2009). Reducing the co-occurrence of whales and vessels is likely the only sure means of reducing ship strikes, but it is not possible in many locations (Silber et al., 2009). Maritime management and whale sanctuaries can be used to ameliorate strike likelihood (Redfern et al., 2013). By avoiding migration routes, foraging and calving areas, ship strike can be reduced. If areas cannot be avoided a low vessel speed reduces likelihood of ship strike (Bannister et al., 1996; Redfern et al., 2013).

70
2.8.2 Nationally
Cetacean exclusion devices
In the Pilbara Trawl Fishery, approximately 70 dolphins per year are captured incidentally in the fishery. In this fishery, a semi-flexible exclusion grid constructed from a combination of braided stainless wire and pipe, appeared to reduce the bycatch of dolphins by almost half (see Figure 5 in Stephenson et al., 2006). Dolphins are able to swim out the mouth of the net, or exit through the escape opening, after interacting with the grid. However, an undetermined number of dolphins may exit the net underwater in poor condition with unknown chances of survival (Stephenson et al., 2008). In this study it was recommended that video footage should be collected to gain information on the fate of dolphins that encounter the grid. In the Pilbara Trawl Fishery, one dolphin has been reported to have had its tail fluke caught in the grid by an observer and another by a skipper. Reducing the bar spacing, to less than the present 155 mm, may reduce the likelihood of this occurring (Stephenson et al., 2008).
Acoustic pingers
In Western Australia, in a FRDC funded project, pingers were found to be ineffective in keeping dolphins out of the trawl net in the Pilbara Trawl Fishery and were rejected as a dolphin bycatch mitigation method (Stephenson et al., 2006).
Time and area closures
Spatial closures as applied in Australian fisheries are often temporal in nature. They are applied to usually address one particular fishing issue such as bycatch. MPAs are complete closures that apply to protect a range of organisms. MPAs that are effective in protecting odontocete populations are difficult to implement, because (1) determining where to put them is difficult in the absence of reliable data on odontocete migration and movement patterns, (2) they are often smaller than necessary, due to stakeholder pressure to minimize their impact on fisheries, (3) monitoring compliance by fishermen is difficult due to the lack of capacity and resources and (4) quantitative performance assessment is hampered by the statistical uncertainties associated with limited and potentially unrepresentative data (Hamer et al., 2012).
In the Pilbara Trawl Fishery there was a temporal pattern in the dolphin catch rates with most being caught in daylight hours. This pattern is not useful for dolphin catch mitigation as daytime closure of the fishery would severely disrupt the fishing operation and greatly reduce scalefish catches. The lack of spatial patterns in dolphin catches observed and reported in 2004–05 and 2006 indicate that area closures will probably be ineffective in reducing dolphin catches (Stephenson et al., 2008).
Observer programs and altering trawler behaviour
Hamer et al. (2012) noted that “The “move on” tactic has been used by some longline fishermen in a bid to outrun depredating whales, although the success of this strategy seems to be ambiguous at best and is likely to be costly, thus affecting profit margins. A study of this method for avoiding pinniped depredation and bycatch in a trawl fishery found it was only occasionally successful, because depredating individuals were also able to travel long distances to remain with the vessel (Tilzey et al. 2006).” Move on provisions are used regularly in the Commission for the Conservation of Antarctic Marine Living Resources (CCAMLR) fisheries to manage bycatch issues for a range of taxa.
Observer coverage and accurate reporting of bycatch and discards in daily fishing logs are important to monitor by-catch and other aspects of fishery operations (Hamer et al., 2012; Hamer et al., 2008). This

71
problem is further exacerbated by under reporting in fishery logbooks, which occurs because fishermen are typically fearful of the negative consequences of reporting accurately (Hamer et al., 2012; Moore et al., 2010).
In the Pilbara Trawl Fishery an evaluation of the success of an exclusion device for ceaceans, turtles and sharks recommended that the observer program (with 22% coverage of the fishery) should continue to gather ongoing information on the catch of dolphins, turtles and sharks (Stephenson et al., 2008). There appeared to be a difference between the reported catch of dolphins with and without observers on-board the vessels during the project. Between January 2004 and June 2005 the catch rate reported by observers was 13.3 dolphins per 1,000 shots compared to 5.6 dolphins per 1,000 shots reported by the skippers when observers were not on board (Stephenson et al., 2008).
In the SPF, a volunteer industry code of conduct has been developed and adopted by industry to minimise interactions with dolphins. The code includes practices such as not setting gear where dolphins are sighted, and actively steaming at least 10km away from areas where dolphins are present before setting gear (AFMA, 2012).
AFMA also require certain mid-water trawl operators in the SPF to comply with a dolphin management plan that contains mitigation measures to minimise interactions with dolphins (Tuck et al., 2013). This plan includes suspending fishing if one or more dolphin mortalities occur, and not recommencing fishing within 50 nautical miles from where the mortality was recorded. Voluntary rules for mid-water trawl operations were first implemented by the SPF industry members in October 2004 and again in May 2005 following the Cetacean Mitigation Working Group meetings to mitigate bycatch of TEP species. The first rule states that fishing must stop and the vessel relocate if dolphins were seen following incidental dolphin captures. The second rule involved conducting long wide turns to maintain net configuration rather than winching gear to blocks prior to turning. Additional planned scientific trials to assess modifications of mid-water trawl gear are expected to be completed by 2013 but are dependent on fishing by that method taking place (Tuck et al., 2013).
The Great Australian Bight Trawl Fishery
The GABTF has independent observers on board form time-to-time and uses a number of industry initiatives that assist in quantifying and reducing bycatch, including:
• the GABTF Bycatch and Discard Workplan, which outlines actions that will be undertaken in the GABTF to address bycatch and discarding issues;
• gear modifications pursued by industry, including the move to T90 extensions and/or codends on all nets used for fishing on the shelf;
• area closures;
• investigation of seabird mitigation measures, including offal management and mitigation devices;
• individual vessel management plans; and production of a GABIA bycatch and discards flier to assist in accurate reporting of bycatch and discards in daily fishing logs (GABIA, 2010).
2.9 Has the effectiveness of mitigation measures been investigated? The bycatch of marine mammals in U.S. fisheries has declined significantly since the Marine Mammal Protection Act (MMPA) was amended in 1994 to address this conservation issue. The MMPA provides an objective and quantitative goal which can be used to measure the success or failure of mitigation efforts and facilitates the generation of fishery specific solutions to bycatch problems through a negotiated
72
rulemaking process (Geijer & Read, 2013). However, most of the bycatch reduction in the U.S. has occurred because of mitigation measures in the gillnet fishery (Geijer & Read, 2013). In 2009 excluder devices for marine mammals in trawl gear had not been tested or implemented in the United States (Zollett, 2009a). Werner et al. (2006) published an excellent review of bycatch mitigation methods and trial results (see Table 2.1).
The Atlantic Trawl Gear Take Reduction Team (ATGTRT) has identified several voluntary measures that fishermen in the Northeast and Mid-Atlantic can take to reduce marine mammal bycatch. See their website for a list of groups http://www.nmfs.noaa.gov/pr/interactions/trt/teams.htm. These measures include reducing the number of turns made by the fishing vessel, decreasing tow times at night, and increasing communication between fishermen as to sightings or incidental takes of marine mammals (Zollett, 2009a). The Atlantic Trawl Gear Team is working to reduce cetacean bycatch in the mid-water trawl and pair-trawl fisheries http://www.nero.noaa.gov/prot_res/atgtrp/.
In 2003 and 2004, the NW Atlantic fleet preferably used the smaller 4,300 (circumference) meshes trawl (70 m×30 m net opening), which is more easily manoeuvred in shallow waters above the shelf. Trawls with a larger circumference have a larger net opening and the greater extension of their rigging parts (bridles and doors) likely provides a significant herding effect for cetaceans. In comparison, the frequent hauls and concomitant trawl entrance collapses during manoeuvrings of the smaller Russian, Lithuanian, and Icelandic trawlers do appear to promote cetacean bycatch (Fertl & Leatherwood, 1997; Zeeberg et al., 2006).
In fisheries that use fish pumps to empty the catch from the net, no cetacean bycatch is observed because the ability of the observer to record marine mammal catches is compromised (Morizur et al., 1999). Cetaceans are too large to pass through the pump and, in the case of the UK fisheries, the final emptying of the cod-end occurred outboard and thus any bycaught animals may have gone unobserved, particularly during the night (Ross & Isaac, 2004). To maximise observer program success, it is important that fish pumps are not used.
Refer to Table 2.5 for examples of small cetacean (Max length > 7.5m) bycatch mitigation techniques and trials. Extracted from http://www.bycatch.org/search. There were no records for large cetaceans.
2.10 Are there organisations working on mitigation? Stephenson et al. (2008) provide a good review of groups working on cetacean mitigation including the Centre for Environment, Fisheries & Aquaculture Science (CEFAS) that oversees the European Union (EU) funded project ‘NECESSITY’. Whether the reported groups are still active is uncertain. Stephenson et al. (2008) tested a cetacean exclusion device in the Pilbara Trawl Fishery in Western Australia, and used underwater video footage in an attempt to clearly determine its success.
In 2005, Simon Northridge and colleagues (Northridge et al., 2005) of the Sea Mammal Research Unit (SMRU), University of St Andrews, Scotland, were working on dolphin escape hatches used in conjunction with a barrier to reduce bycatch because dolphins can detect them and navigate through them. It is uncertain whether there is more recent designs from this research group.
In addition to several types of cetacean “barriers” (i.e. vertical ropes in the front part of the trawl), acoustic deterrents are under development to prevent dolphins from entering the net opening, or guide them out during hauling (Zeeberg et al., 2006).
Erika Zollett (University of New Hampshire) could be working on mitigation devices in trawl fisheries, or know people who are (Zollett, 2004) - but this needs to be investigated further.

73
The Cetacean Mitigation Working Group (CMWG) was established in 2005 by Australian Fisheries Management Authority (AFMA) for the Small Pelagic fishery, which comprises industry, government, research and conservation organisations. The purpose of this group is to identify strategies to mitigate cetacean bycatch (especially dolphins), and to advise on research needs (AFMA, 2012).
2.10.1 Success stories?
The US National Marine Fisheries Service (NOAA) (2011) state several success stories from efforts to reduce cetacean bycatch in some fisheries:
• Harvest limits and time and area closures have resulted in bycatch reductions in some fisheries.
• Annual quota specification process results in fishery closures (and bycatch reductions) when target or bycatch quotas are reached.
• Regulations limit or prohibit discard in many fisheries.
• Industry-managed cooperatives in some fisheries have changed fleet behaviour, leading to reduction of bycatch.
Pilbara Trawl Fishery cetacean exclusion device halved dolphin captures (Stephenson et al., 2008).
Vaquita porpoise (Phocoena sinus) and leatherback turtle (Dermochelys coriacea) exclusion devices may be reducing bycatch of both species (Senko et al., 2013).
2.11 Gaps in the literature and areas of research to address these
• Cetacean bycatch estimates could be improved considerably if better data were made available by fishing nations on the composition of the fleet and on relative measures of effort in different fleet sectors. Such information might also assist management organizations such as the FAO and regional fisheries bodies in directing conservation efforts to areas where marine mammal bycatch is likely to be large but where no research infrastructure exists to assess their size or impact (Read et al., 2006)
• Identify proposed fishery high-use areas and determine degree of overlap with whale migration, foraging and calving areas – potentially restrict use of these areas to avoid interactions such as entanglement, noise disturbance and ship strike
• Identify broader biological and management questions that can provide fisheries managers with up-to-date information on abundance, population structure, and seasonal movements of the cetacean species known to frequent fishing zones (Fertl & Leatherwood, 1997)
• Cetacean bycatch often occurs during night trawls, indicating the additional need for behavioural studies to determine if this nocturnal relationship exists in the SPF
• Determine if altering net haul (e.g. speed) minimises collapse of net in the water and reduces drowning of cetaceans caught in the net
• Determine if fishing exclusively during the day is likely to reduce incidental bycatch mortality
• Determine if depth of the trawl net can be varied to minimise bycatch
• Determine if any net exclusion devices are successful with dolphins
• Calculate limits (PBRs) to human caused mortality for species likely to interact with trawlers, and include mortality caused by other fisheries and anthropogenic factors

74
• Examine success of increasing observer education, particularly cetacean species identification. Improved species identification by observers or logbook recorders on trawlers would likely increase the number of cetacean species identified in the SPF fishery.
• In the Pilbara Trawl Fishery, there was a significant difference in dolphin catches between vessels when the grid was deployed – differences that were considered due to different types of gear being used by the vessels. It was recommended that during future observer programs, these vessel differences should be documented so that fishing methods and net designs with the lowest dolphin catch rates can be adopted as standards in the fishery (Stephenson et al., 2008).
2.12 Reliability of data / source of information Data and information specific to cetacean bycatch in large mid-water or pelagic factory-freezer trawlers was sourced for North-west Atlantic, Western Africa, Argentina, the United States of America, and Tasmania, Australia. See Table 2.2 for a description of the type of data and quality for the statistics presented; see also (Couperus, 1997; Crespo et al., 1997; Dans et al., 2003a; Dans et al., 2003b; Morizur et al., 1999; National Marine Fisheries Service, 2011; Zeeberg et al., 2006) for relevant and useful information and data.
Each study states that bycatch data are difficult to source and results should be interpreted with caution. Most studies report that the results should be taken as minimum estimates because both observer and logbook data cannot record all cetacean mortality occurring in the fishery.
Data collection poses fundamental problems with estimating cetacean bycatch: logbook records suffer from under-reporting and on-board observer programs cannot detect the dead cetaceans that fall out of the net before it is brought onboard, or the fate of the whales that swim away entangled in netting. “Existing data do not permit us to determine the relative incidence of such mortalities among the different trawl types: sample sizes are too small, and many areas have no observer coverage. However, it seems likely that the greatest potential for conflict exists with mid-water and surface trawls operating in areas of high cetacean density, notably where both fishermen and cetaceans target the same prey.” (Fertl & Leatherwood, 1997)
2.13 Limitations in the review process Consultation with scientific experts was not part of the project scope. This limited the ability of the consultants to properly identify and contact Research Groups currently working on cetacean bycatch mitigation globally.
The majority of published data identified in this review pooled the cetacean bycatch data across trawl fleets and did not single out large pelagic or mid-water trawlers to maximise comparison leading to a lack of information specific to such vessles.
Statistics regarding cetacean interactions and bycatch are reported in a range of different formats that created difficulties when consolidating the data into a table for easy assessment and comparison. The search and compilation of data on cetacean interactions with trawl fisheries should be the focus of additional works.
To source data specific to large mid-water trawl vessels relating to cetacean bycatch, a separate project would be required that involves contacting relevant experts and industry groups for the data. This is a time-consuming process that was outside the scope for this review.
75
There was a paucity of literature showing cetacean interactions with trawl fisheries in Australia. This may be because there are limited interactions, or because there is a low level of observation or reporting of interactions. The lack of cetacean interactions reported for the SPF mid-water trawl fishery since 2009 corresponds to a reduction in fishing effort rather than a low level of interactions with cetaceans. Prior to this, from 2001-1009, there were 25 reported dolphin mortalities in this fishery. AFMA require certain mid-water trawl vessels to comply with a seal and dolphin management plan that mandates mitigation measures be used to minimise interactions with these species, however the success of these measures has not been properly determined for cetaceans (Tuck et al., 2013). It was identified that an upward-opening SED should be trialled for the mid-water trawl fishery to mitigate dolphin and seal moralities, however this did not go ahead due to lack of funding and the minimal trawl effort in the fishery (AFMA, 2011; Tuck et al., 2013).
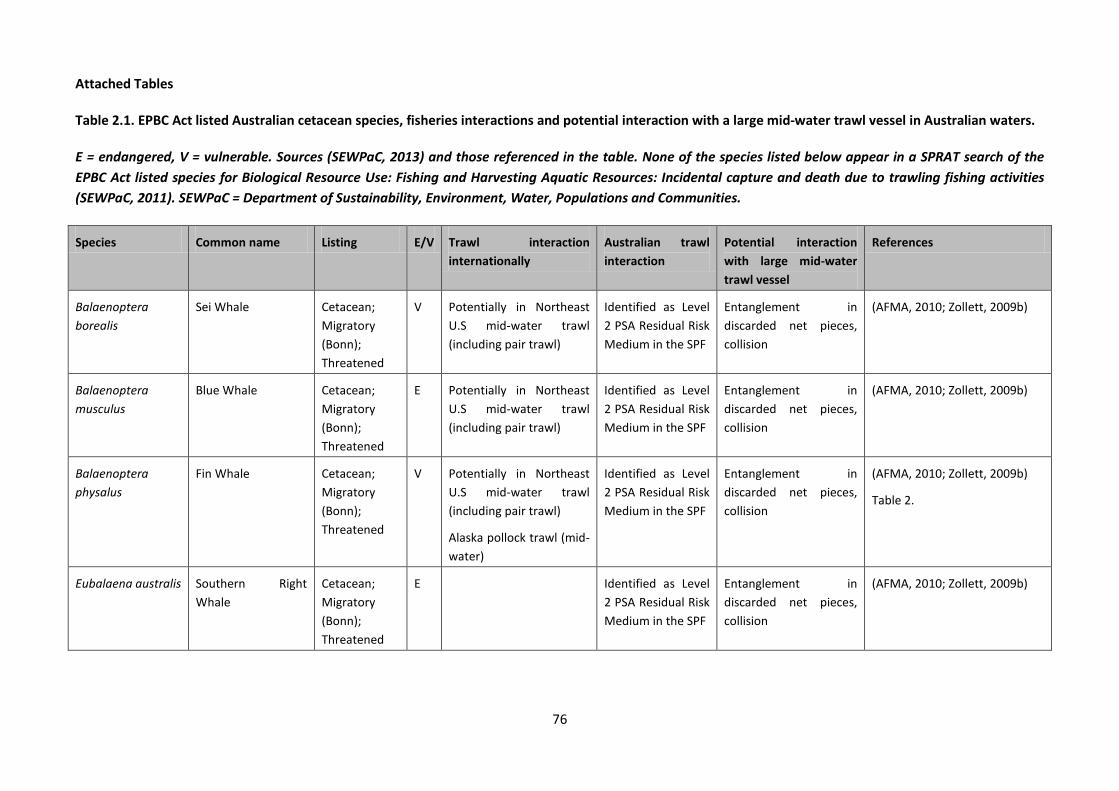
76
Attached Tables
Table 2.1. EPBC Act listed Australian cetacean species, fisheries interactions and potential interaction with a large mid-water trawl vessel in Australian waters.
E = endangered, V = vulnerable. Sources (SEWPaC, 2013) and those referenced in the table. None of the species listed below appear in a SPRAT search of the EPBC Act listed species for Biological Resource Use: Fishing and Harvesting Aquatic Resources: Incidental capture and death due to trawling fishing activities (SEWPaC, 2011). SEWPaC = Department of Sustainability, Environment, Water, Populations and Communities.
Species Common name Listing E/V Trawl interaction internationally
Australian trawl interaction
Potential interaction with large mid-water trawl vessel
References
Balaenoptera borealis
Sei Whale Cetacean; Migratory (Bonn); Threatened
V Potentially in Northeast U.S mid-water trawl (including pair trawl)
Identified as Level 2 PSA Residual Risk Medium in the SPF
Entanglement in discarded net pieces, collision
(AFMA, 2010; Zollett, 2009b)
Balaenoptera musculus
Blue Whale Cetacean; Migratory (Bonn); Threatened
E Potentially in Northeast U.S mid-water trawl (including pair trawl)
Identified as Level 2 PSA Residual Risk Medium in the SPF
Entanglement in discarded net pieces, collision
(AFMA, 2010; Zollett, 2009b)
Balaenoptera physalus
Fin Whale Cetacean; Migratory (Bonn); Threatened
V Potentially in Northeast U.S mid-water trawl (including pair trawl)
Alaska pollock trawl (mid-water)
Identified as Level 2 PSA Residual Risk Medium in the SPF
Entanglement in discarded net pieces, collision
(AFMA, 2010; Zollett, 2009b)
Table 2.
Eubalaena australis Southern Right Whale
Cetacean; Migratory (Bonn); Threatened
E Identified as Level 2 PSA Residual Risk Medium in the SPF
Entanglement in discarded net pieces, collision
(AFMA, 2010; Zollett, 2009b)
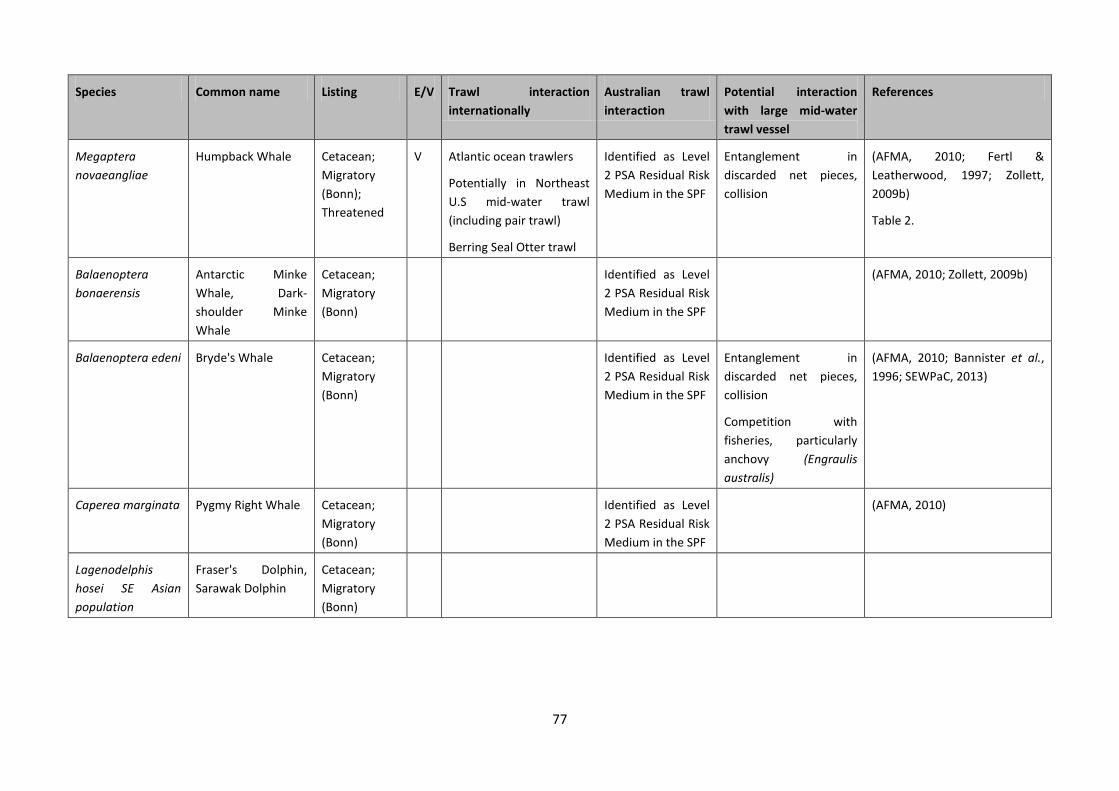
77
Species Common name Listing E/V Trawl interaction internationally
Australian trawl interaction
Potential interaction with large mid-water trawl vessel
References
Megaptera novaeangliae
Humpback Whale Cetacean; Migratory (Bonn); Threatened
V Atlantic ocean trawlers
Potentially in Northeast U.S mid-water trawl (including pair trawl)
Berring Seal Otter trawl
Identified as Level 2 PSA Residual Risk Medium in the SPF
Entanglement in discarded net pieces, collision
(AFMA, 2010; Fertl & Leatherwood, 1997; Zollett, 2009b)
Table 2.
Balaenoptera bonaerensis
Antarctic Minke Whale, Dark-shoulder Minke Whale
Cetacean; Migratory (Bonn)
Identified as Level 2 PSA Residual Risk Medium in the SPF
(AFMA, 2010; Zollett, 2009b)
Balaenoptera edeni Bryde's Whale Cetacean; Migratory (Bonn)
Identified as Level 2 PSA Residual Risk Medium in the SPF
Entanglement in discarded net pieces, collision
Competition with fisheries, particularly anchovy (Engraulis australis)
(AFMA, 2010; Bannister et al., 1996; SEWPaC, 2013)
Caperea marginata Pygmy Right Whale Cetacean; Migratory (Bonn)
Identified as Level 2 PSA Residual Risk Medium in the SPF
(AFMA, 2010)
Lagenodelphis hosei SE Asian population
Fraser's Dolphin, Sarawak Dolphin
Cetacean; Migratory (Bonn)

78
Species Common name Listing E/V Trawl interaction internationally
Australian trawl interaction
Potential interaction with large mid-water trawl vessel
References
Lagenorhynchus obscurus
Dusky Dolphin Cetacean; Migratory (Bonn)
Argentinian trawl fishery
South and southwest Africa trawl interactions
NZ interactions
Identified as Level 2 PSA Residual Risk Low in the SPF
High potential:
Common coastal and offshore dolphin, feeds on pelagic fish
(AFMA, 2010; Crespo et al., 1997; Dans et al., 2003a; Dans et al., 2003b; Fertl & Leatherwood, 1997)
Orcaella heinsohni Australian Snubfin Dolphin
Cetacean; Migratory (Bonn)
Orcinus orca Killer Whale, Orca Cetacean; Migratory (Bonn)
Observed from Dutch pelagic trawlers off Ireland (NE Atlantic).
Berring Sea mid-water Pollock trawl and otter trawl.
NZ interactions
Bering Sea and Aleutian Island trawl fishery
Gulf of Alaska and Alaska
Identified as Level 2 PSA Residual Risk Medium in the SPF
High potential:
Overlap spatially and commonly interact in trawl fisheries internationally
Most frequently observed scavenger but not recorded in bycatch.
(AFMA, 2010; Couperus, 1997; Dalla Rosa & Secchi, 2007; Fertl & Leatherwood, 1997)
Table 2.
Phocoena dioptrica Spectacled Porpoise Cetacean; Migratory (Bonn)
Physeter macrocephalus
Sperm Whale Cetacean; Migratory (Bonn)
Incidentally caught in nets in the Mediterranean
Identified as Level 2 PSA Residual Risk Medium in the SPF
Low-mod potential:
Overlap spatially, uncommonly interact in trawl fisheries internationally
(AFMA, 2010; Fertl & Leatherwood, 1997)

79
Species Common name Listing E/V Trawl interaction internationally
Australian trawl interaction
Potential interaction with large mid-water trawl vessel
References
Sousa chinensis Indo-Pacific Humpback Dolphin
Cetacean; Migratory (Bonn)
Incidentally caught in nets in Malaysia
Follow trawl boats, feeds in mixed groups with bottlenose dolphins in Moreton Bay, QLD
Identified as Level 2 PSA Residual Risk Medium in the SPF
Low potential: prefers shallow water habitat
(AFMA, 2010; SEWPaC, 2013; Fertl & Leatherwood, 1997; Jaaman et al., 2009)
Stenella attenuata
E Tropical Pacific, SE Asian populations
Spotted Dolphin, Pantropical Spotted Dolphin
Cetacean; Migratory (Bonn)
Incidentally caught in nets in Malaysia
(Atlantic spotted dolphin caught in U.S. NE bottom trawl)
Identified as Level 2 PSA Residual Risk Medium in the SPF
Potential to interact in pelagic gillnet fishery in Australia and fish off continental shelf and slope on pelagic fish
(AFMA, 2010; SEWPaC, 2013; Jaaman et al., 2009)
Table 2.
Stenella longirostris
E Tropical Pacific, SE Asian populations
Long-snouted Spinner Dolphin
Cetacean; Migratory (Bonn)
Identified as Level 2 PSA Residual Risk Medium in the SPF
(AFMA, 2010)
Tursiops aduncus (Arafura/Timor Sea populations)
Spotted Bottlenose Dolphin
Cetacean; Migratory (Bonn)
Berardius arnuxii Arnoux's Beaked Whale
Cetacean Identified as Level 2 PSA Residual Risk Medium in the SPF
(AFMA, 2010)
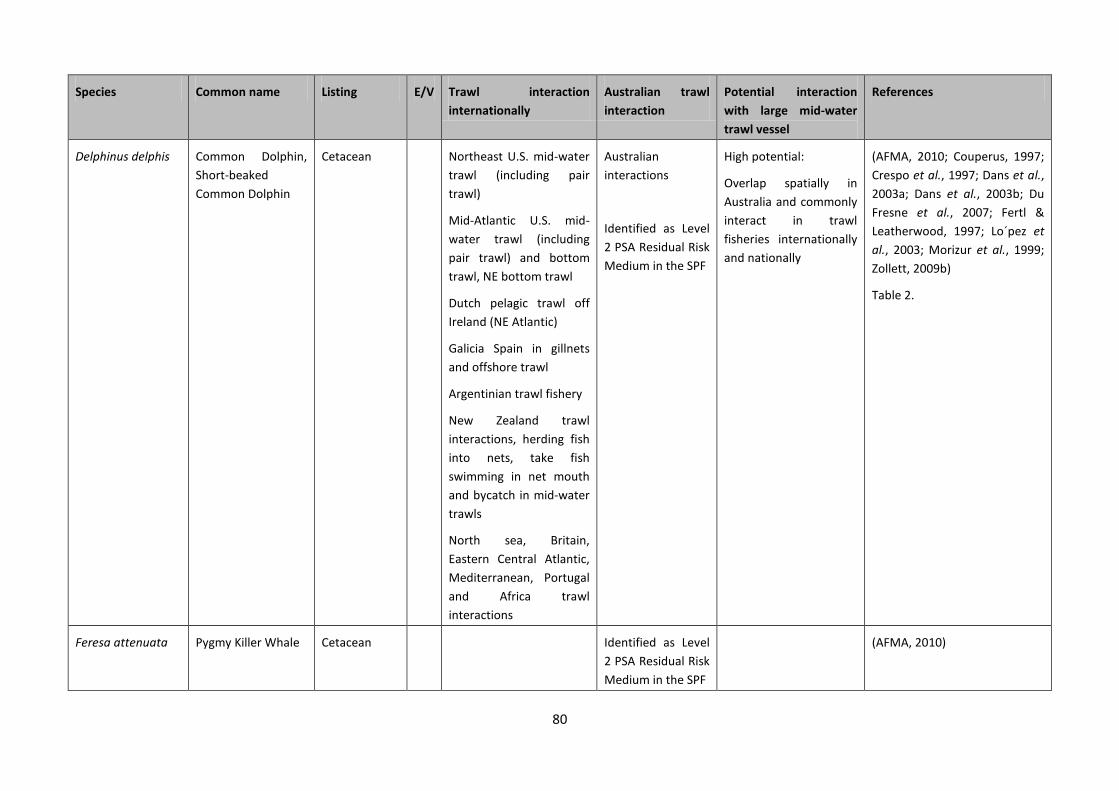
80
Species Common name Listing E/V Trawl interaction internationally
Australian trawl interaction
Potential interaction with large mid-water trawl vessel
References
Delphinus delphis Common Dolphin, Short-beaked Common Dolphin
Cetacean Northeast U.S. mid-water trawl (including pair trawl)
Mid-Atlantic U.S. mid-water trawl (including pair trawl) and bottom trawl, NE bottom trawl
Dutch pelagic trawl off Ireland (NE Atlantic)
Galicia Spain in gillnets and offshore trawl
Argentinian trawl fishery
New Zealand trawl interactions, herding fish into nets, take fish swimming in net mouth and bycatch in mid-water trawls
North sea, Britain, Eastern Central Atlantic, Mediterranean, Portugal and Africa trawl interactions
Australian interactions
Identified as Level 2 PSA Residual Risk Medium in the SPF
High potential:
Overlap spatially in Australia and commonly interact in trawl fisheries internationally and nationally
(AFMA, 2010; Couperus, 1997; Crespo et al., 1997; Dans et al., 2003a; Dans et al., 2003b; Du Fresne et al., 2007; Fertl & Leatherwood, 1997; Lo´pez et al., 2003; Morizur et al., 1999; Zollett, 2009b)
Table 2.
Feresa attenuata Pygmy Killer Whale Cetacean Identified as Level 2 PSA Residual Risk Medium in the SPF
(AFMA, 2010)

81
Species Common name Listing E/V Trawl interaction internationally
Australian trawl interaction
Potential interaction with large mid-water trawl vessel
References
Globicephala macrorhynchus
Short-finned Pilot Whale
Cetacean Mid-Atlantic U.S. mid-water trawl (including pair trawl) and bottom trawl, NE bottom trawl
Mauritania and NE Africa pelagic freezer-factory trawlers
Identified as Level 2 PSA Residual Risk Medium in the SPF
Uncertain but possible (AFMA, 2010; Fertl & Leatherwood, 1997; Zeeberg et al., 2006)
Table 2.
Globicephala melas Long-finned Pilot Whale
Cetacean Dutch pelagic trawl off Ireland (NE Atlantic).
Observed at rear of trawler during net haul in NE U.S. and SW Ireland.
Mid-Atlantic U.S. mid-water trawl (including pair trawl) and bottom trawl, NE bottom trawl
Galicia Spain in gillnets and offshore trawl
Gulf of Mexico
Identified as Level 2 PSA Residual Risk Medium in the SPF
Uncertain but possible (AFMA, 2010; Couperus, 1997; Fertl & Leatherwood, 1997; Lo´pez et al., 2003)
Table 2.

82
Species Common name Listing E/V Trawl interaction internationally
Australian trawl interaction
Potential interaction with large mid-water trawl vessel
References
Globicephala spp Unident pilot whale Cetacean Northeast U.S. mid-water trawl (including pair trawl)
Mid-Atlantic U.S. mid-water trawl (including pair trawl)
New Zealand, Argentina, Britain, Bay of Biscay, Central Cantabrian Sea
Moderate potential:
Overlap spatially and interact in trawl fisheries internationally, difficult to identify species
(Fertl & Leatherwood, 1997; Zollett, 2009b)
Grampus griseus Risso's Dolphin, Grampus
Cetacean Northeast mid-water trawl (including pair trawl)
Mid-Atlantic U.S. mid-water trawl (including pair trawl)
Identified as Level 2 PSA Residual Risk High in the SPF
Moderate potential: common pelagic dolphin, possible on East Coast
Prefer warmer waters and interact with trawl fisheries internationally
(AFMA, 2010; Zollett, 2009b)
Hyperoodon planifrons
Southern Bottlenose Whale
Cetacean Identified as Level 2 PSA Residual Risk Medium in the SPF
(AFMA, 2010)
Indopacetus pacificus
Longman's Beaked Whale
Cetacean
Kogia breviceps Pygmy Sperm Whale
Cetacean Identified as Level 2 PSA Residual Risk Medium in the SPF
(AFMA, 2010)

83
Species Common name Listing E/V Trawl interaction internationally
Australian trawl interaction
Potential interaction with large mid-water trawl vessel
References
Kogia simus Dwarf Sperm Whale Cetacean Identified as Level 2 PSA Residual Risk Medium in the SPF
(AFMA, 2010)
Lagenodelphis hosei
Fraser's Dolphin, Sarawak Dolphin
Cetacean Identified as Level 2 PSA Residual Risk High in the SPF
Low potential: minimal range overlap with SPF
(AFMA, 2010)
Lagenorhynchus cruciger
Hourglass Dolphin Cetacean Identified as Level 2 PSA Residual Risk High in the SPF
Uncertain
Likely range overlap only south of Tasmania
(AFMA, 2010)
Lissodelphis peronii Southern Right Whale Dolphin
Cetacean Identified as Level 2 PSA Residual Risk High in the SPF
High potential: entire range overlaps with SPF but species not identified in trawl bycatch in this review
(AFMA, 2010)
Mesoplodon bowdoini
Andrew's Beaked Whale
Cetacean Identified as Level 2 PSA Residual Risk Medium in the SPF
(AFMA, 2010)
Mesoplodon densirostris
Blainville's Beaked Whale, Dense-beaked Whale
Cetacean Identified as Level 2 PSA Residual Risk Medium in the SPF
(AFMA, 2010)
Mesoplodon ginkgodens
Gingko-toothed Beaked Whale, Gingko-toothed Whale, Gingko Beaked Whale
Cetacean Identified as Level 2 PSA Residual Risk Medium in the SPF
(AFMA, 2010)
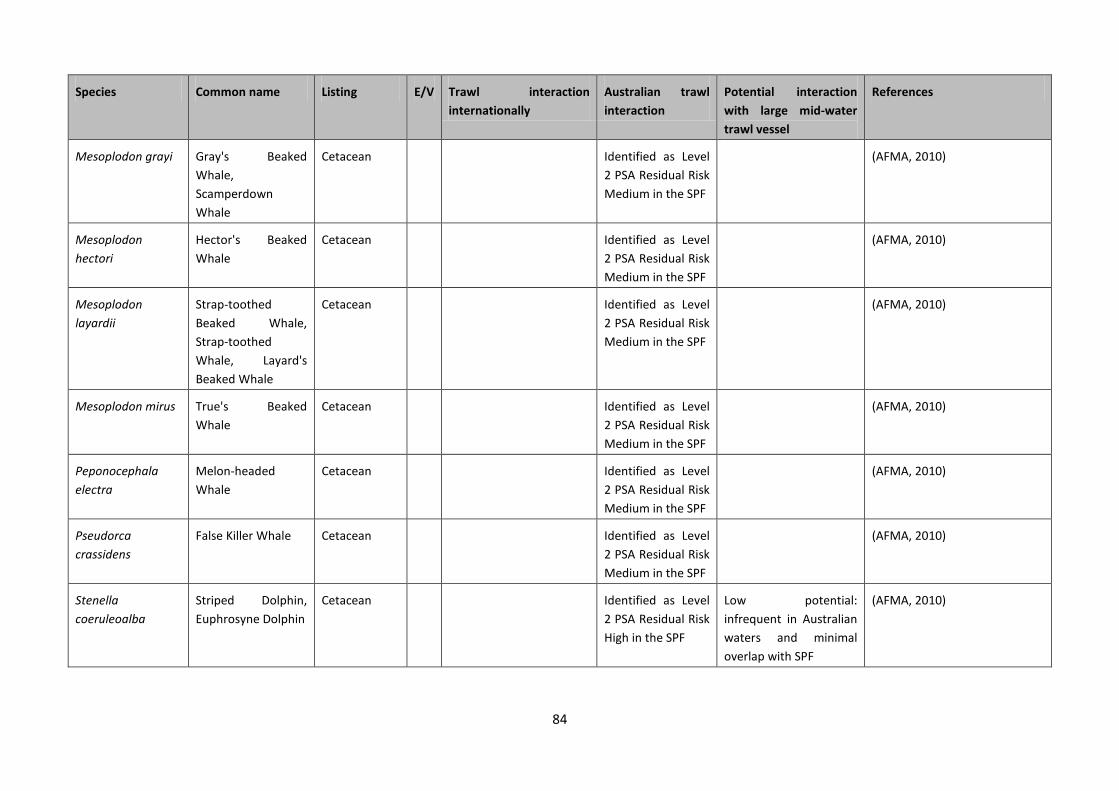
84
Species Common name Listing E/V Trawl interaction internationally
Australian trawl interaction
Potential interaction with large mid-water trawl vessel
References
Mesoplodon grayi Gray's Beaked Whale, Scamperdown Whale
Cetacean Identified as Level 2 PSA Residual Risk Medium in the SPF
(AFMA, 2010)
Mesoplodon hectori
Hector's Beaked Whale
Cetacean Identified as Level 2 PSA Residual Risk Medium in the SPF
(AFMA, 2010)
Mesoplodon layardii
Strap-toothed Beaked Whale, Strap-toothed Whale, Layard's Beaked Whale
Cetacean Identified as Level 2 PSA Residual Risk Medium in the SPF
(AFMA, 2010)
Mesoplodon mirus True's Beaked Whale
Cetacean Identified as Level 2 PSA Residual Risk Medium in the SPF
(AFMA, 2010)
Peponocephala electra
Melon-headed Whale
Cetacean Identified as Level 2 PSA Residual Risk Medium in the SPF
(AFMA, 2010)
Pseudorca crassidens
False Killer Whale Cetacean Identified as Level 2 PSA Residual Risk Medium in the SPF
(AFMA, 2010)
Stenella coeruleoalba
Striped Dolphin, Euphrosyne Dolphin
Cetacean Identified as Level 2 PSA Residual Risk High in the SPF
Low potential: infrequent in Australian waters and minimal overlap with SPF
(AFMA, 2010)

85
Species Common name Listing E/V Trawl interaction internationally
Australian trawl interaction
Potential interaction with large mid-water trawl vessel
References
Steno bredanensis Rough-toothed Dolphin
Cetacean Identified as Level 2 PSA Residual Risk Medium in the SPF
(AFMA, 2010)
Tasmacetus shepherdi
Shepherd's Beaked Whale, Tasman Beaked Whale
Cetacean Identified as Level 2 PSA Residual Risk Medium in the SPF
(AFMA, 2010)
Tursiops aduncus Indian Ocean Bottlenose Dolphin, Spotted Bottlenose Dolphin
Cetacean Incidentally caught in nets in Malaysia
In Moreton Bay QLD feed in association with benthic trawlers
Identified as Level 2 PSA Residual Risk High in the SPF
Low potential: prefers shallow water habitat
(AFMA, 2010; Chilvers & Corkeron, 2001; SEWPaC, 2013; Jaaman et al., 2009)

86
Species Common name Listing E/V Trawl interaction internationally
Australian trawl interaction
Potential interaction with large mid-water trawl vessel
References
Tursiops truncatus s. str.
Bottlenose Dolphin Cetacean Globally interacts with trawl fisheries
Northeast mid-water trawl (including pair trawl), NE bottom trawl
Mid-Atlantic U.S. mid-water trawl (including pair trawl) and bottom trawl
SE Atlantic U.S. Shrimp trawl
Gulf of Mexico U.S. Butterfish trawl
Dutch pelagic trawl off Ireland (NE Atlantic)
Incidentally caught in nets in Malaysia
Galicia Spain in gillnets and offshore trawl
NZ trawl interactions
In Moreton Bay QLD feed on discarded bycatch, feeding behind trawlers
NW Australia, demersal trawl gear, present inside and outside of nets
Bycatch in Pilbara Trawl Fishery, WA
Identified as Level 2 PSA Residual Risk High in the SPF
High potential:
Overlap spatially in Australia and commonly interact in trawl fisheries internationally and nationally
(Couperus, 1997; Fertl & Leatherwood, 1997; Jaaman et al., 2009; Jaiteh et al., 2012; Morizur et al., 1999; Zollett, 2009b) (AFMA, 2010; Lo´pez et al., 2003, Stephenson et al. 2008)
Table 2.
Ziphius cavirostris Cuvier's Beaked Whale, Goose-beaked Whale
Cetacean Identified as Level 2 PSA Residual Risk Medium in the SPF
(AFMA, 2010)

87
Table 2.2. International trawl fisheries with documented cetacean interactions.
Region Fishery Species Data source Year Data Quality
Gear / other information
Statistics References
Norway Sea
Pelagic trawls 17 Fin whales
6 Atlantic white-sided dolphins
5 Killer whales
Observer 1993-1996 High 184 behavioural events (no mortality or injury), occurring every 8.3 min on average
fin whales seen at night, 300m from vessel
(Nottestad et al., 2002)
Hong Kong Pair trawlers Pacific humpback dolphins
Uncertain Low in (Chilvers & Corkeron, 2001)
Malaysia
Sabah region
Inshore trawl Cetacean
Irrawaddy dolphin, bottlenose dolphin, spinner dolphin, pantropical
spotted dolphin, Indo-Pacific humpback dolphin and finless porpoise
Vessel reporting (crew interviews)
1997-2004 Low annual cetacean catch/1,000 trips = 0.04; number of trawl vessels = 13 and number of vessels reporting bycatch = 4; vessels in the fleet = 1,422
(Jaaman et al., 2009).
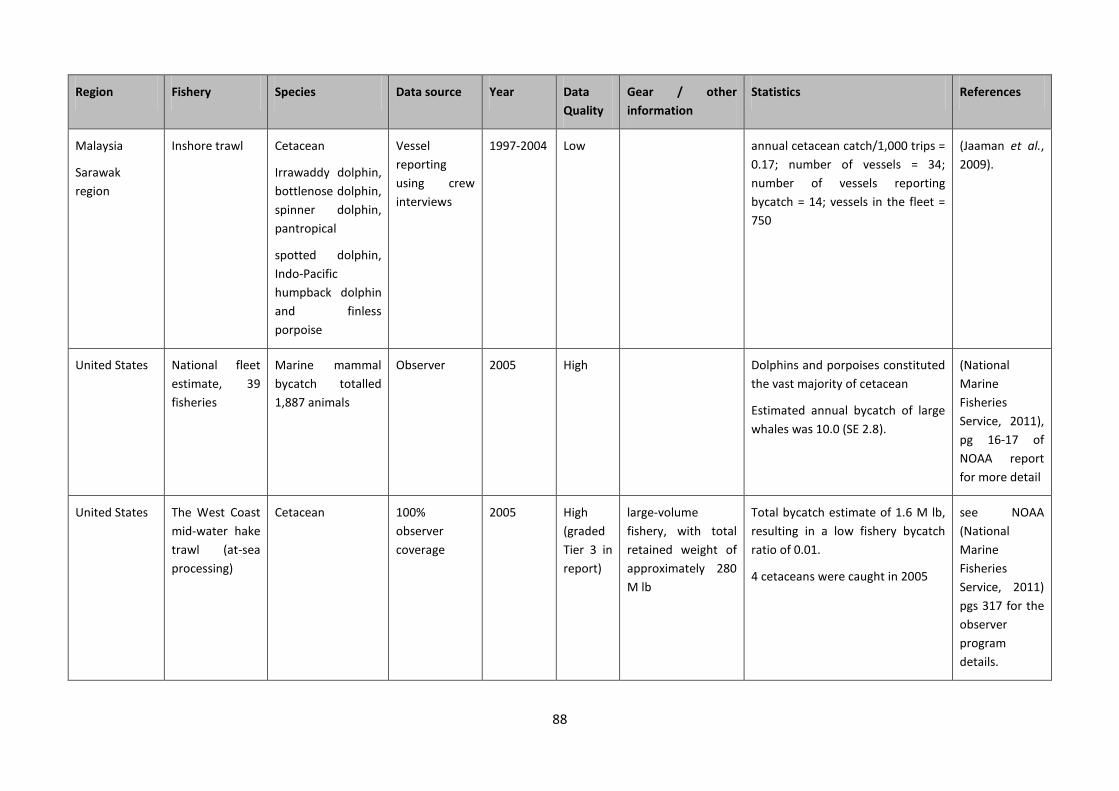
88
Region Fishery Species Data source Year Data Quality
Gear / other information
Statistics References
Malaysia
Sarawak region
Inshore trawl Cetacean
Irrawaddy dolphin, bottlenose dolphin, spinner dolphin, pantropical
spotted dolphin, Indo-Pacific humpback dolphin and finless porpoise
Vessel reporting using crew interviews
1997-2004 Low annual cetacean catch/1,000 trips = 0.17; number of vessels = 34; number of vessels reporting bycatch = 14; vessels in the fleet = 750
(Jaaman et al., 2009).
United States
National fleet estimate, 39 fisheries
Marine mammal bycatch totalled 1,887 animals
Observer 2005 High Dolphins and porpoises constituted the vast majority of cetacean
Estimated annual bycatch of large whales was 10.0 (SE 2.8).
(National Marine Fisheries Service, 2011), pg 16-17 of NOAA report for more detail
United States
The West Coast mid-water hake trawl (at-sea processing)
Cetacean
100% observer coverage
2005 High (graded Tier 3 in report)
large-volume fishery, with total retained weight of approximately 280 M lb
Total bycatch estimate of 1.6 M lb, resulting in a low fishery bycatch ratio of 0.01.
4 cetaceans were caught in 2005
see NOAA (National Marine Fisheries Service, 2011) pgs 317 for the observer program details.

89
Region Fishery Species Data source Year Data Quality
Gear / other information
Statistics References
United States
The Mid-Atlantic mid water trawl and
Marine mammals Observer 2005 High annual average of 91 marine mammals
(National Marine Fisheries Service, 2011)
United States
The Mid-Atlantic mid-water otter trawl
Marine mammals
(inc 118 Western North Atlantic short beaked common dolphins)
Observer 2005 High Annual average 182 marine mammals
(National Marine Fisheries Service, 2011)
United States
Alaska, Kodiak trawl fishery
Marine mammals
Observer 2005 High Annual average of 35.8 marine mammals
(National Marine Fisheries Service, 2011). See pages 421-426
United States
Alaska, BSAI Pollock pelagic trawl
Marine mammals
Observer 2005 High Annual average of 5.46 marine mammals
(National Marine Fisheries Service, 2011). See pages 421-426

90
Region Fishery Species Data source Year Data Quality
Gear / other information
Statistics References
United States
Alaska, GOA Pollock pelagic trawl
Marine mammals
Observer 2005 High Annual average of 2.52 marine mammals
(National Marine Fisheries Service, 2011). See pages 421-426
United States
Foreign vessels fishing off the northwest U.S. coast
Marine mammals
Eight cetacean species and three unidentified baleen whales were caught
Common dolphins comprised 93% of catch
Observer coverage on foreign vessels was 25-35% during 1977-82. and increased to 58%, 86%, 95%. 98%, 100%, and 100%, respectively, in 1983-88
1977–1988
High Influential biological factors: target species of the fishery, prevalence of marine mammals in the fishing area and time of day.
Influential operational considerations include: tow duration, level of tow in water column, size of net opening, haul-back speed and gear design.
68% dolphins caught along shelf edge
538 marine mammals
mean±SD marine mammal catch rate for all fisheries combined = 0.059±0.019 (1 per 17.0 tows) or 0.0124±0.0121 (1 per 80.6 h of towing).
The mean±SD dolphin catch rate for all fisheries combined was 0.048±0.013 per tow (one dolphin per 20.7 tows), or 0.0185±0.0019 per hour of towing (one dolphin per 98 h of towing)
95% confidence intervals, calculated on untransformed data, for all fisheries combined were 0.4±1.6 dolphins per 100 h of towing
(Waring et al., 1990)
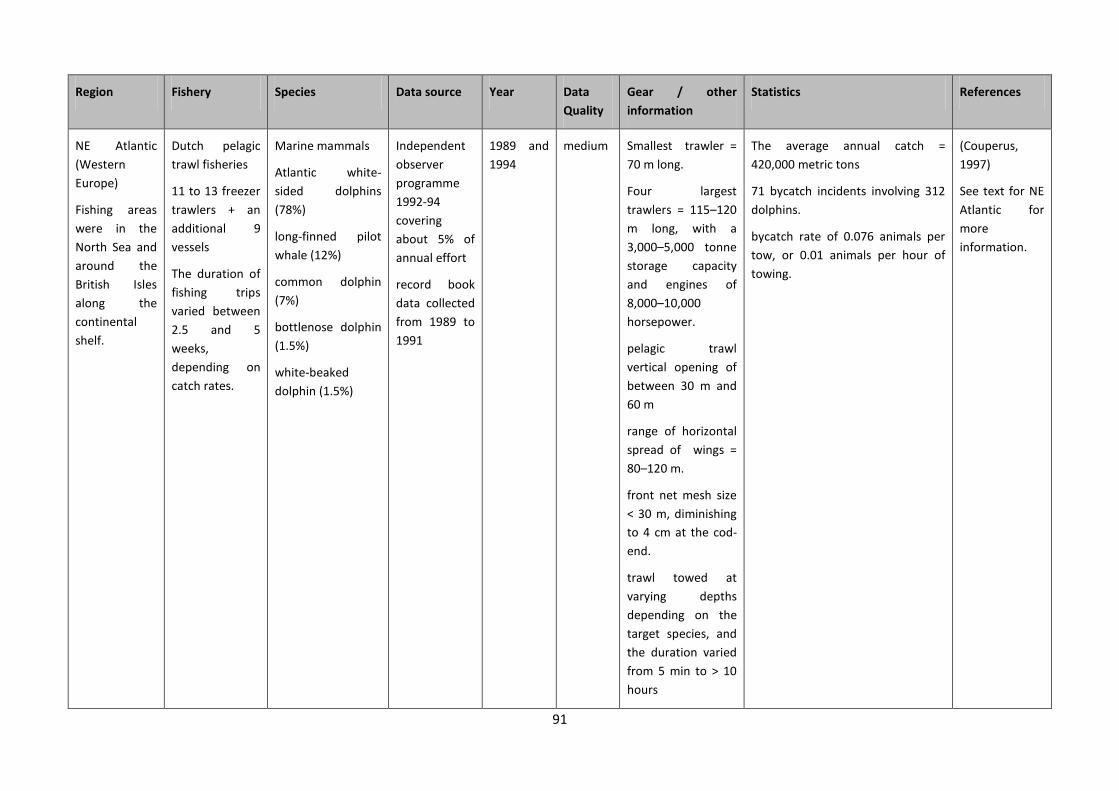
91
Region Fishery Species Data source Year Data Quality
Gear / other information
Statistics References
NE Atlantic (Western Europe)
Fishing areas were in the North Sea and around the British Isles along the continental shelf.
Dutch pelagic trawl fisheries
11 to 13 freezer trawlers + an additional 9 vessels
The duration of fishing trips varied between 2.5 and 5 weeks, depending on catch rates.
Marine mammals
Atlantic white-sided dolphins (78%)
long-finned pilot whale (12%)
common dolphin (7%)
bottlenose dolphin (1.5%)
white-beaked dolphin (1.5%)
Independent observer programme 1992-94 covering about 5% of annual effort
record book data collected from 1989 to 1991
1989 and 1994
medium Smallest trawler = 70 m long.
Four largest trawlers = 115–120 m long, with a 3,000–5,000 tonne storage capacity and engines of 8,000–10,000 horsepower.
pelagic trawl vertical opening of between 30 m and 60 m
range of horizontal spread of wings = 80–120 m.
front net mesh size < 30 m, diminishing to 4 cm at the cod-end.
trawl towed at varying depths depending on the target species, and the duration varied from 5 min to > 10 hours
The average annual catch = 420,000 metric tons
71 bycatch incidents involving 312 dolphins.
bycatch rate of 0.076 animals per tow, or 0.01 animals per hour of towing.
(Couperus, 1997)
See text for NE Atlantic for more information.
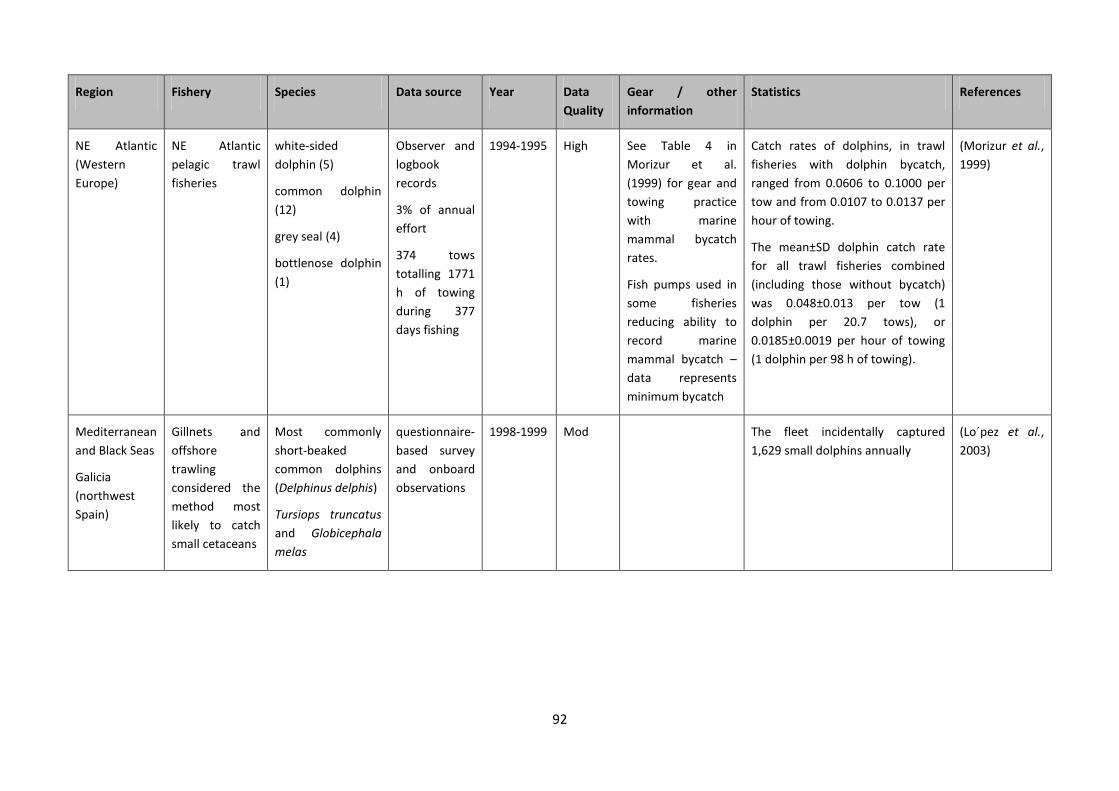
92
Region Fishery Species Data source Year Data Quality
Gear / other information
Statistics References
NE Atlantic (Western Europe)
NE Atlantic pelagic trawl fisheries
white-sided dolphin (5)
common dolphin (12)
grey seal (4)
bottlenose dolphin (1)
Observer and logbook records
3% of annual effort
374 tows totalling 1771 h of towing during 377 days fishing
1994-1995
High See Table 4 in Morizur et al. (1999) for gear and towing practice with marine mammal bycatch rates.
Fish pumps used in some fisheries reducing ability to record marine mammal bycatch – data represents minimum bycatch
Catch rates of dolphins, in trawl fisheries with dolphin bycatch, ranged from 0.0606 to 0.1000 per tow and from 0.0107 to 0.0137 per hour of towing.
The mean±SD dolphin catch rate for all trawl fisheries combined (including those without bycatch) was 0.048±0.013 per tow (1 dolphin per 20.7 tows), or 0.0185±0.0019 per hour of towing (1 dolphin per 98 h of towing).
(Morizur et al., 1999)
Mediterranean and Black Seas
Galicia (northwest Spain)
Gillnets and offshore trawling considered the method most likely to catch small cetaceans
Most commonly short-beaked common dolphins (Delphinus delphis)
Tursiops truncatus and Globicephala melas
questionnaire-based survey and onboard observations
1998-1999 Mod The fleet incidentally captured 1,629 small dolphins annually
(Lo´pez et al., 2003)

93
Region Fishery Species Data source Year Data Quality
Gear / other information
Statistics References
Mediterranean and Black Seas
Galicia (northwest Spain)
Pairtrawling considered the method most likely to catch small cetaceans
Short-beaked common dolphins (Delphinus delphis)
On-board observations
2001 and 2002
High Hauling time, fishing depth, and season of the year were identified as the key factors involved in the incidental capture.
The annual bycatch in 2001 and 2002 was an estimated 394 dolphins [95% confidence interval (CI) 230–632].
(Fernández-Contreras et al., 2010)
See text for Medit. and Black Seas for more info.
Western Africa
Mauritania and NW Africa
11 pelagic fisheries with 5–10 European (Dutch and Irish) pelagic factory trawlers
Cetaceans make up 8% of the megafauna bycatch
shortbeaked common dolphins, bottlenose dolphins, and white-sided dolphins, short-finned pilot whales
over 1,400 trawl sets observed representing 4–88% of the fishing effort in a month
October 2001 and May 2005
High net openings of 90×50m
9,000 and 18,000 hp
tunnel “excluder” device used: resulted in 8% cetaceans retained with 0% released alive
Trawlers in spring incidentally capture pods of 10–20 pilot whales or groups of 5–30 dolphins
70–720 dolphins, mostly common dolphins
(Zeeberg et al., 2006).
See text for Western Africa for more info.

94
Region Fishery Species Data source Year Data Quality
Gear / other information
Statistics References
Latin America (South-western Atlantic Ocean, Southern South America, Eastern South Pacific)
Patagonia
Argentinian national fishing fleet
208 vessels (75% trawlers; 16% jiggins; 9% longliners)
includes Mid-water factory trawls for Argentine red shrimp (forbidden in 1994)
Bycatch = several small cetaceans, such as dusky, Commerson's, and common dolphins
Interview of fishers, records and observers
1992-1995 Mod Shrimp trawls showed the highest dolphin bycatch per unit effort Most bycatch ocurred at night
Net mouth of 20 m high and 40 m wide (shrimp boats)
annual mortality rates = 70–200 dusky dolphins (70% females) and 25–170 Commerson's dolphins
In 1994 shrimp trawl vessels captured: Dusky dolphins = 0.148 CPUE and annual catch of 54.2 individs; Commerson’s dolphins = 0.0302 CPUE and an annual catch of 11.1 individs
(Crespo et al., 1997; Dans et al., 2003b).
See text for Latin America for more info.

95
Region Fishery Species Data source Year Data Quality
Gear / other information
Statistics References
Latin America (South-western Atlantic Ocean, Southern South America, Eastern South Pacific)
Patagonia
Nocturnal mid-water trawling for shrimp by two-beam factory vessels
Mid-water factory trawlers caught a large percentage of the dolphins despite the lower annual effort compared to the remainder of the trawl fleet.
Commerson’s dolphin and dusky dolphins
Interview of fishers, records and observers
1992-94 Mod Nets were 20 m high and 40 m wide
Average catch rate for Commerson’s dolphin was 0.030, with 11 individuals captured by mid-water factory trawlers out of 27 total caught by the trawl fleet (41%). This occurred over 366 days annual effort, which was only 3.4% of the total trawl fleet fishing effort for the year.78% of these dolphins were female. Average catch rate for the dusky dolphins in the mid-water factory trawlers was 0.148, with 54 individuals out of 69 total caught for the whole trawl fleet (78%). The total annual effort (days) for the mid-water factory trawler was 366 days, only 1.3 % of the total fleet’s annual effort. 70% of the dolphins were female and half of these were pregnant
(Crespo et al., 1997; Dans et al., 2003b).
See text for Latin America for more info.

96
Region Fishery Species Data source Year Data Quality
Gear / other information
Statistics References
Latin America (South-western Atlantic Ocean, Southern South America, Eastern South Pacific)
Patagonia
Nocturnal mid-water trawling for anchovies by factory vessels
Factory trawlers caught a large percentage of the dolphins despite the lower annual effort compared to the remainder of the trawl fleet.
dolphins Interview of fishers, records and observers
1992-94 Mod Nets were 40 m high and 40 m wide, and
catch rates of dolphins reached 9 individuals per day, per vessel
(Dans et al., 2003b).
See text for Latin America for more info.
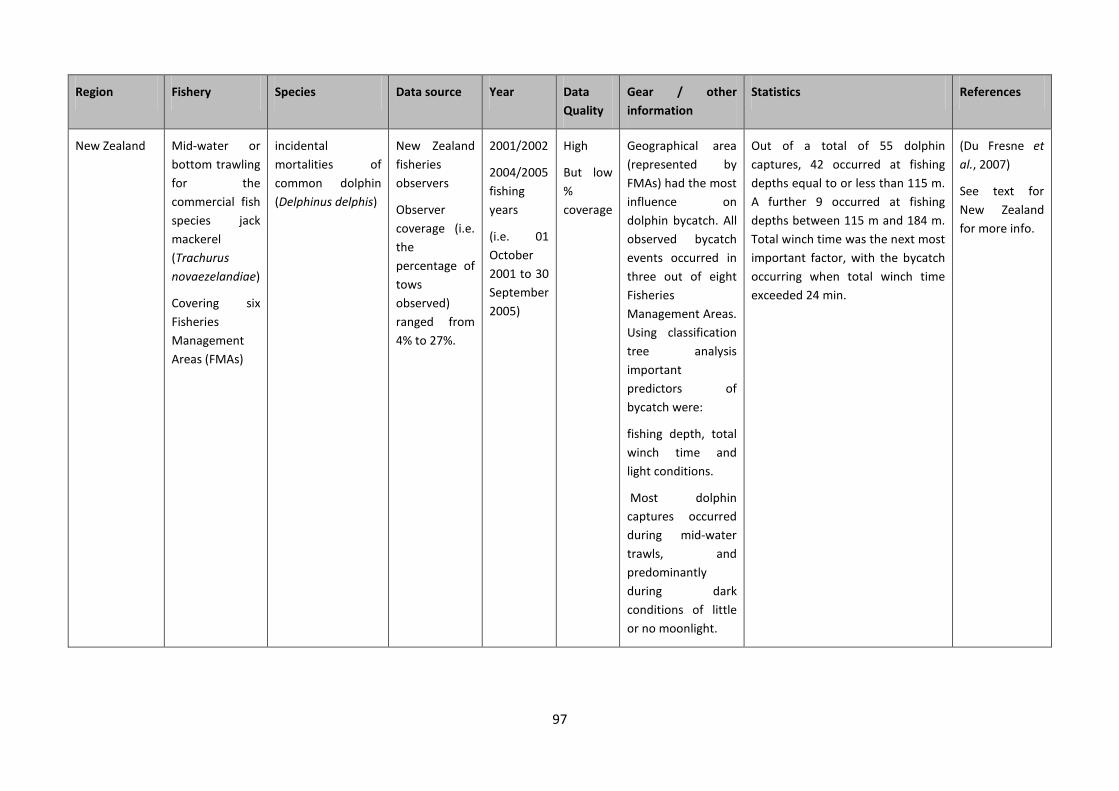
97
Region Fishery Species Data source Year Data Quality
Gear / other information
Statistics References
New Zealand Mid-water or bottom trawling for the commercial fish species jack mackerel (Trachurus novaezelandiae)
Covering six Fisheries Management Areas (FMAs)
incidental mortalities of common dolphin (Delphinus delphis)
New Zealand fisheries observers
Observer coverage (i.e. the percentage of tows observed) ranged from 4% to 27%.
2001/2002
2004/2005 fishing years
(i.e. 01 October 2001 to 30 September 2005)
High
But low % coverage
Geographical area (represented by FMAs) had the most influence on dolphin bycatch. All observed bycatch events occurred in three out of eight Fisheries Management Areas. Using classification tree analysis important predictors of bycatch were:
fishing depth, total winch time and light conditions.
Most dolphin captures occurred during mid-water trawls, and predominantly during dark conditions of little or no moonlight.
Out of a total of 55 dolphin captures, 42 occurred at fishing depths equal to or less than 115 m. A further 9 occurred at fishing depths between 115 m and 184 m. Total winch time was the next most important factor, with the bycatch occurring when total winch time exceeded 24 min.
(Du Fresne et al., 2007)
See text for New Zealand for more info.

98
Region Fishery Species Data source Year Data Quality
Gear / other information
Statistics References
New Zealand Mid-water or bottom trawling for the commercial fish species jack mackerel (Trachurus novaezelandiae)
incidental mortalities of common dolphin (Delphinus delphis)
New Zealand fisheries observers
2006–07 High
The probability of a capture event occurring during a trawl: Headline depth had the most explanatory power, most bycatch occurred shallower than 40 m, the model estimated that deepening the headline depth of a tow by 21 metres would have halved the probability of a dolphin capture event.
11 dolphins caught during observed tows.
0.8 capture events per 100 observed tows
(Thompson & Abraham, 2009)
See text for New Zealand for more info.
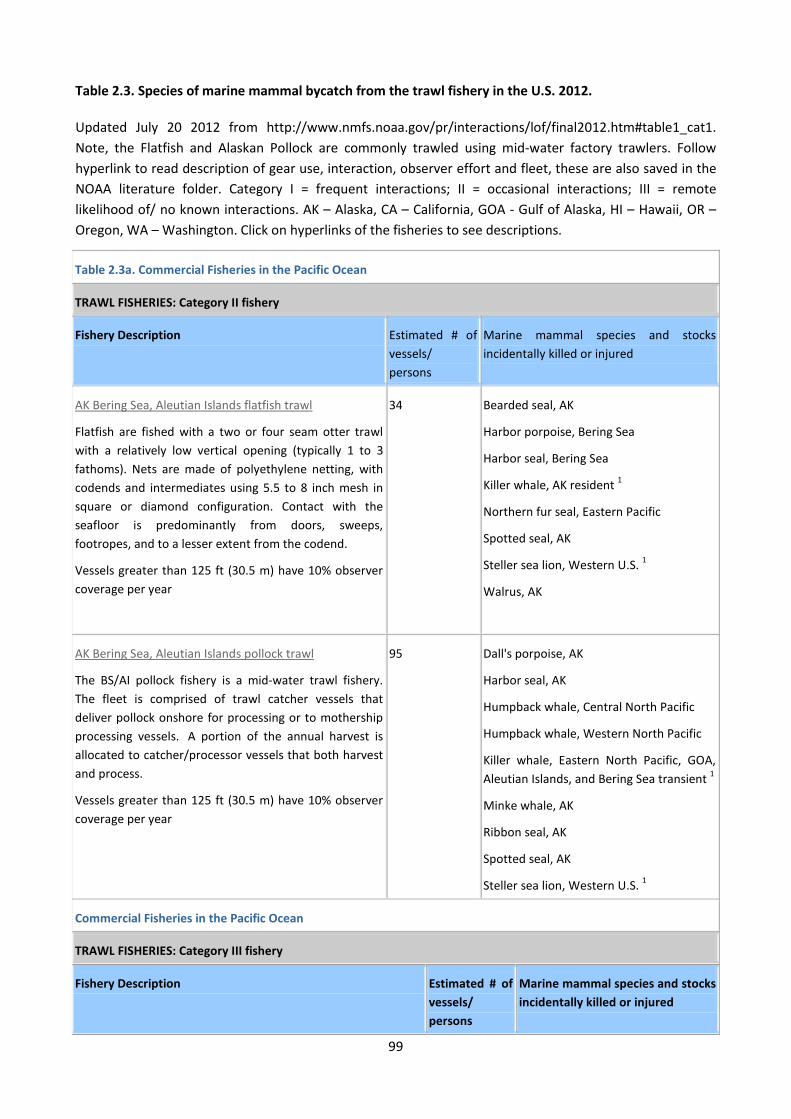
99
Table 2.3. Species of marine mammal bycatch from the trawl fishery in the U.S. 2012.
Updated July 20 2012 from http://www.nmfs.noaa.gov/pr/interactions/lof/final2012.htm#table1_cat1. Note, the Flatfish and Alaskan Pollock are commonly trawled using mid-water factory trawlers. Follow hyperlink to read description of gear use, interaction, observer effort and fleet, these are also saved in the NOAA literature folder. Category I = frequent interactions; II = occasional interactions; III = remote likelihood of/ no known interactions. AK – Alaska, CA – California, GOA - Gulf of Alaska, HI – Hawaii, OR – Oregon, WA – Washington. Click on hyperlinks of the fisheries to see descriptions.
Table 2.3a. Commercial Fisheries in the Pacific Ocean
TRAWL FISHERIES: Category II fishery
Fishery Description Estimated # of vessels/ persons
Marine mammal species and stocks incidentally killed or injured
AK Bering Sea, Aleutian Islands flatfish trawl
Flatfish are fished with a two or four seam otter trawl with a relatively low vertical opening (typically 1 to 3 fathoms). Nets are made of polyethylene netting, with codends and intermediates using 5.5 to 8 inch mesh in square or diamond configuration. Contact with the seafloor is predominantly from doors, sweeps, footropes, and to a lesser extent from the codend.
Vessels greater than 125 ft (30.5 m) have 10% observer coverage per year
34 Bearded seal, AK
Harbor porpoise, Bering Sea
Harbor seal, Bering Sea
Killer whale, AK resident 1
Northern fur seal, Eastern Pacific
Spotted seal, AK
Steller sea lion, Western U.S. 1
Walrus, AK
AK Bering Sea, Aleutian Islands pollock trawl
The BS/AI pollock fishery is a mid-water trawl fishery. The fleet is comprised of trawl catcher vessels that deliver pollock onshore for processing or to mothership processing vessels. A portion of the annual harvest is allocated to catcher/processor vessels that both harvest and process.
Vessels greater than 125 ft (30.5 m) have 10% observer coverage per year
95 Dall's porpoise, AK
Harbor seal, AK
Humpback whale, Central North Pacific
Humpback whale, Western North Pacific
Killer whale, Eastern North Pacific, GOA, Aleutian Islands, and Bering Sea transient 1
Minke whale, AK
Ribbon seal, AK
Spotted seal, AK
Steller sea lion, Western U.S. 1
Commercial Fisheries in the Pacific Ocean
TRAWL FISHERIES: Category III fishery
Fishery Description Estimated # of vessels/ persons
Marine mammal species and stocks incidentally killed or injured

100
AK Bering Sea, Aleutian Islands Atka mackerel trawl 9 Steller sea lion, Western U.S.
AK Bering Sea, Aleutian Islands Pacific cod trawl 93 Harbor seal, Bering Sea
Steller sea lion, Western U.S.
AK Bering Sea, Aleutian Islands rockfish trawl 10 None documented
AK Gulf of Alaska flatfish trawl 41 None documented
AK Gulf of Alaska Pacific cod trawl 62 Steller sea lion, Western U.S.
AK Gulf of Alaska pollock trawl 62 Fin whale, Northeast Pacific
Northern elephant seal, North Pacific
Steller sea lion, Western U.S.
AK Gulf of Alaska rockfish trawl 34 None documented
AK food/ bait herring trawl 4 None documented
AK miscellaneous finfish otter / beam trawl 317 None documented
AK shrimp otter trawl and beam trawl (statewide and Cook Inlet)
32 None documented
AK State-managed waters of Cook Inlet, Kachemak Bay, Prince William Sound, Southeast AK groundfish trawl
2 None documented
CA halibut bottom trawl 53 None documented
WA/ OR/ CA shrimp trawl 300 None documented
WA/ OR/ CA groundfish trawl 160-180 California sea lion, U.S.
Dall's porpoise, CA/OR/WA
Harbor seal, OR/ WA coast
Northern fur seal, Eastern Pacific
Pacific white-sided dolphin, CA/OR/WA
Steller sea lion, Eastern U.S.
Table 2.3b. Commercial Fisheries in the Atlantic Ocean, Gulf of Mexico, and Caribbean
TRAWL FISHERIES: Category II fishery
Fishery Description Estimated # of vessels/ persons
Marine mammal species and stocks incidentally killed or injured
Mid-Atlantic mid-water trawl(including pair trawl) 669 Bottlenose dolphin, WNA offshore

101
Table 2.3b. Commercial Fisheries in the Atlantic Ocean, Gulf of Mexico, and Caribbean
Common dolphin, WNA
Long-finned pilot whale, WNA
Risso's dolphin, WNA
Short-finned pilot whale, WNA
White-sided dolphin, WNA 1
Mid-Atlantic bottom trawl 1,388 Bottlenose dolphin, WNA offshore
Common dolphin, WNA 1
Harbor seal, WNA
Long-finned pilot whale, WNA 1
Risso's dolphin, WNA 1
Short-finned pilot whale, WNA 1
White-sided dolphin, WNA
Northeast mid-water trawl(including pair trawl)
887 Harbor seal, WNA
Long-finned pilot whale, WNA 1
Short-finned pilot whale, WNA 1
White-sided dolphin, WNA
Northeast bottom trawl 2,584 Bottlenose dolphin, WNA offshore
Common dolphin, WNA
Gray seal, WNA
Harbor porpoise, GME/ BF
Harbor seal, WNA
Harp seal, WNA
Long-finned pilot whale, WNA
Short-finned pilot whale, WNA
White-sided dolphin, WNA 1
Southeastern U.S. Atlantic, Gulf of Mexico shrimp trawl 4,950 Atlantic spotted dolphin, GMX continental and oceanic
Bottlenose dolphin, SC/ GA coastal 1
Bottlenose dolphin, Eastern GMX coastal 1
Bottlenose dolphin, GMX continental shelf
Bottlenose dolphin, Northern GMX coastal
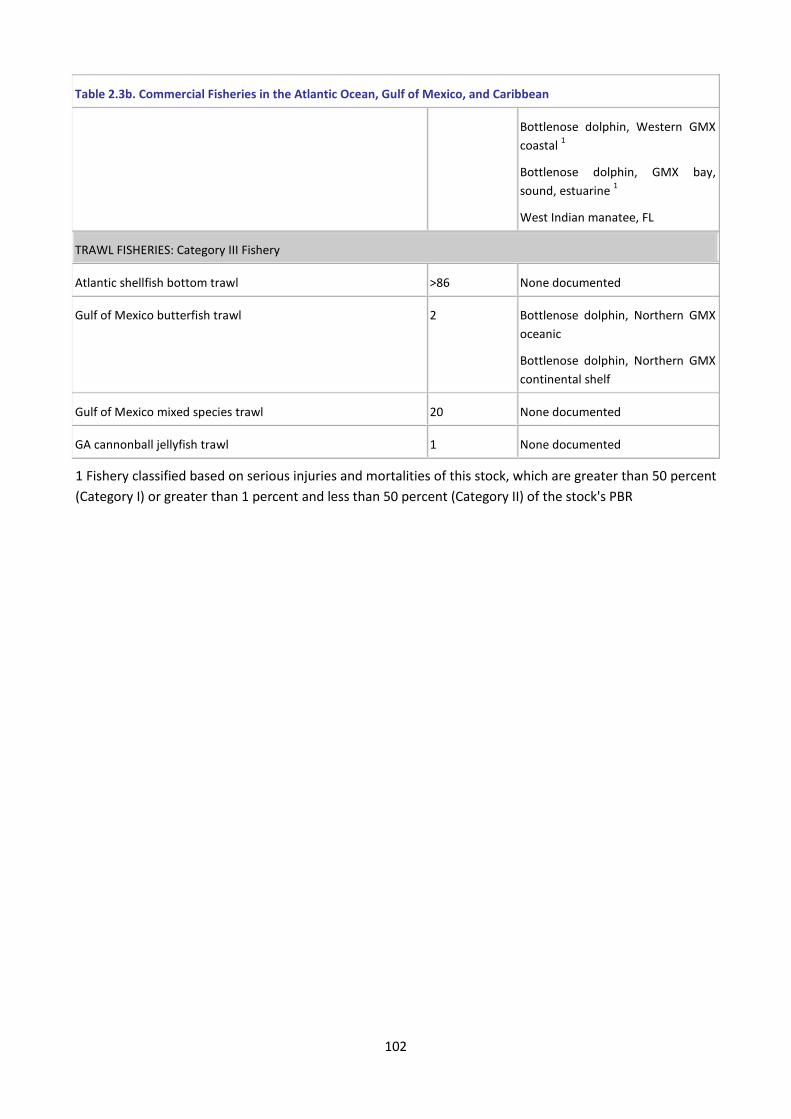
102
Table 2.3b. Commercial Fisheries in the Atlantic Ocean, Gulf of Mexico, and Caribbean
Bottlenose dolphin, Western GMX coastal 1
Bottlenose dolphin, GMX bay, sound, estuarine 1
West Indian manatee, FL
TRAWL FISHERIES: Category III Fishery
Atlantic shellfish bottom trawl >86 None documented
Gulf of Mexico butterfish trawl 2 Bottlenose dolphin, Northern GMX oceanic
Bottlenose dolphin, Northern GMX continental shelf
Gulf of Mexico mixed species trawl 20 None documented
GA cannonball jellyfish trawl 1 None documented
1 Fishery classified based on serious injuries and mortalities of this stock, which are greater than 50 percent (Category I) or greater than 1 percent and less than 50 percent (Category II) of the stock's PBR

103
Table 2.4. Commercial Fisheries with marine mammal bycatch on the High Seas in 2012.
Use hyperlink to read about fishery. The Western Pacific Pelagic fishery is listed as Category 1 (frequent interactions) because of the longline component of the fishery. The level of marine mammal bycatch in the pelagic trawl factory mothership is undetermined.
CATEGORY I
TRAWL FISHERIES:
Fishery Description Estimated # of vessels/ persons
Marine mammal species and stocks incidentally killed or injured
Atlantic Highly Migratory Species ** 3 Undetermined
CCAMLR 0 Antarctic fur seal
Western Pacific Pelagic 1 Undetermined
FACTORY MOTHERSHIP FISHERIES:
Western Pacific Pelagic 1 Undetermined

104
Table 2.5. Small cetacean (Max length > 7.5m) bycatch mitigation techniques and trials. Taken from http://www.bycatch.org/search. There were no records for large cetaceans. Follow reference hyperlink to view relevant sections from each report.
FISHERY FIELD STUDY
Locatio Gear Target species Technique Results Effect on target species Type Reference
Western Australia
Trawls red emperor, scarlet perch, spangled emperor, Rankin cod, blue spot emperor, rosy threadfin brea, flagfish, frypan snapper, red snapper and goldband snapper
Flexible sorting grid
Reduced dolphin bycatch by almost 50% and reduced bycatch of sea turtles, large sharks and large rays
Not reported In the wild
Stephenson, P.C., Wells, S., King, J.A., 2008: Evaluation of exclusion grids to reduce the bycatch of dolphins, turtles, sharks and rays in the Pilbara trawl fishery
United Kingdom
Trawls Bass Excluder devices
Did not reduce bycatch In the wild
Northridge, S., A. Mackay, D. Sanderson, R. Woodcock, and A. Kingston, 2004: A review of dolphin and porpoise bycatch issues in the Southwest of England
Unable to locate complete document
United Kingdom
Trawls Bass Excluder devices
Reduced bycatch Slightly reduced target catch (<1%)
In the wild
Northridge, S., 2003: Further development of a dolphin exclusion device
United Kingdom
Trawls Bass Acoustic pingers
Did not reduce bycatch In the wild
Northridge, S, 2003: Reduction of cetacean bycatch in pelagic trawls
United Kingdom
Trawls Bass Acoustic pingers
Did not reduce bycatch In the wild
Northridge, S., D. Sanderson, A. Mackay, and P. Hammond, 2003: Analysis and mitigation of cetacean bycatch in UK fisheries
Unable to locate complete document

105
FISHERY FIELD STUDY
Locatio Gear Target species Technique Results Effect on target species Type Reference
U.S. West Coast
Mid-water rope trawl
Coastal pelagic fish
Metal grate (Marine Mammal Exclusion Device (MMED)
Not during day but undetermined at night. 4 Pacific while-sided dolphins caught, 2 fell out of net alive, 2 cut out alive.
No statistical difference between the total catch between trawls with and without the MMED
In the wild
(Dotson et al., 2010)

106
2.14 References (Cetaceans) AFMA. 2010. Ecological Risk Management Report for the Mid-water trawl sector of the Small Pelagic Fishery. Australian Fisheries Management Authority.
AFMA. 2011. Small Pelagic Fishery Bycatch and discarding workplan 2011 - 2013 Australian Government, Australian Fisheries Management Authority.
AFMA. 2012. Threatened, Endangered, and Protected (TEP) Species Management Fact Sheet No. 2 Dolphins & porpoises. Australian Government, Australian Fisheries Management Authority.
Attard, C.R.M., Beheregaray, L.B., Jenner, C., Gill, P., Jenner, M., Morrice, M., Bannister, J., LeDuc, R. and Moller, L. 2010. Genetic diversity and structure of blue whales (Balaenoptera musculus) in Australian feeding aggregations. Conservation Genetics.
Bannister, J.L. 2011. Population trend in right whales off southern Australia 1933-2010. Paper SC/S11/RW10 presented to the IWC Scientific Committee, 2011, 8 pp.
Bannister, J.L., Burton, C.L.K., Hedley, S.L., Jenner, M.-N., Jenner, K.C.S. and Sturrock, V. 2007. Investigation of blue whales in the Perth Canyon, Western Australia, 2006 ? aerial surveys. . Department of the Environment and Heritage.
Bannister, J.L., Kemper, C.M. and Warneke, R.M. 1996. The Action Plan for Australian Cetaceans. Australian Nature Conservation Agency.
Bearzi, G., Agazzi, S., Gonzalvo, J., Costa, M., Bonizzoni, S., Politi, E., Piroddi, C. and Reeves, R.R. 2008. Overfishing and the disappearance of short-beaked common dolphins from western Greece. Endangered Species Research, 5: 1-12.
Bilgmann, K., Moller, L.M., Harcourt, R.G., Gales, R. and Beheregaray, L.B. 2008. Common dolphins subject to fisheries impacts in Southern Australia are genetically differentiated: implications for conservation. . Animal Conservation, 11: 518–528.
Brewer, D., Eayrs, S., Mounsey, R. and Wang, Y.G. 1996. Assessment of an environmentally friendly, pelagic trawl. Fisheries Research, 26: 225-237.
Broadhurst, M.K. 1998. Bottlenose Dolphins, Tursiops truncatus, Removing By-catch from Prawn-trawl Codends During Fishing in New South Wales, Australia.(Statistical Data Included). Marine Fisheries Review.
Carretta, J.V. and Barlow, J. 2011. Long-term effectiveness, failure rates, and "dinner bell" properties of acoustic pingers in a gillnet fishery. Marine Technology Society Journal, 45: 7-19.
Chilvers, B.L. and Corkeron, P.J. 2001. Trawling and bottlenose dolphin's social structure. Proceedings of the Royal Society of London B, 268: 1901-1905.
CMS Secretariat. 2012. Conserving cetaceans and manatees in the western African region, CMS Technical Series No. 26. Convention on the Conservation of Migratory Species of Wild Animals (CMS)
Corkeron, P.J. 1990. Aspects of the behavioral ecology of inshore dolphins Tursiops truncatus and Sousa chinensis in Moreton Bay, Australia. In The bottlenose dolphin (S. Leatherwood and R.R. Reeves, eds), pp. 285–293. San Diego, California: Academic Press.
Couperus, A.S. 1994. Killer whales (Orcinus orca) scavenging on discards of freezer trawlers north east of the Shetland Islands. Aquatic Mammals, 20.1: 47-51.
Couperus, A.S. 1997. Interactions Between Dutch Midwater Trawl and Atlantic White-sided Dolphins (Lagenorhynchus acutus) Southwest of Ireland. Journal Northwest Atlanic Fisheries Science, 22: 209–218.

107
Crespo, E.A., Pedraza, S.N., Dans, S.L., Alonso, M.K., Reyes, L.M., Garcia, N.A., Coscarella, M. and Schiavini, A.C.M. 1997. Direct and indirect effects of the highseas fisheries on the marine mammal populations in the northern and central Patagonian coast. Journal of Northwest Atlantic Fishery Science, 22: 189-207.
Dalla Rosa, L. and Secchi, E.R. 2007. Killer whale, Orcinus orca, interactions with the tuna and swordfish longline fishery off southern and south-eastern Brazil: a comparison with shark interactions. Journal of the Marine Biological Association of the United Kingdom, 87: 135-140.
Dans, S., L. , Koen Alonso, M., Pedraza, S.N. and Crespo, E.A. 2003a. Incidental Catch of Dolphins in Trawling Fisheries off Patagonia, Argentina: Can Populations Persist? Ecological Applications, 13: 754-762.
Dans, S., L., Alonso, M.K., Crespo, E.A., Pedraza, S.N. and Garcia, N.A. 2003b. Interactions between marine mammals and high seas fisheries in Patagonia: An intergrated approach. In Marine Mammals. Fisheries, Tourism and Management Issues (N.J. Gales , M. Hindell and R. Kirkwood, eds), pp. 100-115. Melbourne: CSIRO Publishing.
DEH. 2005. Humpback Whale Recovery Plan 2005 - 2010. Australian Government. Department of the Environment and Heritage.
Dotson, R.C., Griffith, D.A., King, D.L. and Emmett, R.L. 2010. Evaluation of a Marine Mammal Excluder Device (MMED) for a Nordic 264 Midwater Rope Trawl. NOAA-TM-NMFS-SWFSC-455.
Double, M.C., Jenner, K.C.S., Jenner, M.-N., Ball, I., Laverick, S. and Gales, N. 2012. Satellite tracking of pygmy blue whales (Balaenoptera musculus brevicauda) off Western Australia. Australian Marine Mammal Centre.
SEWPaC. 2011. http://www.environment.gov.au/coasts/species/cetaceans/conservation/sanctuary.html#network. Canberra: Department of Sustainability, Environment, Water, Population and Communities.
SEWPaC. 2013. Marine mammal species in Australian waters, http://www.environment.gov.au/coasts/species/cetaceans/australia/index.html: Department of Sustainability, Environment, Water, Population and Communities.
Du Fresne, S.P., Grant, A.R., Norden, W.S. and Pierre, J.P. 2007. Factors affecting cetacean bycatch in a New Zealand trawl fishery, DOC Research & Development Series 282. Science & Technical Publishing, New Zealand Department of Conservation.
Fernández-Contreras, M., Cardona, L., Lockyer, C. and Aguilar, A. 2010. Incidental by-catch of short beaked common dolphins (Delphinus delphis) in the pair trawler fishery off north-western Spain. ICES Journal Marine Science, 67: 1732-1738.
Fertl, D. and Leatherwood, S. 1997. Cetacean interactions with trawls: A preliminary review. Journal Northwest Atlantic Fisheries Science, 22: 219-248.
GABIA. 2010. Great Australian Bight Trawl Fishery Boat Operating Procedures Manual. Australian Fisheries Management Authority and Great Australian Bight Fishing Industry Association Inc.
Geijer, C.K.A. and Read, A.J. 2013. Mitigation of marine mammal bycatch in U.S. fisheries since 1994. Biological Conservation 159, 159: 54-60.
Gill, P.C. 2002. A blue whale (Balaenoptera musculus) feeding ground in a southern Australian coastal upwelling zone. Journal of Cetacean Research and Management, 4: 179-184.
Hall, M.A., Alverson, D.L. and Metuzals, K.I. 2000. By-Catch: Problems and Solutions. Marine Pollution Bulletin, 41: 204-219.

108
Hamer, D.J., Childerhouse, S.J. and Gales, N.J. 2012. Odontocete bycatch and depredation in longline fisheries: A review of available literature and of potential solutions [Review]. Mar. Mamm. Sci, 28: 345-374.
Hamer, D.J., Ward, T.M. and McGarvey, R. 2008. Measurement, management and mitigation of operational interactions between the South Australian Sardine Fishery and short-beaked common dolphins (Delphinus delphis). Biol. Conserv, 141: 2865-2878.
Hedley, S.L., Bannister, J.L. and Dunlop, R.A. 2011. Abundance estimates of Southern Hemisphere Breeding Stock ‘D’ humpback whales from aerial and land-based surveys off Shark Bay, Western Australia, 2008. Journal of Cetacean Research and Management (Special Issue 3): 209-221.
Hucke-Gaete, R., Crespo, E.A. and Schlatter, R.P. (eds) 2002. Aquatic mammals in Latin America: Proceedings of a workshop on identifying high-priority conservation needs and actions. Valdivia, Chile: Convention on the Conservation of Migratory Species of Wild Animals.
Jaaman, S.A., Lah-Anyi, Y.U. and Pierce, G.J. 2009. The magnitude and sustainability of marine mammal by-catch in fisheries in East Malaysia. Journal of the Marine Biological Association of the United Kingdom, 89: 907-920.
Jaiteh, V.F., Allen, S.J., Meeuwig, J.J. and Loneragan, N.R. 2012. Subsurface behavior of bottlenose dolphins (Tursiops truncatus) interacting with fish trawl nets in northwestern Australia: Implications for bycatch mitigation. Mar. Mamm. Sci.
Jensen, F.H., Bejder, L., Wahlberg, M., Aguilar Soto, N., Johnson, M. and Madsen, P.T. 2009. Vessel noise effects on delphinid communication. Marine Ecology Progress Series, 395: 161-175.
Kennelly, S.J. and Broadhurst, M.K. 2002. Bycatch begone: changes in the philosophy of fishing technology. Fish and Fisheries, 3: 340-355.
Kuiken, T., Simpson, V., Allchin, C., Bennett, P., Codd, G., Harris, E., Howes, G., Kennedy, S., Kirkwood, J., Law, R., Merrett, N. and Phillips, S. 1994. Mass mortality of common dolphins (Delphinus delphis) in south west England due to incidental capture in fishing gear. Veterinary Record. , 134: 81-89.
Laist, D.W., Knowlton, A.R., G, M.J., Collet, A.S. and Podesta, M. 2001. Collisions between ships and whales. Mar. Mamm. Sci, 17: 35-75.
Lo´pez, A., Pierce, G.J., Santos, M.B., Gracia, J. and Guerra, A. 2003. Fishery by-catches of marine mammals in Galician waters: results from on-board observations and an interview survey of fishermen. Biol. Conserv, 111: 25-40.
Lyle, J.M. and Willcox, S.T. 2008. Dolphin and seal interactions with mid-water trawling in the Small Pelagic Fishery, including an assessment of bycatch mitigation strategies. Final Report Project R05/0996. Tasmanian Aquaculture and Fisheries Institute, University of Tasmania.
Macfadyen, G., Huntington, T. and Cappell, R. 2009. Abandoned, lost or otherwise discarded fishing gear. UNEP Regional Seas Reports and Studies No. 185 and FAO Fisheries and Aquaculture Technical Paper No. 523. FAO and UNEP.
Moore, A. and Skirtun, M. 2012. Chapter 7: Small Pelagic Fishery. In ABARES Fishery status reports 2011 (J. Woodhams, S. Vieira and I. Stobutzki, eds), pp. 90-103. Canberra: Commonwealth of Australia.
Moore, J.E., Cox, T.M., Lewison, R.L., Read, A.J., Bjorkland, R., McDonald, S.L., Crowder, L.B., Aruna, E., Ayissi, I., Espeut, P., Joynson-Hicks, C., Pilcher, N., Poonian, C.N.S., Solarin, B. and Kiszka, J. 2010. An interview-based approach to assess marine mammal and sea turtle captures in artisanal fisheries. Biol. Conserv, 143: 795-805.

109
Moore, M.J., Bogomolni, A.L., Dennison, S.E., Early, G., Garner, M.M., Hayward, B.A., Lentell, B.J. and Rotstein, D.S. 2009. Gas bubbles in seals, dolphins, and porpoises entangled and drowned at depth in gillnets. Vet Pathology, 46: 536-547.
Moore, M.J., van der Hoop, J., Barco, S.G., Costidis, A.M., Gulland, F.M., Jepson, P.D., Moore, K.T., Raverty, S. and McLellan, W.A. 2013. Criteria and case definitions for serious injury and death of pinnipeds and cetaceans caused by anthropogenic trauma. Diseases of Aquatic Organisms, 103: 229–264.
Moore, M.J. and van der Hoop, J.M. 2012. The painful side of trap and fixed net fisheries: Chronic entanglement of large whales [Review]. Journal of Marine Biology, Article ID 230653: 4 pages.
Morizur, Y., Berrow, S.D., Tregenza, N.J.C., Couperus, A.S. and Pouvreau, S. 1999. Incidental catches of marine-mammals in pelagic trawl fisheries of the northeast Atlantic. Fisheries Research, 41: 297-307.
National Marine Fisheries Service. 2011. U.S. National Bycatch Report, NOAA Tech. Memo. NMFS-F/SPO-117E. National Marine Fisheries Service.
Noad, M., Dunlop, R.A., Paton, D. and Kniest, H. 2011. Abundance estimates of the east Australian humpback whale population: 2010 survey and update. Paper SC/63/SH22 presented to the IWC Scientific Committee.
Northridge, S., Mackay, A., Cross, T., Sanderson, D., Woodcock, R. and Kingston, A. 2005. Investigations into dolphin bycatch in a pelagic trawl fishery: University of St Andrews.
Notarbartolo di Sciari, G. and Birkun, A., Jr. 2010. Conserving whales, dolphins and porpoises in the Mediterranean and Black Seas. ACCOBAMS Status Report.
Nottestad, L., Ferno, A., Mackinson, S., Pitcher, T. and Misund, O.A. 2002. How whales influence herring school dynamics in a cold-front area of the Norwegian Sea. ICES Journal of Marine Science: Journal du Conseil. , 59: 393-400.
Pace, D.S., Pulcin, i.M. and Triossi, F. 2012. Anthropogenic food patches and association patterns of Tursiops truncatus at Lampedusa island, Italy. Behavioral Ecology & Sociobiology, 23: 254-264.
Pichel, W.G., Veenstra, T.S., Churnside, J.H., Arabini, E., Friedman, K.S., Foley, D.G., Brainard, R.E., Kiefer, D., Ogle, S., Clemente-Colon, P. and Li, X.F. 2012. GhostNet marine debris survey in the Gulf of Alaska - Satellite guidance and aircraft observations. Marine Pollution Bulletin, 65: 28-41.
Read, A.J., Drinker, P. and Northridge, S. 2006. Bycatch of marine mammals in US and global fisheries. Conservation Biology, 20: 163-169.
Redfern, J.V., McKenna, M.F., Moore, T.J., Calambokidis, J., Deangelis, M.L., Becker, E.A., Barlow, J., Forney, K.A., Fielder, P.C. and Chivers, S.J. 2013. Assessing the risk of ships striking large whales in marine spatial planning. Conservation Biology, 27: 292-302.
Reeves, R.R., McClellan, K. and Werner, T.B. 2013. Marine mammal bycatch in gillnet and other entangling net fisheries, 1990 to 2011. Endangered Species Research, 20: 71–97.
Reeves, R.R., Smith, B.D., Crespo, E.A. and Notarbartolo di Sciara, G. 2003. Dolphins, whales and porpoises: 2002–2010 conservation action plan for the world’s cetaceans. IUCN/SSC Cetacean Specialist Group. .
Reynolds, J.E. 2008. New Zealand can act to conserve Hector's and Maui's dolphins. Presidential Letter. The Society for Marine Mammalogy Letter.
Ross, A. and Isaac, S. 2004. The Net Effect? A review of cetacean bycatch in pelagic trawls and other fisheries in the north-east Atlantic. A WDCS report for Greenpeace.

110
Salgado Kent, C., Jenner, C., Jenner, M., Bouchet, P. and Rexstad, E. 2012. Southern Hemisphere Breeding Stock D humpback whale population estimates from North West Cape, Western Australia. Journal of Cetacean Research and Management 12: 29-38.
Senko, J., White, E.R., Heppell, S., S. and Gerber, L., R. 2013. Comparing bycatch mitigation strategies for vulnerable marine megafauna. Animal Conservation, doi:10.1111/acv.12051: 1-14.
Shaughnessy, P., Kirkwood, R., Cawthorn, M., Kemper, C. and Pemberton, D. 2003. Pinnipeds, cetaceans and fisheries in Australia: A review of operational interactions. In Marine Mammals. Fisheries, Tourism and Management Issues (N.J. Gales , M. Hindell and R. Kirkwood, eds), pp. 136-152. Melbourne: CSIRO Publishing.
Silber, G.K., Bettridge, S. and Cottingham, D. 2009. Report of a workshop to identify and assess technologies to reduce ship strikes of large whales, 8-10 July, 2008. U.S. Dep. Commer., NOAA Tech. Memo. NMFS-OPR-42.
Slooten, E. and Dawson, S.M. 2010. Assessing the effectiveness of conservation management decisions: likely effects of new protection measures for Hector's dolphin (Cephalorhynchus hectori). Aquatic Conservation: Marine & Freshwater Ecosystems, 20: 334-347.
Stephenson, P.C. and Wells, S. 2006. Evaluation of the effectiveness of reducing dolphin catches with pingers and exclusion grids in the Pilbara trawl fishery. Report to Department of Fisheries, Western Australia, Perth.
Stephenson, P.C., Wells, S. and King, J.A. 2008. Evaluation of exclusion grids to reduce the bycatch of dolphins, turtles, sharks and rays in the Pilbara trawl fishery. DBIF funded Project. Fisheries Research Report No. 171, 2008. 24 pp. Department of Fisheries, Government of Western Australia.
Thompson, F.N. and Abraham, E.R. 2009. Dolphin bycatch in New Zealand trawl fisheries, 1995–96 to 2006–07, New Zealand Aquatic Environment and Biodiversity Report No. 36. Ministry of Fisheries.
Thompson, F.N., Berkenbusch, K. and Abraham, E.R. 2013. Marine mammal bycatch in New Zealand trawl fisheries 1995–96 to 2009–10, New Zealand Aquatic Environment and Biodiversity Report No. 105. Ministry for primary Industries.
Tuck, G.N., Knuckey, I. and Klaer, N.L. 2013. Informing the review of the Commonwealth Policy on Fisheries Bycatch through assessing trends in bycatch of key Commonwealth fisheries. Fisheries Research and Development Corporation final report 2012/046. . Fisheries Research and Development Corporation.
van der Hoop, J., Moore, M., Fahlman, A., Bocconcelli, A., George, C., Jackson, K., Miller, C., Morin, D., Pitchford, T., Rowles, T., Smith, J. and Zoodsma, B. 2013. Behavioral impacts of disentanglement of a right whale under sedation and the energetic cost of entanglement. Mar. Mamm. Sci: DOI: 10.1111/mms.12042.
van Waerebeek, K. 2007. Conservation Status of the Clymene Dolphin in West Africa. Convention on the Conservation of Migratory Species of Wild Animals (CMS)
Wade, P.R. 1998. Calculating the limits to the allowable human-caused mortality of cetaceans and pinnipeds. Mar. Mamm. Sci, 14: 1-37.
Waring, G.T., Gerior, P., Payne, M.P., Parry, B.L. and Nicolas, J.R. 1990. Incidental Take of Marine Mammals in Foreign Fishery Activities Off the Northeast United States, 1977-88. Fisheries Bulletin, 88: 347-360.
Werner, T., Kraus, S., Read, A.a. and Zollett, E. 2006. Fishing techniques to reduce the bycatch of threatened marine animals. Marine Technology Society Journal, 40: 50-68.

111
Zeeberg, J., Corten, A. and De Graaf, E. 2006. Bycatch and release of pelagic megafauna in industrial trawler fisheries off Northwest Africa. Fisheries Research, 78: 186-195.
Zollett, E.A. 2004. Net knowledge: A review of cetacean bycatch in trawl fisheries: University of New Hampshire.
Zollett, E.A. 2009a. Bycatch of protected species and other species of concern in US east coast commercial fisheries. Endangered Species Research, 9: 49–59.
Zollett, E.A. 2009b. Supplementary Material, Tables. Endangered Species Research, 9.
Zollett, E.A. and Rosenberg, A.A. 2005. A Review of Cetacean Bycatch in Trawl Fisheries. Prepared for the Northeast Fisheries Science Center.

112
3 Sharks
Literature review on the impacts on Environment Protection and Biodiversity Conservation Act 1999 (Cth)
protected species by large mid-water trawl vessels.
Chapter 3: Sharks
Prepared for
The Department of Sustainability, Environment, Water, Population and Communities on behalf of the Expert Panel on a Declared Commercial Fishing Activity.
GPO Box 787, Canberra, ACT, 2601
Project Reference: JN13076
Elgin Associates Pty Ltd
ABN 59123488639
113
Chapter Information
Chapter written by:
Luke Finley (Elgin Associates Pty Ltd)
Reviewed by: Rebecca McIntosh (Elgin Associates Pty Ltd)
Barry Baker (Latitude 42 Environmental Consultants Pty Ltd)
Sheryl Hamilton (Latitude 42 Environmental Consultants Pty Ltd)
Project: Elgin JN13076: Literature Review: Impacts on Environment Protection and Biodiversity Conservation Act 1999 protected species by large mid-water trawl vessels
Contact: Elgin Associates Pty Ltd ABN 59123488639 Level 4, 11 Morrison St, Hobart, TAS, 7000 Telephone: +61 417 598807 Fax: +61 3 86486336 www.elgin.com.au

114
3. Sharks
3.1 Brief description Worldwide, there are about 400 species of sharks. Of these, around 180 species occur in Australian waters, of which about 70 are thought to be endemic (SEWPaC 2013a). Sharks are relatively long lived, slow to reach sexual maturity and have low fecundity rates. This suite of characteristics increases their vulnerability to mortality above natural levels, either through harvesting by commercial or recreational fishing or through depletion from other sources such as habitat degradation or shark control activities.
Sharks occur in all habitats around the Australian coast line, but most are found on the continental slope or shelf, primarily on the ocean bottom. There are however some protected shark species that are primarily pelagic and known to inhabit or utilise resources within the zones of the Small Pelagic Fishery (SPF).
For the purpose of this literature review, only descriptions of the nine sharks that are listed on the EPBC Act and likely to interact with fishers in the SPF of Australia are provided.
Of the nine species described below, three listed species were included in an Ecological Risk Assessment (ERA) for the mid-water trawl sector of the Small Pelagic Fishery: Grey Nurse shark1, White shark, and Whale shark. All species were assessed as having a ‘Medium’ risk of interacting with fishing vessels within the SPF zones (Daley et al. 2007). The remaining five species that were not assessed in the 2007 ERA were the Basking shark, School shark, Longfin Mako shark, Shortfin Mako shark and Porbeagle shark. School shark was listed under the EPBC Act as Conservation Dependent in January 2009, and the remaining species were listed as Migratory under the EPBC Act either in 2007 (Basking shark) or 2010 (Porbeagle, Longfin Mako and Shortfin Mako sharks). The species listed since the abovementioned ERA process was completed should be assessed using an additional or supplementary ERA that identifies the risk of these species interacting with fishing vessels in the SPF.
3.2 Sharks at risk of interactions with large pelagic trawlers in Australian waters
3.2.1 Grey Nurse Shark (Carcharias taurus) – East coast population
Conservation status: Listed as critically endangered under the EPBC Act.
Population estimate: The total number of individuals on the east coast of Australia is low and estimated at between 1146 and 1662 individuals.
Distribution and key habitats within Australian waters: The Australian population of Grey Nurse Shark (East Coast) is now confined to coastal waters off southern Queensland and along the entire NSW coast. This species is uncommon in Victorian, South Australian and Tasmanian waters, and has not been found in the Great Australian Bight (SEWPaC 2013b).
This species is migratory and is known to migrate north and south along the east coast of Australia. It is commonly observed at 14 sites in NSW where aggregations of 5 or more individuals can occur, although additional sites were identified in 2010 (Cardno Ecology Lab 2010). Although less common in Queensland waters, it can also be found at several sites in southern Queensland during the winter months. Aggregation sites have been identified along the east coast (Chidlow et al. 2006; Cardno Ecology Lab 2010) and
1 The ERA assessed Grey Nurse Sharks as one population (Daley et al. 2007), rather than East and West coast population as described here.

115
suggested management of these sites has included regulation of fishing and education of fishers (Cardno Ecology Lab 2010).
Feeding and/or breeding ecology relevant to interactions in the SPF: Grey nurse sharks are often observed just above the sea bed in or near deep sandy-bottomed gutters or rocky caves, in the vicinity of inshore rocky reefs and islands. The diet of the adult grey nurse shark consists of a wide range of fish, other sharks, squids, crabs and lobsters. Observations suggest that schools of Grey Nurse Sharks can feed cooperatively by concentrating schooling prey before feeding on them (Compagno 1984; Ireland 1984).
Previous outcomes of risk assessment: Evaluated as medium risk. No captures have been recorded in SPF observer data to date (Tuck et al. 2013).
Risk profile: Interactions unlikely. The grey nurse distribution overlaps with Zone D (eastern zone) of the SPF, particularly off Eden, NSW. Population numbers are critically low and poor fecundity means that recovery is slow. Commercial and recreational fishers should be educated regarding the locations where grey nurse sharks aggregate.
3.2.2 Grey Nurse shark (Carcharias taurus) – West coast population
Conservation status: Listed as vulnerable under the EPBC Act.
Population estimate: There are no population estimates for the west coast population; however commercial bycatch rates have been stable over time suggesting that this population has not undergone the significant declines as seen in the eastern population (SEWPaC 2013c), although Ahonen and Stow (2004) estimated that the total west coast population may be in the order of 1000-1500 individuals.
Distribution and key habitats within Australian waters: Unlike the east coast Grey Nurse shark, aggregation sites have not been identified in Western Australia (Chidlow et al. 2006). Anecdotal reports suggest that Grey Nurse sharks are widely distributed along the WA coast, albeit with little or indeterminate frequency. There is a possibility that Grey Nurse sharks do not aggregate to the same degree or in the same areas/habitat types as off the east coast.
Feeding and/or breeding ecology relevant to interactions in the SPF: Similar to east coast description above. A tracking study of west coast Grey Nurse sharks found that juveniles can move hundreds of kilometres north along the Western Australia coast, from Perth to Kalbarri, before returning south. The length of the migration indicates that Grey Nurse sharks do not need to stay close to what is considered their typical habitat, such as rocky ledges, gutters and caves (McAuley 2004).
Previous outcomes of risk assessment: Grouped with East coast population and evaluated as medium risk. No captures have been recorded in observer data to date (Daley et al. 2007).
Risk profile: Interactions unlikely. Aggregations sites unknown for the west coast population. The west coast distribution overlaps with Zone B (western zone) of the SPF, particularly off Cape Leeuwin, WA. Although individuals have been recorded at varying depths down to 230 metres, most commonly found between 15 and 40 metres (Otway and Parker 2000).
3.2.3 Whale shark (Rhincodon typhus)
Conservation status: Listed as vulnerable under the EPBC Act and migratory on Appendix 2 of CMS.
Population estimate: Yearly numbers of Whale sharks in Ningaloo Marine Park (WA) are estimated to vary between 200 and 400 individuals (Davis et al.1997 cited in DEH 2005).

116
Distribution and key habitats within Australian waters: The Whale shark is an oceanic and coastal, tropical to warm-temperate pelagic shark, generally between 30⁰N and 35⁰S. Whale shark are known to seasonally aggregate at known areas within Australian waters, including coastal waters off Ningaloo Reef between March and July each year, at Christmas Island between December and January, and in the Coral Sea between November and December (SEWPaC 2013d). These seasonal aggregations are thought to be linked to localised seasonal ‘pulses’ of food productivity. It is not known if other habitat critical to the survival of the whale shark exists within Australian waters (DEH 2005).
Feeding and/or breeding ecology relevant to interactions in the SPF: The Whale shark is a large filter-feeding shark characterised by a streamlined body with a flattened, broad head. It has a very large and wide mouth, positioned at the front of the head, with approximately 300 minute teeth in each jaw (Last and Stevens 2009). The Whale shark is the world's largest fish, with most reported specimens are between 4 and 10 m (Colman 1997). Although capable of diving to great depths (at least 980 metres), they are more commonly seen at, or close to, the surface (Wilson et al. 2006).
Previous outcomes of risk assessment: Evaluated as medium risk. No captures have been recorded in SPF observer data to date (Tuck et al. 2013) and distribution unlikely to overlap with fishery.
Risk profile: Interactions unlikely. Although their distribution overlaps with the fishing zones of the SPF - particularly in southern Western Australia and waters off Eden, southern NSW - Whale sharks are generally considered a tropical to warm pelagic shark and therefore interactions unlikely.
They are commonly seen near the surface and some individuals have scars that have been attributed to boat strike.
3.2.4 White shark (Carcharodon carcharias)
Conservation status: Listed as vulnerable under the EPBC Act migratory on Appendix 1 & 2 of CMS.
Population estimate: There are currently no estimates of the size of the white shark population in Australian waters and no reliable measures with which to compare changes in population status over time. This is due partly to the scarcity of White sharks and also to the difficulty in distinguishing population changes from the high rates of variability in numbers observed within any one site or region between years (Bruce 2008). However, it is generally accepted that there has been a long-term decline of the White shark population in Australian waters (SEWPaC 2013e).
Distribution and key habitats within Australian waters: In Australian waters the White shark's range extends primarily from southern Queensland, around the southern coastline and to the North West Cape in Western Australia. White sharks are widely, but not evenly, distributed in Australian waters - more frequented areas include waters in and around some fur seal and sea lion colonies such as the Neptune Islands (South Australia), areas of the Great Australian Bight, the Recherche Archipelago and the islands off the lower west coast of Western Australia (DEWHA 2009). The species is not site-specific—tracking data has revealed individuals travel between sites of temporary residency (Bradford et al. 2011) and sometimes covering great distances (Bonfil et al. 2005).
Feeding and/or breeding ecology relevant to interactions in the SPF: White sharks eat a variety of prey, including fish, other sharks and rays, marine mammals, squid and crustaceans. They can be found from close inshore around rocky reefs, surf beaches and shallow coastal bays to outer continental shelf and slope areas (Bruce and Bradford 2011, Bruce et al. 2006). However, they also make open ocean excursions and can cross ocean basins (Bruce and Bradford 2011; Bonfil et al. 2005). Both adults and juveniles have been recorded diving to depths of 1000 m. Most White shark movements and activities in Australian waters occur between the coast and the 120 m depth contour (Bruce and Bradford 2008; Bruce et al. 2006). White

117
sharks are often found in regions with high prey density, which results in higher numbers near some seal colonies and in sites where other prey species (e.g. some finfish) aggregate (Bruce et al. 2006).
Previous outcomes of risk assessment: Evaluated as medium risk. One white shark was captured using mid-water trawl gear in the SPF in 2009 (Tuck et al. 2013).
Risk profile: Interactions possible. The White shark’s distribution overlaps with the fishing zones of the SPF. Although often observed in coastal areas (<120 m depth contour), satellite tracking has revealed White sharks can make long oceanic migrations. Interactions between White sharks and commercial fisheries have generally involved entanglement with gillnets. The Great Australian Bight has been identified as a biologically important area for White sharks.
3.2.5 Basking shark (Cetorhinus maximus)
Conservation status: Listed as vulnerable under the EPBC Act and migratory on Appendix 1 & 2 of CMS.
Population estimate: Declining trend globally, but no information regarding Australian population.
Distribution and key habitats within Australian waters: The species is found worldwide in temperate and cool oceanic waters. In Australia it is most common off the southern coastline but is recorded from Exmouth Gulf, Western Australia, around the temperate south and north to Port Stephens, New South Wales.
Feeding and/or breeding ecology relevant to interactions in the SPF: The Basking shark can grow up to 10 metres in length, feeds almost entirely on zooplankton, and swims near the surface with their huge mouths open to strain food from the water. They are known to travel in groups and are known to aggregate around abundant plankton. Basking sharks are known to aggregate around areas of high productivity, such as upwellings and shelf breaks. A New Zealand winter hoki fishery, targeting fish aggregated in deep water for spawning, takes a bycatch of Basking sharks that are thought to be feeding on the energy-rich eggs (Francis and Duffy 2002 cited in Fowler 2005).
Risk profile: Interactions possible. The Basking Shark distribution overlaps with the fishing zones of the SPF, particularly in southern Australia. Because they are commonly seen near the surface there is a risk of boat strike. They are also relatively slow moving compared to other pelagic shark species and there are trawl fisheries in New Zealand that catch basking sharks around areas of high productivity.
3.2.6 School shark (Galeorhinus galeus)
Conservation status: Listed as Conservation Dependant under the EPBC Act.
Population estimate: In 2001 the estimated School shark population in Australian waters was approximately 2.3 million sharks. More recent assessments suggest that stocks may have stabilised (AFMA 2009).
Distribution and key habitats within Australian waters: School sharks are found in offshore temperate waters from Moreton Bay in Queensland to Perth in Western Australia, including the offshore waters of Tasmania and Lord Howe Island. School sharks move extensively throughout the waters of southern Australia (TSSC 2009) and are mainly found in demersal waters, over the continental and insular shelves, but also over the upper slopes, in depths from near shore to 550 m (Last and Stevens 2009). Inshore areas are particularly important as birthing and nursery sites (TSSC 2009). The most important pupping areas occur inshore around Tasmania, particularly in the south-east, and in Victoria, including Port Phillip Bay, Western Port Bay and Corner Inlet (AFMA 2009).

118
Feeding and/or breeding ecology relevant to interactions in the SPF: School shark often occurs in small groups of similar sex and size aggregations. School sharks feed on bony fish and cephalopods.
Risk profile: Interactions unlikely. The distribution of School shark overlaps with the fishing zones of the SPF, particularly in southern Australian waters. Interactions with pelagic trawlers unlikely given that School sharks are often found near the sea bed.
3.2.7 Longfin Mako shark (Isurus paucus)
Conservation status: Listed as migratory on Appendix 2 of CMS.
Population estimate: Unknown. Declining trend globally, but there is a lack of information regarding Australian population.
Distribution and key habitats within Australian waters: The Longfin Mako shark is a widely distributed but rarely encountered oceanic tropical shark with a usual depth range between 120 and 240 metres. The Longfin Mako shark is often confused with its slightly more slender-bodied relative, the Shortfin Mako shark. The Longfin Mako shark can grow to just over four metres and is found from Geraldton in Western Australia around the northern Australian waters to Port Stephens in New South Wales (Last and Stevens 2009).
Feeding and/or breeding ecology relevant to interactions in the SPF: The Longfin Mako shark is thought to feed on pelagic fish and cephalopods, and its relatively large eyes suggest it may feed at depth (Last and Stevens 2009). In the North Atlantic, females give birth in winter (Gilmore 1993).
Risk profile: Interactions unlikely. The Shortfin Mako shark has a northern distribution that only overlaps with the northern portion of the SPF fishery off NSW (Zone D).
3.2.8 Shortfin Mako shark (Isurus oxyrinchus)
Conservation status: Listed as migratory on Appendix 2 of CMS.
Population estimate: Declining trend globally, but lack of information regarding Australian population.
Distribution and key habitats within Australian waters: The Shortfin Mako shark is a wide-ranging oceanic and pelagic shark, common and widespread in Australian waters, but rarely found in water below 16°C.
Feeding and/or breeding ecology relevant to interactions in the SPF: The Shortfin Mako shark is probably the fastest of all sharks and can grow to almost four metres. The Shortfin Mako shark feeds mainly on pelagic fish and cephalopods, with larger individuals known to take billfish and small cetaceans. Young are born off New South Wales around November (Last and Stevens 2009).
Risk profile: Interactions possible. The Shortfin Mako shark is an oceanic shark with a distribution that overlaps with the fishing zones of the SPF, particularly in southern Australian waters. The Shortfin Mako shark is known to feed on pelagic fish which are also the target of the SPF.
3.2.9 Porbeagle or Mackerel Shark (Lamna nasus)
Conservation status: Listed as migratory on Appendix 2 of CMS.
Population estimate: Declining trend globally, but a lack of information regarding Australian population.
Distribution and key habitats within Australian waters: The Porbeagle shark is a wide-ranging, coastal and oceanic shark. Porbeagle sharks reach a maximum size of approximately two metres and can be confused with the Shortfin Mako sharks. In Australia, it occurs from southern Queensland to south-west Australia, typically in oceanic waters on the continental shelf, although it is occasionally found in coastal waters
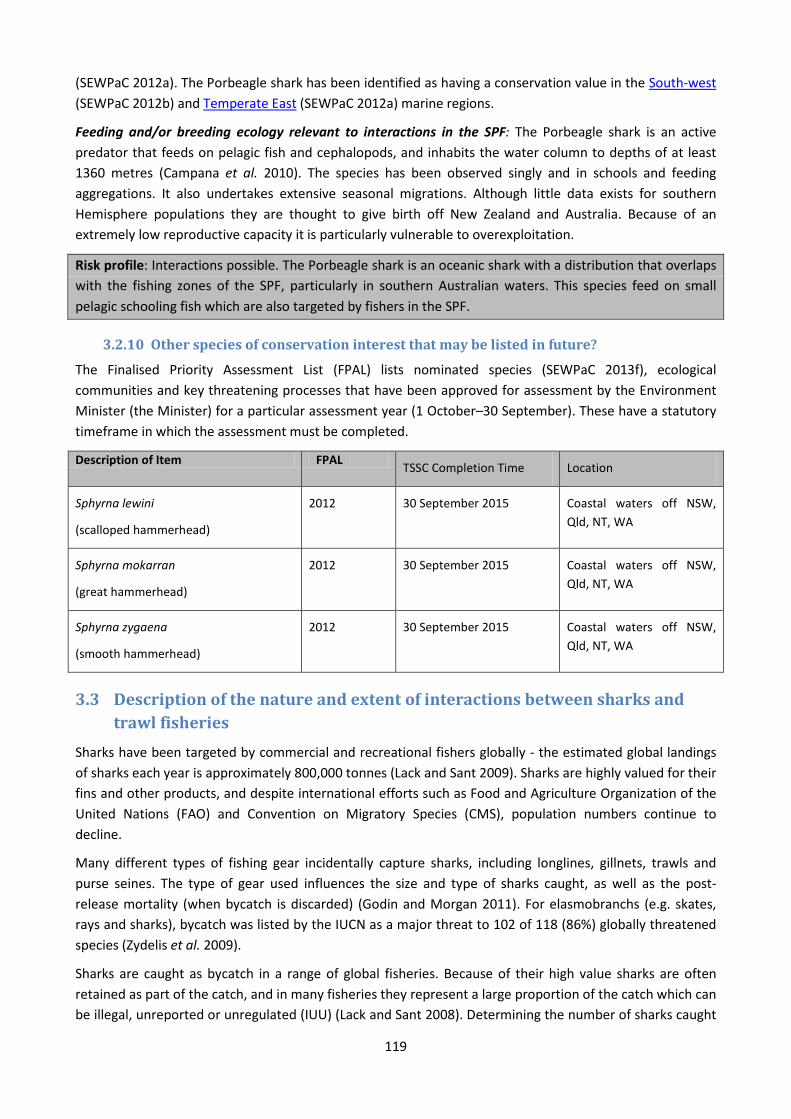
119
(SEWPaC 2012a). The Porbeagle shark has been identified as having a conservation value in the South-west (SEWPaC 2012b) and Temperate East (SEWPaC 2012a) marine regions.
Feeding and/or breeding ecology relevant to interactions in the SPF: The Porbeagle shark is an active predator that feeds on pelagic fish and cephalopods, and inhabits the water column to depths of at least 1360 metres (Campana et al. 2010). The species has been observed singly and in schools and feeding aggregations. It also undertakes extensive seasonal migrations. Although little data exists for southern Hemisphere populations they are thought to give birth off New Zealand and Australia. Because of an extremely low reproductive capacity it is particularly vulnerable to overexploitation.
Risk profile: Interactions possible. The Porbeagle shark is an oceanic shark with a distribution that overlaps with the fishing zones of the SPF, particularly in southern Australian waters. This species feed on small pelagic schooling fish which are also targeted by fishers in the SPF.
3.2.10 Other species of conservation interest that may be listed in future?
The Finalised Priority Assessment List (FPAL) lists nominated species (SEWPaC 2013f), ecological communities and key threatening processes that have been approved for assessment by the Environment Minister (the Minister) for a particular assessment year (1 October–30 September). These have a statutory timeframe in which the assessment must be completed.
Description of Item FPAL TSSC Completion Time Location
Sphyrna lewini
(scalloped hammerhead)
2012 30 September 2015 Coastal waters off NSW, Qld, NT, WA
Sphyrna mokarran
(great hammerhead)
2012 30 September 2015 Coastal waters off NSW, Qld, NT, WA
Sphyrna zygaena
(smooth hammerhead)
2012 30 September 2015 Coastal waters off NSW, Qld, NT, WA
3.3 Description of the nature and extent of interactions between sharks and trawl fisheries
Sharks have been targeted by commercial and recreational fishers globally - the estimated global landings of sharks each year is approximately 800,000 tonnes (Lack and Sant 2009). Sharks are highly valued for their fins and other products, and despite international efforts such as Food and Agriculture Organization of the United Nations (FAO) and Convention on Migratory Species (CMS), population numbers continue to decline.
Many different types of fishing gear incidentally capture sharks, including longlines, gillnets, trawls and purse seines. The type of gear used influences the size and type of sharks caught, as well as the post-release mortality (when bycatch is discarded) (Godin and Morgan 2011). For elasmobranchs (e.g. skates, rays and sharks), bycatch was listed by the IUCN as a major threat to 102 of 118 (86%) globally threatened species (Zydelis et al. 2009).
Sharks are caught as bycatch in a range of global fisheries. Because of their high value sharks are often retained as part of the catch, and in many fisheries they represent a large proportion of the catch which can be illegal, unreported or unregulated (IUU) (Lack and Sant 2008). Determining the number of sharks caught
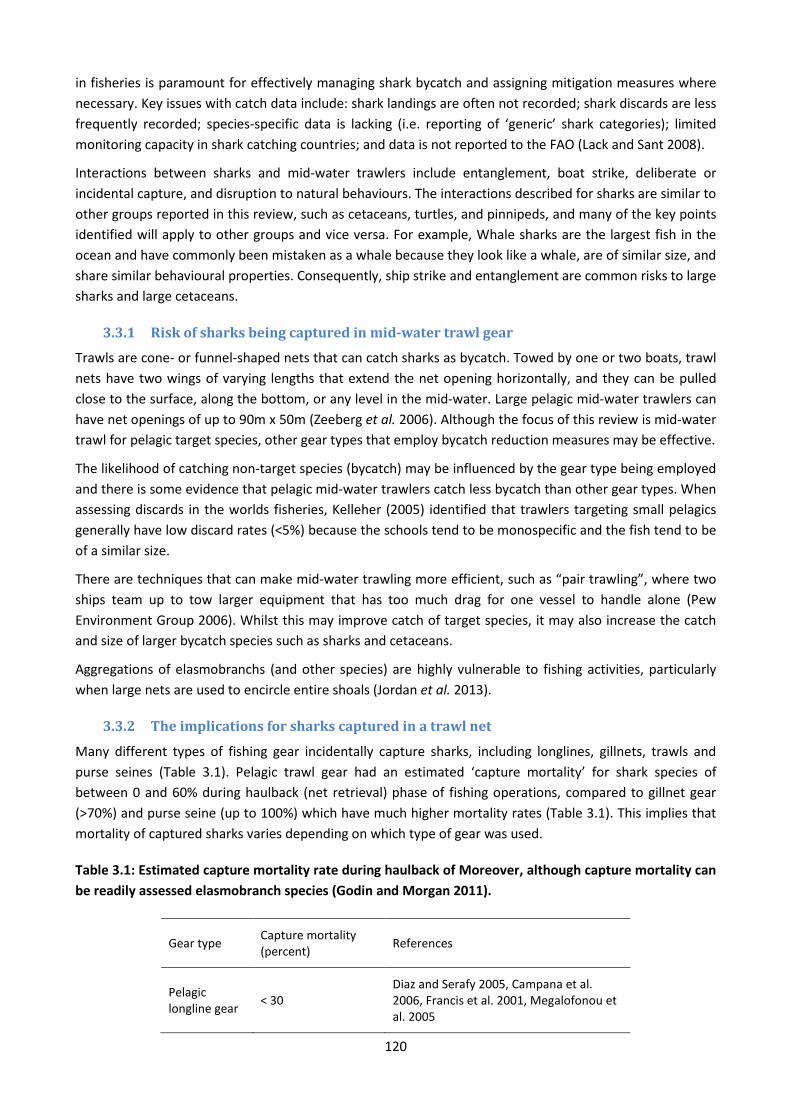
120
in fisheries is paramount for effectively managing shark bycatch and assigning mitigation measures where necessary. Key issues with catch data include: shark landings are often not recorded; shark discards are less frequently recorded; species-specific data is lacking (i.e. reporting of ‘generic’ shark categories); limited monitoring capacity in shark catching countries; and data is not reported to the FAO (Lack and Sant 2008).
Interactions between sharks and mid-water trawlers include entanglement, boat strike, deliberate or incidental capture, and disruption to natural behaviours. The interactions described for sharks are similar to other groups reported in this review, such as cetaceans, turtles, and pinnipeds, and many of the key points identified will apply to other groups and vice versa. For example, Whale sharks are the largest fish in the ocean and have commonly been mistaken as a whale because they look like a whale, are of similar size, and share similar behavioural properties. Consequently, ship strike and entanglement are common risks to large sharks and large cetaceans.
3.3.1 Risk of sharks being captured in mid-water trawl gear
Trawls are cone- or funnel-shaped nets that can catch sharks as bycatch. Towed by one or two boats, trawl nets have two wings of varying lengths that extend the net opening horizontally, and they can be pulled close to the surface, along the bottom, or any level in the mid-water. Large pelagic mid-water trawlers can have net openings of up to 90m x 50m (Zeeberg et al. 2006). Although the focus of this review is mid-water trawl for pelagic target species, other gear types that employ bycatch reduction measures may be effective.
The likelihood of catching non-target species (bycatch) may be influenced by the gear type being employed and there is some evidence that pelagic mid-water trawlers catch less bycatch than other gear types. When assessing discards in the worlds fisheries, Kelleher (2005) identified that trawlers targeting small pelagics generally have low discard rates (<5%) because the schools tend to be monospecific and the fish tend to be of a similar size.
There are techniques that can make mid-water trawling more efficient, such as “pair trawling”, where two ships team up to tow larger equipment that has too much drag for one vessel to handle alone (Pew Environment Group 2006). Whilst this may improve catch of target species, it may also increase the catch and size of larger bycatch species such as sharks and cetaceans.
Aggregations of elasmobranchs (and other species) are highly vulnerable to fishing activities, particularly when large nets are used to encircle entire shoals (Jordan et al. 2013).
3.3.2 The implications for sharks captured in a trawl net
Many different types of fishing gear incidentally capture sharks, including longlines, gillnets, trawls and purse seines (Table 3.1). Pelagic trawl gear had an estimated ‘capture mortality’ for shark species of between 0 and 60% during haulback (net retrieval) phase of fishing operations, compared to gillnet gear (>70%) and purse seine (up to 100%) which have much higher mortality rates (Table 3.1). This implies that mortality of captured sharks varies depending on which type of gear was used.
Table 3.1: Estimated capture mortality rate during haulback of Moreover, although capture mortality can be readily assessed elasmobranch species (Godin and Morgan 2011).
Gear type Capture mortality (percent) References
Pelagic longline gear < 30
Diaz and Serafy 2005, Campana et al. 2006, Francis et al. 2001, Megalofonou et al. 2005
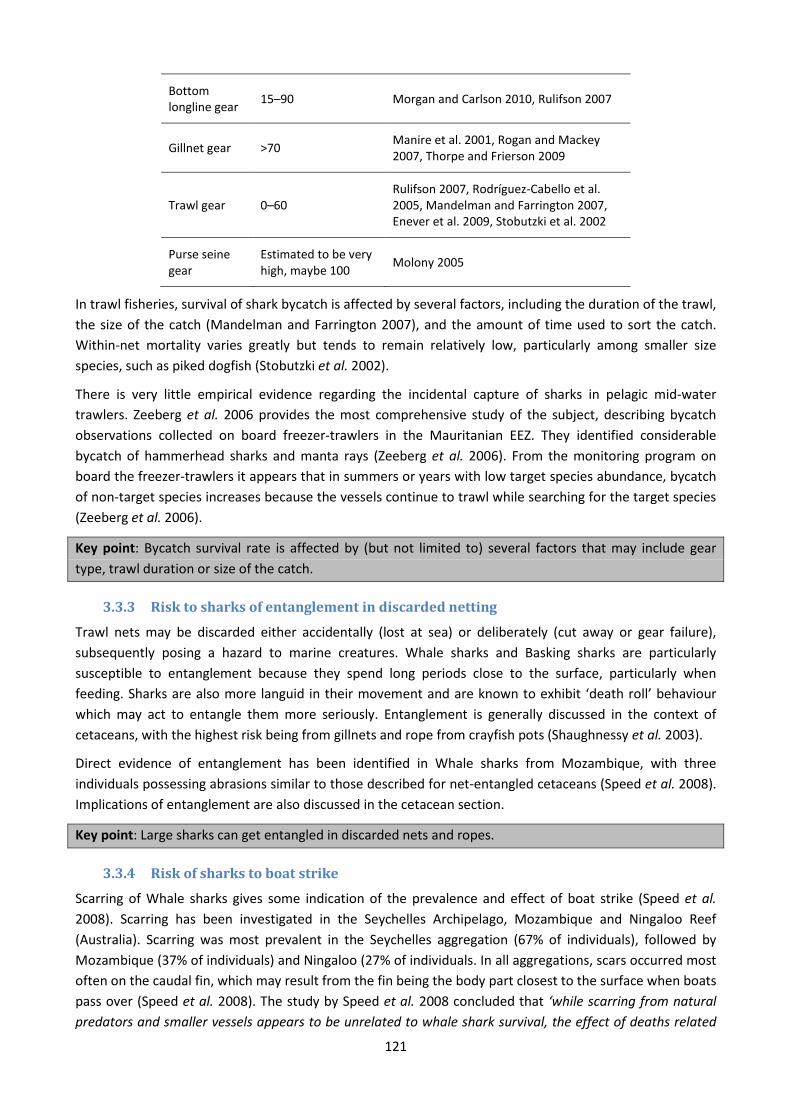
121
Bottom longline gear 15–90 Morgan and Carlson 2010, Rulifson 2007
Gillnet gear >70 Manire et al. 2001, Rogan and Mackey 2007, Thorpe and Frierson 2009
Trawl gear 0–60 Rulifson 2007, Rodríguez-Cabello et al. 2005, Mandelman and Farrington 2007, Enever et al. 2009, Stobutzki et al. 2002
Purse seine gear
Estimated to be very high, maybe 100 Molony 2005
In trawl fisheries, survival of shark bycatch is affected by several factors, including the duration of the trawl, the size of the catch (Mandelman and Farrington 2007), and the amount of time used to sort the catch. Within-net mortality varies greatly but tends to remain relatively low, particularly among smaller size species, such as piked dogfish (Stobutzki et al. 2002).
There is very little empirical evidence regarding the incidental capture of sharks in pelagic mid-water trawlers. Zeeberg et al. 2006 provides the most comprehensive study of the subject, describing bycatch observations collected on board freezer-trawlers in the Mauritanian EEZ. They identified considerable bycatch of hammerhead sharks and manta rays (Zeeberg et al. 2006). From the monitoring program on board the freezer-trawlers it appears that in summers or years with low target species abundance, bycatch of non-target species increases because the vessels continue to trawl while searching for the target species (Zeeberg et al. 2006).
Key point: Bycatch survival rate is affected by (but not limited to) several factors that may include gear type, trawl duration or size of the catch.
3.3.3 Risk to sharks of entanglement in discarded netting
Trawl nets may be discarded either accidentally (lost at sea) or deliberately (cut away or gear failure), subsequently posing a hazard to marine creatures. Whale sharks and Basking sharks are particularly susceptible to entanglement because they spend long periods close to the surface, particularly when feeding. Sharks are also more languid in their movement and are known to exhibit ‘death roll’ behaviour which may act to entangle them more seriously. Entanglement is generally discussed in the context of cetaceans, with the highest risk being from gillnets and rope from crayfish pots (Shaughnessy et al. 2003).
Direct evidence of entanglement has been identified in Whale sharks from Mozambique, with three individuals possessing abrasions similar to those described for net-entangled cetaceans (Speed et al. 2008). Implications of entanglement are also discussed in the cetacean section.
Key point: Large sharks can get entangled in discarded nets and ropes.
3.3.4 Risk of sharks to boat strike
Scarring of Whale sharks gives some indication of the prevalence and effect of boat strike (Speed et al. 2008). Scarring has been investigated in the Seychelles Archipelago, Mozambique and Ningaloo Reef (Australia). Scarring was most prevalent in the Seychelles aggregation (67% of individuals), followed by Mozambique (37% of individuals) and Ningaloo (27% of individuals. In all aggregations, scars occurred most often on the caudal fin, which may result from the fin being the body part closest to the surface when boats pass over (Speed et al. 2008). The study by Speed et al. 2008 concluded that ‘while scarring from natural predators and smaller vessels appears to be unrelated to whale shark survival, the effect of deaths related

122
to ship strike need to be quantified to assist in future management of this species’. They also reported on examples of Whale shark mortalities from collision with large vessels, including a tagged individual that was recorded travelling in a busy shipping lane, which sank to the bottom, that they hypothesise may have been due to ship strike.
Of the nine shark species described in Section 1.2, the Whale shark and Basking shark are behaviourally vulnerable to boat strike. These two species exhibit similar behaviours to cetaceans – surface feeding, slow moving, migratory, and aggregate around areas of high productivity (Speed et al. 2008). Refer to the cetacean section for more information regarding boat strike.
Key point: Whale sharks and Basking sharks are particularly vulnerable to boat strike because they are slow moving, surface feeding, and are known to aggregate around areas of high productivity. Larger vessels can inflict damage via ship strike that can be fatal (Speed et al. 2008).
3.3.5 Does vessel noise affect sharks?
Unlike cetaceans, sharks do not use sound to communicate with each other. However, sharks do sense sound as pressure through their lateral line system, and it is possible that high decibel sounds may negatively impact on sharks. Experiments have demonstrated that sharks can hear sounds with frequencies ranging from about 10 Hertz to about 800 Hertz, probably adapted to detecting very low-frequency vibrations such as those made by a struggling fish (Martin, 2004). The effects of very loud sounds on shark behaviour are not well documented, however it is possible that they may disrupt or disorientate normal behaviours such as feeding, mating, or migrating from one place to another (DEH 2005).
Key point: The impact of vessel noise on sharks has not been investigated.
3.4 International interactions between sharks and trawl fisheries Pelagic sharks and rays are caught in fisheries in all of the world’s oceans. In most regions, their bycatch in longline, purse-seine and gillnet fisheries is well known but poorly documented because the bycatch is often discarded and/or of low priority in data collection programmes (Camhi et al. 2009). As discussed previously, the bycatch by mid-water trawlers is not well documented.
Key point: The gear types in which sharks are taken as bycatch are predominantly longline, driftnet or gillnet. Shark bycatch in pelagic mid-water trawlers are less common, but there is still evidence of shark bycatch issues.
3.4.1 United States
Bycatch is generally well studied and documented for United States fisheries. Much of the research is done for gear types other than trawl fisheries. Zollett (2009) investigated seven commercial trawl fisheries that have documented bycatch (see Table S3 in Supplement 1, available at: www.int-res.com/articles/suppl/n009p049_app.pdf). All of these fisheries have either regulatory or recommended voluntary measures to reduce bycatch of protected species. Turtle excluder devices (TEDs), the best known method for bycatch reduction in trawl fisheries, were implemented to address sea turtle bycatch and are now mandated in areas throughout the U.S. east coast. TEDs may also be beneficial for other taxa, as other large organisms such as sharks may be able to escape through these devices (Zollett 2009).
3.4.2 Western Africa
Bycatch rates observed between 2001 and 2005 for more than 1,400 trawl sets off Mauritania, Northwest Africa, were shown to be considerable. Between five and ten European freezer trawlers, and between 40
123
and 70 foreign trawlers fish the productive upwelling system year round, targeting Sardinella, sardine and horsemackerel. Megafauna bycatch off Northwest Africa commonly consists of larger predatory fishes, including the larger shark species, and less frequently manta rays (Zeeberg et al. 2006).
The bycatch-monitoring program was implemented to assess monthly totals and establish whether mitigation was necessary. Bycatch was identified when it was taken on board a trawler during the haul process. The bycatch was retained in a “filter grid” designed to prevent large non-target animals entering into the cod end (Figure 2 in Zeeberg et al. 2006). Few animals arrived on deck alive and most were suffocated or had succumbed to water pressure while caught in the filter grid (Figure 3 in Zeeberg et al. 2006). The grid is rigged with a zipper junction that enables emptying of the filter outside of the vessel, but the animals are often entangled and are commonly removed on deck. Observers also requested that the animals be kept on deck for identification (to species level) and measurement.
Bycatch composition and volume was found to vary throughout the year. During summers and/or years with low Sardinella abundance, bycatch of non-target species increased because the vessel continued to trawl while searching for target species (Zeeberg et al. 2006). The European trawlers removed 1000 - 2000 sharks annually, which was considered high and unsustainable by the authors.
The nets fished by the vessels were fitted as standard with a 250mm x 250mm shark filter grid, which excluded Hammerhead sharks >140cm in length. However, the majority (ca. 75%) of hammerheads caught by the freezer-trawlers were juveniles of 0.50 m length to 1.40 m that often pass through the filter grid with the target species and are only separated once the catch is being processed below deck in the freezing factory.
Experiments in Mauritania have concentrated on the identification of bycatch seasonality. The authors concluded that (at least) during months of high animal abundance (June–September), a “tunnel excluder” (a simple gear adaptation that enables large animals to escape) is recommended to reduce bycatch. Most, if not all, mature sharks and rays were released alive and undamaged by this excluder. The specifics of the bycatch excluder described in this paper are discussed in Section 1.7 below.
Key point: Zeeberg et al. (2006) discuss many aspects of factory trawlers including fishing behaviour, megafauna bycatch, seasonal variations, net characteristics, and a range of other features.
3.4.3 Asia
Indonesia has the highest landings of elasmobranchs worldwide (109,000 t p.a. as reported by Lack and Sant 2011) and millions of Indonesian artisanal fishers rely heavily on elasmobranchs taken in target fisheries (Blaber et al. 2009). However, there have been no reliable species-specific catch data available from the Indonesian fisheries and little or no management of elasmobranch resources. Elasmobranchs in Indonesia are taken in target fisheries, primarily by artisanal fishers, utilising nets, longlines and droplines. They are also taken by industrial fish trawlers (Demersal trawl) and as bycatch in the pelagic tuna fisheries (Blaber et al. 2009). This review did not identify whether pelagic mid-water factory trawlers operate in Indonesia. There are a plethora of shark fisheries throughout Asia, but given the limited timeframes available for this review, they were not investigated further.
Key point: Shark mitigation measures are unlikely in Asian fisheries as the demand for shark fin means that sharks are targeted by fishermen.
3.4.4 Mediterranean
There are 86 species of elasmobranchs found in the Mediterranean (Bradai et al. 2012) and although none are directly targeted by fisheries they constitute part of the bycatch in most fisheries. Most fisheries effort

124
is concentrated along coastal areas, with more than 80% of the vessels being less than 12 metres in length. Pelagic fishing expanded in the Mediterranean Sea in the 1970s, and Ferretti et al. (2008) reported that the Mediterranean Sea is losing a wide range of its predator species, including sharks, largely because of overfishing and bycatch rates. Catches of elasmobranchs are primarily derived from two different fisheries: the pelagic artisanal fishery with longlines and gillnets and the demersal trawl fishery. Although trawlers represent only 10% of the fishing fleet, they contribute more than half of the landed fish catch (Bradai et al. 2012).
Demersal trawling in the Mediterranean generates occasional bycatch of pelagic sharks (Alopias vulpinus, Prionace glauca, Carcharadon carcharias, Isurus oxyrinchus) and provides 5% of the total bycatch for the Basking shark (Mancusi et al. 2005 cited in Bradai et al. 2012). Demersal trawlers in the Gulf of Gabès (central Mediterranean) account for 30% of bycatch for the White shark and 80% of bycatch for the Bluntnose sixgill shark (Hexanchus griseus) (Saidi et al. 2007 cited in Bradai et al. 2012). Furthermore, demersal trawls in this area account for the majority of the bycatch of juvenile White sharks.
Four protected sharks are common to the SPF and the Mediterranean area: White shark; Basking shark; Shortfin Mako; and Porbeagle shark. The most recent and comprehensive bycatch reviews of Mediterranean fisheries highlighted the need for mitigation measures for protected sharks (Bradai et al. 2012).
Key points: There are four protected species in common between the SPF and Mediterranean fisheries. Mitigation measures specifically designed to reduce shark bycatch in the Mediterranean pelagic trawl fisheries were not identified but further investigation may source relevant research groups.
3.4.5 South America
There are factory trawlers operating in South American waters, but data on shark bycatch is sparse. In the Argentine trawl fishery, data on bycatch from factory trawlers only provides information on marine mammals (Crespo et al. 1997). There was also no reported shark bycatch for the Patagonian trawl fishery, despite the activity of 20 factory trawlers operating in 1994, which was reduced to 12 in 2001 because of the fishery collapse (Dans et al. 2003). Argentina was the only South American country to be listed by the FAO as one of the top ten shark-fishing nations for 2007. This ranking was based on elasmobranch catch, but more than half of Argentina’s catch was non-pelagic rays (FAO 2009).
Factory trawlers are known to operate in Chile, but information on shark bycatch or mitigation measures was not identified in the literature. Chile has recently introduced legislation to ban bottom trawling techniques on sea mounts and other sensitive environments.
Argentina has adopted a range of measures to manage shark populations. Argentina has prohibited finning; adopted best practices for the handling of sharks (e.g. release of specimens larger than 1.6 m; banning the use of gaffs); set a maximum shark/ray bycatch of 40%; closed nursery areas; and closed areas to recreational fishing. Argentina has increased the number of shark species recorded by fishers from five in 2003 to 19 in 2009 (Sanchez 2010 cited in Lack and Sant, 2011).
Key point: Information on shark bycatch or mitigation measures was not identified in literature describing South American fisheries.
3.4.6 Atlantic Ocean
Shark numbers for all recorded species from the north-west Atlantic, with the exception of makos, were estimated to have declined by more than 50% in a 15 year period (Baum et al. 2003). Pelagic sharks are caught in a variety of gear in this region, including longlines, gillnets, hand lines, rod and reel, trawls, trolls,

125
and harpoons. FAO have reported that chondrichthyan landings in the Atlantic declined steadily from a high of 343,428t in 1997 to a low of 278,685t in 2006, and then rose in 2007 to 296,150t (FAO 2009). About 15% of the 2007 Atlantic landings by weight were identified as pelagic sharks and rays but species-specific reporting remains notoriously poor. Most pelagic elasmobranch landings from the Atlantic and Mediterranean are taken in multispecies fisheries primarily targeting tunas and swordfish.
In some regions of the Atlantic and Mediterranean, pelagic sharks have been targeted for decades. The best documented are those for Porbeagle shark, whose meat is highly prized. Despite evidence of population collapse, directed fishing for Porbeagle sharks continues in the Atlantic and in 2007, France, Spain, and Canada reported Porbeagle landings of 356t, 275t and 94t, respectively (Camhi et al. 2009).
Key point: Information on shark bycatch or mitigation measures was not identified in literature describing Atlantic Ocean fisheries.
3.4.7 Indian Ocean
The Indian Ocean borders on the top two shark-fishing nations in the world, Indonesia and India, which together have accounted for 22% of the total FAO-reported chondrichthyan global landings since 2000, and almost 26% of the 2007 landings from all oceans (FAO 2009 cited in Camhi et al. 2009). Sharks are taken as bycatch in trawl and gillnet fisheries in India, with trawl nets accounting for 60% of shark landings (Lack and Sant 2011).
Reported elasmobranch landings from the Indian Ocean have been increasing, but record-keeping by fishing vessels in the region has been extremely poor or inaccurate (e.g. finned sharks are not recorded in logbooks), and catches are rarely reported to species. The majority of shark bycatch in this ocean basin is taken by longline and gillnet methods (Camhi et al. 2009).
Other than the domestic Indian fleet, information on pelagic mid-water trawl fisheries was not identified in the Indian Ocean during this review.
Key point: There was no evidence of mitigation measures for reducing shark bycatch identified in Indian Ocean pelagic trawl fisheries.
3.4.8 New Zealand
In New Zealand, Basking sharks have been recorded as bycatch in trawl and set net fisheries (Francis & Duffy 2002 cited in Francis and Sutton 2012; Francis & Smith 2010). A strong and highly significant association was found between the numbers of Basking sharks caught and vessel nationality in three fishery areas. This was due to relatively large numbers of sharks being caught by Japanese vessels in the late 1980s and early 1990s. Other variables examined were not correlated with shark catch rates. Reasons for the high catch rates of Basking sharks by Japanese trawlers are unknown, but may relate to targeting of the sharks for their liver oil, or a high abundance of sharks in the late 1980s and early 1990s (Francis and Sutton 2012).
There are other shark bycatch species in New Zealand, such as the White shark, which may overlap in range with the SPF. White sharks from the East Coast Australia are known to migrate to New Zealand across the Tasman Sea (SEWPaC 2013e). New Zealand has a range of trawl fisheries and there may be mitigation measures employed in their trawl fisheries that would be applicable for pelagic trawling in the SPF. Additional communication or consultation with New Zealand fisheries agencies is recommended as there may be additional information on mitigation measures that was not identified in this review.
126
Key point: New Zealand has had issues with bycatch of Basking shark in trawl fisheries, particularly the capture of multiple specimens from individual net tows. Bycatch measures employed in New Zealand trawl fisheries may be useful in the SPF.
3.5 Australian interactions between sharks and trawl fisheries In Australia, most sharks can be legally caught by commercial and recreational fishers. However, it is illegal to interact with species listed as 'threatened' under the EPBC Act 1999. Actions that kill, injure, take, trade, keep, or move any member of a listed threatened species on Australian Government land or in Commonwealth waters are prohibited without a permit.
3.5.1 Spatial overlap between shark distribution and fishing zones of the Small Pelagic Fishery
Of the nine species identified as having distributions that overlap with the SPF, only four were identified as being at risk of interacting with fishing vessels: White shark, Basking shark, Shortfin Mako shark, and Porbeagle shark.
There was one interactions with a White shark in the SPF during 2009 (Tuck et al. 2013), but since the commencement of the 2009 Bycatch and Discarding Workplan for the SPF (AFMA 2011) there has not been any further interactions with protected shark species. The potential for interactions between the SPF and the three TEP shark species that overlap with the fishery (White shark [Carcharodon carcharias], Grey Nurse shark [Carcharias taurus], Whale shark [Rhincodon typus]) were assessed as low risk (AFMA 2010).
3.6 What is the result of interactions between sharks and trawl gear / fishing operations
Actual total fishing mortality of sharks in trawl gear includes the reported (landed) and unreported catch and other unaccounted, collateral deaths due to (i) avoiding, (ii) escaping, (iii) dropping out of the gear during fishing, (iv) discarding from the vessel, (v) ghost fishing of lost gear, (vi) habitat destruction or subsequent (vii) predation and (viii) infection from any of the above. Actual total fishing mortality is impossible to record and is difficult to estimate. The inherent poor selectivity of many towed gears, combined with their broad spatial deployment, means that there is considerable potential for cumulative effects of (i)–(viii) listed above on total fishing mortality, and subsequent wide-scale negative impacts on stocks of important species (Broadhurst et al. 2006).
Delayed effects of fisheries capture on the physiology and condition of sharks are poorly understood. Information on the post-release fate of sharks that have been incidentally captured and handled prior to release is important because such information can influence mitigation choices and improve the accuracy of risk assessments for shark species. By-catch is often substantial during commercial trawling operations, and fish are exposed to a multitude of different stressful stimuli during trawl capture (Frick et al. 2010; Mandelman and Farrington 2007). Extended periods of air exposure (>10 min) following a capture event may increase the physiological stress of being captured. Trawl capture may lead to significant immediate and delayed mortality in gummy sharks, and extended air exposure on deck may further exacerbate the deleterious effects of capture stress (Frick et al. 2010).
The survival rate of elasmobranchs caught as bycatch in prawn trawls was investigated by Stobutzki et al. (2002). Whether an individual was alive or dead when landed on the deck was recorded for 847 animals. Overall 56% were dead after capture in the trawl and 44% were alive. The authors also investigated the impact of TEDs on the composition and size of shark bycatch. Both sharks and rays taken as bycatch were significantly smaller in nets with a codend fitted with a TED. The length frequency of the sharks and rays

127
caught in the nets with TEDs showed a lower proportion of the larger individuals (Figure 3 in Stobutzki et al. 2002).
It may be more cost effective for trawlers to avoid bycatch that damages their primary catch. For example, in a South African fishery, the offshore commercial fleet actively avoids areas of high numbers of ‘trash fish’ species such as dogfish (Squalus megalops), because the rough skin and spines of dogfish damage the target species and wastes trawling and factory time (Kroese 1998).
There is some evidence that large sharks can escape from trawl nets but the efficacy of this has not been tested. TEDs generally have an opening in the top of the net of a particular diameter and if the shark cannot fit through it will remain trapped in the net. Consequently, some bycatch reduction devices may be selective for a particular size of bycatch (i.e. small species pass through to the codend, whilst larger species are too big to exit via escape hatches. Large catches of target species (or other) may block the escape opening as well, rendering the TED useless for all species.
Key points: Survivorship of sharks that are caught in trawl nets is affected by a range of factors that are likely to be fishery specific. Some bycatch mitigation for other species (such as turtles) also works for sharks, but empirical testing has been fishery specific.
3.6.1 Impact of trawling on survivorship of shark bycatch
To estimate the short-term bycatch discard mortality of otter trawl captured spiny dogfish (Squalus acanthias) individuals caught by a Northwest Atlantic commercial bottom-trawl vessel using 45–60 min tows were held in held in pens for 72-h trials in lieu of being released. Mortality rates were compared to those in minimally stressed hook-and-line (control) dogfish subjected to the same protocols. Of the factors that could potentially correlate to 72 h mortality (tow-weight, tow-duration, gender composition, dogfish-size and coefficient of variation of size), only estimated tow-weight was significantly correlated with mortality. This factor explained 67% of the variation in 72 h mortality. The duration of a trawl was not a significant predictor of its estimated catch-weight. This indicates that as tows become more heavily packed, potentially fatal damage inflicted on this species can heighten quickly. Spiny dogfish discard mortality is thus postulated as more commensurate with current estimations for otter trawling when tows are heavily packed (Mandelman and Farrington 2007).
3.6.2 Effect of discards on shark behaviour
Discards from fisheries that affect the amount of food available to scavengers may have an effect on certain components of the ecosystem. In the Northern Prawn fishery 95% of the bycatch is discarded, and most of it is dead. About half of the discards float and are scavenged by birds, dolphins, and sharks (Stevens et al. 2000). The other half sinks and is preyed upon by sharks in mid-water and teleosts, sharks, and crustaceans on the bottom. Sharks and dolphins were the most common scavengers of floating discards at night, while birds scavenged only during the day. In a nearby area that had not been trawled for 8 years, no dolphins and fewer birds were seen, but there were more sharks (Hill and Wassenberg, 1990 cited in Stevens et al. 2000). Scavenging or opportunistic shark species may learn to associate trawlers with food and their populations may benefit from feeding on discards (Stevens et al. 2000).
Comparing survey results before and after 20 years of prawn trawling, Harris and Poiner (1991) noted a slight increase in abundance of carcharhinid sharks. They suggested that the disposal of by-catch might be an important factor in explaining this increase; although they noted that cessation of foreign gillnetting in the area may also have contributed to an increase in numbers (cited in Stevens et al. 2000).
Key point: Discards of offal and other bycatch is known to attract scavengers, including sharks.

128
3.6.3 Regional differences in the groups impacted by trawl fisheries
There are differences in the behaviour of shark species that are likely to influence the potential for interactions with the SPF. For example, Whale sharks and Longfin Mako sharks have relatively tropical distributions, whereas Basking shark, White shark, Shortfin Mako shark, and Porbeagle shark are more temperate. Although water temperature may limit the southern extent of some species, the migratory patterns of most sharks are poorly understood.
Habitat suitability of Whale shark in the Indian Ocean is mainly correlated with spatial variation in sea surface temperature (SST) (Sequeira et al. 2012). The relative influence of SST provides a basis for predicting habitat suitability in the open ocean, possibly giving insights into the migratory behaviour of the Whale sharks. These results also provide a baseline for temperature-dependent predictions of distributional changes in the future. Despite average temperatures ranging between 23 and 34⁰C, around 65% of the whale shark sightings occurred between just 27.5 and 29 ⁰C, and 90% occurred between 26.5 and 30⁰C (Sequeira et al. 2012).
The ranging patterns of some sharks are being tracked with acoustic tags. The Western Australia Department of Fisheries has established a network of acoustic receivers throughout Perth metropolitan waters to collect data relating to localised movements and numbers of white sharks that have been tagged with acoustic transmitters through various research projects around Australia (CMS 2011). While data collected from this Shark Monitoring Network project is initially intended to inform public safety agencies on risks associated with shark attacks, the project should provide additional information on migratory patterns, population distribution and possibly relative abundance of this species (CMS 2011).
Within Australia there is important research being conducted that may assist in assessing the risk of shark interactions with the SPF. Barry Bruce (CSIRO) has done VHF tracking of white sharks in SA, particularly around the Neptune Islands and Dangerous Reef which are within the fishing area of the SPF.
IMOS is also gathering lots of data on sharks for their oceanographic data collection – they are using tagged sharks and other marine species to collect data for them on Australia’s oceanography and biologists also receive the data on species, such as spatial and temporal movements. Charlie Huveneers would be an important contact for discussing this work.
http://www.imos.org.au/
http://www.sardi.sa.gov.au/__data/assets/pdf_file/0020/125912/Huveneers_Charlie.pdf
Tracking of Basking sharks in the United States using satellite-based technology revealed that basking sharks travel from the coast of southern New England to the Bahamas, the Caribbean Sea and to the coast of South America, swimming at depths of 600 to 3,000 feet or 200 to 1,000 meters for several weeks or months (Skomal et al. 2009). The research is significant because the species has undergone population declines in recent years, and scientists will now have a better understanding of its habitat. Similar tracking studies may be useful for identifying habitat usage and migratory patterns for Basking sharks in Australian waters.
Given the paucity of information on the distribution of threatened shark species, it is paramount that data collected from acoustic tracking studies be made available to fisheries managers. Threatened species risk assessments should be revisited once new data becomes available.
Key point: Water temperature can influence the habitat usage and migration patterns of some species (e.g. Whale shark). As additional information on shark distribution becomes available (such as through tagging studies), it may be useful for refining risk assessments of the chance of interactions between large pelagic sharks and trawl fisheries.

129
3.7 Shark bycatch mitigation devices/measures and their effectiveness Numerous bycatch reduction devices (BRDs) have been developed to increase the selectivity of trawl fisheries. These include turtle excluder devices (TEDs), which consist of grid bars fitted into the neck of a trawl net with an opening at either the top or the bottom, allowing large animals to escape through the openings as they strike the grid bars while target species pass through the grids and are subsequently captured in the net. The successful development of such devices has resulted in BRDs and TEDs becoming mandatory in a number of prawn and shrimp fisheries worldwide (Hall and Mainprize 2005). The excluder devices may have an indirect influence on reducing shark bycatch (Brewer et al. 2006; Zollett 2009). For example, Brewer et al. (2006) assessed modified trawls using different combinations of BRDs, including TEDs, during commercial operations in Australia’s northern prawn fishery. Overall, any nets with such modification caught significantly fewer (86 to 94 percent) large shark species (Brewer et al. 2006). For example, TED devices, particularly those with upward excluders, reduced the numbers of larger sharks (those greater than one meter in length) by 86 percent (Brewer et al. 2006). However, more extensive research on the use of excluder devices to reduce shark bycatch is still needed. In addition, the effectiveness of any TED in reducing shark bycatch will be dependent on proper use of the devices and industry collaboration (Godin and Morgan 2011).
3.7.1 Turtle Excluder Device – Northern Prawn Trawl, Australia
In 2001, paired-trawl comparisons were made during prawn trawl operations to assess the effect of TEDs and BRDs on a range of species groups caught in tropical Australia. Nets with employing both in combination reduced the catches of turtles by 99%, seasnakes by 5%, sharks by 17.7%, rays by 36.3%, large sponges by 85.3%, and small bycatch by 8%. However, these results were largely attributable to the influence of the TEDs that reduced the numbers of larger sharks and rays (>1 m) by 86% and 94%, respectively. Upward excluders were more effective for sharks. Despite the introduction of TEDs and BRDs as mitigation measures in 2000, the Northern Prawn Fishery has not significantly reduced catches of small sharks. The authors highlighted other studies that have shown that impacts on small sharks can be reduced by improving the rigging and use of BRD (Brewer et al. 2006).
Key point: Upward-facing excluders were more effective at mitigating shark bycatch. TEDs may not mitigate against bycatch of small sharks because they pass through the space between the bars. Adapting trawl gear may mitigate shark bycatch.
3.7.2 Tunnel excluder and filter grid - Mauritania
The tunnel excluder is a trawl modification that holds promise for releasing large sharks from the net. A filter grid, which allows fish that are too big to pass through the grid and exit through an escape hatch, slopes downward 20 degrees and forces larger non-target species downward to the tunnel entrance. This configuration has shown a 20 to 100 percent reduction in the bycatch of the most vulnerable species, including sharks (Zeeberg et al. 2006). In addition, a 250 by 250 mm shark filter grid has been shown to allow 25 percent of the hammerheads, particularly mature individuals, to escape (Zeeberg et al. 2006).
3.7.3 Turtle excluder – United States
The United States have been investigating Turtle Excluder Device Technology via an evaluation and fisher Outreach program. Sea turtle excluder devices (TEDs) are federally required equipment in most shrimp trawls fished in the Southeast Atlantic and Gulf of Mexico. Some of the testing conducted on prototype TEDs has included assessment of the impact on shark species. Underwater video collected during TED testing revealed that sharks, skates, rays, and sturgeon readily escaped from the trawl through the TED

130
opening without a significant amount of target catch loss observed. Specifically, when assessing the effectiveness of the “Flexible Flat Bar Flynet” TED (FFF-TED), species of sharks, skates, and rays were encountered on an infrequent basis (Gearhart 2010). A comparison of catch rates between TED and control catches revealed that the total weight of shark bycatch was reduced by 35.8% by the TED. Reduction rates for TED equipped catches were much greater during tows with smaller catches. Shark numbers were reduced by 44.3% and the difference between biomass and number reductions indicates that the TED was size selective for shark although no sharks were measured to confirm selectivity; the average individual weight of sharks averaged across tows was less in TED catches at 2.4 kg when compared to the control 3.8 kg. This result suggests that TEDs may allow small sharks into the codend, whilst excluding larger sharks (Gearhart 2010). Notably a basking shark (Cetorhinus maximus) approximately 5 m long was captured in the TED side of the trawl and was observed at the surface escaping out of the TED opening during haul back (Gearhart 2010).
Key point: TEDs can be selective to particular size classes of non-target species, such that large sharks are excluded, whilst small sharks may still enter the codend. Large sharks up to 5 metres long have been observed escaping from TEDs.
3.7.4 Size selection by mitigation devices
The mandatory introduction of TEDs and BRDs into the Northern Prawn Fleet in 2000 has almost fully removed the fishery’s impact on sea turtles and greatly reduced its impact on many of the highest risk sharks and rays. The impact of TEDs on the larger species was demonstrated by separate analyses of large and small sharks and rays (Brewer et al. 2006). A much higher exclusion rate for large sharks and large rays was identified than for smaller individuals, and there was a major change in the exclusion rates of large animals greater than 1m in size. Of the large sharks (>1m long), 86% fewer were caught in nets with TEDs than in nets without TEDs, and of the large rays (>1m wide), 94% fewer were caught in nets with TEDs. For smaller animals the differences were much smaller: only 4.9% fewer small sharks were caught in nets fitted with TEDs than in control nets, and 25% fewer small rays (less than 1m) were caught in nets with TEDs (Brewer et al. 2006).
Stobutzki et al (2002) found that both sharks and rays taken as bycatch were significantly smaller in nets with a codend fitted with a TED. The length frequency of the sharks and rays caught in the nets with TEDs showed a lower proportion of the larger individuals.
A semi-flexible exclusion grid tested in the Pilbara Trawl Fishery (W.A.) reduced the bycatch of turtles, large sharks and large rays (Stephenson et al. 2008). The grid reduced the captured number of sharks with total lengths above 100 cm, with a larger reduction occurring for sharks over 180 cm.
The performance of BRDs could be improved by using them in more effective positions such as closer to the codend catch. The use of may contribute to the long-term conservation of many species, especially endangered sea turtles and vulnerable elasmobranchs. As fishers become more experienced in their use, a fishery’s impact on bycatch will reduce even further (Brewer et al. 2006).
Key point: The positioning of escape hatches and other reduction devices is critical for their success and should be empirically tested prior to full commercial use. Mitigation measures may work more effectively for particular species or types or size of bycatch (e.g. sharks vs rays).
3.7.5 Other research regarding influence of BRDs and TEDS on shark bycatch
Brewer et al. (1996) tested variations of three differently rigged versions of a semi-pelagic Demersal wing trawl in the Northern Fish Trawl Fishery. Whilst catches of the target species were not significantly

131
different, bycatch levels for species that would usually be discarded was lower. This research illustrated that changes in the gear configuration or operation can reduce the level of bycatch, and thus improves the quality of the catch.
The composition and survivability of catches can vary depending on the gear or mitigation device used during mid-water trawls. During a comparison of dogfish sharks caught by two methods - hook and line, and bottom-trawl - a total of 1,084 trawls were examined for elasmobranch bycatch (Mandelman and Farrington 2007). Of the individuals recorded 3,965 were sharks, 3,608 were rays and 33 were sawfish. Most of the individuals caught (64%) were from five species. Compared to the total number of sharks caught in control nets (no TED or BRD), significantly fewer were caught in nets that employed both TEDs and BRDs (17.7%). Nets with only a TED or BRD installed reduced shark bycatch by 13.3% and 16.7%, respectively. The exclusion rate of sharks was higher with upward-excluding TEDs (20.4%) than with downward-excluding TEDs (8.8%) (Mandelman and Farrington 2007).
Key point: Adapting trawl gear configuration or usage may mitigate shark bycatch. TED and BRDs may influence shark bycatch differently.
3.7.6 Novel research and lessons from non-trawl fisheries
Sensory biology - sharks
The link between sensory biology and fisheries bycatch reduction in elasmobranchs was reviewed recently by Jordan et al. (2013). This paper provides an excellent background to shark bycatch, and proposes new directions for research. The review outlines potential sensory signals emitted by various types of fishing gear that elasmobranchs may encounter and introduce potential bycatch reduction modifications to each gear type as topics for future research. Signals including visual (lights), hydrodynamic (water jets), or electric fields could provide an early warning system to benthic elasmobranchs, which may increase reaction time to enable avoidance of approaching gear. The authors acknowledge E. Gilman, C. O’Connell, L. Dagorn, V. Restrepo, E. Stroud, and M. Kobza for insight into on-going research projects and bycatch reduction methods. It may be worthwhile consulting with these researchers.
Predator deterrents
There are likely to be many technical modifications to towed gears and changes to operational and/ or handling procedures that can be developed and implemented to mitigate unwanted fishing mortalities (Broadhurst et al. 2006). Other modifications may include physical, acoustic and electronic deterrents to mitigate the consumption of target species escapees by dolphins, sharks and other large marine predators (and thus the attractiveness of trawl gear to depredation by megafauna). Such devices could be secured to codends, BRDs or other areas of towed gears where most of the prey escape occurs (or where a predator may enter). Although there are few quantitative data available, the evidence of widescale interactions between marine predators and towed gears means that even simple deterrents that discourage predators from interacting with fishing gear may be effective (sensu Broadhurst et al. 2006).
An electrical shark avoidance device was tested in a coastal mid-water trawl fishery in the Sea of Japan in 2004 (Shelley Clarke, pers. obs. in Gilman et al. 2007). The device was thought to deter depredation by sharks on the targeted catch sticking out of the cod end of the trawl during hauling. The device, mounted on the fishing vessel, emitted an electrical pulse into the waters in the immediate vicinity. It was believed by fishermen to be effective based on observations of sharks suddenly moving away from the cod end and the vessel once the electrical pulse was emitted. This example provides a useful illustration of electrical deterrents for sharks but the effectiveness of the device is yet to be fully proven (Gilman et al. 2007). In
132
support of this, Jordan et al. (2013) hypothesised that an electric pulse may alert elasmobranchs to the approaching gear and facilitate escape either below or away from the trawl.
Key paper: Jordan et al. (2013). The reference list from this paper also contains relevant research conducted on mitigation of shark bycatch in fishing methods, including trawl.
Electro-positive metals
The construction of hooks from electro-positive metals that act as magnets was hypothesised as being affective at deterring non-targeted sharks and reducing bycatch. In 2010 a group of researchers undertook field trials in an artisanal pelagic longline fishery based out of Manta, Ecuador (NOAA 2011). The trials involved testing the effectiveness of hooks constructed from a non electro-positive metal called Neodymium/Praseodymium thought to deter sharks from interacting with fishing gear. The open-ocean experiments showed that in eight sets (2,400 hooks in the water), 62.96% of the non-targeted shark species were captured on magnetised hooks, and 37.03% were captured on the control hooks without magnets. These results demonstrate that the magnets have no obvious deterrent effect on the two main shark species caught, the thresher shark (Alopias pelagicus) and the blue shark (Prionace glauca). Electromagnets may work better as a deterrent for certain species of sharks whose Lorenzini ampullae are more sensitive to magnetic fields, but at present there appears to be little evidence to demonstrate the potential to utilize electropositive metals on a commercial scale for bycatch reduction of sharks.
Key point: There is no evidence that fishing gear constructed from electro-positive materials repels sharks.
3.8 National guidelines for mitigating shark bycatch The Australian Fisheries Management Authority (AFMA) has been conducting ecological risk assessments (ERAs) for the fisheries under its jurisdiction. These assessments take numerous biological factors into account and give an indication of which species are at high risk from fishing in each fishery. In order to address and mitigate the risks to chondrichthyans identified as ‘high risk’ in this process, AFMA convened the Chondrichthyan Technical Working Group (CTWG).
The options for mitigation of shark bycatch were discussed at a meeting of the CTWG. This expert panel provided scientifically-based advice to assist with the development of cost effective mitigation measures to reduce the risk to chondrichthyans from interactions with Commonwealth managed fisheries, subsequently published as the ‘Chondrichthyan guide for fisheries managers: A practical guide for mitigating chondrichthyan bycatch’ (Patterson and Tudman 2009).
The CTWG concluded that there is no panacea for the problem of chondrichthyan bycatch in marine fisheries, but that the guide will provide managers with the most appropriate options to mitigate fisheries impacts and improve the survival of chondrichthyan species. Indeed, it was noted that addressing chondrichthyan bycatch is a problem for fisheries management agencies worldwide. It was also noted that what is successful for one fishery may not be suitable for another, and that managers will have to weigh their options and work with industry and other stakeholders to determine which is best for each fishery. In many cases practical changes in the way fishing is conducted are required to improve the survivorship of these important animals (Patterson and Tudman 2009).
Australia’s second National Plan of Action for the Conservation and Management of Sharks 2012 (also known as Shark-plan 2) outlines Australia’s approach to achieving the conservation and management of sharks and their long-term sustainable use. The Shark-plan provides guidance to fisheries and conservation managers and the public to improve conservation and management of sharks, and details actions to encourage the effective and sustainable management of Australia’s shark populations (DAFF 2013).

133
3.9 Are there organisations working on mitigation? The following list of organisations or individuals (in no particular order) are those that may be useful to contact for more information, but it is not comprehensive. There may be other researchers or groups working on shark mitigation but they were not identified in this review.
Department of Conservation – New Zealand
MIT-4 Basking shark mitigation: detection and avoidance
Objective: To identify and develop mitigation strategies to minimise the capture of basking sharks by demersal trawl vessels.
The basking shark population status in New Zealand is poorly understood, though populations are likely to be susceptible to fisheries impacts, and considerable catch/bycatch has been reported. This project aims to investigate ways that basking sharks may be identified during fishing operations (e.g. on sonar) and provide potential protocols to actively modify fishing operations to avoid or minimise bycatch. It is envisaged this project will consist of one or more expert workshops and possible collection of observational data of fishing practices through observer programmes, and recommendations to on suitable and effective mitigation strategies that can be developed in this fishery.
The PEW Environment Group
Pew Environment Group released a global scientific review that showed simple changes in fishing gear could significantly reduce the large number of sharks unintentionally caught in the world’s oceans. The paper, “Fisheries Bycatch of Sharks: Options for Mitigation”, outlines practical options for reducing shark injury and death from commercial fishing, a leading cause of shark population decline. There is a section on trawl gear that may be useful when considering shark bycatch in the SPF.
Project GloBAL (Global Bycatch Assessment of Long-lived Species)
This project was a joint venture between Duke University and Blue Ocean Institute. The aim is to characterize the bycatch of marine mammals, seabirds, and sea turtles by synthesizing existing information about bycatch from various sources and across different geographic regions. Project GloBAL are analyzing bycatch information to 1) quantify spatial and temporal trends in bycatch using a cross-taxa, cross-gear approach, 2) identify oceanographic processes associated with high-risk areas of bycatch, and 3) assess population-level impacts of bycatch on long-lived marine vertebrates. This group are not specifically related to sharks, but they are likely to have data that may be useful.
http://bycatch.nicholas.duke.edu/Collaborators/bycatch-bibliography
Centre for Research-based Innovation in Sustainable Fishing and Pre-processing technology (CRISP)
CRISP brings together world-leading Norwegian companies that supply fishery technology and marine products and scientific research institutions in a virtual centre. CRISP draws upon the expertise and experience of Norwegian fishing companies to solve bycatch related issues, including the modification of existing nets, design and testing of bycatch reduction devices, and communication with fisherman.
http://www.imr.no/crisp/a_crisp_approach_to_sustainable_fish_capture/en
Marine Stewardship Council (MSC)
The MSC's fishery certification program and seafood ecolabel recognise and reward sustainable fishing. They are a global organisation working with fisheries, seafood companies, scientists, conservation groups and the public to promote the best environmental choice in seafood. There are pelagic freezer trawler fisheries that have been certified under MSC and they are required to address bycatch issues as part of the
134
accreditation process. There may be shark bycatch mitigation measures employed in MSC certified fisheries, but information on the website is limited and this should be investigated further.
http://www.msc.org/documents/fisheries-factsheets
Australia and other relevant experts
Within Australia there is important research being conducted that may assist in assessing the risk of shark interactions with the SPF. Barry Bruce (CSIRO) has done VHF tracking of white sharks in SA, particularly around the Neptune Islands and dangerous reef where White sharks are commonly sighted, and is a region within the fishing area of the SPF. We have assumed that this information is readily available to certain members of the Expert panel.
IMOS is also gathering lots of data on sharks for their oceanographic data collection – they are using tagged sharks and other marine species to collect data for them on Australia’s oceanography and biologists also receive the data on species, such as spatial and temporal movements. Charlie Huveneers would be an important contact for discussing this work.
http://www.imos.org.au/
http://www.sardi.sa.gov.au/__data/assets/pdf_file/0020/125912/Huveneers_Charlie.pdf
Matt Broadhurst has several papers detailing trawl gear modifications and estimating mortality from towed gear. He is currently Senior Principal Research Scientist, Fisheries and Ecosystems Research, Wild Fisheries, DPI NSW. http://www.dpi.nsw.gov.au/research/staff/matt-broadhurst
Laura Jordan and colleagues recently (2013) published a review titled “Linking sensory biology and fisheries bycatch reduction in elasmobranch fishes: a review with new directions for research”. Laura is based at Department of Ecology and Evolutionary Biology, University of California, Los Angeles, Los Angeles, California, USA.
3.9.1 Success stories?
There were no ‘success stories’ identified per se. The demand for shark fins and other elasmobranch products is high and growing in some markets, resulting in disincentives to research, mandate, employ, and enforce the use of methods to minimize elasmobranch bycatch. Some countries are working hard within their own fisheries (e.g. United States, Australia, New Zealand), but factory trawlers often operate in countries that do not have the resources to set limits for ensuring a sustainable catch of target species or bycatch, or outside the EEZ of a country and thereby not affected by the regulations.
One effective way of testing gear modifications is with a pair-trawl, whereby gear modifications and controls can be tested side by side, including target catch data (Gearhart, 2010).
Refer to section 1.7.3 for a review of mitigation devices that may have indirect benefits for shark bycatch in trawl fisheries.
3.10 Suggested areas of research to address gaps in knowledge There is some indication that the bycatch of sharks is less of a problem in pelagic mid-water trawl fisheries than for other gear types (longline, gillnet, Demersal trawl), although this should be considered with some caution. Where species overlap spacially and temporally with trawl fisheries, it is likely that interactions will occur. The United States invests large amounts of resources and time into studying bycatch within their fishing fleets. In a recent review of bycatch in 49 United States fisheries, seven trawl fisheries were assessed and did not highlight sharks as a bycatch issue (Zollett 2009).
135
Over-fishing, including excessive mortality from bycatch, is the largest threat to elasmobranch populations. According to the IUCN, of the 563 elasmobranch species not considered data deficient, 55% are categorized as threatened or near threatened (IUCN Redlist). Concern over depleted elasmobranch populations and waste associated with bycatch has led to a surge in bycatch reduction-related research, however it is not possible to research every species, so Jordan et al. (2013) highlighted some important areas as follows:
• Behavioural observations of elasmobranchs prior to and during capture are needed in order to suggest promising techniques for minimizing vulnerability to fishing gear. Few studies have directly or indirectly investigated elasmobranch behaviour around fishing gear.
• Research that integrates the sensory biology and behavioural characteristics of elasmobranch species can help to improve gear selectivity, support more effective fisheries management, and facilitate recovery of threatened species.
• Technology for video or sonar surveillance of trawling and other fishing operations is an important tool for understanding when and how various species, including elasmobranchs, react to approaching gear. Use of this technology should accompany catch data as new bycatch reduction methods are tested for a more complete understanding of how gear modifications and deterrents influence the behaviour of both target and non-target species.
• Adopting an integrative approach, including modelling, laboratory, and field tests to understand consequences of gear alterations on both target and non-target species.
• Need for greater collaboration among researchers studying bycatch reduction of different taxonomic groups.
• When testing gear modifications in the field, recording detailed species-specific catch data is vital to the overall goal of bycatch mitigation. Many bycatch reduction studies focusing on other taxa list elasmobranchs among the catch, yet do not include detailed analyses of the effects of gear modifications on elasmobranch catch rate and/or mortality. This missing information could provide valuable insights into types of modifications that influence elasmobranch vulnerability to fishing gear. Also, greater collaboration among scientists should streamline efforts to develop technologies that reduce bycatch of all non-target species, rather than decreasing the catch of one species or group while increasing the catch of another.
• Any of the proposed bycatch mitigation methods will be likely to meet with less resistance from the fishing community if their benefits (such as increased or unaffected target catch and/or decreased depredation and gear damage) outweigh their costs in terms of materials and time spent modifying gear.
Trends in shark bycatch research were investigated recently by Molina and Cooke (2012). The authors provide a list of what they regard as critical research needs as well as a rationale and discussion of how these research needs could be addressed. Relevant research suggested by them included:
• Need for studies that combine approaches (e.g., field, lab and modeling)
• Need for experimental studies on shark repellents or other aspects of sensory physiology relevant to shark bycatch reduction
• Need for studies that explore the handling component of bycatch
• Need to examine the condition and fate of sharks that are discarded
• Need for research that covers more regions, fisheries (gear types), and species

136
• Need for human dimensions studies related to shark bycatch
In summary, research that integrates the sensory biology and behavioural characteristics of elasmobranch species can help to improve gear selectivity, support more effective fisheries management, and facilitate recovery of threatened species.
3.11 Conclusion In the SPF a white shark was captured using mid-water trawl gear in 2009 (Tuck et al. 2013). Additional detail on how, where and when this shark was captured was not identified, but may be helpful when assessing the risk posed to shark species by mid-water trawling by a factory trawler.
There is some indication that the bycatch of sharks is less of a problem in pelagic mid-water trawl fisheries than for other gear types (longline, gillnet, Demersal trawl), although there is a paucity of information on shark interactions with mid-water trawl fisheries generally.
The majority of information regarding shark bycatch in trawl fisheries describes reduction of shark bycatch when researching and implementing BRDs, including SEDs and TEDs. Whilst these devices were designed to mitigate seals and turtles, they also reduced the bycatch of sharks, particularly larger sharks. This may be important in a fishery like the SPF where larger pelagic sharks have been encountered.
Bycatch in longline fisheries has been the focus of recent efforts to reduce catches of megafauna such as cetaceans, seals, turtles and sharks. This has somewhat overshadowed bycatch issues in trawl fisheries, although there has been considerable work done in Demersal trawl fisheries. Demersal fisheries are indiscriminate and catch a more diverse range of species, whereas pelagic mid-water trawls are more selective because they do not make contact with the ocean floor. It is unlikely that gear modifications that are effective in the Demersal trawl fisheries will be applicable to pelagic trawl nets, especially those towed by factory trawlers.

137
3.12 Limitations Consultation with scientific experts was not part of the project scope. This limited the ability of the consultants to properly identify and contact Research Groups currently working on bycatch mitigation globally.
The majority of published data identified in this review often pooled bycatch data across trawl fleets and did not single out factory-freezer large pelagic trawlers to maximise comparison leading to a lack of information specific to large factory trawlers. Also, statistics regarding interactions with fishing vessels and bycatch are reported in a range of different formats which created difficulties when consolidating the data into a table for easy assessment and comparison. The search and compilation of data on interactions of with trawl fisheries should be the focus of additional works.
To source factory-trawl specific data relating to shark bycatch, a separate project would be required that involves contacting relevant experts and industry groups for the data. This is a time-consuming process that was outside the scope for this review.
There was limited literature regarding interactions between threatened species with trawl fisheries globally and in Australia. This may be because there are limited interactions but there is insufficient data to draw that conclusion. Access to fisheries data for observer programs and logbook records would be required to determine level of interaction in Australia.
Almost all of the published data identified in this review stem from studies undertaken on small to medium sized trawl vessels and trawl fleets. We were unable to locate any studies on carried out on factory-freezer or large pelagic trawlers (except for Zeeberg et al. 2006). As a consequence, mitigation measures and approaches identified as suitable elsewhere will need to be specifically tested to ascertain their efficacy when applied to large factory trawlers.

138
3.13 References (Sharks) Australian Fisheries Management Authority (AFMA) 2010. Ecological Risk Management Report for the Mid-water trawl sector of the Small Pelagic Fishery. Australian Fisheries Management Authority.
Australian Fisheries Management Authority (AFMA) (2009). The School Shark Rebuilding Strategy 2008. Canberra: AFMA. Available from: http://www.afma.gov.au/wp-content/uploads/2010/07/school_shark_rebuild.pdf.
Australian Fisheries Management Authority (AFMA) (2011). Small Pelagic Fishery: Bycatch and discarding workplan 2011 – 2013. URL accessed on 31st May 2013 from http://web-test.afma.gov.au/wp-content/uploads/2010/07/SPF-Bycatch-Discarding-Workplan-2011-2013.pdf
Baum, J.K, Myers, R. A., Kehler, D. G., Worm, B., Harley, S. J., and Doherty, P. A. (2003). Collapse and Conservation of Shark Populations in the Northwest Atlantic. Science, 299: 389.
Blaber, S.J.M., Dichmont, C.M., White, W., Buckworth, R., Sadiyah, L., Iskandar, B., Nurhakim, S., Pillans, R. and Andamari, R. (2009) Elasmobranchs in southern Indonesian fisheries: the fisheries, the status of the stocks and management options. Rev Fish Biol Fisheries 19:367–391
Bonfil, R., M. Meÿer, M.C. Scholl, R. Johnson, S. O'Brien, H. Oosthuizen, S. Swanson, D. Kotze & M. Paterson (2005). Transoceanic Migration, Spatial Dynamics, and Population Linkages of White Sharks. Science. 310:100 – 103. Available from: http://www.sciencemag.org/cgi/content/abstract/sci310/5745/100.
Bradai M.N., Saidi B. and Enajjar S. (2012). Elasmobranchs of the Mediterranean and Black sea: status, ecology and biology. Bibliographic analysis. Studies and Reviews. General Fisheries Commission for the Mediterranean. No. 91. Rome, FAO. 2012. 103 pp.
Bradford, R. W., Bruce, B. D., McAuley, R. B. and Robinson, G. (2011). An evaluation of passive acoustic monitoring using satellite communication technology for near real-time detection of tagged animals in a marine setting. The Open Fish Science Journal 4: 10–20.
Brewer, D.T., Eayrs, S., Mounsey, R.P. and Wang, Y.-G. (1996). Assessment of an environmentally friendly, semi-pelagic fish trawl. Fisheries Research. 26, 225–237.
Brewer, D., Heales, D., Milton, D., Dell, Q., Fry, G., Venables, B. and Jones, P. (2006). The impact of turtle excluder devices and bycatch reduction devices on diverse tropical marine communities in Australia’s northern prawn trawl fishery. Fisheries Research, 81: 176-188.
Broadhurst, M.K., Suuronen, P. And Hulme, A. (2006). Estimating collateral mortality from towed fishing gear. Fish and Fisheries, 7, 180-218.
Bruce, B. D. (2008). White sharks: the biology and ecology of Carcharodon carcharias. In E. Pikitch and M. Camhi (eds) Sharks of the Open Ocean. Blackwell Scientific. pp 69–81.
Bruce, B. D. and Bradford, R. W. (2008). Spatial dynamics and habitat preferences of juvenile white sharks – identifying critical habitat and options for monitoring recruitment. Final Report to The Department of Water, Heritage and the Arts. CSIRO Marine & Atmospheric Research, Hobart. 75 pp.
Bruce, B. D. and Bradford, R. W. (2011) Near-shore habitat use by white sharks in coastal waters off Port Stephens. CSIRO Marine and Atmospheric Research.
Bruce, G.D., J.D. Stevens & H. Malcolm (2006). Movements and swimming behaiour of white sharks (Carcharodon carcharias) in Australian waters. Marine Biology. 150:161-172.
http://web-test.afma.gov.au/wp-content/uploads/2010/07/SPF-Bycatch-Discarding-Workplan-2011-2013.pdf
139
Camhi, M.D., Valenti, S.V., Fordham, S.V., Fowler, S.L., and Gibson, C. (2009). The Conservation Status of Pelagic Sharks and Rays: Report of the IUCN Shark Specialist Group Pelagic Shark Red List Workshop. IUCN Species Survival Commission Shark Specialist Group, Newbury, UK, 78 pp.
Campana, S.E., Joyce, W. and Fowler, M. (2010), Subtropical pupping ground for a cold-water shark, Canadian Journal of Fisheries and Aquatic Sciences, vol. 67, pp. 769–773.
Cardno Ecology Lab (2010). Development and Implementation of a Population Estimation Protocol to Provide an Estimate of East Coast Population Numbers for Grey Nurse Sharks (Carcharias taurus). Prepared for Department of the Environment, Water, Heritage and the Arts.
Chidlow, J., Gaughan, D. and McAuley, R. (2006). Identification of Western Australian Grey Nurse Shark Aggregation Sites. Fisheries Research Report Number 155. Western Australia: Department of Fisheries.
Colman, J. G. (1997). A review of the biology and ecology of the whale shark. Journal of Fish Biology 51, 1219–1234.
Compagno, L.J.V. (1984). Part 1 - Hexanchiformes to Lamniformes. FAO Species Catalogue, Vol. 4., Sharks of the World. An Annotated and Illustrated Catalogue of Sharks Known to Date. FAO Fisheries Synopsis. 4(1):1-249.
Convention on the Conservation of Migratory Species of Wild Animals (CMS) (2011). National report of parties on the implementation of the convention on the conservation of migratory species of wild animals. UNEP/CMS/Inf.10.12.70
Compagno, L.J.V. (1984). Part 1 - Hexanchiformes to Lamniformes. FAO Species Catalogue, Vol. 4., Sharks of the World. An Annotated and Illustrated Catalogue of Sharks Known to Date. FAO Fisheries Synopsis. 4(1):1-249.
Crespo, E.A., Pedraza, S.N., Dans, S.L., Alonso, M.K., Reyes, L.M., Garcia, N.A., Coscarella, M. and Schiavini, A.C.M. (1997). Direct and indirect effects of the highseas fisheries on the marine mammal populations in the northern and central Patagonian coast. Journal of Northwest Atlantic Fishery Science, 22: 189-207.
Daley, R., Dowdney, J., Bulman, C., Sporcic, M., Fuller, M., Ling, S. and Hobday, A. (2007). Ecological Risk Assessment for the Effects of Fishing. Report for the midwater trawl sub-fishery of the Small Pelagic Fishery. Report for the Australian Fisheries Management Authority. Canberra, Australia. URL accessed on 27th May 2013: http://www.afma.gov.au/wp-content/uploads/2010/06/era_spf_mt.pdf
Dans, S., L., Alonso, M.K., Crespo, E.A., Pedraza, S.N. and Garcia, N.A. (2003). Interactions between marine mammals and high seas fisheries in Patagonia: An intergrated approach. In Marine Mammals. Fisheries, Tourism and Management Issues (N.J. Gales , M. Hindell and R. Kirkwood, eds), pp. 100-115. Melbourne: CSIRO Publishing.
Department of Agriculture Fisheries and Forestry (DAFF) (2013). National Plan of Action for the Conservation and Management of Sharks 2012 - Shark-plan 2. URL accessed on 27th May 2013: www.daff.gov.au/sharkplan2.
Department of the Environment and Heritage (DEH) (2005). Whale Shark (Rhincodon typus) Recovery Plan: Issues Paper. DEH, Canberra. URL accessed on 28th May 2013 from: http://www.environment.gov.au/biodiversity/threatened/publications/recovery/r-typus-issues/pubs/r-typus-issues-paper.pdf.
Department of the Enviroment, Water, Heritage and the Arts (DEWHA) (2009). White Shark Issues Paper. [Online]. Canberra, ACT: Australian Government. Available

140
from: http://www.environment.gov.au/biodiversity/threatened/publications/recovery/pubs/white-shark-issues-paper.pdf.
Department of Sustainability, Environment, Water, Population and Communities (SEWPaC) (2013a). Sharks in Australian Waters. URL accessed on 27th May 2013: http://www.environment.gov.au/coasts/species/sharks/index.html
Department of Sustainability, Environment, Water, Population and Communities (SEWPaC) (2013b). Carcharias taurus (East Coast Population) in Species Profile and Threats Database, Department of Sustainability, Environment, Water, Population and Communities, Canberra. URL accessed Sat, 1 Jun 2013: http://www.environment.gov.au/cgi-bin/sprat/public/publicspecies.pl?taxon_id=68751
Department of Sustainability, Environment, Water, Population and Communities (2013c). Carcharias taurus (West Coast Population) in Species Profile and Threats Database, Department of Sustainability, Environment, Water, Population and Communities, Canberra. URL accessed Sat, 1 Jun 2013: http://www.environment.gov.au/cgi-bin/sprat/public/publicspecies.pl?taxon_id=68752
Department of Sustainability, Environment, Water, Population and Communities (SEWPaC) (2013d). Rhincodon typus in Species Profile and Threats Database, Department of Sustainability, Environment, Water, Population and Communities, Canberra. URL accessed 30 May 2013: http://www.environment.gov.au/cgi-bin/sprat/public/publicspecies.pl?taxon_id=66680
Department of Sustainability, Environment, Water, Population and Communities (SEWPaC) (2013e). Carcharodon carcharias in Species Profile and Threats Database, Department of Sustainability, Environment, Water, Population and Communities, Canberra. URL accessed Sat, 1 Jun 2013: http://www.environment.gov.au/cgi-bin/sprat/public/publicspecies.pl?taxon_id=64470
Department of Sustainability, Environment, Water, Population and Communities (SEWPaC) (2013f). Finalised priority assessment lists. URL accessed on 27th May 2013: http://www.environment.gov.au/biodiversity/threatened/pubs/fpal-current.pdf
Department of Sustainability, Environment, Water, Population and Communities (SEWPaC) (2012a). Species group report card—sharks. Supporting the marine bioregional plan for the Temperate East Marine Region. URL accessed on 28th May 2013: http://www.environment.gov.au/coasts/marineplans/temperate-east/pubs/temperate-east-report-card-sharks.pdf
Department of Sustainability, Environment, Water, Population and Communities (SEWPaC) (2012b). Species group report card—sharks. Supporting the marine bioregional plan for the South-west Marine Region. URL accessed on 28th May 2013: http://www.environment.gov.au/coasts/marineplans/south-west/pubs/south-west-report-card-sharks.pdf
Ferretti, F., Myers, R.A., Serena, F. and Lotze, H.K. (2008). Loss of large predatory sharks from the Mediterranean Sea. Conservation Biology 22: 952-964.
Food and Agriculture Organization (FAO) (2009). Report of the technical workshop on the status, limitations, and opportunities for improving the monitoring of shark fisheries and trade. FAO Fisheries and Aquaculture Report No. 897.
Fowler, S.L. (2005). Cetorhinus maximus. In: IUCN 2012. IUCN Red List of Threatened Species. Version 2012.2. <www.iucnredlist.org>. Downloaded on 28 May 2013.
Francis, M.P. and Smith, M.H. (2010). Basking shark (Cetorhinus maximus) bycatch in New Zealand fisheries, 1994–95 to 2007–08. New Zealand Aquatic Environment and Biodiversity Report No. 49.

141
Francis, M.P. and Sutton, P. (2012). Possible factors affecting bycatch of basking sharks (Cetorhinus maximus) in New Zealand trawl fisheries. Basking Shark Bycatch Review Final Report (Draft). Prepared for Department of Conservation, September 2012
Frick, L. H., Walker T. I. and Reina, R.D. (2010). Trawl capture of Port Jackson sharks, Heterodontus portusjacksoni, and gummy sharks, Mustelus antarcticus, in a controlled setting: Effects of tow duration, air exposure and crowding. Fisheries Research, 106: 344–350
Gearhart, J.L. (2010). Evaluation of a turtle excluder device (TED) designed for use in the U.S. mid-Atlantic Atlantic croaker fishery. NOAA Technical Memorandum NMFS-SEFSC-606, 30 p.
Gilman, E., Clarke, S., Brothers, N., Alfaro-Shigueto, J., Mandelman, J., Mangel, J., Petersen, S., Piovano, S., Thomson, N., Dalzell, P., Goren, M. and Werner, T. (2007). Shark Depredation and Unwanted Bycatch in Pelagic Longline Fisheries: Industry Practices and Attitudes, and Shark Avoidance Strategies, Western Pacific Regional Fishery Management Council, Honolulu, Hawaii.
Gilmore, R.G. (1993). Reproductive biology of lamnoid sharks. Environmental Biology of Fishes 38: 95–114.
Godin, A. and Morgan. A. (2011). Fisheries Bycatch of Sharks: Options for Mitigation. Ocean Science Division, Pew Environment Group, Washington, DC.
Hall, S.J. and Mainprize, B.M. (2005). Managing by-catch and discards: how much progress are we making and how can we do better? Fish and Fisheries. Volume 6 (2): 134–155.
Harris, A. N., and Poiner, I. R. (1991). Changes in species composition of demersal fish fauna of southeast Gulf of Carpentaria, Australia, after 20 years of fishing. Marine Biology, 111: 503–519.
Ireland, D. (1984). The Grey Nurse Shark. Underwater. 11:10-13.
Jordan, L. K., Mandelman, J.W., McComb, D.M. Fordham, S.V., Carlson, J.K. and Werner, T.B. (2013). Linking sensory biology and fisheries bycatch reduction in elasmobranch fishes: a review with new directions for research. Conservation Physiology 1: 1-20. Available from http://conphys.oxfordjournals.org/content/1/1/cot002.full.pdf+html?sid=eb1c9f8b-3bc2-477a-87b8-ab158415eab0
Kelleher, K. (2005). Discards in the world’s marine fisheries. An update. FAO Fisheries Technical Paper. No. 470. Rome, FAO. 2005. 131p.
Kroese, M. and Sauer, W. H. H. (1998). Elasmobranch exploitation in Africa. Marine and Freshwater Research, 1998, 49, 573–7.
Lack, M. and Sant, G. (2008). Illegal, unreported and unregulated shark catch: A review of current knowledge and action. Department of the Environment, Water, Heritage and the Arts and TRAFFIC, Canberra.
Lack, M. and Sant, G. (2009). Trends in Global Shark Catch and Recent Developments in Management. TRAFFIC International.
Lack, M. and Sant, G. (2011). The Future of Sharks: A Review of Action and Inaction. TRAFFIC International and the Pew Environment Group.
Last, P.R. and Stevens, J.D. (2009), Sharks and rays of Australia, 2nd edn, CSIRO Publishing, Collingwood.
Mandelman, J.W. and Farrington, M.A. (2007). The estimated short-term discard mortality of a trawled elasmobranch, the spiny dogfish (Squalus acanthias). Fisheries Research. 83: 238–245
142
Martin, R.A. (2004). Hearing and Vibration Detection. World Wide Web Publication, http://www.elasmo-research.org/education/white_shark/hearing.htm
McAuley, R. (2004). Western Australian Grey Nurse Shark Pop Up Archival Tag Project. Final Report to Department of Environment and Heritage. 55p.
Molina, J.M. and Cooke, S.J. (2012). Trends in shark bycatch research: current status and research needs. Rev Fish Biol Fisheries, 22:719–737
Morgan, A.C. (2010). Sharks: The State of the Science. Ocean Science Division, Pew Environment Group, Washington, DC.
National Oceanic and Atmospheric Administration (NOAA) (2011). NOAA Bycatch Reduction Engineering Program. U.S. Department of Commerce, National Oceanic and Atmospheric Administration, National Marine Fisheries Service.
Otway, N.M. and Parker, P.C. (2000). The Biology, Ecology, Distribution, Abundance and Identification of Marine Protected Areas for the Conservation of Threatened Grey Nurse Sharks in South-east Australian Waters. NSW Fisheries Office of Conservation.
Patterson, H.M. and Tudman, M.J. (2009). Chondrichthyan guide for fisheries managers: A practical guide to mitigating chondrichthyan bycatch. Bureau of Rural Sciences and Australian Fisheries Management Authority, Canberra.
Pew Environment Group (2006). Out of Balance: Industrial fishing and the threat to our ocean. Available from URL http://www.pewenvironment.org/uploadedFiles/PEG/Campaigns/herring_alliance_report_out_of_balance.pdf
Sequeira, A., Mellin, C., Rowat, D., Meekan, M.G. and C.J.A. Bradshaw. (2012). Ocean-scale prediction of whale shark distribution. Diversity and Distributions, 18, 504–518.
Shaughnessy, P., Kirkwood, R., Cawthorn, M., Kemper, C. and Pemberton, D. (2003). Pinnipeds, cetaceans and fisheries in Australia: A review of operational interactions. In Marine Mammals. Fisheries, Tourism and Management Issues (N.J. Gales , M. Hindell and R. Kirkwood, eds), pp. 136-152. Melbourne: CSIRO Publishing.
Skomal, G.B., Zeeman, S. I., Chisholm, J.H., Summers, E. L., Walsh, H. J., McMahon, K. W. and Thorrold, S. R. (2009). Transequatorial Migrations by Basking Sharks in the Western Atlantic Ocean, Current Biology, Volume 19, Issue 12, Pages 1019-1022. (http://www.sciencedirect.com/science/article/pii/S0960982209009786)
Speed, C.W., Meekan, M.G., Rowat, D., Pierce, S.J., Marshall, A.D. & Bradshaw, C.J.A. (2008) Scarring patterns and relative mortality rates of Indian Ocean whale sharks. Journal of Fish Biology, 72, 1488–1503.
Stephenson, P. C., Wells, S. and King, J.A. (2006). Evaluation of exclusion grids to reduce the catch of dolphins, turtles, sharks and rays in Pilbara trawl fishery. DBIF Funded Project. Fisheries Research Report No. 171, Department of Fisheries Western Australia, 24 pp.
Stevens, J.D., Bonfil, R., Dulvy, N.K.,Walker, P.A. (2000). The effects of fishing on sharks, rays, and chimaeras (chondrichthyans) and the implications for marine ecosystems. ICES Journal of Marine Science. 57: 476–494.
Stobutzki, I.C., Miller, M.J. Heales, D.S. and Brewer, D.T. (2002). Sustainability of elasmobranchs caught as bycatch in a tropical prawn (shrimp) trawl fishery. Fisheries Bulletin 100: 800-821.
http://www.pewenvironment.org/uploadedFiles/PEG/Campaigns/herring_alliance_report_out_of_balance.pdf
143
Threatened Species Scientific Committee (TSSC) (2001). Commonwealth Listing Advice on Carcharias taurus, Grey Nurse Shark (East Coast population). URL accessed on 28th May 2013 at: http://www.environment.gov.au/biodiversity/threatened/species/c-taurus.html.
Threatened Species Scientific Committee (TSSC) (2009). Commonwealth Listing Advice on Galeorhinus galeus. Department of the Environment, Water, Heritage and the Arts. Available from: http://www.environment.gov.au/biodiversity/threatened/species/pubs/68453-listing-advice.pdf.
Tuck, G.N., Knuckey, I. and Klaer, N.L. (2013). Informing the review of the Commonwealth Policy on Fisheries Bycatch through assessing trends in bycatch of key Commonwealth fisheries. Fisheries Research and Development Corporation final report 2012/046. . Fisheries Research and Development Corporation.
Wilson, S.G., Polovina, J.J., Stewart, B.S. and Meekan, M.G. (2006). ‘Movements of whale sharks (Rhincodon typus) tagged at Ningaloo Reef, Western Australia’, Marine Biology, vol. 148, pp. 1157–1166.
Zeeberg, J., Corten, A. and De Graaf, E. (2006). Bycatch and release of pelagic megafauna in industrial trawler fisheries off Northwest Africa. Fisheries Research, 78: 186-195.
Zollett, E.A. (2009). Bycatch of protected species and other species of concern in US east coast commercial fisheries. Endangered Species Research, 9: 49–59.
Žydelis, R., Wallace, B.P., Gilman, E.L. and Werner, T.B. (2009). Conservation of marine megafauna through minimization of fisheries bycatch. Conservation Biology, 23: 608-616.
Other groups or reference lists identified
http://ramweb.biology.dal.ca/content.php?lang=en&i=4&sub=3
http://bycatch.nicholas.duke.edu/Collaborators/bycatch-bibliography

144
4 Seabirds
Literature review on the impacts on Environment Protection and Biodiversity Conservation Act 1999 (Cth)
protected species by large mid-water trawl vessels.
Chapter 4: Seabirds
Prepared for
The Department of Sustainability, Environment, Water, Population and Communities on behalf of the Expert Panel on a Declared Commercial Fishing Activity.
GPO Box 787, Canberra, ACT, 2601
Project Reference: JN13076
Elgin Associates Pty Ltd
ABN 59123488639

145
Chapter Information
Chapter written by: Barry Baker (Latitude 42 Environmental Consultants Pty Ltd)
Reviewed by: Sheryl Hamilton (Latitude 42 Environmental Consultants Pty Ltd)
Rebecca McIntosh (Elgin Associates Pty Ltd)
Luke Finley (Elgin Associates Pty Ltd)
Project: Elgin JN13076: Literature Review: Impacts on Environment Protection and Biodiversity Conservation Act 1999 protected species by large mid-water trawl vessels
Contact: Elgin Associates Pty Ltd ABN 59123488639 Level 4, 11 Morrison St, Hobart, TAS, 7000 Telephone: +61 417 598807 Fax: +61 3 86486336 www.elgin.com.au
146
4. Seabirds
4.1 Brief description Seabirds are birds that have adapted to life within the marine environment. While seabirds vary greatly in lifestyle, behaviour and physiology, they share life history strategies that are a major factor influencing their conservation status: low natural adult mortality (in the order of 4-5%), deferred sexual maturity, low reproductive output, often lifelong pairing bonds, relatively high breeding success and a long lifespan. Consequently, populations may be impacted by even small increases in the rate of mortality (Croxall et al. 1990). Furthermore, the breeding season of many species (albatrosses, petrels, boobies, gannets, frigatebirds) are typically exceptionally long. During this time, the death of one parent also results in the death of the dependent offspring, further jeopardising population viability (Weimerskirch and Jouventin 1987; Croxall et al. 1990).
In general, while seabirds live longer, breed later and have fewer young than other birds do, they invest a great deal of time in their young. Most species nest in colonies, which can vary in size from a few dozen birds to millions of individuals. Many species are well known for undertaking long annual migrations, crossing the equator or circumnavigating the Earth in some cases (BirdLife International 2004, Croxall et al. 2005). They feed both at the ocean's surface and below it, and even feed on each other (Parker et al. 2013a). Seabirds can be highly pelagic, coastal, or in some cases spend a part of the year away from the sea entirely.
The group of seabirds most impacted by direct interactions with fisheries are albatrosses and petrels (Baker et al. 2002, Croxall 1998). An Ecological Risk Assessment (ERA) for the mid-water trawl sector of the Small Pelagic Fishery (SPF) (Daley et al. 2007, AFMA 2010) identified 76 seabird species that theoretically occurred within the waters of the Small Pelagic Fishery. Fifty three of the species identified in the ERA were albatrosses and petrels, and the other 23 species were penguins, cormorants, gannets, boobies, tropicbirds, skuas, gulls and terns, which are likely to be of lower risk from mortality in trawl fishing operations (Baker and Finley 2013).
Albatrosses are the world’s largest flying birds, weighing between 2-12kg. They have an enormous wingspan of 2-3.5m depending upon the species. Petrels are smaller, ranging in size from the tiny storm-petrels (weight 50 grams) to the giant-petrels (5kg). However, most petrel species range in size from 200 grams to 1kg.
Albatrosses and petrels occur widely across the world’s oceans. Over 40 species of albatrosses and petrels breed in Australia, with a further 40 species visiting or passing through Australian waters. Twenty of the world’s 22 albatross species occur in the Southern Hemisphere. Nineteen of these species occur in Australian waters, and five of these also breed in Australia. Many species, such as the Grey-headed Albatross, are extremely dispersive, spending most of their time over the surface waters of the High Seas (BirdLife International 2004, Terauds et al. 2006a). In contrast, others, like adult Shy Albatross, tend to be sedentary, regularly foraging over the coastal waters of southern Australia throughout their adult lives (Baker et al. 2007, Hedd et al. 2001, Hedd and Gales 2005).
In Australia albatrosses and giant-petrels are managed under the National recovery plan for threatened albatrosses and giant petrels 2011-2016 (SEWPaC 2011b). National recovery plans do not exist for the remaining species identified in the ERA, generally reflecting their more secure (Least Concern or Near Threatened) conservation status (Table 4.9).
147
4.2 Seabirds at risk of interactions with large pelagic trawlers in Australian waters
Of the 76 seabird species identified through the ERA for the mid-water trawl sector of the SPF (Daley et al. 2007, AFMA 2010), none were found to be at high ecological risk, with all being assessed as having a ‘Low’ or ‘Medium’ risk of interacting with fishing vessels within the SPF zones (AFMA 2010). All these species are listed under the EPBC Act as Marine Species, and some are listed as Migratory or Threatened under the Act (Table 4.9).
For the purpose of this literature review, detailed descriptions of seabirds at risk of interaction with factory trawlers in the SPF of Australia have not been provided because of the large number of species (76 species, Table 4.9) identified in the ERA (Daley et al. 2007 — pp 108-118; AFMA 2010). Detailed information on the biology, feeding ecology, breeding behaviour, evolutionary relationships and conservation for these species can be obtained from the following references:
• Little penguin Marchant and Higgins (1990), Williams (1995)
• Albatrosses ACAP (2009)
• Giant-petrels ACAP (2009)
• Petrels – Procellaria species ACAP (2009)
• Other petrels, shearwaters Brooke (2004), Marchant and Higgins (1990)
• Cormorants Nelson (2005), Marchant and Higgins (1990)
• Gannets boobies Nelson (2005), Marchant and Higgins (1990)
• Red-tailed tropicbird Nelson (2005), Marchant and Higgins (1990)
• Skuas and jaegers Higgins and Davies (1996)
• Gulls and terns Higgins and Davies (1996)
Risk profile: The distribution of 76 species of seabirds overlaps with the fishing zones of the SPF. There is a risk of incidental mortality for seabirds that follow fishing vessels and attempt to feed on discards and offal through warp strike and entanglement in trawl gear. Particularly susceptible are the albatrosses and larger species of petrels that are known to commonly interact with trawl fisheries (Table 4.9).
4.3 Conservation status of the species nationally The national conservation status of the all species identified by the ERA (Daley et al. 2007, AFMA 2010) is shown in Table 4.9.
Seabirds commonly interact with fisheries internationally and in Australian waters, with interactions ranging from disruption of natural behaviour to prey depletion and incidental mortality. Primary sources of seabird mortality include: incidental mortality in fisheries (longlines, gillnets, trawls) and competition for prey species. Globally, fishing-related mortality is considered the most severe and immediate threat to seabirds in the marine environment (Baker et al. 2002, Gales 1998).
Despite seabird bycatch being globally recognised as a threat to many species, there is a paucity of information regarding seabird abundance, population structure, and spatial and temporal habitat use. This presents difficulties for mitigating threats to seabirds, especially when behaviour is highly variable in time and space. Mitigation may need to be determined on a fishery-by-fishery or location-by-location basis. Spatial and/or temporal fishery closures should consider that some ‘at-risk’ seabirds migrate to distant
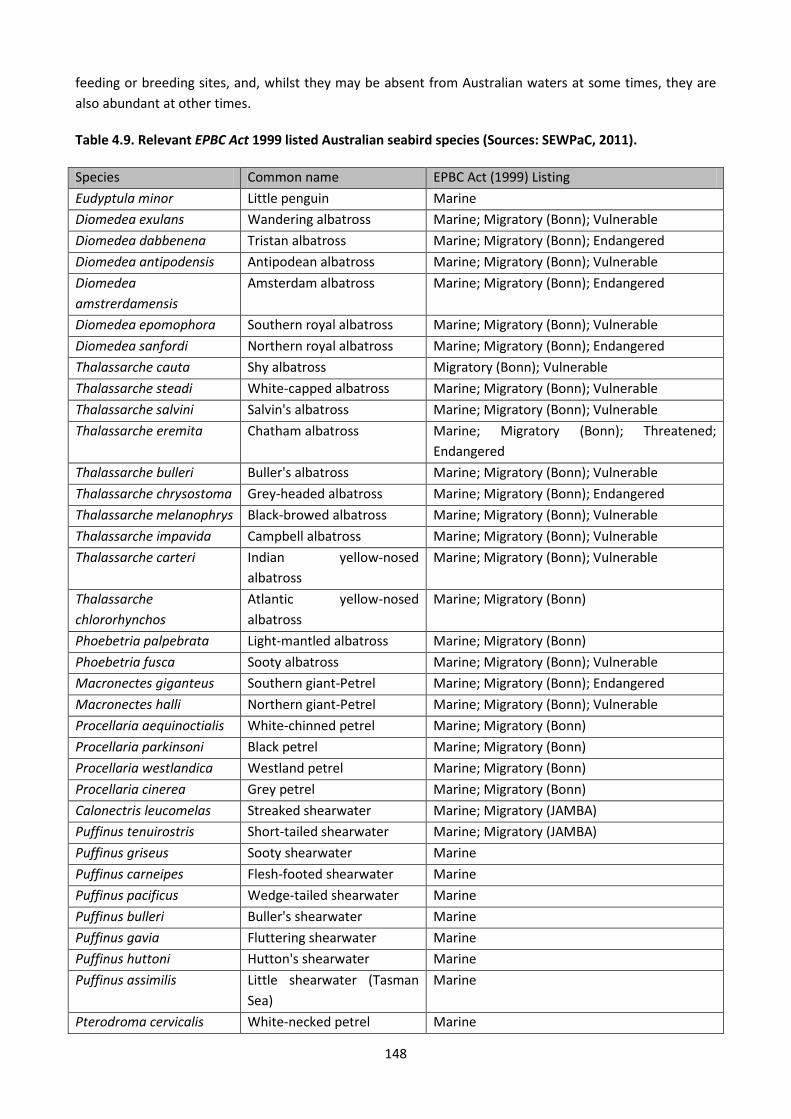
148
feeding or breeding sites, and, whilst they may be absent from Australian waters at some times, they are also abundant at other times.
Table 4.9. Relevant EPBC Act 1999 listed Australian seabird species (Sources: SEWPaC, 2011).
Species Common name EPBC Act (1999) Listing Eudyptula minor Little penguin Marine Diomedea exulans Wandering albatross Marine; Migratory (Bonn); Vulnerable Diomedea dabbenena Tristan albatross Marine; Migratory (Bonn); Endangered Diomedea antipodensis Antipodean albatross Marine; Migratory (Bonn); Vulnerable Diomedea amstrerdamensis
Amsterdam albatross Marine; Migratory (Bonn); Endangered
Diomedea epomophora Southern royal albatross Marine; Migratory (Bonn); Vulnerable Diomedea sanfordi Northern royal albatross Marine; Migratory (Bonn); Endangered Thalassarche cauta Shy albatross Migratory (Bonn); Vulnerable Thalassarche steadi White-capped albatross Marine; Migratory (Bonn); Vulnerable Thalassarche salvini Salvin's albatross Marine; Migratory (Bonn); Vulnerable Thalassarche eremita Chatham albatross Marine; Migratory (Bonn); Threatened;
Endangered Thalassarche bulleri Buller's albatross Marine; Migratory (Bonn); Vulnerable Thalassarche chrysostoma Grey-headed albatross Marine; Migratory (Bonn); Endangered Thalassarche melanophrys Black-browed albatross Marine; Migratory (Bonn); Vulnerable Thalassarche impavida Campbell albatross Marine; Migratory (Bonn); Vulnerable Thalassarche carteri Indian yellow-nosed
albatross Marine; Migratory (Bonn); Vulnerable
Thalassarche chlororhynchos
Atlantic yellow-nosed albatross
Marine; Migratory (Bonn)
Phoebetria palpebrata Light-mantled albatross Marine; Migratory (Bonn) Phoebetria fusca Sooty albatross Marine; Migratory (Bonn); Vulnerable Macronectes giganteus Southern giant-Petrel Marine; Migratory (Bonn); Endangered Macronectes halli Northern giant-Petrel Marine; Migratory (Bonn); Vulnerable Procellaria aequinoctialis White-chinned petrel Marine; Migratory (Bonn) Procellaria parkinsoni Black petrel Marine; Migratory (Bonn) Procellaria westlandica Westland petrel Marine; Migratory (Bonn) Procellaria cinerea Grey petrel Marine; Migratory (Bonn) Calonectris leucomelas Streaked shearwater Marine; Migratory (JAMBA) Puffinus tenuirostris Short-tailed shearwater Marine; Migratory (JAMBA) Puffinus griseus Sooty shearwater Marine Puffinus carneipes Flesh-footed shearwater Marine Puffinus pacificus Wedge-tailed shearwater Marine Puffinus bulleri Buller's shearwater Marine Puffinus gavia Fluttering shearwater Marine Puffinus huttoni Hutton's shearwater Marine Puffinus assimilis Little shearwater (Tasman
Sea) Marine
Pterodroma cervicalis White-necked petrel Marine

149
Species Common name EPBC Act (1999) Listing Pterodroma solandri Providence petrel Marine Pterodroma leucoptera Gould's petrel Marine; Endangered Pterodroma macroptera Great-winged petrel Marine Pterodroma mollis Soft-plumaged petrel Marine; Vulnerable Pterodroma nigripennis Black-winged petrel Marine Pterodroma neglecta Kermadec petrel (western) Marine; Vulnerable Pterodroma lessoni White-headed petrel Marine Pseudobulweria rostrata Tahiti petrel Marine Lugensa brevirostris Kerguelen petrel Marine Halobaena caerulea Blue petrel Marine; Vulnerable Pachyptila turtur Fairy prion Marine; Vulnerable (P.turtur subantarctica) Pelecanoides urinatrix Common diving-petrel Marine Pelagodroma marina White-faced storm-petrel Marine Oceanites oceanicus Wilson's storm petrel Marine Fregetta grallaria White-bellied storm-petrel Marine Fregetta tropica Black-bellied storm-petrel Marine Garrodia nereis Grey-backed storm petrel Marine Fulmarus glacialoides Southern fulmar Marine Daption capense Cape petrel Marine Phalacrocorax fuscescens Black-faced cormorant Marine Phaethon rubricauda Red-tailed tropicbird Marine Morus capensis Cape gannet Marine Morus serrator Australasian gannet Marine Sula dactylatra Masked booby Marine Catharacta skua Great skua Marine Larus novaehollandiae Silver gull Marine Larus dominicanus Kelp gull Marine Larus pacificus Pacific gull Marine Anous stolidus Common noddy Marine Anous minutus Black noddy Marine Anous tenuirostris Lesser noddy Marine; Vulnerable; Procelsterna cerulea Grey ternlet Marine Sterna fuscata Sooty Tern Sooty tern Marine Sterna hirundo Common tern Marine Sterna paradisaea Arctic tern Marine Sterna striata White-fronted tern Marine Sterna sumatrana Black-naped tern Marine Sterna albifrons Little tern Marine Sterna anaethetus Bridled tern Marine Sterna bergii Crested tern Marine Sterna caspia Caspian tern Marine
150
4.4 Incidental bycatch in fisheries Seabirds, including albatrosses and petrels, are killed in a range of fisheries throughout the world (e.g. Baker et al. 2007, Favero et al. 2011, Gonzalez-Zevallos and Yorio 2006, Sullivan et al. 2006b), and there is evidence that fisheries-related mortality is responsible for population decreases in many species of seabird, particularly the albatrosses and petrels (Families Diomedeidae and Procellariidae) (Alexander et al. 1997; Baker et al. 2002; Baker and Wise 2005; Birdlife International 1995; Croxall 1998; Gales 1998).
This threat to seabirds has been particularly well documented for longline fisheries, where birds drown after being accidentally caught while scavenging on baited hooks set for target pelagic and demersal fish. Mortality of seabirds associated with trawl, gillnet and purse-seine fisheries is less well documented but is increasingly recognised, especially in trawl fisheries where seabirds can get struck by the warp cables and drown, collide with other vessel cables and be killed or injured, or become entangled in the mesh of nets at the sea surface. In gillnet and purse-seine fisheries, seabirds can become entangled in the mesh of nets and drown, either accidentally or as a result of active diving/feeding behaviour of certain species.
4.4.1 Trawl bycatch
Trawl fisheries are known to kill large numbers of seabirds worldwide (Sullivan and Reid 2002; Sullivan 2004; Gonzalez-Zevallos and Yorio 2006; Sullivan et al. 2006b; Baker et al. 2007; BirdLife International 2013b). Sullivan et al. (2006b) reported high levels of mortality of albatrosses, predominantly black-browed albatrosses, in the Falklands Island (Islas Malvinas) finfish fleet in 2002/2003. Observers estimated that more than 1,500 seabirds, predominantly black-browed albatross, were killed by finfish trawlers over a 157-day period. Baker et al. (2007) estimated that over 8,500 shy and white-capped albatrosses may be killed annually by trawl and longline fishery operations, with most birds being killed in South African, Namibian and New Zealand waters. Trawl fisheries were responsible for 75 per cent per cent of these mortalities. BirdLife International (2013b) recently reported that 8,088 (0 – 27,487) birds are killed each year in the Namibian demersal trawl fishery. Of those birds, 5,010 (62%) albatrosses are estimated to be killed and 3,078 (38%) non-albatross species.
Seabird mortality in trawl fisheries can be broadly grouped into two causal categories: (1) birds colliding with trawl warps, netsonde and paravane cables, which particularly impacts larger birds such as albatrosses (Bartle 1991; Sullivan and Reid 2002, 2003a, 2003b; Weimerskirch et al. 2000); and (2) birds becoming entangled in nets during shooting and hauling, which more commonly affect smaller seabirds (SC-CAMLR 2001, 2002). There is considerable potential for underestimating incidental mortality because an unknown proportion of birds that are killed by warp strikes are not recovered or observed (Sullivan et al. 2006b; Parker et al. 2013a).
Collisions with trawl warps in particular, but also with other components of trawling equipment including trawl doors, backstrops, bridles, sweeps and paravanes, can cause injury or death if the collision is sufficiently severe (Wienecke and Robertson 2002; Gonzalez-Zevallos and Yorio 2006, Gonzalez-Zevallos et al. 2007). Sullivan et al. (2006b) reported birds being killed after being dragged underwater by the warp cable while feeding on factory discharges at the stern of the vessel. A proportion of birds slide down the cable and become impaled on a splice in the cable. Sometimes birds are killed when they become stuck to lubricated cables and dragged through trawl winches (Wienecke and Robertson 2002, R. Wanless unpublished). The problem of interaction with trawl gear is exacerbated when large numbers of birds are present around vessels in response to offal discharge of and the competition for offal becomes intense. Offal management remains the key to minimizing interactions with seabirds in trawl operations.
Most net related mortality recorded in recent years has been caused by pelagic trawlers, although demersal trawls have also been implicated in some fisheries. Pelagic nets remain at or near the sea surface

151
for extended periods, in contrast to demersal nets which are weighted to stay on or near the bottom under tow, and hence sink rapidly during deployment. Mortality is predominantly caused by birds diving into the net and becoming entangled, particularly in the intermediate size meshes (Weimerskirch et al. 2000; SC-CCAMLR 2001, 2002), or as a result of collisions with trawl warps during towing. Different size birds are typically impacted by different components of trawl gear: larger species such as albatrosses are more likely to be impacted by warp strikes, whereas the smaller petrel species are killed in net captures.
P. Hicken and I. Everson, in Hooper et al. (2003), provide excellent descriptions on trawling operations and the ways that seabirds become entangled.
Key point: Seabirds are more often caught in mid-water trawls. Reduction in offal discharge is key to minimizing seabird attendance at trawl vessels and subsequent bycatch. Large birds are more likely to be impacted by warp strikes. Smaller species (> 1kg) are typically caught in the net.
4.4.2 Spatial overlap between seabird distribution and fishing zones
Interactions with fisheries often depend on the degree to which a species’ spatial and temporal habitat use overlaps with the working fishery (BirdLife 2004).
Key point: Seabirds targeting prey species often overlap spatially and temporally with fisheries targeting the same prey species.
4.4.3 Illegal culling
Commercial and recreational fishers may regard seabirds as competitors and pests (SEWPaC 2011a, b). Seabirds that interfere with fishing gear may be shot by commercial and recreational fishermen, but there is no information regarding the extent of current illegal culling
4.4.4 Prey depletion and competition for food
The progressive degradation of the marine habitat, particularly via the potential global over-extraction of marine resources, may have long-term effects on the status of seabirds and be as serious as the more direct and acute pressures of interactions with fisheries (Croxall 1998). There is concern that over-fishing by trawl fisheries may cause a depletion of prey for seabirds and adversely impact population rates (SEWPaC 2011a, b). Because trawling takes the target species as well as many bycaught species, it can remove species throughout the entire food web. The SPF species play an important ecological role as food for many marine birds and mammals and it is important the harvest strategies contain reference points for the target species that allow a viably functioning ecosystem that can support seabirds and mammals higher in the food chain (Daley et al. 2007). In particular, it is known that redbait, a major target species in the SPF, are preyed on by marine birds, such as the Australasian gannet and shy albatross (Hedd and Gales 2001). Other prey items for these species such as Gould’s squid (not a SPF target species) and jack mackerel are also commercially harvested.
Key point: Seabirds often target the same prey species as those targeted by mid-water trawl fisheries. Overfishing of stocks in one area may hinder feeding or provisioning of seabird species and potentially lead to population declines.
4.4.5 Dependence on fishery discards and offal discharge
Some seabird species have become dependent upon the offal discarded from fishing vessels during operations and/or processing at sea. They scavenge dead prey and fishery discards and bait (Croxall and Prince 1994), with larger species being more predisposed to boat-following (Baker et al. 2002).

152
There are essentially two issues arising from this dependence upon discards. First, the disposal of offal further encourages seabirds to follow fishing vessels, significantly increasing their likelihood of becoming injured or killed during fishing operations by direct interactions with fishing gear (SEWPaC 2011b).
Second, some populations have become habituated to the regular food source and have altered their foraging ranges and dynamics accordingly (Ryan and Moloney 1988; Adams 1992; Acros and Oro 1996; Blaber et al. 1998; Weimerskirch 1998; Sagar et al. 1999). Votier et al. (2004) argue that discards are a key food resource for many seabird species. Evidence indicates that the additional food made available by commercial fishing operations may influence breeding success and hence population sizes in some seabird species (e.g. Blaber et al. 1998). However, consideration of these ‘benefits’ needs to be weighed against the negative aspects (Baker et al. 2002). For example, in the North Sea, reduced rates of discarding, particularly when coupled with reduced availability of small shoaling pelagic fish, can result in an increase in predation by great skuas on other birds (Votier et al. 2004).
The availability of this additional food may not always benefit a species. The consequence of birds becoming habitually attracted to the offal discarded from fishing vessels may be that they return less frequently to the nest during critical phases of the nesting period, causing the nesting attempt to fail (Terauds and Hamill 1999). This indirect threat has been specifically identified as potentially affecting black-browed albatrosses breeding on Macquarie Island, although the mechanism was not clearly understood (Terauds and Hamill 1999; Terauds 2002). Breeding success appeared to be lower in years when trawling operations were being conducted earlier in the breeding season throughout the incubation period. Terauds (2002) suggested the decrease could have been related to breeding birds being distracted by the vessel and undertaking longer than ’normal’ foraging trips leading to higher rates of nest abandonment. Short term benefits from utilising offal and fisheries discards has been documented for other black-browed albatross populations (e.g. Thompson and Riddy 1995); however, at Macquarie Island offal and discards are not released in the Macquarie Island EEZ and therefore the relationship between the presence of the fishery and breeding success remains unclear (Terauds 2002).
Weimerskirch (1998) reported that, in 1994, when black-browed albatrosses breeding on Iles Crozet concentrated foraging in an area of high natural prey and largely ignored a vessel fishing in an adjacent foraging area, fledging success was the highest on record.
There are few available data to quantify this issue. Greater use of the extensive satellite-tracking data that are now accumulating (BirdLife International, 2004) may be able to determine the level of association and degree of overlap between fishing vessels and foraging seabirds, and their dependence on discards. Two recent studies of albatross species in New Zealand (Torres et al. 2011, 2013) indicated generally low rates of overlap while foraging and high variability among sexes, years and types of fishery. Changes in overlap rates were attributed to shifts in both albatross and vessel distributions. Albatrosses foraged independently of fishing vessels half the time they were within 10 km of a vessel, indicating that overlap was due to coincident habitat use rather than vessel interaction.
Key point: the concentration of prey items during or following fishing activities is known to attract feeding seabirds. It is possible that reliance on offal or discards from fishing operations may affect breeding success.
4.5 Australian interactions between seabirds and trawl fisheries In Australia, 21 seabird species have been recorded to interact with, and form bycatch in a range of Australian net fisheries, including trawl (Baker and Finley 2013). Given the poor level of observer coverage in many of the fisheries assessed, and because mortalities are often difficult to observer (e.g. seabirds striking trawl warps and other cables), this is likely to be an underestimate of the total number of species

153
that are actually affected. Those seabird species known to be caught in trawl fisheries differ substantially in conservation status. They include endangered species such as the black-browed albatross and prolific species such as the short-tailed shearwater. Nine of the species identified by Baker and Finley are classified as threatened – one as Endangered, seven as Vulnerable and one as Near Threatened (Garnett et al. 2011).
4.5.1 Southern and Eastern Scalefish and Shark Fishery (SESSF)
The Southern and Eastern Scalefish and Shark Fishery (SESSF) is a multi-species multi-gear fishery situated off the south-east coast of Australia. The SESSF has the following trawl sectors: Commonwealth Trawl Sector (CTS), East Coast Deepwater Trawl Sector (ECDTS), and Great Australian Bight Trawl Sector (GABTS) (Woodhams and Vieira 2012).
The areas fished by the SESSF overlap with the distributions of many seabird species. The CTS and GABTS, in particular, are known to interact with these species (Phillips et al. 2010).
The risks that the otter trawl sub-fishery of the CTS poses to the sustainability of the marine ecosystem were assessed through an individual ERA completed to Level 2 PSA in 2007 (Wayte et al. 2007); a rapid quantitative risk assessment (Level 3 SAFE methodology) completed for teleosts and chondrichthyans in December 2007; and a residual risk assessment of the Level 2 PSA results, and application of the residual risk guidelines to the Level 3 SAFE methodology completed in August 2009. The results of these risk assessments were consolidated to form a priority list of high risk species for the fishery. Overall four ‘high-risk’ seabird species were identified: the Tahiti petrel (Pseudobulweria rostrata), the long-tailed jaeger (Stercorius longicaudus), Buller’s albatross (Thalassarche bulleri) and Chatham albatross (Thalassarche eremita) (AFMA 2010c). Shearwaters, which have been subsequently caught in the fishery, were not included in the priority list.
Analysis of observer data indicates that there may be potentially significant levels of seabird interactions (Phillips et al. 2010) in the fishery, with an estimated 1,111 albatross interactions in 2006. Further work is needed to understand scale and significance of seabird interactions. However, given the nature of these interactions (mainly warp strikes), obtaining robust estimates of seabird mortalities may be difficult even with on-board observers (Alderman 2011).
In the CTS during 2010, there were 448 seabird contacts with warp wires in the bottom otter trawl sub-fishery and two seabird contacts with warp wires in the midwater trawl sub-fishery. Twelve of these seabirds (all ‘shy-type’ albatross – Thalassarche cauta or T. steadi) were recorded as dead from the contact with warp wires. One other ‘shy-type’ albatross was recorded as dead and two cape petrels were presumably killed after being entangled in midwater trawl nets (AFMA unpublished data). Tuck et al. (2013) did not report on trends in seabird interactions in any SESSF fisheries because date could not be be interpreted with confidence due to the recent redesign of the ISMP and introduction of new seabird bycatch mitigation measures.
The ecological risk management report for the GABTS indicated no seabird species were assessed to be high, medium or low risk in the GABTS following this assessment process (AFMA 2008).
Seabirds are known to interact with trawling activities and, particularly during hauling, they are vulnerable to warp strike (Phillips et al. 2010). The wildlife trade operation approval for the SESSF included a condition to investigate the nature and extent of seabird interactions in the trawl sectors. In 2010 observer logbooks, one shy albatross (Thalassarche cauta) was recorded dead from being caught in a warp wire (AFMA unpublished data). However, logbook records have been shown to be an unreliable measure of interactions with seabirds in this (Phillips et al. 2010) and other fisheries, particularly in terms of warp strikes which are often cryptic (Sullivan et al. 2006b).
154
4.5.2 Small Pelagic Fishery (SPF)
The Australian SPF targets Australian sardine (Sardinops sagax), blue mackerel (Scomber australasicus), jack mackerel (Trachurus declivis, T. murphyi) and redbait (Emmelichthys nitidus) using purse-seine and midwater trawlers to catch fish (Moore and Skirtun 2012). The SPF extends from southern Queensland to southern Western Australia and is divided into four management zones (A, B, C and D). Mid-water trawling was trialled in Tasmania during 2001 for the SPF and commercial mid-water trawl operations commenced in late 2002, with redbait the primary target species (Lyle and Willcox, 2008). At the commencement of the fishery, a ‘soft’ rope-mesh Seal Excluder Device (SED) and a high level of observer coverage was used.
ERAs have been undertaken separately for mid-water trawl and purse-seine fishing methods.
An ERA for the mid-water trawl sector of the SPF (Daley et al. 2007, AFMA 2010) identified 76 seabird species that theoretically occurred within the waters of the SPF (See Section 2 above). As stated above, none of these species were found to be at high ecological risk, with all being assessed as having a ‘Low’ or ‘Medium’ risk of interacting with fishing vessels within the SPF zones (AFMA 2010). All these species are listed under the EPBC Act as Marine Species, and some are listed as Migratory or Threatened under the Act (Table 4.1).
A total of 37 interactions between seabirds and mid-water trawl gear were reported by on-board observers in 2002 and 2006 and during commercial fishing operations in 2006 (Tuck et al. 2013). AFMA publishes quarterly reports of logbook interactions with ‘Threatened, Endangered and Protected’ (TEP) species on its website (AFMA 2012). No interactions with TEP species have been reported in the mid-water trawl fisheries of the SPF since the 2009 Workplan commenced (AFMA 2011). Note that there has been very limited effort in the SPF since the introduction of the 2009 Workplan, with close to zero midwater trawl effort. Commonwealth logbooks show no seabird interactions in the Jack Mackerel Fishery (JMF) in 2001-2002 or the SPF before 2006 and 2007-2011 (Tuck et al. 2013).
A large factory-freezer trawler proposes to work within the boundaries of the SPF. Most of the 76 species of seabirds identified in the ERA are likely to be at risk from trawler interactions, particularly the species of albatrosses that overlap with the fishery. The evidence of warp strikes reported for albatrosses for the SESSF CTS provides some justification of the need to re-assess the risk to seabird species by SPF fishing operations.
4.6 Are there any bycatch mitigation devices or measures?
4.6.1 Internationally
Studies to determine the effectiveness of seabird mitigation measures in trawl fisheries are scarce, and accordingly few mitigation devices have been developed and tested. A review by Løkkeborg (2008) identified only three devices, which have been described and tested (Sullivan et al. 2004a, 2004b, 2006a) in the Falkland Island (Islas Malvinas). Bull (2007, 2009) also reviewed trawler mortality mitigation techniques and recommended a combination of offal and discard management, the banning of net monitoring cables, paired streamer lines, and a reduction in the time the net is on or near the surface as likely to be the most effective in reducing seabird interactions with the warp cables and net.
The few studies conducted in finfish trawl fisheries to date indicate interactions between seabirds and trawl gear are rare at times of no offal discharge. These studies therefore suggest that a no-discharge policy, or no discharge while gear is in the water, would largely eliminate seabird mortality (Lokkeborg 2008, 2011; Wienecke and Robertson 2002). Limiting factory discharge to ‘dirty water’, resulting from processing, that does not attract large numbers of seabirds (Sullivan et al. 2006a; Wienecke and Robertson 2002) would also be effective. However, the development and testing of appropriate bird-scaring devices to

155
protect warps may also be useful in mitigating the problem. The use of a suite of measures, including net binding to secure the meshes at the time of setting, removal of fish ‘stickers’ from nets prior to shooting gear, considering adding weight to the cod end to assist gear in sinking rapidly and retaining offal during shooting and hauling of trawl gear, with full offal retention where feasible, has been adopted by CCAMLR as best-practice mitigation for new pelagic finfish fisheries (SC-CAMLR 2007).
Recognition of the extent of seabird mortality in net fisheries has resulted in a number of organisations and governments introducing measures to mitigate the threat both nationally and internationally, and applying resources to developing technical solutions to mitigate seabird bycatch. Particularly prominent in this respect has been the Agreement on the Conservation of Albatrosses and Petrels (ACAP); BirdLife International, particularly through its Albatross Task Force (BirdLife 2013a); and a charitable trust, Southern Seabirds Solutions; as well as the governments of Australia (Wienecke and Robertson 2002), the United States of America (Melvin et al. 2010), the United Kingdom (Sullivan et al. 2004; 2006a, 2010; Parker et al. 2013 a, b; Reid and Edwards 2005;) and New Zealand (Abraham and Pierre 2007, Abraham 2010, Abraham et al. 2009, Abraham and Thompson 2009, Pierre et al. 2010, 2013).
ACAP seeks to coordinate international activity to mitigate known threats to albatross and petrel populations throughout the Southern Hemisphere. To provide advice on seabird bycatch matters, ACAP established a Seabird Bycatch Working Group (SBWG). The SBWG comprises representatives from its 13 Parties, as well as invited specialists and NGOs with expertise in mitigation research, RFMOs and high seas governance, and management of seabird-fisheries interactions. The SBWG meets regularly and reviews available research on seabird bycatch mitigation measures for various gear types, based on published literature and expert opinion. The results of these reviews are available on the ACAP website (http://www.acap.aq), together with a summary of recommended mitigation approaches, which are extracted from the reviews and incorporated into best-practice advice statements. Mitigation reviews for trawl gear were recently updated by ACAP and provide the most comprehensive advice on mitigation research and recommended best practice. The review conducted by ACAP’s SBWG is provided as an Appendix document titled ‘ACAP 2013_Trawl Mitigation – Review.pdf’ (Appendix 4.1).
BirdLife International, in conjunction with ACAP, has developed a series of Mitigation Fact Sheets that describe potential mitigation measures currently available for trawl fisheries and other fishing gears (BirdLife and ACAP 2010a, 2010b). The fact sheets are designed to inform managers of the options available and assist in decision-making on the most appropriate measures for their fisheries. The fact sheets describe appropriate measures, summarise their effectiveness, provide technical specifications and discuss compliance and implementation issues. The key fact sheets are:
Fact Sheet #13: Trawl Warp Strike
Fact Sheet #14: Trawl Net Entanglement
Key recommendations for minimizing seabird interactions and mortality in trawls:
• cable strike problems — use bird scaring lines to deter birds away from warp cables and install a snatch block at the stern of vessels to reduce the aerial extent of the net monitoring;
• net entanglement problems — clean nets to remove stickers (entangled fish), minimise the time the net is on the water surface during hauling, and applying net binding;
• pelagic trawl gear — apply net binding to large meshes in the wings (120–800 mm), together with incorporating a minimum of 400-kg weight into the net belly prior to setting; and,
• managing offal discharge and discards while fishing gear is deployed has been shown to reduce seabird attendance. Avoiding any discharge during shooting and hauling, and converting offal into

156
fish meal, retaining all waste material and restricting discharge to liquid discharge/sump water will reduce the number of birds to a minimum.
Where meal production from offal and full retention is not feasible, batching waste will reduce seabird attendance at the stern of the vessel. Mincing of waste to reduce food particle size has also been shown to reduce the attendance of large albatross species (Abraham 2010).
Observer programs and altering trawler behaviour
Observer programs are important as they provide more reliable catch rates and may enable trawling behaviour to alter in the presence of seabirds. Adequate observer coverage coupled with crew training enables real time management of incidents. High levels of observer coverage also contribute to confidence in annual bycatch estimates.
The major issue that currently hinders understanding and effective management of seabird interactions in Australian trawl fisheries is the lack of representative observer data for most fisheries. A recent assessment of seabird bycatch risk in Australia’s state and territory fisheries was necessarily based largely on information, analyses and experiences extrapolated from other fisheries or areas, and not on empirical data for the actual fisheries being assessed (Baker and Finley 2013). While information gathering through independent observer programmes is costly, generating the priority and resources necessary to support the level of data gathering required to quantify seabird bycatch levels in trawl fisheries should be a key focus.
Time and area closures
Time and area closures may be an effective tool for reducing bycatch in areas with relatively high bycatch (Waugh et al. 2008); however, the utility of closures will be fishery specific. Successful mitigation relies on knowledge of temporal and spatial uses of habitats and overlap with fisheries. Closures can cause gear shifts or can displace the effort elsewhere, causing problems for other species and/or populations (Zollett and Rosenberg, 2005).
Harvest limits
Harvest limits or Potential Biological Removal (PBR) limits may be set for a fishery (Wade, 1998). Although developed initially for management of marine mammal populations, PBRs have recently been applied in the management of fisheries in New Zealand (Richard and Abraham 2013). Because many seabirds are highly migratory, and because fisheries may overlap, they may be impacted by more than one fishery. In some cases these fisheries may extend beyond national jurisdictions (BirdLife 2004). PBR models need to take all forms of anthropogenic mortality into account i.e., data for all relevant fisheries need to be considered as well as non-fishery data.
4.6.2 Nationally
Many of the mitigation measures identified by ACAP as best practice for trawl operations (Appendix 4.1) are relevant to Australian trawl fisheries, including the SPF. However, these measures have largely not been taken up to date. The relevant measures are listed below.
Net sonde monitoring cables or third wires
The use of netsonde monitor cables or equivalent gear has been prohibited within the CCAMLR Convention Area for many years (Baker and Finley 2013). They are also banned within Australian sub-Antarctic fisheries, but are still permitted elsewhere within the EEZ. However, very few (if any) domestic trawling vessels still use a netsonde cable, preferring the use of hull-mounted transducers or towed aquaplanes on which transducers are set (AFMA logbook databases).

157
Observer programs
AFMA has committed to 100% observer coverage to monitor by-catch and other aspects of fishery operations for the factory trawler (http://www.afma.gov.au/2012/06/super-trawler-faqs/).
SESSF Great Australian Bight and Commonwealth Trawl Fisheries
The GABTF and CTS have independent observers on board from time-to-time and uses a number of industry initiatives that assist in quantifying and reducing bycatch, including:
• Bycatch and Discard Workplans, which outline actions that will be undertaken in the each fishery to address bycatch and discarding issues (AFMA 2011). The workplans include aims to respond to key high risk species and take steps to increase the knowledge of all high risk species and their interactions with fishing gear, to develop a long-term response plan for all remaining high risk species based on scientific advice, and to develop measures to mitigate seabird interactions.;
• area closures;
• investigation of seabird mitigation measures, including offal management and mitigation devices;
• individual vessel management plans. AFMA has been working with trawl fishers to develop tailored seabird management plans to address this issue in the CTS. Vessel seabird management plans (SMP) were mandated to be in place for all CTS vessels by 31 October 2011. The effectiveness of these SMPs is yet to be evaluated (Baker and Finley); and
• production of a bycatch and discards flier to assist in accurate reporting of bycatch and discards in daily fishing logs (GABIA, 2010).
4.7 Are there organisations working on mitigation? If so, who and what. The Agreement on the Conservation of Albatrosses and Petrels (ACAP) through its Seabird Bycatch Working Group regularly reviews available research on seabird bycatch mitigation measures for various gear types. Reviews by ACAP are based on published literature and expert opinion and ACAP subsequently develops best-practice advice statements which are widely disseminated. ACAP also supports bycatch mitigation research through a grants programme.
In 2005 BirdLife International formed the Albatross Task Force, a programme that has established an international team of skilled, at-sea instructors to assist fishers develop strategies to minimise seabird bycatch in their fisheries. Albatross Task Force teams are based in the bycatch 'hotspots' of southern Africa and South America, where albatrosses and other seabirds come into contact with large and diverse longline and trawl fishing fleets. The Task Force carries out experimental work on mitigation devices and practices to provide proof of concept for measures ideas. The Task Force also work on-shore, running workshops with fishermen and fisheries management bodies, and carrying out research to identify solutions that best suit each fishery.
4.8 Suggested areas of research to address gaps in knowledge Implementation of ACAPs identified best practice mitigation measures, particularly the appropriate management of offal, will significantly contribute to reduce seabird bycatch in trawl fisheries. For the SPF large freezer trawler fishery, close attention to all aspects of the fishing operation will be essential to ensure interactions are kept to a minimum.
Industry consultation and education is important to meet management goals and effectively reduce incidental bycatch.
158
The observer programme for the SPF large freezer trawler will need to collect, analyse and publish observer data on all seabird interactions, including on the levels and causes of seabird bycatch, focusing especially on recording of warp interactions and trawl entanglements. Consideration should be given to installing corpse catchers (Parker et al. 2013a) on warps to assist in understanding the level of warp/seabird interactions that lead to mortalities. Electronic monitoring via video cameras may also assist in quantifying warps strikes.
The use of netsonde monitor cables or equivalent equipment in global fisheries can cause substantial mortality to albatrosses and giant petrels and should be discouraged or prohibited on freezer trawlers.
Annual review of information on the fishery's seabird bycatch performance, the seabird species that interact with it and improvements in bycatch mitigation practice, would provide fishery managers with the information necessary to assess the need for, and adopt and refine, effective mitigation measures that are close to best-practice at any time. Establishment of a seabird bycatch working group, modelled on the former CCAMLR IMAF Working Group (Waugh et al. 2008) to collect and review relevant information would greatly facilitate this process.
4.9 Reliability of data / source of information Data and information specific to seabird bycatch in large factory freezer trawlers was not located. The review therefore looked at the impact of other forms of trawling on seabirds, for which a substantial body of work has been carried out. Many studies state that bycatch data are difficult to source and results should be interpreted with caution. Most studies report that the results should be taken as minimum estimates because both observer and logbook data cannot record every mortality occurring in the fishery (e.g. Tuck et al. 2013.
Data collection poses fundamental problems with estimating bycatch: logbook records suffer from under-reporting and on-board observer programs are typically limited because of scarce observer coverage and because priority is given to other duties required of observers, potentially leading to seabird deaths going unnoticed. Another difficulty in quantifying bycatch is that some birds initially caught in the net may be lost underwater, and birds that hit warps during various stages of trawling operations are often undetected because they fall into the water in an area where they may not be captured in the net, thus avoiding detection (Sullivan et al. 2006b, Parker et al. 2013a). Reliable data on the levels of seabird bycatch in Australian trawl fisheries will require observer programs to specifically focus on this issue (Baker and Finley 2013.
4.10 Limitations in the review process Consultation with scientific experts was not part of the project scope, although we have a strong knowledge of the literature pertaining to mitigation of seabird bycatch in trawl fisheries, together with an awareness of the research programmes of influential Research Groups currently working on seabird bycatch mitigation globally.
All of the published data identified in this review stem from studies undertaken on small to medium sized trawl vessels and trawl fleets. We were unable to locate any studies on carried out on factory-freezer or large pelagic trawlers. As a consequence, mitigation measures and approaches identified as suitable elsewhere will need to be specifically tested to ascertain their efficacy when applied to large factory trawlers.
159
4.11 References (Seabirds) Abraham, E. and Pierre, J. 2007. Mincing, mealing and batching: waste management strategies aimed at reducing seabird interactions with trawl vessels. WG-FSA-07-42, SC-CAMLR XXVII, Hobart, Australia
Abraham, E.R, and Thompson, F.N. 2009: Warp strike in New Zealand trawl fisheries, 2004-05 to 2006-07. New Zealand Aquatic Environment and Biodiversity Report No. 33. 21 p.
Abraham, E.R. 2010: Mincing offal to reduce the attendance of seabirds at trawlers. Report prepared by Dragonfly for Department of Conservation, Wellington, New Zealand. 28 p.
Abraham, E.R. Pierre, J.P., Middleton, D.A.J., Cleal, J. Walker, N.A. and Waugh, S.M. 2009. Effectiveness of fish waste management strategies in reducing seabird attendance at a trawl vessel. Fisheries Research, 95: 210–219.
ACAP (Agreement on the Conservation of Albatrosses and Petrels) 2009. ACAP Species assessments. Downloaded from http://www.acap.aq/index.php/species-assessments on 18 May 2013.
Acros, J.M. and D. Oro. 1996. Changes in foraging range of Audouin’s Gulls Larus audouinii in relation to a trawler moratorium in the Western Mediterranean. Colonial Waterbirds 19, 128–131.
Adams, N.J. 1992. The distribution, population status and conservation of Southern African seabirds. Stichting Greenpeace Council, Amsterdam.
AFMA (Australian Fisheries Management Authority) 2010. Ecological Risk Management Report for the Mid-water trawl sector of the Small Pelagic Fishery. Australian Fisheries Management Authority.
AFMA 2008. Residual Risk Assessment of the Level 2 ecological risk assessment species results: report for the Great Australian Bight trawl sub-fishery of the Southern and Eastern Scalefish and Shark Fishery, AFMA, Canberra. http://www.afma.gov.au/wp-content/uploads/2010/06/GABTF_RR_report.pdf (Accessed 15 March 2012).
AFMA 2011. Commonwealth Trawl Sector (Otter Board Trawl and Danish Seine) Bycatch and Discarding Workplan 1 July 2011 to 30 June 2013, AFMA, Canberra. http://web-test.afma.gov.au/wp-content/uploads/2010/06/CTS-Bycatch-and-Discarding-Workplan-2010-2013-Final.pdf (Accessed 15 March 2012).
AFMA 2012. Interactions with Protected Species. www.afma.gov.au/managing-our-fisheries/ environment-and-sustainability/Protected-Species/ (Accessed 8 March 2012).
Alderman, R. 2011. Interactions between seabirds and the Commonwealth Trawl Fishery: A pilot investigation. Unpublished report to the Commonwealth Department of Sustainability, Environment, Water, Populations and Communities. Tasmanian Department of Primary Industries, Parks, Water and Environment.
Alexander, K., Robertson, G. and Gales, R. 1997. The incidental mortality of albatrosses in longline fisheries. Australian Antarctic Division, Tasmania. 44 pp.
Baker, G. B., Gales, R., Hamilton, S. and Wilkinson, V. 2002. Albatrosses and petrels in Australia: a review of their conservation and management. Emu 102, 71–97.
Baker, G.B. and Finley, L.A. 2013. National assessment of the incidental catch of seabirds in trawl, gillnet and purse-seine fisheries. Unpublished report to Fisheries Research and Development Corporation. Latitude 42 Environmental Consultants, Kettering, Tasmania.

160
Baker, G.B. and Wise, B.S., 2005. The impact of pelagic longline fishing on the flesh-footed shearwater Puffinus carneipes in Eastern Australia. Biological Conservation 126, 306–316.
Baker, G.B., Double, M.C., Gales, R., Tuck, G.N., Abbott, C.L., Ryan, P.G., Petersen, S.L., Robertson, C.J.R. and Alderman, R. 2007. A global assessment of the impact of fisheries-related mortality on shy and white-capped Albatrosses: conservation implications. Biological Conservation 137, 319–333.
Bartle, J.A. 1991. Incidental capture of seabirds in the New Zealand sub-Antarctic squid trawl fishery, 1990. Bird Conservation International 1, 351–359.
BirdLife International 1995. Global impacts of fisheries on seabirds. A paper prepared by Birdlife International for the London Workshop on Environmental Science, Comprehensiveness and Consistency in Global Decisions on Ocean Issues. 30 November – 2 December 1995.
BirdLife International 2013a. Albatross Task Force: advances in mitigation research. ACAP SBWG5 Doc.38.
BirdLife International 2013b. Seabird mortality estimate for the Namibian demersal Hake trawl fishery. ACAP SBWG5 Doc.41.
BirdLife International and ACAP 2010a. Bycatch Mitigation Fact-Sheet 13 Trawl Fisheries: Warp strike.
BirdLife International and ACAP 2010b. Bycatch Mitigation Fact-Sheet 14 Trawl Fisheries: Net entanglement.
BirdLife International. 2004. Tracking ocean wanderers: the global distribution of albatrosses and petrels. Results from the Global Procellariiform Tracking Workshop, 1–5 September, 2003, Gordon’s Bay, South Africa. Cambridge, UK; BirdLife International; 2004.
Brooke, M. 2004. Albatrosses and Petrels across the World. Oxford University Press.
Blaber, S.J.M., Milton, D.A., Farmer, M.J. and Smith, G.C. 1998. Seabird breeding populations on the far northern Great Barrier Reef, Australia: trends and influences. Emu 98, 44–57.
Bull, L.S. 2007. Reducing seabird bycatch in longline, trawl and gillnet fisheries. Fish 8: 31-56
Bull, L.S. 2009. New mitigation measures reducing seabird bycatch in trawl fisheries. Fish and Fisheries, 10: 408–427.
Croxall, J.P. 1998. Research and Conservation: a future for albatrosses? Pp. 269–290 in Albatross: Biology and Conservation. Robertson, G. and Gales, R. (eds.). Surrey Beatty and Sons, Chipping Norton.
Croxall, J.P. and Prince, P.A. 1994. Dead or alive, night or day: how do albatrosses catch squid? Antarctic Science 6, 155–162.
Croxall, J.P., Rothery, P., Pickering, S.P.C. and Prince, P.A. 1990. Reproductive performance, recruitment and survival of wandering albatrosses Diomedea exulans at Bird Island, South Georgia. Journal of Animal Ecology 59, 775–796.
Croxall, J.P., Silk, J.R.D., Phillips, R.A., Afanasyev, V. and Briggs, D. R. 2005. Global circumnavigations: tracking year-round ranges of nonbreeding albatrosses. Science 307, 249-250.
Daley, R., Dowdney, J., Bulman, C., Sporcic, M., Fuller, M., Ling, S. and Hobday, A. 2007. Ecological risk assessment (ERA) for the effects of fishing: Report for the Midwater Trawl Sub-Fishery of the Small Pelagic Fishery. Report the Australian Fisheries Management Authority. Canberra, Australia
Department of Sustainability, Environment, Water, Population and Communities (SEWPaC). 2011a. Background Paper, Population Status and Threats to Albatrosses and Giant Petrels Listed as Threatened
161
under the Environment Protection and Biodiversity Conservation Act 1999. Commonwealth of Australia, Hobart.
Department of Sustainability, Environment, Water, Population and Communities (SEWPaC). 2011b. National recovery plan for threatened albatrosses and giant petrels 2011-2016. Commonwealth of Australia, Hobart.
Favero, M, Blanco, G., Garcia, G., Copello, S., Seco Pon, J. P., Frere, E, Quintana, F., Yorio, P., Rabuffetti, F., Canete, G and Gandini, P. 2011. Seabird mortality associated with ice trawlers in the Patagonian shelf: effect of discards on the occurrence of interactions with fishing gear. Animal Conservation 1-9.
GABIA. 2010. Great Australian Bight Trawl Fishery Boat Operating Procedures Manual. Australian Fisheries Management Authority and Great Australian Bight Fishing Industry Association Inc.
Gales, R. 1998. Albatross populations: status and threats. Pp. 20–45 in Albatross: Biology and Conservation. Robertson, G. and Gales, R. (eds.). Surrey Beatty and Sons, Chipping Norton.
Garnett, S.T., Szabo, J.K and Dutson, G. 2011. The 2010 Action Plan for Australian Birds. CSIRO Publishing, Collingwood.
Gonzalez-Zevallos, D., and Yorio, P., 2006. Seabird use of discards and incidental captures at the Argentine hake trawl fishery in the Golfo San Jorge, Argentina. Marine Ecology Progress Series, 316: 175–183.
Gonzalez-Zevallos, D., Yorio, P. and Caille, G. 2007. Seabird mortality at trawler warp cables and a proposed mitigation measure: A case of study in Golfo San Jorge, Patagonia, Argentina. Biological Conservation, 136: 108–116.
Hedd, A. and Gales, R. 2001. The diet of shy albatrosses (Thalassarche cauta) at Albatross Island, Tasmania. Journal of Zoology (London) 252, 69-90.
Hedd, A. and Gales, R. 2005. Breeding and overwintering ecology of shy albatrosses in southern Australia: year-round patterns of colony attendance and foraging-trip durations. Condor 107, 375–387.
Hedd, A., Gales, R. and Brothers, N. 2001. Foraging strategies of shy albatross Thalassarche cauta breeding at Albatross Island, Tasmania, Australia. Marine Ecology Progess Series 224, 267–282.
Higgins, P.J. and Davies, S.J.J.F. 1996. Handbook of Australian, New Zealand and Antarctic Birds Vol. 3. Oxford University Press, Melbourne.
Hooper, J., Agnew, D. and Everson, I. 2003. Incidental mortality of birds on trawl vessels fishing for icefish in Subarea 48.3. WG-FSA-03/79, SC-CAMLR XXII, Hobart, Australia.
Løkkeborg, S. 2008. Review and assessment of mitigation measures to reduce incidental catch of seabirds in longline, trawl and gillnet fisheries. FAO Fisheries and Aquaculture Circular No. 1040. FAO, Rome.
Løkkeborg, S. 2011. Best practices to mitigate seabird bycatch in longline, trawl and gillnet fisheries — efficiency and practical applicability. Marine Ecology Progress Series 435: 285-303.
Lyle, J. M. and Willcox, S.T. 2008. Dolphin and seal interactions with mid-water trawling in the Small Pelagic Fishery, including an assessment of bycatch mitigation strategies. Final Report Project R05/0996 Tasmanian Aquaculture and Fisheries Institute and Australian Fisheries Management Authority.
Marchant, S. and Higgins P.J. 1990. Handbook of Australian, New Zealand and Antarctic Birds Vol. 1. Oxford University Press, Australia.
162
Melvin, E.F., Dietrich, K.S., Fitzgerald, S. and Cordoza, T. 2010. Reducing seabird strikes with trawl cables in the Pollock Catcher-Processor Fleet in the Eastern Bering Sea. Agreement on the Conservation of Albatrosses and Petrels, SBWG-3 Doc 14 Rev1, Hobart, Australia, 18 pp.
Moore, A. and Skirtun, M. 2012. Chapter 7: Small Pelagic Fishery. In ABARES Fishery status reports 2011 (J. Woodhams, S. Vieira and I. Stobutzki, eds), pp. 90-103. Canberra: Commonwealth of Australia.
Nelson, J.B. 2005. Pelicans, Cormorants and their relatives. Oxford University Press.
Parker, G., Brickle, P., Crofts, S., Pompert, J. and Wolfaardt, A. 2013a. Research into undetected seabird mortality in a demersal trawl fishery. ACAP SBWG5 Doc.07.
Parker, G., Brickle, P., Wolfaardt, A. and Pompert, J. 2013b Early results from trials of Bird Scaring Lines (BSLs) attached to 14 m booms on a demersal trawler. ACAP SBWG5 Doc.08.
Phillips, K, Giannini, F, Lawrence, E and Bensley, N. 2010. Cumulative assessment of the catch of non-target species in Commonwealth fisheries: a scoping study, Bureau of Rural Sciences, Canberra.
Pierre, J. P.; Cleal, J.; Thompson, F.N.; Abraham, E.R. 2013. Seabird bycatch reduction in scampi trawl fisheries. Final Research Report for Department of Conservation project MIT2011-02 (Unpublished report held by Department of Conservation, Wellington). 26 pages.
Pierre, J.P., Abraham, E.R, Middleton, D.A.J., Cleal, J., Bird, R., Walker, N.A. and Waugh, S.M. 2010. Reducing interactions between trawl fisheries and seabirds: responses to foraging patches provided by fish waste batches. Biological Conservation 143: 2779-2788.
Reid, T. and Edwards, M. 2005. Consequences of the introduction of Tori lines in relation to seabird mortality in the Falkland Islands trawl fishery, 2004/2005. Falklands Conservation, Stanley, Falkland Islands, 41 pp.
Richard, Y. and Abraham, E. 2013. Application of Potential Biological Removal methods to seabird populations. New Zealand Aquatic Environment and Biodiversity Report No. 108. http://fs.fish.govt.nz go to Document library/Research reports
Ryan, P.G. and Moloney, C.L. 1988. Effect of trawling on bird and seal distributions in the southern Benguela current. Marine Ecology Progress Series 45, 1–11.
Sagar, P.M., Stahl, J.C., Molloy, J., Taylor, G.A. and Tennyson, A.J.D. 1999. Population size and trends within the two populations of Southern Buller’s Albatross Diomedea bulleri bulleri. Biological Conservation 89, 11–19.
SC-CAMLR 2001. Report of the 20th meeting of the Scientific Committee of the Commission for the Conservation of Marine Living Resources. CCAMLR, Hobart.
SC-CAMLR 2002. Report of the 21st meeting of the Scientific Committee of the Commission for the Conservation of Marine Living Resources CCAMLR, Hobart.
SC-CAMLR 2007. Report of the 26th meeting of the Scientific Committee of the Commission for the Conservation of Marine Living Resources CCAMLR, Hobart.
Sullivan, B. 2004 Falkland Island Plan of Action for Reducing Incidental Catch of Seabirds in Trawl Fisheries. Falklands Conservation, Stanley.
Sullivan, B. and Reid, T. 2002. Seabird interactions/mortality with longliners and trawlers in the Falkland/Malvinas Island Waters 2001/02. CCAMLR WG-FSA-02/36.

163
Sullivan, B., Clark, J., Reid, K. and Reid, E. 2010. Polar Biology Submitted. Development of effective mitigation to reduce seabird mortality in the icefish (Champsocephalus gunnari) trawl fishery in Subarea 48.3.
Sullivan, B., Liddle, G.M. and Munro, G.M. 2004a. Mitigation trials to reduce seabird mortality in pelagic trawl fisheries (Subarea 48.3). WG-FSA-04/80. CCAMLR, Hobart.
Sullivan, B.J. and Reid, T.A. 2003a. Seabird mortality and trawlers in Falkland Island waters 2002/03. Falklands Conservation.
Sullivan, B.J., and Reid, T.A., 2003b. Seabird mortality and Falkland Island trawling fleet 2002/03. WG-FSA-03/91. CCAMLR, Hobart.
Sullivan, B.J., Brickle, P., Reid, T.A. and Bone, D.G. 2004b. Experimental trials to investigate emerging mitigation measures to reduce seabird mortality caused by warp cable strike on factory trawlers. Seabirds at Sea Team report. Falklands Conservation, Stanley, Falkland Islands (unpublished).
Sullivan, B.J., Brickle, P., Reid, T.A., Bone, D.G. and Middleton, D.A.J. 2006a. Mitigation of seabird mortality on factory trawlers: trials of three devices to reduce warp cable strikes. Polar Biology 29, 745–753.
Sullivan, B.J., Reid, T.A., and Bugoni, L. 2006b. Seabird mortality on factory trawlers in the Falkland Islands and beyond. Biological Conservation, 131: 495–504.
Terauds, A. and Hamill, J. 1999. Status and conservation of albatrosses and giant-petrels on Macquarie Island: Fieldwork report 19998/99. Department of Primary Industries, Water and Environment, Hobart. 163 pp.
Terauds, A., Gales, R. and Alderman, R. 2005. Trends in numbers and survival of black-browed (Thalassarche melanophyrs) and grey-headed (T. chrysostoma) albatrosses breeding on Macquarie Island. Emu 105, 159–167.
Terauds, A., Gales, R., Baker, G.B. and Alderman, R. 2006a. Foraging areas of black-browed and grey-headed albatrosses breeding on Macquarie Island in relation to marine protected areas. Aquatic Conservation: Marine and Freshwater Ecosystems 16, 133–146.
Terauds, A. 2002. Population biology and ecology of albatrosses on Macquarie Island: implications for conservation status. PhD Thesis, University of Tasmania
Thompson, K.R. and Riddy, M.D. 1994. Utilisation of offal and discards from ‘finfish’ trawlers around the Falkland Islands by the black-browed albatross Diomedea melanophrys. Ibis 137, 198–206.
Tuck G.N., Knuckey, I. and Klaer, N.L. 2013. Informing the review of the Commonwealth Policy on Fisheries Bycatch through assessing trends in bycatch of key Commonwealth fisheries. Fisheries Research and Development Corporation final report 2012/046. 240p.
Votier, R.W. Furness, S.B, Crane, J.E., Caldow, R.W.G., Catry, P., Ensor, K., Hamer, K.C., Hudson, A.V., Kalmbach, E., Klomp, N.I., Pfeiffer, S., Phillips, R.A., Prieto, I. and Thompson, D.R. 2004. Changes in fisheries discard rates and seabird communities. Nature 427, 727–730.
Wade, P.R. 1998. Calculating the limits to the allowable human-caused mortality of cetaceans and pinnipeds. Marine Mammal Science 14: 1-37.
Waugh, S.M., Baker, G.B., Gales, R. and Croxall, J.P. 2008. CCAMLR process of risk assessment to minimise the effects of longline fishing mortality on seabirds. Marine Policy 32, 442-454.

164
Wayte, S.E., Bulman, C, Dowdney, J, Sporcic, M, Williams, A, Fuller, M and Smith, T. 2007. Ecological risk assessment for the effects of fishing: report for the Danish seine sub-fishery of the Commonwealth Trawl Sector of the Southern and Eastern Scalefish and Shark Fishery, report to the AFMA, Canberra.
Weimerskirch, H. 1998. Foraging strategies of Indian Ocean albatrosses and their relationship with fisheries, in Albatross Biology and Conservation, G. Robertson and R. Gales (Eds). Surrey Beatty and Sons Pty Ltd: Chipping Norton. 196-179.
Weimerskirch, H. and Jouventin, P. 1987. Population dynamics of the wandering albatross, Diomedea exulans, of the Crozet Islands: causes and consequences of the population decline. Oikos 49, 315–322.
Weimerskirch, H., Capdeville, D., and Duhamel, G., 2000. Factors affecting the number and mortality of seabirds attending trawlers and long-liners in the Kerguelen area. Polar Biology, 23: 236–249.
Wienecke, B. and Robertson, G., 2002. Seabird and seal-fisheries interactions in the Australian Patagonian toothfish Dissostichus eleginoides trawl fishery. Fisheries Research, 54: 253–265.
Williams, T.D. 1995. The Penguins. Oxford University Press.
Woodhams, J, and Vieira, S. 2012. Chapter 8: Southern and Eastern Scalefish and Shark Fishery. In: Woodhams, J, Vieira, S and Stobutzki, I (eds) 2012, Fishery status reports 2011, Australian Bureau of Agricultural and Resource Economics and Sciences,Canberra.
Zollett, E.A. and Rosenberg, A.A. 2005. A Review of Cetacean Bycatch in Trawl Fisheries. Prepared for the Northeast Fisheries Science Center.

4.12 Appendix 4.1: ACAP Review of Seabird Bycatch Mitigation Measures for Trawl Fisheries
This appendix is a link to ‘ACAP 2013_Trawl Mitigation – Review.pdf’
ACAP has comprehensively reviewed the scientific literature dealing with seabird bycatch mitigation in trawl fisheries and this document is a distillation of the review.
http://www.acap.aq/en/bycatch-mitigation/mitigation-advice/202-acap-review-of-mitigation-measures-and-summary-advice-for-reducing-the-impact-of-pelagic-and-demersal-trawl-gear-on-seabirds/file

166
5 Turtles
Literature review on the impacts on Environment Protection and Biodiversity Conservation Act 1999 (Cth)
protected species by large mid-water trawl vessels.
Chapter 5: Turtles
Prepared for
The Department of Sustainability, Environment, Water, Population and Communities on behalf of the Expert Panel on a Declared Commercial Fishing Activity.
GPO Box 787, Canberra, ACT, 2601
6 March 2015 PROJECT REFERENCE: JN13076
Elgin Associates Pty Ltd
ABN 59123488639

167
Chapter Information
Chapter written by:
Rebecca McIntosh (Elgin Associates Pty Ltd)
Reviewed by: Luke Finley (Elgin Associates Pty Ltd)
Barry Baker (Latitude 42 Environmental Consultants Pty Ltd)
Sheryl Hamilton (Latitude 42 Environmental Consultants Pty Ltd)
Submission Date: 6 March 2015
Project: Elgin JN13076: Literature Review: Impacts on Environment Protection and Biodiversity Conservation Act 1999 protected species by large mid-water trawl vessels
Contact: Elgin Associates Pty Ltd ABN 59123488639 Level 4, 11 Morrison St, Hobart, TAS, 7000 Telephone: +61 417 598807 Fax: +61 3 86486336 www.elgin.com.au

168
5. Turtles
5.1 Brief description
As a result of their migratory nature most species of sea turtles are an internationally shared responsibility and all countries involved must attempt to prevent sea turtle populations from declining further (Wallace et al., 2013). Sea turtles tracked from the Cayman Islands travelled to foraging grounds over a >2,000 km stretch of Caribbean coastline and the Florida Keys, highlighting the need for international cooperation in identifying and mitigating foraging ground threats (Blumenthal et al., 2006).
Bycatch is considered the biggest threat globally to long-lived sea turtles (Robins, 1995; Senko et al., 2013; Wallace et al., 2013) and addressing the incidental catch and death of sea turtles during commercial fishing operations is a conservation priority (Robins et al., 2002b). In Australia, main threats to sea turtles include incidental capture in fishing bycatch (trawling, gill nets, longline, pots, ghost nets), competition with fisheries for prey items and/or overfishing and/or damage caused by fishing reducing prey items, indigenous hunting, marine debris, predation, coastal development, boat strike and climate change (SEWPaC, 2009b).
During this review, many of the sourced sea turtle bycatch literature were related to gillnet, longline, and coastal passive net fisheries (See Archive folder in supplied turtle literature), as well as shrimp trawling and bottom trawling. Excellent reviews for sea turtle bycatch have been written by Wallace et al. (2013), the Food and Agricultural Organisation of the United Nations (FAO, 2010), Moore et al. (2009), Cox (2007) and Zeeberg et al. (2006). Zeeberg et al. (2006) was the only reference reporting data for sea turtle bycatch in large freezer-trawlers.
There are seven sea turtles listed by the EPBC Act (1999) in Australian waters: loggerhead turtle (Caretta caretta), flatback turtle (Chelonia depressa = Natator depressus), leatherback turtle (Dermochelys coriacea), green turtle (Chelonia mydas), hawksbill turtle (Eretmochelys imbricata), and olive ridley turtle (Lepidochelys olivacea) (See Table 5.1). Sea turtles are long-lived with delayed sexual maturity. Therefore, it is critical that they be protected throughout all stages of their life history (egg, hatchling, juvenile, adult). According to several population models for sea turtles, increased early-stage survivorship (i.e., hatchling production) without a concomitant increase in late-stage survivorship will delay population extinction but typically cannot reverse population declines by itself. Therefore bycatch mitigation for juveniles and adults is essential for sea turtle conservation (Žydelis et al., 2009).
Coastal fisheries may affect females migrating to rookeries, other fisheries may interact with sea turtles in areas where they overlap spatially and temporally (FAO, 2010). Incidental bycatch in shrimp trawling is the most commonly reported sea turtle bycatch, both globally and in Australia, particularly in the tropics and subtropics (FAO, 2010; Oravetz, 1999; Wallace et al., 2013; Woodhams et al., 2012). The FAO identified industrialised longline fishing from large vessels as a threat to sea turtles, but did not identify industrialised pelagic trawlers as a threat (only coastal trawlers) (FAO, 2010). FAO (2004) identified only pelagic longline and purse seine fisheries as a hazard to sea turtles. Gear modifications such as Turtle Excluder Devices (TEDs) have a high success rate, allowing turtles to exit nets; and captured turtles often have a high likelihood of live release (Kelleher, 2005). However, when considering the conservation status and life history of sea turtles, even low levels of bycatch may be unsustainable for turtle populations.
Sea turtles are managed under the Recovery Plan for Sea Turtles in Australia (Environment Australia, 2003). Four species of sea turtle (loggerhead, leatherback, green and hawksbill turtles) are identified by the Australian Small Pelagic Fishery (SPF) as threatened species found within the area of the SPF, at medium

169
risk in the Level 2 PSA Residual Risk Assessment (AFMA, 2010) (Table 1.1). The Level 2 PSA assessment categorises species, habitats and communities into high, medium or low risk on the basis of their susceptibility to fishing activities and their ability to recover from fishing impacts. It is an inherently precautionary methodology with risks scored high in the absence of information or evidence to the contrary (AFMA, 2011). The SPF includes Commonwealth waters extending from southern Queensland to southern Western Australia. Historically, the major fishing grounds of the SPF are off the south east corner of Australia, and in particular around Tasmania.
5.2 Turtles at risk of interactions with large pelagic trawlers in Australian waters
Juvenile (small) sea turtles are typically pelagic, migrating into inshore waters when they grow larger and become adults (Limpus, 2008). Young loggerhead turtles are pelagic and live at or near the surface of the ocean and move with the ocean currents. In eastern Australia, there is evidence that they spend around 15 years or more in the open ocean with much of their feeding in the top 5 m of water. Green turtles spend their first five to ten years drifting on ocean currents, as do Hawksbill turtles. During this pelagic (ocean-going) phase, they are often found in association with rafts of Sargassum. The leatherback turtle is predominantly a pelagic feeder and uses coastal habitats for breeding.
The pelagic phase or foraging habits of sea turtles increases the likelihood of spatial overlap with trawlers where turtles occur in the SPF.
5.1.1 Loggerhead turtle (Caretta caretta)
Conservation status: Listed as endangered under the EPBC Act and migratory on Appendix 1 and 2 of CMS (Table 1.1).
Population estimate: The loggerhead turtle is considered to comprise of two distinct genetic stocks in Australia - the eastern Australian sub-population (500 nesting females) and the western Australian sub-population (1,000–2,000 breeding females). Interbreeding does not occur between Western Australian and Queensland sub-populations. The eastern Australian sub-population has declined by an estimated 86% between 1977 and 2000; 3500 females were breeding annually in 1997 while only 500 females were nesting annually in 2000. There are no data on the trends for the western Australian sub-population, nor have the threatening processes been quantified. Survivorship varies with age class: eggs - average emergence success 70–90%, hatchlings - average mortality 16–65% at Heron Reef, immature turtles - annual survivorship 58% (males) and 84% (females), and adult turtles - annual survivorship 87%. In 1989, the Queensland Parks and Wildlife Service (QPWS) implicated trawling as a significant contributing factor in the decline of the eastern Australian sub-population (Limpus & Reimer, 1994).
Distribution and key habitats within Australian waters: The loggerhead turtle has a global distribution throughout tropical, sub-tropical and temperate waters. In Australia, this species occurs in the waters of coral and rocky reefs, seagrass beds and muddy bays throughout eastern, northern and western Australia. This species does not occur commonly in southern Australia, however, one sighting was verified on Redmap Australia, an online register for sightings of marine species that are ‘uncommon’ to their local seas, at Howrah Beach, near Hobart Tasmania on 5 November 2012 (http://www.redmap.org.au/sightings/1003/, accessed 12 June 2013). See also the map of observations in the Atlas of Living Australia (http://biocache.ala.org.au/occurrences/search?q=Loggerhead%20Turtle#tab_mapView, accessed 12 June 2013).
While nesting is concentrated in southern Queensland and from Shark Bay to the North West Cape in Western Australia, foraging areas are more widely distributed. Females tagged at the southeast

170
Queensland rookeries have been recorded from feeding areas in Indonesia, Papua New Guinea, Solomon Islands, New Caledonia, Northern Territory, Queensland and New South Wales. There have been unconfirmed reports of tagged loggerhead turtles being trawled in northern New Zealand, probably originating from the Queensland rookeries (Limpus, 2008).
Feeding and/or breeding ecology relevant to interactions in the SPF: Loggerhead turtles are carnivorous, feeding primarily on benthic invertebrates in habitat ranging from nearshore to 55 m. They are specialised for feeding on hard-bodied, slow-moving invertebrate prey. In eastern Australian coastal waters, while the species has been recorded feeding on about 100 taxa, loggerhead turtles feed principally on gastropod and bivalve molluscs, portunid crabs and hermit crabs. They feed less frequently on other invertebrates (including jellyfish, anemones, holothurians, sea urchins) and fish (Limpus et al. 2001 in (Limpus, 2008)). Loggerhead turtles forage using a range of strategies including digging within the substrate, picking prey items off the substrate and plucking them from within the water column or at the water surface (Preen, 1996; Limpus et al. 2001 in (Limpus, 2008)).
Genetic studies on the global scale have demonstrated that there is little or no female mediated interbreeding between the major breeding aggregations (Bowen, 2003 in Limpus, 2008). In management terms, this means that if there was a significant population decline at one of the major rookeries, there is little probability of it being repopulated from other stocks in the time frame of human management. The breeding populations in Australia are therefore unique (Limpus, 2008). There are several small (<10 females per year) breeding sites within the SPF between Moreton Island QLD and Northern NSW (Limpus, 2008).
Risk profile: Interactions moderately likely. This species range overlaps with the SPF, with less likelihood of occurrence in southern Australia. Potential interactions with mid-water pelagic trawl operations may occur while this species is in its pelagic phase. Surface feeding may increase the risk of boat strike.
5.1.2 Leatherback turtle (Dermochelys coriacea)
Conservation status: Listed as endangered under the EPBC Act (Table 1.1) and migratory on Appendix 1 and 2 of CMS.
Population estimate: In 1982, there were an estimated 115,000 adult female leatherback turtles in the world but, in 2004, the estimate was 35,800. Analysis of published estimates of global population sizes, suggest a reduction of over 70% for the global population of adult females in less than one generation. The populations in the Pacific Ocean, the species' stronghold until recently, have declined drastically in the last decade, with current annual nesting female mortalities estimated at around 30% (Ferraroli et al., 2004).
The dramatic worldwide decline in populations of the leatherback turtle is largely due to the high mortality associated with their interaction with fisheries, so a reduction of this overlap is critical to their survival (Ferraroli et al., 2004). Historically, many Leatherback turtles have been captured in the nets used by the Queensland Shark Control Program (nets used to protect ocean bathers), numbers of captured leatherback turtles have declined over time, possibly indicating a decline in their population (SEWPaC, 2009b; Limpus, 2008).
Distribution and key habitats within Australian waters: Found in tropical, subtropical and temperate waters throughout the world, it’s large size allows them to utilise cold water (10 °C) foraging areas and has been recorded feeding in the waters of all Australian states. Leatherback turtles are most frequently encountered in the waters of southern Australia (Tasmania, Victoria, South Australia and Western Australia) and along the mid-eastern Australian Coast (SE Queensland) (see distribution map in Figure 2 of Limpus, 2008, Chapter 6 leatherback turtles). See also the map of observations in the Atlas of Living Australia (http://biocache.ala.org.au/occurrences/search?taxa=Leatherback+Turtle#tab_mapView,
171
accessed 12 June 2013). Several breeding sites have been confirmed along the central eastern coast and Coburg Peninsula in northern Australia (see map of breeding sites in Figure 2 of Limpus, 2008, Chapter 6 Leatherback turtles).
Feeding and/or breeding ecology relevant to interactions in the SPF: Limited data from overseas indicates that leatherback turtles concentrate in areas where currents converge with steep bathymetric contours, presumably where food is more readily available. Dives may be deep (300–1250 m) and protracted (> 1 hour). Adults feed mainly on pelagic soft-bodied creatures such as jellyfish and tunicates, which occur in greatest concentrations at the surface in areas of upwelling or convergence. The regular appearance of leatherback turtles in cool temperate waters is probably due to the seasonal occurrence of large numbers of jellyfish (SEWPaC, 2009b; Ferraroli et al., 2004; Limpus, 2008).
Risk profile: Interactions moderately likely. This species range overlaps with the SPF and a key threat to this species in Australia is incidental bycatch or entanglement in commercial fishing operations. The pelagic nature and diving ability of this species may increase its risk of bycatch by factory trawlers in the SPF.
5.1.3 Green turtle (Chelonia mydas)
Conservation status: Listed as vulnerable under the EPBC Act (Table 1.1) and migratory on Appendix 1 and 2 of CMS.
Population estimate: The global population of green turtles is estimated to be very large (2.2 million), and most populations (except Bali) are thought to be increasing. Six of the major green turtle nesting populations in the world have been increasing over the past two to three decades following protection from human hazards such as exploitation of eggs and turtles (Chaloupka et al., 2007). The total Australian population of green turtles is estimated to be more than 70,000 individuals (SEWPaC, 2009b), distributed across seven regional populations and the Heron Island rookery is estimated to be growing at an annual rate of 3.8% (Chaloupka et al., 2007).
The seven regional populations of green turtles in Australia are thought to be genetically distinct subpopulations, with a very low level of genetic exchange between regions. The seven subpopulations and their estimated numbers of individuals are (DEH 2005a): Southern Great Barrier Reef, 8,000; Northern Great Barrier Reef, 41,000, Southern Gulf of Carpentaria, 5,000; Western Australia, 20,000; Ashmore and Cartier Reefs, low hundreds; Coral Sea, several hundred; Scott Reef, unknown. These subpopulations can be further subdivided into 17 genetically distinguishable breeding stocks (management units), consisting of individual rookeries (breeding colonies) or groups of rookeries that are generally more than 500 km apart.
Distribution and key habitats within Australian waters: Globally, this species occurs between the 20°C isotherms, although individuals can stray into temperate waters. This species is most commonly found between latitudes of 9-27 degrees south (Limpus, 2008; Limpus & Reimer, 1994). The Southern Great Barrier Reef Stock is the most likely to overlap with the SPF. Some individuals have been identified migrating in excess of 2,600 km, but most migrate less than 1,000 km to their rookeries (Limpus, 2008). Sightings in southern Australia, below 27 degrees south, are less common (Limpus, 2008; Limpus & Reimer, 1994). There have been six verified sightings of green turtles from Newcastle (NSW) to Dromana (Vic) on Redmap Australia, an online register for sightings of marine species that are ‘uncommon’ to their local seas (http://www.redmap.org.au/sightings/map/?species=43&page=1, accessed 12 June 2013). See also the map of observations in the Atlas of Living Australia (http://biocache.ala.org.au/occurrences/search?taxa=Green+Turtle#tab_mapView, accessed 12 June 2013). A global distribution map is available from the IUCN Redlist website (http://maps.iucnredlist.org/map.html?id=4615, accessed 13 June 2013).
172
Feeding and/or breeding ecology relevant to interactions in the SPF: Green turtles eat mainly seagrass and algae, although they will occasionally eat other items including fish-egg cases, jellyfish and sponges. Young turtles tend to be more carnivorous than adults. During their pelagic phase (while drifting on ocean currents), young green turtles also eat plankton and can be found in association with driftlines and rafts of Sargassum (a floating marine plant that is also carried by currents) (Limpus, 2008).
Risk profile: Interactions are moderately likely. This species range overlaps with the SPF and a key threat to this species in Australia is incidental bycatch or entanglement in commercial fishing operations. The pelagic phase may increase its risk of bycatch by the factory trawler. Drifting on the surface may also increase risk of boat strike.
5.1.4 Hawksbill turtle (Eretmochelys imbricata)
Conservation status: Listed as vulnerable under the EPBC Act (Table 1.1) and migratory on Appendix 1 of CMS.
Population estimate: The total population of hawksbill turtles in Australia is unknown although Australia holds the largest breeding populations of hawksbill turtles in the world, and the largest rookeries. In Australia, there are two genetically separate subpopulations; one in the northern Great Barrier Reef, Torres Strait and Arnhem Land; and the other on the North West Shelf of Western Australia. This genetic distinctiveness means that individuals from the two subpopulations very rarely interbreed. Australian stocks of hawksbill turtles are genetically different from the stocks that breed in neighbouring countries such as the Solomon Islands and Malaysia. Several thousand females nest in Queensland each year. Around 3,000 females nest in Western Australia each year (SEWPaC, 2009b).
There have been serious population declines of hawksbill turtles worldwide. In Australia, long-term monitoring of nesting turtles at Milman Island in the Torres Strait has shown that the number of hawksbill turtles has been declining by 3% to 4% per year for at least ten years. On the northern Great Barrier Reef, the body size of nesting females has decreased, and the hatching success on Raine Island has been poor since 1996 (Limpus, 2008).
Distribution and key habitats within Australian waters: Hawksbill turtles are found in tropical, subtropical and temperate waters in all the oceans of the world. See the map of observations in the Atlas of Living Australia (http://biocache.ala.org.au/occurrences/search?taxa=Hawksbill+Turtle#tab_mapView, accessed 12 June 2013). Nesting is mainly confined to tropical beaches. In Australia this species range includes the Temperate East, the North and North-west of Australia. Major nesting of hawksbill turtles in Australia occurs at Varanus Island and Rosemary Island in Western Australia, and in the northern Great Barrier Reef and Torres Strait, QLD (SEWPaC, 2009b).
Feeding and/or breeding ecology relevant to interactions in the SPF: Once hawksbill turtles reach 30 to 40 cm curved carapace length, they end their pelagic phase and settle and forage in tropical tidal, sub-tidal coral and rocky reef habitat. They primarily feed on sponges and algae. They have also been found, though less frequently, within seagrass habitats of coastal waters, as well as the deeper habitats of trawl fisheries. The Hawksbill Turtle migrates up to 2,400 km between foraging areas and nesting beaches.
Risk profile: Interactions are unlikely. This species range overlaps with the SPF along the eastern coast of Victoria, NSW and southern QLD. Incidental bycatch or entanglement in commercial fishing operations is a key threat for this species, but there are few recorded interactions. The pelagic phase may increase the risk of bycatch in the SPF and drifting on ocean currents may increase the risk of boat strike.
173
5.3 Conservation status of the species nationally
Listed in Table 1.1.
5.4 Description of the nature and extent of interactions between turtles and trawl fisheries
Wallace et al. (2013) have recently published a review of the global bycatch interactions of sea turtles with fisheries. The researcher’s compiled a comprehensive database of reported data on sea turtle bycatch in multiple fishing gear categories worldwide from 1990–2011. Trawls were divided into shrimp trawls, bottom trawls, midwater trawls (although this category was later eliminated due to extremely low number of records) and other trawls. They calculated global bycatch impact scores, which integrated information on bycatch rates, fishing effort, turtle mortality rates, and body sizes (as proxies for reproductive values) of turtles taken as bycatch. Impact scores for turtles were significantly higher in trawl gear (2.02) compared to longline (1.66) and net (1.94) fishing gears, despite having more overall reports of turtle bycatch in longline gear.
Trawl bycatch occurred most prevalently in nearshore areas. There was a lack of regional or species-specific patterns in bycatch impacts across fishing gears suggesting that gear types and Regional Management Units (RMUs) in which bycatch has the highest impact depend on spatially-explicit overlaps of fisheries (e.g., gear characteristics, fishing practices, target species), sea turtle populations (e.g., conservation status, aggregation areas), and underlying habitat features (e.g., oceanographic conditions). Gear fixed to the ocean bottom appeared to have higher mortality rates and bycatch impact scores than gear close to the surface, free of bottom-set anchoring, although these differences were not statistically significant, possibly because of limited sample size and reduced statistical power. This general pattern was attributed to the air-breathing nature of sea turtles; when turtles become hooked, entangled, or trapped in fishing gear that prevents them from reaching the surface to breathe, the likelihood that these interactions result in mortality will be higher (Wallace et al., 2013). The highest bycatch rates and levels of observed effort for each gear category occurred in the East Pacific, Northwest and Southwest Atlantic, and Mediterranean regions. Generally, BPUEs (Bycatch per Unit Effort) and mortality rates were inversely related to amounts of observed fishing effort as well as the associated number of bycatch records (Wallace et al., 2013).
Key points: Bottom-set trawlers had higher rates of turtle mortality compared to other gear types and bycatch was most prevalent in nearshore waters. The Mid-water trawl category was removed from the Wallace et al. (2013) review because of the low number of recorded turtle bycatch in that gear type.
5.5 International interactions between turtles and trawl fisheries
Most bycatch data is obtained from observer programs and logbook records. Several studies have correlated patterns of beach strandings with seasonality and intensity of fishing operations. However, parsing the relative contribution of fisheries-related mortalities from the overall number of beach strandings is not straightforward (Wallace et al., 2008).
5.1.5 United States
Finkbeiner et al. (2011) compiled the first cumulative estimates of sea turtle bycatch across fisheries of the United States (U.S.) between 1990 and 2007, before and after implementation of fisheries-specific bycatch mitigation measures. An annual mean of 346,500 turtle interactions was estimated to result in 71,000 annual deaths prior to establishment of bycatch mitigation. Since implementation of mitigation measures,

174
bycatch levels are ~60% lower (137,800 interactions) and mortality estimates are ~94% lower (4,600 deaths) than pre-regulation estimates.
Bycatch estimates for sea turtles were calculated for 21 U.S. Fisheries in 2005, and included all U.S. sea turtle populations, with a total of 11,772 individual animals (National Marine Fisheries Service, 2011). In U.S. fisheries of the Pacific Ocean, primary concerns are for leatherbacks and loggerheads, due to their critical conservation status (Moore et al., 2009). Turtle bycatch was recorded for bottom trawls, scallop trawls and dredges and shrimp trawls, not pelagic trawls (Moore et al., 2009). The highest sea turtle bycatch estimates were for the Southeast Region (48 fisheries), with a total sea turtle bycatch estimate of 10,671 individuals per year (shrimp trawl fishery estimates only included mortalities) (National Marine Fisheries Service, 2011). Most sea turtle bycatch were loggerhead (5,209 animals), Kemp’s ridley (4,222), and leatherback (537) turtles. Most bycatch occurred in the Southeastern Atlantic (1,901 turtles) and Gulf of Mexico shrimp trawl fisheries (6,849 turtles). Data was obtained based on fishing effort reported in 2001, and from observer programs ranked as having adequate coverage (12 fisheries observed, 2,657 sea days for the Southeast Region, average <2.25% from 2005-2008 for the shrimp trawl fishery) and mandatory logbook programs were used for nine fisheries of the Southeast Region. The National Academy of Sciences panel estimated kills as high as 55,000 sea turtles per year in the Gulf of Mexico shrimp trawlers (Cox et al., 2007).
For other trawl fisheries in the U.S., only loggerhead turtles were caught. During 1996–2005 in the Northeast Region, across nine gear types, 1,062 loggerhead sea turtles were caught per year, with an estimated annual average of 136 in the Mid-Atlantic scallop trawl fishery (2004–05), 310 in the Mid-Atlantic scallop dredge fishery (2003–05), and 616 in the Mid-Atlantic otter trawl fishery (1996–2004) (National Marine Fisheries Service, 2011).
Turtles are also incidentally captured in the try nets or sample trawls that are used to indicate what the large nets are catching. It was believed that they had little impact on sea turtle mortality because they are pulled in frequently. However, in almost 20,000 hr of tows conducted between 1992-1995 in U.S. waters, 41 turtles captured in try nets were recorded by NMFS observers for a calculated catch rate of about 0.002 turtles/net hr/try net (average try net size is 15 ft, or 4.6 m) (Oravetz, 1999)
Murray and Orphanides (2013) developed generalized additive models (GAMs) to describe fishery-independent encounter rates of loggerhead turtles observed in aerial and resource surveys in the US mid-Atlantic region as a function of environmental variables. The preferred model predicted 85% of the observed bycatch events when grouped by latitude and season.
Large factory trawlers typically target cold water fish species where sea turtles are unlikely to occur. However, in the U.S. Gulf of Mexico shrimp fishery, the simultaneous use of four 100 ft (30.75 m) trawls by large shrimp vessels is not uncommon (Oravetz, 1999). The Southeast/Gulf of Mexico Shrimp Trawl fishery accounts for 98% of sea turtle bycatch, but estimates have high uncertainty due to lack of observer coverage. The estimates represent minimum annual interactions and do not include potential interactions from unobserved fisheries. Fisheries with turtle interactions included longlines, gillnets, bottom-dredging, pound nets and hook and line; there were no pelagic trawlers in the records (Finkbeiner et al., 2011).
Key points: Shrimp trawlers accounted for 98% of sea turtle bycatch and bycatch levels are 60% lower since implementing bycatch mitigation measures. Latitude and season are important for predicting loggerhead turtle bycatch.

175
5.1.6 Mauritania
Foreign freezer trawl sector: Fishing activities typically occur in pelagic shelf waters (40-200m deep) off southern Mauritania (17⁰N) in early May, and off Cap Blanc (20⁰45'N) in July. Trawlers in this sector operate both day and night, and average 3.2 sets a day, with each set lasting 3-5 hours. They often concentrate their efforts on sea-surface temperature fronts (Zeeberg et al., 2006). The fleet preferably used the smaller 4,300m (circumference) meshes trawl (70×30 m net opening), which is more easily manoeuvred in shallow waters above the shelf.
The foreign freezer trawlers appear to make few incidental captures of sea turtles in Mauritania (Table 5.2 in Zeeberg et al., 2006). It was estimated that one turtle per month was captured, summed per 100 trawl sets, or about 31 days on average. Turtles made up 1% of pelagic megafauna bycatch for the trawlers and 100% were released through the excluder device tested by Zeeberg et al. (2006). The excluder consisted of a gear modification that guided pelagic megafauna deflected by a filter to an escape tunnel along the bottom of the trawl.
Captured animals include the turtle species leatherback, loggerhead, and hawksbill. Sea turtles are listed as critically endangered (http://www.redlist.org) and between 2001 and 2005, freezer-trawlers captured up to 50 turtles, although this seems low, it may be unsustainable because of the threatened species status of these species (Zeeberg et al., 2006).
Key point: The foreign freezer trawlers of Mauritania made few incidental captures of sea turtles. However because of their threatened status, this bycatch may still be unsustainable.
5.1.7 Mediterranean
The Italian and Turkish neritic trawl fleet have recorded loggerhead turtle bycatch (Wallace et al., 2008). From 1999-2000 the Italian trawlers in the Mediterranean captured 61 turtles with a 14% mortality rate and an estimated total of 613-6,563 turtles per year. The Turkish trawlers captured 86 turtles with a 13% known mortality rate and 87% released post capture (no annual estimate was provided). The loggerhead turtles captured in neritic trawlers were larger than those captured in oceanic and pelagic longlines, reflecting the preferred habitats of the age (size) classes: juveniles in oceanic and pelagic environments and adults in coastal waters (Wallace et al., 2008). This study also identified a lower size-selectivity of turtles captured in driftnet and trawl gear relative to longline gear.
Key point: Trawl gear captures a larger variety of sizes of sea turtles than longline gear and captures in trawl gear reflected turtle life history. Larger individuals were captured inshore, and smaller individuals in pelagic and oceanic environments.
5.6 Australian interactions between turtles and trawl fisheries
Only shrimp trawl fisheries in the north and east of Australia were identified by Wallace (2013) as having turtle bycatch interactions. The Northern Prawn Fishery (NPF) (Poiner & Harris, 1996; Robins et al., 2002a; Tuck et al., 2013), the East Coast Otter Trawl Fishery (ECOTF) and the Ocean Trawl Fishery off N.S.W. have reported turtle interactions (Limpus & Reimer, 1994) (Limpus, 2008; NSW Department of Primary Industries, 2004; Robins & Courtney, 1998; Robins, 1995; Robins, 2002; Robins & Mayer, 1998). Turtle interactions are also reported in the Coral Sea Fishery (CSF) trawl vessels when fishing for crustaceans (Tuck et al., 2013). The Moreton Bay fishery of the ECOTF, located to the east and inshore of the SPF, has been a hotspot for sea turtle interactions (Robins & Mayer, 1998). The EPBC Act SPRAT database (SEWPaC, 2009a) identified trawler interactions for the 'Incidental catch (bycatch) of sea turtles during coastal otter-trawling operations in Australian waters north of 28°S'. This involves the catch of sea turtles during trawls for

176
penaeid prawns and scallops that use the outward force of otter boards to spread the mouth of a net. The net is configured to trawl the fishing grounds with the footrope or a 'tickler' chain in contact with the substrate and a headline with fixed floats to open the net vertically. Sea turtles are taken by this trawling method and can be injured during the trawl and/or become trapped in the cod-end of the net where they will drown during trawls. Western Australian fisheries suggests that some turtles are taken, with some being killed, but that current impact would probably be much less than that ascribed to the Northern Prawn Fishery (Prince, 1994).
5.1.8 Northern Prawn Fishery
In the late 1980s, 5,000 to 6,000 sea turtles were caught each year as bycatch in the Australian NPF (off the north coast of Australia) (Limpus, 2008). This fishery uses demersal otter trawls with offshore vessels. Six species of sea turtles live in the prawn trawling areas of northern Australia: the flatback, olive ridley, green turtle, hawksbill, loggerhead, and leatherback. Data was collected during a two year (1989 and 1990) monitoring program of the tiger prawn trawlers using trained observers to record turtle bycatch for a least seven consecutive days per month per season. A total of 165 turtles were captured in 1989 in 3,313 trawls, and 161 in 1990 in 3,092 trawls. Five species of turtles were captured: the flatback (59% of the total), loggerhead (10%), olive ridley (12%), green turtle (8%) and hawksbill (5%) (Poiner & Harris, 1996). Hamann et al. (2006 in Limpus 2008a) report that leatherback turtles were rarely caught in trawling activities, with less than one death of leatherback turtle per year between the 1970s to the 1990s. Since the introduction of TEDs in the NPF in 2000, there has been no recorded bycatch of leatherback turtles (Perdrau & Garvey 2005 in Limpus 2008a).
The turtle catches varied with water depth: the highest catch rates (0.068 ± 0.006 turtles per trawl) were from trawls in water between 20 and 30 m deep, relatively few turtles (10%) were captured deeper than 40 m (25% of trawls). The incidence of capture in the commercial fishery was 0.051 (±0.003) turtles per trawl towed for about 180 min, with 0.007 (±0.001) turtles per trawl drowning in the nets. Based on the fishing effort (27,049 d for 1989 and 25,746 d for 1990), it was estimated that 5,503 (±424) turtles were caught and returned to the sea in 1989 and 5,238 (± 404) in 1990, of which 567 ± 140 drowned in 1989 and 943 ± 187 in 1990. In 1990, an estimated 25% of all captured turtles suffered some non-lethal damage; an estimated 21% of turtles were captured comatose and 4% were injured (Poiner & Harris, 1996).
The use of TEDs was made compulsory in the NPF in 2000 (Tuck et al., 2013). Before TEDs were introduced, an average 0.24 turtles were caught per Banana Prawn trawl, and 0.30 turtles per Tiger Prawn trawl. Since the introduction, the capture rates have dropped to 0.007 and 0.009 turtles per Banana Prawn and Tiger Prawn trawl, respectively. Some turtles are still caught because the TED becomes blocked (e.g. with starfish), small turtles pass through it, or the net is winched up before the turtle has reached the TED. Turtles are also caught in the 'try gear' (small trawls to sample prawn density before the main trawl, which are not required to be fitted with TEDs), but the duration of these captures is short and unlikely to drown turtles (Robins et al., 2002a). Due to significant spatial differences in catch rates of total bycatch, the diversity of TED and BRD types used throughout the fishery and the lack of comprehensive data on bycatch recorded by the commercial fleet, it is difficult to estimate current total bycatch volume caught across the fishery with acceptable accuracy (Tuck et al., 2013).
5.1.9 East Coast Otter Trawl Fishery
Based on logbook records, Robins (2002) found that an annual estimated 5,900 sea turtles were caught in Queensland in the ECOTF each year with a mean annual total fleet effort of 85,000 days by 105 fishers between 1991-1996. Six species of turtles were captured: the loggerhead (50%), green turtle (27%), flatback (16%), olive ridley (6%), with minimal captures of leatherback and hawksbill turtles (Robins, 2002).

177
However, only 1% to 7% of these turtles died, because the duration of trawls was generally short enough not to drown them (less than 80 min) (Robins, 1995; Robins & Mayer, 1998). Greater than 90% of all turtles caught in the Queensland Trawl Fishery were healthy when first landed on the boat. Four percent were reported as comatose and 1% were reported as dead (Robins & Mayer, 1998). The loggerhead turtles captured included the adult and large immature size ranges. The majority of loggerhead turtles were trawled in three areas: off Mackay, Bundaberg to Bustard Head and Morton Bay (Limpus & Reimer, 1994). The inshore waters of the Queensland east coast were the most critical areas for sea turtle bycatch and the use of TEDS (compulsory after 1999) was prioritised to minimise turtle mortality.
Key points: Sea turtles are considered at medium risk in the SPF. However, shrimp trawlers in tropical and subtropical waters account for the majority of sea turtle bycatch in Australia.
TEDs reduce bycatch rates. Tow times of less than 80 min reduce mortality of those caught because they can be released alive. Some turtles are still caught because the TED becomes blocked (e.g. with starfish), small turtles pass through the TED, or the net is winched up before the turtle has reached the TED. Even prior to the use of TEDs, leatherback and hawksbill turtles were rarely caught.
5.1.10 Ocean Trawl Fishery off N.S.W.
The NSW ocean prawn trawl fishery interacts with various species of turtle, particularly in waters north of South West Rocks. The level of interaction is thought to be low, however it is not monitored or accurately recorded. Many fishers are aware of how to revive and release turtles that have been taken in nets. Turtle Exclusion Devices are mandatory in the Queensland East Coast Trawl Fishery, but not in NSW (Department of Primary Industries and Investment NSW, 2010; NSW Department of Primary Industries, 2004). No data pertaining to turtle bycatch was readily available for this fishery.
5.1.11 Coral Sea Fishery
The CSF uses otter trawlers and covers waters from the east of Sandy Cape (Fraser Island) to east of Cape York. The Fishery commences east of the Great Barrier Reef Marine Park and extends to the edge of the Australian Fishing Zone. This fishery uses demersal and midwater trawl gear. There are no size limits on boats, and there are no TACs or quotas. Input controls include gear restrictions of a minimum mesh size and fitting of Turtle Exclusion Devices (TEDs) for crustacean trawling operations (Tuck et al., 2013). Although turtles were afforded a high risk rating in this fishery, there have been no reported interactions with turtles in the CSF. This is supported by observer coverage which covers a minimum of 25% of trips, although the reader is reminded that the observer data are sporadic due to the small number of total trips and that turtles do occur at a wide range of depths encompassing the range of depths over which CSF trawling is undertaken (Tuck et al., 2013).
5.7 Threats to turtles by fishing operations or other risks
5.1.12 Boat strike
Moving boats have the potential to cause sea turtle injury or death, particularly in coastal waters through boat strike or propeller damage (FAO, 2010). Boat strikes are particularly common in Queensland where there is a lot of inshore boat activity between the coast and nearby islands and reefs. Most boat strike mortality data is obtained from strandings. Limpus (2008) details the death of five olive ridley turtles (from 1996–2003) and 12 loggerhead turtle deaths from (1998-2002) from boat strike in Queensland. Between 1998 and 2002, an average of 57 (±12 S.D.) Green turtles were recorded killed by boat strike and propeller cuts in Queensland (Limpus, 2008). More adult-sized green turtles are killed (60%) because of the overlap

178
between inshore boat activity and the presence of adult turtles. Given that strandings provide an incomplete census of the actual number of turtles being killed by boating interactions, it is expected that the number of green turtles that die from this source annually in Queensland could be in the low hundreds (Limpus & Reimer, 1994).
Collision between small, fast boats and turtles has been reduced in Moreton Bay since late 1990s when extensive areas of shallow sea grass habitat that support a high density of foraging turtles started to be managed as go-slow area within the Moreton Bay Marine Park (Limpus & Reimer, 1994).
Key point: Boat strike is possible but not a commonly reported phenomenon. However, boat strike of turtles by large vessels may go unnoticed and unreported.
5.1.13 Marine debris
Turtles are threatened by lost fishing gear which can result in “ghost fishing” and threatens sea turtles. Ghost fishing occurs when lost or discarded gear continually catches turtles and reduces their ability to forage and swim (FAO, 2010; Macfadyen et al., 2009). The development and implementation of methods to facilitate the retrieval of derelict fishing gear and other marine debris is encouraged, in part to reduce adverse effects of marine debris on sea turtles. For example, the Republic of Korea has an incentive programme for fishers to retrieve marine debris, and the fishery management authority for the Hawaiian longline fisheries has created a seaport reception facility to receive and recycle derelict fishing gear that is voluntarily collected on fishing grounds in the North Pacific (FAO, 2010). CSIRO have also been studying marine debris along the north coast of Australia http://www.csiro.au/science/marine-debris.
Ghost netting sourced from bottom set trawl nets off foreign vessels are causing great harm to marine animals in Australia, especially turtles (Kiessling, 2005 in Macfadyen et al. (2009)). Monofilament line nets and ropes are the most common net entanglement type in turtles (Macfadyen et al., 2009). However, entanglement in trawl net does occur: a juvenile hawksbill turtle was found dead in a beach-washed trawl net on Hawk Island, Northern Territory, August 1992 and another in a beach-washed trawl net at Duyfken Point, Weipa, November 2000 (Limpus & Reimer, 1994).
5.8 Regional differences in the groups impacted by trawl fisheries
In the past, prawn trawlers were considered to cause more deaths than any other gear type and to be a major contributor to the global sea turtle decline (Robins et al., 2002b). Two Australian fisheries were considered the main threat, the Australian NPF and the Queensland East Coast prawn fishery. However, the introduction of TEDs is expected to reduce the mortality events greatly. The stout whiting trawl fishery on the south east of QLD has also been associated with loggerhead turtle mortalities based on evidence from beach-washed dead turtles (Limpus & Reimer, 1994).
The large factory-freezer trawler proposes to work within the boundaries of the SPF that extends from southern Queensland to southern Western Australia (Moore & Skirtun, 2012). Turtle interactions are still possible within the SPF but with a reduced number of species (four) and at a reduced likelihood compared to trawling activity in the northern oceans of Australia.
Ocean warming may also cause sea turtle ranges to expand further south increasing both the number of species with interactions and the likelihood of interactions (SEWPaC, 2009b; Limpus, 2008). Likelihood of interactions may increase further north in the Eastern Zone (Zone D) of the SPF, as ocean temperatures increase. Boat strike is a risk for these turtles.
179
5.1.14 In the Small Pelagic Fishery (SPF)
In Australia, sea turtle interactions occur most frequently in the shrimp trawlers of tropical and subtropical zones (Section 1.6).
The geographic extent of the SPF zone overlaps with several other state and commonwealth fisheries. Consequently, bycatch issues within these fisheries may assist in determining risk of interactions with turtles in the SPF. Only the Queensland East Coast Otter Trawl was identified as having interactions with sea turtles within the north eastern boundary of the SPF (Northern NSW to Moreton Island). This fishery operates in Queensland waters between the Queensland/New South Wales border and Cape York. It is a multi-species fishery targeting prawns, scallops and finfish through the use of several types of trawl apparatus (Environment Australia, 2003; Robins, 1995). Fishing operations within Australian waters north of 28 degrees South' was listed as a key threat to sea turtles.
No interactions with threatened, endangered and protected species (TEP species) have been reported in the mid-water trawl fisheries of the SPF since the 2009 Workplan commenced (AFMA, 2011; Tuck et al., 2013). Note that there has been very limited effort in the SPF since the introduction of the 2009 Workplan, with close to zero midwater trawl effort.
Key point: There have been no reported turtle mortalities or incidental catches in the midwater trawl fisheries of the SPF since 2009. However, fishing effort has also been close to zero. Turtles are captured in other fishing operations within the range of the SPF, such as the Ocean Trawl Fishery off N.S.W.
5.9 Are there any turtle mitigation devices or measures?
5.1.15 Turtle exclusion devices
Turtle Excluder Devices (TED) have been progressively introduced into trawl fisheries since the eighties (Chabouda & Vendeville, 2011; Epperly, 2003; Gearhart, 2010). TED concepts have developed from attempting to prevent turtles from entering the net, which also reduced target catch, to allowing turtles inside the net to exit (National Marine Fisheries Service, 2013). Because of the tendency for turtles to swim upwards to exit the net, top-opening TED designs were used in 1982. The TED was of rigid construction located well inside the net. These were considered cumbersome and heavy by fishers and, therefore, lightweight materials such as fibreglass and plastic were used. Throughout the 1990s a variety of rigid and soft TEDs were in use and, in 2003, escape openings were enlarged allowing larger individuals and species, such as adult loggerhead turtles, to escape (Senko et al., 2013). A double-cover escape hatch allows for turtle exit but greater target catch retention. Most recent regulations and TED designs to protect sea turtles are found at http://www.nmfs.noaa.gov/pr/species/turtles/regulations.htm and https://www.federalregister.gov/articles/2012/05/10/2012-11201/sea-turtle-conservation-shrimp-trawling-requirements#h-8 and (https://www.federalregister.gov/articles/2012/05/21/2012-12014/sea-turtle-conservation-shrimp-and-summer-flounder-trawling-requirements) (NOAA Fisheries, 2012). For detailed NOAA approved TED design features see http://www.gpo.gov/fdsys/pkg/CFR-2011-title50-vol9/xml/CFR-2011-title50-vol9-sec223-207.xml.
The Nordmøre-type grid used in Barents Sea shrimp fishery has also been successful at mitigating turtle bycatch (Richards & Hendrickson, 2006; Zeeberg et al., 2006). It has been estimated that TEDs excluded 97% of the turtles caught in U.S. shrimp trawls in 2005 (National Marine Fisheries Service, 2011). Analyses by Epperly and Teas (2002) indicated that the required minimum escape opening dimensions were too small, and that as many as 47% of the loggerheads stranding annually along the Atlantic seaboard and Gulf of Mexico were too large to fit through existing openings. On 21 February 2003, NMFS published a final rule

180
to require larger escape openings, reducing Leatherback turtle mortality by an estimated 97% (Finkbeiner et al., 2011; Senko et al., 2013).
From 1993-2004, the majority of turtle catches in the New England and Mid-Atlantic regions occurred in the inshore fisheries (NOAA Fisheries, 2006). In a workshop on turtle and cetacean bycatch and mitigation in 2006, it was identified by industry that while TEDs may be appropriate for smaller vessels, it would not be practical in the large boat – large net fisheries due to problems with handling the large TEDs (NOAA Fisheries, 2006).
TED effectiveness is maximized through proper placement and installation, configuration (e.g., width of bar spacing), flotation, and more widespread use. TED compliance is a significant factor in reducing turtle mortality rates. Dockside enforcement of TED use is inadequate and at-sea enforcement is extremely difficult because it is possible for a TED to be installed in a net but for the escape flap by which a turtle would be excluded to be sewn shut (Cox et al., 2007).
The compulsory use of TEDs has been regulated in the NPF since April 2000, East Coast Trawl Fishery since December 2000, Torres Straight Prawn Fishery since March 2002 and Western Australian prawn and scallop trawl fisheries since 2002. The T4 stout whiting trawl fishery in south Queensland prevents interactions with endangered species through the enforcement of closed waters and mandatory use of TEDs otter trawl gear . Over the 2009 season, fishers recorded no catches of turtles (Queensland Government, 2011). The process for regulating the compulsory use of TEDs in trawl fisheries was partly facilitated by Otter Trawling being listed under the EPBC Act as a key threatening process (KTP) in 2001 due to the level of bycatch of sea turtles. TEDs are mandatory in Queensland otter trawl fishery, but not in NSW (NSW Department of Primary Industries, 2004; Tuck et al., 2013).
The TEDs used in the otter trawl fishery are defined as:
(a) A rigid or semi-rigid inclined barrier structure comprised of bars extending from the foot to the head of the net that is attached to the circumference of the net which must guide turtles towards an escape hole immediately forward of the grid; and
(b) An escape hole with the following minimum measurements when measured simultaneously with the net taut:
i) 760mm across the width of the net,
ii) a perpendicular measure of 380mm from the midpoint of the width measure; and
(c) A maximum bar spacing of 120mm. (Tuck et al., 2013)
The predominant midwater trawler in the SPF uses a bottom opening Seal Excluder Device (SED) with a large escape hole and steel grid (AFMA, 2011). The 2009 Workplan identified a trial of upward excluding SEDs which has not proceeded due to lack of funding and virtually zero midwater trawl effort in the fishery. The outcomes of a similar trial taking place in the Commonwealth Trawl Sector may be adopted for the purposes of the SPF should midwater trawl effort resume. SED design is typically fishery and species specific and has not been shown to work for sea turtles. Approved TED designs are available from Department of Primary Industries and Investment NSW (2010). However, two Bycatch Reduction Devices for trawlers in Mexico (the RS-INP shrimp trawl Bycatch Reduction Device (BRD) (developed by Mexico’s National Fisheries Institute; INAPESCA) and Scorpion and Box trawl BRD (developed by Southeast Fisheries Science Center)) have been shown to eliminate vaquita and sea turtle bycatch (Aguilar-Ramírez & Rodríquez-Valencia, 2010).

181
Key points: TEDs have been shown to significantly reduce sea turtle bycatch. NOAA identified that large net fisheries would not find it practical to use TEDs because of problems handling a TED large enough to for the large net size used.
The SPF uses SEDs but these are specific to seals and have unknown success rates for turtle bycatch mitigation (if there are turtle interactions with factory trawlers in the SPF).
5.1.16 Spatial and temporal area closures
There are well known areas and periods where overlaps of turtle distribution and fishing activity occur. Some sea turtles follow narrow migratory corridors from nesting beaches to foraging grounds, traversing several thousand kilometres. Other turtles are known to consistently migrate along specific routes to highly productive areas, or congregate at foraging grounds. For example, sea turtles have been tracked to frontal zones and eddies that are high in chlorophyll and plankton productivity. However, these are oceanographic features that are also sought out by fishers and therefore result in interactions between fishing gear and turtles (FAO, 2010).
Because distribution of sea cheloniid turtles appears to be related, in part, to sea surface temperature (SST) along the Atlantic coast of the USA, the ability to predict water temperature over the continental shelf could be useful in minimizing turtle–fishery interactions (Braun-McNeill et al., 2008). Of those loggerhead turtles that stranded, were sighted, or were incidentally captured between Cape Hatteras, North Carolina, and Cape Cod, Massachusetts, those at lower latitudes occurred when 25% or more of the area reached a water temperature of 11°C, while those in the northern zones did not occur until 50% or more of the area had reached a water temperature of 14°C. This predictor of sea cheloniid turtle presence may be helpful in regulating fisheries that seasonally interact with turtles.
Area and seasonal closures enable sea capture fisheries to avoid peak areas and periods of sea turtle foraging, nesting and migration. Although closed areas can have substantial adverse economic effects on the fishing industry, they are a tool that fishery managers can use to complement other management measures. A closed area may also be a more desirable option than a closed fishery (FAO, 2010).
The occurrence of beach-washed, dead, gravid female loggerhead turtles along the Bundaberg District coast Queensland has been almost entirely eliminated since the declaration of the Woongarra Marine Park in 1991 and the cessation of the prawn trawling in the region (Limpus, 2008).
The discovery of narrow migration corridors used by the leatherback turtles in the Pacific Ocean raised the possibility of protecting the turtles by restricting fishing in these key areas (Ferraroli et al., 2004). Satellite tracking showed that there was no equivalent of these corridors in the North Atlantic Ocean, because the turtles disperse actively over the whole area. However, ‘hot spots’, such as productive frontal areas associated with the equatorial current systems, were identified where leatherback turtles and fisheries overlapped and where conservation efforts should be focused (Ferraroli et al., 2004).
A time–area closure in the mid-1990s dramatically reduced bycatch of leatherback turtles from 14 per year to zero in the U.S. Northeastern Pacific gillnet fishery (Gilman et al., 2010; Senko et al., 2013). During a 4-year closure of the Hawaii longline swordfish fishery, leatherback bycatch was simply redistributed via other fisheries. In the North Atlantic, tagged animals travelled much farther distances, including to areas of high pelagic longline use and did not remain in the protected area (Senko et al., 2013).
Key points: Area and seasonal closures may enable fisheries to avoid peak areas and periods of sea turtle foraging, nesting and migration. Sea surface temperature and migration routes may helpful in regulating fisheries that seasonally interact with turtles.
182
5.1.17 Vessel communication
There is evidence that sea turtle captures can occur in clusters and real-time turtle bycatch hotspot avoidance can be achieved through fleet communication. If vessels report hotspots of turtle catches to other vessels, bycatch may be avoided (FAO, 2010). Therefore, after a turtle is caught, additional sea turtle interactions may be avoided by moving a fishing vessel away from the area or moving to an area where different oceanographic conditions prevail (e.g. where the sea surface temperature is different or there are no jellyfish aggregations) before making another set.
Key point: Vessel communication can minimise turtle interactions.
5.1.18 TurtleWatch
TurtleWatch is a map providing up-to-date information about the thermal habitat of loggerhead sea turtles in the Pacific Ocean north of the Hawaiian Islands (Howell et al., 2008). It was developed to reduce loggerhead turtle bycatch rates in the Hawaii-based longline fishery during 1994 to 2006. Operational longline fishery characteristics, bycatch information, and satellite tracks were all used in conjunction with remotely sensed sea surface temperature data to identify the environmental area where the majority of loggerhead turtle bycatch occurred. It was recommended that shallow sets should only be deployed in waters south of the 18.5°C (~65.5°F) isotherm to decrease loggerhead turtle bycatch. TurtleWatch was released to fishers and managers in electronic and paper formats on December 26, 2006. The observed fleet movement during the first quarter of 2007 was to the north of the 18.5°C (~65.5°F) isotherm (i.e. in the area recommended for avoidance by the TurtleWatch product) with increased effort and lower bycatch rates.
Key point: TurtleWatch provides an up to date map of likely turtle habitat, allowing vessels to avoid the identified turtle ‘hot-spots’.
5.1.19 Turtle catch limits and triggers
The U.S. National Marine Fisheries Service has established annual catch limits (caps) for loggerhead and leatherback captures for some domestic longline fisheries (FAO, 2010). From 2004 to 2010, leatherback turtle interactions in the Hawaii shallow-set longline fishery were below the 16-leatherback limit. However, in November of 2011, the fishery reached the 16-leatherback limit and was immediately closed for the remainder of the year (NOAA, 2012 in (Senko et al., 2013)).
Spotila et al. (2000) calculated population levels of the East Pacific leatherback turtle population and calculated sustainable anthropogenic levels of mortality. Assuming leatherbacks can withstand a 1% annual mortality from anthropogenic factors, the East Pacific population can tolerate the annual loss of 17 adult females and 13 subadult females per year. Understanding population rates for turtle species that overlap with fisheries can assist managers to apply catch limits to incidental mortality rates of sea turtles.
The 2009 Workplan for bycatch and discards management in the SPF included the development of triggers to identify shifts or expansion of effort within the fishery. Triggers included any increased interaction with TEP species. AFMA and the SPFRAG are continuing to develop triggers and performance measures based on recent research. Triggers have not yet been put in place in the SPF (AFMA, 2011).
Key points: Catch limits may be used to minimise total turtle mortality in a fishing season. Triggers such as increases in catch rates of turtles can also be used.
183
5.1.20 Trade embargos
Since 1989, U.S. legislation (section 609 of U.S. Public Law 101–162 enacted in 1989) banned shrimp imports from countries where TED were not used. Disruptions to international trade activity have the potential to significantly and increasingly impact upon the Australian fishing industry (Robins et al., 2002b). The U.S. embargo existed for shrimp products that were not able to obtain a turtle-safe shrimp certification. This certification (Section 609) is available to
• countries with a fishing environment that does not pose a threat of incidental takings of sea turtles because of:
a) an absence of the species within its jurisdiction,
b) exclusive use of harvest methods which do not pose a threat to sea turtles, or
c) whose commercial harvest occurs exclusively in areas where sea turtles do not occur; or
• • harvesting nations that provide documentary evidence of the adoption of a regulatory program governing the bycatch of turtles in shrimp trawling operations to the effect that:
a) requirements to use turtle excluder devices (TEDs) are comparable in effectiveness to those in the U.S. – that is a 97% turtle exclusion rate, and
b) credible enforcement including monitoring, compliance & appropriate sanctions.
The NPF Fishery and the Spencer Gulf Prawn Fishery obtained the certification. However, in 2007, the U.S. embargo still applied to the East Coast Trawl Fishery and all of the Western Australian fisheries because the certification had not been obtained.
Key points: Trade Embargoes are useful for raising public awareness and improving public education about bycatch. They also encourage improved fishing practices.
5.1.21 Observer programs and logbook data
In 2010, Small Pelagic Fishery Resource Assessment Group (SPFRAG) and Small Pelagic Fishery Management Advisory Committee (SPFMAC) resolved the following for midwater trawl boats: an observer coverage target of 20% of shots and observer coverage of the first 10 trips for new boats entering the fishery, or existing boats moving into significantly new areas (AFMA, 2011).
The particular recommendations for the collection of information and data were:
(i) The collection of information on sea turtle interactions in all fisheries, directly or through relevant Regional Fisheries Bodies (RFBs), regional sea turtle arrangements or other mechanisms.
(ii) Development of observer programmes in fisheries that may have impacts on sea turtles, where such programmes are economically and practically feasible. In some cases, financial and technical support might be required.
(iii) Joint research with other states and/or FAO and relevant RFBs.
(iv) Research on the survival of released sea turtles.
(v) Research to identify areas and time periods characterized by high sea turtle interactions.
(vi) Research on the socio-economic impacts of sea turtle conservation on fishers and fishing industries and ways to improve communication.
(vii) Use of fishing communities' traditional knowledge about sea turtle conservation.

184
Key point: The SPF has an observer program and logbook reporting, with recommendations for the research and management of turtle bycatch.
5.1.22 Individual Vessel Management Plans
The 2009 Workplan for bycatch and discards management in the SPF included the development and implementation of individual vessel management plans (VMP) to minimise TEP species interactions and record procedures for reporting on catch and wildlife interactions (AFMA, 2011). A VMP for the predominant trawler in the SPF has not been implemented because of the minimal effort since the 2009 Workplan. VMPs have been prepared for boats in the Commonwealth Trawl Sector and will be able to be adapted to SPF trawl boats. A VMP observer is available to develop the plan when midwater trawl effort recommences in the fishery.
Key point: Individual VMPs have been prepared for the Commonwealth Trawl Sector and these will be able to be adapted for midwater trawlers of the SPF.
5.1.23 Reduced tow times
Reducing tow times to less than 80 minutes can improve sea turtle survival (Robins, 1995). However, recent research and review of physiological data suggest that forced submergence of turtles for even a few minutes causes changes in their blood chemistry. Recovery to normal levels is dependent on the length of time submergence is forced, as well as turtle size. For small turtles, recovery from even a few minutes of forced submergence can require as long as 24 hr. The outcome of resuscitating and releasing captured turtles is unknown without tagging programs (FAO, 2010; Oravetz, 1999). Thus, reduced tow times, which may negatively impact the fishery, may not be a viable alternative to TEDs where the mitigation has been well researched and shown to successfully allow the release of turtles (Oravetz, 1999).
Key point: Reducing tow times to less than 80 minutes can improve sea turtle survival, however TEDs may be a more viable mitigation method.
5.1.24 Resuscitation and Release
Sea turtles that are dead or actively moving should be released over the stern of the boat. In addition, they should be released only when trawls (or other offending gear) are not in use, when the engine gears are in neutral position, and in areas where they are unlikely to be recaptured or injured by vessels. Resuscitation should be attempted on sea turtles that are comatose or inactive but not dead by: (1) placing the turtle on its carapace (back) and pumping its plastron (breastplate) with hand or foot, or (2) placing the turtle on its plastron and elevating its hindquarter several inches for a period of 1-24 hr. This allows water to drain from the lungs. The amount of elevation depends on the size of the turtle; greater elevations are required for larger turtles. Sea turtles being resuscitated must be shaded and kept wet or moist (FAO, 2010; Oravetz, 1999). A 'turtle recovery procedure' brochure published by the Queensland Commercial Fisherman's Organisation and the Queensland Department of Primary Industry explains how to do this. A modification of the procedure involves placing a small plastic pipe into the turtle's windpipe and blowing gently (Robins et al., 2002a).
Seven post-capture turtles were released with Time Depth Recorders (TDR) attached to them to observe post-release behaviour and survival (after average tow times of 80 min) (Robins & Courtney, 1998). The data recorded indicates that trawl capture resulted in appreciable behavioural changes, i.e. an increased amount of surfacing. It appeared that small turtles took longer to recover than large turtles, and no mortalities occurred.

185
Key point: Captured, comatose turtles can be resuscitated and released.
5.1.25 Mitigation and Loggerhead turtles
Limpus (2008a) documents many records of incidental capture and death of loggerhead turtles and concludes that the trawl fisheries off the coast of NSW, Queensland, Northern Territory and Western Australia have had, prior to the introduction of TEDs, the potential to kill many hundreds, or possibly thousands, of loggerhead turtles annually since the late 1970s. In 1994, Limpus and Reimer (1994) implicated trawling as a significant contributing factor in the decline of the eastern Australian loggerhead turtle sub-population. The introduction of TEDs has, however, significantly reduced capture and mortality of loggerhead turtles in association with trawling. For instance, while Poiner and Harris (1996) estimated that the Northern Prawn Fishery killed 163 and 67 Loggerhead Turtles in 1989 and 1990 respectively, between 2002–2004, this same Fishery recorded only one death of a loggerhead turtle and two 'released alive' loggerhead turtles through incidental bycatch during this three year period (Perdrau & Garvey 2005 in Limpus 2008a). This fishery recorded one death of a loggerhead turtle and four 'released alive' between 2005–2007 (Ciccosilla 2008 in Limpus 2008 a).
During 1 January – 19 March 1998, 20 beach-washed, dead, loggerhead turtles were reported from North Stradbroke Island to Gold Coast in SE Queensland for which there was direct or circumstantial evidence that these mortalities originated from drowning in an adjacent stout whiting trawl fishery (EPA Marine Wildlife and Mortality Stranding database in (Limpus & Reimer, 1994)).
A minimum of 61 adult female and 8 other Loggerhead turtles were beach-washed dead on the Bundaberg coast from the Kolan River to Elliot River adjacent to the Mon Repos rookery over six turtle breeding seasons 1983–1989 and this mortality of breeding females was attributed to drowning in the prawn trawls (Limpus & Reimer, 1994). The occurrence of beach-washed, dead, gravid female Loggerhead turtles along the Bundaberg District coast has been almost entirely eliminated since the declaration of the Woongarra Marine Park in 1991 (Limpus, 2008).
Key point: Loggerhead turtles are a case study for successful mitigation of sea tutle bycatch in Australia. Both the application of TEDs and Marine Parks has reduced Loggerhead turtle mortality.
5.10 National application of mitigation methods
No commercial harvesting of sea turtles is permitted in Australia. Commonwealth By-catch Action Plans state that the catch of sea turtles must be reported and By-catch Reduction Devices (e.g. Turtle Excluder Devices) must be used. By-catch Action Plans have been developed for the following trawl fisheries: Northern Prawn Fishery, Torres Strait Prawn Fishery, Shark Bay Scallop Fishery, Shark Bay Prawn Fishery, Exmouth Gulf Prawn Fishery, Nickol Bay Prawn Fishery, Onslow Prawn Fishery, Kimberley Prawn Fishery, Broome Prawn Fishery and the Abrolhos Islands and Mid-West Trawl Fishery (SEWPaC, 2009b).
The Ocean Trawl Fishery of N.S.W. overlaps with the SPF and has a range of BRDs approved for the fishery (NSW Department of Primary Industries, 2004). This fishery must also record any turtle bycatch. Turtle exclusion devices are not mandatory in NSW ocean trawl nets. Based on previous observer studies and advice from industry, interaction with sea turtles is believed to be low, but there are few quantitative data (NSW Department of Primary Industries, 2004).
The Queensland Commercial Fisherman's Organisation, the Queensland Department of Primary Industries, the Australian Fisheries Research and Development Corporation, and the Australian Nature Conservation
186
Agency have together published a code of fishing ethics regarding the accidental capture of sea turtles (Robins et al., 2002a). The recommendations of this code include:
• Not trawling within two to three nautical miles of major nesting beaches during the turtle nesting season.
• Limiting the duration of trawls to less than 90 minutes in areas with high turtle numbers to minimise the number of netted turtles that drown.
• If turtles are caught, handling live and active individuals gently, and returning them to the water as soon as possible.
• Applying the recommended recovery procedure to comatose turtles.
• Participating in research programs on the incidental capture rate and the effectiveness of TEDs, and forwarding information on any tagged turtles caught to the Queensland Southern Fisheries Centre.
Shorter trawls reduce the chance of turtles drowning and being injured, and TEDs reduce the number of turtles caught. Since the use of TEDs was made compulsory in the Australian NPF in 2000, the catch of sea turtles has declined from around 5,000 to around 200 per year. The death rate of captured turtles has also nearly halved, from around 40% to 22%, because of improved turtle handling procedures and the fact that most turtles are now caught when the net is winched up, and spend little time in the net (Robins et al., 2002a).
A recovery procedure has been developed to revive sea turtles that have been caught in nets and brought on board in a comatose state. Comatose turtles (which appear to be lifeless and not breathing) will drown if returned to the water. Around half of the turtles tested with the resuscitation and recovery technique when they appeared to be dead recovered (Robins et al., 2002a).
Key point: There is a high likelihood of successfully mitigating turtle bycatch in the SPF.
5.11 Is the effectiveness of mitigation measures being investigated?
5.1.26 Internationally
The Strategy for Sea Turtle Conservation and Recovery in Relation to Atlantic and Gulf of Mexico Fisheries is a program devoted to reducing sea turtle bycatch by evaluating and addressing priority gear types on a comprehensive per-gear basis throughout the Atlantic and Gulf of Mexico, rather than fishery by fishery. This is because certain gear types are more likely to incidentally catch turtles than other gear types.
The Strategy involves the following major components:
• characterise the fisheries
• develop a geographical information system depicting sea turtle distribution, bycatch, fisheries effort, regulated areas, and oceanographic information;
• solicit constituent input on the Strategy framework, prioritization of gears, and management alternatives; and
• develop and implement management measures, where necessary, to reduce sea turtle bycatch.
The U.S. Southeast Shrimp Trawl Fishery Observer Program has been in existence since 1987, and is administered by the SEFSC Galveston Laboratory. The program was originally developed to provide an

187
economic evaluation of TEDs in shrimp trawls, and continues to focus on research (National Marine Fisheries Service, 2011).
NOAA performs a 5-year review of all species of concern in incidental bycatch. The sea turtle species are going through this process currently.
(https://www.federalregister.gov/articles/2012/10/10/2012-24935/endangered-and-threatened-species-initiation-of-5-year-review-for-kemps-ridley-olive-ridley).
NMFS gear technologists continue to work with industry on TED design and improvements are made nearly annually (National Marine Fisheries Service, 2013).
The World Wildlife Fund (WWF) supports the International Smart Gear Competition in 2004, with cash prizes totalling $57,500. The goal is to identify innovative and practical modifications or improvements to currently used gear with the potential to significantly reduce bycatch (NOAA, 2011).
The NMFS Southeast Fisheries Science Centre Harvesting Systems Unit conducts ongoing research to improve TED efficiency for sea turtle exclusion and target catch retention. Industry concepts directed at improving TED performance are evaluated through an annual TED testing project during which NOAA divers and TED specialists perform certification testing of new devices using captive-reared, juvenile sea turtles. Fishery-dependent testing of prototype TEDs to assess usability and target catch retention is performed and outreach programs to educate and update fishers on latest BRD gear are provided (NOAA, 2011) (http://www.sefsc.noaa.gov/labs/mississippi/fishinggear.htm).
Key point: The Strategy for Sea Turtle Conservation and Recovery in Relation to Atlantic and Gulf of Mexico Fisheries, the U.S. Southeast Shrimp Trawl Fishery Observer Program, NOAA, and WWF are continually revising turtle mitigation and TED design.
5.1.27 Nationally
In the NPF pairwise comparisons to assess TEDs and bycatch reduction devices (BRDs) found that upward- and downward-excluding TEDs performed about equally for most species groups, and the TED reduced the catches of turtles by 99% with a 6% reduction in catch but an improvement in its quality with less damaged target catch (Brewer et al., 2006). This study highlighted the importance of educating fishers to use the devices correctly for their success. It is now compulsory for all shrimp boats to use a TED (FRDC, 2012).
In Australia, the efficacy of TEDs in reducing bycatch has been achieved partly due to an outreach and education project initiated in 1996 (Robins 1997 & 1999, cited in Cox et al. 2007). Researchers loaned TEDs to commercial fishers so they could try TEDs before buying them. Then, research staff modified TEDs to suit individual fishers’ needs (e.g., modifications that reduced jellyfish bycatch thereby increasing prawn catch). Because trawl fishers had an economic incentive to comply with TED regulations and the opportunity to try TEDs before investing in them, 80% of fishers were using TEDs by 1999.
The proper handling of sea turtles after capture can enhance their survival rates (FAO, 2010).
Key points: Fishery compliance and education is the key to TED success and captured turtle survival.
5.12 Recommended management needs or research ideas
The likelihood and type of interactions between sea turtles and factory trawlers in the SPF is unknown, but based on the lack of interactions identified in trawl fisheries (other than the tropical and subtropical shrimp trawls) it is likely to be a low level of interaction. This needs to be confirmed by:
188
• data collection to assess whether sea turtle interactions are problematic; • research to identify potential methods for reducing sea turtle interactions and sea turtle
mortality; and • the implementation of effective turtle avoidance methods (FAO, 2010).
If an interaction is observed, the following ideas may be relevant:
Finkbeiner et al. (2011) and FAO (2010) identified a number of critical management needs in monitoring and mitigating sea turtle bycatch:
1. Cumulative take limits across fisheries should be estimated to identify whether population recovery goals would be impeded by fishery-related mortality. Evaluation of fishery-specific takes should be conducted within the context of such limits as a reference frame. Estimating appropriate take limits should incorporate information about population size and trends, conservation status, and other vital rates, and should be robust to plausible forms of uncertainty in these parameters.
2. Enhanced observer coverage is needed in fisheries with scant or non-existent bycatch data.
3. There should be increased reporting of demographic data (e.g. turtle body sizes) to improve our understanding of population impacts.
4. Better understand the behaviour of sea turtles in relation to the different characteristics of fishing gear and fishing methods.
5. Identify, with a high degree of certainty, the location of migratory routes, the timing of migrations and other sea turtle hotspots that could assist with the design of time or area closures for the fishing industry (FAO, 2010; Wallace et al., 2008). These are seasonal and predictable and can be easily incorporated into management plans (Hall et al., 2000).
6. Integrated management approaches should be considered, including gear modification, strict observer coverage, and adaptive spatial–temporal closures.
7. TEDs may require testing and reconfiguration until a fishery specific practical and viable TED design is identified.
8. Develop improved equipment and methods for handling and releasing turtles so as to optimize the likelihood of turtles surviving interactions with marine capture fisheries.
9. Assess the efficacy and commercial viability of alternative fishing gear designs and fishing methods. For example, after fleet-wide adoption of a turtle avoidance strategy, it is important to determine the economic effects of implementing the measures, and to assess efficacy to determine if there is consistency with observed results from trials.
10. Fisheries impacts should be considered in conjunction with those from neighbouring nations, high-seas fleets, and different resource- use sectors to provide a more cumulative and realistic picture of ocean-wide anthropogenic threats to sea turtles.
Incidental catches of turtles and cetaceans often overlap in U.S. fisheries and a universal BRD that excludes both groups of species or enables both turtles and cetaceans to escape does not currently exist (NOAA Fisheries, 2006). Further information regarding the multi-purpose BRDs that successfully reduced turtle and vaquita bycatch (developed by Mexico’s National Fisheries Institute; INAPESCA and the Southeast Fisheries Science Center) may be useful (Aguilar-Ramírez & Rodríquez-Valencia, 2010). It should be noted that grid size is an issue in a multi-purpose BRD. Fishers don’t like to have too close a grid because it increases the drag coefficient and therefore fuel costs, as well as reducing fish catch (FAO, 2012).

189
5.13 Conclusion
Loggerhead, green, leatherback and hawksbill turtles were identified as moderately at risk in the SPF fishery based on spatial overlap of the species ranges and the fishery (AFMA, 2010). In the NPF of Australia the most captured species was the vulnerable flatback turtle and in the East Coast Otter Trawl Fishery, the most captured turtle was the endangered loggerhead turtle and then the vulnerable green turtle (SEWPaC, 2009a; Environment Australia, 2003; Limpus, 2008; Poiner & Harris, 1996; Robins et al., 2002a; Robins, 2002). Hawksbill and leatherback turtles are rarely reported in bycatch along the eastern coast of Australia and the likelihood of an interaction with a pelagic factory trawler in the SPF is low. Interactions with the loggerhead and green turtles are possible and may occur as bycatch or ship strike, particularly for the pelagic juveniles of each species. No sea turtles have been reported as bycatch in the midwater trawl fisheries of the SPF since 2009, however, there has been little to no effort during this time (AFMA, 2010; Tuck et al., 2013).
The Mauritanian study of pelagic freezer-trawlers in NW Africa reported a low incidence of sea turtle bycatch (Zeeberg et al., 2006). Several mitigation methods have been discussed in this review and all would be useful to a new fishery in Australian waters reporting incidental captures of sea turtles, depending on the requirements of the fishery. TEDs have been particularly successful in the shrimp trawler fisheries of the world, reducing turtle bycatch by up to 97% in the U.S. (National Marine Fisheries Service, 2013) Incidentally captured turtles can also be released alive, particularly after tow times of <80 min and provided fishers are educated to use the gear and techniques (Poiner & Harris, 1996).
Because the endangered Loggerhead turtle was the most captured turtle in the East Coast Otter Trawl Fishery, due caution should be exercised when determining acceptable levels of risk of bycatch or boat strike. Even low levels of incidental mortalities in the SPF could be unsustainable for this species.
5.14 Limitations in the review process
Consultation with scientific experts was not part of the project scope for this review. This limited the ability of the consultants to properly identify and contact Research Groups and fisheries organisations currently working on turtle bycatch rates in large pelagic factory trawlers.
To source factory-trawl specific data relating to turtle bycatch, a separate project would be required that involves contacting relevant experts and industry groups for the data. This is a time-consuming process that was outside the scope of this review.
There was a paucity of literature showing turtle interactions with non-shrimp trawl fisheries in Australia. This may be because there are limited interactions. Access to fisheries data for observer programs and logbook records would be required to determine level of interaction in Australia.

190
Table 5.1. EPBC Act listed Australian sea turtle species, fisheries interactions and likelihood of interacting with a large factory freezer trawler in Australian waters.
Sources (SEWPaC, 2009b) and those referenced in the table. SEWPAC = Department of Sustainability, Environment, Water, Populations and Communities. Click on the species name hyperlink to be directed to further information on the SPRAT website. B = Bycatch in trawl, C = competition in relation to overfishing, E = entanglement in debris. The Bycatch Threat Class is trawl specific and does not include longline or gillnet interactions.
Species EPBC Act (1999) Listing
Australian range
Size: Curved carapace length and weight
Trawl interaction internationally
EPBC Act Threat Class (relating to trawling)
Australian trawl interactions
Likelihood of interaction with factory trawler
References
Caretta caretta
Loggerhead turtle
Endangered; Marine; Migratory
All Australian waters, not inc south of Tas.
96 cm Mauritania
Mediterranean
Globally
B, C, E East Coast Otter Trawl and Northern Australia Prawn Fishery
Moderate - spatial overlap, most frequently caught in the East Coast Otter Trawl Fishery
(AFMA, 2010; SEWPaC, 2009b; Limpus & Reimer, 1994; Poiner & Harris, 1996; Robins & Courtney, 1998; Robins, 1995; Robins, 2002; Robins & Mayer, 1998; Wallace et al., 2008; Wallace et al., 2013; Zeeberg et al., 2006)
Chelonia depressa = Natator depressus
Flatback turtle
Vulnerable; Marine; Migratory
East coast, north and west coast waters
92 cm No B, E East Coast Otter Trawl and Northern Australia Prawn Fishery
Low – spatial overlap only at western and eastern extent of range
(SEWPaC, 2009b; Poiner & Harris, 1996; Robins & Courtney, 1998; Robins, 1995; Robins, 2002; Robins & Mayer, 1998; Wallace et al., 2013)
Chelonia mydas
Green turtle
Vulnerable; Marine; Migratory
All Australian waters, not inc south of Tas.
100 cm Globally C, E East Coast Otter Trawl and Northern Australia Prawn Fishery
Moderate - spatial overlap, second most frequently caught in the East Coast Otter Trawl Fishery
(AFMA, 2010; SEWPaC, 2009b; Poiner & Harris, 1996; Robins & Courtney, 1998; Robins, 1995; Robins, 2002; Robins & Mayer, 1998; Wallace et al., 2013)

191
Species EPBC Act (1999) Listing
Australian range
Size: Curved carapace length and weight
Trawl interaction internationally
EPBC Act Threat Class (relating to trawling)
Australian trawl interactions
Likelihood of interaction with factory trawler
References
Dermochelys coriacea
Leatherback turtle, Leathery turtle, Luth
Endangered; Marine; Migratory
All Australian waters, not inc south of Tas.
160 cm
1000 kg
Mauritania
Globally
C, E East Coast Otter Trawl
Moderate - spatial overlap but low likelihood because of limited examples of bycatch in literature
(AFMA, 2010; SEWPaC, 2009b; Limpus & Reimer, 1994; Poiner & Harris, 1996; Robins & Courtney, 1998; Robins, 1995; Robins, 2002; Robins & Mayer, 1998; Senko et al., 2013; Wallace et al., 2013; Zeeberg et al., 2006)
Eretmochelys imbricata
Hawksbill turtle
Vulnerable; Marine; Migratory
Eastern and northern waters
82 cm
50 kg
Mauritania
Globally
C, E East Coast Otter Trawl and Northern Australia Prawn Fishery
Low – spatial overlap in eastern SPF but rarely caught in East Coast Otter Trawl
(AFMA, 2010; SEWPaC, 2009b; Limpus & Reimer, 1994; Poiner & Harris, 1996; Robins & Courtney, 1998; Robins, 1995; Robins, 2002; Robins & Mayer, 1998; Wallace et al., 2013; Zeeberg et al., 2006)
Lepidochelys olivacea
Olive ridley turtle, Pacific ridley turtle
Endangered; Marine; Migratory
Northern Australia (QLD to North WA.
70 cm
40 kg
Globally B, E East Coast Otter Trawl and Northern Australia Prawn Fishery
Low - minimal spatial overlap of range in southern QLD with SPF
(SEWPaC, 2009b; Poiner & Harris, 1996; Robins & Courtney, 1998; Robins, 1995; Robins, 2002; Robins & Mayer, 1998; Wallace et al., 2013)
192
5.15 References (Turtles)
AFMA. 2010. Ecological Risk Management Report for the Mid-water trawl sector of the Small Pelagic Fishery. Australian Fisheries Management Authority.
AFMA. 2011. Small Pelagic Fishery Bycatch and discarding workplan 2011 - 2013 Australian Government, Australian Fisheries Management Authority.
Aguilar-Ramírez, D. and Rodríquez-Valencia, J.A. 2010. Reducing bycatch with better technology in the Gulf of California shrimp fishery. Technical and Financial Report. 31 pp. World Wildlife Fund.
Blumenthal, J.M., Solomon, J.L., Bell, C.D., Austin, T.J., Ebanks-Petrie, G., Coyne, M.S., Broderick, A.C. and Godley, B.J. 2006. Satellite tracking highlights the need for international cooperation in marine turtle management. Endangered Species Research, 7: 7: 1–11, 2006.
Braun-McNeill, J., Sasso, C.R., Epperly, S.P. and Rivero, C. 2008. Feasibility of using sea surface temperature imagery to mitigate cheloniid sea turtle–fishery interactions off the coast of northeastern USA. Endangered Species Research, 5: 257–266.
Brewer, D., Heales, D., Milton, D., Dell, Q., Fry, G., Venables, B. and Jones, P. 2006. The impact of turtle excluder devices and bycatch reduction devices on diverse tropical marine communities in Australia’s northern prawn trawl fishery. Fisheries Research, 81: 176-188.
Chabouda, C. and Vendeville, P. 2011. Evaluation of selectivity and bycatch mitigation measures using bioeconomic modelling. The cases of Madagascar and French Guiana shrimp fisheries. Aquatic Living Resources, 24: 137-148.
Chaloupka, M., Bjorndal, K.A., Balazs, G.H., Bolten, A.B., Ehrhart, L.M., Limpus, C.J., Suganuma, H., Troëng, S. and Yamaguchi, M. 2007. Encouraging outlook for recovery of a once severely exploited marine megaherbivore, DOI: 10.1111/j.1466-8238.2007.00367.x. Global Ecology and Biogeography.
Cox, T.M., Lewiston, R.L., Zydelis, R., Crowder, L.B., Safina, C. and Read, A.J. 2007. Comparing Effectiveness of Experimental and Implemented Bycatch Reduction Measures: the Ideal and the Real. Conservation Biology Volume, 21: 1155–1164.
Department of Primary Industries and Investment NSW. 2010. Fisheries Management (Ocean Trawl Share Management Plan) Regulation 2006, Clause 7A Instrument of Approval of Bycatch Reduction Devices and Specifications. New South Wales Government Gazette No. 94. .
SEWPaC. 2009a. Incidental catch (bycatch) of sea turtles during coastal otter-trawling operations in Australian waters north of 28°S. http://www.environment.gov.au/biodiversity/threatened/ktp/ottertrawl.html. Canberra.
SEWPaC. 2009b. SPRAT Search Results: Turtles. http://www.environment.gov.au/cgi-bin/sprat/public/spratlookupspecies.pl?name=turtle&searchtype=Wildcard. Canberra.
Environment Australia. 2003. Recovery Plan for Marine Turtles in Australia. Prepared by the Marine Species Section Approvals and Wildlife Division, Environment Australia in consultation with the Marine Turtle Recovery Team.
Epperly, S.P. 2003. Fisheries mortality and Turtle Excluder Devices (TEDs). In The Biology of Sea Turtles Volume II (P.L. Lutz, J.A. Musick and J. Wynekin, eds), pp. 339-353. United States of America: CRC Press.
Epperly, S.P. and Teas, W.G. 2002. Turtle excluder devices - Are the escape openings large enough? Fishery Bulletin, 100: 466-474.

193
FAO. 2004. Report of the Expert Consultation on Interactions Between Sea Turtles and Fisheries within an Ecosystem Context. Food and Agriculture Organization of the United Nations.
FAO. 2010. Guidelines to reduce sea turtle mortality in fishing operations. , p. 128. Rome.
FAO. 2012. The state of world fisheries and aquaculture. FAO Fisheries and Aquaculture Department.
Ferraroli, S., Georges, J.-Y., Gasparll, P. and Le Maho, Y. 2004. Where leatherback turtles meet fisheries. Nature, 429: 521.
Finkbeiner, E.M., Wallace, B.P., Moore, J.E., Lewison, R.L., Crowder, L.B. and Read, A.J. 2011. Cumulative estimates of sea turtle bycatch and mortality in USA fisheries between 1990 and 2007. Biol. Conserv, 144: 2719-2727.
FRDC. 2012. Bycatch reduction devices, http://www.fish.gov.au/fishing_methods/Pages/bycatch_reduction_devices.aspx: Fisheries Research and Development Corporation.
Gearhart, J. 2010. Evaluation of a turtle excluder device (TED) designed for use in the U.S. Mid-Atlantic Croaker Fishery. NOAA Technical Memorandum NMFS-SEFSC-606. 30 p.
Gilman, E., Gearhart, J., Price, B., Eckert, S., Milliken, H., Wang, J., Swimmer, Y., Shiode, D., Abe, O., Peckham, S.H., Chaloupka, M., Hall, M., Mangel, J., Alfaro-Shigueto, J., Dalzell, P. and Ishizaki, A. 2010. Mitigating sea turtle by-catch in coastal passive net fisheries [Review]. Fish & Fisheries Series, 11: 57-88.
Hall, M.A., Alverson, D.L. and Metuzals, K.I. 2000. By-Catch: Problems and Solutions. Marine Pollution Bulletin, 41: 204-219.
Howell, E.A., Kobayashi, D.R., Parker, D.M., Balazs, G.H. and Polovina, J.J. 2008. TurtleWatch: a tool to aid in the bycatch reduction of loggerhead turtles Caretta caretta in the Hawaii-based pelagic longline fishery. Endangered Species Research, 5: 267–278.
Kelleher, K. 2005. Discards in the world's marine fisheries. An update. FAO Fisheries Technical Paper No. 470., p. 131. Rome: Food and Agriculture Organization of the United Nations.
Limpus, C.J. 2008. A biological review of Australian marine turtle species. Queensland Environmental Protection Agency.
Limpus, C.J. and Reimer, D. 1994. The loggerhead turtle, Caretta caretta, in Queensland: a population in decline. In “Proceedings of the Marine Turtle Conservation Workshop” (Compiled by R. James). pp 34–48. Australian National Parks and Wildlife Service.
Macfadyen, G., Huntington, T. and Cappell, R. 2009. Abandoned, lost or otherwise discarded fishing gear. UNEP Regional Seas Reports and Studies No. 185 and FAO Fisheries and Aquaculture Technical Paper No. 523. FAO and UNEP.
Moore, A. and Skirtun, M. 2012. Chapter 7: Small Pelagic Fishery. In ABARES Fishery status reports 2011 (J. Woodhams, S. Vieira and I. Stobutzki, eds), pp. 90-103. Canberra: Commonwealth of Australia.
Moore, J.E., Wallace, B.P., Lewison, R.L., Zydelis, R., Cox, T.M. and Crowder, T.M. 2009. A review of marine mammal, sea turtle and sea bird bycatch in USA fisheries and the role of policy in shaping management. Marine Policy, 33: 435-451.
Murray, K.T. and Orphanides, C.D. 2013. Estimating the risk of loggerhead turtle Caretta caretta bycatch in the US mid-Atlantic using fishery-independent and -dependent data. Marine Ecology-Progress Series, 477: 259-270.
194
National Marine Fisheries Service. 2011. U.S. National Bycatch Report, NOAA Tech. Memo. NMFS-F/SPO-117E. National Marine Fisheries Service.
National Marine Fisheries Service. 2013. History of Turtle Excluder Devices (TEDs). Mississippi Labs, Southeast Fisheries Science Centre, NOAA.
NOAA. 2011. NOAA Bycatch Reduction Engineering Program. U.S. Department of Commerce, National Oceanic and Atmospheric Administration, National Marine Fisheries Service.
NOAA Fisheries. 2006. Report on Cetacean and Sea Turtle Trawl Interaction Mitigation Workshop, Held in Atlantic City 12/08-09/05: ATGTRT September 2006 Results of Bycatch Workshop.
NOAA Fisheries. 2012. Recent Regulations to Protect Marine Turtles, http://www.nmfs.noaa.gov/pr/species/turtles/regulations.htm National Oceanic and Atmospheric Administration.
NSW Department of Primary Industries. 2004. Ocean Trawl Fishery Environmental Impact Statement Public Consultation Document. 428 p (P.I.A.a.F. Division, ed). Cronulla: NSW Department of Primary Industries.
Oravetz, C.A. 1999. Reducing Incidental Catch in Fisheries In Research and Management Techniques for the Conservation of Sea Turtles. IUCN/SSC Marine Turtle Specialist Group Publication No. 4. (K.L. Eckert, K.A. Bjorndal, F.A. Abreu-Grobois and M. Donnelly, eds), pp. 189-194. Washington DC: SSC/IUCN Marine Turtle Specialist Group.
Poiner, I. and Harris, A.N.M. 1996. Incidental capture, direct mortality and delayed mortality of sea turtles in Australia's Northern Prawn Fishery. Marine Biology, 125: 813-825.
Prince, R.I.T. 1994. Status of the Western Australian Marine Turtle Populations: The Western Australian Marine Turtle Project 1986-1990, pp. 1-14. Canberra: Wildlife Research Centre, Department of Conservation and Land Management, WA. Australian Nature Conservation Agency, Commonwealth of Australia.
Queensland Government. 2011. Annual Status Report 2010—Fin Fish (Stout Whiting) Trawl Fishery. Department of Agriculture, Fisheries and Forrestry.
Richards, A. and Hendrickson, L. 2006. Effectiveness of the Nordmore grate in the Gulf of Maine Northern shrimp fishery. Fisheries Research, 81: 100–106.
Robins, C.M., Goodspeed, A.M., Poiner, I.R. and Harch, B.D. 2002a. Monitoring the Catch of Turtles in the Northern Prawn Fishery. Fisheries Research and Development Corporation Final Report.
Robins, C.M., Sali, J.B. and Kalish, S.R. 2002b. Bycatch of sea Turtles in Pelagic Longline Fisheries - Australia. Bureau of Rural Sciences Final Report to the Fisheries Resources Research Fund, Agriculture, Fisheries and Forestry - Australia.
Robins, J. and Courtney, A.J. 1998. Status report on bycatch within the QueenslandTrawl Fishery. In 'Establishing meaningful targets for bycatch reduction in Australian fisheries', pp. 24-45. Hobart: Australian Society for Fish Biology Workshop Proceedings.
Robins, J.B. 1995. Estimated catch and mortality of sea turtles from the east coast otter trawl fishery of Queensland, Australia. Biol. Conserv, 74: 157-167.
Robins, J.B. 2002. A scientific basis for a comprehensive approach to managing sea turtle by-catch: the Queensland east coast as a case study. PhD: James Cook University.
195
Robins, J.B. and Mayer, D.G. 1998. Monitoring the impact of trawling on sea turtle populations of the Queensland east coast. 60 pp. Brisbane: FRDC Final Report Project NoT93/229. Queensland Department of Primary Industries.
Senko, J., White, E.R., Heppell, S.S. and Gerber, L.R. 2013. Comparing bycatch mitigation strategies for vulnerable marine megafauna. Animal Conservation doi:10.1111/acv.12051: 1-14.
Spotila, J.R., Reina, R.D., Steyermark, A.C., Plotkin, P.T. and Paladino, F.V. 2000. Pacific leatherback turtles face extinction. Nature, 405: 529-530.
Tuck, G.N., Knuckey, I. and Klaer, N.L. 2013. Informing the review of the Commonwealth Policy on Fisheries Bycatch through assessing trends in bycatch of key Commonwealth fisheries. Fisheries Research and Development Corporation final report 2012/046. . Fisheries Research and Development Corporation.
Wallace, B.P., Heppell, S.S., Lewison, R.L., Kelez, S. and Crowder, L.B. 2008. Impacts of fisheries bycatch on loggerhead turtles worldwide inferred from reproductive value analyses. Journal of Applied Ecology, 45: 1076-1085.
Wallace, B.P., Kot, C.Y., DiMatteo, A.D., Lee, T., Crowder, L.B. and Lewison, R.L. 2013. Impacts of fisheries bycatch on marine turtle populations worldwide: toward conservation and research priorities. Ecosphere, 4: art40-art40.
Woodhams, J., Vieira, S. and Stobutzki, I. (eds) 2012. Fishery status reports 2011. Canberra: Australian Bureau of Agricultural and Resource Economics and Sciences.
Zeeberg, J., Corten, A. and De Graaf, E. 2006. Bycatch and release of pelagic megafauna in industrial trawler fisheries off Northwest Africa. Fisheries Research, 78: 186-195.
Žydelis, R., Wallace, B.P., Gilman, E.L. and Werner, T.B. 2009. Conservation of marine megafauna through minimization of fisheries bycatch. Conservation Biology, 23: 608-616.


![LITERATURE OVERVIEW Impacts of Disposers and … · LITERATURE OVERVIEW . Impacts of Disposers . and . Food Waste Management . Summary prepared by: ... 1999][Karrman, 2001][Kegebein,](https://static.fdocuments.net/doc/165x107/5b2434227f8b9a60298b4689/literature-overview-impacts-of-disposers-and-literature-overview-impacts-of.jpg)


