
KAPL-P-000036 (K960 16) ELASTIC-PLASTIC FINITE …/67531/metadc707653/m2/1/high... ·...
11
KAPL-P-000036 (K960 16) ELASTIC-PLASTIC FINITE ELEMENT ANALYSIS-TO-TEST CORRELATION FOR S T R U C T U R E m G L ADIN CsNF -5% I I b 5 - - Scott C. Hodge, Jay M. Minicucci November 1996 NOTICE This report was prepared as an account of work sponsored by the United States Government. Neither the United States, nor the United States Department of Energy, nor any of their employees, nor any of their contractors, subccmactors, or their employees, makes any warm@, express or implied, or assumes any legal liability or responsibility for the accuracy, completenessor usefulness of any information, apparatus,prclduct or process disclosed, or represents that its use would not infringe privately owned rights. KAPL ATOMIC POWER LABOR4TORY SCHENECTADY, NEW YOFX 12301 Operated for the U. S. Department of Energy by WL, Iric. a Lockheed Martin company
Transcript of KAPL-P-000036 (K960 16) ELASTIC-PLASTIC FINITE …/67531/metadc707653/m2/1/high... ·...

KAPL-P-000036 (K960 16)
ELASTIC-PLASTIC FINITE ELEMENT ANALYSIS-TO-TEST CORRELATION FOR S T R U C T U R E m G L ADIN
CsNF -5% I I b 5 - - Scott C. Hodge, Jay M. Minicucci
November 1996
NOTICE
This report was prepared as an account of work sponsored by the United States Government. Neither the United States, nor the United States Department of Energy, nor any of their employees, nor any of their contractors, subccmactors, or their employees, makes any warm@, express or implied, or assumes any legal liability or responsibility for the accuracy, completeness or usefulness of any information, apparatus, prclduct or process disclosed, or represents that its use would not infringe privately owned rights.
KAPL ATOMIC POWER LABOR4TORY SCHENECTADY, NEW YOFX 12301
Operated for the U. S. Department of Energy by W L , Iric. a Lockheed Martin company

DISCLAIMER
This report was prepared as an account of work sponsored by an agency of the United States Government. Neither the United States Government nor any agency thereof, nor any of their employees, makes any warranty, express or implied, or assumes any legal liability or responsibility for the accuracy, completeness, or use- fulness of any information, apparatus. product, or process disclosed, or represents that its use would not infringe privately owned rights. Reference herein to any spc- cific commercial product. process, or Service by trade name, trademark, manufac- turer, or otherwise does not necessarily constitute or imply its endorsement, m m - mcndktion. or favoring by the United States Government or any agency thereof. The views and opinions of iiuthos expressed herein do not necessarily state or reflect those of the United States Government or any agency thereof.

DECLAIMER
Portions of this document may be illegible electronic image products. images are produced from the best available original document.

Page 1 of 8
EL ASTIC-P LASl’IC FINITE ELEMENT AN ALY SIS-TO-TEST CORRELATION FOR STRUCTURES SUBJECTED TO
DYNAMIC LOADING
Scott C. Hodge Jay M. Minicucci
Electric Boat Corporation Groton, CT
ABSTRACT A test program was undertaken to demonstrate the ability of
elastic-plastic finite element methods to predict dyniimic inelastic response for simple structural members. Cantilever arid fixed-beam specimens were tested to levels that produced plastic straining in the range of 2.0% to 3.0% and permanent sets. Acceleration, strain, and displacement data were recorded for use in analytical correlation.
Correlation analyses were performed using the AI3AQUS finite element code. Results of the correlation show that current elastic-plastic analysis techniques accurately capture dynamic inelastic response (displacement, acceleration) due to rapidly applied.dynamic loading. Peak elastic and inelastic surface strains are accurately xedicted. To accurately capture inelastic straining near connections, ii solid model, including fillet welds, is necessary.
The hardening models currently available in the ABAQUS code (isotropic, kinematic) do not accurately capture inelastic strain reversals caused by specimen rebound. Analyses performed consistently underpredicted the peak strain level of the first inelastic rcversal and the rebound deflection and overpredicted the permanent sei of structures experiencing inelastic rebound. Based on these findings, an improved hardening model is being implemented in the ABAQUS code by the developers. The intent of this model upgrade is to improve the ability of the program to capture inelastic strain reversals and to predict permanent sets.
PURPOSE
BACKGROUND The accuracy of the elastic-plastic analysis techniques must be
demonstrated prior to use in design applications. Inelastic techniques are verified by comparing analytical predictions to test results. A limited amount of inelastic correlation data is available for rapidly applied dynamic loadings. The Simple Structures Test Program generated transient, inelastic test data for simple test specimens (Reference (I)). Cantilevered and fixed-beam specimens were tested to levels that produced inelastic strains in the range of 2.0% to 3.0% with measurable permanent sets. Three cantilevers and three fixed-beams were subjected to a long duration input pulse (CL-I thru 3 and BL-1 thru 3) and seven cantilevers were subjected to a short duration input pulse (CS-I thru 7). Finite element analyses were performed to replicate selected loading cases from the simple structures test series. The Simple Structures Test Program provides analysis to test correlation for peak inelastic strains, permanent sets, displacements, and maximum mass accelerations.
The Simple Structures Test Program was developed to verify the inelastic capabilities of the ABAQUS finite element code for a rapidly applied dynamic loading. The correlation study allowed typical modelling practices to be verified (element formulation, mesh density, material, etc.). In addition, the correlation study provided an opportunity to determine the modelling assumptions and input values that produced the most accurate inelastic analysis results.
FINITE ELEMENT ANALYSIS METHOD The objective of the Simple Structures Test PrograK., as described
in Reference (1 1, was to demonstrate the ability of current elastic-plastic analysis techniques to predict dynamic inelastic responsc:. This report presents Correlation of inelastic dynamic analyses Of sinipk structural members performed using the ABAQUS finite element code (Reference (2)).
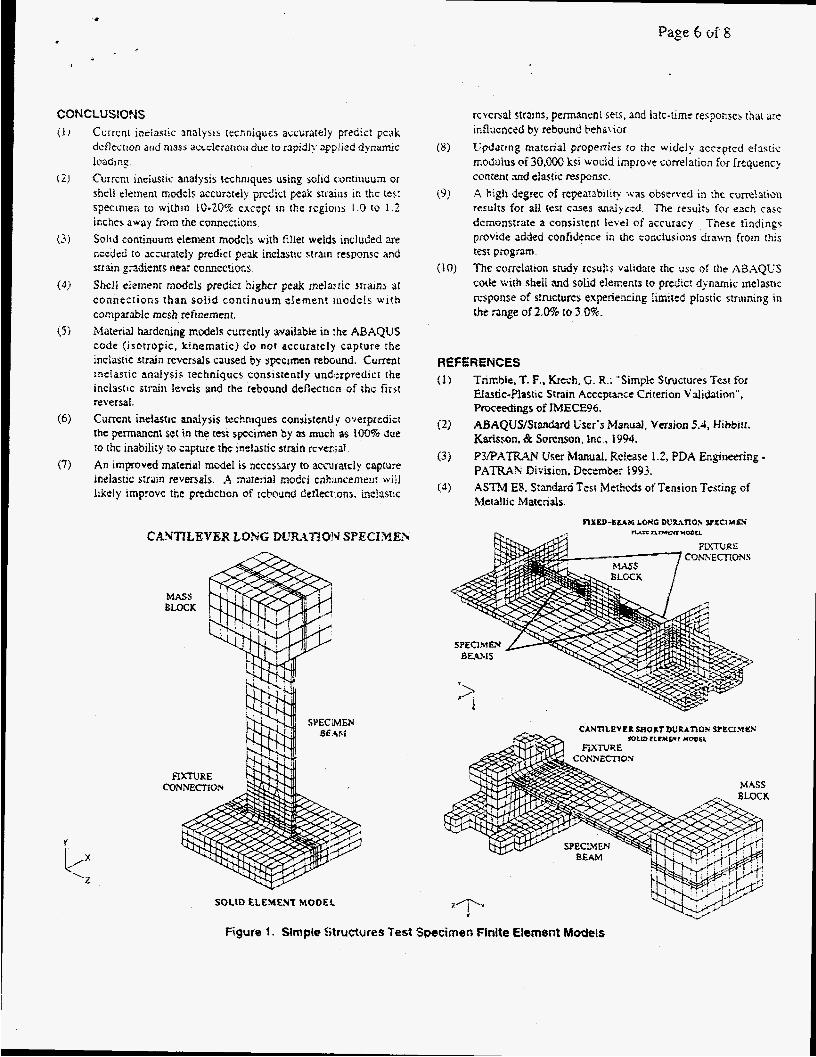
Model Develop= Finite element models were constructed to represent various types
of simple StructupS test specimens (Fig. 1). The models were constructed using the commercial pre-processing code PATRAN (Reference (3)). Input data decks compatible with the comnicrcial finite

element solver ABAQUS (Reference (2)) were generated from these databases. The ABAQUS finite element code was used :o perform the nonlinear analyses presented in this report. Five distinct combinations of geometry and element type were needed to provide the analytical results necessary to perform the correlation study. The five model types are discussed in detail below. It should be noted that some of these finite element models were used in multiple analyses of various load cases. Therefore, the correlation effort extended beyond the five modelling cases discussed.
Finite element models comprised of general stresrldisplacement shell elements were built to represent the simple structures long duration and short duration cantilever specimens and the fixed-beam specimen. Solid (continuum) stress/displacement e1emer.t models were also constructed for the long duration and short duration cantilevers that include representations of the reinforcing fillet weld:.. The model geometries reflect the nominal construction dimemions of the specimens except for the CS-2 short duration cantilever solid model which was constructed to 'as-built' dimensions obtained from pre-test measurements of the specimen. A solid element represcntation of the reinforcing fillet weld was accurately modelled using weld leg dimensions measured at five locations across the width ol'the specimen. For the shell element models, the connection of the test s?ecimen to the fixture was modelled to the face of the fixture plate instead of the midsurface to maintain the correct length of the test specimen straining member. The fixturing structure was modelled to the centerline of the plate, consistent with conventional finite element modelling practices. An elastic modulus of 3 1,720 ksi and nonlinear material properties were determined for the high yield steel used to fabricate the test specimens using the tensile test methods of Reference (4). The entire length of the straining member was assigned the same inelastic material properties; therefore, no distinction was made between base metal and weld metal properties. The material model uses an isotropic hardening assumption.
The finite element meshes were constructed such that data acquisition points are located at the nominal strain gage Ixations.. The CS-2 short duration cantilever solid model, however, contains strain data acquisition points at 'as-measured' gage locations obtained from pre-test measurements of the specimen. Strain response was retrieved at element integration point and nodal locations. Acceleration and displacement response were retrieved at the, acce1eromc:ter and linear variable differential transformer (LVDT) sensor locations.
Material Prop- A series of monotonic tensile tests were performed to obtain
material properties for steels. Material properties were also obtained for the high yield strength (80 ksi) steel used to fabricatc: the straining members of the simple structures test specimens using the testing procedure described in Reference (4). These material Froperties were used in the inelastic analyses performed for the correlation study. Tensile specimens were cut from the plate stock used to fabricate the test specimens. Three specimens were cut from the plate so that the axis of the sample was parallel to the primary plate rol .ing direction (longitudinal). Three additional specimens were cut transverse to the primary plate rolling direction (transverse). The tensile specimens were statically tested to failure. The engineering stress-engineering strain and true stress-true strain curves were determined for cach specimen from zero strain to failure. The ABAQUS code reqjires that true stress-true strain data be input as the inelastic material properties.
Page 2 of 8
A single stress-strain curve was developed from the sets of true stress-true strain tensile test data. This material curve is considered to be representative of the inelastic material properties of the high strength steel used to fabricate the test specimens. The straining members of the test specimens were oriented such that the most significant bending strains were in the primary rolling direction of the plate. Therefore, only the tensile test data from the three longitudinal specimens were used to develop the material curve used in the correlation analyses. A least squares approach was used to fit a B-spline curve to the tensile test data from the longitudinal specimens. It was determined that a modulus of 31,720 ksi best approximated the elastic behavior of the material up to the point where plastic straining begins.
Determination Of Base Motion Acceleration I n p m Dynamic analyses were performed to duplicate selected test cases
from the Simple Structures Test Program. The acceleration time histories used as base motion inputs for each analysis were derived from accelerometer data measured on the mounting fixtures during each test. Therefore, the analysis inputs accurately represented the actual base motion accelerations that each specimen experienced. Accelerations were measured on the mounting fixtures for each test in three global directions. The acceleration data was low-pass filtered to remove the high frequency noise that is not significant to the acceleration input and could lead to convergence problems during the implicit integration solution. Typically, the input traces start when the specimen mounting table first impacts the programming material. For the short duration cantilever drop tests, a portion of the free-fall acceleration history is included to more accurately represent the initial conditions of the specimen at the point of impact.
The cantilever models were dynamically loaded by applying average base motion acceleration inputs to the test fixture at the bolting locations. Average translational accelerations of the parallel pendulum test skid were applied in three directions as base motion accelerations at a point on the fixed-beam model. A portion of the parallel pendulum mounting table was included in the finite element model to account for the added flexibility of the test skid extensions. The acceleration inputs were rigidly transferred to nodes on the extension tubes where they attach to the parallel pendulum mounting table. The angular accelerations resulting from the rigid body rotations of the table were neglected for all analyses.
TEST DATA Analog response signals from, accelerometers, strain gages, and
LVDT displacement gages were recorded at the test site by TEAC XR 9000 VHS tape recorders. The analog data was read off VHS tape, passed through an anti-aliasing filter, and fed into the MASSCOMP system for digitization. The anti-aliasing filter level was set at 8 kHz. The analog data was digitized at a sampling rate of 25 kHz. The rekponse data was low-pass filtered at 250 Hz for long duration loading cases and 333 Hz for short duration loading cases to remove the high frequency system noise inherent in raw test data. The data was resampled to reduce the size of the individual data files. The sampling rates were at least ten times higher than the filtering frequencies to maintain good signal resolution. Prior to each high intensity impulse test in which plastic straining occurred in the test specimens, a low intensity warm-up shot was performed to verify the testing apparatus
Page 3 of 8
and data acquisition equipment. Test data for both the low intensity and high intensity shots were recorded to analog tape; but, typically, only the high intensity impulse test data was digitized.
CORRELATION STUDY RESULTS Finite element analyses were performed to replicate selected static
and dynamic loading cases from the Simple Structures 'Test Program. Static and dynamic elastic analyses and dynamic inelastic: analyses that included material and geometric (large displacements ) nonlinearity were selected for the correlation study. Displacement, acceleration, and strain results were retrieved from the dynamic analyses and compared to response data measured at corresponding sensor location!;. A graphical comparison of measured test data to analytical predictions was performed at each sensor location for every test case examined and a determination made as to the level of correlation ob':ained. Only selected typical correlation results are presented to give the reader a concise overview of results.
A transient, base motion analysis was performelj with inputs corresponding to fixture acceleration histories measured during the low-level (elastic) impulse test of the CS-7 short duration cantilever specimen. The shell element model accurately captures I he pre-impact response as well as the peak elastic strains and maximum mass accelerations due to the low intensity pulse. Since the elastic analysis does not exercise the nonlinear material model, correlation for reversal strains i s very good. Two static analyses were performed that duplicated the elastic/static test of the CS-2 short duration cantilever specimen. One analysis used a modulus of 31,720 ksi, and the other used the more conventional elastic modulus of 30,000 ksi. A review of the elasticktatic correlation results concludes that the analysis results for both values of the elastic modulus show excellent correlation to test. However, the more conventional value of 30,000 ksi consistently produced more accurate predictions of elastic displacement and strain response. These test results serve as a first validation of the finite element models and analysis codes used in this study.
CS-2 Test Correlation Transient, base motion analyses were performed with inputs
corresponding to fixture acceleration histories measured during the correlation test of the CS-2 short duration cantilever specimen. The detailed solid element model analyzed for this test case contains strain data retrieval points at "as-measured gage locations ard an accurate representation of the reinforcing fillet weld profile. The shell element model used for this analysis case contains data acquisition points at the nominal strain gage locations. Horizontally mounting the short duration cantilever specimens induced deadweight loads in the structure that were directly additive to the primary bending strains caused by the dynamic loading. To capture the effect of the deadweight load on inelastic response. a static step in which the specimen deadweight load was applied was included in the short duration cantilever analyses prior to the dynamic step. This deadweight loading remained active during the dynamic analysis. Because of the zeroing procedur? used for the short duration cantilever specimens, the deadweight loading was also captured in the strain gage test data. The test specimen deadweight preload is evidenced as a nonzero response value at the start of the displacement and strain time histones.
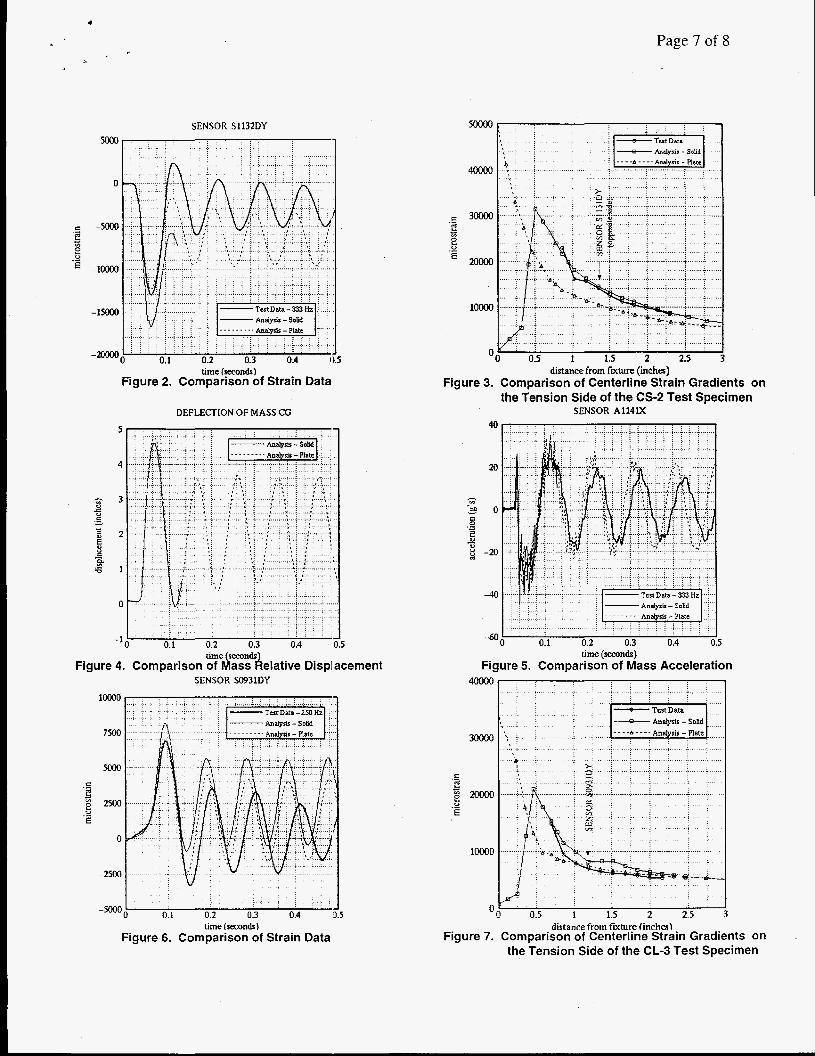
Correlation for the peak inelastic strain due to the initial impact is very good for the solid element model along the entire length of the strain gage string (peak strain predictions typically within 25% of measured values). The shell element model underpredicts the peak inelastic strain at the gage location closest to the fixture weld by approximately 40%. However, correlation for peak strain improves dramatically for the shell element model starting at gage locations approximately 1.2 inches from the fixity and the remaining gages show excellent peak strain correlation. Peak inelastic strains are generally predicted to within about 15% of measured values for both models. Both the solid element and the shell element models predict the peak elastic strains measured near the specimen mass very accurately. Figure 2 shows a comparison of strain gage data to inelastic strain predictions for the fourth gage along the ten gage string located approximately 1.2 inches from the fixity on the side of the cantilever specimen initially in compression.
Figure 3 shows a comparison of strain gradients predicted by the solid element and shell element models along the centerline of the cantilever near the fixture connection. Also included in this figure is the actual strain gradient measured by the strain gage string located on the centerline of the specimen. Excellent correlation is observed for the detailed solid element model containing an accurate representation of the reinforcing fillet weld profile. These results indicate that a solid element analysis accurately captures the shape of the inelastic strain gradient near the base of the cantilever and, therefore, accurately predicts the maximum peak strain in the specimen. Due to the additional through-the-thickness constraint in the solid element formulation, the maximum peak strain in the solid model does not occur at the fixture connection, but occurs along the cantilever at a distance from the toe of the reinforcing fillet weld approximately equal to the size of the weld leg. The strain gradient near the base of the cantilever resulting from a shell element analysis has a different shape than that from a solid element analysis. The beam theory assumptions used to derive the shell element formulation dictate that the maximum strains in the specimen will occur precisely at the base of the cantilever with a continuously decreasing gradient moving away from the connection. Based on comparisons to the strain gage string data, the refined shell element models do not accurately capture the strain gradients in the highly strained region near the base of the cantilever; however, the peak inelastic strains predicted at the connection exceed the more accurate maximum strain levels predicted by the solid element models by approximately 60%. Therefore, both the solid element model and the shell element model accurately predict peak strain levels except in the region within 1.2 inches of the fixture connection. A solid element model that includes the reinforcing fillet weld is needed to accurately predict peak inelastic strain levels and strain contours near the base of the cantilever.
In cases where analysis accurately predicted the peak inelastic strain, the strain level of the inelastic reversal caused by the initial springback of the specimen mass was consistently underpredicted. The higher the level of the initial peak strain, the more significant the underprediction for the inelastic strain reversal. The reason the level of plastic straining during the reversal is underpredicted is because the material hardening rule used in the analysis tends to over estimate the material strength for the reverse loading. Test results indicate that the specimen material is actually softer in the reversal direction than the current material algorithms represent. The material is softer in the sense that yielding occurs at a lower load for the reversal than analysis

. Page 4 of 8
predicts. The softer material allows for more significant plastic straining to occur during the reversal for the test than is predicted by analysis.
Figure 4 shows analytical predictions for the defleclion of the test specimen mass center of gravity relative to the cantilever base. Both the solid element model and the shell element model pi.edict similar response for peak deflection and mass rebound. Mounti ig a LVDT to measure relative mass displacement was deemed impractical due to physical constraints of the AVCO mounting table. Therefore, no mass displacement test data is available. The shell element model predicts a permanent set of approximately 2.0 inches. Permanent sei is determined to be the average deflection about which the elastic ring-out of the structure oscillates. The duration of the solid element analysis was not enough to obtain an accurate permanent set prediction. B:ised on results from other test cases and on the similarity in early-time response between the solid element model and the shell element model, it can be concluded that the solid element model would predict a permanent set comparable to that of the shell element model. The permanent set in the test structure determined from pre- and post-test measui'ements of the specimen is approximately 0.83 inches. Analysis ovcrpredicts test specimen set by more than 100%.
The plastic behavior of the test specimen dissipates ; I large portion of the dynamic energy imparted to the system. Since the dynamic loads are so quickly mitigated, plastic straining occurs only within the first or second cycle of specimen response. Response past the lirst or second cycle is predominantly elastic response of the structure. The overall permanent set in the structure is the summation of all the individual permanent deformations caused by each inelastic strain cycle. Underpredicting the plastic straining due to the first revei-sal causes the amount of permanent deformation associated with that straining to also be underpredcted. Since there is very little inelastic straining past the first reversal, this underprediction plays a major role in determining the overall permanent set in the structure. The most significant permanent deformation is caused by the initial plastic straining. The additional permanent deformation due to the reversal acts to reduce the original permanent set caused by the impulse load (bends the specimen back in the opposite direction); therefore, underpredicting the ra-duction from the additional permanent deformation leads to an overprediction in overall permanent set in the structure. The conclusior. that analysis overpredicts permanent set is only applicable to dynamic loadings where an impulse excites the structure and causes thi: most severe straining. After the straining, the structure is allowed to enter a state of free vibration without further excitation.
A comparison of mass block acceleration response is shown in Fig. 5. The accelerometer channel presented measures response in the direction of loading on the test specimen mass block. Both the solid element model and the shell element model accurately predict the maximum mass accelerations. The acceleration response for the first-order bending mode of the cantilever shows excellent correlation. Frequency content from higher-order modes is present in both the analysis response and the test data. The analysis captures the frequency content due to the higher-order modes, but does not predict their amplitude as accurately as the first bending mode. A sharp spike is present in the acceleration response data at the instant when the mounting table impact occurs. Examining the aixelerometer orientations and the direction of the response signals shows that the mass block experiences an initial rotation in the direction opposite to
that associated with the low frequency flexural response of the test specimen. Strain data from the gages located in the elastic region near the mass block confirms the direction of the initial mass block rotation. Evaluation of the acceleration and strain data indicates that the specimen initially deforms into a second-order bending mode shape. The frequency content of the acceleration input pulse coupled with the dynamic behavior of the system causes the second-order bending mode of the cantilever to be excited before the lower frequency first bending mode. The higher amplitude first bending response quickly overtakes the higher-order modes and dominates the test specimen response. Analysis accurately captures this dynamic behavior and displaced shape plots confirm that the second-order bending mode is instantaneously excited before the general flexural response begins.
The underprediction of the inelastic strain reversal coupled with a slightly higher frequency content in the analysis results leads to a loss of phasing later in time. The difference in frequency content is most likely due to slight deviations between the modelled geometry and the actual test specimen and because the elastic modulus used in the analysis is slightly higher than the conventional value of 30,000 h i . Updating the analysis with an elastic modulus of 30,000 ksi would improve correlation for frequency content. No structural damping was included in the analyses and only slight numerical damping was used in the implicit integration technique. The inelastic material behavior is sufficient to damp out any high frequency response during the initial impulse loading. Any contribution due to structural damping would be overshadowed by the energy dissipated by the inelastic straining. Acceleration and strain data comparisons show that the predicted elastic ring-out of the structure does not damp out as quickly as the measured test response. Poor late-time phase correlation and underdamped analysis response is present in all the data comparisons.
Correlation results similar to the CS-2 test case were observed for the shell element analysis of the CS-3 short duration cantilever specimen.
CL-3 Test Correlation Transient, base motion analyses were performed with inputs
corresponding to fixture acceleration histories measured during the correlation test of the CL-3 long duration cantilever specimen. The solid element model analyzed for this test case contains strain data retrieval points at the nominal strain gage locations and a reinforcing fillet weld representation with nominal weld size. The shell element model used for this analysis case also contains data acquisition points at the nominal strain gage locations. The results of the CL-3 tes: correlation study are consistent with those of the CS-2 test case.
Similar strain correlation is observed for the short duration and long duration cantilever specimens. Figure 6 shows a comparison of strain gage data to inelastic strain predictions for the fourth gage along the string moving away from the fixture weld on the side of the cantilever specimen initially in tension. Figure 7 demonstrates the correlation between the measured strain gradient near the fixture connection and analytical predictions. It should be noted that a nominal 0.25 inches reinforcing fillet weld size was used in the solid element model of the CL-3 test specimen. Post-test measurements of the specimen showed that, at the specimen centerline, the size of the weld legs adjacent to the test fixture were smaller than the,nominal dimension. Translating the predicted strain gradients towards the connection slightly would improve correlation. Where peak inelastic

Page 5 of 8
strains are accurately predicted, analysis continues to underpredict the inelastic strain levels of the initial reversal due to inabilities of the ABAQUS material models discussed previously. Similar to the previous case, the solid element model and the shell element model accurately predict peak strain levels except in the region within 1 .O inch of the fixture connection. A solid element model tha; includes the reinforcing fillet weld is needed to accurately predict peak inelastic strain levels and strain contours near the base of the cantilever. The shell element model, once again, does not accurately capture the strain gradient in the highly strained region near the connection; however, the peak inelastic strains predicted at the connection exceed the more accurate strain levels of the solid element model by approximately 60%.
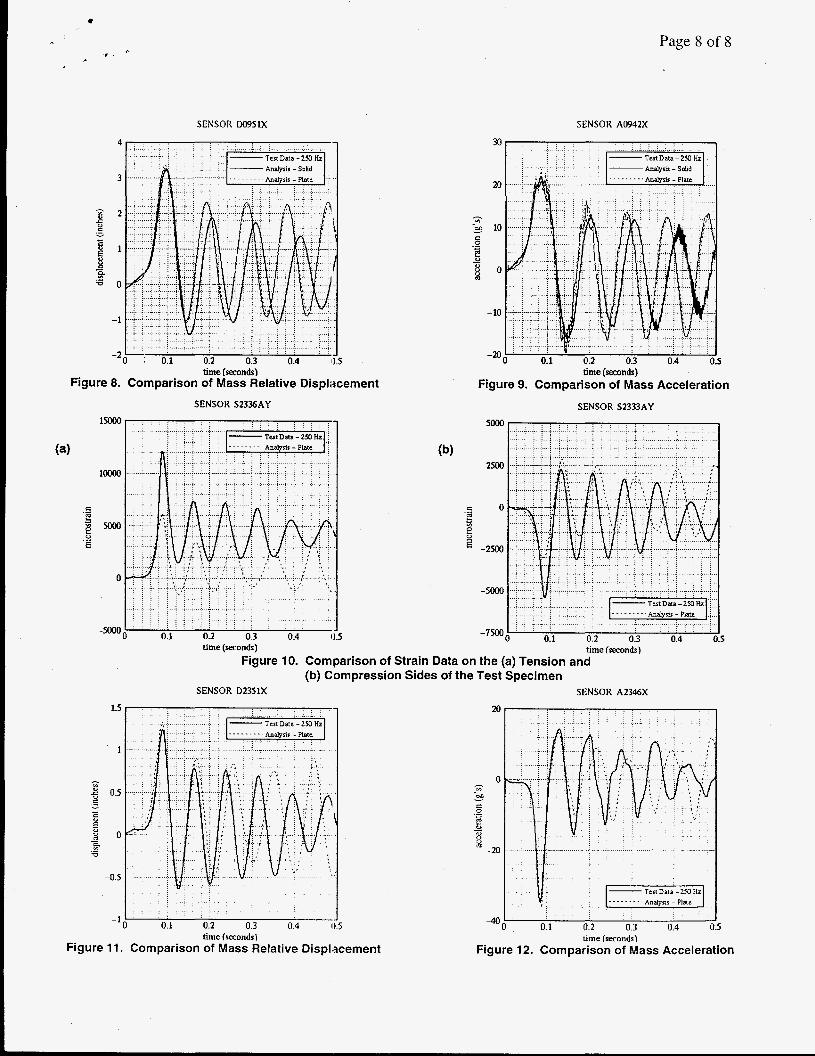
The same type of displacement and acceleration behavior observed for the short duration cantilevers was shown for the CL-3 test case. Figure 8 shows a comparison of the deflection of the test specimen mass center of gravity relative to the cantilever base. Both the solid element and the shell element models accurately predict the peak: deflection of the specimen mass and underpredict the initial springback. The reason for the underprediction is tied to the inability of the ABAQUS material models to capture the inelastic strain reversal. Since the analysis over estimates the strength of the specimen material during the reversal, the predicted springback deflection tends to be smaller than the measured value. Both the solid element model and the shell e!.ement model predict a permanent set of approximately 0.75 inches. 'The measured permanent set in the test structure, determined from the test data as the average deflection about which the elastic ring-out of the structure is oscillating prior to the first rebound impact, is approximately 0.29 inches. Just as in the short duration load cases, analysis overpredicts test specimen set by more than 100% for a long duration loading. A comparison of mass block acceleration response is shown in Fig. 9. The same poor late-time phase correlation and underdamped analysis response observed previously is still present in all response data.
Similar correlation results were obtained from the solid element analysis of the CL-1 long duration cantilever specimen.
BL-2 Test Correlation A transient, base motion analysis was performe1 with inputs
corresponding to fixture acceleration histories measured during the correlation test of the BL-2 long duration fixed-be2.m specimen. Average translational accelerations of the parallel pendulum mounting table were derived from accelerometer response measurcd at locations throughout the test fixture. The shell element model used for this analysis case contains data acquisition points at the nominal strain gage locations. To accurately represent the stiffness of the fixed-beam structure, the model contained the entire test assembly including the test specimen, the test fixture, and the parallel pendulum mounting table extension tubes.
The same type of strain behavior seen for the cantikver test cases is also observed for the fixed-beam case. Figure 10 shows comparisons of strain gage data to inelastic strain predictions for the first gage of two ten gage strings located on the tension and compression sides of the fixed-beam specimen. Strain gages S 2 3 3 3 A Y and ! i2336AY are located directly opposite of each other on the two sides o T the specimen near a fixture connection and demonstrate a 50% underprediction of peak inelastic strain by the shell element model. The results of the strain correlation shows that the shell element model accurately predicts peak strain levels in the test specimens except in the regions within 1.2
inches of the fixture and mass block connections. Previous test cases have shown that a solid element model that includes the reinforcing fillet weld is needed to accurately predict peak inelastic strain levels and strain contours near test specimen connections. Comparing inelastic strain peaks on opposite sides of the fixed-beam shows that the membrane strain in the specimen due to the initial impulse load was approximately 0.4%.
The underprediction of the peak strain level for the inelastic reversal caused by the rebound of the specimen mass is not as apparent in the fixed-beam results as i t was for the cantilever specimens. The underprediction is more pronounced for higher levels of initial peak strain and when analysis accurately captures the peak inelastic strain due to the impulse load. Due to the added constraints on the specimen, the maximum mass deflection and mass rebound for the fixed-beam is much less than for the cantilever specimens. Initial peak strain levels and the reversal strains are also much lower. Since the initial strain levels are less severe and less inelastic straining occurs during the reversal, the underprediction is less pronounced. In addition, the shell element model does not accurately capture peak strain levels near the connections where the maximum strains occur. Therefore, the peak strain levels at the gages where analysis does accurately capture strain response are even lower still.
Figure 11 shows a comparison of the deflection of the test specimen mass center of gravity relative to the parallel pendulum mounting table. Analysis accurately predicts the peak deflection of the spec imen mass block. Analysis predicts a permanent set of approximately 0.21 inches. The permanent set in the test structure, determined from test data measured prior to the first rebound impact, is approximately 0.11 inches. Analysis overpredicts test specimen set by more than 90%. Overprediction of permanent set is slightly less significant for the fixed-beam specimen than for the cantilevers due to the reduced rebound behavior.
A comparison of mass block acceleration response is shown in Fig. 12. The shell element model accurately predicts the maximum mass acceleration. The fixed-beam response is unique from that of the cantilevers due to the membrane loading generated by the added constraint on the specimen. The effect of this loading is to introduce membrane stiffening to the structure. The short duration, high amplitude response of the initial mass acceleration is caused by the considerable membrane stiffening which occurs during the initial impulse loading. Analysis with t h e nonlinear geometry (large displacements) option included accurately captures this behavior. The unsymmetric, late-time acceleration response for the fixed-beam case is caused by a combination of the membrane stiffening and the deformed shape of the specimen.
Very poor late-time correlation is observed for the acceleration, displacement, and strain response. Later time excitations associated with the very low frequency, rigid body rotations of the parallel pendulum mounting table were neglected for this analysis. Neglecting these excitations could affect test specimen response and cause a loss of phasing later in time. The fundamental bending response in the analysis results has a significantly lower frequency content than in the test data. The difference in frequency content may partially be due to any tensile preload induced in the specimen by torquing the test fixture mounting bolts which was not accounted for in the analysis. Predicted elastic ring-out of the structure does not damp out as quickly as the measured test response due to the lack of structural damping.
CONCLUSlONS Ccrrcnl intiastic malysi5 [echniqucs a~cura:ely predict FC& dcflcction atid R : ~ S S acdersr:oii duc to rapidly Jpplicd dynarmc
C u r r m inelustic analysis techniques using soiid continuum or shcll element models accu:srell; prcriict peak strsiilj in thc Its: specimen tu within 10-205 cxcepi in the rcgivris 1.0 IO 1.2 icchcs away from the conncctions. Solid continuum ele.menr modc!s with fillet welds included are nccded to accur;ltcfy predict peak incistic stran reswnsc and s r r in gd icnrs near coracclions. Shcfl eimrnt rncddcls predict higher peak ine1a:tic strains 81 connections than solid conrinuum dement incdcis with compxablc mesh refinement. M a t e d h-dcning models currently available in the ABAQUS code (iso!ropic. kinematic) do not accuratcly capture the inclasric strain rcvcrsals caused by spcnmen rebound. Cuntn.~ inelastic analysis rrchniqucs consirtenrly undqwedicr the inelastic srrain lev& and the rebound deflection of thc firs! reversal. Currcnt inelasuc analysis techniques conristcntl y overpredict the pmancnt sct in the rest spccimen by as much as 100% due 10 thc inability to capture thc inelastic strain r c u e ~ ~ l An improved m8reriul model is ncceswy to accurarcly cnprure inelastic strain reversals. .A nilrenal modci cnEirncrmen: will likely impravc tne pnQction of rcbomci derlecticns. inc!astic
loadlag.
Y
Lx Z
SOLID ELEMENT MOOEL
Page 6 Vf 8
rcvcrsd strains, pemmcnr sets. and latc-time response> that ilic influcnccd by rebound behsvior. t.:pdntiag niareriai proprnies io the wideiy acc~ptcd elistic modulus of 30.000 ksi would improve conelation for frcquenc: content .and dastic response. A high degrcc of repeambslit): was observed in tnc cum?srion resulrs for all trsr cases an\nrii?ztil. The rzsuit3 for each casc dcmonstrate a consistcnt Iwel of accuracy These findings provide added confidence in thc conclusions drnrvn from this test program Thc currelation snady rcsuiis validate rhc u5c of the i\SAQ‘,:S coctc with sheli and solid eiements tO prcciic? dj-nmic melasac r spnse of structures experiencing Iimited plastic straining in the range of 2.0% to 3.045..
RfFERENCES (1) Trimbie, T. F., Krcch. G. R.: “Simplc Smcrures Tar for
Elasstic-Plastic Strain Acccpmce Criterion Vdjdation”, ploceed~ngs of IMECE96. ABAQUS/Siandard User’s Manu&, Version 5.4, Wibbitr. Kd.5son. Br Sorcnson, inc., 1994. P3/PAIR;t”l User Manual, Release 1.2, PDA Engineering - PATRAN Division. Dcccrnber 1993. ASTM ES, Standard Tcst Mtthods of Tension Testing of Metallic Matrnals.
(2)
(3)
(4)
r..
Figure 1. Simple Structures Test Specimen Flnlte Element Models
Page 7 of 8
SENSOR S1132DY
time k o n d s ) Figure 2. Comparison of Strain Data
DEFLECTION OF MASS CG
0
-1
. . . . . . . . . . . . . . .
. . . . . . . . . . . . . . . . . . . . . . . . . . . . . . ................. ............ . . . . . . . . . . .
. . . . . . . . . . . . . . . . . . . . . . . . . . . . . . . . . . . . . . . . . . . . . . . . . ..... ....... .... .... . .
. ~ . ~ . . . . . .
. . . . . . I . . . . ~ .......... : . . i . . I i ;..: : . / j..:
. . . . . . . . . . ............................. . . . . . . . . . . . . . . . . . . . . . . . . . . . . . .
. . . . ? . . . . -. :.
0.1 0.2 0.3 0.4 time (seconds
SENSOR S0931DY Figure 4. Comparison of Mass Aelative Displacement
J . . 0 1 0.2 0 3 0.4 3.5
time (seconds) Figure 6. Comparison of Strain Data
distance from fDthue (inches) Figure 3. Comparison of Centerline Strain Gradients on
the Tension Side of the CS-2 Test Specimen SENSOR A114lX
time (seconds) Figure 5. Comparison of Mass Acceleration
'0 0.5 1 1.5 2 2.5 distance from fucmre linchesl
Figure 7. Comparison of Centertine Strain Gradients on the Tension Side of the CL-3 Test Specimen
Page 8 of 8
SENSOR W951X
, 0.1 0.2 0.3 0.4
SENSOR A0942X
I TertData-29 Hrl
time (seconds) Figure 8. Comparison of Mass Relative Displacement
SENSOR S2336AY
Figure
. . . . . . . . . . . . . . . . .
0.1 0.2 0.3 0.4 0.5 time (seconds)
- 10
-20
c .- E E E
- .-
time (seconds) Figure 9. Comparison of Mass Acceleration
SENSOR S2333AY
................ . . . . . . . . . . . . . . . . . . . . " . . ; . . . . . . .
. . -75000. : . : . : : , :
0.1 0.2 0.3 0.4 0.5 time lsecondsl
Figure 10. Comparison of Strain Data on the (a) Tension and (b) Compression Sides of the Test Specimen
SENSOR D2351X SENSOR A2346X
I- -'0 0.1 0 2 0 3 0 4 1) s
ume (seconds) 11. Comparison of Mass Relative Displ scement
m
0 M
E - 0 E - e,
J - -20
0 0 1 0 2 0 3 0 4 os ume (seconds)
-40
Figure 12. Comparison of Mass Acceleration