IVA Worldwide Fund IVA International Fund Funds Semi... · 2018-07-18 · IVA Worldwide Fund IVA...
52
IVA Worldwide Fund IVA International Fund Semi-Annual Report March 31, 2017 An investment in the Funds is not a bank deposit and is not insured or guaranteed by the Federal Deposit Insurance Corporation or any other government agency. Advised by International Value Advisers, LLC
Transcript of IVA Worldwide Fund IVA International Fund Funds Semi... · 2018-07-18 · IVA Worldwide Fund IVA...

IVA Worldwide FundIVA International Fund
Semi-Annual ReportMarch 31, 2017
An investment in the Funds is not a bank deposit and is not insured or guaranteed bythe Federal Deposit Insurance Corporation or any other government agency.Advised by International Value Advisers, LLC


1
2 An Owner’s Manual
3 Letter from the President
4 Letter from the Portfolio Managers
6 Management’s Discussion of FundPerformance
IVA Worldwide Fund8 Performance9 Portfolio Composition
10 Schedule of Investments
IVA International Fund20 Performance21 Portfolio Composition22 Schedule of Investments
31 Statements of Assets and Liabilities
32 Statements of Operations
33 Statements of Changes in Net Assets
34 Financial Highlights
40 Notes to Financial Statements
48 Additional Information
49 Fund Expenses
Contents IVA Funds

2
An Atypical Investment Strategy
We manage both the IVA Worldwide and IVA International Funds with a dual attempt thatis unusual in the mutual fund world: in the short-term (12-18 months), our attempt is totry to preserve capital, while in the longer-term (5-10 years, i.e., over a full economiccycle), we seek to perform better than the MSCI All Country World Index, in the case ofyour IVA Worldwide Fund, and the MSCI All Country World (ex-U.S.) Index, in the caseof your IVA International Fund.
The Worldwide Fund is typically used by investors who are looking for an “all weatherfund” where we are given the latitude to decide how much we should have in the U.S. versusoutside the U.S. The International Fund is typically used by investors who practice assetallocation and want to decide for themselves how much should be allocated to a domesticmanager and how much should be allocated to a pure “international” (i.e., non-U.S.)manager, yet at the same time are looking for a lower risk – and lower volatility – exposureto international markets than may be obtained from a more traditional international fund.
We believe our investment approach is very different from the traditional approach of mostmutual funds. We are trying to deliver returns that are as absolute as possible, i.e., returns thattry to be as resilient as possible in down markets, while many of our competitors try to delivergood relative performance, i.e., try to beat an index, and thus would be fine with being down15% if their benchmark is down 20%.
Why do we have such an unusual strategy (which, incidentally, is not easy to carry out)?Because we believe this strategy makes sense for many investors. We are fond of the quoteby Mark Twain: “There are two times in a man’s life when he should not speculate: the firsttime is when he cannot afford to; the second time is when he can.” We realize that manyinvestors cannot tolerate high volatility and appreciate that “life’s bills do not always come atmarket tops.” This strategy also appeals to us at International Value Advisers since we “eatour own cooking” for a significant part of our savings (invested in IVA products) and we havean extreme aversion to losing money.
An Eclectic Investment Approach
Here is how we try to implement our strategy:
■ We don’t hug benchmarks. In practical terms, this means we are willing to make big “negativebets,” i.e., having nothing or little in what has become big in the benchmark. Conversely, wewill generally seek to avoid overly large positive bets.
■ We prefer having diversified portfolios (100 to 150 names). Because we invest on a globalbasis, we believe that diversification helps protect against weak corporate governance orinsufficient disclosure, or simply against “unknown unknowns.” We like the flexibility toinvest in small, medium and large companies, depending on where we see value.
■ We attempt to capture equity-type returns through fixed income securities but predominantlywhen credit markets (or sub-sets of them) are depressed and offer this potential.
■ We hold some gold, either in bullion form or via gold mining securities, as we believegold provides a good hedge in either an inflationary or deflationary period, and it canhelp mitigate currency debasement over time.
■ We are willing to hold cash when we cannot find enough cheap securities that we likeor when we find some, yet the broader market (Mr. Market) seems fully priced. We will seekto use that cash as ammunition for future bargains.
■ At the individual security level, we ask a lot of questions about “what can go wrong?”and will establish not only a “base case intrinsic value” but also a “worst case scenario”(What could prove us wrong? If we were wrong, are we likely to lose 25%, 30%, or evenmore of the money invested?). As a result, we will miss some opportunities, yet hopefully,we will also avoid instances where we experience a permanent impairment of value.
An Owner’s Manual IVA Funds

Dear Shareholder:
This report covers the six month period ended March 31, 2017. The IVA Worldwide Fund and IVA International Fund (the “Funds”) are now in their ninth year and the Funds’ investment adviser, International Value Advisers, LLC, remains pleased with the Funds’ performance since their inception on October 1, 2008.
The investing environment and the factors influencing our investment decisionshave not changed significantly over the last six months. Nor has our investmentapproach, which emphasizes capital preservation over the short-term while stillproviding the capacity to outperform equity indices over the long-term. Sinceinception, we have been, and will continue to be, absolute return orientedinvestors. We are willing to have a high “active share” and deviate significantly
from our benchmarks. We believe that our investment approach represents one of the bestways to invest one’s money, in fact, almost everyone employed by IVA is a shareholder.
Looking back over letters I have written in the past, I wanted to emphasize some pointsafter what has been a relatively quiet six month period:
1. Our investment strategy does not give us any room for excuses. The Funds arefortunate to be managed by Charles de Vaulx and Chuck de Lardemelle.
2. We do not pay attention to benchmark performance over a month, a quarter or ayear and we are willing to endure short-term underperformance and let cashbuild when we cannot find enough attractive investment opportunities.
3. The responsibility we have to our clients spans many different departments atIVA. The investment team and the marketing and client service group are themost visible to our shareholders. IVA is also supported by excellent people inoperations and accounting. It is extremely rewarding for me to observe thecontinued development, commitment, and strong work ethic of all mycolleagues.
4. We manage our firm and our clients’ assets with a simple philosophy thatestablishes an order of priority for everything that we do. Our work begins withthe client, proceeds to the firm, then to our colleagues, and finally, to the partners.This is and always will be the progression. If our clients are taken care of, the restfalls into place. At IVA, every working component is structured to benefit theclient.
I want to offer my thanks to all my colleagues and to our shareholders for their continuedsupport.
Michael W. Malafronte, President
Effective February 22, 2011, the IVA Worldwide Fund and IVA International Fund are closedto new investors.
Letter from the President IVA Funds
3
Michael W. Malafronte
May 1, 2017
Dear Fellow Shareholders,
During the period under review, October 1, 2016 to March 31, 2017, marketscontinued their upward journey. While equities owned by both Fundsoutperformed their indices of reference, the large cash position detracted fromperformance. The absolute performance over the period was satisfactory, in ouropinion.
We believe that the sizeable cash position in both Funds is warranted givenelevated valuations in all asset classes in the United States, substantial andunsustainable credit growth in China, political risks in relation to the eurozone,and rising short-term interest rates in the United States. These issues would besurmountable as investors if valuations were commensurate with these risks. Wedo not believe this is the case today.
We are however stock pickers at heart, and with the help of our analysts, we’vebeen able to unearth a number of attractive investments over the period, inparticular in Europe during the last quarter of 2016, and in Korea and emergingmarkets in the first quarter of 2017.
For the International Fund in particular, we were able to put a sizeable chunk ofcash to work over the period, with cash moving from 34.1% to 28.1% over theperiod while the International Fund equity allocation moved from 53.9% to61.3%. This is not a function of some macro views on economies outside theUnited States; rather this is the result of finding what we believe are a few
undervalued businesses around the world, which led to sizeable investments in Airbus,Bureau Veritas, Kangwon Land and Korea Tobacco & Ginseng for both Funds, as well asa few South American names in Mexico, Chile, and Brazil for the International Fund.
The rally in European equities in the first quarter of 2017 cut our European buying spreeshort. The names available in emerging markets tend to be small, constraining the size ofthe positions we establish there. Valuations in emerging markets are at substantialdiscounts to the United States; likewise, European markets have underperformed the U.S.market massively over the last few years, albeit for a good reason: European markets areheavily weighted towards financials, with the underlying issue of the sustainability of theeuro, and therefore suspicious balance sheets; while U.S. indices are loaded withexpensive, yet fast growing internet related names, such as Facebook or Amazon. Strikinghow absent these types of investments are from European or Japanese indices.
For the Worldwide Fund, sizeable European investments over the period were offset bysales in the U.S. of substantially all of our mortgage real estate investment trust (REIT)preferred shares as well as selling out of a few U.S. equity names.
We continue to carry a sizeable gold bullion position in both Funds. We view gold bullionas a currency that central bankers cannot debase, and as a useful hedge in both portfoliosagainst extreme outcomes. While gold bullion historically has gone up in price duringmost bear markets in the United States, obviously past performance is no guarantee offuture performance… In particular, if the next bear market in the U.S. is triggered byhigher real interest rates, rather than by a recession, it is possible that gold may notperform as we anticipate. It is interesting to note however that in both Venezuela, wherehyperinflation wiped out investors, as well as in Greece, where deflation led to financialruin for most, gold protected wealth well.
Letter from the Portfolio Managers IVA Funds
4
Letter from the Portfolio Managers IVA Funds
Chuck de Lardemelle
Charles de Vaulx

Letter from the Portfolio Managers IVA Funds
5
We remain concerned by the large and growing amounts of worldwide debt outstandingas a percentage of global GDP, by the derelict global monetary system, as well as thefurious credit growth in China and the volatile political situation in Europe, whicheventually could result in a breakup of the eurozone (We believe Italy might be theweakest link there). Rising short-term interest rates in the U.S., in the context of one of thelongest bull markets in history, coupled with an advanced economic cycle in the U.S. andvery high valuations by historical standards, warrant a conservative and prudent capitalallocation in our opinion, and explain why an allocation to gold bullion is warranted inyour Funds, and why the cash (invested in commercial paper of our choosing) remains athigh levels.
We continue to work hard to find suitable investments, to avoid speculations, and tocompound your hard-earned savings at a reasonable rate, while doing our utmost topreserve capital. We appreciate your continued confidence and thank you for yoursupport.
Charles de Vaulx, Chief Investment Officer and Portfolio Manager
Chuck de Lardemelle, Portfolio Manager
Letter from the Portfolio Managers IVA Funds

6
The election of Donald Trump as President of the United States stunned the world andwas by far the defining event of the period under review. The news, for the most part, wascalmly digested by markets. Immediately following the election, bonds were struck withthe reality that inflation and higher interest rates may become a byproduct of any fiscalstimulus package initiated by President Trump and a Republican-controlled Congress.Equities fared better, especially in the U.S., as markets embraced an optimistic view of a“pro-business” Trump administration that would cut taxes, engage in deficit spending androll back regulations. The global equity markets continued their “Trump-Trade” driven rallyinto the New Year and through most of the first quarter of 2017. There was an interruptionin this rally following President Trump’s setback in healthcare reform at the end of March,as investors began to question his ability to accomplish his other goals such as corporatetax cuts, infrastructure spending and deregulation. However, these doubts seem to havebeen fleeting, as the market rebounded after only a few days of volatility. Helping to buoymarkets at the end of the period, the U.S. Federal Reserve signaled in March that althoughthey intend to gradually increase rates, they still want to proceed cautiously.
Over the period, our equity exposure decreased from 52.1% to 50.8% in the WorldwideFund and increased from 53.9% to 61.3% in the International Fund. Cash increased from37.3% to 40.7% in the Worldwide Fund and decreased from 34.1% to 28.2% in theInternational Fund. We found new equity opportunities over the period. In both Funds, weinitiated a new position in BMW AG (Germany, consumer discretionary), Airbus Group SE(Netherlands, industrials) and KT&G Corp. (South Korea, consumer staples). We alsoadded to our position in Bureau Veritas SA (France, industrials), which is now a top 10name in both Funds. In the International Fund only, we added multiple new names,including TOTVS SA (Brazil, technology), Doshisha Co., Ltd. (Japan, consumerdiscretionary) and DONGKOOK Pharmaceutical Co., Ltd. (South Korea, health care). Inthe Worldwide Fund only, we added Ralph Lauren Corp. (U.S., consumer discretionary).
While we were able to find new names, some of our existing names approached ourintrinsic value estimates and in those cases we trimmed and even eliminated positionsentirely. Yokogawa Electric Corp. (Japan, technology) was sold by both Funds. In theWorldwide Fund only, names that we eliminated included Raymond James Financial Inc.(U.S., financials) and Hewlett Packard Enterprise Co. (U.S., technology).
Fixed income exposure decreased in both Funds as we trimmed corporate bond positionsand reduced our exposure to short-dated bonds denominated in Singapore dollars overthe period. In the Worldwide Fund, fixed income decreased from 3.3% to 2.5% and in theInternational Fund, it decreased from 4.1% to 3.2%.
Our gold exposure through gold bullion decreased from 6.4% to 5.8% in the WorldwideFund and from 7.6% to 7.1% in the International Fund.
IVA Worldwide Fund
The IVA Worldwide Fund Class A, at net asset value, returned 5.26% over the six-monthperiod ended March 31, 2017 compared to the MSCI All Country World Index (Net) (the“Index”) return of 8.18% over the same period.
The IVA Worldwide Fund lagged the Index for the period, mostly due to the dilutive effectof our elevated cash position. Our equities outperformed, up 11.1%, compared to those inthe Index* which were up 8.3%. Our U.S. names contributed 3.1%, led by a rally infinancials and strong performance by some of our top 10 names, including DeVryEducation Group Inc. (consumer discretionary) and Berkshire Hathaway Inc., Class ‘A’ and‘B’ (holding company). Continental Europe contributed 0.9% and the United Kingdomadded 0.7%, led by Antofagasta Plc (materials), which benefited from a rise in copperprices over the period. With markets robust around the globe, the only countries thatdetracted from return this period were Japan (taking away -0.3%) and Thailand (takingaway -0.01%). In Japan, performance was hurt by Astellas Pharma Inc. (health care).
Management’s Discussion of Fund Performance (unaudited) IVA Funds

7
The top five individual contributors to return this period were: DeVry Education GroupInc. (U.S., consumer discretionary), Berkshire Hathaway Inc. Class ‘A’ and ‘B’ (U.S., holdingcompany), Bank of America Corp. (U.S., financials), Samsung Electronics Co., Ltd. (SouthKorea, technology), Antofagasta Plc (U.K., materials). The top five individual detractorswere: Astellas Pharma Inc. (Japan, health care), Hyundai Mobis Co., Ltd (South Korea,consumer discretionary), News Corp. Class ‘A’ and ‘B’ (U.S., consumer discretionary), CVSHealth Corp. (U.S., consumer staples), Nestlé S.A. (Switzerland, consumer staples).
Collectively, fixed income contributed 0.3%. Gold was down -5.3% and detracted -0.4%.
In an effort to neutralize part of our foreign exchange risk, we were partially hedgedagainst several currencies over the period – the euro, Japanese yen, South Korean wonand Australian dollar. Our currency hedges added 0.3%, helped the most by our hedge onthe Japanese yen as it depreciated against the U.S. dollar over the period. At the end ofthe period, our currency hedges were: 39% Australian dollar, 9% euro, 25% Japanese yen,and 30% South Korean won.
IVA International Fund
The IVA International Fund Class A, at net asset value, returned 4.25% over the six-month period ended March 31, 2017 compared to the MSCI All Country World Index(ex-U.S.)(Net)(the “Index”) return of 6.51% over the same period.
The IVA International Fund lagged the Index for the period, mostly due to the dilutiveeffect of our elevated cash position. Our equities outperformed, up 7.4%, compared tothose in the Index* which were up 6.6%. Our names in Continental Europe contributedthe most to return, adding 1.5%. The United Kingdom added 1.0%, led by Antofagasta Plc(materials), which benefited from a rise in copper prices over the period. South Koreaadded 0.9%, led by Samsung Electronics Co., Ltd (technology). News Corp. Class ‘A’ and‘B’ (U.S., consumer discretionary) detracted -0.2%. We hold News Corp. in ourInternational portfolio due to its meaningful Australian exposure. With markets robustaround the globe this period, the only countries that detracted from return were HongKong and Thailand, taking away a total of -0.03%.
The top five individual equity contributors to return this period were: Samsung ElectronicsCo., Ltd. (South Korea, technology), Antofagasta Plc (U.K., materials), Jardine StrategicHoldings Ltd. (Bermuda, holding company), Clear Media Ltd. (China, consumerdiscretionary), Hongkong & Shanghai Hotels Ltd. (Hong Kong, consumer discretionary).The top five individual detractors were: Astellas Pharma Inc. (Japan, health care), NewsCorp. Class ‘A’ and ‘B’ (U.S., consumer discretionary), Hyundai Mobis Co., Ltd (South Korea,consumer discretionary), APT Satellite Holdings Ltd. (Hong Kong, telecommunicationsservices), Toho Co., Ltd. (Japan, consumer discretionary).
Collectively, fixed income contributed 0.2%. Gold was down -5.3% and detracted -0.5%.
In an effort to neutralize part of our foreign exchange risk, we were partially hedgedagainst several currencies over the period – the euro, Japanese yen, South Korean wonand Australian dollar. Our currency hedges added 0.7%, helped the most by our hedge onthe Japanese yen as it depreciated against the U.S. dollar over the period. At the end ofthe period, our currency hedges were: 39% Australian dollar, 9% euro, 36% Japanese yen,and 30% South Korean won.
Investment Risks: There are risks associated with investing in securities of foreign countries, suchas erratic market conditions, economic and political instability and fluctuations in currencyexchange rates. Value-based investments are subject to the risk that the broad market may notrecognize their intrinsic value.
*The Index equity return excludes gold mining stocks.
Management’s Discussion of Fund Performance (unaudited) IVA Funds

IVA Worldwide Fund IVA Funds
8
IVA Worldwide Fund IVA Funds
Average Annual Total Returns as of March 31, 2017 Six Months(a) One Year Five Year Since Inception(b)
Class A 5.26% 10.17% 5.63% 8.65%Class A (with a 5% maximum initial sales charge) -0.01% 4.65% 4.55% 8.00%Class C 4.91% 9.40% 4.83% 7.84%Class I 5.43% 10.48% 5.88% 8.91%MSCI All Country World Index (Net)(c) 8.18% 15.04% 8.37% 7.33%Consumer Price Index(d) 1.14% 2.45% 1.28% 1.27%
Growth of a $10,000 Initial Investment
Performance (unaudited) As of March 31, 2017
10,000
5,000
$20,000
15,000
$19,233$18,247
$11,136
IVA Worldwide Fund, Class A Shares(e)
MSCI All Country World Index (Net)(c)
Consumer Price Index(d)
3/13 3/173/163/153/143/123/103/09 3/11
(a) Total returns for periods of less than one year are not annualized.(b) The Fund commenced investment operations on October 1, 2008.(c) The MSCI All Country World Index (Net) is an unmanaged, free float-adjusted market capitalization weighted index
composed of stocks of companies located in countries throughout the world. It is designed to measure equity marketperformance in global developed and emerging markets. The index includes reinvestment of dividends, net of foreignwithholding taxes. Please note that an investor cannot invest directly in an index.
(d) The Consumer Price Index examines the weighted average of prices of a basket of consumer goods and services, such astransportation, food and medical care. Please note that an investor cannot invest directly in an index.
(e) Hypothetical illustration of $10,000 invested in Class A shares on October 1, 2008, assuming the deduction of the maximuminitial sales charge of 5% at the time of investment for Class A shares and the reinvestment of all distributions, includingreturns of capital, if any, at net asset value through March 31, 2017. The performance of the Fund’s other classes may begreater or less than the Class A shares’ performance indicated on this chart depending on whether greater or lesser salescharges and fees were incurred by shareholders investing in the other classes.
Past performance is no guarantee of future results. The performance data quoted represents past performance andcurrent returns may be lower or higher. The investment return and principal value will fluctuate so that an investor’s shares,when redeemed, may be worth more or less than the original cost. The returns do not reflect the deduction of taxes that ashareholder would pay on Fund distributions or the redemption of Fund shares. To obtain performance information current tothe most recent month-end, please call 866-941-4482.
The maximum sales charge for Class A shares is 5.00%. Class C shares may include a 1.00% contingent deferred sales chargefor the first year only. The expense ratios for the Fund are as follows: 1.25% (Class A shares); 2.00% (Class C shares); and 1.00%(Class I shares). These expense ratios are as stated in the most recent Prospectus dated January 31, 2017. More recent expenseratios can be found in the Financial Highlights section of this Semi-Annual Report.

IVA Worldwide Fund IVA Funds
9
Portfolio Composition (unaudited) As of March 31, 2017
Asset Allocation (As a Percent of Total Net Assets)
Equity 50.8%Fixed Income 2.5%Short-Term Investments 40.7%Gold 5.8%Other(a) 0.2%
Sector Allocation (As a Percent of Total Net Assets)
Holding Company
Consumer Discretionary
Financials
Consumer Staples
Energy
IndustrialsGold & Gold Mining
MaterialsTelecommunication Services
Health Care
Other(a)
Short-Term Investments
Sovereign BondsUtilities
Real Estate
Technology10.8%
10.3%
6.4%9.0%
5.1%4.5%4.4%4.3%
1.7%0.8%0.6%0.5%
0.3%0.4%
40.7%0.2%
Top 10 Positions (As a Percent of Total Net Assets)(b)
Gold Bullion 5.8%
Berkshire Hathaway Inc., Class ‘A’, Class ‘B’ 4.2%
Astellas Pharma Inc. 3.7%
Nestlé SA 2.2%
Bureau Veritas SA 2.1%
Oracle Corp. 1.8%
Samsung Electronics Co., Ltd. 1.5%
Mastercard Inc., Class ‘A’ 1.4%
Antofagasta Plc 1.3%
CVS Health Corp. 1.3%
Top 10 positions represent 25.3% of total net assets.(a) Other represents unrealized gains and losses on forward foreign currency contracts and other assets and liabilities.(b) Short-Term Investments are not included.

IVA Worldwide Fund IVA Funds
10
Schedule of Investments (unaudited)March 31, 2017
SHARES DESCRIPTION FAIR VALUE
COMMON STOCKS – 50.7%
Bermuda | 0.8%1,505,700 Jardine Strategic Holdings Ltd. $ 63,239,400
China | 0.6%129,324 Baidu Inc., ADR (a) 22,310,977
15,637,640 Clear Media Ltd. 18,109,60068,320,000 Springland International Holdings Ltd. 12,219,623
52,640,200
France | 6.8%903,607 Alten SA 69,290,003
3,705,607 Altran Technologies SA 62,380,56224,549,756 Bolloré SA 95,173,279
177,361 Bolloré SA NV (a) 673,5838,037,087 Bureau Veritas SA 169,550,1152,258,966 Engie SA 32,003,000
37,482 Financière de l’Odet SA 31,388,84594,455 Robertet SA 35,267,60157,677 Séché Environnement SA 1,699,454
279,481 Sodexo SA 32,871,068200,614 Thales SA 19,402,598
41,887 Wendel SA 5,308,583555,008,691
Germany | 0.9%284,050 Bayerische Motoren Werke AG 25,911,623332,556 Siemens AG 45,552,555
71,464,178
Hong Kong | 0.8%3,507,587 Henderson Land Development Co. Ltd. 21,732,010
37,372,159 Hongkong & Shanghai Hotels Ltd. 43,953,10265,685,112
Japan | 7.7%23,041,200 Astellas Pharma Inc. 303,407,879
1,198,300 Azbil Corp. 40,255,475537,500 Benesse Holdings Inc. 16,801,401
1,418,200 Cosel Co., Ltd. 19,273,660588,100 F@N Communications, Inc. 4,389,752289,700 FANUC Corp. 59,381,604755,700 Icom Inc. (b) 17,370,307211,200 Medikit Co., Ltd. 8,840,313509,000 Miraca Holdings Inc. 23,408,605
See Notes to Financial Statements.

IVA Worldwide Fund IVA Funds
11
Schedule of Investments (unaudited)March 31, 2017
SHARES DESCRIPTION FAIR VALUE
Japan | 7.7% (continued)178,500 Nitto Kohki Co., Ltd. $ 4,086,917328,700 Okinawa Cellular Telephone Co. 10,643,703
1,064,000 Rohto Pharmaceutical Co., Ltd. 19,936,262390,200 Seven & i Holdings Co., Ltd. 15,288,354259,400 Techno Medica Co., Ltd. 4,939,621932,900 Toho Co., Ltd. 24,728,177
11,298,800 Yahoo Japan Corp. 52,165,483624,917,513
Malaysia | 0.8%52,837,200 Genting Malaysia Berhad 65,068,973
Netherlands | 1.1%1,177,040 Airbus Group SE 89,566,659
Norway | 0.0%77,511 Golden Close Maritime Corp. Ltd. (a)(c) —
South Africa | 0.4%2,535,416 Net 1 U.E.P.S. Technologies Inc. (a) 31,008,138
South Korea | 4.8%398,539 Hyundai Mobis Co., Ltd. 85,709,228474,241 Hyundai Motor Co. 66,791,521
1,994,452 Kangwon Land, Inc. 68,128,468523,248 KT&G Corp. 45,619,851
68,381 Samsung Electronics Co., Ltd. 125,963,391392,212,459
Switzerland | 3.4%473,828 Compagnie Financière Richemont SA 37,465,360
2,351,279 Nestlé SA 180,398,1343,742,100 UBS Group AG 59,887,049
277,750,543
Thailand | 0.2%33,397,500 Thaicom PCL 19,243,958
United Kingdom | 2.4%10,128,763 Antofagasta Plc 105,900,820
4,773,700 HSBC Holdings Plc 38,930,1408,984,991 Millennium & Copthorne Hotels Plc 49,644,690
194,475,650
See Notes to Financial Statements.

IVA Worldwide Fund IVA Funds
12
Schedule of Investments (unaudited)March 31, 2017
SHARES DESCRIPTION FAIR VALUE
United States | 20.0%14,434 Alphabet Inc., Class ‘A’ (a) $ 12,237,14545,665 Alphabet Inc., Class ‘C’ (a) 37,881,857
940,901 Amdocs Ltd. 57,385,552741,612 American Express Co. 58,668,925349,766 Aon Plc 41,513,727
4,294,892 Bank of America Corp. 101,316,5021,190 Berkshire Hathaway Inc., Class ‘A’ (a) 297,321,500
285,555 Berkshire Hathaway Inc., Class ‘B’ (a) 47,596,307149,135 Cimarex Energy Co. 17,820,141
1,384,235 CVS Health Corp. 108,662,4482,447,875 DeVry Education Group Inc. 86,777,169
557,158 Emerson Electric Co. 33,351,4781,018,852 Expeditors International of Washington, Inc. 57,554,950
468,024 Flowserve Corp. 22,661,72266,596 Goldman Sachs Group, Inc. 15,298,433
Liberty Interactive Corp. QVC Group,2,524,713 Series ‘A’ (a) 50,544,754
454,930 Marsh & McLennan Cos., Inc. 33,614,7781,006,921 Mastercard Inc., Class ‘A’ 113,248,4056,370,534 News Corp., Class ‘A’ 82,816,9421,285,193 News Corp., Class ‘B’ 17,350,1063,234,502 Oracle Corp. 144,291,134
617,728 Ralph Lauren Corp. 50,418,9591,587,550 Teradata Corp. (a) 49,404,556
428,963 Tiffany & Co. 40,880,174444,019 United Technologies Corp. 49,823,372
1,628,441,036TOTAL COMMON STOCKS
(Cost — $2,906,449,224) 4,130,722,510
PREFERRED STOCKS – 0.1%
United States | 0.1%CYS Investments Inc., Series ‘B’,
297,755 7.5% due 4/30/2018 (d) 6,997,243
TOTAL PREFERRED STOCKS(Cost — $6,125,729) 6,997,243
PRINCIPALAMOUNT
CORPORATE NOTES & BONDS – 2.0%
Norway | 0.0%Golden Close Maritime Corp. Ltd.,
154,101 USD 8% due 3/29/2022 (c)(e)(f) 154,101
See Notes to Financial Statements.

IVA Worldwide Fund IVA Funds
13
Schedule of Investments (unaudited)March 31, 2017
PRINCIPALAMOUNT DESCRIPTION FAIR VALUE
South Africa | 0.6%Gold Fields Orogen Holding (BVI) Ltd.,
46,980,000 USD 4.875% due 10/7/2020 (e) $ 47,449,800
Switzerland | 0.1%8,900,000 EUR UBS AG, 7.152% due 12/21/2017 (g) 9,962,266
United States | 1.3%Brandywine Operating Partnership, LP,
6,070,000 USD 5.7% due 5/1/2017 6,088,3569,684,000 USD Era Group Inc., 7.75% due 12/15/2022 9,272,430
Intelsat Jackson Holdings Ltd.:8,702,000 USD 7.5% due 4/1/2021 7,886,187
29,476,000 USD 5.5% due 8/1/2023 24,354,545
34,108,000 USD Joy Global Inc., 5.125% due 10/15/2021 36,640,314Rowan Cos., Inc.:
17,524,000 USD 4.875% due 6/1/2022 16,823,0403,786,000 USD 4.75% due 1/15/2024 3,416,865
104,481,737
TOTAL CORPORATE NOTES & BONDS(Cost — $138,309,743) 162,047,904
CONVERTIBLE BONDS – 0.0%
Norway | 0.0%Golden Close Maritime Corp. Ltd.,
523,946 USD 0% due 3/29/2022 (a)(c) 104,789
TOTAL CONVERTIBLE BONDS(Cost — $274,257) 104,789
SOVEREIGN BONDS – 0.5%
Singapore | 0.5%Government of Singapore,
48,812,000 SGD 2.5% due 6/1/2019 35,791,512
TOTAL SOVEREIGN BONDS(Cost — $36,924,723) 35,791,512
OUNCES
COMMODITIES – 5.8%
380,678 Gold Bullion (a) 474,887,580
TOTAL COMMODITIES(Cost — $532,545,604) 474,887,580
See Notes to Financial Statements.

IVA Worldwide Fund IVA Funds
14
Schedule of Investments (unaudited)March 31, 2017
PRINCIPALAMOUNT DESCRIPTION FAIR VALUE
SHORT-TERM INVESTMENTS – 40.7%
Commercial Paper | 40.6%Apple Inc.:
40,000,000 USD 0.69% due 4/6/2017 (e) $ 39,995,42725,000,000 USD 0.72% due 4/13/2017 (e) 24,993,74430,000,000 USD 0.71% due 4/19/2017 (e) 29,988,93230,000,000 USD 0.75% due 5/4/2017 (e) 29,979,77022,000,000 USD 0.85% due 5/11/2017 (e) 21,981,93533,000,000 USD 0.72% due 5/12/2017 (e) 32,972,20325,000,000 USD 0.83% due 5/25/2017 (e) 24,971,92732,000,000 USD BASF SE, 0.85% due 4/24/2017 (e) 31,981,291
Cisco Systems Inc.:16,000,000 USD 0.66% due 4/5/2017 (e) 15,998,20980,000,000 USD 0.7% due 4/12/2017 (e) 79,978,10750,400,000 USD 0.8% due 5/3/2017 (e) 50,360,037
Clorox Co.:15,000,000 USD 1.13% due 5/8/2017 (e) 14,980,16115,000,000 USD 1.18% due 5/9/2017 (e) 14,979,606
Coca-Cola Co.:66,000,000 USD 0.79% due 4/19/2017 (e) 65,972,58650,000,000 USD 0.85% due 5/22/2017 (e) 49,938,82815,000,000 USD 0.85% due 5/23/2017 (e) 14,981,27330,000,000 USD 0.85% due 5/25/2017 (e) 29,960,950
Colgate-Palmolive Co.:24,000,000 USD 0.76% due 4/12/2017 (e) 23,993,79230,000,000 USD 0.8% due 4/20/2017 (e) 29,986,867
Danaher Corp.:35,000,000 USD 0.75% due 4/7/2017 (e) 34,994,28340,000,000 USD 0.75% due 4/10/2017 (e) 39,990,60048,100,000 USD 0.85% due 4/13/2017 (e) 48,085,18440,000,000 USD 0.75% due 4/17/2017 (e) 39,983,73766,900,000 USD 0.9% due 4/18/2017 (e) 66,871,13314,000,000 USD Dover Corp., 1.15% due 4/6/2017 (e) 13,998,045
Dow Chemical Co.:15,000,000 USD 1.03% due 4/4/2017 14,998,157
9,000,000 USD 1.0% due 4/18/2017 8,994,744Engie SA:
35,000,000 USD 0.9% due 4/25/2017 (e) 34,978,63526,000,000 USD 0.74% due 5/11/2017 (e) 25,973,11325,000,000 USD 0.9% due 5/17/2017 (e) 24,970,037
See Notes to Financial Statements.

IVA Worldwide Fund IVA Funds
15
Schedule of Investments (unaudited)March 31, 2017
PRINCIPALAMOUNT DESCRIPTION FAIR VALUE
Commercial Paper | 40.6% (continued)Essilor International:
25,000,000 USD 0.95% due 5/24/2017 (e) $ 24,965,12525,000,000 USD 0.95% due 5/25/2017 (e) 24,964,403
Estée Lauder Companies Inc., 21,400,000 USD 0.73% due 4/7/2017 (e) 21,396,505
Florida Power & Light Co.:24,000,000 USD 1.0% due 4/6/2017 23,995,64840,000,000 USD 0.87% due 4/7/2017 39,991,52225,000,000 USD 0.92% due 4/17/2017 24,986,88425,000,000 USD 0.91% due 4/19/2017 24,985,27515,000,000 USD 1.07% due 5/12/2017 14,979,70010,000,000 USD 1.12% due 5/12/2017 9,986,46710,000,000 USD 1.12% due 5/15/2017 9,985,43731,100,000 USD 1.15% due 5/18/2017 31,051,484
Henkel Corp.:63,000,000 USD 0.74% due 4/3/2017 (e) 62,995,63744,500,000 USD 0.74% due 4/5/2017 (e) 44,494,83323,900,000 USD 0.75% due 4/10/2017 (e) 23,894,38325,000,000 USD 0.98% due 6/1/2017 (e) 24,959,312
Johnson & Johnson:45,900,000 USD 0.73% due 4/6/2017 (e) 45,894,117
7,000,000 USD 0.77% due 4/18/2017 (e) 6,997,25318,000,000 USD 0.77% due 4/20/2017 (e) 17,992,12020,200,000 USD 0.77% due 4/28/2017 (e) 20,187,33739,000,000 USD 0.8% due 5/5/2017 (e) 38,968,98450,500,000 USD 0.8% due 5/9/2017 (e) 50,454,866
Kraft Heinz Foods Co., 20,000,000 USD 1.1% due 4/17/2017 (e) 19,986,674
L’Oréal USA Inc.:10,000,000 USD 0.83% due 4/18/2017 (e) 9,995,83546,000,000 USD 0.79% due 4/21/2017 (e) 45,977,46030,000,000 USD 0.83% due 4/27/2017 (e) 29,980,807
Merck & Co. Inc.:32,700,000 USD 0.81% due 4/28/2017 (e) 32,679,50119,000,000 USD 0.83% due 5/1/2017 (e) 18,986,71513,000,000 USD 0.84% due 5/10/2017 (e) 12,988,054
Microsoft Corp.:30,000,000 USD 0.64% due 4/12/2017 (e) 29,991,94030,000,000 USD 0.75% due 5/10/2017 (e) 29,971,43320,000,000 USD 0.77% due 5/16/2017 (e) 19,977,84326,000,000 USD 0.82% due 5/18/2017 (e) 25,969,84025,000,000 USD 0.85% due 5/23/2017 (e) 24,967,685
See Notes to Financial Statements.

IVA Worldwide Fund IVA Funds
16
Commercial Paper | 40.6% (continued)Nestlé Capital Corp., 0.7%
35,000,000 USD due 5/10/2017 (e) $ 34,967,800Nestlé Finance International Ltd.,
30,000,000 USD 0.77% due 5/8/2017 (e) 29,973,970Novartis Finance Corp.:
25,000,000 USD 0.83% due 4/7/2017 (e) 24,996,06230,000,000 USD 0.72% due 4/10/2017 (e) 29,993,20015,000,000 USD 0.72% due 4/13/2017 (e) 14,995,54225,000,000 USD 0.73% due 4/18/2017 (e) 24,989,58750,000,000 USD 0.73% due 4/21/2017 (e) 49,975,50022,000,000 USD 0.85% due 4/26/2017 (e) 21,986,47920,000,000 USD 0.85% due 5/1/2017 (e) 19,985,15438,900,000 USD 0.85% due 5/4/2017 (e) 38,868,14820,000,000 USD 0.85% due 5/9/2017 (e) 19,981,042
1,400,000 USD 0.87% due 5/22/2017 (e) 1,398,186Procter & Gamble Co.:
55,200,000 USD 0.69% due 4/4/2017 (e) 55,195,30225,000,000 USD 0.7% due 4/5/2017 (e) 24,997,33735,000,000 USD 0.8% due 4/17/2017 (e) 34,987,05922,000,000 USD 0.8% due 4/24/2017 (e) 21,988,31135,000,000 USD 0.82% due 4/25/2017 (e) 34,980,58020,000,000 USD 0.81% due 4/27/2017 (e) 19,987,955
Roche Holdings, Inc.:17,000,000 USD 0.66% due 4/4/2017 (e) 16,998,48138,900,000 USD 0.66% due 4/10/2017 (e) 38,891,18315,000,000 USD 0.62% due 4/11/2017 (e) 14,996,24630,000,000 USD 0.66% due 4/12/2017 (e) 29,991,79020,000,000 USD 0.62% due 4/13/2017 (e) 19,994,05620,000,000 USD 0.66% due 4/17/2017 (e) 19,992,15210,000,000 USD 0.67% due 4/19/2017 (e) 9,995,58820,000,000 USD 0.68% due 4/24/2017 (e) 19,988,70742,400,000 USD 0.67% due 4/25/2017 (e) 42,375,00250,000,000 USD 0.8% due 4/26/2017 (e) 49,969,269
Schlumberger Holdings Corp.,19,000,000 USD 0.95% due 4/3/2017 (e) 18,998,288
Siemens Capital Co., LLC, 11,000,000 USD 0.88% due 5/1/2017 (e) 10,991,835
Unilever Capital Corp.:20,000,000 USD 0.75% due 4/3/2017 (e) 19,998,67525,000,000 USD 0.72% due 4/11/2017 (e) 24,993,85117,200,000 USD 0.84% due 5/1/2017 (e) 17,187,52925,000,000 USD 0.85% due 5/8/2017 (e) 24,977,490
Schedule of Investments (unaudited)March 31, 2017
PRINCIPALAMOUNT DESCRIPTION FAIR VALUE
See Notes to Financial Statements.

IVA Worldwide Fund IVA Funds
17
Schedule of Investments (unaudited)March 31, 2017
PRINCIPALAMOUNT DESCRIPTION FAIR VALUE
Commercial Paper | 40.6% (continued)United Healthcare Co.:
25,000,000 USD 1.1% due 4/20/2017 (e) $ 24,984,47244,500,000 USD 1.2% due 5/26/2017 (e) 44,418,11030,000,000 USD 1.2% due 6/5/2017 (e) 29,933,780
United Parcel Service, Inc.:30,000,000 USD 0.78% due 4/20/2017 (e) 29,986,36723,000,000 USD 0.76% due 4/24/2017 (e) 22,987,31935,000,000 USD 0.8% due 4/24/2017 (e) 34,980,70325,000,000 USD 0.8% due 4/27/2017 (e) 24,984,38125,000,000 USD 0.82% due 5/15/2017 (e) 24,972,96925,000,000 USD 0.82% due 5/17/2017 (e) 24,971,66938,000,000 USD 0.82% due 5/26/2017 (e) 37,947,805
United Technologies Corp., 5,000,000 USD 1.22% due 4/27/2017 (e) 4,995,425
Wal-Mart Stores, Inc.:40,000,000 USD 0.79% due 4/3/2017 (e) 39,997,45035,000,000 USD 0.66% due 4/4/2017 (e) 34,997,02111,000,000 USD 0.68% due 4/4/2017 (e) 10,999,06425,000,000 USD 0.78% due 4/5/2017 (e) 24,997,33720,000,000 USD 0.75% due 4/10/2017 (e) 19,995,70040,000,000 USD 0.66% due 4/11/2017 (e) 39,990,52840,100,000 USD 0.8% due 4/11/2017 (e) 40,090,504
Walt Disney Co., 40,000,000 USD 0.84% due 5/19/2017 (e) 39,952,524
3,312,204,876
Treasury Bills | 0.1%5,000,000 USD U.S. Treasury Bill, due 6/8/2017 (h) 4,993,535
TOTAL SHORT-TERM INVESTMENTS(Cost — $3,317,356,284) 3,317,198,411
TOTAL INVESTMENTS — 99.8%(Cost — $6,937,985,564) 8,127,749,949
Other Assets In Excess ofLiabilities — 0.2% 17,917,440
TOTAL NET ASSETS — 100.0% $8,145,667,389
See Notes to Financial Statements.
IVA Worldwide Fund IVA Funds
18
Schedule of Investments (unaudited)March 31, 2017
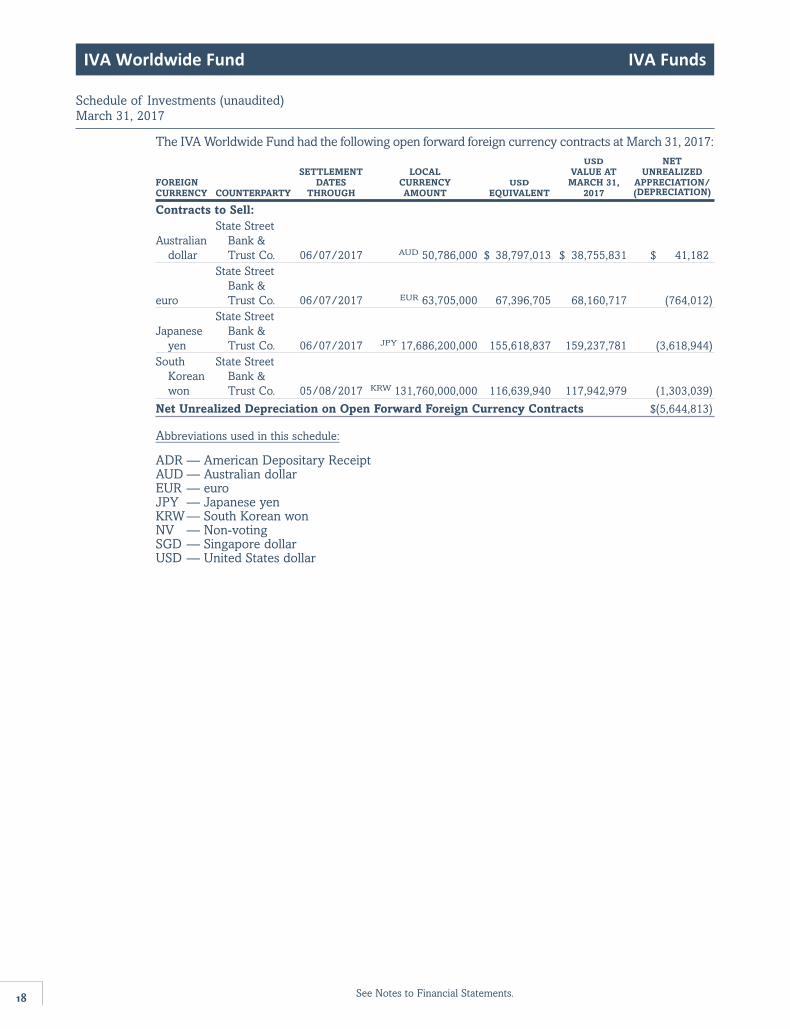
The IVA Worldwide Fund had the following open forward foreign currency contracts at March 31, 2017:USD NET
SETTLEMENT LOCAL VALUE AT UNREALIZEDFOREIGN DATES CURRENCY USD MARCH 31, APPRECIATION/CURRENCY COUNTERPARTY THROUGH AMOUNT EQUIVALENT 2017 (DEPRECIATION)
Contracts to Sell:State Street
Australian Bank &dollar Trust Co. 06/07/2017 AUD 50,786,000 $ 38,797,013 $ 38,755,831 $ 41,182
State StreetBank &
euro Trust Co. 06/07/2017 EUR 63,705,000 67,396,705 68,160,717 (764,012)State Street
Japanese Bank ¥ Trust Co. 06/07/2017 JPY 17,686,200,000 155,618,837 159,237,781 (3,618,944)
South State StreetKorean Bank &won Trust Co. 05/08/2017 KRW 131,760,000,000 116,639,940 117,942,979 (1,303,039)
Net Unrealized Depreciation on Open Forward Foreign Currency Contracts $(5,644,813)
Abbreviations used in this schedule:
ADR — American Depositary ReceiptAUD — Australian dollarEUR — euroJPY — Japanese yenKRW— South Korean wonNV — Non-votingSGD — Singapore dollarUSD — United States dollar
See Notes to Financial Statements.

IVA Worldwide Fund IVA Funds
(a) Non-income producing investment.(b) Issuer of the security is an affiliate of the IVA Worldwide Fund as defined by the Investment Company Act of 1940.
An affiliate is deemed as a company in which the IVA Worldwide Fund indirectly or directly has ownership of atleast 5% of the company’s outstanding voting securities. See Schedule of Affiliates below for additional information.
Schedule of AffiliatesSHARES SHARES HELD AT HELD AT FAIR VALUE AT
SEPTEMBER 30, SHARE SHARE MARCH 31, MARCH 31, REALIZED DIVIDEND SECURITY 2016 ADDITIONS REDUCTIONS 2017 2017 GAIN/(LOSS) INCOME*
DeVryEducationGroupInc.** 6,567,795 — 4,119,920 2,447,875 — $(16,481,162) $803,819
Icom Inc. 758,200 — 2,500 755,700 $17,370,307 (88) 68,060
Net 1 U.E.P.S.TechnologiesInc.** 2,835,280 — 299,864 2,535,416 — 552,279 —
Total $17,370,307 $(15,928,971) $871,879
* Dividend income is gross of withholding taxes.** Non-affiliated at March 31, 2017.
(c) Security is deemed illiquid. As of March 31, 2017, the value of these illiquid securities amounted to 0.0% oftotal net assets.
(d) Cumulative redeemable preferred stock. The date shown represents the first optional call date.(e) Security is exempt from registration under Rule 144A or Section 4(2) of the Securities Act of 1933 (the “1933
Act”). Any resale of these securities must generally be effected through a sale that is registered under the 1933Act or otherwise exempted from such registration requirements.
(f) Payment-in-kind security for which the issuer may pay interest with additional debt securities or cash.(g) Fixed-to-float perpetual bond. The security has no maturity date. The date shown represents the next call date.(h) This security is held at the custodian as collateral for forward foreign currency contracts sold. As of March 31,
2017, portfolio securities valued at $4,993,535 were segregated to cover collateral requirements.
19
Schedule of Investments (unaudited)March 31, 2017

IVA International Fund IVA Funds
20
Average Annual Total Returns as of March 31, 2017 Six Months(a) One Year Five Year Since Inception(b)
Class A 4.25% 8.31% 6.01% 8.39%Class A (with a 5% maximum initial sales charge) -0.98% 2.93% 4.92% 7.74%Class C 3.86% 7.55% 5.23% 7.58%Class I 4.38% 8.57% 6.28% 8.66%MSCI All Country World (ex-U.S.) Index (Net)(c) 6.51% 13.13% 4.36% 4.47%Consumer Price Index(d) 1.14% 2.45% 1.28% 1.27%
Growth of a $10,000 Initial Investment
Performance (unaudited) As of March 31, 2017
MSCI All Country World (ex-U.S.) Index (Net)(c)IVA International Fund, Class A Shares(e)
Consumer Price Index(d)
10,000
5,000
$20,000
15,000
$18,848
$14,505
$11,136
3/13 3/173/163/153/143/123/103/09 3/11
(a) Total returns for periods of less than one year are not annualized.(b) The Fund commenced investment operations on October 1, 2008.(c) The MSCI All Country World (ex-U.S.) Index (Net) is an unmanaged, free float-adjusted, market capitalization weighted
index composed of stocks of companies located in countries throughout the world, excluding the United States. It isdesigned to measure equity market performance in global developed and emerging markets outside the United States. Theindex includes reinvestment of dividends, net of foreign withholding taxes. Please note that an investor cannot investdirectly in an index.
(d) The Consumer Price Index examines the weighted average of prices of a basket of consumer goods and services, such astransportation, food and medical care. Please note that an investor cannot invest directly in an index.
(e) Hypothetical illustration of $10,000 invested in Class A shares on October 1, 2008, assuming the deduction of the maximuminitial sales charge of 5% at the time of investment for Class A shares and the reinvestment of all distributions, includingreturns of capital, if any, at net asset value through March 31, 2017. The performance of the Fund’s other classes may begreater or less than the Class A shares’ performance indicated on this chart depending on whether greater or lesser salescharges and fees were incurred by shareholders investing in the other classes.
Past performance is no guarantee of future results. The performance data quoted represents past performance andcurrent returns may be lower or higher. The investment return and principal value will fluctuate so that an investor’s shares,when redeemed, may be worth more or less than the original cost. The returns do not reflect the deduction of taxes that ashareholder would pay on Fund distributions or the redemption of Fund shares. To obtain performance information current tothe most recent month-end, please call 866-941-4482.
The maximum sales charge for Class A shares is 5.00%. Class C shares may include a 1.00% contingent deferred sales chargefor the first year only. The expense ratios for the Fund are as follows: 1.24% (Class A shares); 1.99% (Class C shares); and 0.99%(Class I shares). These expense ratios are as stated in the most recent Prospectus dated January 31, 2017. More recent expenseratios can be found in the Financial Highlights section of this Semi-Annual Report.

IVA International Fund IVA Funds
21
Portfolio Composition (unaudited) As of March 31, 2017
Asset Allocation (As a Percent of Total Net Assets)
Equity 61.3%Fixed Income 3.2%Short-Term Investments 28.2%Gold 7.1%Other(a) 0.2%
Sector Allocation (As a Percent of Total Net Assets)
Sovereign and Supranational Bonds
Consumer Discretionary
Telecommunication Services
Technology
Consumer Staples
Holding Company
Health Care
EnergyReal Estate
Materials
Other(a)
Short-Term Investments
Financials
Utilities
IndustrialsGold & Gold Mining
14.8%11.0%
7.3%
10.8%7.7%
6.7%4.5%
3.1%2.3%
1.2%1.1%
0.5%0.3%0.3%
28.2%0.2%
Top 10 Positions (As a Percent of Total Net Assets)(b)
Gold Bullion 7.1%
Astellas Pharma Inc. 4.0%
Bureau Veritas SA 3.1%
Nestlé SA 2.5%
Alten SA 2.3%
Samsung Electronics Co., Ltd. 2.3%
Antofagasta Plc 1.8%
Airbus Group SE 1.6%
First Resources Ltd. 1.5%
Hyundai Mobis Co., Ltd. 1.5%
Top 10 positions represent 27.7% of total net assets.(a) Other represents unrealized gains and losses on forward foreign currency contracts and other assets and liabilities.(b) Short-Term Investments are not included.

IVA International Fund (unaudited) IVA Funds
22
IVA International Fund IVA Funds
Schedule of Investments (unaudited)March 31, 2017
SHARES DESCRIPTION FAIR VALUE
COMMON STOCKS – 61.3%
Argentina | 0.0%876 Nortel Inversora SA, Series ‘B’, ADR $ 22,776
Australia | 0.0%1,351,864 Programmed Maintenance Services Ltd. 1,936,544
Bermuda | 1.1%976,326 Jardine Strategic Holdings Ltd. 41,005,692
Brazil | 0.3%1,515,600 TOTVS SA 13,434,453
Canada | 0.3%3,307,348 Uranium Participation Corp. (a) 10,097,254
Chile | 0.4%551,948 Compañía Cervecerías Unidas SA, ADR 13,947,726
China | 2.7%96,761 Baidu Inc., ADR (a) 16,693,208
40,065,030 Clear Media Ltd. (b) 46,398,4143,441,970 Phoenix New Media Ltd., ADR (a) 12,012,475
59,788,000 Phoenix Satellite Television Holdings Ltd. 11,155,195108,509,000 Springland International Holdings Ltd. 19,407,773
105,667,065
France | 11.6%1,186,888 Alten SA 91,012,4352,076,828 Altran Technologies SA 34,961,532
12,736,006 Bolloré SA 49,374,31784,610 Bolloré SA NV (a) 321,333
5,779,454 Bureau Veritas SA 121,923,166188,235 DOM Security SA (b) 11,446,117
1,463,806 Engie SA 20,737,888184,201 Euler Hermes Group 16,926,992
30,023 Financière de l’Odet SA 25,142,39679,189 Robertet SA 29,567,583
5,900 Robertet SA-CI (c) 1,724,589300,428 Séché Environnement SA 8,852,114167,314 Sodexo SA 19,678,582155,834 Thales SA 15,071,652
29,983 Wendel SA 3,799,920450,540,616
Germany | 1.3%228,887 Bayerische Motoren Werke AG 20,879,542225,710 Siemens AG 30,917,100
51,796,642
See Notes to Financial Statements.

IVA International Fund (unaudited) IVA Funds
23
IVA International Fund IVA Funds
Schedule of Investments (unaudited)March 31, 2017
SHARES DESCRIPTION FAIR VALUE
Hong Kong | 2.7%40,491,000 APT Satellite Holdings Ltd. $ 21,622,293
Asia Satellite Telecommunications 15,821,000 Holdings Ltd. (a) 19,543,409
1,900,386 Henderson Land Development Co. Ltd. 11,774,25044,448,917 Hongkong & Shanghai Hotels Ltd. 52,276,021
105,215,973
India | 0.8%425,750 Bajaj Holdings and Investment Ltd. 14,227,728
47,141,230 South Indian Bank Ltd. 15,535,87929,763,607
Indonesia | 0.3%288,943,800 PT Bank Bukopin Tbk 13,552,203
Japan | 14.4%1,325,570 Arcland Sakamoto Co., Ltd. 15,931,130
285,100 As One Corp. 12,343,32211,760,600 Astellas Pharma Inc. 154,864,274
1,135,200 Azbil Corp. 38,135,70573,800 The Bank of Okinawa Ltd. 2,823,929
379,200 Benesse Holdings Inc. 11,853,1931,010,100 Cosel Co., Ltd. 13,727,488
371,100 Daiseki Co., Ltd. 7,566,667605,800 Doshisha Co., Ltd. 11,214,891214,500 Earth Chemical Co., Ltd. 11,502,425
4,096,300 F@N Communications, Inc. (b) 30,575,993175,400 FANUC Corp. 35,952,825819,800 Hi-Lex Corp. 21,744,987662,700 Icom Inc. 15,232,635105,900 Medikit Co., Ltd. 4,432,713413,600 Miraca Holdings Inc. 19,021,216780,000 Nitto Kohki Co., Ltd. 17,858,798268,900 Okinawa Cellular Telephone Co. 8,707,307
1,011,000 Rohto Pharmaceutical Co., Ltd. 18,943,196171,300 San-A Co., Ltd. 7,785,664290,400 Sankyo Co., Ltd. 9,703,476
10,600 Secom Joshinetsu Co., Ltd. 326,579276,000 Seven & i Holdings Co., Ltd. 10,813,905495,575 Shingakukai Co., Ltd. 2,599,621300,650 Shofu Inc. 3,572,801
4,500 SK Kaken Co., Ltd. 440,582556,900 Techno Medica Co., Ltd. (b) 10,604,761637,600 Toho Co., Ltd. 16,900,724255,200 Transcosmos Inc. 5,996,615
8,366,000 Yahoo Japan Corp. 38,625,025559,802,447
See Notes to Financial Statements.

IVA International Fund (unaudited) IVA Funds
24
IVA International Fund IVA Funds
Schedule of Investments (unaudited)March 31, 2017
SHARES DESCRIPTION FAIR VALUE
Malaysia | 1.3%40,205,300 Genting Malaysia Berhad $ 49,512,797
Mexico | 0.9%1,133,839 Corporativo Fragua, SAB de CV 12,778,683
11,084,097 Grupo Comercial Chedraui SAB de CV 23,888,33136,667,014
Netherlands | 1.6%834,110 Airbus Group SE 63,471,459
Norway | 0.0%37,272 Golden Close Maritime Corp. Ltd. (a)(c) —
Singapore | 2.8%42,447,700 First Resources Ltd. 58,868,741
7,043,020 Haw Par Corp. Ltd. 50,449,341109,318,082
South Africa | 0.8%2,444,574 Net 1 U.E.P.S. Technologies Inc. (a) 29,897,140
South Korea | 7.3%75,334 DONGKOOK Pharmaceutical Co., Ltd. 4,338,29080,618 Fursys Inc. 2,296,059
268,785 Hyundai Mobis Co., Ltd. 57,804,518252,562 Hyundai Motor Co. 35,570,522
1,536,843 Kangwon Land, Inc. 52,497,007408,731 KT&G Corp. 35,635,583
48,803 Samsung Electronics Co., Ltd. 89,899,115298,218 WHANIN Pharmaceutical Co., Ltd. 4,200,066
282,241,160
Switzerland | 4.4%347,236 Compagnie Financière Richemont SA 27,455,789
1,271,232 Nestlé SA 97,533,2492,755,821 UBS Group AG 44,103,041
169,092,079
Thailand | 0.5%30,705,300 Thaicom PCL 17,692,687
United Kingdom | 4.3%6,545,486 Antofagasta Plc 68,436,0303,999,945 HSBC Holdings Plc 32,620,0681,208,449 Jardine Lloyd Thompson Group Plc 17,139,2306,594,416 Millennium & Copthorne Hotels Plc 36,436,0685,019,571 Mitie Group Plc 13,955,342
168,586,738
See Notes to Financial Statements.
IVA International Fund (unaudited) IVA Funds
25
IVA International Fund IVA Funds
Schedule of Investments (unaudited)March 31, 2017
SHARES DESCRIPTION FAIR VALUE
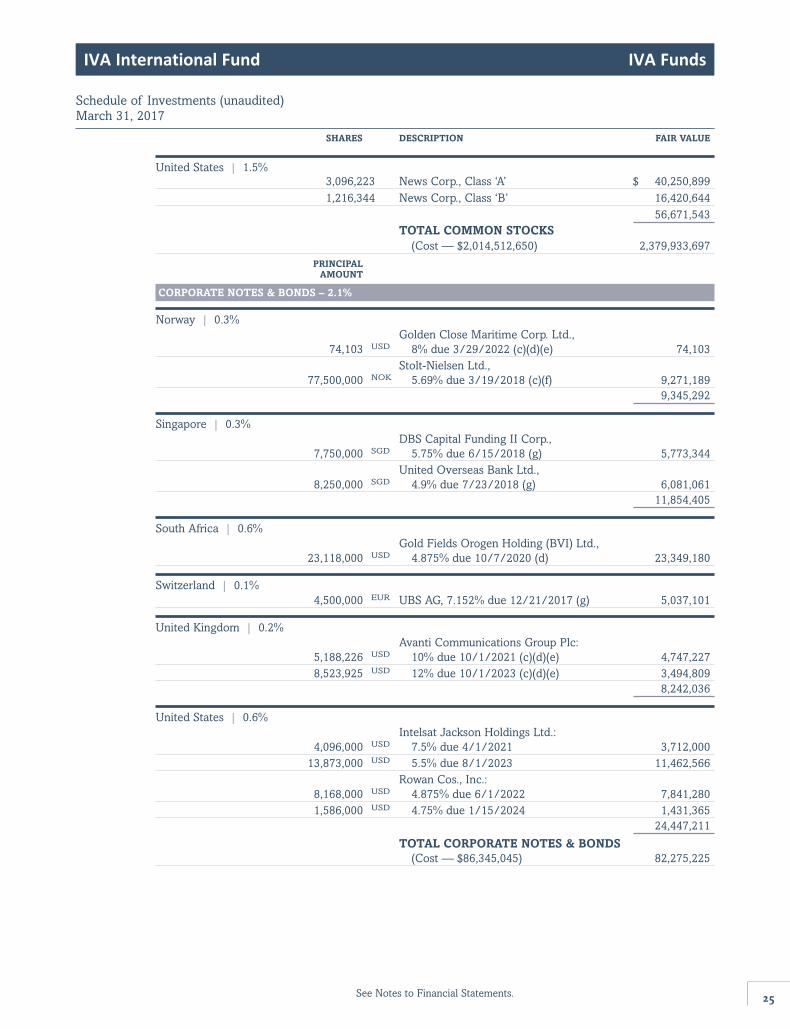
United States | 1.5%3,096,223 News Corp., Class ‘A’ $ 40,250,8991,216,344 News Corp., Class ‘B’ 16,420,644
56,671,543TOTAL COMMON STOCKS
(Cost — $2,014,512,650) 2,379,933,697PRINCIPAL
AMOUNT
CORPORATE NOTES & BONDS – 2.1%
Norway | 0.3%Golden Close Maritime Corp. Ltd.,
74,103 USD 8% due 3/29/2022 (c)(d)(e) 74,103Stolt-Nielsen Ltd.,
77,500,000 NOK 5.69% due 3/19/2018 (c)(f) 9,271,1899,345,292
Singapore | 0.3%DBS Capital Funding II Corp.,
7,750,000 SGD 5.75% due 6/15/2018 (g) 5,773,344United Overseas Bank Ltd.,
8,250,000 SGD 4.9% due 7/23/2018 (g) 6,081,06111,854,405
South Africa | 0.6%Gold Fields Orogen Holding (BVI) Ltd.,
23,118,000 USD 4.875% due 10/7/2020 (d) 23,349,180
Switzerland | 0.1%4,500,000 EUR UBS AG, 7.152% due 12/21/2017 (g) 5,037,101
United Kingdom | 0.2%Avanti Communications Group Plc:
5,188,226 USD 10% due 10/1/2021 (c)(d)(e) 4,747,2278,523,925 USD 12% due 10/1/2023 (c)(d)(e) 3,494,809
8,242,036
United States | 0.6%Intelsat Jackson Holdings Ltd.:
4,096,000 USD 7.5% due 4/1/2021 3,712,00013,873,000 USD 5.5% due 8/1/2023 11,462,566
Rowan Cos., Inc.:8,168,000 USD 4.875% due 6/1/2022 7,841,2801,586,000 USD 4.75% due 1/15/2024 1,431,365
24,447,211
TOTAL CORPORATE NOTES & BONDS(Cost — $86,345,045) 82,275,225
See Notes to Financial Statements.

26
IVA International Fund IVA Funds
Schedule of Investments (unaudited)March 31, 2017
PRINCIPALAMOUNT DESCRIPTION FAIR VALUE
CONVERTIBLE BONDS – 0.0%
Norway | 0.0%Golden Close Maritime Corp. Ltd.,
251,952 USD 0% due 3/29/2022 (c)(d) $ 50,390TOTAL CONVERTIBLE BONDS
(Cost — $131,883) 50,390
SOVEREIGN AND SUPRANATIONAL BONDS – 1.1%
Luxembourg | 0.1%European Investment Bank,
37,500,000 NOK 1.125% due 5/15/2020 4,385,869
Singapore | 1.0%Government of Singapore:
6,786,000 SGD 2.375% due 4/1/2017 4,852,09821,142,000 SGD 0.5% due 4/1/2018 15,032,22926,781,000 SGD 2.5% due 6/1/2019 19,637,230
39,521,557
TOTAL SOVEREIGN AND SUPRANATIONAL BONDS(Cost — $45,830,816) 43,907,426
OUNCES
COMMODITIES – 7.1%
220,108 Gold Bullion (a) 274,580,005TOTAL COMMODITIES
(Cost — $308,169,069) 274,580,005PRINCIPAL
AMOUNT
SHORT-TERM INVESTMENTS – 28.2%
Commercial Paper | 28.1%Apple Inc.:
23,000,000 USD 0.69% due 4/6/2017 (d) 22,997,37013,000,000 USD 0.72% due 4/13/2017 (d) 12,996,74712,900,000 USD 0.85% due 5/11/2017 (d) 12,889,407
9,000,000 USD 0.72% due 5/12/2017 (d) 8,992,41910,000,000 USD BASF SE, 0.85% due 4/24/2017 (d) 9,994,153
Cisco Systems Inc.:5,000,000 USD 0.66% due 4/5/2017 (d) 4,999,440
20,000,000 USD 0.7% due 4/12/2017 (d) 19,994,52715,100,000 USD 0.8% due 5/3/2017 (d) 15,088,027
5,000,000 USD Clorox Co., 1.13% due 5/8/2017 (d) 4,993,387Coca-Cola Co.:
28,000,000 USD 0.79% due 4/19/2017 (d) 27,988,37010,000,000 USD 0.85% due 5/22/2017 (d) 9,987,766
6,000,000 USD 0.85% due 5/23/2017 (d) 5,992,5099,000,000 USD 0.85% due 5/25/2017 (d) 8,988,285
Colgate-Palmolive Co.:4,000,000 USD 0.76% due 4/12/2017 (d) 3,998,965
5,000,000 USD 0.8% due 4/20/2017 (d) 4,997,811
See Notes to Financial Statements.

27
IVA International Fund IVA Funds
Schedule of Investments (unaudited)March 31, 2017
PRINCIPALAMOUNT DESCRIPTION FAIR VALUE
Commercial Paper | 28.1% (continued)Danaher Corp.:
10,100,000 USD 0.85% due 4/13/2017 (d) $ 10,096,88936,200,000 USD 0.9% due 4/18/2017 (d) 36,184,380
7,000,000 USD Dover Corp., 1.15% due 4/6/2017 (d) 6,999,022Dow Chemical Co.:
15,000,000 USD 1.03% due 4/4/2017 14,998,1578,000,000 USD 1.0% due 4/17/2017 7,995,599
Engie SA:15,000,000 USD 0.9% due 4/25/2017 (d) 14,990,84412,000,000 USD 0.74% due 5/11/2017 (d) 11,987,591
Estée Lauder Companies Inc., 10,900,000 USD 0.73% due 4/7/2017 (d) 10,898,220
Florida Power & Light Co.:10,000,000 USD 0.87% due 4/7/2017 9,997,881
8,000,000 USD 0.91% due 4/19/2017 7,995,2887,000,000 USD 1.12% due 5/12/2017 6,990,5277,000,000 USD 1.12% due 5/15/2017 6,989,8064,000,000 USD 1.15% due 5/18/2017 3,993,760
Henkel Corp.:5,000,000 USD 0.74% due 4/5/2017 (d) 4,999,419
20,000,000 USD 0.75% due 4/10/2017 (d) 19,995,3006,000,000 USD 0.74% due 4/12/2017 (d) 5,998,298
25,000,000 USD 0.75% due 4/18/2017 (d) 24,989,213Johnson & Johnson:
7,900,000 USD 0.77% due 4/18/2017 (d) 7,896,8998,000,000 USD 0.77% due 4/20/2017 (d) 7,996,498
20,000,000 USD 0.77% due 4/28/2017 (d) 19,987,4624,000,000 USD 0.8% due 5/5/2017 (d) 3,996,819
19,000,000 USD 0.8% due 5/9/2017 (d) 18,983,019L’Oréal USA Inc.:
15,000,000 USD 0.79% due 4/21/2017 (d) 14,992,6509,000,000 USD 0.83% due 4/27/2017 (d) 8,994,242
Merck & Co. Inc.:15,000,000 USD 0.81% due 4/28/2017 (d) 14,990,59712,000,000 USD 0.83% due 5/1/2017 (d) 11,991,60910,200,000 USD 0.84% due 5/10/2017 (d) 10,190,627
Microsoft Corp.:8,500,000 USD 0.64% due 4/12/2017 (d) 8,497,716
11,800,000 USD 0.75% due 5/10/2017 (d) 11,788,76415,000,000 USD 0.82% due 5/18/2017 (d) 14,982,600
Nestlé Capital Corp., 15,000,000 USD 0.7% due 5/10/2017 (d) 14,986,200
Nestlé Finance International Ltd., 11,500,000 USD 0.77% due 5/8/2017 (d) 11,490,022
Novartis Finance Corp.:16,000,000 USD 0.83% due 4/7/2017 (d) 15,997,480
5,000,000 USD 0.72% due 4/13/2017 (d) 4,998,51419,000,000 USD 0.85% due 4/26/2017 (d) 18,988,322
See Notes to Financial Statements.
28
IVA International Fund IVA Funds
See Notes to Financial Statements.
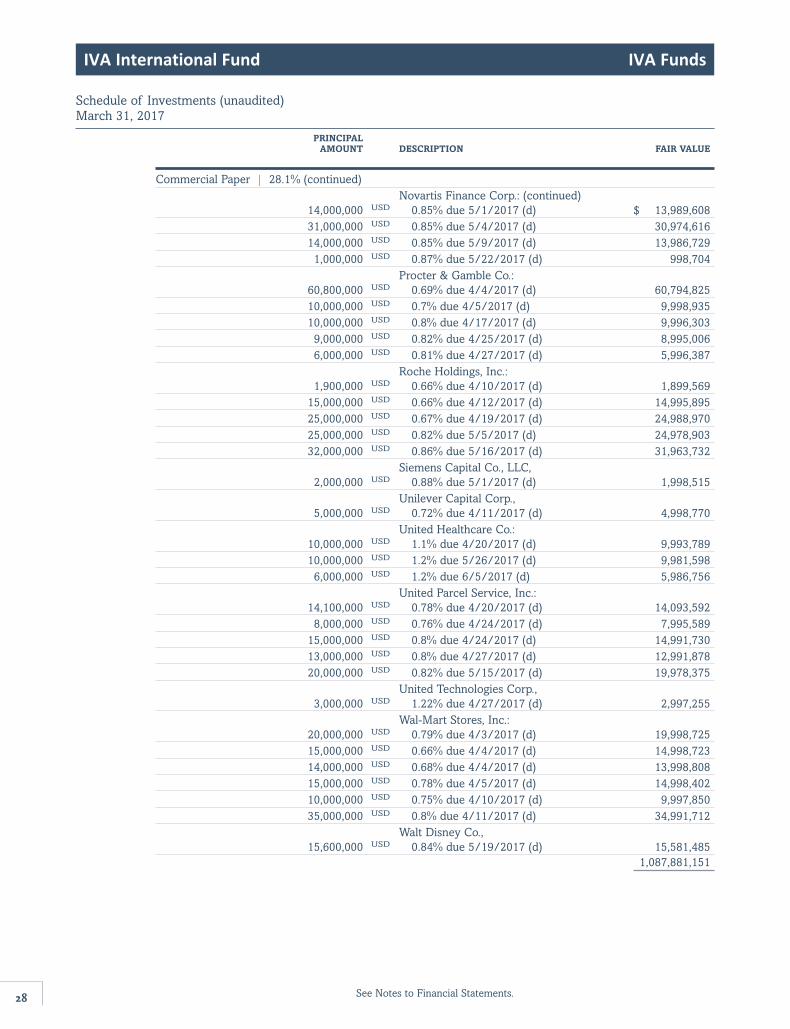
Commercial Paper | 28.1% (continued)Novartis Finance Corp.: (continued)
14,000,000 USD 0.85% due 5/1/2017 (d) $ 13,989,60831,000,000 USD 0.85% due 5/4/2017 (d) 30,974,61614,000,000 USD 0.85% due 5/9/2017 (d) 13,986,729
1,000,000 USD 0.87% due 5/22/2017 (d) 998,704Procter & Gamble Co.:
60,800,000 USD 0.69% due 4/4/2017 (d) 60,794,82510,000,000 USD 0.7% due 4/5/2017 (d) 9,998,93510,000,000 USD 0.8% due 4/17/2017 (d) 9,996,303
9,000,000 USD 0.82% due 4/25/2017 (d) 8,995,0066,000,000 USD 0.81% due 4/27/2017 (d) 5,996,387
Roche Holdings, Inc.:1,900,000 USD 0.66% due 4/10/2017 (d) 1,899,569
15,000,000 USD 0.66% due 4/12/2017 (d) 14,995,89525,000,000 USD 0.67% due 4/19/2017 (d) 24,988,97025,000,000 USD 0.82% due 5/5/2017 (d) 24,978,90332,000,000 USD 0.86% due 5/16/2017 (d) 31,963,732
Siemens Capital Co., LLC, 2,000,000 USD 0.88% due 5/1/2017 (d) 1,998,515
Unilever Capital Corp., 5,000,000 USD 0.72% due 4/11/2017 (d) 4,998,770
United Healthcare Co.:10,000,000 USD 1.1% due 4/20/2017 (d) 9,993,78910,000,000 USD 1.2% due 5/26/2017 (d) 9,981,598
6,000,000 USD 1.2% due 6/5/2017 (d) 5,986,756United Parcel Service, Inc.:
14,100,000 USD 0.78% due 4/20/2017 (d) 14,093,5928,000,000 USD 0.76% due 4/24/2017 (d) 7,995,589
15,000,000 USD 0.8% due 4/24/2017 (d) 14,991,73013,000,000 USD 0.8% due 4/27/2017 (d) 12,991,87820,000,000 USD 0.82% due 5/15/2017 (d) 19,978,375
United Technologies Corp., 3,000,000 USD 1.22% due 4/27/2017 (d) 2,997,255
Wal-Mart Stores, Inc.:20,000,000 USD 0.79% due 4/3/2017 (d) 19,998,72515,000,000 USD 0.66% due 4/4/2017 (d) 14,998,72314,000,000 USD 0.68% due 4/4/2017 (d) 13,998,80815,000,000 USD 0.78% due 4/5/2017 (d) 14,998,40210,000,000 USD 0.75% due 4/10/2017 (d) 9,997,85035,000,000 USD 0.8% due 4/11/2017 (d) 34,991,712
Walt Disney Co., 15,600,000 USD 0.84% due 5/19/2017 (d) 15,581,485
1,087,881,151
Schedule of Investments (unaudited)March 31, 2017
PRINCIPALAMOUNT DESCRIPTION FAIR VALUE

29
IVA International Fund IVA Funds
Schedule of Investments (unaudited)March 31, 2017
PRINCIPALAMOUNT DESCRIPTION FAIR VALUE
Treasury Bills | 0.1%5,000,000 USD U.S. Treasury Bill, due 6/8/2017 (h) $ 4,993,535
TOTAL SHORT-TERM INVESTMENTS(Cost — $1,092,924,955) 1,092,874,686
TOTAL INVESTMENTS — 99.8% (Cost — $3,547,914,418) 3,873,621,429
Other Assets In Excess of Liabilities — 0.2% 8,196,411
TOTAL NET ASSETS — 100.0% $3,881,817,840
The IVA International Fund had the following open forward foreign currency contracts at March 31, 2017:USD NET
SETTLEMENT LOCAL VALUE AT UNREALIZEDFOREIGN DATES CURRENCY USD MARCH 31, APPRECIATION/CURRENCY COUNTERPARTY THROUGH AMOUNT EQUIVALENT 2017 (DEPRECIATION)
Contracts to Sell:State Street
Australian Bank & dollar Trust Co. 06/07/2017 AUD 29,710,000 $ 22,695,827 $ 22,672,307 $ 23,520
State Street Bank &
euro Trust Co. 06/07/2017 EUR 49,423,000 52,287,063 52,879,791 (592,728)State Street
Japanese Bank & yen Trust Co. 06/07/2017 JPY 22,172,700,000 195,032,969 199,632,004 (4,599,035)
South State Street Korean Bank & won Trust Co. 05/08/2017 KRW 94,577,000,000 83,622,728 84,659,177 (1,036,449)
Net Unrealized Depreciation on Open Forward Foreign Currency Contracts $(6,204,692)
Abbreviations used in this schedule:
ADR — American Depositary ReceiptAUD — Australian dollarCI — Investment certificates (non-voting)EUR — euroJPY — Japanese yenKRW— South Korean wonNOK — Norwegian kroneNV — Non-votingSGD — Singapore dollarUSD — United States dollar
See Notes to Financial Statements.

Schedule of Investments (unaudited)March 31, 2017
IVA International Fund IVA Funds
(a) Non-income producing investment.(b) Issuer of the security is an affiliate of the IVA International Fund as defined by the Investment Company Act of
1940. An affiliate is deemed as a company in which the IVA International Fund indirectly or directly hasownership of at least 5% of the company’s outstanding voting securities. See Schedule of Affiliates below foradditional information.
Schedule of Affiliates
SHARES SHARES HELD AT HELD AT FAIR VALUE AT
SEPTEMBER 30, SHARE SHARE MARCH 31, MARCH 31, REALIZED DIVIDENDSECURITY 2016 ADDITIONS REDUCTIONS 2017 2017 LOSS INCOME*
Clear Media Ltd. 40,065,030 — — 40,065,030 $46,398,414 — —
DOM Security SA 291,806 — 103,571 188,235 11,446,117 $(241,529) —
F@N Communications, Inc. 4,078,800 17,500 — 4,096,300 30,575,993 — $629,151
Techno Medica Co., Ltd. 554,500 2,400 — 556,900 10,604,761 — 215,668
Total $99,025,285 $(241,529) $844,819
* Dividend income is gross of withholding taxes.
(c) Security is deemed illiquid. As of March 31, 2017, the value of these illiquid securities amounted to 0.5% oftotal net assets.
(d) Security is exempt from registration under Rule 144A or Section 4(2) of the Securities Act of 1933 (the “1933Act”). Any resale of these securities must generally be effected through a sale that is registered under the 1933Act or otherwise exempted from such registration requirements.
(e) Payment-in-kind security for which the issuer may pay interest with additional debt securities or cash.(f) Variable rate security. The interest rate shown reflects the rate currently in effect.(g) Fixed-to-float perpetual bond. The security has no maturity date. The date shown represents the next call date.(h) This security is held at the custodian as collateral for forward foreign currency contracts sold. As of March 31,
2017, portfolio securities valued at $4,993,535 were segregated to cover collateral requirements.
30

Statement of Assets and Liabilities IVA Global SICAV
March 31, 2017
31
Statements of Assets and Liabilities (unaudited) IVA Funds
IVA IVAWorldwide International
Fund Fund
Assets:Long-term investments, at cost:
Non-affiliated securities $ 3,070,634,865 $ 2,086,941,435Affiliated securities 17,448,811 59,878,959Commodities 532,545,604 308,169,069
Short-term investments, at cost 3,312,360,954 1,087,929,625Foreign currency, at cost — 42,037Collateral for open foreign forward currency contracts, at cost 4,995,330 4,995,330Long-term investments, at fair value:
Non-affiliated securities $ 4,318,293,651 $ 2,407,141,453Affiliated securities 17,370,307 99,025,285Commodities 474,887,580 274,580,005
Short-term investments, at fair value 3,312,204,876 1,087,881,151Foreign currency, at fair value — 41,998Collateral for open foreign forward currency contracts, at fair value 4,993,535 4,993,535Cash 409,548 327,945Dividends and interest receivable 22,778,324 13,292,409Receivable for fund shares sold 9,579,065 3,095,093Receivable for investments sold 5,985,691 4,002,884Prepaid expenses and other assets 116,145 50,837
Total assets $ 8,166,618,722 $ 3,894,432,595
Liabilities:Payable for fund shares repurchased $ 6,582,445 $ 982,344Unrealized depreciation on open forward foreign currency contracts 5,644,813 6,204,692Payable for investments purchased — 1,542,092Accrued investment advisory fees 6,200,193 2,932,788Accrued distribution and service fees 1,130,034 109,060
Accrued expenses and other liabilities 1,393,848 843,779
Total liabilities 20,951,333 12,614,755
Net Assets $ 8,145,667,389 $ 3,881,817,840
Net Assets Consist of:Par value ($0.001 per share) $ 453,453 $ 231,436Additional paid-in-capital 6,826,469,500 3,541,650,345Distributions in excess of net investment income (21,190,901) (19,226,309)Accumulated net realized gain on investments and foreign
currency transactions 155,573,863 39,608,807Unrealized appreciation from investments and foreign
currency translation 1,184,361,474 319,553,561
Net Assets $ 8,145,667,389 $ 3,881,817,840
Net Asset Value Per Share:Class A
Net assets $ 1,528,298,932 $ 271,264,932Shares outstanding 85,094,083 16,188,505Net asset value per share $ 17.96 $ 16.76
Maximum offering price per share (with a maximum initialsales charge of 5.00%) $ 18.91 $ 17.64
Class CNet assets $ 938,251,737 $ 61,362,177Shares outstanding 53,073,629 3,726,534Net asset value per share $ 17.68 $ 16.47
Class INet assets $ 5,679,116,720 $ 3,549,190,731Shares outstanding 315,285,727 211,521,094Net asset value per share $ 18.01 $ 16.78
See Notes to Financial Statements.

Statement of Assets and Liabilities IVA Funds
32
Statements of Operations (unaudited) IVA Funds
For the Six Months Ended March 31, 2017
IVA IVAWorldwide International
Fund FundInvestment Income:
Interest $ 20,501,318 $ 9,189,430Dividends:
Non-affiliated securities 31,119,019 15,196,405Affiliated securities 871,879 844,819
Other income — 40,446Less: Foreign taxes withheld (2,223,563) (1,565,424)
Total income 50,268,653 23,705,676
Expenses:Investment advisory fees 36,183,871 17,247,798Distribution and service fees:
Class A 1,926,961 338,196Class C 4,887,331 316,116
Trustee fees 145,679 67,197Other expenses 3,966,628 1,797,799
Total expenses 47,110,470 19,767,106
Net investment income 3,158,183 3,938,570
Net Realized and Change in Unrealized Gain (Loss)on Investments and Foreign Currency:
Net realized gain (loss) on:Investments:
Non-affiliated securities 168,454,601 20,494,587Affiliated securities (15,928,971) (241,529)Commodities (4,993,916) (2,563,272)
Foreign currency transactions 23,701,352 24,980,022Net realized gain 171,233,066 42,669,808
Net change in unrealized appreciation(depreciation) from:
Investments (net of change in foreign capital gains tax of $0 and ($157,344), respectively) 238,112,902 111,481,115
Foreign currency translation 2,932,278 948,594
Net change in unrealized appreciation (depreciation) 241,045,180 112,429,709
Net realized and change in unrealized gain oninvestments and foreign currency 412,278,246 155,099,517
Increase in net assets resulting from operations $ 415,436,429 $ 159,038,087
See Notes to Financial Statements.
Statement of Assets and Liabilities IVA Global SICAV
33
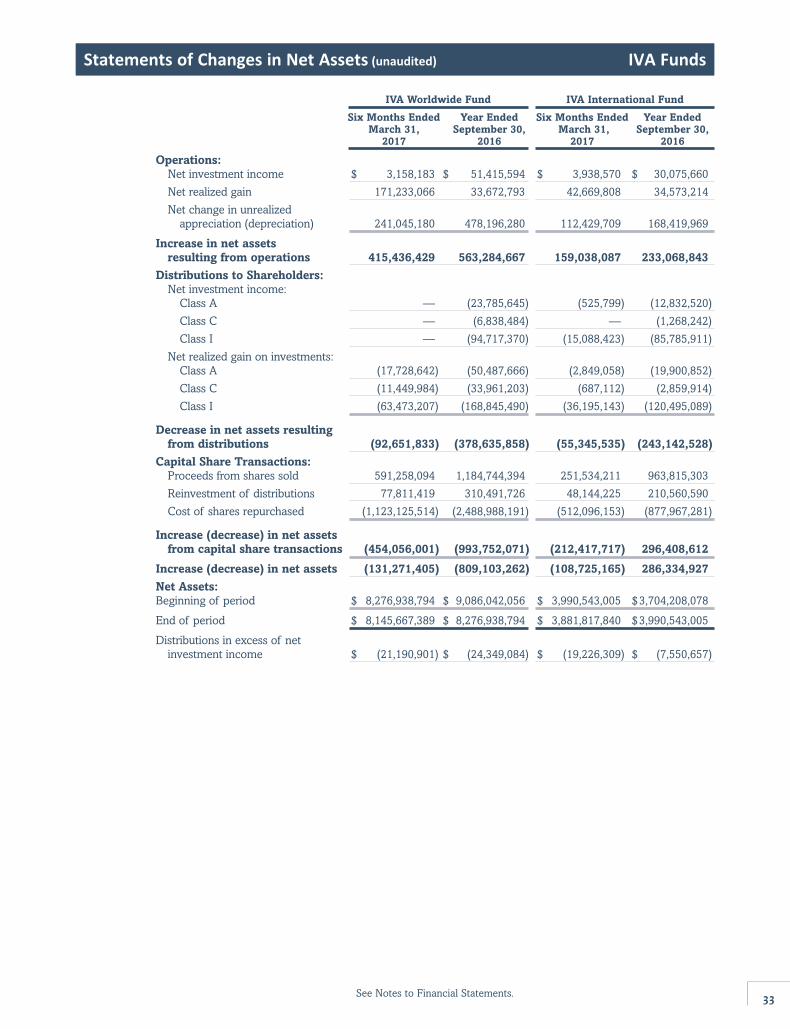
Statements of Changes in Net Assets (unaudited) IVA Funds
See Notes to Financial Statements.
IVA Worldwide Fund IVA International Fund
Six Months Ended Year Ended Six Months Ended Year Ended March 31, September 30, March 31, September 30,
2017 2016 2017 2016
Operations:Net investment income $ 3,158,183 $ 51,415,594 $ 3,938,570 $ 30,075,660
Net realized gain 171,233,066 33,672,793 42,669,808 34,573,214
Net change in unrealizedappreciation (depreciation) 241,045,180 478,196,280 112,429,709 168,419,969
Increase in net assetsresulting from operations 415,436,429 563,284,667 159,038,087 233,068,843
Distributions to Shareholders:Net investment income:
Class A — (23,785,645) (525,799) (12,832,520)
Class C — (6,838,484) — (1,268,242)
Class I — (94,717,370) (15,088,423) (85,785,911)
Net realized gain on investments:Class A (17,728,642) (50,487,666) (2,849,058) (19,900,852)
Class C (11,449,984) (33,961,203) (687,112) (2,859,914)
Class I (63,473,207) (168,845,490) (36,195,143) (120,495,089)
Decrease in net assets resultingfrom distributions (92,651,833) (378,635,858) (55,345,535) (243,142,528)
Capital Share Transactions:Proceeds from shares sold 591,258,094 1,184,744,394 251,534,211 963,815,303
Reinvestment of distributions 77,811,419 310,491,726 48,144,225 210,560,590
Cost of shares repurchased (1,123,125,514) (2,488,988,191) (512,096,153) (877,967,281)
Increase (decrease) in net assetsfrom capital share transactions (454,056,001) (993,752,071) (212,417,717) 296,408,612
Increase (decrease) in net assets (131,271,405) (809,103,262) (108,725,165) 286,334,927
Net Assets:Beginning of period $ 8,276,938,794 $ 9,086,042,056 $ 3,990,543,005 $3,704,208,078
End of period $ 8,145,667,389 $ 8,276,938,794 $ 3,881,817,840 $3,990,543,005
Distributions in excess of netinvestment income $ (21,190,901) $ (24,349,084) $ (19,226,309) $ (7,550,657)

Statement of Assets and Liabilities IVA Funds
34
Financial Highlights (unaudited) IVA Funds
IVA Worldwide Fund — Class A
For a share of each class of beneficial interest outstanding:
Six Months Ended Year Ended September 30, March 31, 2017 2016 2015 2014 2013 2012
Net asset value,beginning of period $ 17.26 $ 16.87 $ 18.54 $ 17.91 $ 16.18 $ 15.71
Increase (decrease) from investment operations:(a)
Net investment income (loss)(b) (0.00)(c) 0.09 0.02 0.03 0.12 0.18
Net realized and unrealized gain (loss) 0.90 1.01 (0.77) 1.35 2.08 1.26
Increase (decrease) frominvestment operations 0.90 1.10 (0.75) 1.38 2.20 1.44
Decrease from distributions:Net investment income — (0.23) (0.21) (0.20) (0.30) (0.12)Net realized gain on
investments (0.20) (0.48) (0.71) (0.55) (0.17) (0.85)
Decrease from distributions (0.20) (0.71) (0.92) (0.75) (0.47) (0.97)
Net asset value, endof period $ 17.96 $ 17.26 $ 16.87 $ 18.54 $ 17.91 $ 16.18
Total return(d) 5.26% 6.75% (4.21)% 8.00% 14.02% 9.62%Ratios to average net assets:
Operating expenses 1.25%(e) 1.25% 1.25% 1.26% 1.27% 1.28%Net investment income (loss) (0.01)%(e) 0.52% 0.09% 0.14% 0.72% 1.16%
Supplemental data:Portfolio turnover rate 9.8% 29.7% 30.3% 22.5% 26.3% 27.9%Net assets, end of
period (000’s) $1,528,299 $1,587,209 $1,815,439 $2,083,683 $2,378,045 $2,408,396
(a) The amounts shown for a share outstanding may not correlate with the Statements of Operations for the period due to thetiming of sales and repurchases of fund shares in relation to income earned and/or gains (losses) both realized andunrealized during the period.
(b) Calculated using average daily shares outstanding.(c) Amount represents less than ($0.005) per share.(d) Total return assumes reinvestment of all distributions and does not reflect an initial sales charge. Total returns for periods
of less than one year are not annualized.(e) Annualized.
See Notes to Financial Statements.

Statement of Assets and Liabilities IVA Global SICAV
35
Financial Highlights (unaudited) IVA Funds
IVA Worldwide Fund — Class C
For a share of each class of beneficial interest outstanding:
Six Months Ended Year Ended September 30,March 31, 2017 2016 2015 2014 2013 2012
Net asset value,beginning of period $ 17.05 $ 16.67 $ 18.33 $ 17.71 $ 16.01 $ 15.54
Increase (decrease) frominvestment operations:(a)
Net investment income(loss)(b) (0.07) (0.04) (0.12) (0.11) (0.01) 0.06
Net realized and unrealizedgain (loss) 0.90 1.00 (0.76) 1.35 2.07 1.26
Increase (decrease) frominvestment operations 0.83 0.96 (0.88) 1.24 2.06 1.32
Decrease from distributions:Net investment income — (0.10) (0.07) (0.07) (0.19) —Net realized gain on
investments (0.20) (0.48) (0.71) (0.55) (0.17) (0.85)
Decrease from distributions (0.20) (0.58) (0.78) (0.62) (0.36) (0.85)
Net asset value, endof period $ 17.68 $ 17.05 $ 16.67 $ 18.33 $ 17.71 $ 16.01
Total return(c) 4.91% 5.93% (4.96)% 7.23% 13.13% 8.87%Ratios to average net assets:
Operating expenses 2.00%(d) 2.00% 2.00% 2.01% 2.02% 2.03%Net investment income (loss) (0.76)%(d) (0.23)% (0.67)% (0.61)% (0.03)% 0.41%
Supplemental data:Portfolio turnover rate 9.8% 29.7% 30.3% 22.5% 26.3% 27.9%Net assets, end of
period (000’s) $ 938,252 $1,037,758 $1,201,687 $1,431,328 $1,380,608 $1,469,720
(a) The amounts shown for a share outstanding may not correlate with the Statements of Operations for the period due to thetiming of sales and repurchases of fund shares in relation to income earned and/or gains (losses) both realized and unrealizedduring the period.
(b) Calculated using average daily shares outstanding.(c) Total return assumes reinvestment of all distributions and does not reflect a contingent deferred sales charge. Total returns for
periods of less than one year are not annualized.(d) Annualized.
See Notes to Financial Statements.

Statement of Assets and Liabilities IVA Funds
36
Financial Highlights (unaudited) IVA Funds
IVA Worldwide Fund — Class I
For a share of each class of beneficial interest outstanding:
Six Months Ended Year Ended September 30,March 31, 2017 2016 2015 2014 2013 2012
Net asset value,beginning of period $ 17.28 $ 16.90 $ 18.57 $ 17.94 $ 16.21 $ 15.73
Increase (decrease) frominvestment operations:(a)
Net investment income(b) 0.02 0.13 0.06 0.07 0.16 0.23Net realized and unrealized
gain (loss) 0.91 1.00 (0.77) 1.36 2.08 1.26
Increase (decrease) frominvestment operations 0.93 1.13 (0.71) 1.43 2.24 1.49
Decrease from distributions:Net investment income — (0.27) (0.25) (0.25) (0.34) (0.16)Net realized gain on
investments (0.20) (0.48) (0.71) (0.55) (0.17) (0.85)
Decrease from distributions (0.20) (0.75) (0.96) (0.80) (0.51) (1.01)
Net asset value, endof period $ 18.01 $ 17.28 $ 16.90 $ 18.57 $ 17.94 $ 16.21
Total return(c) 5.43% 6.96% (3.95)% 8.25% 14.28% 9.97%Ratios to average net assets:
Operating expenses 1.00%(d) 1.00% 1.00% 1.01% 1.02% 1.03%Net investment income 0.25%(d) 0.77% 0.34% 0.39% 0.97% 1.43%
Supplemental data:Portfolio turnover rate 9.8% 29.7% 30.3% 22.5% 26.3% 27.9%Net assets, end of
period (000’s) $5,679,117 $5,651,971 $6,068,916 $6,845,786 $5,443,865 $5,003,855
(a) The amounts shown for a share outstanding may not correlate with the Statements of Operations for the period due to the timingof sales and repurchases of fund shares in relation to income earned and/or gains (losses) both realized and unrealized duringthe period.
(b) Calculated using average daily shares outstanding.(c) Total return assumes reinvestment of all distributions. Total returns for periods of less than one year are not annualized.(d) Annualized.
See Notes to Financial Statements.

Statement of Assets and Liabilities IVA Global SICAV
37
Financial Highlights (unaudited) IVA Funds
IVA International Fund — Class A
For a share of each class of beneficial interest outstanding:
Six Months Ended Year Ended September 30,March 31, 2017 2016 2015 2014 2013 2012
Net asset value,beginning of period $ 16.28 $ 16.39 $ 17.84 $ 17.39 $ 15.95 $ 15.56
Increase (decrease) frominvestment operations:(a)
Net investmentincome (loss)(b) (0.00)(c) 0.07 0.12 0.08 0.16 0.23
Net realized and unrealizedgain (loss) 0.68 0.86 (0.55) 1.10 2.00 1.16
Increase (decrease) frominvestment operations 0.68 0.93 (0.43) 1.18 2.16 1.39
Decrease from distributions:Net investment income (0.03) (0.41) (0.47) (0.41) (0.44) (0.23)Net realized gain on
investments (0.17) (0.63) (0.55) (0.32) (0.28) (0.77)
Decrease from distributions (0.20) (1.04) (1.02) (0.73) (0.72) (1.00)
Net asset value, endof period $ 16.76 $ 16.28 $ 16.39 $ 17.84 $ 17.39 $ 15.95
Total return(d) 4.25% 5.93% (2.37)% 7.05% 14.09% 9.53%Ratios to average net assets:
Net operating expenses 1.25%(e) 1.24% 1.25% 1.26% 1.26% 1.27%Net investment income (loss) (0.01)%(e) 0.41% 0.70% 0.45% 0.97% 1.52%
Supplemental data:Portfolio turnover rate 14.7% 34.9% 27.6% 23.4% 40.1% 29.9%Net assets, end of
period (000’s) $271,265 $282,567 $466,336 $391,494 $377,043 $409,163
(a) The amounts shown for a share outstanding may not correlate with the Statements of Operations for the period due to thetiming of sales and repurchases of fund shares in relation to income earned and/or gains (losses) both realized and unrealizedduring the period.
(b) Calculated using average daily shares outstanding.(c) Amount represents less than ($0.005) per share.(d) Total return assumes reinvestment of all distributions and does not reflect an initial sales charge. Total returns for periods of
less than one year are not annualized.(e) Annualized.
See Notes to Financial Statements.

Statement of Assets and Liabilities IVA Funds
38
Financial Highlights (unaudited) IVA Funds
IVA International Fund — Class C
For a share of each class of beneficial interest outstanding:
Six Months Ended Year Ended September 30,March 31, 2017 2016 2015 2014 2013 2012
Net asset value,beginning of period $ 16.03 $ 16.14 $ 17.58 $ 17.14 $ 15.74 $ 15.35
Increase (decrease) frominvestment operations:(a)
Net investmentincome (loss)(b) (0.06) (0.03) (0.02) (0.06) 0.04 0.11
Net realized and unrealizedgain (loss) 0.67 0.83 (0.53) 1.11 1.96 1.15
Increase (decrease) frominvestment operations 0.61 0.80 (0.55) 1.05 2.00 1.26
Decrease from distributions:Net investment income — (0.28) (0.34) (0.29) (0.32) (0.10)Net realized gain on
investments (0.17) (0.63) (0.55) (0.32) (0.28) (0.77)
Decrease from distributions (0.17) (0.91) (0.89) (0.61) (0.60) (0.87)
Net asset value, endof period $ 16.47 $ 16.03 $ 16.14 $ 17.58 $ 17.14 $ 15.74
Total return(c) 3.86% 5.17% (3.14)% 6.29% 13.18% 8.76%Ratios to average net assets:
Net operating expenses 2.00%(d) 1.99% 2.00% 2.01% 2.01% 2.02%Net investment income (loss) (0.78)%(d) (0.19)% (0.11)% (0.32)% 0.26% 0.74%
Supplemental data:Portfolio turnover rate 14.7% 34.9% 27.6% 23.4% 40.1% 29.9%Net assets, end of
period (000’s) $61,362 $68,878 $73,818 $82,359 $81,804 $77,882
(a) The amounts shown for a share outstanding may not correlate with the Statements of Operations for the period due to the timingof sales and repurchases of fund shares in relation to income earned and/or gains (losses) both realized and unrealized duringthe period.
(b) Calculated using average daily shares outstanding.(c) Total return assumes reinvestment of all distributions and does not reflect a contingent deferred sales charge. Total returns for
periods of less than one year are not annualized.(d) Annualized.
See Notes to Financial Statements.

Statement of Assets and Liabilities IVA Global SICAV
39
Financial Highlights (unaudited) IVA Funds
IVA International Fund — Class I
For a share of each class of beneficial interest outstanding:
Six Months Ended Year Ended September 30,March 31, 2017 2016 2015 2014 2013 2012
Net asset value,beginning of period $ 16.32 $ 16.43 $ 17.89 $ 17.43 $ 15.99 $ 15.60
Increase (decrease) frominvestment operations:(a)
Net investment income(b) 0.02 0.13 0.16 0.12 0.21 0.27Net realized and unrealized
gain (loss) 0.68 0.84 (0.55) 1.12 1.99 1.16
Increase (decrease) frominvestment operations 0.70 0.97 (0.39) 1.24 2.20 1.43
Decrease from distributions:Net investment income (0.07) (0.45) (0.52) (0.46) (0.48) (0.27)Net realized gain on
investments (0.17) (0.63) (0.55) (0.32) (0.28) (0.77)
Decrease from distributions (0.24) (1.08) (1.07) (0.78) (0.76) (1.04)
Net asset value, endof period $ 16.78 $ 16.32 $ 16.43 $ 17.89 $ 17.43 $ 15.99
Total return(c) 4.38% 6.20% (2.16)% 7.36% 14.34% 9.81%Ratios to average net assets:
Net operating expenses 1.00%(d) 0.99% 1.00% 1.01% 1.01% 1.02%Net investment income 0.24%(d) 0.85% 0.92% 0.69% 1.31% 1.79%
Supplemental data:Portfolio turnover rate 14.7% 34.9% 27.6% 23.4% 40.1% 29.9%Net assets, end of
period (000’s) $3,549,191 $3,639,098 $3,164,053 $3,136,324 $2,847,380 $2,280,940
(a) The amounts shown for a share outstanding may not correlate with the Statements of Operations for the period due to the timingof sales and repurchases of fund shares in relation to income earned and/or gains (losses) both realized and unrealized duringthe period.
(b) Calculated using average daily shares outstanding.(c) Total return assumes reinvestment of all distributions. Total returns for periods of less than one year are not annualized.(d) Annualized.
See Notes to Financial Statements.

Notes to Financial Statements IVA Funds
40
Notes to Financial Statements (unaudited) IVA Funds
Note 1 – Organization and Significant Accounting Policies
IVA Fiduciary Trust (the “Trust”) consists of the IVA Worldwide Fund (the “Worldwide Fund”) and IVA International Fund (the“International Fund”) (each, a “Fund” and, together, the “Funds”). The Worldwide Fund and the International Fund are each adiversified investment portfolio of the Trust, an open-end series management investment company registered under theInvestment Company Act of 1940, as amended (the “1940 Act”), and organized as a Massachusetts business trust. The Fundscommenced investment operations on October 1, 2008. The Worldwide Fund seeks long-term growth of capital by investing in arange of securities and asset classes from markets around the world, including U.S. markets. The International Fund seeks long-term growth of capital by investing in a range of securities and asset classes from markets around the world.
The following are significant accounting policies followed by the Funds in the preparation of their financial statements in conformitywith accounting principles generally accepted in the United States of America (“U.S. GAAP”). In accordance with U.S. GAAP, eachFund has been defined as an investment company and as such complies with investment company and reporting guidance of theFinancial Accounting Standards Board. As of result, there are no changes to measurement or disclosure required in the Funds’financial statements.
Use of Estimates. Preparation of these financial statements in conformity with U.S. GAAP requires the Funds’ management tomake estimates and assumptions that may affect the amounts reported in the financial statements and related notes. Actual resultscould differ from these estimates.
Valuation of the Funds. The net asset value per share (“NAV”) of a Fund’s shares of a particular class is calculated each daythat the New York Stock Exchange (“NYSE”) is open.
Listed equity securities are generally valued at the last sale price on the exchange that is the primary market for such securities.Equity securities listed on the NASDAQ Stock Exchange (“NASDAQ”) are generally valued using the NASDAQ Official ClosingPrice (“NOCP”). If no sales or NOCPs are reported during the day, equity securities are generally valued at the mean of the lastavailable bid and asked quotations on the exchange or market on which the security is primarily traded, or using other marketinformation obtained from a quotation reporting system, established market makers, or pricing services. If there is only a bid oronly an asked price on such date, valuation will be at such bid or asked price for long and short positions, respectively. Over-the-counter (“OTC”) equity securities not listed on NASDAQ are generally valued at the mean of the last available bid and askedquotations on the market on which the security is primarily traded, or using other market information obtained from a quotationreporting system, established market makers or pricing services. If there is only a bid or only an asked price on such date, valuationwill be at such bid or asked price for long or short positions, respectively.
Precious metals, including gold bullion, are valued at the spot price at the time trading on the NYSE closes (normally 4:00 p.m.E.S.T.).
Debt securities, other than commercial paper, for which market quotations are readily available are generally valued at theevaluated mean primarily based on the last bid and asked prices received from an independent pricing service. When no askedprice is available, debt securities are valued at the evaluated bid price alone. Commercial paper is generally valued at the evaluatedbid price provided by an independent pricing service. An evaluated price may include a variety of factors including the issue’scoupon rate, maturity, credit rating, yield, trade data, quoted prices of similar debt securities, and any other relevant market orsecurity specific information.
Forward foreign currency contracts are valued at the current cost of offsetting such contracts.
The value of any investment that is listed or traded on more than one exchange or market is based on the exchange or marketdetermined by International Value Advisers, LLC (the “Adviser”) to be the primary trading venue for that investment. A quotationfrom the exchange or market deemed by the Adviser to be the secondary trading venue for a particular investment may be reliedupon in instances where a quotation is not available on the primary exchange or market.
The Board of Trustees of the Trust (the “Board”) has established a Pricing and Fair Valuation Committee (the “Committee”)comprised of officers of the Adviser to which it has delegated the responsibility for overseeing the implementation of the Funds’valuation procedures and fair value determinations made on behalf of the Board. The Committee may determine that marketquotations are not readily available due to events relating to a single issuer (e.g., corporate actions or announcements) or eventsrelating to multiple issuers (e.g., governmental actions or natural disasters). The Committee may determine that there has been asignificant decrease in the volume and level of activity for an asset or liability whereby transactions or quoted prices may not bedeterminative of fair value. The Committee may determine the fair value of investments based on information provided by pricing
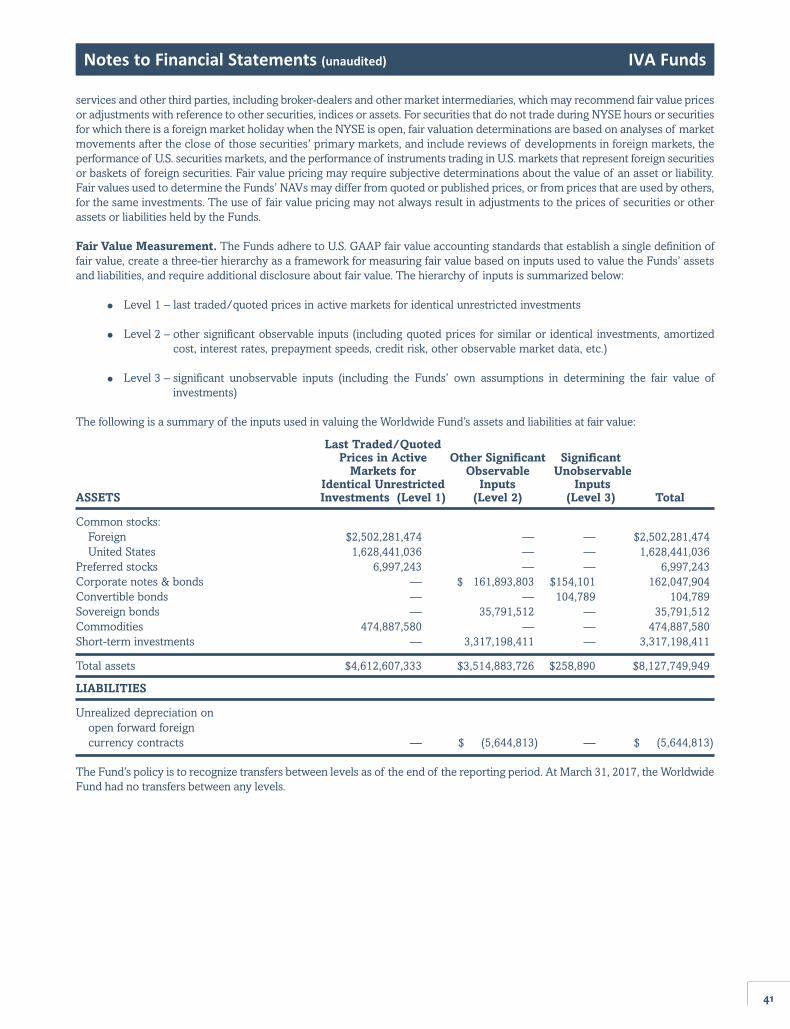
Notes to Financial Statements IVA Funds
41
Notes to Financial Statements (unaudited) IVA Funds
services and other third parties, including broker-dealers and other market intermediaries, which may recommend fair value pricesor adjustments with reference to other securities, indices or assets. For securities that do not trade during NYSE hours or securitiesfor which there is a foreign market holiday when the NYSE is open, fair valuation determinations are based on analyses of marketmovements after the close of those securities’ primary markets, and include reviews of developments in foreign markets, theperformance of U.S. securities markets, and the performance of instruments trading in U.S. markets that represent foreign securitiesor baskets of foreign securities. Fair value pricing may require subjective determinations about the value of an asset or liability.Fair values used to determine the Funds’ NAVs may differ from quoted or published prices, or from prices that are used by others,for the same investments. The use of fair value pricing may not always result in adjustments to the prices of securities or otherassets or liabilities held by the Funds.
Fair Value Measurement. The Funds adhere to U.S. GAAP fair value accounting standards that establish a single definition offair value, create a three-tier hierarchy as a framework for measuring fair value based on inputs used to value the Funds’ assetsand liabilities, and require additional disclosure about fair value. The hierarchy of inputs is summarized below:
• Level 1 – last traded/quoted prices in active markets for identical unrestricted investments
• Level 2 – other significant observable inputs (including quoted prices for similar or identical investments, amortizedcost, interest rates, prepayment speeds, credit risk, other observable market data, etc.)
• Level 3 – significant unobservable inputs (including the Funds’ own assumptions in determining the fair value ofinvestments)
The following is a summary of the inputs used in valuing the Worldwide Fund’s assets and liabilities at fair value:
Last Traded/Quoted Prices in Active Other Significant Significant
Markets for Observable UnobservableIdentical Unrestricted Inputs Inputs
ASSETS Investments (Level 1) (Level 2) (Level 3) Total
Common stocks:Foreign $2,502,281,474 — — $2,502,281,474United States 1,628,441,036 — — 1,628,441,036
Preferred stocks 6,997,243 — — 6,997,243Corporate notes & bonds — $ 161,893,803 $154,101 162,047,904Convertible bonds — — 104,789 104,789Sovereign bonds — 35,791,512 — 35,791,512Commodities 474,887,580 — — 474,887,580Short-term investments — 3,317,198,411 — 3,317,198,411
Total assets $4,612,607,333 $3,514,883,726 $258,890 $8,127,749,949
LIABILITIES
Unrealized depreciation on open forward foreign currency contracts — $ (5,644,813) — $ (5,644,813)
The Fund’s policy is to recognize transfers between levels as of the end of the reporting period. At March 31, 2017, the WorldwideFund had no transfers between any levels.

Notes to Financial Statements IVA Funds
42
Notes to Financial Statements (unaudited) IVA Funds
The following is a summary of the inputs used in valuing the International Fund’s assets and liabilities at fair value:
Last Traded/Quoted Prices in Active Other Significant Significant
Markets for Observable UnobservableIdentical Unrestricted Inputs Inputs
ASSETS Investments (Level 1) (Level 2) (Level 3) Total
Common stocks:Foreign $2,310,483,471 $ 12,778,683 — $2,323,262,154United States 56,671,543 — — 56,671,543
Corporate notes & bonds — 82,201,122 $74,103 82,275,225Convertible bonds — — 50,390 50,390Sovereign and supranational bonds — 43,907,426 — 43,907,426Commodities 274,580,005 — — 274,580,005Short-term investments — 1,092,874,686 — 1,092,874,686
Total assets $2,641,735,019 $1,231,761,917 $124,493 $3,873,621,429
LIABILITIES
Unrealized depreciation on open forward foreigncurrency contracts — $ (6,204,692) — $ (6,204,692)
The Fund’s policy is to recognize transfers between levels as of the end of the reporting period. At March 31, 2017, theInternational Fund had transfers of $21,708,580 from Level 2 to Level 1 as a result of the Fund using last traded prices. AtMarch 31, 2017, the International Fund had transfers of $12,778,683 from Level 1 to Level 2 as result of the use of quoted pricesin absence of last traded prices.
Foreign Currency Translation. Portfolio securities and other assets and liabilities initially valued in currencies other than theU.S. dollar are translated to U.S. dollars using exchange rates obtained from pricing services.
The Funds do not isolate that portion of the results of operations resulting from changes in foreign exchange rates on investmentsfrom the fluctuations arising from changes in market prices of investments held. Such fluctuations are included with the net realizedand change in unrealized gain or loss on investments.
Net realized gains or losses on foreign currency transactions arise from sales of foreign currencies, including gains and losses onforward foreign currency contracts, currency gains or losses realized between the trade and settlement dates on securitiestransactions, and the difference between the amounts of dividends, interest, and foreign withholding taxes recorded on each Fund’sbooks and the U.S. dollar equivalent of the amounts actually received or paid. Net change in unrealized gains and losses fromforeign currency translation arise from changes in the fair values of assets and liabilities, other than investments, at the date ofvaluation, resulting from changes in exchange rates.
Portfolio Transactions and Investment Income. Portfolio transactions are recorded on a trade date basis. Interest income,adjusted for amortization of premium and accretion of discount, is recorded on the accrual basis. Dividend income is recordedon the ex-dividend date. Realized gains and losses on investment transactions are determined by the specific identification method.
Class Allocation. Investment income, realized and unrealized gains and losses, and Fund expenses are allocated daily to thevarious classes of each Fund pro rata on the basis of relative net assets. Each class bears certain expenses unique to that class.Differences in class-level expenses may result in payment of different per share dividends by each share class.
Distributions to Shareholders. Distributions are recorded on the ex-dividend date and are determined in accordance withfederal income tax regulations, which may differ from U.S. GAAP. Accordingly, the nature of distributions and composition of netassets for tax purposes differ from those reflected in the accompanying financial statements.

Notes to Financial Statements IVA Funds
43
Notes to Financial Statements (unaudited) IVA Funds
Federal and Other Taxes. It is each Fund’s policy to comply with the federal income and excise tax requirements of the InternalRevenue Code of 1986, as amended, applicable to regulated investment companies. Accordingly, each Fund intends to distributesubstantially all of its taxable income and net realized gains, if any, to shareholders each year. Therefore, no federal income taxprovision is required in the Funds’ financial statements.
The Funds follow the Financial Accounting Standards Board accounting standard for accounting for uncertainty in income taxes.This standard defines the threshold for recognizing tax positions in the financial statements as “more-likely-than-not” to besustained by the applicable taxing authority and requires measurement of a tax position meeting the “more-likely-than-not”criterion, based on the largest benefit that is more than fifty percent realized. Management has analyzed each Fund’s tax positionstaken on federal and state tax returns for all open tax years (generally the current and the prior three tax years) and determinedthat no provision for income tax would be required in the Funds’ financial statements. Tax-related interest or penalties, if applicable,are to be disclosed in the Statements of Operations. For the six months ended March 31, 2017, the Funds did not incur any tax-related interest or penalties.
Under the applicable foreign tax laws, a withholding tax may be imposed on interest, dividends and capital gains at various rates.Dividend and interest withholding taxes and capital gains taxes incurred, for the six months ended March 31, 2017, can be foundin the Statements of Operations.
Forward Foreign Currency Contracts. Each Fund engages in buying and selling forward foreign currency contracts to seek tomanage the exposure of investments denominated in non-U.S. currencies against fluctuations in relative value. A forward foreigncurrency contract involves a privately negotiated obligation to purchase or sell (with delivery generally required) a specific currencyat a future date, at a price set at the time of the contract.
Transactions with Affiliates. The Funds are permitted to purchase and sell securities (“cross-trade”) from and to other entitiesmanaged by the Adviser pursuant to procedures approved by the Board in compliance with Rule 17a-7 under the 1940 Act. Incompliance with these provisions of Rule 17a-7, each cross-trade is executed at the current market price with no remunerationpaid in connection with the transaction.
Foreign Investment Risk. Each Fund invests in foreign investments. Foreign investments can involve additional risks relatingto political, economic or regulatory conditions in foreign countries. These risks include fluctuations in foreign currencies;withholding or other taxes; trading, settlement, custodial, and other operational risks; and the less stringent investor protectionand disclosure standards of some foreign markets. Since foreign exchanges may be open on days when a Fund does not price itsshares, the value of the investments in such Fund’s portfolio may change on days when shareholders will not be able to purchaseor sell the Fund’s shares.
Custodian Risk. Cash is held at the Funds’ custodian, State Street Bank and Trust Company (the “Custodian”). The Funds aresubject to credit risk on any cash balance that exceeds the amount insured by the Federal Deposit Insurance Corporation to theextent that the Custodian may be unable to return cash held.
Indemnification. Under the Trust’s organizational documents, its officers and trustees are indemnified against certain liabilityarising out of the performance of their duties to the Funds. The Funds have a variety of indemnification obligations under contractswith their service providers. The Funds’ maximum exposure under these arrangements is unknown. However, the Funds have nothad prior claims or losses pursuant to these contracts and expect the risk of loss to be remote.
Note 2 – Investment Advisory Agreement and Distribution Agreement
International Value Advisers, LLC is the investment adviser of the Funds. The Adviser’s primary business is to provide investmentmanagement services to a variety of investment vehicles, including the Funds. The Adviser is responsible for all business activitiesand oversight of the investment decisions made for the Funds.
In return for providing investment advisory services to the Funds, each Fund pays the Adviser an investment advisory fee,calculated daily and paid monthly, at an annual rate of 0.90% of each Fund’s average daily net assets. Investment advisory feespaid for the six months ended March 31, 2017 are disclosed in the Statements of Operations.
The Funds have adopted Distribution and Services Plans (“12b-1 Plans”), pursuant to Rule 12b-1 under the 1940 Act. Under those12b-1 Plans, the Funds pay a distribution fee with respect to Class A and C shares calculated at the annual rate of 0.25% and 0.75%,respectively, of the average daily net assets of each respective class. The Funds also pay a service fee with respect to Class C

Notes to Financial Statements IVA Funds
44
Notes to Financial Statements (unaudited) IVA Funds
shares calculated at the annual rate of 0.25% of the average daily net assets. Class I shares do not participate in 12b-1 Plans. Feespaid under the 12b-1 Plans for the six months ended March 31, 2017 are disclosed in the Statements of Operations.
IVA Funds Distributors, LLC serves as the Funds’ sole and exclusive distributor.
There is a maximum initial sales charge of 5.00% for Class A shares. Class A shares may be subject to a contingent deferred salescharge (“CDSC”) of 0.75% if $1,000,000 or more of Class A shares were initially purchased, a “finder’s fee” was paid to the dealerof record, and the Class A shares were subsequently redeemed within 18 months.
Class C shares may be subject to a CDSC of 1.00% if shares are redeemed within the first 12 months after purchase.
Note 3 – Investments
For the six months ended March 31, 2017, the aggregate cost of purchases and proceeds from sales of investments (excludingshort-term investments) were as follows:
Worldwide InternationalFund Fund
Purchases $ 474,307,737 $ 414,969,400
Sales $1,164,038,878 $ 384,143,292
The cost basis of investments for federal income tax purposes is substantially similar to the cost basis under U.S. GAAP. Thefollowing information is as of March 31, 2017.
Worldwide InternationalFund Fund
Cost basis of investments $6,937,985,564 $3,547,914,418
Gross unrealized appreciation $1,379,007,684 $ 542,808,081
Gross unrealized depreciation $ (189,243,299) $ (217,101,070)
Net unrealized appreciation $1,189,764,385 $ 325,707,011
Note 4 – Derivative Instruments and Hedging Activities
The Funds enter into transactions involving derivative financial instruments in connection with their investing activities. Duringthe six months ended March 31, 2017, these instruments included forward foreign currency contracts. These instruments aresubject to various risks similar to non-derivative instruments including market, credit and liquidity risks.
The use of derivative instruments may involve risks different from, or potentially greater than, the risks associated with investingdirectly in investments. Specifically, derivative instruments expose a Fund to the risk that the counterparty to an OTC derivativescontract will be unable or unwilling to make timely settlement payments or otherwise to honor its obligations. OTC derivativestransactions typically can only be closed out with the other party to the transaction. If the counterparty defaults, a Fund will havecontractual remedies, but there is no assurance that the counterparty will meet its contractual obligations or that, in the event ofdefault, a Fund will succeed in enforcing them. During the six months ended March 31, 2017, the Funds had exposure to OTCderivatives in the form of forward foreign currency contracts.
Forward foreign currency contracts involve elements of market risk in excess of the amounts reflected in the Statements of Assetsand Liabilities. The Funds bear the risk of an unfavorable change in the foreign exchange rate underlying the forward foreigncurrency contract, movements in foreign investment security values and changes in interest rates. Credit risks may also arise uponentering into these contracts from the potential inability of counterparties to meet the terms of their contracts.
The following summary of derivative instruments and hedging activity for each Fund is grouped by risk-type and providesinformation about the fair value and location of derivatives within the Statements of Assets and Liabilities at March 31, 2017.

Notes to Financial Statements IVA Funds
45
Notes to Financial Statements (unaudited) IVA Funds
Worldwide FundStatements of Assets
Risk-Type Category and Liabilities Location Fair Value
Foreign exchange Unrealized depreciation on open forward foreign currency contracts $(5,644,813)
International FundStatements of Assets
Risk-Type Category and Liabilities Location Fair Value
Foreign exchange Unrealized depreciation on open forward foreign currency contracts $(6,204,692)
The following is a summary for each Fund grouped by risk-type that provides information about the effect of derivatives andhedging activities on the Funds’ Statements of Operations for the six months ended March 31, 2017.
Worldwide FundChange inUnrealized
Appreciation/Risk-Type Category Derivative Instrument Realized Gain (Depreciation)
Foreign exchange Forward foreign currency contracts $25,451,994 $2,562,046
International FundChange inUnrealized
Appreciation/Risk-Type Category Derivative Instrument Realized Gain (Depreciation)
Foreign exchange Forward foreign currency contracts $25,888,377 $535,569
During the six months ended March 31, 2017, the Worldwide Fund had average notional values of $447,578,496 on forwardforeign currency contracts to sell.
During the six months ended March 31, 2017, the International Fund had average notional values of $376,439,597 on forwardforeign currency contracts to sell.
The following tables present, by counterparty, gross amounts of derivatives eligible for offsetting, gross amounts offset in theStatements of Assets and Liabilities and related collateral received and/or pledged, if any, that the Funds have elected to offset undertheir legally enforceable ISDA Master Netting Agreement with such counterparty. An ISDA Master Netting Agreement is an agreementbetween the Fund and the counterparty that governs the terms of certain transactions and reduces the counterparty risk associatedwith relevant transactions by specifying offsetting mechanisms and collateral arrangements, if any. Offsetting mechanisms allow the Funds to pay or receive the net amount of all forward foreign currency contracts outstanding on a given settlement date. AtMarch 31, 2017, the Funds elected to offset forward foreign currency contracts on the Statements of Assets and Liabilities.
Worldwide FundGross Amount Net Exposure
Gross Amount of Offset in the Presented in theRecognized Statements of Collateral Statements of Assets
Counterparty Liabilities Assets and Liabilities Pledged and Liabilities
Forward foreign currency contractsState Street Bank & Trust Co. $(5,685,995) $41,182 $4,993,535 $(651,278)
International FundGross Amount Net Exposure
Gross Amount of Offset in the Presented in theRecognized Statements of Collateral Statements of Assets
Counterparty Liabilities Assets and Liabilities Pledged and Liabilities
Forward foreign currency contractsState Street Bank & Trust Co. $(6,228,212) $23,520 $4,993,535 $(1,211,157)

Notes to Financial Statements IVA Funds
46
Notes to Financial Statements (unaudited) IVA Funds
Note 5 – Shares of Beneficial Interest
At March 31, 2017, the Trust had an unlimited number of shares of beneficial interest authorized with a par value of $0.001 pershare. The Funds have the ability to issue multiple classes of shares. Each share of a class represents an identical interest and hasthe same rights, except that each class bears certain direct expenses specifically related to the distribution of its shares.
Transactions in shares of each class of the Worldwide Fund were as follows:
Worldwide FundSix Months Ended Year Ended
March 31, 2017 September 30, 2016
Shares Amount Shares Amount
Class AShares sold 4,170,089 $ 72,446,101 8,653,272 $ 143,643,764Shares reinvested 906,939 15,626,560 3,963,837 65,086,198Shares repurchased (11,961,536) (208,004,085) (28,240,021) (472,721,421)
Net Decrease (6,884,508) $ (119,931,424) (15,622,912) $ (263,991,459)
Class CShares sold 1,053,568 $ 18,065,444 3,256,132 $ 53,547,661Shares reinvested 504,096 8,564,597 1,842,160 30,082,467Shares repurchased (9,342,525) (160,328,526) (16,314,163) (269,246,845)
Net Decrease (7,784,861) $ (133,698,485) (11,215,871) $ (185,616,717)
Class IShares sold 28,656,335 $ 500,746,549 59,390,839 $ 987,552,969Shares reinvested 3,104,821 53,620,262 13,113,463 215,323,061Shares repurchased (43,466,635) (754,792,903) (104,607,457) (1,747,019,925)
Net Decrease (11,705,479) $ (200,426,092) (32,103,155) $ (544,143,895)
Transactions in shares of each class of the International Fund were as follows:
International FundSix Months Ended Year Ended
March 31, 2017 September 30, 2016
Shares Amount Shares Amount
Class AShares sold 764,986 $ 12,344,102 6,932,316 $ 113,732,117Shares reinvested 184,673 2,923,376 1,906,896 29,690,378Shares repurchased (2,118,353) (34,153,095) (19,940,351) (310,588,962)
Net Decrease (1,168,694) $ (18,885,617) (11,101,139) $ (167,166,467)
Class CShares sold 104,247 $ 1,655,350 478,931 $ 7,447,454Shares reinvested 35,327 550,744 218,714 3,370,382Shares repurchased (710,239) (11,252,445) (974,718) (15,223,470)
Net Decrease (570,665) $ (9,046,351) (277,073) $ (4,405,634)
Class IShares sold 14,719,084 $ 237,534,759 53,759,331 $ 842,635,732Shares reinvested 2,820,082 44,670,105 11,400,118 177,499,830Shares repurchased (28,984,505) (466,690,613) (34,817,884) (552,154,849)
Net Increase (Decrease) (11,445,339) $ (184,485,749) 30,341,565 $ 467,980,713

Redemption Fees. The Funds impose a redemption fee of 2% of the total redemption amount on the Funds’ shares redeemedwithin 30 days of buying them or acquiring them by exchange. The redemption fee is credited to the applicable Fund. The purposeof the redemption fee is to deter excessive, short-term trading and other abusive trading practices, and to help offset the costsassociated with the sale of portfolio securities to satisfy redemption and exchange requests made by “market timers” and othershort-term shareholders, thereby insulating longer-term shareholders from such costs.
Notes to Financial Statements (unaudited) IVA Funds
47

48
Proxy Voting. Information on how the Funds voted proxies relating to portfolio securities during the prior 12-month period endedJune 30th of each year and a description of the policies and procedures that the Funds use to determine how to vote proxiesrelating to portfolio transactions are available (1) without charge, upon request, by calling 866-941-4482, and (2) on the Securitiesand Exchange Commission (“SEC”) website at www.sec.gov by accessing the Funds’ Form N-PX and Statement of AdditionalInformation in the Funds’ registration statement on Form N-1A.
Schedules of Portfolio Holdings. The Funds file their complete schedules of portfolio holdings with the SEC for the first andthird quarters of each fiscal year on Form N-Q. The Funds’ Form N-Q is available on the SEC’s website at www.sec.gov. The Funds’Form N-Q may be reviewed and copied at the SEC’s Public Reference Room in Washington, D.C., and information on the operationof the Public Reference Room may be obtained by calling 800-SEC-0330. To obtain the Funds’ Form N-Q, shareholders can call866-941-4482.
Trustees and Officers of the Funds. Additional information about Trustees and officers of the Funds is included in theStatement of Additional Information which is available, without charge, upon request, by calling 866-941-4482.
Additional Information (unaudited) IVA Funds

49
As a shareholder of the Funds, you may incur two types of costs: (1) transaction costs, including initial sales charges and/orredemption fees; and (2) ongoing costs, including investment advisory fees, distribution and/or service (12b-1) fees and otheroperating fund expenses. The information on this page is intended to help you understand your ongoing costs of investing in theFunds and to compare these costs with the ongoing costs of investing in other mutual funds.
This example is based on an investment of $1,000 invested on October 1, 2016 and held for the six months ended March 31, 2017.
ACTUAL EXPENSES
The table below titled “Based on Actual Total Return” provides information about actual account values and actual expenses. Youmay use the information provided in this table, together with the amount you invested, to estimate the expenses that you paid overthe period. To estimate the expenses you paid on your account, divide your ending account value by $1,000 (for example, an $8,600ending account value divided by $1,000 = 8.6), then multiply the result by the number under the heading titled “Expenses PaidDuring the Period.”
BASED ON ACTUAL TOTAL RETURN FOR THE SIX MONTHS ENDED MARCH 31, 2017(a)
Actual Annualized Expenses Total Beginning Ending Expense Paid During
Return Account Value Account Value Ratio the Period(b)
Worldwide FundClass A 5.26% $1,000.00 $1,052.60 1.25% $ 6.40Class C 4.91% 1,000.00 1,049.10 2.00% 10.22Class I 5.43% 1,000.00 1,054.30 1.00% 5.12International FundClass A 4.25% $1,000.00 $1,042.50 1.25% $ 6.37Class C 3.86% 1,000.00 1,038.60 2.00% 10.17Class I 4.38% 1,000.00 1,043.80 1.00% 5.10
HYPOTHETICAL EXAMPLE FOR COMPARISON PURPOSES
The table below titled “Based on Hypothetical Total Return” provides information about hypothetical account values andhypothetical expenses based on the actual expense ratio and an assumed rate of return of 5% per year before expenses, whichare not the Funds’ actual returns. The hypothetical account values and expenses may not be used to estimate the actual endingaccount values and expenses you paid for the period. You may use the information provided in this table to compare the ongoingcosts of investing in the Funds and other funds. To do so, compare the 5% hypothetical example relating to the Funds with the 5%hypothetical examples that appear in the shareholder reports of other funds.
Please note that expenses shown in the table below are meant to highlight your ongoing costs and do not reflect any transactionalcosts, such as initial sales charges (loads) or redemption fees, if any. Therefore, the table is useful in comparing ongoing costs onlyand will not help you determine your relative total costs of owning different funds. In addition, if these transactional costs wereincluded, your costs would have been higher.
BASED ON HYPOTHETICAL TOTAL RETURN FOR THE SIX MONTHS ENDED MARCH 31, 2017Hypothetical Annualized ExpensesAnnualized Beginning Ending Expense Paid During
Total Return Account Value Account Value Ratio the Period(b)
Worldwide FundClass A 5.00% $1,000.00 $1,018.70 1.25% $ 6.29Class C 5.00% 1,000.00 1,014.96 2.00% 10.05Class I 5.00% 1,000.00 1,019.95 1.00% 5.04International FundClass A 5.00% $1,000.00 $1,018.70 1.25% $ 6.29Class C 5.00% 1,000.00 1,014.96 2.00% 10.05Class I 5.00% 1,000.00 1,019.95 1.00% 5.04
(a) Assumes reinvestment of all dividends and capital gain distributions, if any.(b) Expenses are equal to the Funds’ respective annualized expense ratio multiplied by the average account value over the period,
multiplied by 182 days in the most recent fiscal half-year, then divided by 365.
Fund Expenses (unaudited) IVA Funds
IVA Funds
www.ivafunds.com
Investment AdviserInternational Value Advisers, LLC717 Fifth AvenueNew York, NY 10022
DistributorIVA Funds Distributors, LLC3 Canal Plaza, Suite 100Portland, ME 04101
CustodianState Street Bank and Trust CompanyOne Heritage DriveQuincy, MA 02171-2105
Transfer AgentBoston Financial Data Services, Inc.2000 Crown Colony DriveQuincy, MA 02169
CounselK&L Gates LLPState Street Financial CenterOne Lincoln StreetBoston, MA 02111-2950
Independent Registered Public Accounting FirmErnst & Young LLP200 Clarendon StreetBoston MA, 02116-5072
This report is submitted for the general information of the Funds’ shareholders. The report is not authorized for distribution toprospective investors in the Funds unless it is accompanied or preceded by the Funds’ current prospectus, which includesinformation regarding the Fund’s risks, objectives, fees and expenses, experience of its management, and other information.
The commentary within An Owner’s Manual, the Letter from the President, the Letter from the Portfolio Managers, and theManagement’s Discussion of Fund Performance reflects their current views and opinions as of the date of this report. Any suchviews are subject to change at any time based upon market or other conditions and IVA Funds disclaims any responsibility toupdate such views. These views may not be relied on as investment advice and, because investment decisions are based onnumerous factors, may not be relied on as an indication of trading intent. References to specific securities should not be construedas recommendations or investment advice.