Integrated Architecture for Aircraft Engine Performance ... · Integrated Architecture for Aircraft...
25
www.nasa.gov Integrated Architecture for Aircraft Engine Performance Monitoring and Fault Diagnostics: Engine Test Results Aidan W. Rinehart Vantage Partners LLC 3000 Aerospace Parkway Brook Park, OH 44142 Donald L. Simon NASA Glenn Research Center 21000 Brookpark Road Cleveland, OH 44135 1 AIAA Joint Propulsion Conference 2014 July 28-30, 2014 Cleveland, OH https://ntrs.nasa.gov/search.jsp?R=20140016832 2020-03-10T07:42:46+00:00Z
Transcript of Integrated Architecture for Aircraft Engine Performance ... · Integrated Architecture for Aircraft...
www.nasa.gov
Integrated Architecture for Aircraft Engine Performance Monitoring and Fault Diagnostics:
Engine Test Results
Aidan W. Rinehart Vantage Partners LLC
3000 Aerospace Parkway Brook Park, OH 44142
Donald L. Simon NASA Glenn Research Center
21000 Brookpark Road Cleveland, OH 44135
1
AIAA Joint Propulsion Conference 2014 July 28-30, 2014 Cleveland, OH
https://ntrs.nasa.gov/search.jsp?R=20140016832 2020-03-10T07:42:46+00:00Z

www.nasa.gov
Overview
• Background • Architecture • Application • Results • Conclusion
2

www.nasa.gov
Background – aircraft engine performance trend monitoring and gas path fault diagnostics
• Conventional Approach: – Ground-based – Processing of “snapshot”
measurements post-flight – Enables estimation and trending of
engine performance and gas path fault diagnostics
– Early diagnosis of incipient fault conditions with minimal latency can be challenging
• Emerging Approach: – Advances in on-board processing and
flight data recording capabilities are enabling new diagnostic approaches
– Acquisition of full-flight streaming/continuous measurement data now possible
– Requires new approaches to analyze expanded quantity and format of data
Data Transfer
Denotes notional “snapshot” measurement point
Alti
tude
Fan
Spee
dEx
haus
t Gas
Tem
pera
ture
Fuel
Flo
w
Ground Station
Example Aircraft Engine Flight Data
3

www.nasa.gov
Architecture for Engine Performance Monitoring and Fault Diagnostics
• Designed for processing real-time continuous (streaming) engine measurement data to provide: – Estimation and trending of deterioration-induced engine
performance changes – Detection and isolation of gas path system faults
4

www.nasa.gov
Real-Time Self Tuning Model
• Self-tuning piecewise linear Kalman filter design • Applies NASA-developed optimal tuner selection
– Application for underdetermined estimation problems – Minimizes mean squared estimation error in parameters of interest
• Provides real-time estimates of unmeasured engine performance parameters
5

www.nasa.gov
Performance Baseline Model
• Piecewise linear state space model design, open-loop with inputs: – Actuator commands, u. – Power reference parameter, yr , which is used to improve model-to-engine tracking
capability. – Periodic model tuning parameter updates from RTSTM to account for gradual
degradation effects.
• PBM provides a baseline of recent engine performance 6

www.nasa.gov
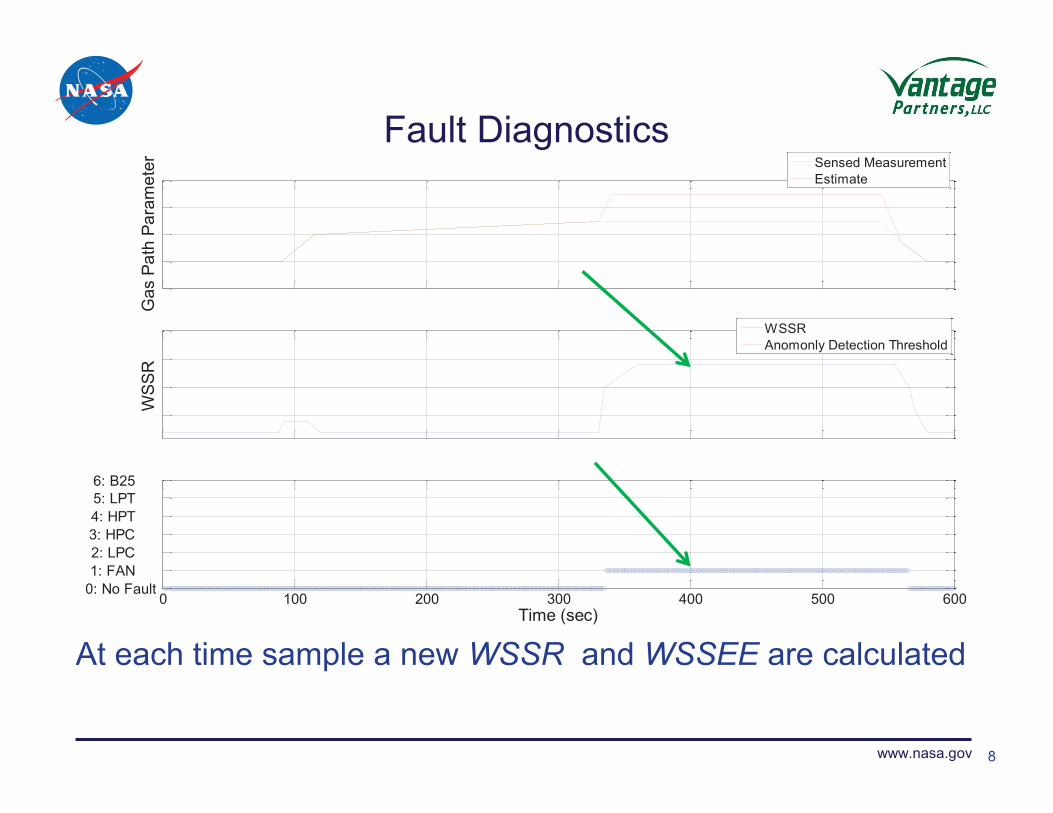
Fault Diagnostics
7
• Monitors residuals between sensed engine outputs and PBM estimated outputs • Fault detection is performed by calculating and monitoring a weighted sum of
squared residuals (WSSR) signal. • Upon fault detection, fault classification is performed by identifying the candidate
fault signature that most closely matched the observed residual in a weighted least squares sense.
yRyWSSR 1T ~~ ��
� � � �j1T
jj yyRyyWSSEE ~̂~~̂~ ��� �
www.nasa.gov
Gas
Pat
h Pa
ram
eter
Sensed MeasurementEstimate
WSS
R
WSSRAnomonly Detection Threshold
0 100 200 300 400 500 6000: No Fault 1: FAN 2: LPC 3: HPC 4: HPT 5: LPT 6: B25
Time (sec)
Fault Diagnostics
8
At each time sample a new WSSR and WSSEE are calculated
www.nasa.gov
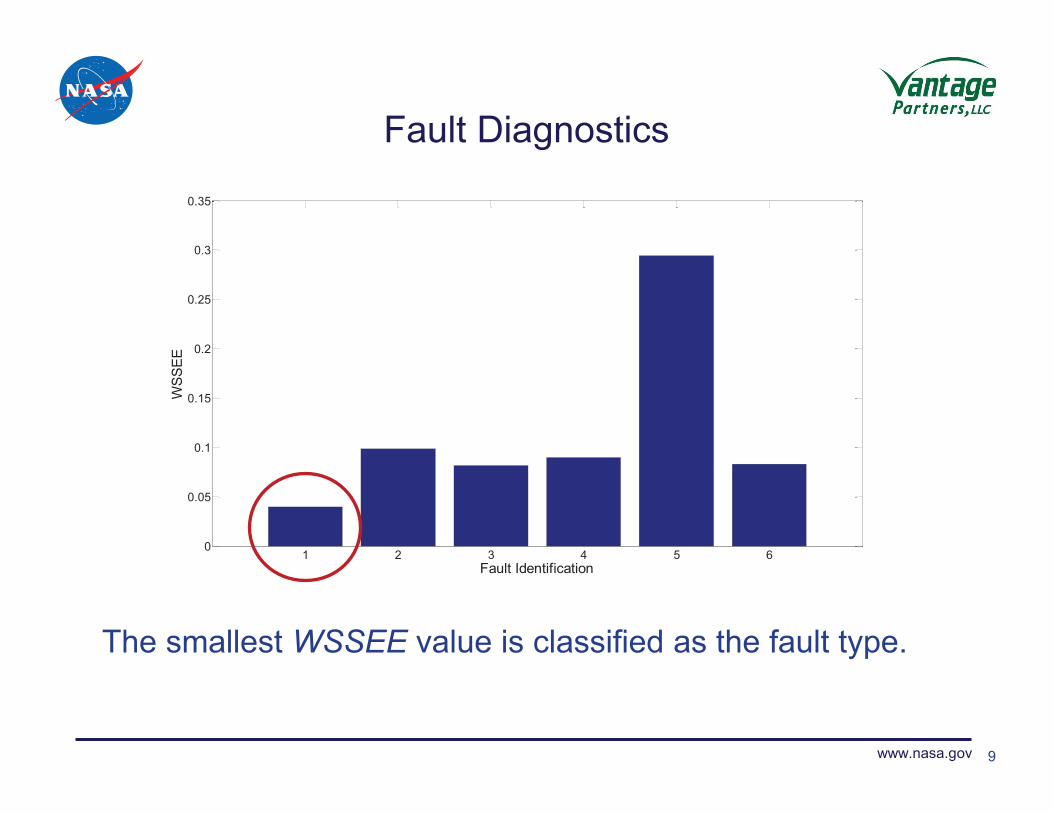
Fault Diagnostics
9
1 2 3 4 5 60
0.05
0.1
0.15
0.2
0.25
0.3
0.35
WSS
EE
Fault Identification
The smallest WSSEE value is classified as the fault type.

www.nasa.gov
Application Example: Analysis of Vehicle Integrated Propulsion Research (VIPR) Engine Test Data
10
Boeing C-17 Globemaster III
Pratt & Whitney F117 Turbofan Engine
• VIPR is a series of ground-based, on-wing engine tests to mature engine health management sensors and algorithms
– Ongoing at NASA Armstrong / Edwards Air Force Base
– Partners include NASA, US Air Force, Pratt & Whitney, and others
• Test vehicle: – Boeing C-17 Globemaster III – Equipped with Pratt & Whitney F117 high-
bypass turbofan engines
• VIPR ground tests include: – A series of nominal and seeded faulted engine
test cases o Faults include station 2.5 bleed valve and 14th
stage bleed valve faults – Data collected over a range of engine power
settings including steady-state and transient operating conditions
www.nasa.gov
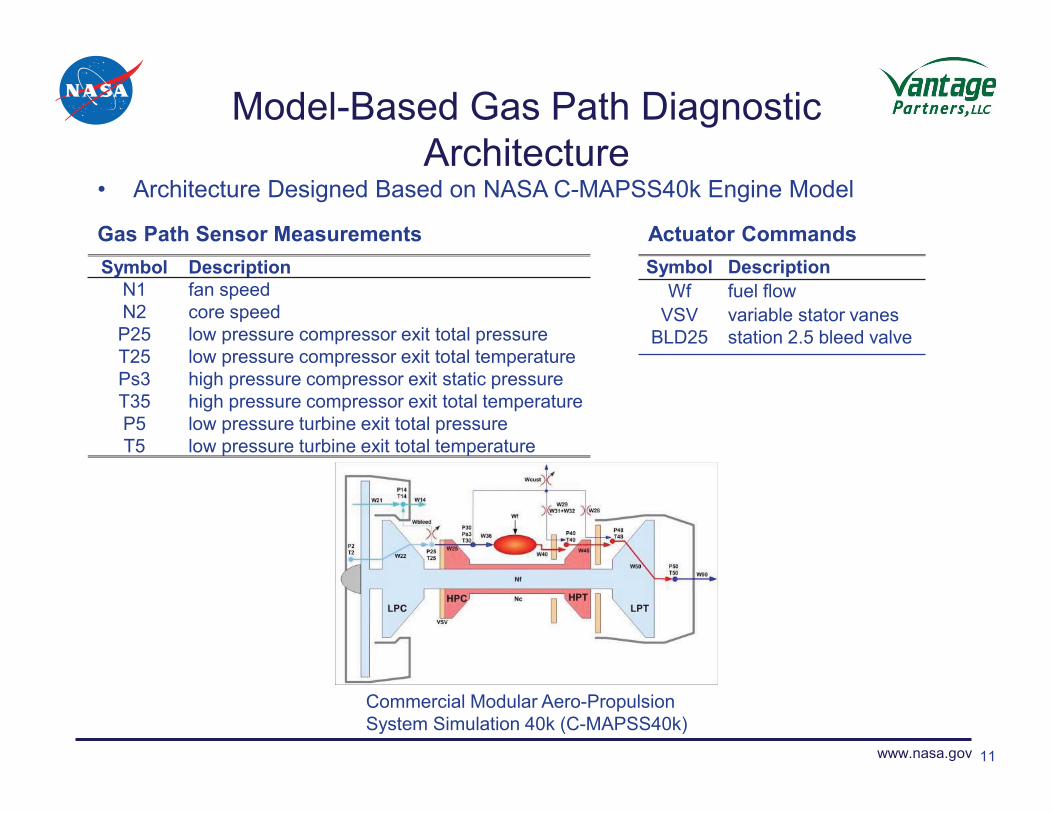
Model-Based Gas Path Diagnostic Architecture
Commercial Modular Aero-Propulsion System Simulation 40k (C-MAPSS40k)
Symbol Description N1 fan speed N2 P25 T25
core speed low pressure compressor exit total pressure low pressure compressor exit total temperature
Ps3 high pressure compressor exit static pressure T35 high pressure compressor exit total temperature P5 low pressure turbine exit total pressure T5 low pressure turbine exit total temperature
Gas Path Sensor Measurements Symbol Description
Wf fuel flow VSV variable stator vanes
BLD25 station 2.5 bleed valve
Actuator Commands
• Architecture Designed Based on NASA C-MAPSS40k Engine Model
11

www.nasa.gov
Model-Based Gas Path Diagnostic Architecture
• Architecture Designed Based on NASA C-MAPSS40k Engine Model
Description 7 state variables (2 rotor speeds, 5 metal temperatures) 8 engine sensors (2 rotor speeds, 3 pressure and 3 temperature) 6 engine performance deterioration tuning parameters
RTSTM Kalman Filter Estimated Parameters
12
PBM Estimated Parameters Description 6 state variables (1 rotor speeds, 5 metal temperatures) 8 engine sensors (2 rotor speeds, 3 pressure and 3 temperature) 6 engine performance deterioration tuning parameters
Commercial Modular Aero-Propulsion System Simulation 40k (C-MAPSS40k)

www.nasa.gov
Engine Sensors and Commands Considered in this Study
13
T5 P5
T35 Ps3
T25* P25*
Wf VSV Station 2.5 Bleed
N1 N2
14th Stg Bleed
*Sensors unique to VIPR II tests

www.nasa.gov
Fault Types
14
Fault Index Fault Types
1 Fan
2 Low Pressure Compressor
3 High Pressure Compressor
4 High Pressure Turbine
5 Low Pressure Turbine
6 Station 2.5 Bleed Valve
7 Variable Stator Vane
8 14th Stage Bleed Valve

www.nasa.gov
VIPR I Baseline Results
15
Ga
s P
ath
Pa
ram
ete
r
Sensed MeasurementPBM Predicted MeasurementRTSTM Predicted Measurement
WS
SR
WSSRAnomaly Detection Threshold
0 500 1000 1500 2000 2500 3000 3500 40000: No Fault 1: FAN 2: LPC 3: HPC 4: HPT 5: LPT 6: B25 7: VSV 8: B14
Dia
gn
ose
d F
au
lt ID
Time (sec)

www.nasa.gov
VIPR I Station 2.5 Bleed Valve Fault Results
16
Gas
Pat
h P
aram
eter
Sensed MeasurementPBM Predicted MeasurementRTSTM Predicted Measurement
WS
SR
WSSRAnomaly Detection Threshold
0 500 1000 1500 2000 2500 30000: No Fault 1: FAN 2: LPC 3: HPC 4: HPT 5: LPT 6: B25 7: VSV 8: B14
Dia
gnos
ed F
ault
ID
Time (sec)

www.nasa.gov
VIPR II Station 2.5 Bleed Valve Fault Results
17
Gas
Pat
h P
aram
eter
Sensed MeasurementPBM Predicted MeasurementRTSTM Predicted Measurement
WS
SR
WSSRAnomaly Detection Threshold
0 500 1000 1500 2000 2500 30000: No Fault 1: FAN 2: LPC 3: HPC 4: HPT 5: LPT 6: B25 7: VSV 8: B14
Dia
gnos
ed F
ault
ID
Time (sec)

www.nasa.gov
VIPR I 14th Stage Bleed Valve Fault Results
18
Gas
Pat
h P
aram
eter
Sensed MeasurementPBM Predicted MeasurementRTSTM Predicted Measurement
WS
SR
WSSRAnomaly Detection Threshold
0 500 1000 1500 2000 2500 30000: No Fault 1: FAN 2: LPC 3: HPC 4: HPT 5: LPT 6: B25 7: VSV 8: B14
Dia
gnos
ed F
ault
ID
Time (sec)

www.nasa.gov
VIPR II 14th Stage Bleed Valve Fault Results
19
Gas
Pat
h P
aram
eter
Sensed MeasurementPBM Predicted MeasurementRTSTM Predicted Measurement
WS
SR
WSSRAnomaly Detection Threshold
0 500 1000 1500 2000 2500 30000: No Fault 1: FAN 2: LPC 3: HPC 4: HPT 5: LPT 6: B25 7: VSV 8: B14
Dia
gnos
ed F
ault
ID
Time (sec)

www.nasa.gov
Conclusion
• Architecture was found to provide reliable steady-state fault detection and isolation
• Addition of station 2.5 sensor provided fault detection at lower power settings
• Future work will include improved matching of model to engine dynamics
• The architecture’s ability to estimate deteriorated engine performance will be evaluated during the follow on VIPR III test
20

www.nasa.gov
Acknowledgments
21
Research conducted under the Vehicle Systems Safety Technologies Project of NASA’s Aviation Safety Program

www.nasa.gov
Backup Slides
22
www.nasa.gov
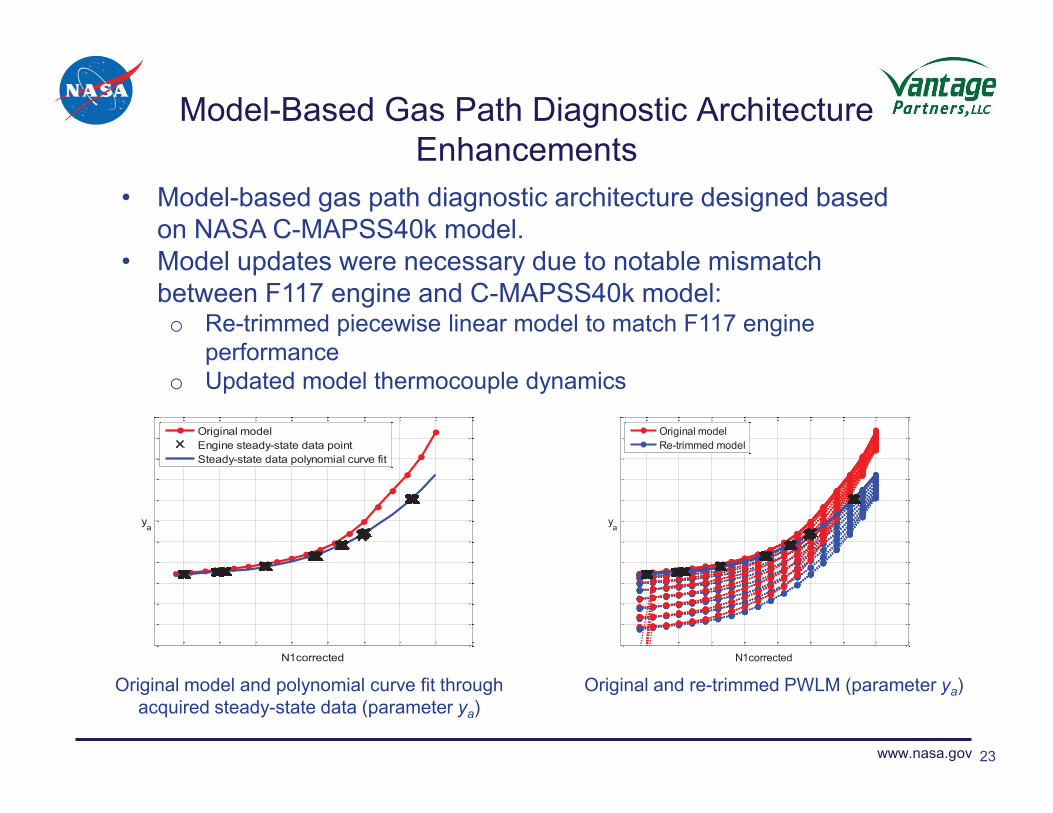
Model-Based Gas Path Diagnostic Architecture Enhancements
23
• Model-based gas path diagnostic architecture designed based on NASA C-MAPSS40k model.
• Model updates were necessary due to notable mismatch between F117 engine and C-MAPSS40k model: o Re-trimmed piecewise linear model to match F117 engine
performance o Updated model thermocouple dynamics
N1corrected
ya
Original modelEngine steady-state data pointSteady-state data polynomial curve fit
N1corrected
ya
Original modelRe-trimmed model
Original model and polynomial curve fit through acquired steady-state data (parameter ya)
Original and re-trimmed PWLM (parameter ya)
www.nasa.gov
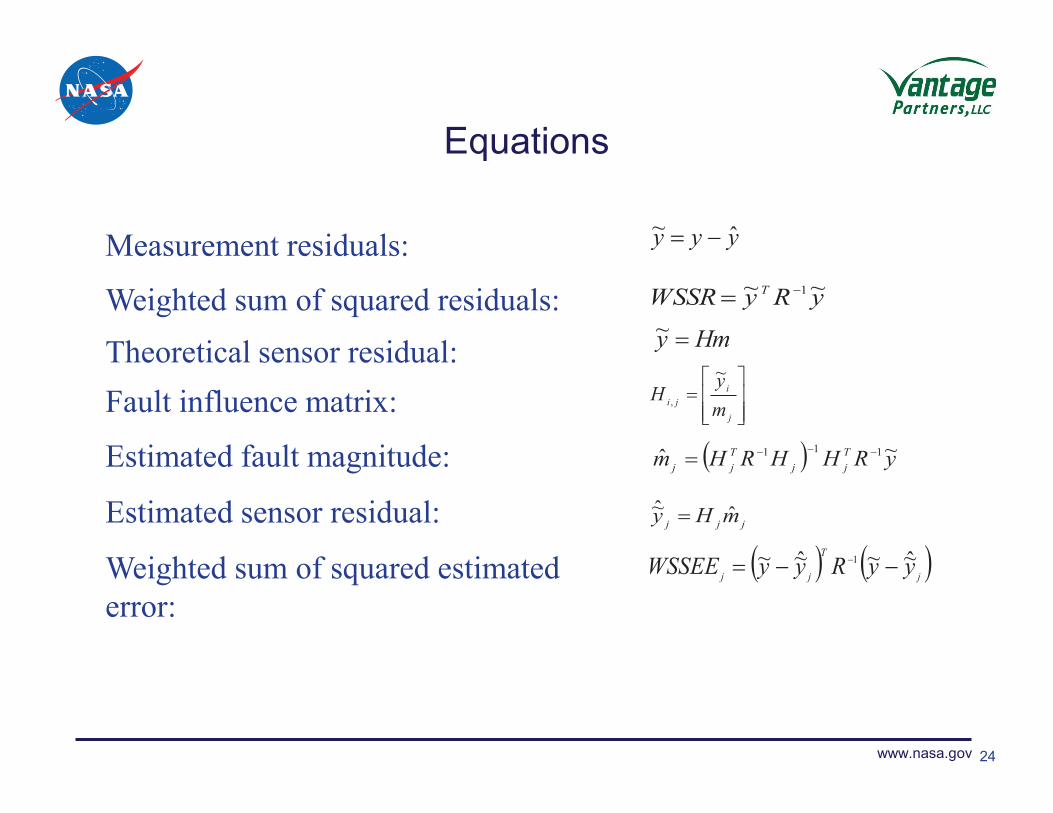
Equations
yyy ˆ~ ��
yRyWSSR T ~~ 1��
Hmy �~
���
�
��
j
iji m
yH
~,
� � yRHHRHm Tjj
Tjj
~ˆ 111 ����
jjj mHy ˆ~̂ �
� � � �jT
jj yyRyyWSSEE ~̂~~̂~ 1 ��� �
Measurement residuals:
Weighted sum of squared residuals: Theoretical sensor residual: Fault influence matrix:
Estimated fault magnitude:
Estimated sensor residual:
Weighted sum of squared estimated error:
24

www.nasa.gov
VIPR II Baseline Results
25
Gas
Pat
h P
aram
eter
Sensed MeasurementPerformance Baseline Model Predicted MeasurementReal Time Self Tunning Model Predicted Measurement
0
0.5
1
1.5
2 x 10⁻³
WS
SR
WSSRAnomaly Detection Threshold
0 500 1000 1500 2000 2500 30000: No Fault 1: FAN 2: LPC 3: HPC 4: HPT 5: LPT 6: B25 7: VSV 8: B14
Dia
gnos
ed F
ault
ID
Time (sec)