
In Situ Electron Microscopy Imaging and Article...
8
In Situ Electron Microscopy Imaging and Quantitative Structural Modulation of Nanoparticle Superlattices Juyeong Kim, †,‡ Matthew R. Jones, § Zihao Ou, † and Qian Chen* ,†,‡,⊥ † Department of Materials Science and Engineering, ‡ Frederick Seitz Materials Research Laboratory, and ⊥ Department of Chemistry, University of Illinois, Urbana, Illinois 61801, United States § Department of Chemistry, University of California, Berkeley, California 94720, United States * S Supporting Information ABSTRACT: We use liquid-phase transmission electron micros- copy (LP-TEM) to characterize the structure and dynamics of a solution-phase superlattice assembled from gold nanoprisms at the single particle level. The lamellar structure of the superlattice, determined by a balance of interprism interactions, is maintained and resolved under low-dose imaging conditions typically reserved for biomolecular imaging. In this dose range, we capture dynamic structural changes in the superlattice in real time, where contraction and smaller steady-state lattice constants are observed at higher electron dose rates. Quantitative analysis of the contraction mechanism based on a combination of direct LP-TEM imaging, ensemble small-angle X-ray scattering, and theoretical modeling allows us to elucidate: (1) the superlattice contraction in LP-TEM results from the screening of electrostatic repulsion due to as much as a 6-fold increase in the effective ionic strength in the solution upon electron beam illumination; and (2) the lattice constant serves as a means to understand the mechanism of the in situ interaction modulation and precisely calibrate electron dose rates with the effective ionic strength of the system. These results demonstrate that low-dose LP-TEM is a powerful tool for obtaining structural and kinetic properties of nanoassemblies in liquid conditions that closely resemble real experiments. We anticipate that this technique will be especially advantageous for those structures with heterogeneity or disorder that cannot be easily probed by ensemble methods and will provide important insight that will aid in the rational design of sophisticated reconfigurable nanomaterials. KEYWORDS: nanoassemblies, reorganization kinetics, liquid-phase TEM, gold nanoprism superlattice, interaction modeling, SAXS S elf-assembly of nanoparticles into complex architectures promises access to collective photonic, 1−3 plasmonic, 4−6 electronic, 7−9 catalytic, 10,11 and magnetic 12 functional- ities that are tunable and may even be adaptable in response to changes in external conditions. 13−16 An understanding of internanoparticle interactions and structuring kinetics in liquids is essential for predictive nanoparticle assembly, which remains a challenge. 17,18 Classical colloidal theories developed for interactions between micron-sized particles do not simply rescale at nanometer dimensions because of multiscale collective effects and the nonadditivity of nanoscale inter- actions. 18−21 Ideally one would address this by analyzing directly the dynamic motion and assembly of individual nanoparticles. However, experimental studies of this sort are complicated by the need to acquire images with the appropriate time and spatial resolution while nanoparticles interact freely in liquids to form into superstructures. Most in situ observations of nanoparticle assembly in solution use small-angle X-ray scattering (SAXS), which probes assembled structures in reciprocal space. 13−15,22,23 SAXS has minimal disturbance to the native sample solution during measurement and high resolution in detecting structural order. It is limited, however, by its ensemble nature, which offers little insight into the real-time motions and interactions of single nanoparticles and complicates interpretation of structural heterogeneity/disorder. On the other hand, liquid-phase transmission electron microscopy (LP-TEM) readily achieves single-nanoparticle imaging in liquids 24−32 and allows experimental interpretation of nanoparticle interactions and assembly dynamics. 33−38 For example, LP-TEM has been used to observe nanoparticle Received: August 4, 2016 Accepted: October 10, 2016 Article www.acsnano.org © XXXX American Chemical Society A DOI: 10.1021/acsnano.6b05270 ACS Nano XXXX, XXX, XXX−XXX
Transcript of In Situ Electron Microscopy Imaging and Article...
In Situ Electron Microscopy Imaging andQuantitative Structural Modulation ofNanoparticle SuperlatticesJuyeong Kim,†,‡ Matthew R. Jones,§ Zihao Ou,† and Qian Chen*,†,‡,⊥
†Department of Materials Science and Engineering, ‡Frederick Seitz Materials Research Laboratory, and ⊥Department of Chemistry,University of Illinois, Urbana, Illinois 61801, United States§Department of Chemistry, University of California, Berkeley, California 94720, United States
*S Supporting Information
ABSTRACT: We use liquid-phase transmission electron micros-copy (LP-TEM) to characterize the structure and dynamics of asolution-phase superlattice assembled from gold nanoprisms atthe single particle level. The lamellar structure of the superlattice,determined by a balance of interprism interactions, is maintainedand resolved under low-dose imaging conditions typicallyreserved for biomolecular imaging. In this dose range, wecapture dynamic structural changes in the superlattice in realtime, where contraction and smaller steady-state lattice constantsare observed at higher electron dose rates. Quantitative analysisof the contraction mechanism based on a combination of directLP-TEM imaging, ensemble small-angle X-ray scattering, and theoretical modeling allows us to elucidate: (1) thesuperlattice contraction in LP-TEM results from the screening of electrostatic repulsion due to as much as a 6-fold increasein the effective ionic strength in the solution upon electron beam illumination; and (2) the lattice constant serves as ameans to understand the mechanism of the in situ interaction modulation and precisely calibrate electron dose rates withthe effective ionic strength of the system. These results demonstrate that low-dose LP-TEM is a powerful tool for obtainingstructural and kinetic properties of nanoassemblies in liquid conditions that closely resemble real experiments. Weanticipate that this technique will be especially advantageous for those structures with heterogeneity or disorder thatcannot be easily probed by ensemble methods and will provide important insight that will aid in the rational design ofsophisticated reconfigurable nanomaterials.
KEYWORDS: nanoassemblies, reorganization kinetics, liquid-phase TEM, gold nanoprism superlattice, interaction modeling, SAXS
Self-assembly of nanoparticles into complex architecturespromises access to collective photonic,1−3 plasmonic,4−6
electronic,7−9 catalytic,10,11 and magnetic12 functional-ities that are tunable and may even be adaptable in response tochanges in external conditions.13−16 An understanding ofinternanoparticle interactions and structuring kinetics in liquidsis essential for predictive nanoparticle assembly, which remainsa challenge.17,18 Classical colloidal theories developed forinteractions between micron-sized particles do not simplyrescale at nanometer dimensions because of multiscalecollective effects and the nonadditivity of nanoscale inter-actions.18−21 Ideally one would address this by analyzingdirectly the dynamic motion and assembly of individualnanoparticles. However, experimental studies of this sort arecomplicated by the need to acquire images with the appropriatetime and spatial resolution while nanoparticles interact freely inliquids to form into superstructures.
Most in situ observations of nanoparticle assembly in solutionuse small-angle X-ray scattering (SAXS), which probesassembled structures in reciprocal space.13−15,22,23 SAXS hasminimal disturbance to the native sample solution duringmeasurement and high resolution in detecting structural order.It is limited, however, by its ensemble nature, which offers littleinsight into the real-time motions and interactions of singlenanoparticles and complicates interpretation of structuralheterogeneity/disorder.On the other hand, liquid-phase transmission electron
microscopy (LP-TEM) readily achieves single-nanoparticleimaging in liquids24−32 and allows experimental interpretationof nanoparticle interactions and assembly dynamics.33−38 Forexample, LP-TEM has been used to observe nanoparticle
Received: August 4, 2016Accepted: October 10, 2016
Artic
lewww.acsnano.org
© XXXX American Chemical Society A DOI: 10.1021/acsnano.6b05270ACS Nano XXXX, XXX, XXX−XXX
monolayer formation during solvent drying33 and the assemblyof gold spheres,34−36 gold rods,37 and CdSe/CdS octapods38
into linear chains. Based on a statistical analysis of singlenanoparticle motion trajectories, our earlier work reported aquantitative map of nanoparticle interactions inside LP-TEM.37
The limitation of LP-TEM is the effect of the imaging electronbeam, which has been shown to greatly alter the liquidcomponents through radiolysis reactions.27−29 For instance, theradiolysis of water,39 the widely used solvent for metallicnanoparticle and biomolecule-directed assemblies, generatesionic and reactive species (OH−, H+, hydrated e−, OH, etc.) as afunction of electron beam dose rates (number of electronsimposed onto the sample per unit area per unit time). Thesereactions frequently perturb the solution considerably,convoluting the interpretation of the data and making theresults challenging to be used to guide nanoparticle assembly instandard experimental conditions outside TEM. It is thuscritical to experimentally quantify how local changes in theliquid environment within the illuminated area consequentlyinfluence nanoparticle interactions and assembly dynamics.Here we use low-dose LP-TEM to characterize one-
dimensional (1D) nanoprism superlattices. We resolve thereal-space structure of a hydrated crystalline nanoparticlesuperlattice and its structural change in response to localchanges in the liquid. The quantitative correlation among LP-TEM images, theoretical modeling, and ensemble measure-ments of lattice constants by SAXS enables us to understandthe mechanism of electron beam-mediated nanoparticleinteractions and to reproduce identical structural reorganizationof the assembly outside TEM. We observe that the dose ratestypically used in cryogenic EM imaging of biomolecules (1−10e−/(Å2·s)),40 which are lower than the dose rates commonlyused in earlier LP-TEM studies (Figure S1 and Table S1), arerequired to prevent the superlattices from collapsingcompletely. Within the optimized dose rate range (1−6 e−/(Å2·s)), the contraction of the lattice constant, i.e., the center-to-center d spacing between prisms (Figure 1A), isquantitatively modulated by electron beam dose rates. We seethe “in situ” and “outside TEM” correlation we establish here asa critical step to generalize single-nanoparticle insights onnanoparticle assembly learned from LP-TEM, at a spatiotem-poral resolution not accessible by other means, to directpredictable assembly in real experimental conditions.
RESULTS AND DISCUSSIONThe superlattices used in this work are defined by evenlyspaced gold triangular nanoprisms aligned face-to-face, here-tofore referred to as meta-rods (Figure 1A). While the meta-rods represent a rich and important class of nanoparticlesuperlattices, with collective properties that are sensitive to thespatial arrangement of component nanoparticles,1,4,5,7−9,11,12
they have previously been characterized at the ensemble level.41
The meta-rods are prepared by functionalizing gold prisms(89.3 ± 9.1 nm in edge length and 7.5 ± 0.3 nm in thickness)with a dense monolayer of alkyl-thiol ligands, rationallydesigned to induce robust solution-phase assembly behavior(see Materials and Methods in the Supporting Information,Figure S2). Specifically, carboxyl-terminated thiols areexchanged with the native cetyltrimethylammonium bromide(CTAB) ligands on the prism surface.42−44 The strong gold−thiol bond allows for the system to be prepared in such a wayso as to have a low concentration of free ligands. Thisminimizes the contribution of depletion forces41 and facilitates
theoretical modeling of interprism interactions for mechanisticunderstanding. An aqueous pH = 8 phosphate buffer solution(PBS) is used as the liquid medium to ensure completedeprotonation of the ligands into negatively charged − COO−
groups (pKa = 3.5−3.7, Figure S3A), which excludesinterparticle hydrogen-bonding effects (−COOH·· ·OHOC−).43 The high buffer concentration (0.15 M) maintainsa constant pH and keeps the surface charge density of prismsconstant even with potential radiolysis-generated H+ or OH−
species (see the evaluation of beam-induced pH effects inFigure S3B). Under these conditions, prisms assemble face-to-face through a balance of electrostatic repulsion and van derWaals attraction.Figure 1A shows a typical LP-TEM image of 1D meta-rods
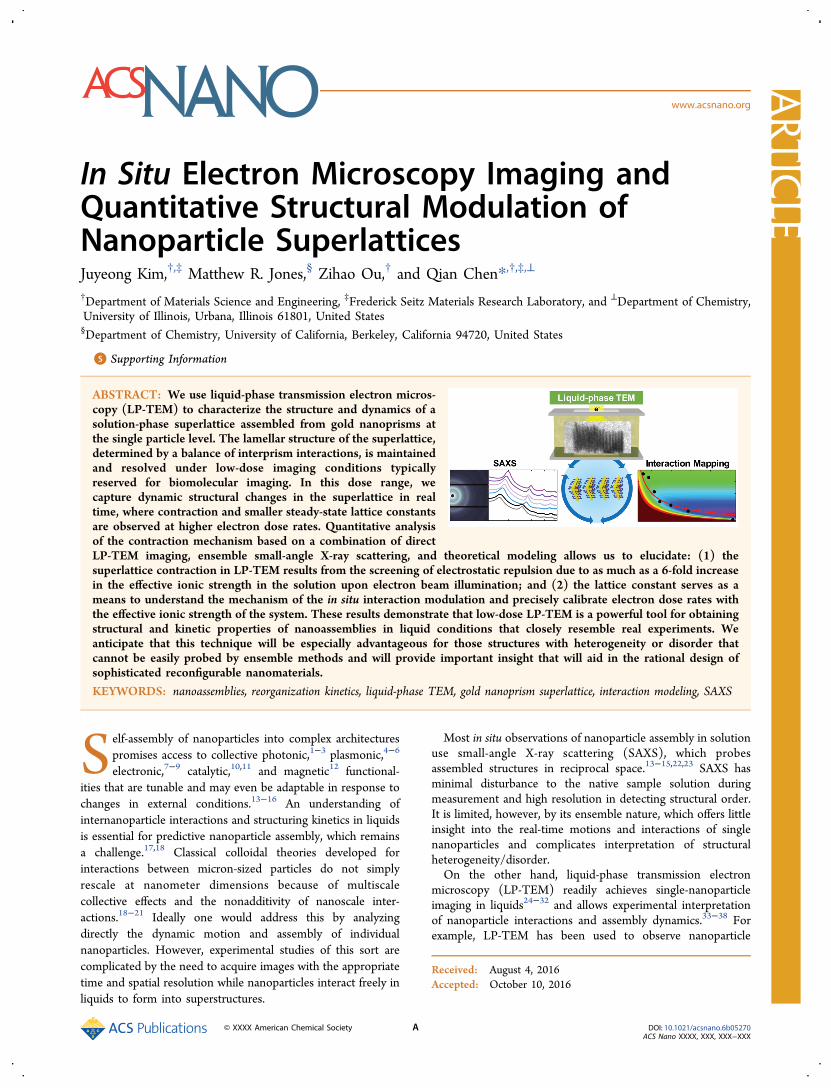
lying flat on the SiNx window composing the liquid cell samplechamber, showing visible interstices between nearest-neighborprisms which indicate preservation of the solvent/ligand layersbetween the particles. The LP-TEM image was taken at a doserate of 10 e−/(Å2·s) and an accelerating voltage of 200 kV. Thereal-space TEM image allows us to measure the d spacingdirectly from the intensity profile across parallel neighboringprisms (Figure 1A); the d spacing is consistent betweendifferent pairs of neighboring prisms (12.2 ± 1.0 nm). MovieS1 shows that at the stable state the intensity profile fluctuatesand still generates a consistent d spacing over time. Such direct
Figure 1. Characterizations of meta-rods. (A) A schematic (left, notdrawn to the scale) of meta-rods in 0.15 M pH = 8 PBS buffersolution labeling the d spacing and the meta-rod length h, a LP-TEM image showing a meta-rod lying flat on the SiNx liquidwindow (middle), and the intensity profile of the TEM imageregion boxed by red dotted lines showing the intensity averagedhorizontally as a function of the vertical axis due to alternatingprisms (dark in TEM) and interstices (bright in TEM), from whichwe measure the d spacing in LP-TEM (right). The red arrowshighlight positions corresponding to the starting and ending prismsshown in the red box of the TEM image. (B) SAXS spectrum of themeta-rods in 0.15 M pH = 8 PBS buffer solution. The black arrowshighlight the peak positions in the spectrum, from which wemeasure the d spacing in SAXS. The inset shows the 2D scatteringimage of the same meta-rod solution. (C) A TEM image of driedmeta-rods as a comparison, where capillary forces have collapsedthe 3D arrangement of meta-rods. Scale bars: 50 nm.
ACS Nano Article
DOI: 10.1021/acsnano.6b05270ACS Nano XXXX, XXX, XXX−XXX
B
measurement of nanoparticle spatial organization in liquids maybe generalized to other complicated multicomponent super-lattices that exhibit heterogeneity and localized disorders, thestructural elucidation of which using SAXS could bechallenging.13−15,22,23 For the purpose of comparison, Figure1C is a typical TEM image of a dried superlattice dropcast on aTEM grid. Evaporation-induced capillary forces disturb theperiodic features of the meta-rods and warp the structure sothat it may flatten on the substrate.Comparison between the averaged d spacings of the same
meta-rod solution measured in LP-TEM and with SAXS showsthat the electron beam modulates nanoparticle interactions. InFigure 1B, both the 2D scattering image and the plot ofscattered intensity I(q) versus scattering vector q clearly featuresharp diffraction peaks at integer spacings, consistent with ahighly ordered 1D lamellar structure.41 We obtain a d spacingof 16.4 ± 0.7 nm from the q value of the first-order peak in theSAXS spectrum, larger than what is measured from LP-TEM(12.2 ± 1.0 nm). In other words, meta-rods contract in LP-TEM and stabilize at a shifted steady-state d spacingdetermined by the re-established liquid environment underbeam irradiation.The meta-rod contraction can be qualitatively explained by
the screening of electrostatic repulsion due to the generation ofionic species during radiolysis. Quantitative understanding ofthe influence of the beam on nanoparticle interactions has beenlimited due to the difficulty of measuring the ion concentrationchange inside LP-TEM.34,37,39 The ions produced fromradiolysis are transient and localized, present only in thebeam illumination area, which is challenging to quantify usingensemble electrochemical measurements or elemental analysismethods within a TEM. Theoretical calculations based onradiolysis reaction networks predict the steady-state concen-trations of many species when the solvent is pure water, but thisdoes not extend readily to highly salted liquids due to theirpoorly understood radiolysis kinetics.39 In contrast, here the dspacing of meta-rods serves as a convenient measurableparameter for quantification of beam modulated nanoparticleinteractions.
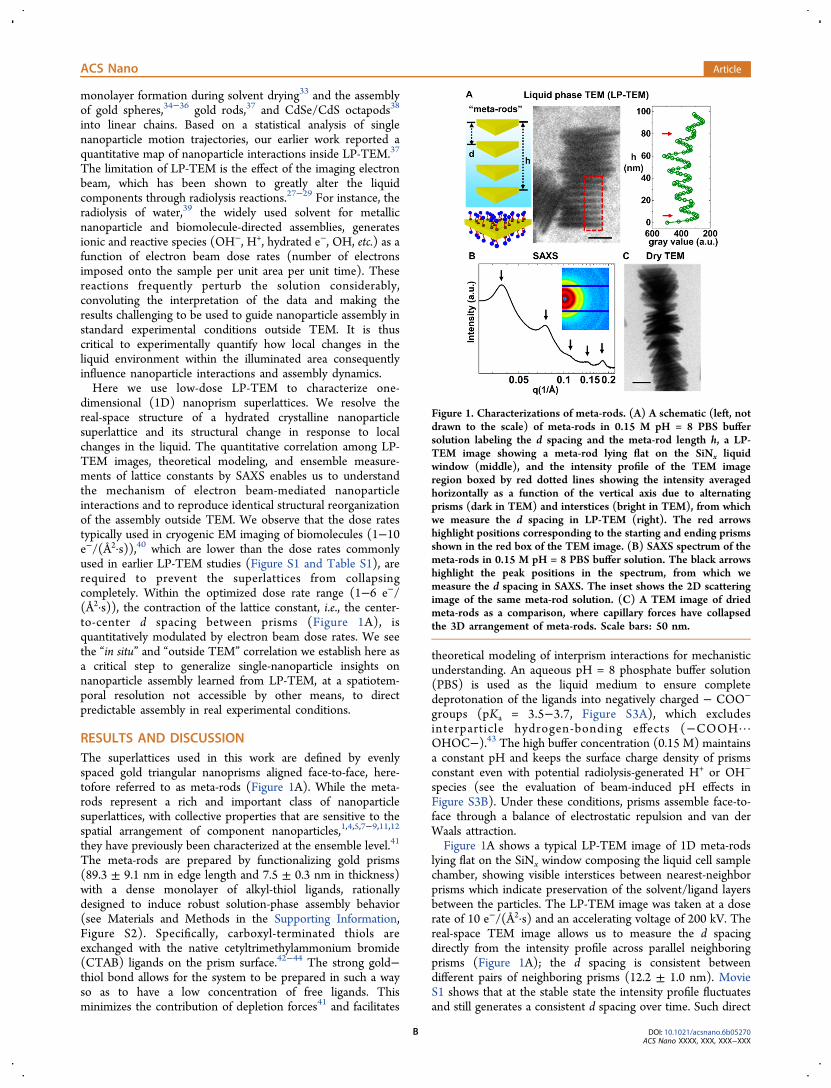
The degree of meta-rod contraction is controlled by electronbeam dose rates in LP-TEM. We take care to minimize electronbeam exposure to a region with meta-rods of interest prior toimaging (see Materials and Methods in the SupportingInformation). Within the dose rate range of 1−6 e−/(Å2·s),the d spacing of meta-rods measured in LP-TEM decreasesmonotonically with increasing dose rates (Figure 2A), and weare able to capture the contraction dynamics of meta-rods fromtheir native states. For example, at a dose rate of 5.5 e−/(Å2·s),time-lapsed TEM images that are collected immediately afterbeam irradiation show that the meta-rods contract until theyreach a plateau value of stable length (Figure 2B−F, Movie S2).The d spacing is measured by d = h/N (Table S2), where h isthe meta-rod length and N is the time-invariant number ofprisms comprising one meta-rod given that the time scales ofprism assembly and prism exchange between meta-rods areboth slower than the imaging experiment. The h(t)−t plot inFigure 2B reveals two important features of the contractiondynamics. First, it takes ∼1 min to reach the steady-state,longer than the estimated time needed for radiolysis reactionsto complete (ms to seconds).39 Because prisms comprising themeta-rods need to move collectively to achieve their newequilibrium positions, it is important to use the stable d spacing,not a random spacing at time t, as the indicator of the re-established liquid environment. Second, the h(t)−t curves offive different meta-rods (Figure S4) converge to one mastercurve after being normalized by N (Figure 2B). The final dspacing is independent of N, which is consistent with thehypothesis that the meta-rods respond sensitively to localchanges in liquids and demonstrates their robustness as an insitu indicator of liquid-mediated nanoparticle interactions.In the above dose range, most previous LP-TEM work using
nanoparticle-based chemical reactions as probes of radiationeffects detected no changes (see our literature survey in FigureS1 and Table S1). Meta-rods are more sensitive and respond toas low as 1 e−/(Å2·s) (Figure S5 and Table S2) due to theirability to detect ion concentrations directly (see below), whilereaction probes (e.g., nanoparticle nucleation and etchingevents) are only responsive when the cumulative change in the
Figure 2. Meta-rod contraction in LP-TEM. (A) The d spacing−dose rate curve showing the electron beam effect on the stable meta-rod dspacing in LP-TEM. The dotted circle is the condition where detailed analysis and meta-rod contraction dynamics are shown in (B−F). (B)The master h(t)−t curve averaged from the h(t)−t curves of five different meta-rods (Figure S4) after normalization by the number of prismsinside one meta-rod, N. The blue arrow shows the equilibrium state of meta-rods. (C−F) Time-lapsed LP-TEM images of meta-rods,demonstrating a shrinking of their total length over time. The dotted arrows indicate the direction of the meta-rod contraction. Scale bar: 100nm.
ACS Nano Article
DOI: 10.1021/acsnano.6b05270ACS Nano XXXX, XXX, XXX−XXX
C
redox environment in irradiated liquids is sufficient toovercome reaction barriers.45,46
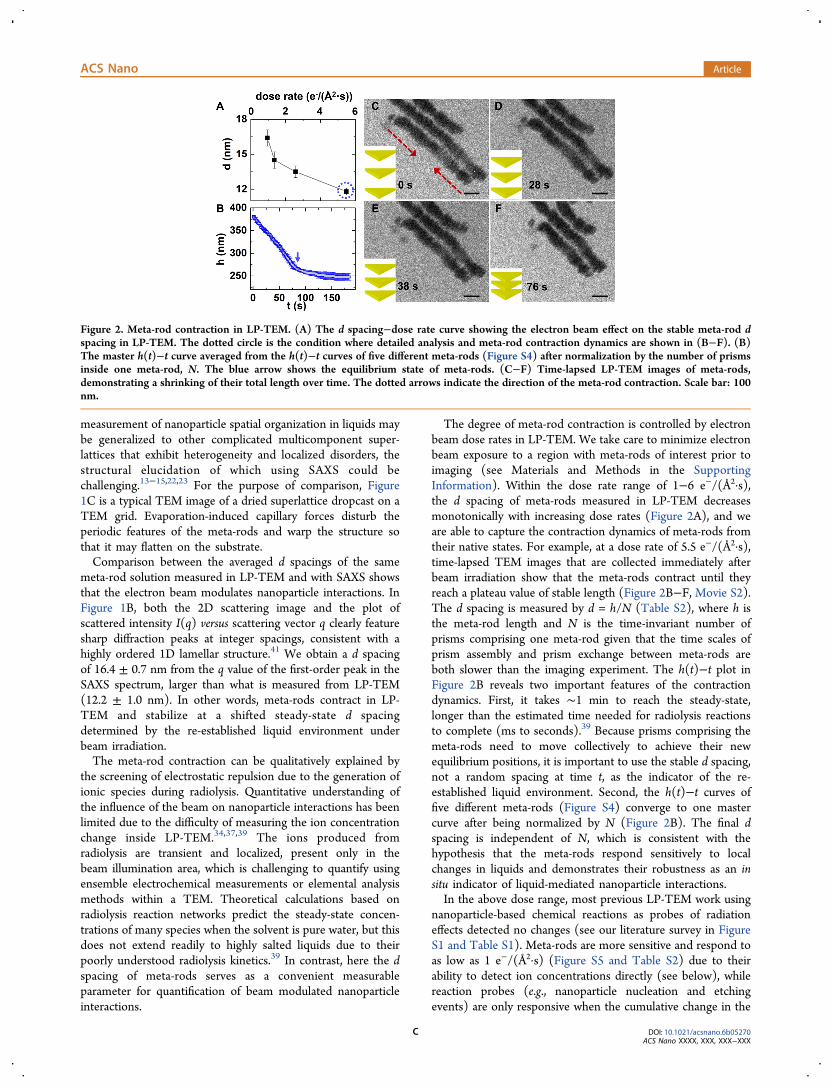
The monotonic decrease in the stable d spacing withincreasing dose rates is understood through theoreticalmodeling on nanoparticle interaction energetics and validatedby SAXS of meta-rods. The modeling accounts for the pairwiseinterparticle interactions for prisms aligned face-to-face,specifically the competition between van der Waals attraction(EvdW) and electrostatic repulsion (Eel, resulting from thecharged ligands on the prism surface). We assume constantsurface charge density on the prisms in the model for tworeasons: the ligands do not dissociate in the low dose rate rangeand stay fully deprotonated in the pH = 8 PBS buffer solution.Under these conditions, both interactions have analyticalexpressions (see Theory and Calculations in the SupportingInformation),41,47 and the stable d spacing is derived from theface-to-face configuration of prisms at the minimum totalinteraction energy (Etotal), as shown in Figure 3A. The prismsize does not change the stable d spacing position, but only themagnitude of the interaction energy minimum.
According to the model, the interprism interactions and thestable d spacing are dependent on material and liquidproperties that rely solely on two parameters that changeunder beam irradiation: the temperature of the liquid, thatdetermines thermal fluctuation and the values of physicalproperties, and the ionic strength of the liquid, that quantifiesthe electrostatic screening effect from solvated ions. Figure S6shows the total interaction energy as a function of liquidtemperature while keeping ionic strength constant (0.15 M PBSbuffer). The temperature range (25 to 60 °C) far exceeds thepredicted change in temperature caused by high energyelectron flux in LP-TEM experiments (a few Kelvins).48,49
Nevertheless, over the range of (overestimated) temperatures,the meta-rods are predicted to exhibit a negligible change in thed spacing albeit with more shallow energy minimums as thetemperature increases. Next, the total interaction energy map asa function of ionic strength at a fixed pH = 8 shows that the
calculated equilibrium d spacing steadily decreases as ionicstrength increases (Figure 3B, red line). This confirms that theinteractions directing the meta-rod assembly respond selec-tively to the local ionic strength. The calculated free-energyminimums are in the range of −10 to −50 kBT, strong enoughto hold the prisms against thermal fluctuation (Figure S7A).Following these predictions, we control the temperature and
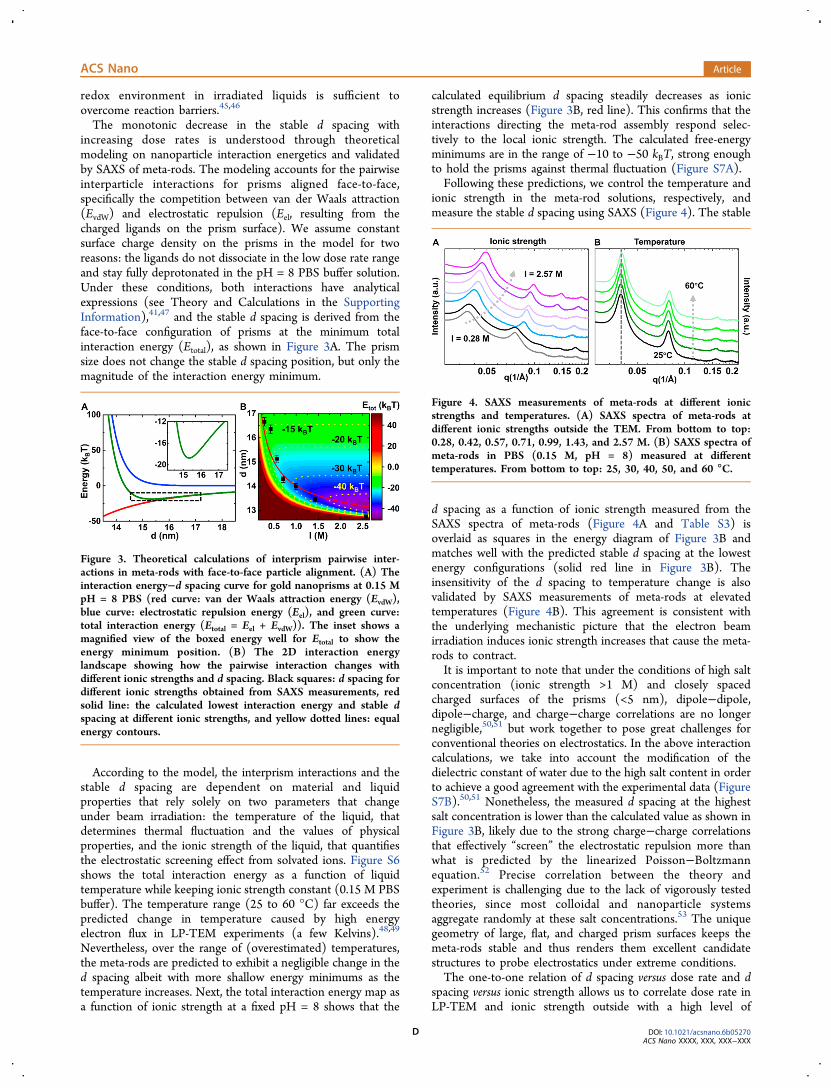
ionic strength in the meta-rod solutions, respectively, andmeasure the stable d spacing using SAXS (Figure 4). The stable
d spacing as a function of ionic strength measured from theSAXS spectra of meta-rods (Figure 4A and Table S3) isoverlaid as squares in the energy diagram of Figure 3B andmatches well with the predicted stable d spacing at the lowestenergy configurations (solid red line in Figure 3B). Theinsensitivity of the d spacing to temperature change is alsovalidated by SAXS measurements of meta-rods at elevatedtemperatures (Figure 4B). This agreement is consistent withthe underlying mechanistic picture that the electron beamirradiation induces ionic strength increases that cause the meta-rods to contract.It is important to note that under the conditions of high salt
concentration (ionic strength >1 M) and closely spacedcharged surfaces of the prisms (<5 nm), dipole−dipole,dipole−charge, and charge−charge correlations are no longernegligible,50,51 but work together to pose great challenges forconventional theories on electrostatics. In the above interactioncalculations, we take into account the modification of thedielectric constant of water due to the high salt content in orderto achieve a good agreement with the experimental data (FigureS7B).50,51 Nonetheless, the measured d spacing at the highestsalt concentration is lower than the calculated value as shown inFigure 3B, likely due to the strong charge−charge correlationsthat effectively “screen” the electrostatic repulsion more thanwhat is predicted by the linearized Poisson−Boltzmannequation.52 Precise correlation between the theory andexperiment is challenging due to the lack of vigorously testedtheories, since most colloidal and nanoparticle systemsaggregate randomly at these salt concentrations.53 The uniquegeometry of large, flat, and charged prism surfaces keeps themeta-rods stable and thus renders them excellent candidatestructures to probe electrostatics under extreme conditions.The one-to-one relation of d spacing versus dose rate and d
spacing versus ionic strength allows us to correlate dose rate inLP-TEM and ionic strength outside with a high level of
Figure 3. Theoretical calculations of interprism pairwise inter-actions in meta-rods with face-to-face particle alignment. (A) Theinteraction energy−d spacing curve for gold nanoprisms at 0.15 MpH = 8 PBS (red curve: van der Waals attraction energy (EvdW),blue curve: electrostatic repulsion energy (Eel), and green curve:total interaction energy (Etotal = Eel + EvdW)). The inset shows amagnified view of the boxed energy well for Etotal to show theenergy minimum position. (B) The 2D interaction energylandscape showing how the pairwise interaction changes withdifferent ionic strengths and d spacing. Black squares: d spacing fordifferent ionic strengths obtained from SAXS measurements, redsolid line: the calculated lowest interaction energy and stable dspacing at different ionic strengths, and yellow dotted lines: equalenergy contours.
Figure 4. SAXS measurements of meta-rods at different ionicstrengths and temperatures. (A) SAXS spectra of meta-rods atdifferent ionic strengths outside the TEM. From bottom to top:0.28, 0.42, 0.57, 0.71, 0.99, 1.43, and 2.57 M. (B) SAXS spectra ofmeta-rods in PBS (0.15 M, pH = 8) measured at differenttemperatures. From bottom to top: 25, 30, 40, 50, and 60 °C.
ACS Nano Article
DOI: 10.1021/acsnano.6b05270ACS Nano XXXX, XXX, XXX−XXX
D
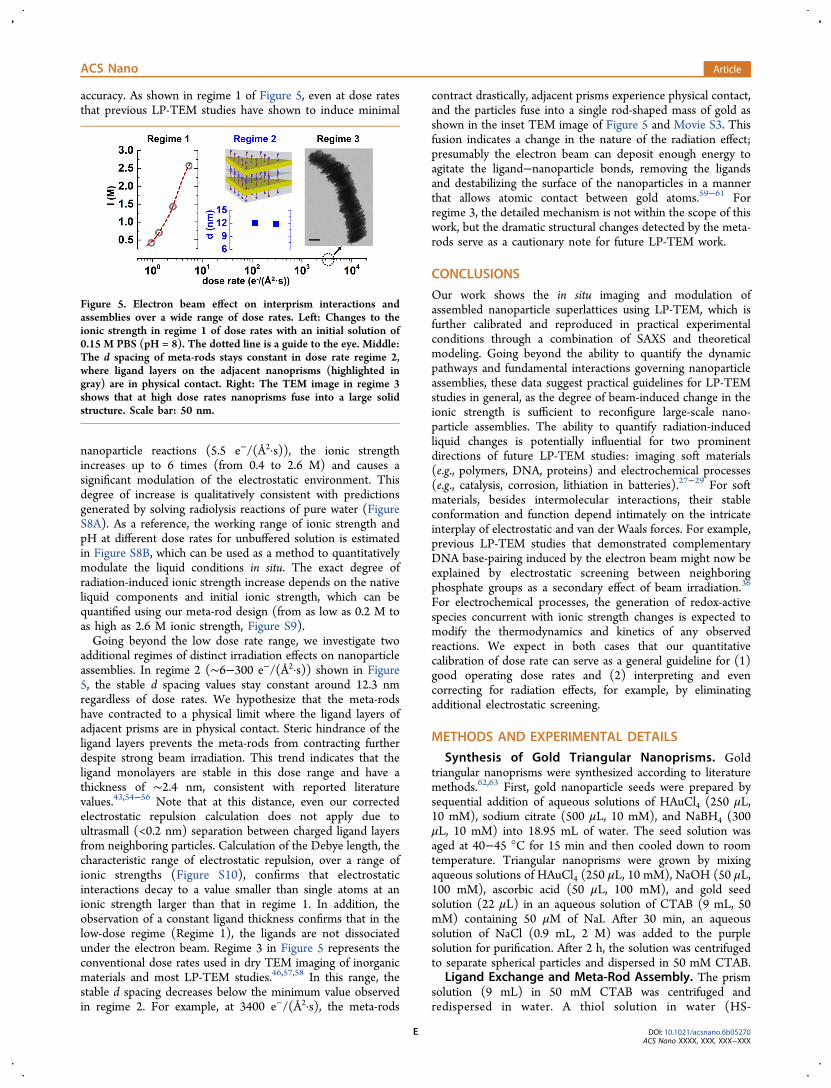
accuracy. As shown in regime 1 of Figure 5, even at dose ratesthat previous LP-TEM studies have shown to induce minimal
nanoparticle reactions (5.5 e−/(Å2·s)), the ionic strengthincreases up to 6 times (from 0.4 to 2.6 M) and causes asignificant modulation of the electrostatic environment. Thisdegree of increase is qualitatively consistent with predictionsgenerated by solving radiolysis reactions of pure water (FigureS8A). As a reference, the working range of ionic strength andpH at different dose rates for unbuffered solution is estimatedin Figure S8B, which can be used as a method to quantitativelymodulate the liquid conditions in situ. The exact degree ofradiation-induced ionic strength increase depends on the nativeliquid components and initial ionic strength, which can bequantified using our meta-rod design (from as low as 0.2 M toas high as 2.6 M ionic strength, Figure S9).Going beyond the low dose rate range, we investigate two
additional regimes of distinct irradiation effects on nanoparticleassemblies. In regime 2 (∼6−300 e−/(Å2·s)) shown in Figure5, the stable d spacing values stay constant around 12.3 nmregardless of dose rates. We hypothesize that the meta-rodshave contracted to a physical limit where the ligand layers ofadjacent prisms are in physical contact. Steric hindrance of theligand layers prevents the meta-rods from contracting furtherdespite strong beam irradiation. This trend indicates that theligand monolayers are stable in this dose range and have athickness of ∼2.4 nm, consistent with reported literaturevalues.43,54−56 Note that at this distance, even our correctedelectrostatic repulsion calculation does not apply due toultrasmall (<0.2 nm) separation between charged ligand layersfrom neighboring particles. Calculation of the Debye length, thecharacteristic range of electrostatic repulsion, over a range ofionic strengths (Figure S10), confirms that electrostaticinteractions decay to a value smaller than single atoms at anionic strength larger than that in regime 1. In addition, theobservation of a constant ligand thickness confirms that in thelow-dose regime (Regime 1), the ligands are not dissociatedunder the electron beam. Regime 3 in Figure 5 represents theconventional dose rates used in dry TEM imaging of inorganicmaterials and most LP-TEM studies.46,57,58 In this range, thestable d spacing decreases below the minimum value observedin regime 2. For example, at 3400 e−/(Å2·s), the meta-rods
contract drastically, adjacent prisms experience physical contact,and the particles fuse into a single rod-shaped mass of gold asshown in the inset TEM image of Figure 5 and Movie S3. Thisfusion indicates a change in the nature of the radiation effect;presumably the electron beam can deposit enough energy toagitate the ligand−nanoparticle bonds, removing the ligandsand destabilizing the surface of the nanoparticles in a mannerthat allows atomic contact between gold atoms.59−61 Forregime 3, the detailed mechanism is not within the scope of thiswork, but the dramatic structural changes detected by the meta-rods serve as a cautionary note for future LP-TEM work.
CONCLUSIONS
Our work shows the in situ imaging and modulation ofassembled nanoparticle superlattices using LP-TEM, which isfurther calibrated and reproduced in practical experimentalconditions through a combination of SAXS and theoreticalmodeling. Going beyond the ability to quantify the dynamicpathways and fundamental interactions governing nanoparticleassemblies, these data suggest practical guidelines for LP-TEMstudies in general, as the degree of beam-induced change in theionic strength is sufficient to reconfigure large-scale nano-particle assemblies. The ability to quantify radiation-inducedliquid changes is potentially influential for two prominentdirections of future LP-TEM studies: imaging soft materials(e.g., polymers, DNA, proteins) and electrochemical processes(e.g., catalysis, corrosion, lithiation in batteries).27−29 For softmaterials, besides intermolecular interactions, their stableconformation and function depend intimately on the intricateinterplay of electrostatic and van der Waals forces. For example,previous LP-TEM studies that demonstrated complementaryDNA base-pairing induced by the electron beam might now beexplained by electrostatic screening between neighboringphosphate groups as a secondary effect of beam irradiation.36
For electrochemical processes, the generation of redox-activespecies concurrent with ionic strength changes is expected tomodify the thermodynamics and kinetics of any observedreactions. We expect in both cases that our quantitativecalibration of dose rate can serve as a general guideline for (1)good operating dose rates and (2) interpreting and evencorrecting for radiation effects, for example, by eliminatingadditional electrostatic screening.
METHODS AND EXPERIMENTAL DETAILS
Synthesis of Gold Triangular Nanoprisms. Goldtriangular nanoprisms were synthesized according to literaturemethods.62,63 First, gold nanoparticle seeds were prepared bysequential addition of aqueous solutions of HAuCl4 (250 μL,10 mM), sodium citrate (500 μL, 10 mM), and NaBH4 (300μL, 10 mM) into 18.95 mL of water. The seed solution wasaged at 40−45 °C for 15 min and then cooled down to roomtemperature. Triangular nanoprisms were grown by mixingaqueous solutions of HAuCl4 (250 μL, 10 mM), NaOH (50 μL,100 mM), ascorbic acid (50 μL, 100 mM), and gold seedsolution (22 μL) in an aqueous solution of CTAB (9 mL, 50mM) containing 50 μM of NaI. After 30 min, an aqueoussolution of NaCl (0.9 mL, 2 M) was added to the purplesolution for purification. After 2 h, the solution was centrifugedto separate spherical particles and dispersed in 50 mM CTAB.
Ligand Exchange and Meta-Rod Assembly. The prismsolution (9 mL) in 50 mM CTAB was centrifuged andredispersed in water. A thiol solution in water (HS-
Figure 5. Electron beam effect on interprism interactions andassemblies over a wide range of dose rates. Left: Changes to theionic strength in regime 1 of dose rates with an initial solution of0.15 M PBS (pH = 8). The dotted line is a guide to the eye. Middle:The d spacing of meta-rods stays constant in dose rate regime 2,where ligand layers on the adjacent nanoprisms (highlighted ingray) are in physical contact. Right: The TEM image in regime 3shows that at high dose rates nanoprisms fuse into a large solidstructure. Scale bar: 50 nm.
ACS Nano Article
DOI: 10.1021/acsnano.6b05270ACS Nano XXXX, XXX, XXX−XXX
E
(CH2)11(OC2H4)6OCH2COOH) (44.6 μL, 7.93 mM) wasadded to the prism solution. After 30 min of incubation, 0.15 MPBS (pH = 8) was added to the prism solution. Blacksediments were observed after ∼15 h of incubation, whichindicates the formation of meta-rods.SAXS Measurement. Black sediments of meta-rods in
liquid were gently transferred to a quartz capillary tube. TheSAXS spectrum was measured using a home-built setup (ForvisTechnologies, Santa Barbara) composed of a Xenocs GeniX3DCuKα ultralow divergence X-ray source (1.54 Å/ 8 keV) with adivergence of ∼1.3 mrad and a Pilatus 300 K 20 Hz hybrid pixeldetector (Dectris). Ionic strength variation was achievedthrough changing the PBS (pH = 8) concentration.LP-TEM Imaging. A Protochips Poseidon 210 liquid flow
holder was used for LP-TEM imaging under a JEOL 2100 CryoTEM with a LaB6 emitter at 200 kV. A Gatan Ultrascan charge-coupled device camera with a 0.1 s exposure time per frame at arate of 1.3 fps was used for recording TEM movies. An aliquotof the meta-rods in PBS (0.15 M, pH = 8) was loaded on anoxygen plasma-cleaned SiNx microchip (window: 550 μm × 20μm, 150 nm spacer flow echip, Protochips) and assembled withthe top SiNx microchip (window: 550 μm × 20 μm) into theliquid holder. Electron dose rate control was achieved byvarying spot size and beam intensity.Theory and Calculations. The model considers the
competition between van der Waals attraction (EvdW) thatfavors smaller d spacing and electrostatic repulsion (Eel) thatprefers larger d spacing. The equilibrium d spacing is where thenet pairwise interaction energy (Etotal = Eel + EvdW) betweennearest-neighboring prisms aligned face-to-face reaches a stableminimum. We consider only pairwise interactions because thedecay lengths of both interactions (∼15 to 20 nm) are smallerthan the smallest possible distance between next nearest prisms.At high ionic strength (>1.0 M), ion−dipole correlation istaken into account for the electrostatic contribution to the totalinteraction energy.
ASSOCIATED CONTENT*S Supporting InformationThe Supporting Information is available free of charge on theACS Publications website at DOI: 10.1021/acsnano.6b05270.
Materials and methods, theory and calculations, FiguresS1−S10, and Tables S1−S5 (PDF)A synchronized movie including a LP-TEM movie (left)of meta-rods in PBS pH = 8 (0.15 M) solution stabilizedat a dose rate of 10 e−/(Å2·s) and the intensity profile(right, same notations as in Figure 1A) showing thealternating prisms and interstices, which does not changeas a function of time after stabilized. The real time isshown in the time stamp. The movie is played at 8 fps,6× real time. Scale bar: 50 nm (AVI)A LP-TEM movie showing the contraction of meta-rodsin PBS pH = 8 (0.15 M) from native states at a dose rateof 5.5 e−/(Å2·s). Contraction of meta-rods graduallyoccurs over 80 s. The movie is played at 10 fps, 8× realtime. Scale bar: 300 nm (AVI)A synchronized movie including a LP-TEM movie (left)showing meta-rods in PBS (0.15 M) at a dose rate of3400 e−/(Å2·s) and how the total length of the meta-rod(L1+L2) at the bottom of the movie changes with time.The real time is shown in the time stamp. The movie isplayed at 8 fps, 6× real time. The high-intensity beam
gives rise to a rapid contraction upon illumination beforethe movie acquisition. Gold nanoprisms are fusedtogether over time. Scale bar: 50 nm (AVI)
AUTHOR INFORMATIONCorresponding Author*E-mail: [email protected].
NotesThe authors declare no competing financial interest.
ACKNOWLEDGMENTSWe thank Matthew Kulzick, a senior scientist at BP and Prof.Jian-Min Zuo at the University of Illinois for helpful discussionson the manuscript. This work was supported by the U.S.Department of Energy, Office of Basic Energy Sciences,Division of Materials Sciences and Engineering under awardno. DE-FG02−07ER46471, through the Frederick SeitzMaterials Research Laboratory at the University of Illinois.M.R.J. acknowledges the Arnold and Mabel BeckmanFoundation for a postdoctoral fellowship.
REFERENCES(1) Poyser, C. L.; Czerniuk, T.; Akimov, A.; Diroll, B. T.; Gaulding,E. A.; Salasyuk, A. S.; Kent, A. J.; Yakovlev, D. R.; Bayer, M.; Murray,C. B. Coherent Acoustic Phonons in Colloidal SemiconductorNanocrystal Superlattices. ACS Nano 2016, 10, 1163−1169.(2) Saran, R.; Curry, R. Lead Sulphide Nanocrystal PhotodetectorTechnologies. Nat. Photonics 2016, 10, 81−92.(3) Konstantatos, G.; Sargent, E. H. Nanostructured Materials forPhoton Detection. Nat. Nanotechnol. 2010, 5, 391−400.(4) Tao, A.; Sinsermsuksakul, P.; Yang, P. Tunable PlasmonicLattices of Silver Nanocrystals. Nat. Nanotechnol. 2007, 2, 435−440.(5) Young, K. L.; Ross, M. B.; Blaber, M. G.; Rycenga, M.; Jones, M.R.; Zhang, C.; Senesi, A. J.; Lee, B.; Schatz, G. C.; Mirkin, C. A. UsingDNA to Design Plasmonic Metamaterials with Tunable OpticalProperties. Adv. Mater. 2014, 26, 653−659.(6) Fan, J. A.; Wu, C.; Bao, K.; Bao, J.; Bardhan, R.; Halas, N. J.;Manoharan, V. N.; Nordlander, P.; Shvets, G.; Capasso, F. Self-Assembled Plasmonic Nanoparticle Clusters. Science 2010, 328, 1135−1138.(7) Talapin, D. V.; Lee, J.-S.; Kovalenko, M. V.; Shevchenko, E. V.Prospects of Colloidal Nanocrystals for Electronic and OptoelectronicApplications. Chem. Rev. 2010, 110, 389−458.(8) Dong, A.; Jiao, Y.; Milliron, D. J. Electronically CoupledNanocrystal Superlattice Films by In Situ Ligand Exchange at theLiquid−Air Interface. ACS Nano 2013, 7, 10978−10984.(9) Kagan, C. R.; Murray, C. B. Charge Transport in StronglyCoupled Quantum Dot Solids. Nat. Nanotechnol. 2015, 10, 1013−1026.(10) Yamada, Y.; Tsung, C.-K.; Huang, W.; Huo, Z.; Habas, S. E.;Soejima, T.; Aliaga, C. E.; Somorjai, G. A.; Yang, P. NanocrystalBilayer for Tandem Catalysis. Nat. Chem. 2011, 3, 372−376.(11) Kang, Y.; Ye, X.; Chen, J.; Qi, L.; Diaz, R. E.; Doan-Nguyen, V.;Xing, G.; Kagan, C. R.; Li, J.; Gorte, R. J.; Stach, E. A.; Murray, C. B.Engineering Catalytic Contacts and Thermal Stability: Gold/IronOxide Binary Nanocrystal Superlattices for CO Oxidation. J. Am.Chem. Soc. 2013, 135, 1499−1505.(12) Cheon, J.; Park, J.-I.; Choi, J.-S.; Jun, Y.-W.; Kim, S.; Kim, M. G.;Kim, Y.-M.; Kim, Y. J. Magnetic Superlattices and Their NanoscalePhase Transition Effects. Proc. Natl. Acad. Sci. U. S. A. 2006, 103,3023−3027.(13) Zhang, Y.; Pal, S.; Srinivasan, B.; Vo, T.; Kumar, S.; Gang, O.Selective Transformations between Nanoparticle Superlattices via theReprogramming of DNA-Mediated Interactions. Nat. Mater. 2015, 14,840−847.
ACS Nano Article
DOI: 10.1021/acsnano.6b05270ACS Nano XXXX, XXX, XXX−XXX
F
(14) Zhao, Y.; Thorkelsson, K.; Mastroianni, A. J.; Schilling, T.;Luther, J. M.; Rancatore, B. J.; Matsunaga, K.; Jinnai, H.; Wu, Y.;Poulsen, D.; Frechet, J. M. J.; Paul Alivisatos, A.; Xu, T. Small-Molecule-Directed Nanoparticle Assembly towards Stimuli-ResponsiveNanocomposites. Nat. Mater. 2009, 8, 979−985.(15) Kim, Y.; Macfarlane, R. J.; Jones, M. R.; Mirkin, C. A.Transmutable Nanoparticles with Reconfigurable Surface Ligands.Science 2016, 351, 579−582.(16) Gerling, T.; Wagenbauer, K. F.; Neuner, A. M.; Dietz, H.Dynamic DNA Devices and Assemblies Formed by Shape-Complementary, Non−Base Pairing 3D Components. Science 2015,347, 1446−1452.(17) Grzelczak, M.; Vermant, J.; Furst, E. M.; Liz-Marzan, L. M.Directed Self-Assembly of Nanoparticles. ACS Nano 2010, 4, 3591−3605.(18) Bishop, K. J. M.; Wilmer, C. E.; Soh, S.; Grzybowski, B. A.Nanoscale Forces and Their Uses in Self-Assembly. Small 2009, 5,1600−1630.(19) Silvera Batista, C. A.; Larson, R. G.; Kotov, N. A. Nonadditivityof Nanoparticle Interactions. Science 2015, 350, 1242477.(20) Min, Y.; Akbulut, M.; Kristiansen, K.; Golan, Y.; Israelachvili, J.The Role of Interparticle and External Forces in NanoparticleAssembly. Nat. Mater. 2008, 7, 527−538.(21) French, R. H.; Parsegian, V. A.; Podgornik, R.; Rajter, R. F.;Jagota, A.; Luo, J.; Asthagiri, D.; Chaudhury, M. K.; Chiang, Y.-M.;Granick, S.; Kalinin, S.; Kardar, M.; Kjellander, R.; Langreth, D. C.;Lewis, J.; Lustig, S.; Wesolowski, D.; Wettlaufer, J. S.; Ching, W.-Y.;Finnis, M.; et al. Long Range Interactions in Nanoscale Science. Rev.Mod. Phys. 2010, 82, 1887−1944.(22) Lu, F.; Yager, K. G.; Zhang, Y.; Xin, H.; Gang, O. SuperlatticesAssembled through Shape-Induced Directional Binding. Nat. Commun.2015, 6, 6912.(23) Li, T.; Senesi, A. J.; Lee, B. Small Angle X-Ray Scattering forNanoparticle Research. Chem. Rev. 2016, 116, 11128.(24) Park, J.; Elmlund, H.; Ercius, P.; Yuk, J. M.; Limmer, D. T.;Chen, Q.; Kim, K.; Han, S. H.; Weitz, D. A.; Zettl, A.; Alivisatos, A. P.3D Structure of Individual Nanocrystals in Solution by ElectronMicroscopy. Science 2015, 349, 290−295.(25) Smeets, P. J. M.; Cho, K. R.; Kempen, R. G. E.; Sommerdijk, N.A. J. M.; De Yoreo, J. J. Calcium Carbonate Nucleation Driven by IonBinding in a Biomimetic Matrix Revealed by In Situ ElectronMicroscopy. Nat. Mater. 2015, 14, 394−399.(26) Chen, Q.; Smith, J. M.; Park, J.; Kim, K.; Ho, D.; Rasool, H. I.;Zettl, A.; Alivisatos, A. P. 3D Motion of DNA-Au Nanoconjugates inGraphene Liquid Cell Electron Microscopy. Nano Lett. 2013, 13,4556−4561.(27) Ramachandramoorthy, R.; Bernal, R.; Espinosa, H. D. Pushingthe Envelope of In Situ Transmission Electron Microscopy. ACS Nano2015, 9, 4675−4685.(28) De Yoreo, J. J.; Sommerdijk, N. A. J. M. Investigating MaterialsFormation with Liquid-Phase and Cryogenic TEM. Nat. Rev. Mater.2016, 1, 16035.(29) Ross, F. M. Opportunities and Challenges in Liquid CellElectron Microscopy. Science 2015, 350, aaa9886.(30) Liao, H.-G.; Zherebetskyy, D.; Xin, H.; Czarnik, C.; Ercius, P.;Elmlund, H.; Pan, M.; Wang, L.-W.; Zheng, H. Facet DevelopmentDuring Platinum Nanocube Growth. Science 2014, 345, 916−919.(31) Peckys, D. B.; Baudoin, J.-P.; Eder, M.; Werner, U.; de Jonge, N.Epidermal Growth Factor Receptor Subunit Locations Determined inHydrated Cells with Environmental Scanning Electron Microscopy.Sci. Rep. 2013, 3, 2626.(32) Welch, D. A.; Woehl, T. J.; Park, C.; Faller, R.; Evans, J. E.;Browning, N. D. Understanding the Role of Solvation Forces on thePreferential Attachment of Nanoparticles in Liquid. ACS Nano 2016,10, 181−187.(33) Park, J.; Zheng, H.; Lee, W. C.; Geissler, P. L.; Rabani, E.;Alivisatos, A. P. Direct Observation of Nanoparticle SuperlatticeFormati on by Using Liquid Cell Transmission Electron Microscopy.ACS Nano 2012, 6, 2078−2085.
(34) Liu, Y.; Lin, X.-M.; Sun, Y.; Rajh, T. In Situ Visualization of Self-Assembly of Charged Gold Nanoparticles. J. Am. Chem. Soc. 2013, 135,3764−3767.(35) Grogan, J. M.; Rotkina, L.; Bau, H. H. In Situ Liquid-CellElectron Microscopy of Colloid Aggregation and Growth Dynamics.Phys. Rev. E 2011, 83, 061405.(36) Keskin, S.; Besztejan, S.; Kassier, G.; Manz, S.; Bucker, R.;Riekeberg, S.; Trieu, H. K.; Rentmeister, A.; Miller, R. J. D.Visualization of Multimerization and Self-Assembly of DNA-Function-alized Gold Nanoparticles Using In-Liquid Transmission ElectronMicroscopy. J. Phys. Chem. Lett. 2015, 6, 4487−4492.(37) Chen, Q.; Cho, H.; Manthiram, K.; Yoshida, M.; Ye, X.;Alivisatos, A. P. Interaction Potentials of Anisotropic Nanocrystalsfrom the Trajectory Sampling of Particle Motion Using In Situ LiquidPhase Transmission Electron Microscopy. ACS Cent. Sci. 2015, 1, 33−39.(38) Sutter, E.; Sutter, P.; Tkachenko, A. V.; Krahne, R.; de Graaf, J.;Arciniegas, M.; Manna, L. In Situ Microscopy of the Self-Assembly ofBranched Nanocrystals in Solution. Nat. Commun. 2016, 7, 11213.(39) Grogan, J. M.; Schneider, N. M.; Ross, F. M.; Bau, H. H. Bubbleand Pattern Formation in Liquid Induced by an Electron Beam. NanoLett. 2014, 14, 359−364.(40) Henderson, R. The Potential and Limitations of Neutrons,Electrons and X-Rays for Atomic Resolution Microscopy of UnstainedBiological Molecules. Q. Rev. Biophys. 1995, 28, 171−193.(41) Young, K. L.; Jones, M. R.; Zhang, J.; Macfarlane, R. J.; Esquivel-Sirvent, R.; Nap, R. J.; Wu, J.; Schatz, G. C.; Lee, B.; Mirkin, C. A.Assembly of Reconfigurable One-Dimensional Colloidal Superlatticesdue to a Synergy of Fundamental Nanoscale Forces. Proc. Natl. Acad.Sci. U. S. A. 2012, 109, 2240−2245.(42) Millstone, J. E.; Park, S.; Shuford, K. L.; Qin, L.; Schatz, G. C.;Mirkin, C. A. Observation of a Quadrupole Plasmon Mode for aColloidal Solution of Gold Nanoprisms. J. Am. Chem. Soc. 2005, 127,5312−5313.(43) Jones, M. R.; Macfarlane, R. J.; Prigodich, A. E.; Patel, P. C.;Mirkin, C. A. Nanoparticle Shape Anisotropy Dictates the CollectiveBehavior of Surface-Bound Ligands. J. Am. Chem. Soc. 2011, 133,18865−18869.(44) Leary, R. K.; Kumar, A.; Straney, P. J.; Collins, S. M.; Yazdi, S.;Dunin-Borkowski, R. E.; Midgley, P. A.; Millstone, J. E.; Ringe, E.Structural and Optical Properties of Discrete Dendritic Pt Nano-particles on Colloidal Au Nanoprisms. J. Phys. Chem. C 2016, 120,20843−20851.(45) Sutter, E. A.; Sutter, P. W. Determination of Redox ReactionRates and Orders by In Situ Liquid Cell Electron Microscopy of Pdand Au Solution Growth. J. Am. Chem. Soc. 2014, 136, 16865−16870.(46) Wu, J.; Gao, W.; Wen, J.; Miller, D. J.; Lu, P.; Zuo, J.-M.; Yang,H. Growth of Au on Pt Icosahedral Nanoparticles Revealed by Low-Dose In Situ TEM. Nano Lett. 2015, 15, 2711−2715.(47) Walker, D. A.; Browne, K. P.; Kowalczyk, B.; Grzybowski, B. A.Self-Assembly of Nanotriangle Superlattices Facilitated by RepulsiveElectrostatic Interactions. Angew. Chem., Int. Ed. 2010, 49, 6760−6763.(48) Zheng, H.; Claridge, S. A.; Minor, A. M.; Alivisatos, A. P.;Dahmen, U. Nanocrystal Diffusion in a Liquid Thin Film Observed byIn Situ Transmission Electron Microscopy. Nano Lett. 2009, 9, 2460−2465.(49) White, E. R.; Mecklenburg, M.; Shevitski, B.; Singer, S. B.;Regan, B. C. Charged Nanoparticle Dynamics in Water Induced byScanning Transmission Electron Microscopy. Langmuir 2012, 28,3695−3698.(50) Levy, A.; Andelman, D.; Orland, H. Dielectric Constant of IonicSolutions: A Field-Theory Approach. Phys. Rev. Lett. 2012, 108,227801.(51) Levy, A.; Andelman, D.; Orland, H. Dipolar Poisson-BoltzmannApproach to Ionic Solutions: A Mean Field and Loop ExpansionAnalysis. J. Chem. Phys. 2013, 139, 164909.(52) Guldbrand, L.; Jonsson, B.; Wennerstrom, H.; Linse, P.Electrical Double Layer Forces. A Monte Carlo Study. J. Chem. Phys.1984, 80, 2221−2228.
ACS Nano Article
DOI: 10.1021/acsnano.6b05270ACS Nano XXXX, XXX, XXX−XXX
G
(53) Meakin, P. Formation of Fractal Clusters and Networks byIrreversible Diffusion-Limited Aggregation. Phys. Rev. Lett. 1983, 51,1119−1122.(54) Pale-Grosdemange, C.; Simon, E. S.; Prime, K. L.; Whitesides,G. M. Formation of Self-Assembled Monolayers by Chemisorption ofDerivatives of Oligo(ethylene glycol) of Structure HS-(CH2)11(OCH2CH2)mOH on Gold. J. Am. Chem. Soc. 1991, 113,12−20.(55) Harder, P.; Grunze, M.; Dahint, R.; Whitesides, G. M.; Laibinis,P. E. Molecular Conformation in Oligo(ethylene glycol)-TerminatedSelf-Assembled Monolayers on Gold and Silver Surfaces DeterminesTheir Ability to Resist Protein Adsorption. J. Phys. Chem. B 1998, 102,426−436.(56) Lee, J. K.; Kim, Y.-G.; Chi, Y. S.; Yun, W. S.; Choi, I. S. GraftingNitrilotriacetic Groups onto Carboxylic Acid-Terminated Self-Assembled Monolayers on Gold Surfaces for Immobilization ofHistidine-Tagged Proteins. J. Phys. Chem. B 2004, 108, 7665−7673.(57) Zheng, H.; Smith, R. K.; Jun, Y.-W.; Kisielowski, C.; Dahmen,U.; Alivisatos, A. P. Observation of Single Colloidal PlatinumNanocrystal Growth Trajectories. Science 2009, 324, 1309−1312.(58) Lu, J.; Aabdin, Z.; Anand, U.; Mirsaidov, U. Effect of ElectronBeam on Nanoparticle Dynamics in Solution During In Situ TEMObservation. Microsc. Microanal. 2015, 21, 257−258.(59) Egerton, R. F. Control of Radiation Damage in the TEM.Ultramicroscopy 2013, 127, 100−108.(60) Zan, R.; Ramasse, Q. M.; Jalil, R.; Georgiou, T.; Bangert, U.;Novoselov, K. S. Control of Radiation Damage in MoS2 by GrapheneEncapsulation. ACS Nano 2013, 7, 10167−10174.(61) Niu, K.-Y.; Liao, H.-G.; Zheng, H. Visualization of theCoalescence of Bismuth Nanoparticles. Microsc. Microanal. 2014, 20,416−424.(62) Jones, M. R.; Mirkin, C. A. Bypassing the Limitations ofClassical Chemical Purification with DNA-Programmable Nano-particle Recrystallization. Angew. Chem., Int. Ed. 2013, 52, 2886−2891.(63) O’Brien, M. N.; Jones, M. R.; Kohlstedt, K. L.; Schatz, G. C.;Mirkin, C. A. Uniform Circular Disks with Synthetically TailorableDiameters: Two-Dimensional Nanoparticles for Plasmonics. NanoLett. 2015, 15, 1012−1017.
ACS Nano Article
DOI: 10.1021/acsnano.6b05270ACS Nano XXXX, XXX, XXX−XXX
H