Harry G. Kwatny - Drexel Universityhgk22/courses/MEM361/MEM361-Lecture4a.pdf · Harry G. Kwatny...
21
ENGINEERING RELIABILITY DIAGRAMS FAULT TREES FAULT TREE DEFINITION QUALITATIVE ANALYSIS LOGIC CUT SETS QUANTITATIVE ANALYSIS CUT SET &TOP EVENT PROBABILITIES BASIC EVENT PROBABILITY SUMMARY E NGINEERING R ELIABILITY FAULT TREES AND RELIABILITY BLOCK DIAGRAMS Harry G. Kwatny Department of Mechanical Engineering & Mechanics Drexel University
-
Upload
duongthuan -
Category
Documents
-
view
222 -
download
0
Transcript of Harry G. Kwatny - Drexel Universityhgk22/courses/MEM361/MEM361-Lecture4a.pdf · Harry G. Kwatny...

ENGINEERINGRELIABILITY
DIAGRAMS
FAULT TREES
FAULT TREE
DEFINITION
QUALITATIVE
ANALYSIS
LOGIC
CUT SETS
QUANTITATIVE
ANALYSIS
CUT SET & TOP
EVENT
PROBABILITIES
BASIC EVENT
PROBABILITY
SUMMARY
ENGINEERING RELIABILITYFAULT TREES AND RELIABILITY BLOCK DIAGRAMS
Harry G. Kwatny
Department of Mechanical Engineering & MechanicsDrexel University

ENGINEERINGRELIABILITY
DIAGRAMS
FAULT TREES
FAULT TREE
DEFINITION
QUALITATIVE
ANALYSIS
LOGIC
CUT SETS
QUANTITATIVE
ANALYSIS
CUT SET & TOP
EVENT
PROBABILITIES
BASIC EVENT
PROBABILITY
SUMMARY
OUTLINE
DIAGRAMS
FAULT TREESFault Tree DefinitionQualitative Analysis
LogicCut Sets
Quantitative AnalysisCut Set & Top Event ProbabilitiesBasic Event Probability
SUMMARY

ENGINEERINGRELIABILITY
DIAGRAMS
FAULT TREES
FAULT TREE
DEFINITION
QUALITATIVE
ANALYSIS
LOGIC
CUT SETS
QUANTITATIVE
ANALYSIS
CUT SET & TOP
EVENT
PROBABILITIES
BASIC EVENT
PROBABILITY
SUMMARY
INTRODUCTION
We will be concerned with how the structure of a systemaffects its reliability. We consider the two graphicalrepresentations of systems used for reliability analysis:
I Fault Tree –I The fault tree shows all possible combinations of failure events that
may cause a specific system failure.I Fault trees are constructed by considering deductively what caused
the failure.I Component failures and other events are combined through logical
‘AND’ (∩) and ‘OR’ (∪) operations to provide a logical description ofthe failure.
I Reliability Block Diagram –I A reliability block block diagram shows how the functioning of
components or subsystems enable the satisfaction of a specificsystem function.
I These diagrams facilitate the computation of reliability indices andelucidate the role of redundancy.

ENGINEERINGRELIABILITY
DIAGRAMS
FAULT TREES
FAULT TREE
DEFINITION
QUALITATIVE
ANALYSIS
LOGIC
CUT SETS
QUANTITATIVE
ANALYSIS
CUT SET & TOP
EVENT
PROBABILITIES
BASIC EVENT
PROBABILITY
SUMMARY
FAULT TREE ANALYSIS
I Fault tree analysis (FTA) is a top-down approach tofailure analysis, starting with a possible failure event,called a TOP event, and then determining the ways itcan happen.
I The analysis proceeds by determining how the TOPevent is caused by lower level failure events.
I The primitive or basic failure events that ultimatelycause the TOP event are connected through logicalAND-gates and OR-gates.

ENGINEERINGRELIABILITY
DIAGRAMS
FAULT TREES
FAULT TREE
DEFINITION
QUALITATIVE
ANALYSIS
LOGIC
CUT SETS
QUANTITATIVE
ANALYSIS
CUT SET & TOP
EVENT
PROBABILITIES
BASIC EVENT
PROBABILITY
SUMMARY
SOME HISTORY OF FAULT TREE ANALYSIS
I FTA was first used by Bell Labs in connection with thesafety analysis of the Minuteman missile launch controlsystem in 1961.
I Boeing further developed the technique, applying it tothe entire Minuteman system and then to commercialaircraft.
I Boeing applied FTA as part of a comprehensive safetyreview of the Apollo system following the launch padfire on January 27, 1967.
I FTA was used in the WASH-1400 study (1976)conducted to review nuclear plant power design and toassure the public that the probability of nuclearaccidents was very small. The 3-mile island accidentoccurred March 28, 1979.

ENGINEERINGRELIABILITY
DIAGRAMS
FAULT TREES
FAULT TREE
DEFINITION
QUALITATIVE
ANALYSIS
LOGIC
CUT SETS
QUANTITATIVE
ANALYSIS
CUT SET & TOP
EVENT
PROBABILITIES
BASIC EVENT
PROBABILITY
SUMMARY
EXAMPLE: POWER SUPPLY
The power supply system consists of the followingelements:
I an offsite power supplyI a backup power system, containing
I A diesel driven generator,I An automatic transfer switch.

ENGINEERINGRELIABILITY
DIAGRAMS
FAULT TREES
FAULT TREE
DEFINITION
QUALITATIVE
ANALYSIS
LOGIC
CUT SETS
QUANTITATIVE
ANALYSIS
CUT SET & TOP
EVENT
PROBABILITIES
BASIC EVENT
PROBABILITY
SUMMARY
EXAMPLE: POWER SUPPLY – 2
I the system ‘fails’ upon blackout – when power is not availableI blackout occurs when both off-site power and backup power
failI the diagram is developed from the top down terminating at
‘basic’ failure events
Blackout
1
Backup Power
Loss
Off-Site Power
Loss
2
Transfer Switch
Failure
Deisel-
Generator
Failure
3
AND Gate
OR Gate
Description
Basic input
event
Input event not
fully developed;
treated as basic

ENGINEERINGRELIABILITY
DIAGRAMS
FAULT TREES
FAULT TREE
DEFINITION
QUALITATIVE
ANALYSIS
LOGIC
CUT SETS
QUANTITATIVE
ANALYSIS
CUT SET & TOP
EVENT
PROBABILITIES
BASIC EVENT
PROBABILITY
SUMMARY
EXAMPLE: FIRE PUMP SYSTEM
I The fire pump system shown below has two pumpsdriven by a single engine.
I the TOP failure event is the failure to supply water tothe fire hose.
EngineFire
Pump
2
Fire
Pump
1
Valve
VF
No water
from system
No water
from either
pump
Valve failure
No water
from pump 1
No water
from pump 2
Pump 1
failureEngine failure
FP
1EF
Pump 2
failureEngine failure
FP
2EF

ENGINEERINGRELIABILITY
DIAGRAMS
FAULT TREES
FAULT TREE
DEFINITION
QUALITATIVE
ANALYSIS
LOGIC
CUT SETS
QUANTITATIVE
ANALYSIS
CUT SET & TOP
EVENT
PROBABILITIES
BASIC EVENT
PROBABILITY
SUMMARY
FAULT TREE LOGIC
In the fault tree shown below primary faults appear multiple times– this is typical of redundant systems.
A
E2
E1
T
E4
E3
B
C
C A B
The following logical expression defines the tree:
T = E1 ∩ E2 = (A ∪ E3) ∩ (C ∪ E4)= (A ∪ (B ∪ C)) ∩ (C ∪ (A ∩ B))

ENGINEERINGRELIABILITY
DIAGRAMS
FAULT TREES
FAULT TREE
DEFINITION
QUALITATIVE
ANALYSIS
LOGIC
CUT SETS
QUANTITATIVE
ANALYSIS
CUT SET & TOP
EVENT
PROBABILITIES
BASIC EVENT
PROBABILITY
SUMMARY
RULES OF BOOLEAN ALGEBRA
The following logical relationships are identical tocorresponding set relationships that can be derived from theVenn diagram.
Expression DescriptionX ∩ Y = Y ∩ X Commutative LawX ∪ Y = Y ∪ XX ∩ (Y ∩ Z) = (X ∩ Y) ∩ Z Associative LawX ∪ (Y ∪ Z) = (X ∪ Y) ∪ ZX ∩ (Y ∪ Z) = (X ∩ Y) ∪ (X ∩ Z) Distributive LawX ∪ (Y ∩ Z) = (X ∪ Y) ∩ (X ∪ Z)(X ∩ Y)c = Xc ∪ Yc de Morgan’s Law(X ∪ Y)c = Xc ∩ Yc

ENGINEERINGRELIABILITY
DIAGRAMS
FAULT TREES
FAULT TREE
DEFINITION
QUALITATIVE
ANALYSIS
LOGIC
CUT SETS
QUANTITATIVE
ANALYSIS
CUT SET & TOP
EVENT
PROBABILITIES
BASIC EVENT
PROBABILITY
SUMMARY
FAULT TREE LOGIC – 2
Using the Boolean logic rules, the expression for T can bereduced to:
T = C ∪ (A ∩ B)
This corresponds to the simplified fault tree shown below.
T
A BC
A B

ENGINEERINGRELIABILITY
DIAGRAMS
FAULT TREES
FAULT TREE
DEFINITION
QUALITATIVE
ANALYSIS
LOGIC
CUT SETS
QUANTITATIVE
ANALYSIS
CUT SET & TOP
EVENT
PROBABILITIES
BASIC EVENT
PROBABILITY
SUMMARY
CUT SETS
Definitions:I A cut set is a set of basic events whose simultaneous
occurrence insures that the TOP event occurs.I A cut set is minimal if it cannot be reduced without
losing its status as a cut set.Notes:
I The TOP event will occur if the basic events in aminimal cut set occur at the same time.
I The minimal cut sets describe the combinations ofevents that cause the TOP event to occur.

ENGINEERINGRELIABILITY
DIAGRAMS
FAULT TREES
FAULT TREE
DEFINITION
QUALITATIVE
ANALYSIS
LOGIC
CUT SETS
QUANTITATIVE
ANALYSIS
CUT SET & TOP
EVENT
PROBABILITIES
BASIC EVENT
PROBABILITY
SUMMARY
EXAMPLES OF CUT SETS
EXAMPLE (POWER SUPPLY SYSTEM)I cut sets
{1, 2, 3} , {1, 2} , {1, 3}
I minimal cut sets{1, 2} , {1, 3}
EXAMPLE (FIRE PUMP SYSTEM)I cut sets
{VF, EF, FP1, FP2} , {VF, EF, FP1} , {VF, EF, FP2} , {VF, EF} ,{VF, FP1} , {VF, FP2} , {EF, FP1} , {EF, FP2} , {FP1, FP2} , {VF} , {EF}
I minimal cut sets{VF} , {EF} , {FP1, FP2}

ENGINEERINGRELIABILITY
DIAGRAMS
FAULT TREES
FAULT TREE
DEFINITION
QUALITATIVE
ANALYSIS
LOGIC
CUT SETS
QUANTITATIVE
ANALYSIS
CUT SET & TOP
EVENT
PROBABILITIES
BASIC EVENT
PROBABILITY
SUMMARY
FAULT TREE NORMAL FORMS
Note:I Conjunction: logical propositions connected by AND
I Disjunction: logical propositions connected by OR
Logic Expression Normal Forms:I Conjunction Normal Form (CNF) a logical formula which is a conjunction of
disjunctive clausesA, A ∩ B, (A ∪ B) ∩ C
I Disjunctive Normal Form (DNF) a logical formula which is a disjunction ofconjunctive clauses
A, A ∪ B, (A ∩ B) ∪ C
If the minimal cut sets of a fault tree are identified, the logicalexpression defining the tree can be expresses in DNF.
EXAMPLE (FIRE PUMP SYSTEM)
T = VF ∪ EF ∪ (FP1 ∩ FP2)

ENGINEERINGRELIABILITY
DIAGRAMS
FAULT TREES
FAULT TREE
DEFINITION
QUALITATIVE
ANALYSIS
LOGIC
CUT SETS
QUANTITATIVE
ANALYSIS
CUT SET & TOP
EVENT
PROBABILITIES
BASIC EVENT
PROBABILITY
SUMMARY
EXAMPLE: FIRE PUMP REDUCED FAULT TREE
VF
No water
from system
No water
from either
pump
Valve failure
No water
from pump 1
No water
from pump 2
Pump 1
failureEngine failure
FP
1EF
Pump 2
failureEngine failure
FP
2EF
VF
No water
from system
Both pumps
failedValve failure
Pump 2
failure
FP
2
Pump 1
failure
FP
1
Engine failure
EF

ENGINEERINGRELIABILITY
DIAGRAMS
FAULT TREES
FAULT TREE
DEFINITION
QUALITATIVE
ANALYSIS
LOGIC
CUT SETS
QUANTITATIVE
ANALYSIS
CUT SET & TOP
EVENT
PROBABILITIES
BASIC EVENT
PROBABILITY
SUMMARY
SETUP
Definitions:I Ei (t) denotes that the ith component (or event) is in a
failed state at time t.I A minimal cut set is said to fail (or be in a failed state)
when all of its basic events are in a failed state at thesame time.
Notation:I Q0 (t) = probability that TOP event occurs (is true) at
time t.I qi (t) = probability that basic event i occurs (is true) at
time t.I
^
Qj (t) = probability that the minimal cut set j occurs (istrue) at time t.

ENGINEERINGRELIABILITY
DIAGRAMS
FAULT TREES
FAULT TREE
DEFINITION
QUALITATIVE
ANALYSIS
LOGIC
CUT SETS
QUANTITATIVE
ANALYSIS
CUT SET & TOP
EVENT
PROBABILITIES
BASIC EVENT
PROBABILITY
SUMMARY
SINGLE AND-GATE
TOP
E2 occurs
E2
E1 occurs
E1
S
E2
E1
When the basic events are independent, the TOP eventprobability is:
Q0 (t) = P (E1 (t) ∩ E2 (t)) = P (E1 (t)) P (E2 (t)) = q1 (t) q2 (t)
For a single AND-gate with m basic events:
Q0 (t) =m∏
i=1
qi (t)

ENGINEERINGRELIABILITY
DIAGRAMS
FAULT TREES
FAULT TREE
DEFINITION
QUALITATIVE
ANALYSIS
LOGIC
CUT SETS
QUANTITATIVE
ANALYSIS
CUT SET & TOP
EVENT
PROBABILITIES
BASIC EVENT
PROBABILITY
SUMMARY
SINGLE OR-GATE
TOP
E2 occurs
E2
E1 occurs
E1
S
E2
E1
When the basic events are independent, the TOP eventprobability is:
Q0 (t) = P (E1 (t) ∪ E2 (t)) = P (E1 (t)) + P (E2 (t))− P (E1 (t) ∩ E2 (t))= q1 (t) + q2 (t)− q1 (t) q2 (t) = 1− (1− q1 (t)) (1− q2 (t))
For a single OR-gate with m basic events:
Q0 (t) = 1−m∏
i=1
(1− qi (t))
ENGINEERINGRELIABILITY
DIAGRAMS
FAULT TREES
FAULT TREE
DEFINITION
QUALITATIVE
ANALYSIS
LOGIC
CUT SETS
QUANTITATIVE
ANALYSIS
CUT SET & TOP
EVENT
PROBABILITIES
BASIC EVENT
PROBABILITY
SUMMARY
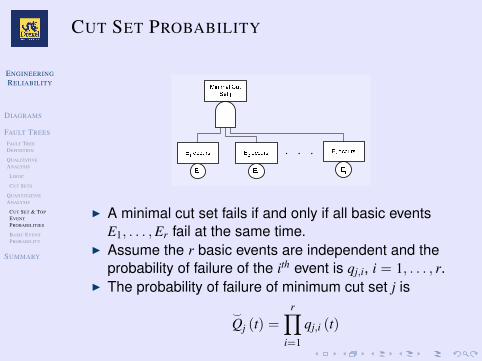
CUT SET PROBABILITY
Minimal Cut
Set j
E2 occurs
E2
E1 occurs
E1
Er occurs
Er
I A minimal cut set fails if and only if all basic eventsE1, . . . , Er fail at the same time.
I Assume the r basic events are independent and theprobability of failure of the ith event is qj,i, i = 1, . . . , r.
I The probability of failure of minimum cut set j is
^
Qj (t) =r∏
i=1
qj,i (t)

ENGINEERINGRELIABILITY
DIAGRAMS
FAULT TREES
FAULT TREE
DEFINITION
QUALITATIVE
ANALYSIS
LOGIC
CUT SETS
QUANTITATIVE
ANALYSIS
CUT SET & TOP
EVENT
PROBABILITIES
BASIC EVENT
PROBABILITY
SUMMARY
TOP EVENT PROBABILITY
TOP Event
Min cut set 2
occurs
C1
Min cut set 1
occurs
C1
Min cut set K
occurs
CK
I The top event if at least one min cut set occurs.I In general, some of the min cut sets will contain
common elements, so we cannot assume they areindependent.
I The best we can do is derive the upper bound
Q0 (t) ≤ 1−K∏
i=1
(1−
^
Qi (t))

ENGINEERINGRELIABILITY
DIAGRAMS
FAULT TREES
FAULT TREE
DEFINITION
QUALITATIVE
ANALYSIS
LOGIC
CUT SETS
QUANTITATIVE
ANALYSIS
CUT SET & TOP
EVENT
PROBABILITIES
BASIC EVENT
PROBABILITY
SUMMARY
SUMMARY