Gypsum scaling in the presence of silica particlestarabara/docs/pubs/wang, 2010...3 precipitation...
35
© 2010. This manuscript version is made available under the CC-BY-NC-ND 4.0 license http://creativecommons.org/licenses/by-nc-nd/4.0 Crystallization of calcium sulfate dihydrate in the presence of colloidal silica Accepted for publication in Industrial and Engineering Chemistry Research on September 27, 2010 Published article DOI: 10.1021/ie100309b Fulin Wang, Thomas E. Davis, and Volodymyr V. Tarabara ∗ Department of Civil and Environmental Engineering, Michigan State University, East Lansing, MI 48824, USA. Key Words: gypsum, induction time, crystallization rate, crystal morphology, scaling, colloidal fouling ∗ Corresponding author. Phone: (517) 432-1755; Fax: (517) 355-0250; Email: [email protected]
Transcript of Gypsum scaling in the presence of silica particlestarabara/docs/pubs/wang, 2010...3 precipitation...

© 2010. This manuscript version is made available under the CC-BY-NC-ND 4.0 license http://creativecommons.org/licenses/by-nc-nd/4.0
Crystallization of calcium sulfate dihydrate in the presence of
colloidal silica
Accepted for publication in Industrial and Engineering Chemistry Research
on September 27, 2010
Published article DOI: 10.1021/ie100309b
Fulin Wang, Thomas E. Davis, and Volodymyr V. Tarabara∗
Department of Civil and Environmental Engineering, Michigan State University,
East Lansing, MI 48824, USA.
Key Words:
gypsum, induction time, crystallization rate, crystal morphology, scaling, colloidal
fouling
∗Corresponding author. Phone: (517) 432-1755; Fax: (517) 355-0250; Email: [email protected]

© 2010. This manuscript version is made available under the CC-BY-NC-ND 4.0 license http://creativecommons.org/licenses/by-nc-nd/4.0
2
Abstract
The effects of silica colloids on calcium sulfate dihydrate (gypsum, CaSO4·2H2O)
crystallization are studied using feed solutions of varying degrees of supersaturation. A
combination of light transmittance and electrical conductivity measurements is employed
to characterize various aspects of the crystallization process. The induction time,
nucleation rate, surface energy, and rate of crystallization of gypsum crystals are
measured as functions of the saturation and the presence of non-crystallizing (SiO2)
colloids. Scanning electron microscopy (SEM) imaging is used to characterize the
morphology of formed crystals. The induction time and the rate of crystallization are both
shown to increase when gypsum crystal formed from solutions containing suspended
colloids. The findings are rationalized in terms of a mechanistic model that links the
random motion of colloids with nucleation and crystal growth processes. The results have
important implications for a variety of industrially-relevant processes such as heat
exchange and membrane separation and related fouling phenomena.
© 2010. This manuscript version is made available under the CC-BY-NC-ND 4.0 license http://creativecommons.org/licenses/by-nc-nd/4.0
3
1. Introduction
In water treatment operations that use natural water as the source, fouling can be
egregious. Membrane-based separation 1 2, 3 and heat transfer 4, 5 unit processes, for
example, suffer significant efficiency losses due to fouling. The losses often translate into
reduced quality and quantity of product water as well as increased energy consumption.
Because the composition of most natural waters is complex, fouling by such waters is
usually due to several concomitant processes, each corresponding to a distinct fouling
mechanism. In heat exchangers, for example, scaling and particulate fouling are main
mechanisms of fouling and typically occur simultaneously 6. In reverse osmosis systems,
formation of biofilm on the membranes surface (i.e., biological fouling) as well as fouling
by precipitating salts and, in some cases, by colloids are of concern. While one fouling
mechanism can dominate, there is growing evidence that interactions between different
fouling mechanisms can be important 2, 4, 6, 7 and, in some cases, can govern the overall
system performance 8.
Precipitative fouling by crystallizing sparingly soluble salts, also known as scaling, can
severely impact performance of salt-rejecting membranes 9 and heat exchangers 4, 10.
Scaling is known to be influenced by other dissolved species such as surfactants 11, other
aqueous ions 12,13, 14, and natural organic matter (NOM) 15. The induced changes have
been found to be specific to the interference agent. For example, in the presence of the
cationic surfactant cetyltrimethylammonium bromide the induction time decreased and
the growth efficiency of gypsum crystals increased; the anionic surfactant sodium

© 2010. This manuscript version is made available under the CC-BY-NC-ND 4.0 license http://creativecommons.org/licenses/by-nc-nd/4.0
4
dodecyl sulfate had opposite effects 11. The presence of another precipitating salt has
been found to affect the structure and strength of gypsum scale in the manner that
depended on the type of the salt 13. Polyelectrolytes have also been shown to influence
gypsum crystallization; the effect depended on the concentration, molecular weight, and
composition of the polyelectrolyte 14. Jiang et al. 16 have shown that the effect of borax
(sodium borate, Na2B4O7) on gypsum scaling depends on its concentration: gypsum
scaling was expedited at low concentrations and retarded at high concentrations of borax.
Studying gypsum crystallization during nanofiltration of agricultural drainage water, Le
Gouellec and Elimelech 15 demonstrated that in the presence of NOM shorter gypsum
crystals were formed.
Scaling is also known to be affected by suspended components of the natural water. Most
of this knowledge comes from studies of heat exchangers, where the effect has been
demonstrated to depend on the crystallizing ability of suspended particles 17, 18. Having
shown that crystallizing CaCO3 particles greatly enhanced gypsum formation, Bansal et
al. 4 attributed this effect to an increase in the number of nucleation sites. In the study on
the deposition of colloids on heat exchanger plates, McGarvey and Turner 19 found that
the rate of particle deposition was enhanced by CaCO3 precipitation. The enhancing
effect of crystallizing colloids was also reported by Andritsos and Karabelas 6, who
demonstrated that CaCO3 precipitation rate was greatly increased by fine aragonite
(CaCO3 polymorph) particles. In contrast, non-crystallizing particles were shown to either
have no effect on scaling (CaCO3 precipitation from solutions containing suspended
silica 20, hematite 21 and silt 21) or to reduce the amount of scale formed (gypsum
precipitation from suspensions of alumina colloids 4). Very little is known about the

© 2010. This manuscript version is made available under the CC-BY-NC-ND 4.0 license http://creativecommons.org/licenses/by-nc-nd/4.0
5
influence of colloids on the crystallization of sparingly soluble salts in waters treated by
salt-rejecting membranes. While both colloidal and precipitative fouling of membranes
have been subjects of extensive research, there have been no studies published on the
interaction between these two processes, which are often limiting the performance of
nanofiltration and reverse osmosis membranes.
The objective of this work was to study how colloidal particles affect the kinetics of
different stages of gypsum crystallization and the morphology of resultant crystals. The
choice of silica as a representative non-crystallizing colloid was motivated by the
abundance of colloidal SiO2 in natural waters. Particles smaller then 100nm were selected
as such smaller colloids are most likely to pass the pretreatment processes and impact the
performance of salt-rejecting membranes used for softening and desalination. Gypsum
was chosen as a salt of particular importance for membrane separations: while carbonate
scaling can be prevented by decreasing the pH of the feed water, the precipitation of
gypsum, which is insensitive to pH, is more difficult to control and remediate. The
discussion of the observed effects of SiO2 colloids on various aspects of gypsum
crystallization is offered and the implications of the results are discussed.

© 2010. This manuscript version is made available under the CC-BY-NC-ND 4.0 license http://creativecommons.org/licenses/by-nc-nd/4.0
6
2. Background
Crystallization in a supersaturated solution begins with nucleation that is the formation of
nuclei that, once formed, may grow into larger crystals 22. The degree of supersaturation
is represented by the saturation, gS . For gypsum, gS is given by:
sp
wSOCag K
aaaS
22
42 −+
= , (1)
where spK is the solubility product for CaSO4∙2H2O in water ( spK =2.623·10-5 at 20 ºC)
23; ia is the activity expressed as the product of the activity coefficient ( iγ ) and the
molality ( im )of species i ( =i +2Ca ; −24SO ; water). Davies’ approximation can be used to
estimate the activity coefficient as a function of ionic strength:
)3.01
(log 2 II
IAz −+
−=γ , (2)
where z is the ion charge; I is the ionic strength (M); A is 0.5 for aqueous solutions at
(15 to 20) °C and 1 atm. The approximate range of applicability of eq. (2) is 5.0<I M 24.
Induction time is defined as the time that elapses between the moment the supersaturation
condition is achieved and the moment crystals are detected in the solution. Induction time

© 2010. This manuscript version is made available under the CC-BY-NC-ND 4.0 license http://creativecommons.org/licenses/by-nc-nd/4.0
7
is known to be a function of the saturation, temperature and the presence of interferences
22, 25, and can be represented by a sum of three components 22, 26:
gnrind tttt ++= , (3)
where rt is the relaxation time required for the system to achieve a quasi-steady-state
distribution of molecular clusters; nt is the time required for formation of stable nuclei,
which grow into crystals instead of dissolving into the feed solution 27; gt is the time for
the nucleus to grow to a detectable size. As the definition of gt implies, the value of indt
depends on the sensitivity of the technique used for detecting the crystals 25, 26. Optical
and electrochemical methods have been used to determine the induction time for gypsum.
Optical methods include monitoring of scattered and transmitted light 27, measurement of
turbidity 11, 28-30, and direct observation by the naked eye 31. Electrochemical methods
include measuring the conductivity of the feed suspensions 32 and measuring the
concentration of free calcium cations in the solution 28, 33, 34. The value of the induction
time is specific to the measurement method and is usually defined operationally 25, 26.
For primary nucleation, the rate of nuclei formation (nucleation rate) is given by 26, 35:
−= 23
23
)(ln)()(
expg
Amss SRT
fNVFJ
θβγ, (4)

© 2010. This manuscript version is made available under the CC-BY-NC-ND 4.0 license http://creativecommons.org/licenses/by-nc-nd/4.0
8
where sγ is the surface energy (interfacial tension) of the crystals (J/m2); F is the pre-
exponential factor (for homogeneous nucleation, F has a theoretical value of 1030
nuclei/(cm3∙s) 11); T is the absolute temperature (K); β is the shape factor ( 3/16π for
spherical nuclei); mV is the molecular volume for solid gypsum (m3/mol); AN is
Avogadro’s number (mol-1); R is the gas constant (J/(mol·K)); )(θf is a correction
factor ( )(θf = 1 for homogenous nucleation and less than 1 for heterogeneous nucleation)
The surface energy ( sγ ) can be calculated from the measured induction time using the
following expression 26, 27, 29:
+= 3
23
23 )3.2()(
)(log1log
RfNV
STBt Ams
gind
θβγ , (5)
where B is a dimensionless constant.
The rate of gypsum crystallization is given by 36:
)( sbb CCkdtdm
−= , (6)
where m is the mass of gypsum formed; bk is the gypsum bulk crystallization rate (also
called the diffusion-controlled crystallization constant 36); bC is the gypsum

© 2010. This manuscript version is made available under the CC-BY-NC-ND 4.0 license http://creativecommons.org/licenses/by-nc-nd/4.0
9
concentrations in bulk solution; sC is the saturation concentration of gypsum. When the
volume of the feed solution is constant, Eq. (6) may be rewritten as
)('sbb CCk
dtdC
−= , (7)
where 'bk is the crystallization rate.

© 2010. This manuscript version is made available under the CC-BY-NC-ND 4.0 license http://creativecommons.org/licenses/by-nc-nd/4.0
10
3. Material and methods
3.1. Experimental apparatus
The schematic of the batch reactor used in crystallization experiments is shown in Fig. 1.
A 1,500 mL Pyrex® beaker with 1,000 mL of stirred feed solution was placed in a water
bath, which was maintained at (20 ± 0.2) ºC using a programmable circulating chiller
(model 9512, PolyScience, Niles, IL). The feed solution was mixed using magnetic
stirring (3 inch stirrer bar) at a rate of 120 rpm and continuous circulation (gear pump
EW-74013-20, Cole-Parmer, Vernon Hills, Illinois) at a flowrate of 1.6 L/min.
A small portion of the circulated solution was diverted into a flow-through UV-vis
sample cell for on-line optical transmittance measurements in the (400 to 800) nm
wavelength range (Multi-Spec 1501 spectrophotometer, Shimadzu, Kyoto, Japan).
A decline of 5% in the light transmittance at 400 nm was used as the criterion to indicate
the onset of gypsum crystallization 27. Although optical transmittance was recorded in the
(400 to 800) nm wavelength range, the transmittance at 400 nm was chosen for detection
as we found the transmittance at lower wavelengths to be more sensitive to nucleation-
caused changes in the optical properties of the feed (see Fig. S1, Supporting
Documentation (SD)). The electrical conductivity was measured in real time using a
conductivity probe (model 013005A, Thermo Electron Corp. Beverly, MA) and meter
(model Orion 550, Thermo Electron Corp.) The electrical conductivity and optical
© 2010. This manuscript version is made available under the CC-BY-NC-ND 4.0 license http://creativecommons.org/licenses/by-nc-nd/4.0
11
transmittance data were logged to a PC every 30 sec or 2 min, depending on the value of
the initial saturation.
[Figure 1]
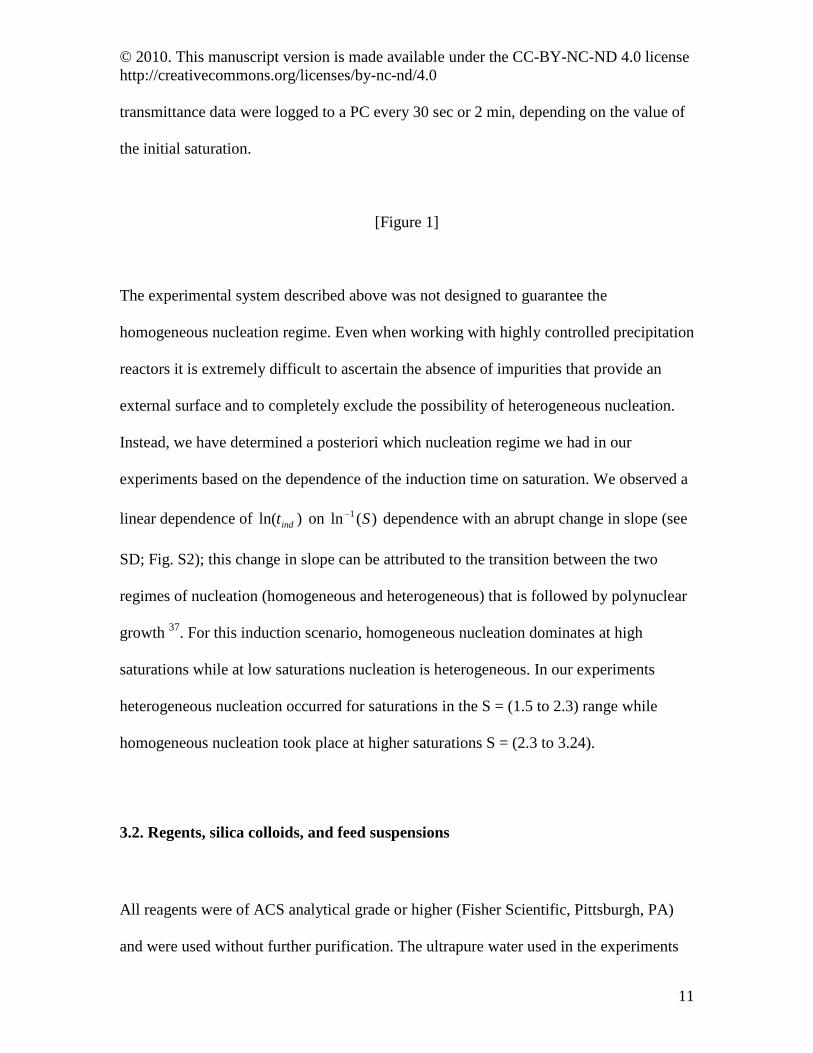
The experimental system described above was not designed to guarantee the
homogeneous nucleation regime. Even when working with highly controlled precipitation
reactors it is extremely difficult to ascertain the absence of impurities that provide an
external surface and to completely exclude the possibility of heterogeneous nucleation.
Instead, we have determined a posteriori which nucleation regime we had in our
experiments based on the dependence of the induction time on saturation. We observed a
linear dependence of )ln( indt on )(ln 1 S− dependence with an abrupt change in slope (see
SD; Fig. S2); this change in slope can be attributed to the transition between the two
regimes of nucleation (homogeneous and heterogeneous) that is followed by polynuclear
growth 37. For this induction scenario, homogeneous nucleation dominates at high
saturations while at low saturations nucleation is heterogeneous. In our experiments
heterogeneous nucleation occurred for saturations in the S = (1.5 to 2.3) range while
homogeneous nucleation took place at higher saturations S = (2.3 to 3.24).
3.2. Regents, silica colloids, and feed suspensions
All reagents were of ACS analytical grade or higher (Fisher Scientific, Pittsburgh, PA)
and were used without further purification. The ultrapure water used in the experiments

© 2010. This manuscript version is made available under the CC-BY-NC-ND 4.0 license http://creativecommons.org/licenses/by-nc-nd/4.0
12
was supplied by a commercial ultrapure water system (Lab Five, USFilter Corp., Hazel
Park, MI) equipped with a terminal 0.2 µ m capsule microfilter (PolyCap, Whatman Plc.,
Sanford, ME). The resistance of water was greater than 16 MΩ ·cm. No buffers were
added to the feed water.
Silica nanoparticles were obtained from the vendor as aqueous suspensions (SnowTex-
XL and SnowTex-N, Nissan Chemical America Corp., Houston, TX). Light scattering
data (ZetaPALS, Brookhaven Instrument Corp., Holtsville, NY) showed that SiO2
particle size distribution was relatively narrow (polydispersity factor of 0.074) with a
mean hydrodynamic particle diameter of (56 ± 1) nm for SnowTex-XL and (16 ± 0) nm
for SnowTex-N suspensions. The pH of the 50 mg/L aqueous suspension of the
SnowTex-XL colloids was measured to be 7.5.
The feed solutions supersaturated with respect to gypsum were prepared by dissolving
two highly soluble salts - O2HCaCl 22 ⋅ and 42SONa - separately, one after another. The
amount of O2HCaCl 22 ⋅ and 42SONa added and the resulting degree of supersaturation
are shown in Table 1. Note that ionic strengths were within the approximate range of
applicability of the Davies’ equation ( 5.0<I M).
[Table 1]

© 2010. This manuscript version is made available under the CC-BY-NC-ND 4.0 license http://creativecommons.org/licenses/by-nc-nd/4.0
13
3.3. Characterization of the gypsum crystals
To comparatively characterize gypsum crystals formed in experiments with feed waters
of different compositions, 10 mL samples of the feed were withdrawn from the batch
reactor at the point in the experiment when the optical transmittance of the feed decreased
to 50% of its initial value. The samples were withdrawn using a syringe and were filtered
through a polycarbonate track-etch membrane (Nuclepore®, Whatman Plc.) with a 0.1
µ m nominal pore size. Immediately after the filtration, 5 mL of methanol were filtered
through the membrane to remove the residual feed solution so that no additional gypsum
could crystallize on surface of crystals deposited on the membrane during filtration. The
membrane filter was then dried in air at room temperature.
For SEM imaging, a small (approximately1 cm2) coupon of the dried membrane was cut
out and coated with osmium for 30 s (Neoc-AN coater, Meiwa Shoji Co. Ltd., Kyoto,
Japan). SEM micrographs were recorded using Hitachi S-4700II Field Emission scanning
electron microscope (Hitachi High Technologies America, Inc. Pleasanton, CA). The
microscope was operated in the ultra-high resolution mode with an accelerating voltage
of 15 kV and an emission current of 10 µ A.

© 2010. This manuscript version is made available under the CC-BY-NC-ND 4.0 license http://creativecommons.org/licenses/by-nc-nd/4.0
14
4. Results and discussion
The assumption of homogenous nucleation was only valid for the S = (2.3 to 3.24) range
of saturation (Fig S2; SD). Therefore, the values of surface energy, nucleation rate and
crystallization rate are reported for this range of saturations.
4.1. Effect of silica colloids on gypsum induction time
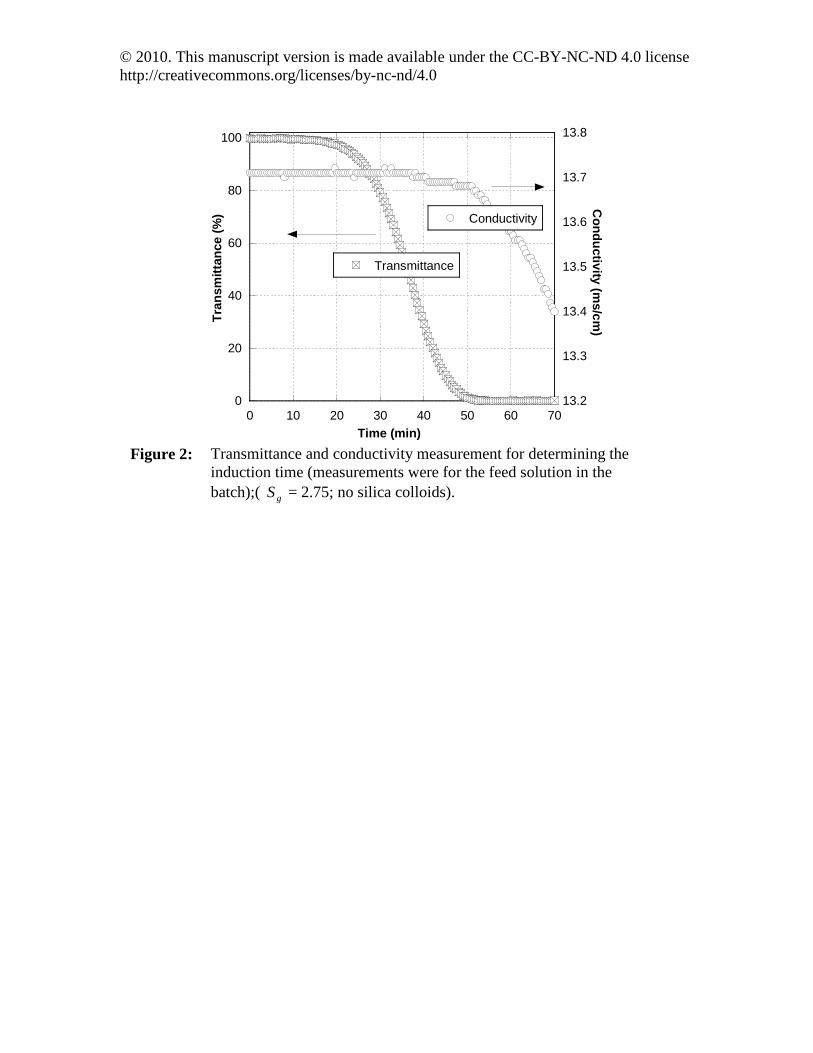
First, in a control crystallization experiment, the optical transmittance and the electrical
conductivity of the SiO2-free oversaturated feed solution were recorded as functions of
time. Transmittance and conductivity decreased to 95% of their initial values after 22.8
min and 38 min, respectively, indicating that optical transmittance is a more sensitive
indicator of the presence of nucleated gypsum crystals in the feed (Fig. 2).
[Figure 2]
The evolution of optical transmittance and electrical conductivity of feed solutions with
different initial saturation indices is shown in Fig. 3. Based on the optical transmittance
data, values of indt were determined (Fig. 4a). The introduction of SiO2 colloids to the
feed resulted in an increase in the induction time for gypsum. This effect was more
evident for feed solutions with lower initial saturation indices (see SD, Fig. S3).
[Figure 3]

© 2010. This manuscript version is made available under the CC-BY-NC-ND 4.0 license http://creativecommons.org/licenses/by-nc-nd/4.0
15
4.2. Effect of silica colloids on the surface energy and nucleation rate of gypsum
crystals
From the slope of the )log( indt versus 2)/(log1 gS plot (Eq. (5)), the value of surface
energy, sγ , was calculated to be 7.94 ± 0.21 J/m2 for gypsum crystals formed from SiO2–
free solutions and 7.95 ± 0.06 J/m2 for gypsum crystals formed from solutions with 50
mg/L loading of colloidal SiO2. The standard deviations given above correspond to the
90% confidence interval. Thus, within the experimental error of our measurements, the
presence of silica colloids did not have an effect on the surface energy of crystals.
[Figure 4]
Based on Eq. (4), the theoretical nucleation rates of gypsum crystallization at different
saturation indices were calculated. The presence of silica colloids was found to have no
evident effect on the nucleation rate (Fig. 4b).
4.3. Effect of silica colloids on gypsum crystallization rate
Because the absorption and scattering of light by a suspension depends on both the
number and the size of suspended particles (i.e., gypsum nuclei and crystals in our case)
38, optical transmittance could not be used as a quantitative measure of the amount of
gypsum crystal formed. The crystallization rate can be directly measured, however, by
determining how fast free Ca2+ and SO42- ions disappear from the solution as they become

© 2010. This manuscript version is made available under the CC-BY-NC-ND 4.0 license http://creativecommons.org/licenses/by-nc-nd/4.0
16
incorporated into the growing CaSO4 crystals. Based on the fact that free Ca2+ and SO42-
contribute to conductivity while CaSO4 crystals do not, we used the measured
conductivity decline with time indtt > to determine dtdC / (Eq. (7)) for feed solutions
with different initial saturation indices in the absence and in the presence of SiO2 colloids
(Fig. 4c). For all saturation conditions, the introduction of silica colloids led to a higher
gypsum crystallization rate. The increase was larger for feed solutions with higher initial
saturation indices.
Hypothetical mechanistic description of the observed effects of SiO2 colloids
We hypothesize that the delayed induction of gypsum crystals in the presence of colloidal
particles is a result of collisions between the colloids and nascent CaSO4 nuclei. The
nuclei have to grow into a critical size to become stable sites available for further growth,
the process that can be disrupted by collisions with SiO2 nanoparticles undergoing
Brownian diffusion. The kinetic energy of the Brownian motion of colloids ( TkB5.1 ) is
smaller than but is of the same order of magnitude as the activation energy for gypsum
crystallization (30 kJ/mol 39, which is equivalent to TkB65.3 at T=200C).
The same random diffusion of colloids can lead to enhanced local mixing in the vicinity
of already stable and growing CaSO4 crystals. Large “fluidized particles” have been
successfully applied to improve mass transfer in membrane modules (e.g., 40) In
experiments with SnowTex-XL colloids, we showed that introducing the colloids into the
feed of reverse osmosis membranes results in improved mass transfer; this improvement

© 2010. This manuscript version is made available under the CC-BY-NC-ND 4.0 license http://creativecommons.org/licenses/by-nc-nd/4.0
17
manifested itself as an increase in salt rejection by the membranes, which was attributed
to the local mixing of the salt concentration polarization layer by the silica colloids 41.
Such mixing should mitigate the diffusional limitation on the transport of Ca2+ and SO42-
to the growth sites on the CaSO4 crystal surface. In consistence with this hypothesis,
longer induction times were recorded in experiments on gypsum crystallization in the
presence of 16 nm colloids than in experiments with 56 nm colloids (Figure 5). The
smaller colloids have higher diffusion coefficient and, therefore should provide better
mixing. Although largely speculative, this mechanistic model explains both the delay in
the induction and faster rates of crystallization from colloid-bearing solutions.

© 2010. This manuscript version is made available under the CC-BY-NC-ND 4.0 license http://creativecommons.org/licenses/by-nc-nd/4.0
18
4.4. Effect of silica colloids on the morphology of gypsum crystals
SEM imaging demonstrated that gypsum crystals formed in the absence of SiO2 colloids
were predominantly needle-like with a typical length-to-width ratio of approximately 20
(Fig. 6). There was no evidence of the epitaxial SiO2/CaSO4·2H2O growth. Interestingly,
there was a significant number of rosette-shaped crystals; these likely represented the
needle-like crystals in an early stage of growth. In contrast, when the SiO2 colloids were
present, gypsum crystals with predominantly plate-like morphology with a typical length-
to-width ratio of approximately 2 were formed. SEM imaging showed the presence of
silica colloids deposited on the surface of gypsum crystals (as seen in Figures 6f, 6h).
Given that no colloids were observed to be incorporated inside gypsum crystals (i.e., no
epitaxial growth), we believe the colloids were deposited onto the crystal surface during
drying at the time of SEM sample preparation. There were also some needle-like crystals
with the length-to-width ratio varying significantly from one crystal to another. The
surface of these crystals was rougher than that of crystals formed in the absence of SiO2
colloids. No rosette-shaped crystals were observed.
[Figure 5]
In earlier studies, similar changes in the morphology of gypsum crystals formed in the
presence of additives were reported. For example, the addition of cetyltrimethylamonium
bromide to a solution supersaturated with respect to gypsum decreased the length-to-
width ratio of gypsum crystals that were formed 11; in another study, the presence of 0.1
© 2010. This manuscript version is made available under the CC-BY-NC-ND 4.0 license http://creativecommons.org/licenses/by-nc-nd/4.0
19
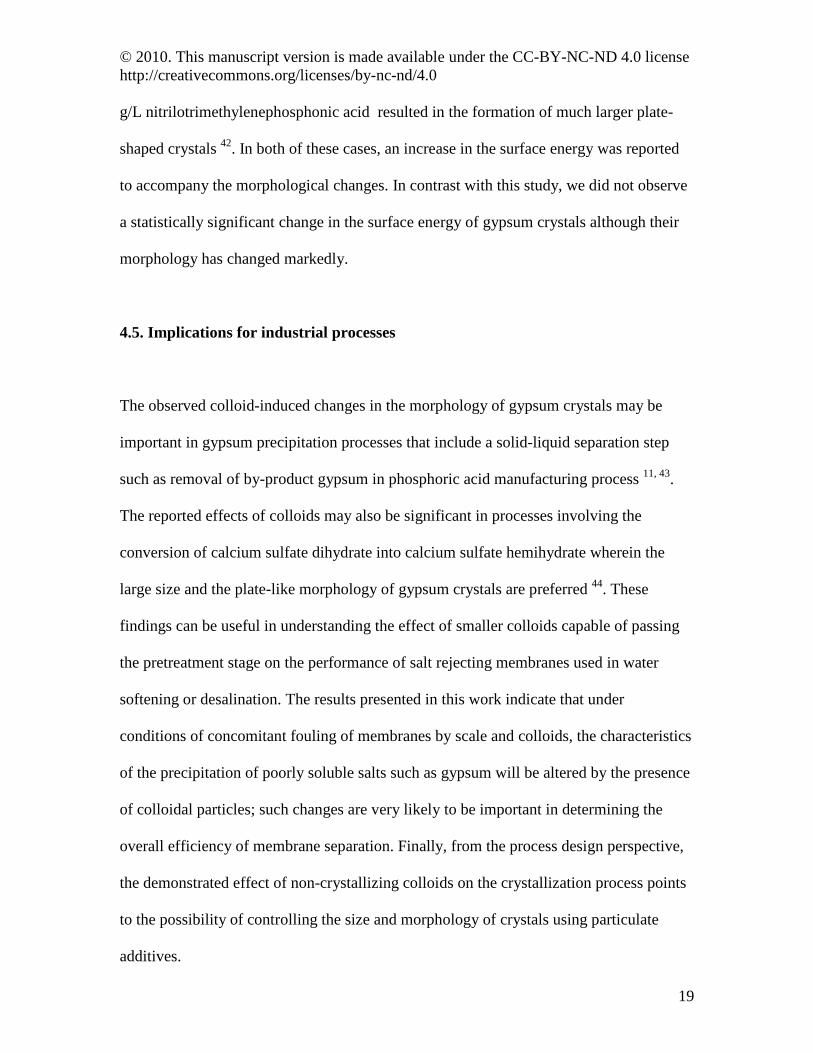
g/L nitrilotrimethylenephosphonic acid resulted in the formation of much larger plate-
shaped crystals 42. In both of these cases, an increase in the surface energy was reported
to accompany the morphological changes. In contrast with this study, we did not observe
a statistically significant change in the surface energy of gypsum crystals although their
morphology has changed markedly.
4.5. Implications for industrial processes
The observed colloid-induced changes in the morphology of gypsum crystals may be
important in gypsum precipitation processes that include a solid-liquid separation step
such as removal of by-product gypsum in phosphoric acid manufacturing process 11, 43.
The reported effects of colloids may also be significant in processes involving the
conversion of calcium sulfate dihydrate into calcium sulfate hemihydrate wherein the
large size and the plate-like morphology of gypsum crystals are preferred 44. These
findings can be useful in understanding the effect of smaller colloids capable of passing
the pretreatment stage on the performance of salt rejecting membranes used in water
softening or desalination. The results presented in this work indicate that under
conditions of concomitant fouling of membranes by scale and colloids, the characteristics
of the precipitation of poorly soluble salts such as gypsum will be altered by the presence
of colloidal particles; such changes are very likely to be important in determining the
overall efficiency of membrane separation. Finally, from the process design perspective,
the demonstrated effect of non-crystallizing colloids on the crystallization process points
to the possibility of controlling the size and morphology of crystals using particulate
additives.

© 2010. This manuscript version is made available under the CC-BY-NC-ND 4.0 license http://creativecommons.org/licenses/by-nc-nd/4.0
20
5. Conclusions
The effect of silica colloids on gypsum scaling was studied in a series of batch
experiments with feed solutions of varying degrees of supersaturation. The induction time
of gypsum crystallization and gypsum crystallization rate were found to increase, while
the nucleation rate and the surface energy of the crystals remained unaffected when SiO2
colloids were present in the feed. Larger, plate-like crystals were formed from solution
with suspended SiO2. This was in sharp contrast to the needle-like morphology typical for
gypsum crystals formed from colloid-free solutions. The results have implications for a
variety of industrially-relevant processes including heat exchange and membrane
separation. In particular, the results can be useful in understanding the effect of small
colloids capable of passing the pretreatment stage on the performance of heat exchangers
and salt rejecting membranes used in water softening or desalination.

© 2010. This manuscript version is made available under the CC-BY-NC-ND 4.0 license http://creativecommons.org/licenses/by-nc-nd/4.0
21
Acknowledgments
This work was supported by the National Water Research Institute (project no. 05-TM-
007) and the National Science Foundation (research grant OISE-0530174). We thank Pall
Corp. for providing the UF membrane samples and Nissan Chemical America Corp. for
supplying the silica suspension. We also thank Dr. Ewa Danielewicz from the Center for
Advanced Microscopy at Michigan State University for her assistance with SEM sample
preparation.

© 2010. This manuscript version is made available under the CC-BY-NC-ND 4.0 license http://creativecommons.org/licenses/by-nc-nd/4.0
22
Nomenclature
Greek letters
A dimensionless coefficient B dimensionless constant C gypsum concentration (mol/L)
bC gypsum concentration in bulk solution (mol/L)
sC saturation concentration of gypsum (mol/L) F frequency constant
)(θf correction factor I ionic strength (M)
sJ nucleation rate (nucleus/(m3∙s))
bk gypsum bulk crystallization rate (g∙L/(min∙mol)) 'bk gypsum crystallization rate (min-1)
spK solubility product m mass of gypsum crystals (g)
AN Avogadro’s number (mol-1) R gas constant (J/(mol·K))
gS saturation T absolute temperature (K)
indt induction time (min)
mV molecular volume (m3/mol) z ion charge
α fraction of calcium and sulfate ions existing as ion pairs β shape factor γ activity coefficient
sγ surface energy of the crystals (J/m2) 2ρ correlation coefficient
© 2010. This manuscript version is made available under the CC-BY-NC-ND 4.0 license http://creativecommons.org/licenses/by-nc-nd/4.0
23
References 1. Committee Report: Recent advances and research needs in membrane fouling. J. Am. Water Works Assoc. 2005, 97, (8), 79-89. 2. Trussell, R. S.; Merlo, R. P.; Hermanowicz, S. W.; Jenkins, D., The effect of organic loading on process performance and membrane fouling in a submerged membrane bioreactor treating municipal wastewater. Wat. Res. 2006, 40, (14), 2675. 3. Rosenberger, S.; Laabs, C.; Lesjean, B.; Gnirss, R.; Amy, G.; Jekel, M.; Schrotter, J. C., Impact of colloidal and soluble organic material on membrane performance in membrane bioreactors for municipal wastewater treatment. Wat. Res. 2006, 40, (4), 710. 4. Bansal, B.; Muller-Steinhagen, H.; Chen, X. D., Effect of suspended particles on crystallization fouling in plate heat exchangers. J. Heat Transfer, Trans. ASME 1997, 119, (3), 568. 5. Grandgeorge, S.; Jallut, C.; Thonon, B., Particulate fouling of corrugated plate heat exchangers. Global kinetic and equilibrium studies. Chem. Eng. Sci. 1998, 53, (17), 3050. 6. Andritsos, N.; Karabelas, A. J., The Influence of particulates on CaCO3 scale formation. J. Heat Transfer 1999, 121, 225-227. 7. Lee, S.; Cho, J.; Elimelech, M., Combined influence of natural organic matter (NOM) and colloidal particles on nanofiltration membrane fouling. J. Membr. Sci. 2005, 262, 27-41. 8. Wang, F.; Tarabara, V. V. In Coupled effects of scaling and colloidal deposition on the performance of reverse osmosis membranes, The 233rd ACS National Meeting, Chicago, IL, March 2007; Chicago, IL, March 2007. 9. Uchymiak, M.; Rahardianto, A.; Lyster, E.; Glater, J.; Cohen, Y., A novel RO ex situ scale observation detector (EXSOD) for mineral scale characterization and early detection. J. Membr. Sci. 2007, 291, (1-2), 86. 10. Karabelas, A., Scale formation in tubular heat exchangers--research priorities. International Journal of Thermal Sciences 2002, 41, (7), 682. 11. Mahmoud, M. H. H.; Rashad, M. M.; Ibrahim, I. A.; Abdel-Aal, E. A., Crystal modification of calcium sulfate dihydrate in the presence of some surface-active agents. J. Colloid Interface Sci. 2004, 270, (1), 99-105. 12. He, S. L.; Oddo, J. E.; Tomson, M. B., The Inhibition of Gypsum and Barite Nucleation in Nacl Brines at Temperatures from 25-Degrees-C to 90-Degrees-C. Applied Geochemistry 1994, 9, (5), 561-567. 13. Sheikholeslami, R., Mixed salts -- scaling limits and propensity. Desalination 2003, 154, (2), 117. 14. Amjad, Z.; Hooley, J., Influence of polyelectrolytes on the crystal growth of calcium sulfate dihydrate. J. Colloid Interface Sci. 1986, 111, (2), 496. 15. Le Gouellec, Y. A.; Elimelech, M., Calcium sulfate (gypsum) scaling in nanofiltration of agricultural drainage water. J. Membr. Sci. 2002, 205, (1-2), 279. 16. Jiang, W.; Pan, H.; Tao, J.; Xu, X.; Tang, R., Dual roles of borax in kinetics of calcium sulfate dihydrate formation. Langmuir 2007, 23, 5070-5076. 17. Sheikholeslami, R., Composite fouling of heat transfer equipment in aqueous media - a review. Heat Transfer Engineering 2000, 21, (3), 34 - 42.
© 2010. This manuscript version is made available under the CC-BY-NC-ND 4.0 license http://creativecommons.org/licenses/by-nc-nd/4.0
24
18. Hasson, D. In Progress in precipitation fouling: a review, in:Understanding Heat Exchanger Fouling and its Mitigation, T.R. Bott et al. (Eds), 1999; Begell House, New York: 1999; pp 67-89. 19. McGarvey, G. B.; Turner, C. W., Synergism models for heat exchanger fouling mitigation. In: T.R. Bott et al.Understanding Heat Exchanger Fouling and its Mitigation, Begell House, New York 1999, 155-161. 20. Okazaki, M.; Kimura, S., Scale formation on reverse-osmosis membranes J. Chem. Eng. Jpn. 1984, 17, (2), 145. 21. Hasson, D.; Drak, A.; Semiat, R., Inception of CaSO4 scaling on RO membranes at various water recovery levels. Desalination 2001, 139, (1-3), 73-81. 22. Mullin, J. W., Crystallization. 4th ed.; Butterworth-Heinemann: Oxford, 2001. 23. Nordstrom, D. K.; Plummer, L. N.; Langmuir, D.; Busenberg, E.; May, H. M.; Jones, B. F.; Parkhurst, D. L., Revised chemical equilibrium data for major water-mineral reactions and their limitations, in Bassett, R.L. and Melchior, D. eds., Chemical modeling in aqueous systems II: Washington D.C., American Chemical Society Symposium Series 416, Chapt. 31. 1990, 398-413. 24. Appelo, C. A. J.; Postma, D., Geochemistry and groundwater pollution. Balkema: Rotterdam, 2005. 25. Söhnel, O.; Mullin, J. W., A method for the determination of precipitation induction periods. J. Crystal Growth 1978, 44, 377 - 382. 26. Söhnel, O.; Mullin, J. W., Interpretation of crystallization induction periods. J. Colloid Interface Sci. 1988, 123, (1), 43-50. 27. Lancia, A.; Musmarra, D.; Prisciandaro, M., Measuring induction period for calcium sulfate dihydrate precipitation. AIChE J. 1999, 45, (2), 390 - 397. 28. Shih, W. Y.; Albrecht, K.; Glater, J.; Cohen, Y., A dual-probe approach for evaluation of gypsum crystallization in response to antiscalant treatment. Desalination 2004, 169, (3), 213. 29. He, S.; Oddo, J. E.; Tomson, M. B., The inhibition of gypsum and barite nucleation in NaCl brines at temperatures from 25 to 90[degree sign]C. Appl. Geochem. 1994, 9, (5), 561. 30. Hasson, D.; Drak, A.; Semiat, R., Inception of CaSO4 scaling on RO membranes at various water recovery levels. Desalination 2001, 139, 73 - 81. 31. Lam, W. H.; Ng, K. M., Diastereomeric salt crystallization synthesis for chiral resolution of ibuprofen. AIChE J. 2007, 53, (2), 429 - 437. 32. Klepetsanis, P. G.; Koutsoukos, P. G., Kinetics of calcium sulfate formation in aqueous media: effect of organophosphorous compounds. J. Crystal Growth 1998, 193, 156 - 163. 33. Le Gouellec, Y. A.; M., E., Control of calcium sulfate (gypsum) scale in nanofiltration of saline agricultural drainage water. Environ. Eng. Sci. 2002, (19), 387-397. 34. Hina, A.; Nancollas, G. H.; Grynpas, M., Surface induced constant composition crystal growth kinetics studies. The brushite–Gypsum system. J. Crystal Growth 2001, 223, (1-2), 213 - 224. 35. Myerson, A. S., Handbook of Industrial Crystallization. 2nd ed.; Butterworth-heinemann: Boston, 2002; p 33-63. 36. Nancollas, G. H., The growth of crystals in solution. Adv. Colloid Interface Sci. 1979, 10, 215-252.

© 2010. This manuscript version is made available under the CC-BY-NC-ND 4.0 license http://creativecommons.org/licenses/by-nc-nd/4.0
25
37. Sohnel, O.; Mullin, J. W., Interpretation of Crystallization Induction Periods. Journal of Colloid and Interface Science 1988, 123, (1), 43-50. 38. Naganuma, T.; Kagawa, Y., Effect of particle size on light transmittance of glass particle dispersed epoxy matrix optical composites. Acta Mater. 1999, 47, (17), 4321 - 4327. 39. Liu, S. T.; Nancollas, G. H., Kinetic and morphological study of seeded growth of calcium-sulfate dihydrate in presence of additives. J. Colloid and Interface Sci. 1975, 52, (3), 593-601. 40. van der Waal, M. J.; van der Velden, P. M.; Koning, J.; Smolders, C. A.; van Swaay, W. P. M., Use of fluidized beds as turbulence promoters in tubular membrane systems,. Desalination 1977, 22, 465-483. 41. Wang, F. L.; Tarabara, V. V., Coupled effects of colloidal deposition and salt concentration polarization on reverse osmosis membrane performance. J. Membr. Sci. 2007, 293, (1-2), 111-123. 42. Prisciandaro, M.; Olivieri, E.; Lancia, A.; Musmarra, D., Gypsum precipitation from an aqueous solution in the presence of nitrilotrimethylenephosphonic acid Ind. Eng. Chem. Res. 2006, 45, 2070 - 2076. 43. Rashad, M. M.; Baioumy, H. M.; Abdel-Aal, E. A., Structural and spectral studies on gypsum crystals under simulated conditions of phosphoric acid production with and without organic and inorganic additives. Cryst. Res. Technol. 2003, 38, (6), 433 - 439. 44. Kojima, Y.; Yasue, T., Synthesis of large plate-like gypsum dihydrate from waste gypsum board. J. Euro. Ceram. Soc. 2006, 26, (4-5), 777-783.
© 2010. This manuscript version is made available under the CC-BY-NC-ND 4.0 license http://creativecommons.org/licenses/by-nc-nd/4.0
26
List of Figures Figure 1 Schematic of the batch reactor used in crystallization experiments.
Figure 2 Transmittance and conductivity measurement for determining the induction time
(measurements were for the feed solution in the batch);( gS = 2.75; no silica colloids).
Figure 3 Effect of silica colloids on changes in the optical transmittance (a) and electrical conductivity (b) with time for feed solutions at five different values of saturation,
gS . Figure 4 Effect of 56 nm silica colloids on (a) induction time, (b) nucleation rate, and (c)
crystallization rate of gypsum. Nucleation and crystallization rates are not reported for lower saturations that correspond to heterogeneous nucleation regime.
Figure 5 Effect of 56 nm silica colloids on (a) induction time, (b) nucleation rate, and (c) crystallization rate of gypsum. Nucleation and crystallization rates are not reported for lower saturations that correspond to heterogeneous nucleation regime. Error bars on Fig 4(b) denote the range of nucleation rates that corresponds to the 95% confidence interval for the value of the surface energy, sγ .
Figure 6 SEM images of gypsum crystals formed in the absence (a-d) and in the presence (e-h) of 50 mg/L silica colloids. Conditions: gS = 2.75, transmittance = 50%). The two groups of images were chosen to represent the variety of crystal morphologies observed under the two sets of conditions (i.e., presence or absence of colloidal silica).

© 2010. This manuscript version is made available under the CC-BY-NC-ND 4.0 license http://creativecommons.org/licenses/by-nc-nd/4.0
27
List of Tables Table 1 Composition of model solutions.

© 2010. This manuscript version is made available under the CC-BY-NC-ND 4.0 license http://creativecommons.org/licenses/by-nc-nd/4.0
28
Figure 1: Schematic of the batch reactor used in crystallization experiments.
© 2010. This manuscript version is made available under the CC-BY-NC-ND 4.0 license http://creativecommons.org/licenses/by-nc-nd/4.0
0
20
40
60
80
100
13.2
13.3
13.4
13.5
13.6
13.7
13.8
0 10 20 30 40 50 60 70
Transmittance
ConductivityTr
ansm
ittan
ce (%
)C
onductivity (ms/cm
)
Time (min) Figure 2: Transmittance and conductivity measurement for determining the
induction time (measurements were for the feed solution in the batch);( gS = 2.75; no silica colloids).

© 2010. This manuscript version is made available under the CC-BY-NC-ND 4.0 license http://creativecommons.org/licenses/by-nc-nd/4.0
0
20
40
60
80
100
Tran
smitt
ance
(%)
With 56 nm colloids
No colloids
Sg=1.50
Sg=1.77Sg=2.75
Sg=2.30Sg=3.24
(a)
8
9
10
11
12
13
14
15
16
9
10
11
12
13
14
15
16
1 10 100 1000
Con
duct
ivity
(ms/
cm)_
No
collo
ids
Conductivity (m
s/cm)_W
ith colloids
Time (min)
With 56 nm colloids
No colloids
Sg=3.24
S=6.0
Sg=2.30
Sg=1.77
Sg=1.50
Sg=2.75
(b)
Figure 3: Effect of silica colloids on changes in the optical transmittance (a) and electrical
conductivity (b) with time for feed solutions at five different values of saturation.

© 2010. This manuscript version is made available under the CC-BY-NC-ND 4.0 license http://creativecommons.org/licenses/by-nc-nd/4.0
(a) (b) (c)
0
200
400
600
800
1000
1.5 1.77 2.3 2.75 3.24
No colloidsWith colloids
Indu
ctio
n tim
e (m
in)
Saturation, Sg
0
50
100
150
200
250
300
1.5 1.77 2.3 2.75 3.24
No ColloidsWith colloids
Nuc
leat
ion
rate
(1027
nuc
lei/c
m3 /s
)
Saturation, Sg
0
0.002
0.004
0.006
0.008
0.01
0.012
1.5 1.77 2.3 2.75 3.24
No colloidsWith colloids
Cry
stal
lizat
ion
rate
(min
-1)
Saturation, Sg
Figure 4: Effect of 56 nm silica colloids on (a) induction time, (b) nucleation rate, and (c) crystallization rate of gypsum. Nucleation and crystallization rates are not reported for lower saturations that correspond to heterogeneous nucleation regime. Error bars on Fig 4(b) denote the range of nucleation rates that corresponds to the 95% confidence interval for the value of the surface energy, sγ .

© 2010. This manuscript version is made available under the CC-BY-NC-ND 4.0 license http://creativecommons.org/licenses/by-nc-nd/4.0
0
20
40
60
80
100
0
20
40
60
80
100
0 50 100 150 200
no colloids56 nm colloids16 nm colloids
Tran
smitt
ance
(%)
Time (min)
Figure 5: Effect of silica colloids of two different sizes on changes in the optical transmittance with time for feed solutions at the saturation gS =2.30. The induction times were determined to be (70.3 ± 5.0) min and (56.3 ± 7.1) min in experiments with 16 nm colloids and 56 nm SiO2 colloids, correspondingly.

© 2010. This manuscript version is made available under the CC-BY-NC-ND 4.0 license http://creativecommons.org/licenses/by-nc-nd/4.0
33
a)
e)
b)
f)
c)
g)
d)
h)
Figure 6: SEM images of gypsum crystals formed in the absence (a-d) and in the presence
(e-h) of 50 mg/L silica colloids. Conditions: gS = 2.75, transmittance = 50%. The two groups of images were chosen to represent the variety of crystal morphologies observed under the two sets of conditions (i.e., presence or absence

© 2010. This manuscript version is made available under the CC-BY-NC-ND 4.0 license http://creativecommons.org/licenses/by-nc-nd/4.0
34
of colloidal silica).

© 2010. This manuscript version is made available under the CC-BY-NC-ND 4.0 license http://creativecommons.org/licenses/by-nc-nd/4.0
35
O2HCaCl 22 42SONa gS * α # I # gS # g/L g/L % mM 3.80 3.67 2.83 30.0 118.6 1.50 4.35 4.21 3.40 30.8 134.4 1.77 5.38 5.20 4.53 32.1 163.0 2.30 6.24 6.02 5.52 33.1 186.2 2.75 7.09 6.85 6.58 34.0 208.9 3.24
Table 1: Composition of model solutions. * Computed without taking ion formation into account # Computed using Visual Minteq with the formation of ion pairs taken into account