Growing together - FUCHS€¦ · The global market for medical equipment, surgical instru-ments,...
219
LUBRICANTS. TECHNOLOGY. PEOPLE. Growing together ANNUAL REPORT
Transcript of Growing together - FUCHS€¦ · The global market for medical equipment, surgical instru-ments,...

FU
CH
S P
ET
RO
LU
B S
E |
AN
NU
AL
RE
PO
RT
20
13
LUBRICANTS.
TECHNOLOGY.
PEOPLE.
Growing togetherA N N UA L R E P O R T

FUCHS PETROLUB is a global Group based in Germany,
which produces and distributes lubricants and related
specialties around the world. The Group, which was founded
in 1931, with its headquarters in Mannheim, ranks num-
ber one among the world’s independent lubricant providers.
The Group currently employs a workforce of 3,888 in
50 operating companies in Europe and overseas.
The most important regions for FUCHS in terms of sales
revenues are Western Europe, Asia and North America.
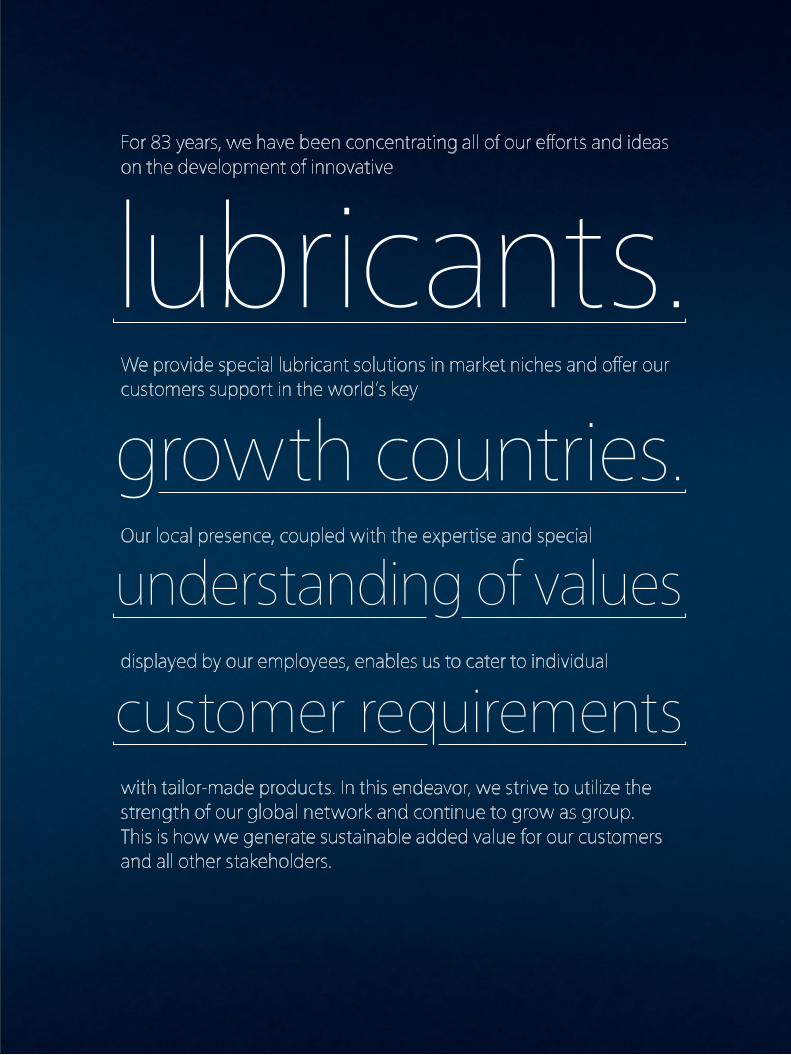
For 83 years, we have been concentrating all of our efforts and ideas on the development of innovative
We provide special lubricant solutions in market niches and offer our customers support in the world‘s key
growth countries.Our local presence, coupled with the expertise and special
understanding of valuesdisplayed by our employees, enables us to cater to individual
customer requirementswith tailor-made products. In this endeavor, we strive to utilize the strength of our global network and continue to grow as group. This is how we generate sustainable added value for our customers and all other stakeholders.
lubricants.

FUCHS at a glance
FUC HS PETROLUB GROU P
Amounts in € million 2013 2012Change
in %
Sales revenues 1 1,831.6 1,819.1 0.7
Europe 1,104.2 1,080.7 2.2
Asia-Pacifi c, Africa 497.9 486.8 2.3
North and South America 307.3 320.3 – 4.1
Consolidation – 77.8 – 68.7 13.2
Earnings before interest, tax and income from
companies consolidated at equity 298.8 278.8 7.2
in % of sales revenues 16.3 15.3
Earnings before interest and tax (EBIT) 312.3 293.0 6.6
Earnings after tax 2 218.6 207.0 5.6
in % of sales revenues 11.9 11.4
Investments in long-term assets 72.8 71.4 2.0
in % of scheduled depreciation 3 253 227
Gross cash fl ow 224.6 219.0 2.6
Shareholders’ equity 853.5 781.7 9.2
in % of balance sheet total 73.5 70.5
Balance sheet total 1,162.0 1,108.7 4.8
Employees as at December 31 3,888 3,773 3.0
Earnings per share (in €)
Ordinary share 3.06 2.90 5.5
Preference share 3.08 2.92 5.5
Proposed dividend / dividend (in €)
per ordinary share 1.38 1.28 7.8
per preference share 1.40 1.30 7.7
1 By company location.2 Previous year´s fi gures adjusted, see “Application of new accounting standards” in the notes to the consolidated fi nancial statements.3 Capital expenditure excluding fi nancial assets.
GROU P STRUC TURE
The Group is headed by the central-management controlling company, FUCHS
PETROLUB SE, which predominantly owns subsidiaries directly at 100%.
On December 31, 2013, the Group comprised 50 operating companies. The consoli-
dated fi nancial statements also include non-operating holding companies,
management companies and real-estate companies, thus increasing the number of
consolidated companies to 52. Of the 50 operating companies, fi ve conducted
their business activities in Germany and 45 abroad.
The organizational and reporting structure is divided into the following regions:
Europe, Asia-Pacifi c, Africa and North and South America.Results of operations of the regions
81

5
FUCHS at a glanceGroup companies and production locations
FU
CH
S A
T A
GL
AN
CE
GROU P COM PANIES AND PRODUC TION LOC ATIONS
As at December 31, 2013 Group companies 1 Production locations
Germany 5 6
Other European countries 22 7
Asia-Pacifi c 17 8
Africa 1 1
North America 3 7
South America 2 2
Total 50 31
1 Operating companies.
PRODUC TION LOC ATIONS

Content
4
2
portraits of FUCHS employees18 VALUES

Top performance – special medical engineering solutions 4
Growth course – interview with the Chairman of the Executive Board Stefan Fuchs 8
FUCHS in figures 10
On the Pulse – new production site in China 12
Values – portraits of FUCHS employees 18
12
3


Medical engineering is an exciting growth sector. FUCHS develops high- performance cutting fluids for the manufacture of implants and has been able to impress a group of discerning customers with its innovative power.
Text by Silke Wernet
TOPPERFORMANCE
5

The field of medical engineering is booming. This can largely
be attributed to the ever-increasing life expectancy of
human beings and a heightened sense of awareness for
health issues, as well as the rapid population growth
being encountered in the emerging markets, which stimu-
lates demand. However, the recent growth in this sector
would not even be possible without the specialized produc-
tion technology now available.
The global market for medical equipment, surgical instru-
ments, and in particular implants, which can significantly
improve the quality of life for patients, generated revenue of
around € 221 billion in 2012 and is growing at a steady
rate of around 7 % per year. The US represents the largest
market and, with revenue of around € 22 billion, Germany
was the number three player in the global business. Medical
engineering is a sector of the future, for which FUCHS
EUROPE SCHMIERSTOFFE has been developing innovative,
high-performance products for more than ten years.
The requirements of cutting fluids in the medical engi-
neering sector are vast. Besides stainless steels, the sector
is now increasingly using titanium and cobalt alloys in
the manu facture of implants. These materials excel through
their strength, but precisely this strength also makes
the metal cutting processes employed during production,
such as drilling or milling, more difficult. This requires
engineering excellence which is also needed from the cut-
ting fluid. To this end, the specialists at FUCHS develop
solutions tailored specifically to the respective process or
application. “We take the highly specific requirements of
our customers into our laboratory,” explains Frank Thomas,
Head of the “Non water miscible cutting and quenching
fluids” unit. “Quality”, adds Dr. Christine Fuchs, Head of
Global R & D, “is immensely important in this regard.”
Besides the specific performance, FUCHS therefore also
carries out comprehensive, in-depth tests of the long-term
availability of the raw mate rials used, as well as their com-
patibility for human beings.
C Y TOTOXICOLOGIC AL TESTS
Manufacturers of knee and hip implants or dental implant
pins always ensure that their products are absolutely media-
free and sterile before they are implanted in the human
body. However, a microscopic amount of residue, for example
from a cutting fluid, can lead to potential compli cations,
even after extremely intensive cleaning. “This is a highly sen-
sitive sector, for which we pre-screen our raw materials and
subject them to rigorous testing procedures,” stresses Frank
Thomas. The influence of all cutting fluids is therefore tested
thoroughly, including their influence on cell growth. Products
that have passed the test include PLANTOCUT 10 SR, a
cutt ing fluid made from synthetic ester oils based on renew-
able raw materials that is kind to skin and quickly biodegrad-
able. “These cytotoxicological tests offer manufact urers and
users the highest degree of security,” stresses the chemical
engineer. “And they are a USP that helps us stand out from
the rest of the market.” This also applies to service, as
FUCHS offers a complete all-around package – from initial
consulting, all the way through to regular process checks
on the customer’s premises.
GLOBAL EXCHANGE
Our specialist knowledge of these cutting fluids is not reserved
exclusively for our own laboratories. Indeed, a comprehen-
sive international employee network, which FUCHS is keen
to further expand over the course of the next few years,
ensures that the results of new research activities and infor-
mation on innovative technological processes flow into
the Group’s various locations around the globe. “We have an
» We can supply the medical engineering market at a very high level and on a global scale. «
Dr. Christine Fuchs, Head of Global R & D, FUCHS EUROPE SCHMIERSTOFFE
6
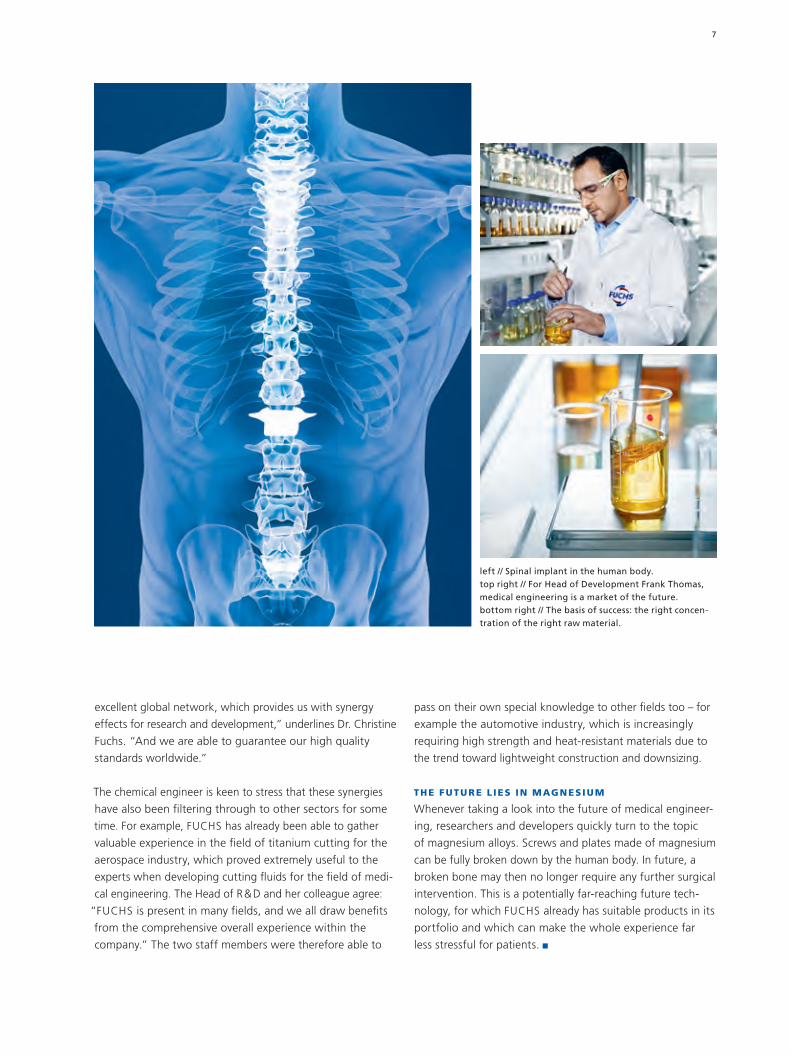
left // Spinal implant in the human body. top right // For Head of Development Frank Thomas, medical engineering is a market of the future.bottom right // The basis of success: the right concentration of the right raw material.
excellent global network, which provides us with synergy
effects for research and development,” underlines Dr. Christine
Fuchs. “And we are able to guarantee our high quality
standards worldwide.”
The chemical engineer is keen to stress that these synergies
have also been filtering through to other sectors for some
time. For example, FUCHS has already been able to gather
valuable experience in the field of titanium cutting for the
aerospace industry, which proved extremely useful to the
experts when developing cutting fluids for the field of medi-
cal engineering. The Head of R & D and her colleague agree:
“FUCHS is present in many fields, and we all draw benefits
from the comprehensive overall experience within the
company.” The two staff members were therefore able to
pass on their own special knowledge to other fields too – for
example the automotive industry, which is increasingly
requiring high strength and heat-resistant materials due to
the trend toward lightweight construction and downsizing.
THE FUTURE L IES IN MAGNESIUM
Whenever taking a look into the future of medical engineer-
ing, researchers and developers quickly turn to the topic
of magnesium alloys. Screws and plates made of magnesium
can be fully broken down by the human body. In future, a
broken bone may then no longer require any further surgical
intervention. This is a potentially far-reaching future tech -
no logy, for which FUCHS already has suitable products in its
portfolio and which can make the whole experience far
less stressful for patients.
7

GROWTHCOURSE
Mr. Fuchs, the motto of this annual report is “growing
together”. What does this statement mean for the
company and for you personally?
I really like the double meaning. We are keen to get stronger
as a company, while also growing together more closely
within the Group. The key here is for us to see ourselves as
one worldwide team and utilize our strengths. In terms of
achieving healthy growth, economic success is just as impor-
tant as having an effective corporate culture.
Where do the challenges lie when it comes to growing
together as a unit?
In China, for example, where we have been operating for 30
years, we have a lot of relatively young employees. We are
keen to include all of them as well as our new colleagues at
other foreign subsidiaries in our FUCHS culture to secure
the company’s success. At the same time, we also need to
advance the reputation and recognition of the entire Group
with its locations and regions, so that we can act as a unit.
What are the most important pillars of your growth
strategy for the next few years?
We are strengthening our global infrastructure by adding
new production sites in growth markets, such as China
and Russia, and in the future Brazil and Turkey. In addition
to this, we are investing a great deal to both optimize
and modernize our existing facilities, such as Chicago. The
significant investments in research and development are
most obviously apparent at our new development center in
Mannheim. In parallel, we are focusing on our customers:
we are keen to make their processes more efficient. In order
to implement this, we are establishing ourselves even more
as a technology-driven company with a strong focus on sales.
How important are the company’s employees in this
regard?
They play a key role, which is also expressed in our mission
statement. We welcomed many new colleagues in the field
of research and development and are still recruiting. Also in
sales we will continue to recruit. Finding skilled and qualified
employees is not easy, especially since we need so many.
However, we have recruited 400 new employees worldwide
in the last four years alone.
Your mission statement is “LUBRICANTS. TECHNOLOGY.
PEOPLE.” To what extent do these three pillars con tribute
to improving the company’s culture and economic success?
The mission statement describes our business model. We
focus on producing lubricants and supplying tribologic solu-
tions. We are technology-driven and interested in process-
oriented solutions for our customers. Our employees are what
makes the difference. Our model is based on our five core
Stefan Fuchs takes a glimpse into a successful future. The Chairman of the Executive Board at FUCHS explains how the company is set to grow with a focus on technology and sales – and the important role of the employees.
8

values: trust, creating value, respect, reliability and integrity,
which we pursue both internally and externally.
In which markets are you looking to grow?
Everywhere. However, we already have a relatively high
market share in mature markets such as Germany, which
makes further growth somewhat more difficult. This has
not stopped us achieving excellent results there and also in
Italy, France and England in 2013. In addition to this, we are
increasing our sales revenues significantly in growth regions
such as China and see further opportunities in North and
South America. Our broad regional base and the fact that
we cater to many different specialist areas will allow us to
continue our growth policy.
Where do you see the company in ten years?
Our company has enjoyed sound development in the last
few years, having recorded organic growth and continually
improved our profits. This is exactly the kind of performance
we are keen to continue in future, which is why we are
making long-term investments. With a global market share
of just under 2 %, there is still plenty of growth potential
to be tapped. We will implement our focused sales philoso-
phy even more efficiently and make further use of the
advantages offered by being a global Group. We are con-
tinuing to expand our business on a global scale and are
well equipped for the future.
The interview was conducted by MarcStefan Andres.
» We want to establish ourselves more as a technology-driven company with a strong focus on sales. «
Stefan Fuchs, Chairman of the Executive Board
9

is the average term of service in the Group
employee turnover rate (2012: 3.5 %)
FUCHS PETROLUB
10

higher earnings than cost of capital generated by FUCHS in 2013. FUCHS Value Added (FVA) is the Group’s
central key performance indicator (2012: €208.2 million).
of employees work in research and development
is the average increase in dividends over the last ten years.
11


ON THE PULSEFUCHS’ new facility in China is just half an hour away from the old manufacturing location. It is generously dimensioned, highly automated, and technologically state-of-the-art. The new facility is one of the largest production locations in the FUCHS Group and represents another milestone in the global growth initiative.
Text by MarcStefan Andres
13
Plant manager Chang Jianhui in Yingkou. China’s economy is enjoying rapid growth – and with it companies like FUCHS China.

The journey takes us over long, arrow-straight asphalt. Newly
constructed roads branch off to the right and left, passing
by large, as yet undeveloped plots of land. The Bohai Gulf, a
part of the Yellow Sea, is just a few miles away. In a few
years, the chemical park located near the coast in Yingkou
will be completely full – just like most of the other industrial
settlements in China. The economy is growing very quickly –
and with it companies such as FUCHS China, which is now
set to begin production operations at an ultra-modern facility
in the port city located in Northeast China.
“We are absolutely delighted to finally be able to start work
in the new halls,” comments Chang Jianhui. The 42-year-old is
head of the manufacturing operations in Yingkou, one of the
largest production locations in the FUCHS Group. Covering a
total area of around 860,000 square feet, the plant is nearly
the size of the main facility in Mannheim. The location com-
pletely replaces the old one in the city center, which began
production 25 years ago and was initially only capable of sup-
plying 200 tonnes per year.
Construction work on the new facility was completed in only
two years. FUCHS invested more than € 24 million to be able
to produce lubricants for vehicle manufacturers and automo-
tive suppliers, the steel industry, the mining industry, the
food industry, as well as the fields of transport and agricul-
ture. This is a calculated investment, as the market in China
is constantly growing. Indeed, business with international and
national companies in China contributes just under half of
the company’s sales revenue in the Asia-Pacific, Africa region –
and thereby around 13 % of total Group sales revenues. More
than 300 employees work at the headquarters (HQ) in
Shanghai, the facility in Yingkou and more than 15 branch
offices, as well as a large number of local warehouses.
PLENT Y OF SCOPE FOR FURTHER GROW TH
“There were two reasons why we wanted to construct a new
facility. Firstly, we had grown massively and needed more
space. And secondly, the city declared the area in which we
were manufacturing as a purely residential zone,” explains
Zhu Qingping, Head of FUCHS China. This is nothing unusual
in China, as the country’s cities are constantly growing. For
example, Yingkou, which is just over 1,000 miles from the
FUCHS HQ in Shanghai, now has 2.5 million residents. The
city has more or less grown around the production facility
since it was opened. “We have enjoyed excellent coopera-
tion with the Chinese authorities over the years and were
therefore able to locate an ideal plot of land for the new
facility with the support of the administration,” explains the
51-year-old, who joined FUCHS four years ago and was
previously able to gather a great deal of experience at one
US and one Chinese automotive supplier. He is very satis-
fied with the choice. “We have a good transport infrastructure
and enough space to grow.” We are already in a position
to increase production, which is set up in modules, year-on-
year. The site also offers expansion potential.
The new location looks impressive. When viewed from a dis-
tance, it is easy to make out the round gray tanks that hold
around 150 different base oils and more than 1,000 chemical
additives. These are also hard to tell apart from the slightly
smaller containers used to store finished products, such as
engine, transmission or machine oils for automotive manu-
facturers or other industrial enterprises. The process used in
the factory sounds relatively straightforward, as it is simply
a matter of mixing oils and chemicals together in tempera-
ture controlled vessels. However, the special expertise of
FUCHS lies in the detail. The precise composition of the mix
and the fine nuances in the processing steps ensure a high
quality product. “We produce around 2,000 products in this
way for various applications,” explains Zhu Qingping.
Location: Approximately 375 miles east of BeijingArea: Approximately 1,900 square milesResidents: Approximately 2,500,000Opening of new facility: 2013Employees: Approximately 150
Yingkou
14

He believes that the new facility will provide a powerful impe-
tus to implement the key maxims of his work even more
effectively: quality in production, service for customers and
product technology at competitive prices. Only when these
work in harmony can FUCHS achieve the targets it has set
itself in China. “We need to produce a product of outstand-
ing quality that is always consistent and for which customers
are willing to pay a fair price,” adds Zhu Qingping. This pro-
vides an indication of the perfectionism with which the team
in China works. “We have a measured customer satisfaction
rate of about 98 %, which we are keen to improve even
further. One example: our products need to be of the high-
est quality so that we can achieve this target.” All of the
processes are geared toward this. “We always comply with
stand ards, which also requires us to select our suppliers
very carefully and then continually train them.”
Maintaining a keen customer focus is equally as important.
“We not only offer perfect products, but also solutions,”
explains Zhu Qingping. For example our partners from the
top // The new production halls are generously dimensioned and perfectly set up for the processes.bottom left // Zhu Qingping, Head of China at FUCHS.bottom right // New tank farm for 150 base oils.
15

heavy industry or automotive sector are not experts when
it comes to oils and greases. Instead, they generally focus
their efforts on keeping tight control over their own proc ess-
es. “We support them in continually improving these proc-
esses and also optimizing our own portfolio. Simply selling
a product is not enough in our opinion.” For example, 24
staff members are currently working in-house at a major
German automotive manufacturer to ensure that the
FUCHS products are always used in the right places within
the large machine pool in operation.
The technologies utilized by FUCHS also have the added
advantage that they create value for customers. “This makes
our products slightly more expensive, which we obviously first
have to explain to our customers. Buying our products brings
a significantly higher benefit,” comments Zhu Qingping.
Works manager Chang Jianhui believes that the new facility
will help both him and his team achieve this. With his double
bachelor’s degree in polymer chemistry and industrial man-
agement, he is well prepared to meet all the requirements
associated with his position, including understanding and
further developing technologies – while at the same time
securing economic production. Chang Jianhui was heavily
involved in the processes for equipping, installing and later
also fitting out the facility. This has helped him establish a
high degree of identification with the manufacturing opera-
tions. In fact, Chang Jianhui is so involved that he actually
refers to the new halls as “heaven” – because they are so gen-
erously dimensioned and perfectly set up for the processes.
There are lots of differences from the old facility – where the
main storage area was located some 20 minutes away from
the production operations. At the new location, the ware-
house is integrated into the facilities. The new equipment
which has been installed in the high ceiling halls also pro-
vides a significantly higher degree of automation. “We can
operate the new facility with the same number of staff
members as the old one,” explains Chang Jianhui. The sub-
sidiary FUCHS CHINA employs a total of 336 people,
around 30 of whom work in production.
CORPOR ATE CULTURE MOTIVATES EM PLOYEES
Personnel is one of the most important factors for FUCHS,
explains Chang Jianhui, who previously worked for a US
mineral oil group. He knows what he is talking about here,
as he has experienced it first-hand. “I was really keen to
join the company, as I had heard so many positive things
about it. I already felt confident that I had made the right
decision during the interview, and this initial impression was
then confirmed when I started work here,” comments the
plant manager, who joined FUCHS in 2013. His employer is
highly specialized in its processes and products, which he
finds great. “But above all, the company relies heavily on its
workforce, in which it places a great deal of trust. This is
something that continually motivates me.”
Klaus Hartig likes to hear this, as he also relies on a well-
trained and efficient team. “Finding the right people for
this is not easy in China”, explains FUCHS’ Head of Asia,
who is responsible for Japan, Korea, and China. “In certain
areas, in particular sales and technology, the battle for
the best staff is in full flow, as there is a great deal of com-
petition among the various employers.” This is another
reason why FUCHS has a high quota of international employ-
ees in China, including staff from Italy, France, Great
» We are keen to grow in China, both with international and local customers.« Klaus Hartig, Executive Vice President FUCHS EAST ASIA
16

Britain, Australia, Singapore, Nepal, Japan, Russia, and of
course China and Germany. “We invest a great deal in quali-
fications, further training, and personnel recruitment to help
secure the best candidates.” Last year, the company invested
as much into coaching programs in one year as it had in
the previous seven years – a clear statement regarding the
importance of its personnel.
Hartig considers the new facility to offer ideal conditions for
achieving the clear objectives that FUCHS has in Asia. “We
are just as keen to grow with the international companies we
supply here in China as the Chinese companies that purchase
our products.” These two customer groups currently repre-
sent around one half each – which Hartig believes to be a
healthy mix, as they both still offer good growth opportu nities.
At the same time, the quality that other companies in China
can now offer has also improved drastically. “Chinese com-
panies have their own, excellent technologies,” stresses Hartig.
The larger enterprises in particular are likely to increasingly
expand across the Asian markets in the mid term, but then
also focus on other markets such as South Africa or Brazil
further down the line. “We will accompany them through-
out the world. With our broad network and many locations
worldwide, we can also demonstrate our skills and capacities
as a good partner.”
Chicago: Major investment
Kaluga: Modern production
Location: On the southwestern shore of Lake Michigan Area: Approximately 230 square milesResidents: Approximately 2,700,000Modernization and expansion of the facility: Since 2012Employees: 160
Location: Approximately 125 miles southwest of Moscow Area: Approximately 65 square milesResidents: Approximately 325,000Opening of new facility: 2013Employees: 20
FUCHS is investing € 23 million in the expansion and modernization of the facility at its central location in Harvey near Chicago. The US subsidiary has expanded its mixing plant, installed a fully automatic highrack warehouse and set up ultramodern LUBRODAL production facilities. An important aspect in this regard is that the new processes reduce airborne emissions and thereby help the company achieve its environmental protection targets. Thanks to these investments, FUCHS USA forms the foundation for future growth.
A stateoftheart production plant was constructed in the Russian city of Kaluga within just two years. FUCHS invested more than € 15 million here. The facility complies with the strictest standards in terms of quality, security, and environmental protection. The subsidiary FUCHS OIL RUSSIA, which operates offices in Moscow, St Petersburg, Yaroslavl, and Jekaterinburg, offers a wide range of lubri cants – for example supplying both local and inter national customers from the automotive industry, the steel industry, the mining industry, the automotive supply industry, the food industry, as well as the transport and agriculture sectors.
17

VALUES»LUBRICANTS. TECHNOLOGY. PEOPLE.« The mission statement stands for the FUCHS business model and is founded on five elementary values. These point the way in the day-to-day work of employees all over the world.
TRUST
Fair and open dealings with one another are valued highly at
FUCHS. Mutual trust is the basis for teamwork. This was
the experience of Arleta Cegielska from the very beginning.
“Although we are still trainees, a great deal of trust is placed
in us, even by managers,” emphasizes the prospective office
clerk, who works at the Group headquarters in Mannheim.
And this is also the case when working independently. “Our
factory shop is a good example of this,” says the 21-year-
old, “as it is fully run by trainees.”
C REATING VALUE
The people at FUCHS delight Steve Puffpaff. “They work with
such great commitment every day – not just for the com-
pany, but also for our customers with their specific needs,”
explains the President and CEO, who is responsible for the
North American business in the Group. He describes how the
FUCHS employees are always on the lookout for the best
possible solution. “Together with leading technologies, our
top-quality products and first-class service, we create added
value for our customers,” stresses the 45-year-old. “The em-
ployees play a significant part in this and can be proud of
their efforts.”
Arleta Cegielska | trainee FUCHS EUROPE SCHMIERSTOFFE | Germany
Steve Puffpaff | President and CEO FUCHS LUBRICANTS (CO.) | USA
18

RESPEC T
Tebogo Mokoena likes to get to the heart of the matter:
“I always wanted to know which individual components are
behind chemical products.” At FUCHS the 31-year-old
turned this passion into a career and feels very happy in his
role as a Laboratory Manager. “Recognition,” says the
South African, “and the appreciation of every staff member
are especially important in my day-to-day work.” The
chemist, who has worked in the Group since 2008, believes
that these values are firmly anchored in the corporate cul-
ture. “If we respect one another, we will achieve our goals
together.” Tebogo Mokoena | Laboratory Manager FUCHS LUBRICANTS (S.A.) | South Africa
RELIABIL IT Y
The Italian Cristina Delmastro has worked for FUCHS since
1996. Today, the Marketing Assistant experiences a Group in
which the mission statement and its values are lived to the
full at all levels and departments. “We have a very exact idea
of this corporate culture and understand it as our mission,”
remarks the 39-year-old, who sees it as one of the strengths
of the FUCHS Group. It is also apparent in the relationship
with customers and suppliers: “They can all count on our reli-
ability. Regardless of whether it’s about day-to-day coopera-
tion or the quality of our products.” Cristina Delmastro | Marketing Assistant FUCHS LUBRIFICANTI (S.P.A.) | Italy
INTEGRIT Y
Roman Brandys previously worked in the mining industry.
When he wanted to make a career change 18 years ago, he
joined FUCHS. Today the Czech maintains intensive contact
with customers as an Industry Sales Representative and knows
that customers particularly value a partner who acts with
integrity. He therefore follows the Code of Conduct which is
based on moral values and serves as a guide for all employ-
ees. “It has a very positive influence on my work,” says the
45-year-old, who also sees teamwork as another important
element in global business.Roman Brandys | Sales Representative Industry FUCHS OIL CORP. (CZ) | Czech Republic
19

11.1 Letter to our shareholders 23
1.2 Organization 26
1.3 Report of the Supervisory Board 31
1.4 Corporate Governance Report 36
1.5 Sustainability report 48
1.6 Disclosure required under takeover law pursuant to Section 315 (4) of the German Commercial Code (HGB) 53
1.7 FUCHS shares 56
2 G R O U P M A N A G E M E N T R E P O R T
2.1 Corporate profile 63
2.2 Economic framework 73
2.3 Sales revenues (performance) 76
2.4 Results of operations 79
2.5 Net assets and financial position 88
2.6 Overall position and performance indicators 95
2.7 Supplementary report 98
2.8 Opportunity, risk and forecast report 99
2.9 Legal disclosures 112
mobile.fuchs-oil.com
Reference to our mobile website.
Scan the QR code with your smartphone
for information on FUCHS in just
a few clicks when you are on the go.
M A N A G E M E N T & S H A R E S

3 F I N A N C I A L R E P O R T F U R T H E R I N F O R M AT I O N
3.1 Consolidated financial statements of FUCHS PETROLUB SE 115
3.2 Notes to the consolidated financial statements 126
3.3 Independent auditor’s report 204
3.4 FUCHS PETROLUB SE (HGB) 206
3.5 Proposal on the appropriation of profits 207
Glossary 208
Imprint 210
Front cover
FUCHS at a glance
Group companies and production locations
Back cover
Ten-year overview
Financial calendar
Glossary reference Page reference Internet link
a–z 123 www

1 M A N A G E M E N T & S H A R E S
1.1 Letter to our shareholders 23
1.2 Organization 26■■ Corporate Boards 26■■ The Executive Board 28■■ Group Management Committee 30
1.3 Report of the Supervisory Board 31
1.4 Corporate Governance Report 36■■ Declaration of Corporate Governance 37■■ Main features of FUCHS PETROLUB SE’s compensation system for members of the Executive Bodies 46
1.5 Sustainability report 48
1.6 Disclosure required under takeover law pursuant to Section 315 (4) of the German Commercial Code (HGB) 53
1.7 FUCHS shares 56

23M A N A G E M E N T & S H A R E S1.1 Letter to our shareholders
In 2013, the Group was able to generate record earnings for the fifth consecutive year after
the decline due to the crisis in 2008. The growth initiative we launched six years ago is
bearing fruit. Sales revenues grew organically by 4 % thanks to sound volume developments.
The Asia-Pacific region generated the biggest growth, although the two other global
regions also recorded increases. Earnings before interest and tax (EBIT) increased by almost
7 %, in particular due to positive contributions from Western Europe and Asia.
Further improved earnings and balance sheet figures motivated us to propose another
increase in dividends of just under 8 % for the year 2013 to the Annual General Meeting.
This would make the dividend increases of the last three years in excess of 50 %. In addi-
tion to this, we also launched a share buyback program at the end of 2013 with a scope
of €100 million. Almost a quarter of this volume had been completed by the end of
2013. These measures are based on our confidence in further profitable growth of FUCHS
PETROLUB.
Our growth initiative is globally aligned and focuses on various sales activities. Numerous
new hirings in the areas of sales and research, as well as investments in our key facilities, in
emerging markets and in our research and development capacities form the basis for
these activities. In the last four years, we have created 400 new jobs. Over 70 % of all new
staff were recruited in the areas of sales and research & development. In the last two
years, we have also made record investments of approximately € 70 million per year. Two
key items to highlight in this regard are our large-scale facilities in Yingkou / China and
Kaluga / Russia, both of which were completed in 2013. These two locations were ceremo-
nially inaugurated and will commence full production in the first half of 2014. We also
successfully completed investments at our Chicago location in 2013, having installed an
automated high-bay warehouse and established a new site for production of die lubri-
cants for the forging industry.
Letter to our shareholders

24 M A N A G E M E N T & S H A R E S
Stefan Fuchs, Chairman of the Executive Board

25M A N A G E M E N T & S H A R E S1.1 Letter to our shareholders
Our motivated and loyal worldwide workforce is the key to our success. In 2013 we embed-
ded our corporate mission statement LUBRICANTS.TECHNOLOGY.PEOPLE. further and
more deeply within our organization. It is built on our five core values of trust, creating value,
respect, reliability and integrity. Promoting talent as well as training and developing
skilled personnel in our global network were important concepts in this regard. The open
and significantly more efficient communication established in our global research and
development activities represents another key improvement achieved in 2013. This interac-
tion helps us react to customer requirements more quickly and with greater innovation,
while also aligning production processes, quality standards, and our range of raw materials
more effectively with one another across the globe.
For 2014, we are once again planning to increase sales revenues and earnings in all global
regions. However, this is subject to further positive development of the global economy,
despite the known risks. We anticipate stable raw material costs and are working on a large
number of promising customer projects. In addition to this, we will examine and if
applicable utilize opportunities that arise from the consolidation of the lubricants industry.
On behalf of my colleagues on the Executive Board, I would like to thank you, the sharehold-
ers of FUCHS PETROLUB SE, for your trust in our company, its management, and its
global team. I would also like to take this opportunity to thank all employees for their per-
sonal contributions in 2013 and for their excellent teamwork.
Mannheim, March 19, 2014
Stefan Fuchs
Chairman of the Executive Board

26 M A N A G E M E N T & S H A R E S
CORPORATE BOARDS
SU PERVISORY BOARD
Dr. Jürgen Hambrecht Chairman
Neustadt an der Weinstraße Former Chairman of the Executive Board of BASF SE
Dr. Dr. h. c. Manfred Fuchs Deputy Chairman
Mannheim Former Chairman of the Executive Board of FUCHS PETROLUB SE
Ines Kolmsee Chairwoman of the Executive Board at SKW Stahl-Metallurgie
Tutzing Holding AG
Horst Münkel* Chairman of the joint works council of
Mannheim FUCHS EUROPE SCHMIERSTOFFE GMBH
Lars-Eric Reinert* Chairman of the European SE works council and the
Altenholz Group works council of FUCHS PETROLUB SE
Dr. Erhard Schipporeit Former member of the Executive Board of E.ON SE
Hannover
COMMIT TEES OF THE SU PERVISORY BOARD
Personnel Committee
Dr. Jürgen Hambrecht (Chairman)
Dr. Dr. h. c. Manfred Fuchs (Deputy Chairman)
Ines Kolmsee
Audit Committee
Dr. Erhard Schipporeit (Chairman)
Dr. Dr. h. c. Manfred Fuchs
Ines Kolmsee
Nomination Committee
Dr. Jürgen Hambrecht (Chairman)
Dr. Dr. h. c. Manfred Fuchs (Deputy Chairman)
Ines Kolmsee
Dr. Erhard Schipporeit
Information on the Corporate Boards
194
Organization
* Employee representative

271.2 OrganizationM A N A G E M E N T & S H A R E S
EXECUTIVE BOARD
Stefan R. Fuchs Chairman
Hirschberg
Dr. Alexander Selent Deputy Chairman
Limburgerhof
Dr. Lutz Lindemann Member
Kerzenheim
Dr. Georg Lingg Member
Mannheim
Dr. Ralph Rheinboldt Member
Heddesheim
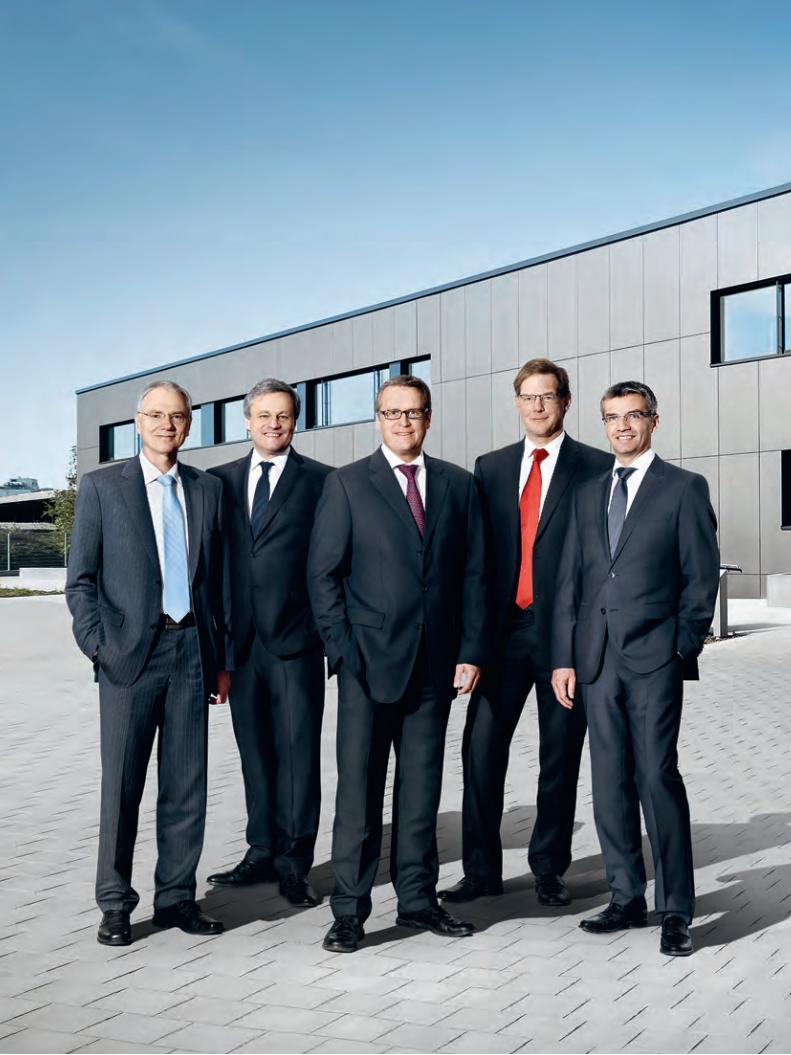

THE EXECUTIVE BOARD
DR. ALEXANDER SELENTAge 61, 15 years at FUCHS
DEPUT Y CHAIRMAN OF THE
EXECUTIVE BOARD
Finance, Controlling Legal, Taxes, Human Resources Investor Relations, Compliance IT, Internal Auditing
DR. GEORG LINGGAge 49, 18 years at FUCHS
MEMBER OF THE EXECUTIVE BOARD
Region Asia-Pacific and Africa International Mining Business
STEFAN R . FUCHS Age 46, 17 years at FUCHS
CHAIRMAN OF THE EXECUTIVE BOARD
Corporate Development, Senior Management Region North America FUCHS LUBRITECH Group Public Relations, Sustainability
DR. LUTZ LINDEMANNAge 53, 15 years at FUCHS
MEMBER OF THE EXECUTIVE BOARD
Technology Supply Chain Management Region South America International OEM Business
DR. RALPH RHEINBOLDTAge 46, 15 years at FUCHS
MEMBER OF THE EXECUTIVE BOARD
Region Europe
29

30 M A N A G E M E N T & S H A R E S
GROUP MANAGEMENT COMMIT TEE
Stefan R. Fuchs
Dr. Alexander Selent
Dr. Lutz Lindemann
Dr. Georg Lingg
Dr. Ralph Rheinboldt
Bernhard Biehl FUCHS LUBRITECH Group
Klaus Hartig Region East Asia
Stefan Knapp Region Germany
Carsten Meyer Global OEM Division
Steve Puffpaff Region North America
Reiner Schmidt Finance and Controlling
Alf Untersteller Region Turkey, Middle East, Central Asia, Africa
Allocation of duties
29
1.2 Organization

311.3 Report of the Supervisory BoardM A N A G E M E N T & S H A R E S
Report of the Supervisory Board
The FUCHS PETROLUB Group can look back on a very successful financial year 2013. It was a
year in which the Group again set new records in terms of sales revenues and earnings. The strategy
of organic growth is successful.
Work performed by the Executive Board and Supervisory Board
The Supervisory Board performed its monitoring and advisory duties with care and conscien-
tiousness in accordance with the requirements of law, the company’s Articles of Association, and the
rules of procedure.
The Supervisory Board and Executive Board cooperated fully and effectively in the financial year
2013. The Chairman of the Executive Board regularly and immediately informed the Chairman of the
Supervisory Board of all significant and important events. In addition to this, the Supervisory
Board and Executive Board also remained in close contact outside scheduled meetings to ensure a
constant exchange of information and opinions.
In its December 2013 meeting, the Supervisory Board also examined the efficiency of its own activi-
ties and did not determine any significant need for improvement in this regard. The Supervisory
Board comprised a sufficient number of independent members. No conflicts of interest occurred
among members of either the Executive Board or the Supervisory Board.
There were no changes in personnel on either the Executive Board or the Supervisory Board in the
financial year 2013.
Reports and board meetings
Two Supervisory Board meetings of FUCHS PETROLUB AG and four Supervisory Board meetings of
FUCHS PETROLUB SE were held in 2013. All members of the Supervisory Board took part in these.
The Supervisory Board was regularly, timely, and comprehensively informed, both in writing and orally,
about the company’s corporate policy, business developments, profitability, liquidity and risk situa-
tion, as well as all relevant questions regarding strategic enhancements in accordance with the duties
set out in the rules of procedure. Further regular items on the agenda included budget supervision,
all significant investment and acquisition projects, the further development of the corporate gover-
nance rules, the change in corporate form into an European company (Societas Europaea, SE)
and the legal dispute with our joint venture partners in the Middle East. Following thorough exam-
ination and consultation, the Supervisory Board approved the proposed resolutions of the Execu-
tive Board, insofar as this was necessary based on applicable legislation or the company’s Articles of
Association.

32 M A N A G E M E N T & S H A R E S
In the balance sheet meeting on March 19, 2013, the annual and consolidated financial statements
of FUCHS PETROLUB AG, the Executive Board’s proposal on the appropriation of profits, and
the dependent company report were reviewed, discussed, and approved in the presence of the auditor.
In this meeting, the Supervisory Board approved the agenda for the Annual General Meeting of
FUCHS PETROLUB AG with the proposed resolutions, in particular the proposed resolution to change
the corporate form of FUCHS PETROLUB AG into an European Company (SE). In addition,
the Super visory Board looked into the strategy for the growth region of Asia-Pacific and Africa.
In the meeting on May 8, 2013, which was held just before the Annual General Meeting, the Execu-
tive Board reported on the business performance of the Group after the end of the first quarter.
The constituent meeting of the Supervisory Board of FUCHS PETROLUB SE was held following the
Annual General Meeting. During this meeting, the Chairman and Deputy Chairman of the Super-
visory Board of FUCHS PETROLUB SE, the members of the individual Supervisory Board Committees,
as well as their respective Chairman and Deputy Chairman were all appointed. The Supervisory
Board also appointed the members of the Executive Board of FUCHS PETROLUB SE, as well as its
Chairman and Deputy Chairman.
Dr. Jürgen Hambrecht, Chairman of the Supervisory Board

331.3 Report of the Supervisory BoardM A N A G E M E N T & S H A R E S
In the meeting held on July 25, 2013, the Supervisory Board examined the 2013 half-year report, as
well as the Group Management Report containing information on investment and acquisition
projects. Changes in the German CORPOR ATE GOVERNANCE Code and new stock corporation pro-
visions that might come into force in Germany were also on the agenda. This was followed by a
presentation by Prof. Dr. h.c. Teltschik on the topic of “The world in turbulence” with a subsequent
discussion on the potential implications for FUCHS PETROLUB SE.
The meeting on October 7 and 8, 2013 was held at the Head Quarter of the US subsidiary FUCHS
LUBRICANTS CO. in Chicago. The main focus of these meetings were the strategies for the North and
South America region. In addition to this, the topic of data security to combat / prevent industrial
espionage was discussed and the Supervisory Board was informed of the constituent meeting of the SE
works council.
The focus of the meeting held on December 9, 2013 was the 2014 budget, including earnings,
the balance sheet, cash flow, investments, and the continuation of the growth initiative for the years
2014 and 2015. Beside this, the Supervisory Board also reviewed the risk management and com-
pliance report, as well as the 2013 DECL AR ATION OF COMPL IANCE . In addition, the Supervisory Board
laid down the performance factor for calculating the variable compensation of the members of
the Executive Board for the financial year 2013 based on the calculated target achievement. It also set
out the targets for the financial year 2014 and adjusted the fixed annual compensation for Exec-
utive Board members in 2014. A vertical and horizontal review of the compensation system confirmed
its appropriateness.
Work of the committees in the Supervisory Board
The Supervisory Board has formed three committees: the Audit Committee, the Personnel Committee
and the Nomination Committee. Information on the activities of the committees was provided
at the start of each Supervisory Board meeting. All committee members took part in the committee
meetings. The composition of the three committees is presented on page 26.
The Audit Committee held four meetings in the reporting year. The CFO and the heads of the
Finance, Controlling and Accounting departments regularly attended the meetings. The auditors were
present at two meetings. The committee focused on the annual and the consolidated financial
statements, monitoring of the financial accounting process, the effectiveness of the internal control
system, of the risk management system, of the compliance management system, and of the inter-
nal audit system, as well as the audit of the financial statements. The interim financial reports were
always discussed in detail prior to publication. The Audit Committee also provided the Supervisory
Board with a recommendation for the Supervisory Board’s proposal to the Annual General Meeting
regarding selection of the auditor. In addition to this, the Audit Committee defined the focuses
of the audit for the reporting year, awarded the audit assignment to the auditor, and addressed both
the new accounting regulations and current com pliance issues. A report was also given on the
random inspection performed by the German Financial Reporting Enforcement Panel (DPR), which
did not lead to any complaints.
Glossary page 208
a–z
Glossary page 208
a–z
Corporate Boards
26

34 M A N A G E M E N T & S H A R E S
The Personnel Committee supports the Supervisory Board in reaching personnel decisions.
Two meetings were held in the reporting year. The Personnel Committee addressed in detail the top-
ics of diversity and the appropriate involvement of women in management positions at the com-
pany. In addition to this, the committee discussed personnel development throughout the Group,
further development of junior managers in the FUCHS PETROLUB Group, and prepared the deci-
sions regarding the compensation, allocation of responsibilities and extension of contracts for mem-
bers of the Executive Board.
The Nomination Committee did not meet in the reporting year.
Audit of annual and consolidated financial statements
The Audit Committee of the Supervisory Board awarded the audit assignment to KPMG AG
Wirtschaftsprüfungsgesellschaft in Mannheim as per the resolution passed by the Annual General
Meeting on May 8, 2013. The auditor’s declaration of independence was submitted and explained.
The financial statements for the financial year 2013, prepared pursuant to the German Commer-
cial Code (HGB), as well as the management report, the consolidated financial statements prepared
pursuant to the I FRS international accounting standards to be applied in the EU, and the Group
management report of FUCHS PETROLUB SE were audited and granted an unqualified auditor’s
opinion by KPMG AG Wirtschaftsprüfungsgesellschaft in Mannheim. The focuses of the audit
defined for the reporting period by the Audit Committee upon the appointment of the auditors were
examined in more detail by KPMG. In particular the company’s auditor confirmed that the Exec-
utive Board had installed a suitable risk monitoring system in accordance with Section 91 (2) of the
German Stock Corporation Act (AktG), which is appropriate for early identification of any devel-
opments which might endanger the going concern of the company. During the audit, the auditor did
not determine any issues / facts that would contradict the Declaration of Compliance or any issues
that might give rise to statements of exclusion or reservation in the auditors’ report. The Supervisory
Board conducted its own thorough examination of the annual and consolidated financial state-
ments, the company and the Group management reports and the proposal on appropriation of profits.
The audit reports of KPMG were submitted to all members of the Supervisory Board in good time
and were discussed comprehensively in the Audit Committee as well as in the balance sheet meeting
on March 19, 2013. The auditor who took part in both meetings reported on the main results of
the audit and was available to answer any questions or provide extra information. The Supervisory
Board took note of and approved the results of the audit performed by the independent auditors.
There are no objections based on the final results of the audit of the Audit Committee and of our own
audit. The Supervisory Board approved the financial statements submitted by the Executive Board
and thereby also the annual financial statements of FUCHS PETROLUB SE. We agreed with the pro-
posal regarding the appropriation of profits.
Glossary page 209
a–z

351.3 Report of the Supervisory BoardM A N A G E M E N T & S H A R E S
The Executive Board reported on its relationship to associated companies pursuant to Section 312
of the German Stock Corporation Act (AktG) and submitted this report to the Supervisory Board.
The external auditors examined the report, submitted in writing the results of this examination
and issued the following audit opinion: “We have audited in accordance with our professional duties
and confirm that
1. the actual statements made in the report are correct and
2. the payments or other contributions made by the company in connection with the legal transac-
tions listed in the report were not unreasonably high.”
The Supervisory Board took note of and approved the results of the audit performed by the inde-
pendent auditors. In keeping with its own findings, the Supervisory Board has no objections to the
statement made by the Executive Board.
Thanks
The Supervisory Board would like to thank the members of the Executive Board, all employees
worldwide and the employee representatives for their dedicated commitment, personal contributions
and constructive cooperation for the benefit of the company.
Mannheim, March 19, 2014
The Supervisory Board
Dr. Jürgen Hambrecht
Chairman of the Supervisory Board

36 M A N A G E M E N T & S H A R E S
In the following chapter, the Executive Board reports – also on behalf of the Supervisory Board – on
corporate governance at FUCHS PETROLUB SE in line with Section 3.10 of the German Corporate
Governance Code. The chapter also contains the Declaration of Corporate Governance in accordance
with Section 289 a of the German Commercial Code (HGB).
Corporate governance at FUCHS PETROLUB SE is predominantly based on the regulations of the
German Stock Corporation Act (AktG) and the German Corporate Governance Code. The Corporate
Governance Code contains important regulations on managing and monitoring listed companies
and also formulates both nationally and internationally recognized standards for sound and respon-
sible corporate governance.
FUCHS PETROLUB SE sees corporate governance as a central prerequisite for achieving its com-
pany targets and increasing company value. We believe that sound and responsible management and
supervision geared towards sustainable added value in particular include
■■ close and trusting cooperation between Executive Board and Supervisory Board■■ respect for shareholders’ interests■■ open corporate communication■■ transparency in accounting■■ responsible handling of opportunities and risks■■ sustainable business activities.
We are convinced that effective and transparent corporate governance is a key factor in the success
of FUCHS PETROLUB SE. Corporate governance therefore plays an important part in how we
see ourselves and is a standard that covers all departments and divisions within the company. Inves-
tors, financial markets, business partners, employees and the general public put their trust in us.
We are keen to confirm this trust in the long term and also continuously further develop corporate
governance in the Group.
On multiple occasions throughout the last financial year, the Executive Board and Supervisory Board
at FUCHS PETROLUB SE once again examined and addressed the stipulations of the Corporate
Governance Code and the changes that have been implemented in detail, paying particular attention
to the requirements regarding the independence of members of the Supervisory Board and taking
into account the concepts of diversity and giving appropriate consideration to women when filling
management positions in the company. On this basis, the Executive Board and Supervisory Board
together submitted the updated Declaration of Compliance pursuant to Section 161 of the German
Stock Corporation Act (AktG) on December 9, 2013 and made it available to shareholders on the
company’s website – together with the declarations of previous years (see page 45 of this report).Text of the declaration of conformity
45
Corporate Governance Report
371.4 Corporate Governance ReportM A N A G E M E N T & S H A R E S
DECLARATION OF CORPORATE GOVERNANCE*
MANAGEMENT AND CONTROL STRUC TURE – WORKING PR AC TIC ES OF THE EXECUTIVE BOARD AND SU PERVISORY BOARD
As an European corporation (Societas Europaea – “SE”), FUCHS PETROLUB SE, with its registered
office in Mannheim, is subject in particular to the provisions of the SE Regulation and of the German
Stock Corporation Act (AktG), on the basis of which the German Corporate Governance Code
was also developed. A basic principle in German stock corporation law is the two-tier board system
with the Executive Board and Supervisory Board bodies, each of which has independent respon-
sibilities. This two-tier board system was also retained following the conversion to an SE. Sound cor-
porate governance requires continuous further development of this two-tier board system, with
all divisions being included. This begins with independent and responsible corporate management
by the Executive Board which is monitored and advised by the Supervisory Board.
CORPOR ATE MANAGEMENT BY THE EXECUTIVE BOARD
The Executive Board holds responsibility to act as the management body and is bound both to the
company’s interests and to sustainably increasing company value. The members of the Executive
Board together hold responsibility for the entire company management. Notwithstanding the over-
all responsibility of the Executive Board, the individual members of the Executive Board also man-
age the divisions assigned to them under their own responsibility within the scope of Executive Board
resolutions. Rules of procedure specify in more detail the work of the Executive Board. The distri-
bution of responsibilities to the individual members of the Executive Board is set out in the schedule
of responsibilities. For key business processes – such as specifying annual planning or major acqui-
sitions – the rules of procedures for the Executive Board include gaining approval of the Supervisory
Board for its actions.
The Executive Board reaches decisions on key issues regarding corporate policy and strategy, as
well as annual and multi-year planning. The Executive Board ensures appropriate risk management
and risk controlling in the company, working towards compliance with legal regulations, regula-
tory stipulations and internal company guidelines (compliance). It also pays attention to diversity and
ensuring appropriate consideration is given to women when filling management positions at the
company. At FUCHS, 21 % of management positions within the Group are held by women. There are
currently no women on the Executive Board. FUCHS strives for systematic and targeted promo-
tion of qualified women considering them appropriately when filling Executive Board and manage-
ment positions.
* Part of the Group management report
38 M A N A G E M E N T & S H A R E S
The Executive Board at FUCHS PETROLUB SE was made up of five members in 2013. The com-
position of the Executive Board and the allocation of duties within the Executive Board (organization
of responsibilities, regions and segments) are shown in detail on pages 29 of this annual report.
MONITORING OF CORPOR ATE MANAGEMENT BY THE SU PERVISORY BOARD
The Supervisory Board appoints the members of the Executive Board, defines the responsibilities
of the members of the Executive Board and both advises and monitors the Executive Board in its man-
agement of the company. It is included in strategy and planning, as well as in all questions of fun-
damental importance for the company. The Chairman of the Executive Board maintains regular contact
with the Chairman of the Supervisory Board. The continuous dialog between the Executive Board
and the Supervisory Board, which is based on mutual trust, forms an important foundation for the
company’s success.
The Supervisory Board at FUCHS PETROLUB SE is made up of four shareholder members, who are
elected by the Annual General Meeting, as well as two members who are elected by the employees.
The terms of office are identical.
The Supervisory Board reaches its decisions through resolutions, which are passed by a simple
majority of those members of the Supervisory Board participating in the vote. In the event of a tied
vote, the Chairman has the casting vote.
The Supervisory Board at FUCHS PETROLUB SE is composed in a way that ensures qualified moni-
toring and advising of the Executive Board by the Supervisory Board. Based on their knowledge,
skills and specialist experience, the candidates to be proposed for election to the Supervisory Board
should be capable of performing the duties required of a member of the Supervisory Board at
an international Group such as FUCHS PETROLUB SE and preserve the reputation of the FUCHS
PETROLUB Group in the public arena. In its composition, the Supervisory Board primarily focuses
on qualifications and diversity, striving also for appropriate involvement of women. In this context
“diversity” is understood to mean diversity in terms of internationality (not in the sense of citi-
zenship, but rather origin, upbringing, training and career), gender and age. Based on Section 5.4.1
of the Code, the Supervisory Board has set the following targets for its composition:
The Executive Board
29

391.4 Corporate Governance ReportM A N A G E M E N T & S H A R E S
■■ The required knowledge, skills and specialist experience refer in particular to the management of
an international company■■ Special economic knowledge and experience is to be considered■■ Special knowledge and experience in the application of financial accounting principles and internal
control procedures■■ Technical expertise, in particular in the field of (special) chemicals is to be considered■■ Appropriate involvement of women in the Supervisory Board for new appointments■■ An appropriate number of independent members of the Supervisory Board; of the four shareholder
representatives on the Supervisory Board, at least two should be independent in the sense of
Section 5.4.2 of the Code■■ Prevention of significant and not only temporary potential conflicts of interest■■ The (standard) age limit of 70 years at the time of election is to be considered
The Supervisory Board is of the opinion that it complies with the diversity requirements, as a female
ratio of 25 % of shareholder representatives on the Supervisory Board has been achieved and
the internationality criterion was also fulfilled. The Supervisory Board also believes that it includes an
appropriate number of independent shareholder representatives.
Dr. Dr. h. c. Manfred Fuchs, former member of the Executive Board at FUCHS PETROLUB SE, has
been a member of the Supervisory Board since 2004. He is the only member of the Supervisory
Board that holds an appreciable share in the company and that has a personal relationship both to the
company and its Executive Board. According to the Supervisory Board’s rules and procedures,
shareholder representatives on the Supervisory Board must always be independent. The members of
the Supervisory Board hold or used to hold executive positions at other companies. However, any
and all business conducted between FUCHS PETROLUB SE and these companies has always taken
place under the same conditions as with third parties (arm’s length transactions). In our opinion,
these transactions (which together represent around 5 % of total sales revenues) do not affect the
independence of the members of the Supervisory Board in question.
The term of office of the Supervisory Board is five years. The next term of office starts with the end
of the Regular Annual General Meeting 2015.
Information on the composition of the Supervisory Board and its Committees is also provided on
page 26 of this annual report. The report by the Supervisory Board on pages 31 onwards provides
further details of the work performed by the Board in the reporting year. Organization and Report of the Supervisory Board
26 31

40 M A N A G E M E N T & S H A R E S
The main features of the company’s compensation system for members of the Executive Bodies
are described on pages 46 and 47 of this report. The compensation for members of the Executive
Board and the compensation for the individual members of the Supervisory Board in accordance
with Section 314 (1) No. 6 of the German Commercial Code (HGB) are disclosed in the notes to the
consolidated financial statements on page 196 ff.
COMMIT TEES OF THE SU PERVISORY BOARD
The Supervisory Board at FUCHS PETROLUB SE has formed three professionally qualified committees,
which prepare and also supplement its work. The duties, responsibilities and work processes are
all aligned with the requirements of the Corporate Governance Code and also take into account the
binding regulations of the German Stock Corporation Act (AktG).
The Personnel Committee and Audit Committee meet several times a year, while the Nomination
Committee only convenes for meetings when these are necessary based on its allocation of duties.
The respective Chairmen of the Committees regularly report to the Supervisory Board on the work
of the Committees.
OWNERSHIP OF SHARES IN THE COM PANY BY MEMBERS OF THE EXECUTIVE AND SU PERVISORY BOARDS
As at December 31, 2013, Stefan Fuchs held directly and indirectly 4,491,664 ordinary shares.
The other members of the Executive Board together held 3,129 ordinary shares and 4,335 preference
shares as at December 31, 2013.
As at December 31, 2013, Dr. Dr. h. c. Manfred Fuchs held directly and indirectly 1,177,683 ordinary
shares. The other members of the Supervisory Board together held 624 ordinary shares and 3,500
preference shares as at December 31, 2013.
As per Section 15 a of the German Securities Trading Act (WpHG), members of the Executive Board
and the Supervisory Board are legally obliged to declare any acquisition or sale of shares in
FUCHS PETROLUB SE or any other related financial instruments if the value of these transactions
conducted by the members or persons related to them reaches or exceeds the sum of € 5,000
within one calendar year. The transactions reported to FUCHS PETROLUB SE in the reporting year
were duly published and can be viewed on the company’s website at www.fuchs-oil.com /
directorsdealing.html.
Corporate Governance and Consolidated financial statements
46 196
Further information at www.fuchs-oil.com / directorsdealing.html
www

411.4 Corporate Governance ReportM A N A G E M E N T & S H A R E S
SHAREHOLDERS AND THE ANNUAL GENER AL MEETING
FUCHS PETROLUB SE has issued both ordinary and preference shares. The holders of ordinary
shares represented at the Annual General Meeting reach decisions on all tasks assigned to them by
law (for example appropriation of earnings, amendments to the Articles of Association, election
of members of the Supervisory Board, approval of the Executive Board and the Supervisory Board,
measures affecting the capital structure and selection of the auditor). Each ordinary share autho-
rizes the holder to one vote. The Schutzgemeinschaft Familie Fuchs holds around 52 % of the ordinary
shares. While the preference shares only grant voting rights in the cases prescribed by law, they
grant the holders a preference right on the distribution of unappropriated profit and entitle them to
an additional dividend (preference).
The holders of ordinary and preference shares exercise their codetermination and control rights at the
Annual General Meeting held at least once a year. In compliance with the statutory and legal con-
ditions, every shareholder is entitled to participate in the Annual General Meeting. Shareholders who
do not wish to or are unable to attend the Annual General Meeting in person can have their vot-
ing right exercised by a voting representative (proxy), such as a bank, a shareholders’ association or
a voting representative appointed by the company, by granting power of attorney.
The Regular Annual General Meeting typically takes place in May. The reports, documents and infor-
mation required by the law on Annual General Meetings, including the annual report, can be
accessed on the Internet, where the agenda of the Annual General Meeting and any counter-motions
or nominations of shareholders to be made public can also be found.
In accordance with the Articles of Association, the Chairman of the Supervisory Board chairs the
Annual General Meeting. He determines the order in which proceedings are conducted as well
as the type and form of voting. He is also authorized to limit the shareholders’ rights to pose ques-
tions and to speak for a reasonable period of time.
CORPOR ATE GOVERNANC E GUIDELINES
The Articles of Association of FUCHS PETROLUB SE, all Declarations of Compliance, the FUCHS Code
of Conduct, the Declaration of Corporate Governance and further documentation on corporate
governance, such as the Global Diversity Guideline or the FUCHS Sustainability Guide, can be accessed
on the Internet at www.fuchs-oil.com / corporate_govern1.html.
Further information at www.fuchs-oil.com / corporate_govern1.html
www

42 M A N A G E M E N T & S H A R E S
COM PLIANC E
We understand COMPLIANCE to mean observing rights, laws and the company’s Articles of Associ-
ation, adhering to internal rules and standards, as well as making voluntary personal commit-
ments. The main guideline for the actions of all employees is observing applicable law. The manage-
ment and employees are called upon without exception to observe applicable laws, directives
and social standards within the scope of their duties, regardless of whether these are international or
local regulations. Unlawful behavior harbors the risk of damaging the company’s image, weaken-
ing our market position and even causing us economic harm.
The Corporate Governance and Compliance divisions report directly to the Executive Board. These
include a Chief Compliance Officer and a Compliance Organization, which together further develop,
guide and implement the Compliance Program, as well as supporting and advising employees
all over the world. There is a Compliance Officer for each national unit, who is also available to local
staff as a contact for individual questions. All FUCHS employees are required to actively contrib-
ute to implementing the Compliance Program in their area of responsibility. The compliance system
is regularly reviewed and, if necessary, modified.
The FUCHS Code of Conduct, which was laid down as early as 2004 and has since been updated,
represents a binding framework for ensuring lawful and social-ethical behavior. The Code of
Conduct is supplemented by information and training measures, the consistent processing and sanc-
tioning of compliance infringements, a Compliance Hotline for reporting criminal or anti-cartel
infringements against laws or guidelines, regular compliance reporting, as well as by the compliance-
related inspection procedures of the internal audit department.
CODE OF RESPONSIBLE CONDUC T FOR BUSINESS – COMMITMENT TO SUSTAINABLE , SUCC ESS - DRIVEN AND VALUE- ORIENTED CORPOR ATE GOVERNANC E
The FUCHS Code expresses a common position of the leadership and thereby offers general orien-
tation for responsible actions. This common basic understanding is in line with the five central
values practiced at FUCHS: Trust, creating value, respect, reliability, and integrity. These values are
considered to be a benchmark for internal objectives and form the basis for individual actions.
Glossary page 208
a–z

431.4 Corporate Governance ReportM A N A G E M E N T & S H A R E S
FUCHS PETROLUB SE also participated in an initiative of German economic leaders that presented
a Code of Responsible Conduct for Business in November 2010 under the patronage of the Wit-
tenberg Center for Global Ethics. The Code explicitly addresses critical points that have been the sub-
ject of public debate, such as profits and morals, job cuts, manager remuneration and violation
of rules. By signing this Code, the Executive Board has underlined its commitment to a success-driven
and value-oriented system of corporate governance in the sense of the social market economy.
In accordance with the Code, this includes fair competition, social partnership, the performance prin-
ciple and sustainability.
In November 2012, we summarized our basic principles for sustainable business activities in the
FUCHS PETROLUB Group in the form of a comprehensive Sustainability Guide, which was signed by
the Executive Board. The Executive Board bears overall responsibility for sustainability at FUCHS.
The Chief Sustainability Officer appointed on January 1, 2011 supports all activities relevant to sustain-
able busi ness activities throughout the company as well as our social commitment. In 2013 we
continued to develop our organizational sustainability management and appointed a Local Sustain-
ability Officer in each producing national entity, who in future is to act as an interface for the
Chief Sustainability Officer at the Group head’s office and to be available as a point of contact for any
specific questions that might arise in this regard. Further information on the topic of sustainability
at FUCHS can be found in the sustainability report on page 48.
OPPORTUNIT Y AND R ISK MANAGEMENT
Sound corporate governance also includes responsible handling of opportunities and risks by the com-
pany. The Executive Board ensures appropriate opportunity and risk management in the company.
The Supervisory Board is informed regularly by the Executive Board of existing opportunities and risks,
their development and any measures that have been taken in this regard. The Audit Committee,
set up by the Supervisory Board, monitors the financial accounting process and examines the effec-
tiveness of the internal control system, risk management system and audit system, as well as
monitoring the audit. The internal control system, the risk management system and the internal audit
system are continuously further developed and brought in line with the ever changing frame-
work conditions. Details on this can be found in the opportunity and risk management report (sepa-
rate chapter in the management report).
Sustainability report
48
Opportunity report and Risk report
99 101

44 M A N A G E M E N T & S H A R E S
HIGH DEGREE OF TR ANSPARENC Y THROUGH COM PREHENSIVE INFORMATION
FUCHS PETROLUB SE places great emphasis on keeping capital market participants up-to-date
on the economic situation of the Group and key events through regular, prompt, uniform and com-
prehensive information. This reporting takes the form of an annual report and interim financial
reports. In addition to this, FUCHS PETROLUB SE also provides information through scheduled and
ad-hoc press releases. All information can be viewed on the Internet (website: www.fuchs-oil.com).
The website also offers a financial calendar that contains the scheduled dates and times of all impor-
tant events and publications.
FUCHS PETROLUB SE has created the mandatory insider directory in accordance with Section 15 b
of the German Securities Trading Act (WpHG) and informed the affected persons, for whom
access to insider information is essential to be able to perform their duties at FUCHS PETROLUB SE,
of their legal obligations and the sanctions faced by anyone failing to comply with the regulations.
Where directors’ dealings are to be reported, these are published on the website.
The members of the Executive Board and Supervisory Board are committed to the interests of the
company. In reaching their decisions, they must neither pursue any personal interests nor busi-
ness opportunities available to the company for their own personal gain. Any conflicts of interest must
be declared to the Supervisory Board immediately. If applicable, the Annual General Meeting is
also to be informed of conflicts of interest that have occurred and how they are being handled. There
were no such conflicts of interest in the reporting year.
ACCOUNTING AND AUDIT
The consolidated financial statements and interim financial reports of FUCHS PETROLUB SE are pre-
pared in accordance with the International Financial Reporting Standards (IFRS) in the way in
which they are to be applied in the European Union. The statutory annual financial statements of
FUCHS PETROLUB SE, relevant for the distribution of dividends are prepared in accordance with
the provisions of the German Commercial Code (HGB). After preparation by the Executive Board, the
annual report and consolidated financial statements are audited by the auditor appointed at the
Annual General Meeting, approved by the Supervisory Board and the annual financial statements are
adopted.
An agreement is reached with the auditor that he will inform the Chairman of the Supervisory
Board respectively the Chairman of the Audit Committee immediately of any issues uncovered during
the audit that might give rise to statements of exclusion or reservation in the auditors’ report,
unless these issues can be resolved forthwith. The auditor is also to immediately report on all findings
or conclusions important for the duties of the Supervisory Board that become apparent when
performing the audit. The auditor is also to inform the Supervisory Board or make a note in the audi-
tor’s report if he detects any facts while performing the audit that render inaccurate any part of
the Dec laration of Compliance submitted by the Executive Board and Supervisory Board pursuant to
Section 161 of the German Stock Corporation Act (AktG).
mobile.fuchs-oil.com
451.4 Corporate Governance ReportM A N A G E M E N T & S H A R E S
TEX T OF THE DECL AR ATION OF COM PLIANC E
Declaration of Compliance, in accordance with Section 161 of the German Stock Corporation Act (AktG)
FUCHS PETROLUB SE complies with all recommendations of the “German Corporate Governance
Code Government Commission” in the version valid since June 10, 2013 (also in future) with the fol-
lowing exceptions:
Section 4.2.3
The variable compensation, and thereby the overall compensation, of the Executive Board is not sub-
ject to any upper limits. The variable compensation is based on FUCHS Value Added (FVA) and
the underlying KPIs of EBIT, capital employed, and weighted average cost of capital, as well as a per-
formance assessment to be performed annually by the Supervisory Board. In the light of the
above, the Supervisory Board does not currently see any need to introduce any upper limits for
compensation.
Section 5.4.3
As per Section 5.4.3 of the Code, elections to appoint members of the Supervisory Board should
take the form of individual elections. Within the scope of the process for changing its corporate form
to an European Company (SE), FUCHS PETROLUB decided to appoint the four shareholder repre-
sentatives of the first Supervisory Board at FUCHS PETROLUB SE through the company’s Articles of
Association in accordance with Article 40 (2) sentence 2 of the SE Regulation. The company’s
Articles of Association were passed by the Annual General Meeting on May 8, 2013, and entered into
the commercial register on July 18, 2013.
Mannheim, December 9, 2013
Dr. Jürgen Hambrecht Stefan R. Fuchs
Chairman of the Supervisory Board Chairman of the Executive Board
The current Declaration of Compliance, as well as all previous Declarations of Compliance, can be
accessed at any time on the Internet at www.fuchs-oil.com / declarationcompliance.html.
Mannheim, March 19, 2014
FUCHS PETROLUB SE
The Executive Board
Further information at www.fuchs-oil.com / declarationcompliance.html
www

46 M A N A G E M E N T & S H A R E S
MAIN FEATURES OF FUCHS PETROLUB SE’S COMPENSATION SYSTEM FOR MEMBERS OF THE EXECUTIVE BODIES*
COM PENSATION FOR MEMBERS OF THE EXECUTIVE BOARD
The compensation of the members of the Executive Board is based on the following criteria:
■■ the duties of the individual board member,■■ his personal performance,■■ the economic situation of the company,■■ the success and future perspectives of the company,■■ the common practice of compensation, taking into account comparable external and internal data.
The compensation of the Executive Board was made up of a fixed and a variable component. The
compensation is reviewed annually and adjusted if necessary.
The performance-related compensation components are based on the FUCHS Value Added (FVA).
As an indicator of sustainable company development, the FVA is based both on annual profit and
capital employed, which itself is based on long-term decisions (capital expenditure, research and
development, etc.). Sustainable economic success as a parameter for compensation has been and
remains at the heart of the management philosophy in place at FUCHS.
To better incorporate the need for a more comprehensive assessment basis which extends over
several years when assessing the variable compensation component, the FVA has been extended to
include a performance factor. The long-term performance of the Executive Board is determined
on the basis of achievement of medium and long-term targets. These targets are aligned to the stra-
tegic guidelines at FUCHS and are agreed for the entire Executive Board.
The members of the Executive Board also receive additional benefits in the form of remuneration
in kind. These benefits essentially consist of private use of company cars and payment of insurance
premiums. These are available to all members of the Executive Board in the same way.
FUCHS Value Added
65
* Part of the Group management report

471.4 Corporate Governance ReportM A N A G E M E N T & S H A R E S
The pension of Executive Board members is based on a percentage of the average fixed salary
received by said members over the last three years prior to termination of their employment con-
tract. This percentage increases successively with the duration of service of the Executive Board
member. Pensions are paid to former members of the Executive Board who have reached the pen-
sion age.
The existing compensation system has been in force since January 1, 2010. In the interests of ensur-
ing acceptance, the Executive Board and Supervisory Board sought the consent of the sharehold-
ers for the Executive Board compensation system at the Annual General Meeting on May 5, 2010.
This consultative AGM resolution was met with 94.87 % approval.
COM PENSATION FOR MEMBERS OF THE SU PERVISORY BOARD
The compensation of the Supervisory Board is specified in the Articles of Association of FUCHS
PETROLUB SE. These state that each member of the Supervisory Board shall receive fixed compen-
sation of € 30,000 for the last year, in addition to expenses, and a variable compensation linked
to the success of the company of €100 for every € 0.01 by which the disclosed average Group earnings
per share exceed € 0.56. The level of variable compensation may not exceed that of the fixed
compensation. The Chairman of the Supervisory Board receives double these compensations and the
Deputy Chairman one and a half times. Members of the Supervisory Board who have not been
a member of the body for a full financial year receive compensation in accordance with the amount
of time they have belonged to the Supervisory Board. Furthermore, each member of the Super-
visory Board shall receive an attendance allowance of €1,000 per Supervisory Board meeting. Mem-
bers of the Supervisory Board who also sit on the Audit Committee receive additional fixed com-
pensation of €15,000, while those who also sit on the Personnel Committee receive additional fixed
compensation of € 5,000. An attendance allowance of €1,000 is paid for committee meetings.
The Committee Chairman receives double these compensations, the Deputy Chairman one and a
half times.

48 M A N A G E M E N T & S H A R E S
As a subscriber to the Code of Responsible Conduct for Business, the Executive Board at FUCHS
PETROLUB SE is committed to a value-oriented system of corporate governance. Based on the
Code, this includes fair competition, social partnership, the performance principle and sustainability.
We understand sustainability as a key element of this commitment. The scarcity of resources and
the responsibility towards future generations are a particular focus of corporate action. FUCHS
strives to create more value with fewer resources – while meeting our economic, ecological and social
responsibilities, to secure the long-term success and the continued existence of the company in
the future.
Sustainability at FUCHS is a continuous further development. We constantly work on future
improvements and in 2013 implemented key objectives in the three areas of sustainability: economy,
ecology and social. These involve in particular:
■■ The description of our basic principles for sustainable and socially responsible business practices in
the FUCHS PETROLUB Group in a comprehensive Sustainability Guideline, which was made
available to all FUCHS managers worldwide at the beginning of 2013. The FUCHS Sustainability
Guideline is used as both an internal and external means of communication and can be accessed
on our website at www.fuchs-oil.com / sustainabilityguideline0.html.■■ Informing our key suppliers on the establishment of the FUCHS Sustainability Guideline, as well as
their written confirmation either that they comply with it or that they employ and adhere to
their own, similar guidelines. Our suppliers are also expected to comply with our corporate ethical
requirements and minimum social standards. When selecting potential new suppliers, we con-
sider their performance with regard to sustainability.■■ The organizational further development of our sustainability management through appointment
of local sustainability officers in each producing national entity, who should act as an interface
for the Chief Sustainability Officer at Group HQ in the future and be available as a point of contact
for any specific questions that might arise in this regard. The Chief Sustainability Officer, who
was appointed in 2011, supports all accompanying activities throughout the Group on sustainable
business practices and our corporate citizenship.
Further information at www.fuchs-oil.com / sustainability0.html
www
Sustainability report

491.5 Sustainability reportM A N A G E M E N T & S H A R E S
■■ The revision of the FUCHS fleet’s former company car guideline in Germany and its extension to
include a sustainability component. As of 2014, specific CO² limits per company car group apply
to all new vehicle orders – from field service staff to the Executive Board. These limits may only be
exceeded by a maximum of 5 % in all cases. A monthly penalty will be charged per gram of CO²
per km above the permitted limit to compensate for the mobility costs associated with the increased
emissions and environmental impact. The applicable CO² limits of the European Union for vehicle
manufacturers (2015 limit: 130 g / km) should provide orientation and not be exceeded as an annual
average by FUCHS’ entire German fleet. FUCHS’ domestic emission limits are to be examined
annually for their appropriateness and, if necessary, adjusted.
ECONOMIC SUSTAINABIL IT Y
FUCHS recognizes sustainability in economic activities as a principle of long-term business strategy
and assurance, and is committed to a continuous and sustainable increase in company value, as
well as creation of shareholder value. At the same time, we pursue a sustainable dividend policy, which
targets continuous increases or at the very least stable dividend payouts to our shareholders.
In the sense of these objectives, the Group was able to increase FUCHS Value Added (FVA) in the
reporting year 2013 over 2012 by 6.6 % to € 221.9 million. The two main factors that influence FVA
developed in the right direction. EBIT increased by 6.6 % over 2012 to € 312.3 million (293.0),
while NOWC, which has an impact on capital costs, recorded a decline relative to sales revenues to
19.9 % (21.0 %). The total Group dividend payout is to be increased by 6.6 % to € 98.2 million (91.6).
The dividends paid by FUCHS have increased by an average of 25 % per year over the last ten years.
ECONOMIC KP IS
2013 2012 2011 2010
FUCHS Value Added (FVA) in € million 221.9 208.2 186.8 182.7
Earnings before interest and tax (EBIT) in € million 312.3 293.0 263.5 250.1
Net operating working capital (NOWC) in % 19.9 21.0 21.1 19.0
Total dividend payout in € million * 98.2 91.6 70.3 63.2
* Dividend proposal for 2013.
Overall position and performance indicators
95

50 M A N A G E M E N T & S H A R E S
ECOLOGIC AL SUSTAINABIL IT Y
FUCHS develops, produces, and markets application-specific and emission-reducing lubricants, some
of which use renewable raw materials. Due to the low level of vertical integration that we employ
as a provider at the end of the process and added value chain, our lubricant manufacturing activities
leave behind only a minor ecological footprint. Nevertheless, FUCHS pays particular attention
to responsible handling of energy, water, and waste. The Group makes a contribution to reducing
energy requirements, preserving resources, and thereby to sustainability in the ecological sense.
We have been continually reducing the amount of energy consumed per ton of lubricant produced
since 2010. The CO² emissions at FUCHS are largely generated during lubricant production due to
the use of energy. Based on the energy consumption per energy type, we determined our CO² emis-
sions during the production process across all production locations for the first time, which were
reduced from 2010 to 2011 and have since remained constant. We managed to reduce the water con-
sumption per ton of lubricant output each year from 2010 to 2012, although it actually increased
in the reporting year due to necessary cooling processes during production of certain products at one
of the Group’s major production sites. Compared to 2010, we were able to slightly reduce the
volume of waste generated per ton of lubricant produced in the reporting year. The energy and water
consumption, the waste generation and the CO² emissions at FUCHS’ production sites are signifi-
cantly below the average in the chemicals industry. Yet despite this, we are still making every effort
to further reduce these ecological KPIs. In 2013, we therefore asked the managing directors of
FUCHS’ major production sites to set reduction targets for energy and water consumption, as well
as waste generation till 2016 and report these to Group HQ. These targets help us anchor our
sustainability strategy in the actions of the production locations and thereby further integrate them
into our business operations.
ECOLOGIC AL KP IS
2013 2012 2011 2010
Energy consumption in kilowatt hours per ton produced 1 266 268 269 285
Water consumption in liters per ton produced 1 507 440 450 454
Waste generated in kilograms per ton produced 1 30 30 31 31
CO² emissions in kilograms per ton produced 2 95 95 95 100
Basis: FUCHS production locations.
1 The values for the previous years have been adjusted accordingly.
2 Generated due to energy consumption during the production process.

511.5 Sustainability reportM A N A G E M E N T & S H A R E S
SOCIAL SUSTAINABIL IT Y
FUCHS takes into account both internal and external aspects in terms of its social responsibility.
In the internal social field we address many challenges, in particular those associated with the demo-
graphic shift. In the sense of a sustainable personnel policy, projects were continued in the report-
ing year in the fields of occupational health management, further training and reconciliation of family
and working life. FUCHS also strives to keep qualified employees loyal to the company in the long
term through targeted measures. Whenever possible, any positions that become vacant are therefore
filled with employees from within the company. Here, we place particular emphasis on the dedi-
cated promotion of women and ensure that appropriate consideration is given to them when filling
management positions.
The following information refer to the FUCHS production locations, which represent around 90 %
of the Group’s employees.
In the reporting year, the average age of employees worldwide and at the German production sites
was 43 and has remained constant since 2010. For comparative purposes, the average age of
workforces in the German chemicals industry is also around 43. With a share of around 27 % each,
the age group of FUCHS employees over 50 overall and in Germany displays a fairly typical
structure for an industrial enterprise. The corresponding quota is around 31 % in the German chemi-
cals industry.
The average length of service and the employee fluctuation are indicators of the satisfaction and the
high degree of loyalty of our employees with FUCHS. The average length of service of FUCHS
employees remained constant between 2010 and 2013 at eleven years. The employee fluctuation
remained at a low level and actually fell slightly to around 3 % in the reporting year.
The number of work-related accidents with more than three days lost per 1,000 employees at FUCHS
was 16 in 2013 and also in 2012 and was therefore reduced by 2 over 2011 and 2010. The corre-
sponding work-related accident rate at FUCHS’ German production sites, which reported an average
of 20 accidents in 2010, was reduced to 15 in 2013 and is therefore around the standard level
of the chemicals industry in Germany. The number of days lost due to sickness per employee has
remained constant over the last four years at seven days on average.
The proportion of women in management positions at the production sites throughout the world
increased from 19 % in 2010 and 2011 to 20 % in 2012 and 2013. The percentage of women
working at the other non-production company locations is higher. As such, a total of 21 % of man-
agement positions within the FUCHS PETROLUB Group are held by women.
Employees
68

M A N A G E M E N T & S H A R E S1.5 Sustainability report52
We have been able to increase the average number of further education hours per employee
continuously since 2010. In the reporting year, each FUCHS employee attended an average of around
17 hours of further education.
SOC IAL KP IS
2013 2012 2011 2010
Average age of employees in years 43 43 43 43
Age structure of employees in %
< 30 years 14 15 14 13
31 – 40 years 27 27 29 30
41 – 50 years 32 32 31 32
> 50 years 27 26 26 25
Average length of service of employees in years 11 11 11 11
Employee fluctuation 1 in % 3.2 3.5 4.2 3.8
Work-related accidents 2 per 1,000 employees 3 16 16 18 18
Days lost due to sickness per employee 7 7 7 7
Proportion of women in management positions in % 3 20 20 19 19
Average further education per employee in hours 3 17 16 12 9
Basis: FUCHS production locations (Group representativeness: 90 %).
1 Proportion of employees who voluntarily leave the company.
2 Number of accidents with more than three days lost.
3 The values for the previous years have been adjusted accordingly.
In the external social field, FUCHS subscribes to the idea that companies should not be committed
solely to economic success, but equally also carry social responsibility. As part of society, we are
a player ourselves and benefit from the social integration at our company locations throughout the
world. We therefore support social and voluntary commitment in various ways at our company
locations and promote academic, cultural and social projects both nationally and internationally, pri-
marily in the field of education.
At the Group’s headquarters, we promote academic exchange with universities, including the Uni-
versity of Mannheim – for which a foundation-endowed Chair has been established together
with four other listed companies in the metropolitan region. In the cultural arena, we provide support
inter alia to the Mannheim National Theater, the oldest municipal theater and largest four-theme
theatrical venue in Germany, run by a city. In the social arena, we have presented the FUCHS spon-
sorship award for social projects of non-profit institutions in Mannheim for 14 years in succession.
In addition to this, FUCHS has been supporting the holistic junior youth development concept “An-
pfiff ins Leben” for many years. FUCHS is an important partner for the development of young
people in the fields of training and careers.

53M A N A G E M E N T & S H A R E S Disclosure required under takeover law pursuant
to Section 315 (4) of the German Commercial Code (HGB)1.6
Section 315 (4) of the German Commercial Code (HGB) stipulates additional disclosures in the
management report regarding specific features of the capital and shareholder structure as well as
specific agreements that might be significant in a takeover situation.
COM POSIT ION OF THE SHARE C APITAL
As at December 31, 2013, the company’s subscribed capital was € 70,980,000. The share capital is
divided into 35,490,000 bearer ordinary shares with no par value and 35,490,000 bearer prefer-
ence shares with no par value. The percentage of share capital in the company is therefore 50 % per
share class. Each share is assigned a nominal value of €1 on the balance sheet date. The ordinary
shares grant the rights provided for by the German Stock Corporation Act (AktG). The preference
shares grant the same rights, with the exception of the voting right. The rights and duties of the
shareholders are based on the regulations of the German Stock Corporation Act (AktG), in particular
Sections 12, 53 a ff., 118 ff. and 186 of the German Stock Corporation Act (AktG).
In accordance with the company’s Articles of Association, the unappropriated profit is used in the
following order:
a. for payment of any remaining profit shares on the non-voting shares from previous years
b. for payment of a preference profit share of € 0.05 per preference share of no par value
c. for payment of an initial profit share of € 0.03 per ordinary share of no par value
d. for equal payment of further profit shares on the ordinary shares and the non-voting shares,
unless the Annual General Meeting decides on another use.
L IMITATIONS THAT AFFEC T VOTING R IGHTS OR THE TR ANSFER OF SHARES
Together with members of the Fuchs family, RUDOLF FUCHS GMBH & CO KG, Mannheim, forms
the Schutzgemeinschaft Fuchs. Within the Schutzgemeinschaft Fuchs there are limitations with regard
to the exercising of voting rights and the transfer of shares. The voting rights of all members in
the Schutzgemeinschaft Fuchs are exercised uniformly by the management of the Schutzgemeinschaft.
In the case of paid and free of charge transfer of shares from members of the Fuchs family or
RUDOLF FUCHS GMBH & CO KG to third parties, the shares must first be offered internally within
the Schutzgemeinschaft.
In addition to this, RUDOLF FUCHS GMBH & CO KG and several members of the Schutzgemein-
schaft Fuchs also concluded a voting trust and escrow agreement. Based on this, shares may only be
transferred to signatories of this voting trust and escrow agreement.
* Part of the Group management report
Disclosure required under takeover law pursuant to Section 315 (4) of the German Commercial Code (HGB)*

54 M A N A G E M E N T & S H A R E S
INVESTMENTS IN THE C APITAL THAT EXC EED 10 % OF VOTING R IGHTS
The following direct or indirect investments in the company’s capital exceed 10 % of the voting rights.
The Schutzgemeinschaft Fuchs holds the majority of the capital stock with voting rights. RUDOLF
FUCHS GMBH & CO KG holds 47.58 % of the voting rights. The individuals who are members of
the Fuchs family hold a further 4.62 %. The Schutzgemeinschaft Fuchs there fore holds 52.21 % of
the voting shares in total.
SHARES WITH SPEC IAL R IGHTS WHICH CONFER SU PERVISORY POWERS
There are no shares with special rights which confer supervisory powers.
T YPE OF VOTING R IGHTS CONTROL WHEN EM PLOYEES PARTIC IPATE IN THE C APITAL AND DO NOT DIREC TLY EXERC ISE THE IR CONTROL R IGHTS
As is the case with other shareholders, those employees that participate in the company’s capital
can exercise their control rights directly pursuant to the legal requirements and terms of the company’s
Articles of Association.
LEGAL REQUIREMENTS AND TERMS OF THE COM PANY’S ARTICLES OF ASSOCIATION REGARDING THE APPOINTMENT AND DISMISSAL OF MEMBERS OF THE EXECUTIVE BOARD AND CHANGES TO THE ARTICLES OF ASSOCIATION
The company’s Articles of Association in their current form comply with the legal requirements pur-
suant to Article 39 of the SE Regulation, Section 16 of the SE Implementation Act, as well as Sec-
tions 84 and 85 of the German Stock Corporation Act (AktG) with regard to the appointment and
dismissal of members of the Executive Board and amendments to the Articles of Association.
AUTHORIT Y OF THE EXECUTIVE BOARD TO ISSUE AND BUY BACK SHARES
The company’s Articles of Association contain an authorized capital. The Executive Board is autho-
rized, with the Supervisory Board’s consent, to increase the share capital of the company by up to
€ 35,490,000 in one or several tranches until May 5, 2014 by issuing up to 35,490,000 new, no-
par-value bearer shares in exchange for cash or non-cash contributions. Ordinary and / or preference
shares with no voting right can be issued.
The Executive Board is authorized, with the Supervisory Board’s consent, to acquire own shares up to
a value of 10 % of the existing share capital at the date of the resolution until May 5, 2014 for the
purpose of redemption. In the light of the good business and cash flow development, as well as to
optimize the capital structure, FUCHS began buying back own shares in November 2013 at a value
not to exceed the limit of €100 million. In the financial year 2013, a total of 169,235 ordinary shares
were acquired at an average price of € 60.14 and 169,235 preference shares were acquired at an
average price of € 69.65. FUCHS therefore spent a total of € 20.0 million on buying back own shares
in the financial year 2013 (€10.2 million on ordinary shares; €11.8 million on preference shares).

55M A N A G E M E N T & S H A R E S Disclosure required under takeover law pursuant
to Section 315 (4) of the German Commercial Code (HGB)1.6
SIGNIF IC ANT COM PANY AGREEMENTS THAT ARE IN PL AC E IN THE EVENT OF A CHANGE IN CONTROL AS A RESULT OF A TAKEOVER B ID
The company has reached agreements with two banks that enable the termination or repayment
of lines of credit in the amount of € 60 million respective of the loans granted thereunder should
there be a change in control, insofar as in light of the changes in ownership and control no agree-
ment can be reached on the continuation of credit facilities.
COM PANY AGREEMENTS FOR COM PENSATION OF MEMBERS OF THE EXECUTIVE BOARD OR EM PLOYEES IN THE EVENT OF A TAKEOVER B ID
At FUCHS, there are no agreements for compensation of the members of the Executive Board or
employees in the event of a takeover bid.

56 M A N A G E M E N T & S H A R E S
FUCHS PETROLUB SE issued two different share classes: ordinary shares (Security ID No. 57940)
and preference shares (Security ID No. 579043).
PERFORMANC E OF FUCHS SHARES
The ordinary share closed at € 61.80 in XETRA trading on December 30, 2013 and was therefore
16.6 % above the 2012 year-end price. The preference share recorded a year-end price of € 71.04 on
December 30, 2013 and therefore increased by 26.4 % in the financial year 2013. The prices of
the ordinary and preference shares dipped slightly during the first few days of trading in 2013. On
January 17, 2013, the preference share then dropped to € 55.50, its lowest level of the year. In
the weeks that followed, the shares developed better than the overall market, recording significant
gains in the first quarter of 2013. In the second quarter of 2013, the prices of both share classes
dipped again and the premium of the preference share increased relative to the ordinary share. In
the third quarter of 2013, the prices then made largely sideways movements due to considerable
fluctuations. On July 29, 2013, the ordinary share reached its lowest level of the year at € 49.24. This
sideways movement continued in the first few months of the fourth quarter of 2013. At the
end of November, both share classes then increased considerably in value, particularly following the
announcement of the share buyback. On December 27, 2013, the ordinary and preference shares
reached their highest level of the year at € 62.25 and € 71.94 respectively. Assuming reinvestment into
the same share of the dividends paid, the performance of the ordinary share was 19.2 % and the
performance of the preference share was 29.1 %. Both share classes were therefore unable to keep
up with the excellent development of the MDA X benchmark index (+ 39.1 %). However, the prefer-
ence shares at least outperformed the development of the DAX, which gained 25.5 % over the course
of the year.
Glossary page 209
a–z
FUCHS shares
Rel %
140
135
130
125
120
115
110
105
100
95
Preference share Ordinary share DAX MDAX
PERFORMANCE TREND OF ORDINARY AND PREFERENCE SHARES IN COMPARISON WITH DA X AND MDA X
(JANUARY 1, 2013 – DECEMBER 31, 2013)
Jan Feb Mar Apr May Jun Jul Aug Sep Oct Nov Dec
* Performance including dividends.
mobile.fuchs-oil.com

57M A N A G E M E N T & S H A R E S1.7 FUCHS shares
FUCHS SHARE TR ADING
The shares in FUCHS PETROLUB SE are primarily traded on the XETRA platform, although they
are also traded on all German regional stock exchanges. The average daily volume traded (XETRA
and Frankfurt) of the preference shares increased by 13.7 % to 131,761 units (2012: 115,917). This
means that € 8.1 million (2012: € 5.2 million) was traded each day on these stock exchanges in the
financial year 2013.
The ordinary shares recorded an average daily trading volume (XETRA and Frankfurt) of 27,790
units in 2013 (2012: 21,522). The average daily traded volume of the ordinary share increased from
€ 0.9 million in 2012 to €1.5 million in the reporting year.
Due to the price trend, the market capitalization of the ordinary and preference shares increased from
€ 3.9 billion to € 4.7 billion.
FUCHS SHARES REPRESENTED IN IM PORTANT INDIC ES
The ordinary share is included in the DAXplus Family Index on the German Stock Exchange. This
index represents the development of 118 German and international family companies listed in
the Prime Standard on the Frankfurt Stock Exchange. In addition to this, the ordinary share is included
in the DAXplus Family 30, which comprises the 30 largest and most liquid family companies.
The preference share is listed in the MDAX, the second largest German share index, which com-
prises 50 companies, while 30 companies are included in the largest German share index, the DAX.
At the end of 2013, the market capitalization of the preference shares was € 2.5 billion. This put
FUCHS in 16th place (2012: 13th place) or 22nd place in terms of trading volume (2012: 29th place).
The weighting in the MDAX is 2.09 % (2012: 2.32 %).
The international significance of the FUCHS preference share is reflected by the fact that it is
included in STOXX Europe. The STOXX Europe 600 represents the shares of 600 companies from
18 European countries.
ANNUAL GENER AL MEETING 2013
At the Annual General Meeting, held on May 8, 2013 in Mannheim, 79.34 % of the share capital
secured in ordinary shares and 7.53 % of the share capital secured in preference shares were
represented. The shareholders agreed to the proposals of the administration with clear majorities of
between 99.11 % and 99.99 %.
SHARE BUYBACK
In the light of the good business and cash flow development, as well as to optimize the capital struc-
ture, FUCHS began buying back own shares in November 2013 at a value not to exceed €100 mil-
lion. In the financial year 2013, a total of 169,235 ordinary shares were acquired at an average price of
€ 60.14 and 169,235 preference shares were acquired at an average price of € 69.65. FUCHS there-
fore spent a total of € 22.0 million on buying back own shares in the financial year 2013 (€10.2 mil-
lion on ordinary shares; €11.8 million on preference shares).

58 M A N A G E M E N T & S H A R E S
SHAREHOLDER STRUC TURE
The subscribed capital of FUCHS PETROLUB SE of € 70,980,000 is divided into 35,490,000 ordinary
shares and 35,490,000 preference shares with a nominal value of €1.00 per share. The ordinary
shares and preference shares have been listed in the Prime Standard on the German Stock Exchange
since January 1, 2003.
Each ordinary share carries one vote at the Annual General Meeting. On the 2013 balance sheet date,
the Fuchs family held 52.0 % of the shares, 0.5 % were own shares, and 47.5 % were freely traded
(free float) as per the definition of Deutsche Börse AG. Own shares are not entitled to vote, therefore
the Fuchs family holds 52.2 % of the voting rights.
As per the definition of Deutsche Börse AG, 99.5 % of the preference shares without voting rights
were freely traded (free float) at the end of 2013. The remaining 0.5 % is attributed to own shares.
Due to the legal form of the shares (bearer shares), FUCHS does not have access to any share register,
as would for example be the case with registered shares. The notification requirement pursuant
to Section 21 ff. of the German Securities Trading Act (WpHG) refer exclusively to shares with voting
rights and thereby not to the preference shares, which are without voting rights. This report
therefore does not contain any detailed information regarding the shareholder structure of the FUCHS
preference shares.
Own shares 0.5 %
Own shares 0.5 %
Free float* 47.5 %
FUCHS family 52.0 %
Free float 99.5 %
SHAREHOLDER STRUC TURE AS AT DECEMBER 31, 2013
Basis: 35,490,000 shares
(Ordinary shares)
PREFERENCE SHARES
Basis: 35,490,000 shares
(Preference shares)
ORDINARY SHARES
* Voting rights announcement: DWS Investment, Frankfurt, 5.2 % (Dec. 15, 2003).

59M A N A G E M E N T & S H A R E S1.7 FUCHS shares
NOTIF IC ATION ON VOTING R IGHTS
In accordance with Section 21 of the German Securities Trading Act (WpHG), the investor Mawer
Investment Ltd., Canada, informed the company that its share of voting rights had fallen below the
threshold of 3 % in the financial year 2013. FUCHS PETROLUB SE informed the capital markets
of this in accordance with Section 26 of the German Securities Trading Act (WpHG) and also informed
the interested general public on its website. In addition to this, DWS Investment, Germany, had
submitted a statement by the 2013 balance sheet date (voting rights announcement from Decem-
ber 15, 2003) declaring that it held 5.2 % of ordinary shares.
INTENSIVE C APITAL MARKET COMM UNIC ATION
FUCHS PETROLUB places great emphasis on open and continuous communication with all capital
market players. Institutional investors, funds managers and financial analysts had the opportunity
to talk directly with the management at the 20 capital market conferences and roadshows held in
Europe and North America. In addition to this, numerous individual meetings and telephone con-
ferences were held. One of the year’s highlights was our 14th FUCHS Capital Market Day, at which
the participants also had the opportunity to gain an insight into the world of the open-cast lignite
mining at RWE Power. Other important dates on the investor relations calendar included the Analysts’
Conferences / telephone conferences on the respective publication dates.
The business and financial press was kept continuously up-to-date through press conferences,
telephone conferences, and press releases. Beside this, there was great interest in interviewing the
company management.
The Annual General Meeting offers an opportunity for an open dialog with private investors. In
addition, private investors also frequently contact the Investor Relations Team by phone, letter or
e-mail with their questions.
The FUCHS Annual Report 2012 received numerous awards in 2013. These included winning Gold
at the ARC Awards (Annual Report Competition) in the categories ”Traditional Annual Reports:
Oil & Gas Production Services”. The criteria evaluated by the jury included the design and presentation
of company information. The report also won Silver at both the FOX AWARDS and the Vision
Awards. In addition to this, the FUCHS Annual Report 2012 received the GOOD DESIGN Award,
successfully fending off several thousand entries from over 38 countries.
ANALYSTS
Over the course of 2013, 18 analysts from various institutions regularly observed and rated the
company development at FUCHS (2012: 20). The “Investor Relations” section of the website operated
by FUCHS PETROLUB SE provides information on current recommendations.
Further information at www.fuchs-oil.com / analystscoverage0.html
www

60 M A N A G E M E N T & S H A R E S
EARNINGS PER SHARE
The earnings per FUCHS ordinary share were € 3.06 for the reporting year (2.90). Due to the
€ 0.02 higher dividend entitlement, earnings per preference share were € 3.08 (2.92).
DIVIDEND PROPOSAL
The Executive Board and Supervisory Board will therefore propose a dividend payout of €1.38 per
ordinary share and €1.40 per preference share to the Annual General Meeting. This represents
a dividend payout ratio of 45 %. With this proposal, we are continuing FUCHS PETROLUB’s stable
dividend policy.
KEY F IGURES FOR FUCHS PETROLUB SHARES
Dec. 31, 2013 Dec. 31, 2012
O R D I N A R Y
S H A R E S
P R E F E R E N C E
S H A R E S
O R D I N A R Y
S H A R E S
P R E F E R E N C E
S H A R E S
Number of no-par-value shares 35,490,000 35,490,000 35,490,000 35,490,000
Number of own shares 169,235 169,235 – –
Shares outstanding 35,320,765 35,320,765 35,490,000 35,490,000
Dividends (in €) 1.38 1 1.40 1 1.28 1.30
Dividend yield (in %) 2 2.5 2.3 3.1 2.9
Earnings per share (in €) 3 3.06 3.08 2.90 2.92
Gross cash flow per share (in €) 4 3.17 3.17 3.09 3.09
Book value per share (in €) 5 12.07 12.07 10.99 10.99
XETRA closing price (in €) 61.80 71.04 53.00 56.19
XETRA highest price (in €) 62.25 71.94 53.00 56.57
XETRA lowest price (in €) 49.24 55.50 29.89 34.13
XETRA average price (in €) 54.36 61.80 41.24 44.75
Average daily turnover (in € thousand)
XETRA and Frankfurt
1,510
8,143
888
5,187
Market capitalization (in € million) 6 4,692 3,875
Price-to-earnings ratio 7 17.8 20.1 14.2 15.3
1 Proposal to the Annual General Meeting.
2 Ratio of dividend to average annual share price.
3 Ratio of earnings after deduction of minority interests to average number of shares.
4 Relative to the average number of shares.
5 Ratio of shareholders’ equity to number of shares.
6 Stock exchange values at the end of the year.
7 Ratio of average price to earnings per share.
Group management report
80
Proposal on the appropriation of profits
207
Further information at www.fuchs-oil.com / stock_current.html
www

3,888W I T H A N A D D I T I O N A L 115 N E W E M P L OY E E S , I N 2 0 13 T H E T O TA L W O R K F O R C E I N T H E 5 0 G R O U P C O M PA N I E S R O S E T O
FUCHS has the financial flexi bility to consistently press ahead with its growth initia- tive. At 73.5 %, the equity ratio has reached a new peak.
I N 2 0 13 , I N V E S T M E N T S I N P R O P E R T Y, P L A N T A N D E Q U I P M E N T A M O U N T E D T O
€ 72.8EMPLOYEES
MILLION

2 G R O U P M A N A G E M E N T R E P O R T ¹
2.1 Corporate profile 63■■ Business model 63■■ Controlling system 65■■ Research and development 66■■ Employees 68■■ Sustainability 72
2.2 Economic framework: general and sectoral 73
2.3 Sales revenues (performance) 76
2.4 Results of operations 79■■ Consolidated results of operations 79■■ Results of operations of the regions 81
2.5 Net assets and financial position 88■■ Balance sheet structure 88■■ Capital expenditure and acquisitions 92■■ Statement of cash flows 93■■ Liquidity situation, financing structure, and dividend policy 94
2.6 Overall position and performance indicators 95■■ Earning power as a performance indicator 95■■ Stability as a performance indicator 97■■ Liquidity as a performance indicator 97
2.7 Supplementary report 98
2.8 Opportunity, risk and forecast report 99■■ Opportunity report 99■■ Risk report 101■■ Forecast report 109
2.9 Legal disclosures 112■■ Dependent company report / report on investments in affiliated companies 112
■■ Declaration of Corporate Governance 112■■ Main features of the compensation system of FUCHS PETROLUB SE for members of the Executive Bodies 112
■■ Information required under takeover law pursuant to Section 315 (4) of the German Commercial Code (HGB) 112
1 The figures in parentheses refer to the same period
of the previous year.

63G R O U P M A N A G E M E N T R E P O R T2.1 Corporate profile
Corporate profile
BUSINESS MODEL
The mission statement of the FUCHS PETROLUB Group, LUBRICANTS.TECHNOLOGY.PEOPLE.
describes its business model in just a few words. The Germany-based Group with a total of 50 oper-
ating companies and more than 3,800 employees worldwide, focuses entirely on lubricants and
related specialties. Its technological orientation represents a special feature of its product portfolio.
The business model is implemented by highly qualified, specialized, and motivated employees.
By focusing on the development, production, and sale of lubricants and related specialties, FUCHS
differs from the vertically integrated mineral oil companies, whose business model is aimed largely at
broad sales channels. FUCHS concentrates on technological leadership in important niches and
premium business segments. Within the scope of this strategy, tailor-made products with great cus-
tomer benefit are developed and manufactured. A high commitment to service rounds off this
product portfolio. Thanks to its size, international presence and strength of resources, FUCHS also
enjoys an advantage over other independent lubricant suppliers.
The portfolio encompasses around 10,000 products for all applications and industries, including
mining, steel production, agriculture, the automotive industry, transport, mechanical engineering,
everyday consumers and more. The broad range of products on offer covers the entire lubri-
cant requirements of more than 100,000 customers and enables supply and support to come from
a single source.
The high level of innovative power is a key driver in the business model. Around one in ten employees
works in research and development. FUCHS engages in applied developments directly at cus-
tomer locations. This allows lubricants to be adapted to customer processes or new lubricants to be
developed at the same time as new machines and systems, in partnership with the customer.
Around 75 % of sales revenues are generated through direct sales. The customer relationships, most
of which have been in place for many years, allow offers that are tailored specifically to customer
requirements. The specialists working in sales have specific industry knowledge, which enables them
to find solutions to specific issues both quickly and professionally.
An important success factor is the speed of reaction to market fluctuations. Our high degree of
internal transparency and low investment intensity are of advantage here. Both of these factors make
it easier to implement short-term capacity adjustments. However, it is not possible to extrapolate
sales trends for subsequent months on the basis of the number of orders on hand. In light of the fast
and service-oriented delivery of lubricants and related specialties to our customers, forecasts
regarding future sales trends can more easily be made based on the general economic situation and
the order situation in certain customer industries. Yet despite this, unforeseen fluctuations can
still occur in the market and the environment at any time, as shown by the developments at the end
of 2008 and in 2009.

64 G R O U P M A N A G E M E N T R E P O R T
EUROPEAN BUSINESS FORMS THE BASIS FOR ONGOING INTERNATIONALIZ ATION
A strong position in the European market forms the basis for the internationalization of FUCHS’
business. The comprehensive product portfolio allows the ever more complex specialization require-
ments in mature markets to be met, while also enabling the Group to participate in the growth
potential in Asia, Africa, South America, and Eastern Europe. FUCHS not only supports important
customers seeking to enter new markets, but at the same time also wins new local customers
with its tailor-made solutions. The diversification in regions and industries ensures that economic and
industry cycles can be compensated.
The FUCHS PETROLUB Group bases its growth objectives on assuming the role of a technology
and service partner, as well as a solution provider for niche applications. The Group is keen to grow
further using this approach both through organic growth and, if possible, also acquisitions.
On the balance sheet date, there were 27 operating companies active in Europe and five oper-
ating companies active on the American continent. Customers in the Asia-Pacific, Africa region were
supported by 18 operating companies.
The organization of the Group follows the principles of transparency and simple structures. The
companies are largely held at 100 % by FUCHS PETROLUB SE in Mannheim. This allows reporting
paths to be kept short and also ensures efficient division of operational leadership and manage-
rial duties under corporate law. We have 50 % stakes in companies in Switzerland, Turkey and the
Middle East, as well as one minority holding in Saudi Arabia.
The organizational and reporting structure at FUCHS is grouped according to the three geographic
regions of Europe, North and South America, and Asia-Pacific, Africa.
On the sales side, business is characterized by a combination of local support and integration of
customer group-specific specialists. Functions such as production and administration are gen-
erally performed locally. Where prudent and feasible, purchasing and research & development activi-
ties will be bundled in addition to the local presence.

65G R O U P M A N A G E M E N T R E P O R T2.1 Corporate profile
CONTROLLING SYSTEM
INC REASING COM PANY VALUE THROUGH FURTHER GROW TH
The goal of FUCHS PETROLUB is to increase its company value, while at the same time allowing
further stakeholders to participate. The priorities are to both secure and extend the mar ket position
in mature markets and also sustainably build on the market position in emerging markets. To this
end, the Group relies on organic and – where prudent and possible – external growth. In this context,
securing the leading technological position of the FUCHS PETROLUB Group in the field of lubri-
cants is of particular strategic importance.
Beside this, securing the independence of the FUCHS PETROLUB Group represents a strategic
step in further increasing company value, as this makes it possible to focus on lubricants and related
specialties in an efficient environment.
FUCHS VALUE ADDED AS A C ENTR AL KEY PERFORMANC E INDIC ATOR
FUCHS pursues a value-driven growth strategy to increase its company value. The central key perfor-
mance indicator (financial performance indicator) is FUCHS Value Added (FVA), which is based on
income and capital investment. Only when the recorded earnings are higher than the costs of capital
employed has value been added.
The key earnings performance indicator and control variable for the operating business in the FUCHS
PETROLUB Group is earnings before interest and tax (EBIT), which in turn is largely determined
by sales revenues, raw material costs, as well as personnel and overhead expenses. Management at
local, regional, and global level pays special attention to these drivers. As a figure determined
before interest and taxes, EBIT has the advantage of making the operating output of companies
comparable without being influenced by differences in local financing and taxation rates.
Another focus is on the analysis of capital employed performed throughout the year. Significant driv-
ers for the level of capital employed are capital expenditure on property, plant and equipment,
investments in intangible assets, and the development of net operating working capital, consisting of
inventories and trade receivables less trade payables. Controlling fixed assets through investment
appraisals and monitoring net operating working capital tied up in inventories and trade receivables
therefore represent important management duties.
FUCHS calculates the capital tied up in the company, i. e. the annual average capital employed
as the sum of shareholders’ equity, financial liabilities and pension provisions, as well as the accumu-
lated scheduled goodwill amortization of former years (up to 2004: € 85.2 million). Cash and cash
equivalents, and any asset surplus from outsourced pension liabilities, are deducted from this figure.

66 G R O U P M A N A G E M E N T R E P O R T
The costs of capital employed were calculated using the weighted interest rate (WACC), the level of
which is reviewed annually applying the Capital Asset Pricing Model (CAPM) and financial market
data available at year end. When determining the performance of subsidiaries, this cost of capital is
adjusted to incorporate the various levels of inflation and specific country risks.
All bonus payments to local, regional, and global management are based on FVA. Only when positive
added value has been generated in a financial year will an entitlement to bonus payment arise.
The level of this bonus can depend on additional individual agreements and performance factors.
The instruments for operational management of the companies include a detailed system that
monitors any deviation between target and actual figures in the budget. In the course of the annual
budgeting process, goals are defined for companies and regions with regard to growth, net con-
tribution or gross margin and development of other personnel and operating costs. A monthly tar-
get / actual comparison ensures that compliance with the budget goals is continuously tracked.
When targets are not achieved, the causes are promptly investigated, potential compensatory factors
examined and corresponding measures introduced.
RESEARCH AND DEVELOPMENT
A key pillar of the FUCHS PETROLUB Group’s business model is its technological focus. The research
and development requirements associated with this are constantly on the rise. Complex technical
challenges and also regulatory provisions require a network that can make the necessary expertise
available quickly and effectively. Last year, FUCHS therefore decided to fundamentally revise its
organizational structure in the field of research and development, which will allow it to cater more
effectively to more complex future requirements.
At the same time, FUCHS provided various locations in Germany and other countries with additional
capacities.
Group-wide research and development expenses increased to € 30.6 million in 2013 (29.2), while the
number of employees increased to 385 (364) engineers and scientists by December 31, 2013.
Numerous developments in our research and development departments in 2013 are breaking new
technological ground.

67G R O U P M A N A G E M E N T R E P O R T2.1 Corporate profile
FUCHS has already been successfully working on the development of gear oils for automotive appli-
cations for years. In a complex development project, FUCHS developed and launched what is
currently the most modern lubricant available for the new dual clutch transmissions of a major German
vehicle manufacturer. The product, which was developed in close cooperation with the customer
using in-house test benches, offers customized friction properties for maximum comfort and max-
imum durability in the dual clutch transmission application.
Sustainability is playing an increasingly important role in the field of lubricant development.
One of the objectives here is to increase the process-efficiency or energy-efficiency of products,
while another is to ensure that the raw material combinations are resource-friendly. In order
to explore new paths, the advance development department at FUCHS PETROLUB is participating
in two joint projects.
The first project, entitled “Advanced Biomass Value”, is working on the development of an inte-
grated recovery chain for conversion of third generation algae and yeast-based biomass. The objective
here is to produce aviation fuels, functional lubricants, and new building materials.
The second project, entitled “TeFuProt”, is researching the structure-function relationships of vege-
table proteins. The objective here is to improve the technical suitability of vegetable proteins and
thereby improve the use of protein mixes from the vegetable oil production process for the lubricant
industry.
One special product that has been produced with a focus on sustainability is the new develop-
ment “RENOLIN Xtreme Temp 46”. Thanks to its special composition, it offers fuel saving potential
of 3 % to 6 % in mobile hydraulics applications.
Preliminary testing on high-performance mechanical test benches is crucial for the qualification of
lubricants. FUCHS extended its test bay in 2013 to include a new modular hydraulic test bench.
This test bench makes it possible to test hydraulic fluids in various pump types with a drive power of
up to 50 kW. It is equipped with a modern control system, which supports freely programmable
load collectives (pump speeds, pressures and oil temperatures) and allows continuous data logging.
Measurement of the energy saving potential through use of modern transmission fluids is performed
on our new gear test bench. This test bench supplements the efficiency testing on various com-
plete transmissions and motor vehicles which we performed independently or together with partners
at universities and research institutes.
This selection shows that FUCHS takes on the technological challenges resulting from the necessity
of sustainability considerations, constantly creates solutions and offers these to our customers.
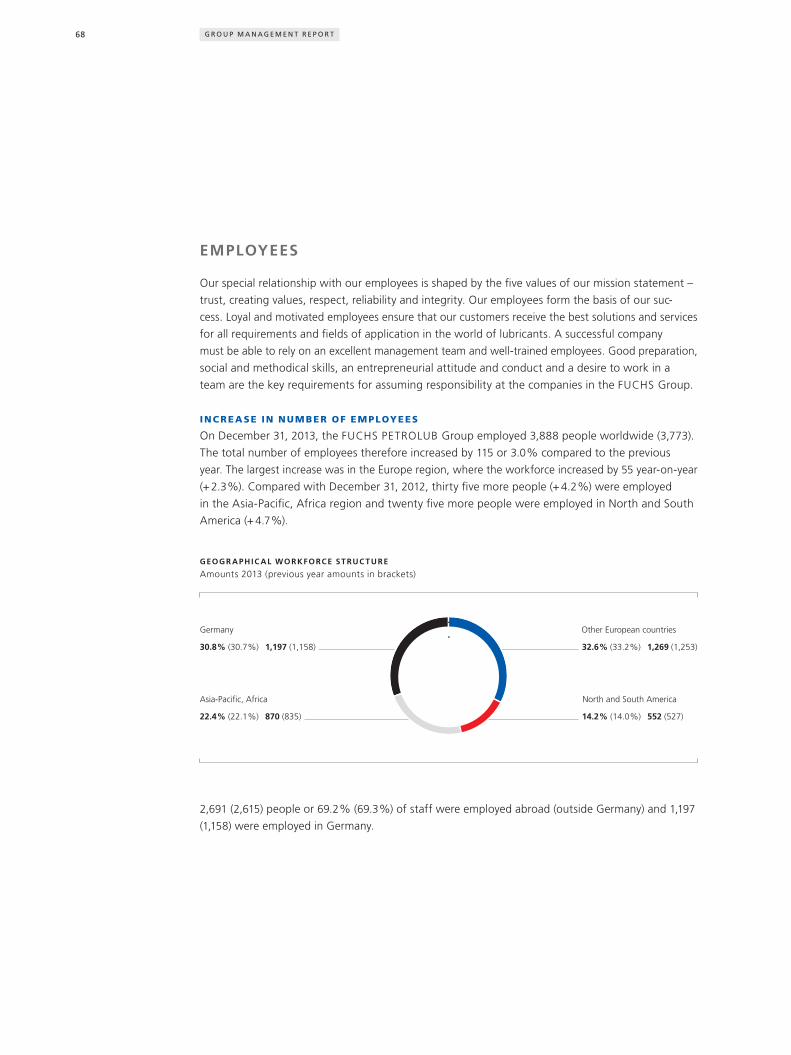
68 G R O U P M A N A G E M E N T R E P O R T
EMPLOYEES
Our special relationship with our employees is shaped by the five values of our mission statement –
trust, creating values, respect, reliability and integrity. Our employees form the basis of our suc-
cess. Loyal and motivated employees ensure that our customers receive the best solutions and services
for all requirements and fields of application in the world of lubricants. A successful company
must be able to rely on an excellent management team and well-trained employees. Good preparation,
social and methodical skills, an entrepreneurial attitude and conduct and a desire to work in a
team are the key requirements for assuming responsibility at the companies in the FUCHS Group.
INC REASE IN NUMBER OF EM PLOYEES
On December 31, 2013, the FUCHS PETROLUB Group employed 3,888 people worldwide (3,773).
The total number of employees therefore increased by 115 or 3.0 % compared to the previous
year. The largest increase was in the Europe region, where the workforce increased by 55 year-on-year
(+ 2.3 %). Compared with December 31, 2012, thirty five more people (+ 4.2 %) were employed
in the Asia-Pacific, Africa region and twenty five more people were employed in North and South
America (+ 4.7 %).
GEOGR APHIC AL WORKFORCE STRUC TURE
Amounts 2013 (previous year amounts in brackets)
Asia-Pacific, Africa
22.4 % (22.1 %) 870 (835)
Germany
30.8 % (30.7 %) 1,197 (1,158)
North and South America
14.2 % (14.0 %) 552 (527)
Other European countries
32.6 % (33.2 %) 1,269 (1,253)
2,691 (2,615) people or 69.2 % (69.3 %) of staff were employed abroad (outside Germany) and 1,197
(1,158) were employed in Germany.

69G R O U P M A N A G E M E N T R E P O R T2.1 Corporate profile
Worldwide, 34.8 % (35.4 %) of the workforce is employed in production, while 38.9 % (38.8 %)
work in marketing and sales, 16.1 % (15.8 %) work in administration and 10.2 % (10.0 %) work in
research and development.
FUNC T IONAL WORKFORCE STRUC TURE
Amounts 2013 (previous year amounts in brackets)
Administration
16.1 % (15.8 %) 625 (598)
Sales & marketing
38.9 % (38.8 %) 1,512 (1,463)
Research & development
10.2 % (10.0 %) 398 (378)
Production
34.8 % (35.4 %) 1,353 (1,334)
Further KPIs, such as the age structure, average term of service or training hours of our employees,
are presented in the sustainability report.
In 2013, we successfully extended our global team to include new entry level staff, yet also experi-
enced specialists (+ 115).
As was already the case in the last few years, the integration and qualification of new colleagues, as
well as the targeted development and promotion of our existing employees had high priority.
STRENGTHENING THE EM PLOYER BR AND
We further enhanced our profile as an attractive employer in 2013. The newly developed employer
brand was presented in job ads and at university fairs. We will continue along this path in the coming
year and further strengthen our brand.
Sustainability report
48

70 G R O U P M A N A G E M E N T R E P O R T
Schools
Within the scope of school cooperations, we offer in-house career forums. These allow graduates to
get a better picture of the training we offer and our operational procedures.
Universities
We collaborate with universities at various levels to increase awareness of FUCHS as an attractive
employer among students, graduates and junior scientists starting out on their career. We particularly
focus on establishing contacts with students with exceptional academic achievements. Besides
scholarships, we also regularly offer internships and provide support for those writing their bachelor’s
or master’s thesis.
Experienced specialists
Winning qualified specialists is a real challenge, particularly in the growth markets such as Brazil, Rus-
sia, India and China, but also in mature markets such as the USA. The range of applicants in these
countries can be both limited and rather unclear, but FUCHS copes with this through professional
selection procedures and attractive offers to ensure the recruitment of suitable and qualified
employees. Our goal is to find the best talents in the respective areas of expertise and to motivate
them for our company and products.
TR AINING
As at the balance sheet date on December 31, 2013, 70 young people at our German subsidiaries were
attending dual training programs. 17 trainees completed their training in the reporting year.
We provide training in eight different commercial and technical job profiles. In addition to this, we
offer goal-oriented and qualified high-school graduates the opportunity to attend a dual study
program in cooperation with the Baden-Wuerttemberg Cooperative State University (DHBW) and gain
a bachelor’s degree.
Besides the various training institutes and DHBW courses, we offer study-related internships at our
subsidiaries in Germany and abroad. We also support students in doing research for their thesis.
Many of our high performers are former trainees, interns or diploma students. Encouraging these
potential future FUCHS employees is an important investment in our future.

71G R O U P M A N A G E M E N T R E P O R T2.1 Corporate profile
SUSTAINABLE PERSONNEL POLIC Y
Within the context of a sustainable personnel management, projects in the fields of health
management, further training and reconciliation of family and working life were continued. We
consistently pursue the objective of finding the optimal balance between the business interests
of FUCHS and the private and family needs of our employees. FUCHS therefore places great emphasis
on the reconciliation of family and working life. Highly flexible working hour models are an
important factor in this regard. Besides typical flexitime models, part-time models are also offered,
ranging from 15 to 32 hours per week. Where possible, job sharing models or shift work can
also be set up. A family-oriented personnel policy is the key to success in many countries and regions
when com peting for qualified staff. It establishes the fundamental prerequisite for optimum
per formance at work.
Company health management is no longer limited to training courses on handling loads, skin
protection or ergonomics when working with monitors. For the first time ever, a campaign for early
diagnosis of colon cancer, as well as a campaign for preventing addiction, were held at the site
in Mannheim. The Group company FUCHS LUBRIFIANT FRANCE received an award from the insur-
ance group Malakoff-Médéric in 2013 for its commitment to health and well-being.
STAFF DEVELOPMENT
Targeted, requirements-based personnel development forms the basis for the development of special-
ists and employees with high potential. We consider mixed management teams to be a particularly
effective way of significantly strengthening our company. For this reason we place partic ular emphasis
on the dedicated support of women and ensure that appropriate consideration is given to women
when filling management positions in the company.
Our company-owned educational establishment, the FUCHS ACADEMY, ensures continuous training
and the further education of our employees at a high level. As a global training instrument, the
FUCHS ACADEMY offers regular seminars on the most diverse technical subjects or provides our
sales experts with sound background knowledge. The FUCHS ACADEMY also offers a very
popu lar learning platform for junior staff and employees with high potential, which helps secure
continuous and targeted further development of the workforce.

72 G R O U P M A N A G E M E N T R E P O R T Corporate profile2.1
Due to the global structure of our organization, intercultural competence is furthermore an import-
ant success factor for our staff. We encourage this competence by challenging our employees
– including train ees and interns – with assignments around the globe as well as targeted deployment
of specialists and managers at FUCHS subsidiaries.
With our language courses, we ensure that the Group language, English, forms a reliable basis for
knowledge exchange. With worldwide internal placements, FUCHS also ensures optimum transfer
of expertise from our knowledge holders to new employees. Whenever necessary and sensible, we
organize both short “training placements” and long-term deployments at our subsidiaries through-
out the world.
Our global talent management program is used to identify and consistently promote talent at all of
our subsidiaries. In 2013, talents from all global regions once again gathered in the Mannheim
area for an event lasting several days during which they had the chance to hold discussions with the
Executive Board on the topics of leadership, organization, or IT concepts and gain new impulses
for their development. The global talent management concept is also supported by local programs to
develop talented young staff.
EUROPEAN SE WORKS COUNCIL
Following the successful conversion into an European company, FUCHS PETROLUB SE, the Euro-
pean SE works council elected by the employees convened for the first time in 2013. Working
alongside the national employee representatives, this committee is responsible for representing the
interests of FUCHS’ employees in Europe in the case of international concerns. The committee
comprises ten members, whereby the German companies have four representatives and Great Britain,
Belgium, Poland, France, Italy and Spain each have one representative.
SUSTAINABILITY
The main features of the company’s system of sustainability management, as well as the development
of selected sustainability indicators are presented in the sustainability report on pages 48 ff.Sustainability report
48

73G R O U P M A N A G E M E N T R E P O R T2.2 Economic framework: general and sectoral
Economic framework: general and sectoral
GLOBAL ECONOMY DISPL AYS IM PROVEMENT
The expansion of the global economy gained ground during the course of 2013. Although global
gross domestic product (GDP) again rose more slowly than in the previous year at an average of 3.0 %
(3.1 %) according to figures published by the International Monetary Fund, the prospects for the
global economy improved around the turn of 2013 / 14. Expansion in the US picked up pace once more,
while production in the eurozone also increased after one and half years of recession. The eco-
nomic dynamics also improved in the emerging markets over the course of 2013. According to the
IMF, the global economy is likely to grow by 3.7 % in 2014, which is higher than in 2013.
IM PROVED ECONOMIC AC TIVIT Y IN THE EMERGING MARKETS / BET TER PROSPEC TS IN THE ADVANC ED ECONOMIES
At 7.7 %, China recorded similarly high economic growth in the reporting year to that of the
year 2012. GDP in India increased by 4.4 %, which is a higher rate than in the previous year (3.2 %).
While the IMF is forecasting 5.4 % growth for India for the year 2014, which is more than in the
previous year, the increase in GDP in China is expected to be 7.5 % for 2014, which represents a fur-
ther slight reduction. Following growth of 1.9 % in the reporting year, the IMF expects the US
economy to grow at 2.8 % in 2014, the same rate as achieved in 2012. Overall economic performance
in the eurozone decreased by 0.4 % in 2013, although Germany was still able to record a 0.5 %
increase in GDP in the same year. An increase in GDP of 1.0 % is being forecast for the eurozone in
2014, and German economic performance is likely to increase by 1.6 %.
GLOBAL STEEL PRODUC TION U P AGAIN IN 2013 DUE TO GROW TH IN ASIA / AT THE SAM E T IME THE MATURE MARKET REGIONS OF NORTH AMERIC A AND EUROPE DECLINED
According to data published by the World Steel Association, world crude steel production recorded
a 3.5 % year-on-year increase in 2013, which represents a new record level. The growth was primar-
ily generated in Asia (6.0 %), while production in Europe (–2.0 %) and North America (–1.9 %)
decreased in the year 2013. Despite virtually unchanged output in the year 2013 (–0.1 % relative to
2012), the German Steel Trade Association believes that the German steel industry is in a difficult
situation both economically and structurally. For 2014, the Association is anticipating a slight upward
movement and an increase in German crude steel production of around 1 %. Based on the results
of a survey performed by The Financial Times with 15 analysts from the steel industry, global steel pro-
duction is likely to increase by 3.6 % in 2014. Following six years of declining production, Europe
is likely to record growth of 2.4 % in the coming year, while the predicted increase in China is fairly
moderate at just 4.0 %.
GLOBAL MECHANIC AL ENGINEERING 2013 ONLY SL IGHTLY U P / GERMANY RECORDS DECLINE IN SALES REVENU ES AND PRODUC TION
According to data published by the German Engineering Federation (VDMA), global revenue from
engineering is likely to have achieved a real increase of around 1 % in 2013. Based on estimates of the
VDMA, China once again has reached the highest growth in sales revenues, although the antici-
pated real growth rate of 5 % is still likely to remain well below the 20 % average recorded for many
years. The US could also achieve growth of around 1 %. In Germany, a decrease in sales revenues

74 G R O U P M A N A G E M E N T R E P O R T
of around 1 % is anticipated in the reporting year, while machine production is set to decline by around
1.8 % in the year 2013 according to DB Research. For 2014, however, the VDMA anticipates an
increase in production in the German mechanical engineering sector of 3 % and a global increase in
sales revenues for the sector of 5 % as the global economy continues to show improvement.
PASSENGER C AR PRODUC TION IN CHINA ST ILL ON THE R ISE / GROW TH ALSO RECORDED IN THE US , STAGNATION IN EUROPE
According to data published by the consultancy PWC, global passenger car production increased
by 4 % in the year 2013. The most important growth market was once again China with an increase
in production of nearly 12 % ahead of the US at 9.1 %. The EU, on the other hand, only managed
a marginal increase of 0.2 %, whereby passenger vehicle manufacturing in Germany rose around 1 %
in the reporting year according to data published by the German Association of the Automotive
Industry (VDA). For 2014, DB Research anticipates an increase in German passenger car production
of 6 %. This forecast is based on the accumulated replacement demand for cars in Western Europe.
In terms of global passenger vehicle manufacturing, PWC is also forecasting an increase of around 6 %
for the year 2014.
GLOBAL CHEMIC ALS PRODUC TION CONTINUES U PWARD TREND / REGIONAL GROW TH IN ASIA , THE US , AND EUROPE
According to the Association of the German Chemical Industry (VCI), the upward trend in global
chemicals production continued in 2013. Based on information provided by the VCI, the global
increase in production in the reporting year was around 4.5 %, and a similar rise is also being forecast
for 2014. In 2013, chemicals production primarily increased in China (+ 12.0 %) and other Asian
emerging markets, yet also in the US (1 %) and the EU (+ 1.4 %). The VCI also anticipates production
increases in 2014 for the aforementioned regions of 10.0 % in China, 2.0 % in the US and 1.5 %
in the EU. According to the VCI, German chemicals production rose by 1.5 % in 2013 and is likely to
increase by 2.0 % in the year 2014.
Trade, transport and services 28 %
Energy and mining 9 %
Automotive industry (vehicle
manufacturing and components) 27 %
Agriculture and construction 8 %
Engineering 8 %
Manufacturing industry
(including chemicals production)* 20 %
BREAKDOWN OF GROUP SALES REVENUES BY CUSTOMER SEC TOR
* Manufacturing industry = producer goods, capital goods, consumer goods.

75G R O U P M A N A G E M E N T R E P O R T2.2 Economic framework: general and sectoral
GLOBAL LUBRIC ANT MARKET ON THE U P / ASIA RECORDS GREATEST REGIONAL GROW TH
Global lubricant demand is estimated to have increased by around 1 % in 2013 to a volume of
just above 35 million tons. While demand in the Asia-Pacific, Africa region, as well as North and South
America each increased by around 1 %, the consumption volume in Europe stagnated at around
the same level as in the previous year. According to figures published by the Federal Office of Eco-
nomics and Export Control (BAFA), lubricant demand in Germany had increased by around 2 %
over the same period in the previous year by November 2013. Based on the positive economic fore-
casts of the IMF for the global economy, we expect increasing volumes for the lubricant markets
in all regions. In Europe, however, lubricant consumption is only likely to increase slightly, whereas it
may increase by around 1 % in the other regions.
2013 35.3 mn t
2012 35.0 mn t
2011 35.1 mn t
2010 34.5 mn t
2009 32.2 mn t
DISTR IBUT ION OF THE GLOBAL LUBR IC ANT MARKET
By regions
Total Asia-Pacific and rest of the world North and South America Europe
18.5 (52 %) 9.9 (28 %)
6.9 (20 %)
18.2 (52 %)
9.9 (28 %)
6.9 (20 %)
18.0 (51 %)
10.1 (29 %)
7.0 (20 %)
17.6 (51 %)
9.7 (28 %)
7.2 (21 %)
16.7 (52 %)
8.7 (27 %)
6.8 (21 %)

76 G R O U P M A N A G E M E N T R E P O R T
Sales revenues (performance)
2013 1,832
2012 1,819
2011 1,652
2010 1,459
2009 1,178
DEVELOPMENT OF GROUP SALES REVENUES
(in € million)
SALES REVENUES DISPL AY ORGANIC GROW TH OF 4%
Despite highly negative currency effects, the FUCHS PETROLUB Group increased its sales reve-
nues by €12.5 million or 0.7 % to €1,831.6 million in 2013 (1,819.1). Adjusted for currency effects, i. e.
without taking into account the conversion effects based on the stronger euro, sales revenues
recorded encouraging organic growth of 4 % or € 72.5 million. This rise can primarily be attributed to
increased volumes.
Growth factors in € million in %
Organic growth 72.5 4.0
External growth – –
Currency translation effects – 60.0 – 3.3
Growth in sales revenues 12.5 0.7
The nature of our business model means that it is not possible to reliably assess future business
developments based on orders on hand, so we only report sales revenues. This is because only a few
days typically elapse between orders being received and revenue being generated.
REGIONAL DEVELOPMENT OF SALES REVENU ES BY COM PANY LOC ATION
in € million 2013 2012Organic growth
External growth
Currency effects
Change absolute
Change in %
Europe 1,104.2 1,080.7 32.1 – – 8.6 23.5 2.2
Asia-Pacific, Africa 497.9 486.8 45.6 – – 34.5 11.1 2.3
North and South America 307.3 320.3 4.0 – – 17.0 – 13.0 – 4.1
Consolidation – 77.8 – 68.7 – 9.2 – 0.1 – 9.1 –
Total 1,831.6 1,819.1 72.5 – – 60.0 12.5 0.7
77G R O U P M A N A G E M E N T R E P O R T2.3 Sales revenues (performance)
ORGANIC GROW TH IN ALL THREE GLOBAL REGIONS
FUCHS was able to increase lubricant sales volumes in all three global regions in 2013. A significant
increase in sales volumes was in particular recorded in the Asia-Pacific, Africa region. The organic
increase in sales revenues in this region was 9.4 %.
At 3.0 %, Europe also achieved pleasant volume-driven organic growth in sales revenues, despite the
difficult macroeconomic conditions in some European countries.
North and South America had a poor start to 2013, but business then picked up significantly in the
second half year. At + 1.2 % for the year, the region recorded slight organic growth in sales revenues.
Unlike the previous year, the development of raw material prices did not have any appreciable
effect on sales revenues. Instead, increases in sales volumes, as well as mix and conversion effects,
were the main drivers behind the development of Group sales revenues.
The Executive Board’s revenue forecast for 2013 was confirmed by the organic increases in sales
revenues recorded in all regions. Particularly high gains were envisaged for China and North
America. While performance in the Asia-Pacific, Africa region met these expectations, it was not
possible to achieve the forecast growth targets in the North and South America region, despite
improvements in the second half of the year. This was largely due to weaker business with industrial
custom ers in the US at the start of the year. The Europe region, on the other hand, developed
better than anticipated.
As expected, raw material prices remained stable. The euro, on the other hand, displayed unex-
pected strength relative to a large number of currencies important to the Group. In the previous year,
this currency had displayed the opposite development.
Due to currency effects, this means that the long-standing average annual growth rate of around
5 % was not achieved, despite organic growth of 4.0 %. Taking into account the conversion effects
of – 3.3 %, Group sales revenues rose by 0.7 %.
The regional customer distribution displays only slight differences from the previous year. At
52.3 % (52.7 %), customers based in Europe continue to represent around one half of all customers.
Outside Europe, the majority of customers are based in the Asia-Pacific, Africa region with a
30.6 % share of total sales revenues (29.4 %). A further 17.1 % (17.9 %) of Group sales revenues were
generated in North and South America.

78 G R O U P M A N A G E M E N T R E P O R T Sales revenues (performance)2.3
HIGH GROW TH R ATES IN ASIA- PACIF IC , AFRIC A
The European companies generated sales revenues of €1,104.2 million in the reporting year (1,080.7).
This figure represents 2.2 % or € 23.5 million more than in the previous year. The key drivers of
this were increases in volume, primarily in Germany, but also in Italy, France, and Russia. Organic
growth was € 32.1 million or 3.0 %. Weaker exchange rates of the British pound and the Russian
ruble had the opposite effect. The effect on Group sales revenues was – € 8.6 million or – 0.8 %.
As was the case in the previous year, the Asia-Pacific, Africa region recorded the greatest absolute
increase in sales volumes of all regions. At the same time, this region also recorded the greatest
absolute and relative organic growth in sales revenues of + € 45.6 million or + 9.4 %. Besides the com-
panies in China, our companies in South Africa, Singapore, and Indonesia all recorded significant
growth. Due to currency effects, our Australian company was not quite able to repeat the previous
year’s revenue. While the Australian dollar still provided highly positive conversion effects in the
previous year, it fell sharply relative to the euro in the reporting year. The Asian currencies were also
weaker than in the previous year when converted to the Group currency. The currency translation
effects of all companies together are – € 34.5 million or – 7.1 %. The region recorded total growth of
€11.1 million or 2.3 %, and the companies generated sales revenues of € 497.9 million (486.8).
At € 4.0 million or + 1.2 %, the North and South America region only recorded slight organic growth
in 2013. This was largely due to unexpectedly weak demand in the industrial business of our US
company at the start of the year. At the same time, the euro became stronger relative to the rele-
vant local currencies. The effect from conversion to the Group currency was – €17.0 million or
– 5.3 %. Total sales revenues in the region declined by 4.1 % or €13.0 million to € 307.3 million (320.3).
Other products 3.6 % (€ 65.6 million)
Automotive lubricants 40.4 %
(€ 740.8 million)
Industrial lubricants
and specialties 56.0 % (€ 1,025.2 million)
BREAKDOWN OF GROUP SALES REVENUES BY PRODUC T GROUPS
Sales revenues
150

79G R O U P M A N A G E M E N T R E P O R T2.4 Results of operations
Results of operations
CONSOLIDATED RESULTS OF OPERATIONS
INC REASE IN EARNINGS CONTINUES
The FUCHS PETROLUB Group successfully continued its earnings growth in 2013. Earnings before
interest and tax (EB IT) increased by 6.6 % to € 312.3 million (293.0), while earnings after taxes increased
by 5.6 % to € 218.6 million (207.0).
Due to currency effects, the increases in sales volumes recorded by the Group within the scope of its
growth initiative only led to a 0.7 % increase in sales revenues. Thanks to an improved margin,
however, gross profit increased by 3.6 % or € 23.9 million to € 689.9 million (666.0). The gross margin
increased to 37.7 % (36.6 %).
At € 385.1 million (376.1), expenses for selling, distribution and administration, as well as research
and development, are € 9.0 million or 2.4 % higher than in the previous year. Freight costs and other
selling and distribution expenses exceeded the previous year’s figures due to the higher level of
business conducted. Beside this, the increase in the number of employees in the course of our growth
initiative had an effect on wages and salaries, as did the usual annual inflation adjustment. The
ongoing construction work to build new facilities and expand existing facilities in important markets
once again increased the cost base. However, the stronger euro dampened the cost increase here.
At – € 6.0 million (– 11.1), other operating income in 2013 was less burdened than in the previous year.
Expenses in Great Britain due to the transfer of risks from pension liabilities to an insurance
company were €1.6 million in the reporting year (4.2). In addition to this, the previous year’s figure
included expenses accrued within the context of the legal action in the Middle East.
EBIT before income from companies consolidated at equity increased by € 20.0 million or 7.2 %
to € 298.8 million (278.8), and the corresponding margin increased by one percentage point to 16.3 %
(15.3 %). Including earnings of companies consolidated at equity, the Group generated EBIT of
€ 312.3 million (293.0). EBIT, an important driver of FVA, was €19.3 million or 6.6 % above the previ-
ous year’s figure. This actually represents a pleasant increase in the light of the previous year’s
high basis, a difficult economic situation in countries in Southern Europe and South America, as well
as significant currency effects.
At – €1.6 million, the financial result remained at around the previous year’s level (– 1.9). Despite
greater net liquidity in the Group, the interest on pensions and the differences in the interest rate
between various currencies led to net interest expenses. The interest rates in funding currencies
such as the Russian ruble, Brazilian real, or Indian rupee were much higher than the interest rates in
the investment currencies such as the euro or US dollar.
Glossary page 208
a–z

80 G R O U P M A N A G E M E N T R E P O R T
The rate of taxation (income tax relative to earnings before tax without income from companies con-
solidated at equity) increased slightly year-on-year from 30.4 % to 31.0 %. This can largely be
attributed to the provision put in place for tax risks in the Asia-Pacific, Africa region. Income taxes
were € 92.1 million (84.1).
The Group recorded earnings after taxes of € 218.6 million (207.0), which corresponds to an increase
of €11.6 million or 5.6 %. The net profit margin was 11.9 % (11.4 %).
Earnings per ordinary and preference share increased by around 5.5 % or € 0.16 year-on-year to € 3.06
(2.90) and € 3.08 (2.92) respectively.
Earnings developments in 2013 were therefore in line with the forecasts we made at the start of the
year. As anticipated, the Group was able to increase EBIT thanks to higher gross income and a
lower increase in personnel and overhead costs. The Group was able to record higher profit after tax
and an increase in earnings per share.
EUROPE AND ASIA- PACIF IC , AFRIC A WITH DISPROPORTIONATELY H IGH INC REASES IN EARNINGS
The two regions of Europe and Asia-Pacific, Africa not only increased their sales revenues, but also
their earning power. Segment earnings (EBIT) in Europe rose by €18.9 million or 14.1 % to €152.5 mil-
lion (133.6) and in Asia-Pacific, Africa by € 7.1 million or 7.4 % to €103.4 million (96.3). EBIT before
income from companies consolidated at equity as a % of sales revenues increased in Europe to 13.7 %
(12.3 %) and in Asia-Pacific, Africa to 18.3 % (17.1 %).
The success in Europe is mainly attributable to the companies in Germany, although the companies in
Poland, France, and Italy also made a valuable contribution. In Asia, our two Chinese companies
were the main drivers of the significant increase in income.
The North and South America region was not quite able to maintain its high earning power in
2013. Influenced primarily by slow business in the US at the start of the year and currency conversion
effects, the region’s EBIT declined by € 5.3 million or 7.9 % to € 62.2 million (67.5). The ratio of
EBIT before income from companies consolidated at equity to sales revenues decreased to 20.2 %
(21.1 %), but still represents the highest value in the Group.
In our forecast at the start of 2013, we anticipated increases in earnings, in particular in Asia with a
focus on China, as well as in North America. While our expectations were met in China, North
America recorded a dip. However, significantly better development than anticipated in Europe, espe-
cially in Germany and Southern Europe, was able to compensate for this.
FUCHS shares
56
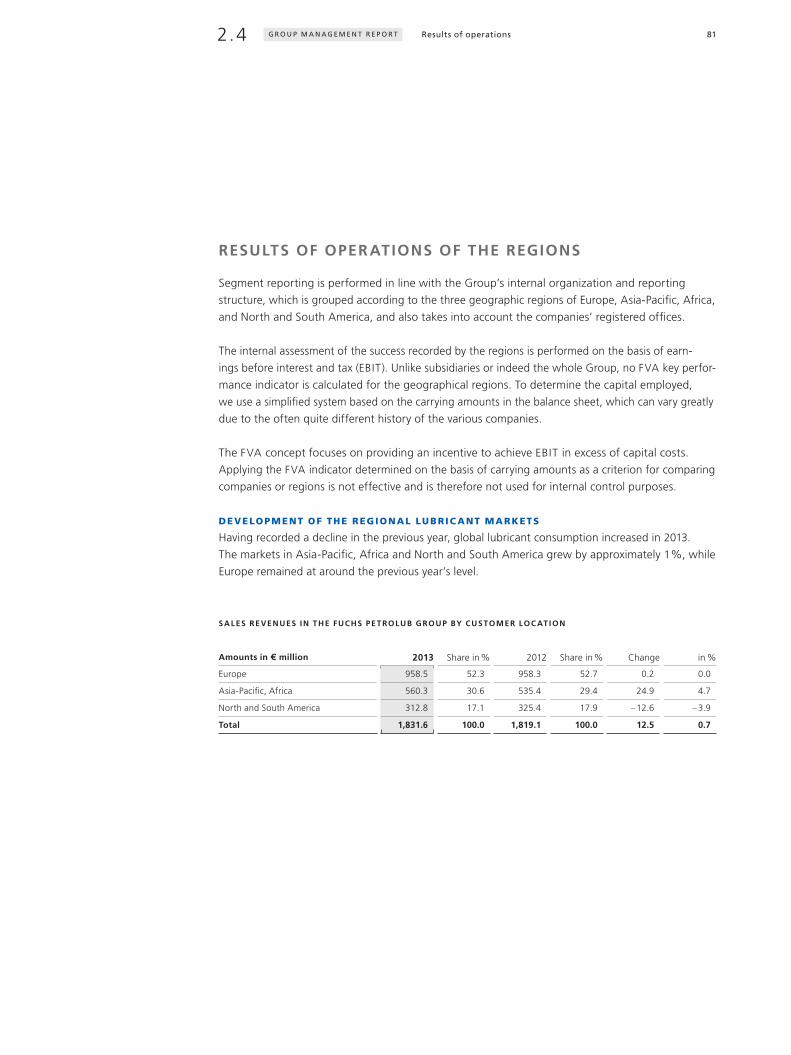
81G R O U P M A N A G E M E N T R E P O R T2.4 Results of operations
RESULTS OF OPERATIONS OF THE REGIONS
Segment reporting is performed in line with the Group’s internal organization and reporting
structure, which is grouped according to the three geographic regions of Europe, Asia-Pacific, Africa,
and North and South America, and also takes into account the companies’ registered offices.
The internal assessment of the success recorded by the regions is performed on the basis of earn-
ings before interest and tax (EBIT). Unlike subsidiaries or indeed the whole Group, no FVA key perfor-
mance indicator is calculated for the geographical regions. To determine the capital employed,
we use a simplified system based on the carrying amounts in the balance sheet, which can vary greatly
due to the often quite different history of the various companies.
The FVA concept focuses on providing an incentive to achieve EBIT in excess of capital costs.
Applying the FVA indicator determined on the basis of carrying amounts as a criterion for comparing
companies or regions is not effective and is therefore not used for internal control purposes.
DEVELOPMENT OF THE REGIONAL LUBRIC ANT MARKETS
Having recorded a decline in the previous year, global lubricant consumption increased in 2013.
The markets in Asia-Pacific, Africa and North and South America grew by approximately 1 %, while
Europe remained at around the previous year’s level.
SALES REVENUES IN THE FUCHS PETROLUB GROUP BY CUSTOMER LOC AT ION
Amounts in € million 2013 Share in % 2012 Share in % Change in %
Europe 958.5 52.3 958.3 52.7 0.2 0.0
Asia-Pacific, Africa 560.3 30.6 535.4 29.4 24.9 4.7
North and South America 312.8 17.1 325.4 17.9 – 12.6 – 3.9
Total 1,831.6 100.0 1,819.1 100.0 12.5 0.7

82 G R O U P M A N A G E M E N T R E P O R T
EUROPE
Segment information (in € million) 2013 2012
Sales revenues by customer location 958.5 958.3
Sales revenues by company location 1,104.2 1,080.7
Depreciation and amortization 17.6 17.4
EBIT before inclusion of companies consolidated at equity 151.3 132.6
Income from companies consolidated at equity 1.2 1.0
Segment earnings (EBIT) 152.5 133.6
Additions to property, plant and equipment, financial assets and intangible assets 32.0 34.9
Employees (average number) 2,356 2,311
Key performance indicators (in %)
Ratio of EBIT before inclusion of companies consolidated at equity
relative to sales revenues
13.7
12.3
With good sales volumes, revenue, and earnings trends, Europe exceeded expectations and forecasts
in 2013. While the sales revenues of the companies with customers in the region remained at the
previous year’s level of € 958.5 million (958.3), the export business grew. Due to higher volumes, the
companies were able to increase their sales revenues by 2.2 % to €1,104.2 million (1,080.7). The
German companies recorded the greatest gains. Beside this, the increases in sales revenues at our
companies in Italy and France were particularly encouraging. Poland, Austria, Ukraine and Sweden
also recorded appreciable increases.
The growth in sales revenues recorded by these companies was accompanied by improved income
and better earning power. Besides Italy, the other Southern European entities also generated dispro-
portionately high income gains. The region’s EBIT increased by 14.1 % to €152.5 million (133.6).
The ratio of EBIT before income from companies consolidated at equity relative to sales revenues
increased to 13.7 % (12.3 %).
Germany recorded sound business development across all customer sectors. In Great Britain, our
industrial business continued to display pleasing development. The companies in France and
the countries of Southern Europe were able to build on their position as lubricant specialists in a dif-
ficult environment.
Segments
124

83G R O U P M A N A G E M E N T R E P O R T2.4 Results of operations
In Central and Eastern Europe, our Polish company enjoyed particular success. The structured cultiva-
tion of the market was rewarded by increases in sales revenue in the industrial and auto motive
fields which resulted in an improved earnings position. Following several years of powerful growth,
the gains recorded in Russia in 2013 were more modest and also further impaired by currency
translation effects. However, we expect to see further significant growth in Russia again in 2014
following the successful start-up of the new facility.
The processes of closing the production facility in Portugal and of reorganizing the business of an
English company that focuses on special applications were completed in the reporting year.
Thanks to the new structure, in future we anticipate improved customer support and greater effi-
ciency in both production and sales.
2013 1,104.2
2012 1,080.7
2011 1,006.7
2010 874.7
2009 742.5
DEVELOPMENT OF SALES REVENUES IN EUROPE BY COMPANY LOC AT ION
(in € million)

84 G R O U P M A N A G E M E N T R E P O R T
ASIA- PACIF IC , AFRIC A
Segment information (in € million) 2013 2012
Sales revenues by customer location 560.3 535.4
Sales revenues by company location 497.9 486.8
Depreciation and amortization 5.9 4.5
EBIT before inclusion of companies consolidated at equity 91.1 83.1
Income from companies consolidated at equity 12.3 13.2
Segment earnings (EBIT) 103.4 96.3
Additions to property, plant and equipment, financial assets and intangible assets 21.2 24.3
Employees (average number) 866 838
Key performance indicators (in %)
Ratio of EBIT before inclusion of companies consolidated at equity
relative to sales revenues 18.3 17.1
Asia-Pacific, Africa was once again the most dynamic region in the FUCHS PETROLUB Group.
Our Chinese companies were the main contributors to the high level of organic growth in sales rev-
enues. Although business in China continues to be dominated by customers in the automotive
sector, our structured market cultivation is paying off in the form of increased industrial and specialty
business, as well as good mining business.
In Australia, our business with mining customers was influenced by the weaker demand for Austra-
lian raw materials. Increased volumes with customers in the industrial and automotive business
could not fully compensate for this. Just like in South Africa, sales revenues in Australia also suf fered
due to the weakness of the local currency relative to the euro. Disregarding this, our South African
company continued its successful development with increases in both volumes and sales revenues.
Our companies in Southeast Asia recorded healthy increases in revenue with double-digit increases in
volume and were able to further extend their market position.
Total sales revenues in the region by company location increased by €11.1 million or 2.3 % to
€ 497.9 million (486.8). The Group’s entire business with customers in the region even increased by
4.7 % or € 24.9 million to € 560.3 million (535.4), although currency translation effects adversely
affected the actual growth figures in all cases.
Segments
124

85G R O U P M A N A G E M E N T R E P O R T2.4 Results of operations
The earnings development was also positive. With a rise of 7.4 % or € 7.1 million to €103.4 million
(96.3), the region increased its EBIT more than its sales revenues. The relative strength of earnings,
expressed as the ratio of EBIT before inclusion of companies consolidated at equity rel ative to sales
revenues, increased to 18.3 % (17.1 %).
More than half of segment earnings was generated by our two Chinese companies. In addition to
this, the companies in Australia and South Africa made a significant contribution to the success
recorded. The fact that, besides these four companies, most of the other Asian companies recorded
double-digit EBIT gains and thereby display excellent earnings power, is also encouraging.
Construction work for a new facility in Northern China, which began in 2012, has now been
completed. The FUCHS PETROLUB Group therefore now has another modern facility in this impor-
tant growth market. This lays the foundations for continued further development of our Chinese
customer base.
2013 497.9
2012 486.8
2011 412.3
2010 382.1
2009 289.8
DEVELOPMENT OF SALES REVENUES IN AS IA- PAC IF IC , AFR IC A BY COMPANY LOC AT ION
(in € million)

86 G R O U P M A N A G E M E N T R E P O R T
NORTH AND SOUTH AMERIC A
Segment information (in € million) 2013 2012
Sales revenues by customer location 312.8 325.4
Sales revenues by company location 307.3 320.3
Depreciation and amortization 4.2 4.5
EBIT before inclusion of companies consolidated at equity 62.2 67.5
Income from companies consolidated at equity 0.0 0.0
Segment earnings (EBIT) 62.2 67.5
Additions to property, plant and equipment, financial assets and intangible assets 17.1 13.7
Employees (average number) 540 524
Key performance indicators (in %)
Ratio of EBIT before inclusion of companies consolidated at equity
relative to sales revenues 20.2 21.1
Following an extremely successful 2012, the North and South America region recorded a rather weak
first half of 2013. Our US business with industrial and mining customers was characterized by
significantly weaker demand than anticipated. Improved OEM business with customers from the auto-
motive industry was only able to partially compensate for this. Our consistent market cultivation
and approach to winning new customers are now having positive effects, and a reversal in trends
could be achieved in the second half of the year.
With the exception of Argentina, the other countries in the region were able to record increases
both in terms of volume and revenue. Following weaker growth in the previous year, the company in
Brazil was in particular able to return to its previous dynamics with double-digit increases. How-
ever, the Argentinian economy suffered from a heightening of the crisis symptoms, which created a
difficult environment for our company to operate in.
In addition to the relative strength of the euro, the pronounced weakness of the South American cur-
rencies had a negative effect when converting local sales revenue and earnings figures to the
Group currency. Despite achieving slight organic growth, the companies in North and South Amer-
ica recorded a decline in sales revenues of 4.1 % or €13.0 million to € 307.3 million (320.3) as a
result of this. The sales revenues of all Group companies with customers from the region decreased
to € 312.8 million (325.4).
Segments
124

87G R O U P M A N A G E M E N T R E P O R T2.4 Results of operations
The FUCHS PETROLUB Group is continuing its systematic market cultivation in the region. In the US,
the extended and modernized facility in Harvey near Chicago is enabling further growth in the
industrial and OEM business. This investment was the basis for the planned closure of an old location
in the US. At the same time, preparations are underway for construction of a new facility in Brazil.
With this investment, the Group is targeting development of additional business fields and increased
market penetration.
The region had to accept a reduction in segment earnings in 2013. EBIT decreased by 7.9 %
or € 5.3 million to € 62.2 million (67.5). Yet despite this, the ratio of EBIT before inclusion of compa-
nies consolidated at equity relative to sales revenues recorded the highest value of all regions at
20.2 % (21.1 %).
2013 307.3
2012 320.3
2011 282.6
2010 245.1
2009 176.9
DEVELOPMENT OF SALES REVENUES IN NORTH AND SOUTH AMERIC A BY COMPANY LOC AT ION
(in € million)

88 G R O U P M A N A G E M E N T R E P O R T
Net assets and financial position
BALANCE SHEET STRUCTURE
INVESTMENTS AND INC REASED L IQUIDIT Y LEAD TO A R ISE IN THE BAL ANC E SHEET TOTAL
The balance sheet total increased by 4.8 % to €1,162.0 million (1,108.7). Alongside additional invest-
ments in property, plant and equipment, this was primarily due to greater cash and cash equivalents.
The balance sheet structure remained virtually unchanged. At 59.8 % (60.3 %) of the balance
sheet total, short-term assets are the dominant factor, while long-term assets increased slightly to
40.2 % (39.7 %) and amount to € 468.2 million (440.4).
INVESTMENTS IN NEW AND EXIST ING FACIL IT IES INC REASE PROPERT Y, PL ANT AND EQUIPMENT
Long-term assets were mainly affected by investments made in new and existing facilities. Property,
plant and equipment increased by € 31.6 million to € 284.5 million (252.9) and therefore represent
24.5 % of total assets. Since the start of the growth initiative in 2007, the Group has almost doubled
its property, plant and equipment.
Intangible assets are the second largest item in the Group’s long-term assets. At € 82.0 million
(84.8), around three quarters of the €108.2 million (112.7) is attributable to goodwill. The values
result ing from earlier acquisitions are subjected to an impairment test on a yearly basis. Aside
from exchange rate fluctuations, their value has hardly changed for years. In contrast with this,
customer bases and similar assets are amortized and amounted to € 26.1 million (27.6) as at
December 31, 2013.
The carrying amount of the five companies included in the consolidated financial statements at
equity rose to € 43.3 million (40.4), as the proportion of non-distributed profits increased.
NET OPER ATING WORKING C APITAL REDUC ED
The business model employed by FUCHS PETROLUB requires more short-term assets than long-term
assets. Short-term assets primarily comprise the inventories needed to secure a high degree
of readiness to deliver and trade receivables as a supplementary factor of a customer-supplier rela-
tionship.
At a total of € 492.8 million (489.7), the scope of inventories and trade receivables hardly changed year
on year (+ 0.6 %). NET OPER ATING WORKING C APITAL (NOWC) is an important KPI for the Group
within the scope of its value-oriented corporate control and thereby its FVA concept. Besides invento-
ries and receivables, the KPI of NOWC takes into account trade payables. As at the end of 2013,
the Group had reduced the net amount of inventories plus trade receivables less trade payables to
€ 360.5 million (369.9).
Glossary page 209
a–z

89G R O U P M A N A G E M E N T R E P O R T2.5 Net assets and financial position
STRUC TURE OF ASSETS AND C APITAL
ASSETS IN € MILL ION
82 (7 %) 285 (25 %) 232 (20 %) 260 (22 %) 303 (26 %)2013
85 (8 %) 253 (23 %) 239 (21 %) 250 (23 %) 282 (25 %)2012
85 (9 %) 215 (22 %) 228 (23 %) 248 (25 %) 209 (21 %)2011
86 (10 %) 201 (22 %) 187 (21 %) 221 (25 %) 199 (22 %)2010
83 (11 %) 181 (24 %) 149 (20 %) 172 (23 %) 161 (22 %)2009
EQUIT Y AND L IAB IL IT IES IN € MILL ION
854 (73 %) 16 (1 %) 8 (1 %) 132 (12 %) 152 (13 %)2013
782 (71 %) 26 (2 %) 9 (1 %) 120 (11 %) 172 (15 %)2012
658 (67 %) 16 (2 %) 14 (1 %) 129 (13 %) 168 (17 %)2011
546 (61 %) 74 (8 %) 20 (2 %) 114 (13 %) 140 (16 %)2010
393 (53 %) 84 (11 %) 58 (8 %) 91 (12 %) 120 (16 %)2009
2013 1,162
2012 1,109
2011 985
2010 894
2009 746
BAL ANCE SHEET TOTAL IN € MILL ION
Goodwill Property, plant and equipment Inventories Trade receivables Other assets
Equity Pension provisions Financial liabilities Trade payables Other liabilities

90 G R O U P M A N A G E M E N T R E P O R T
The ratio of NOWC to annualized sales revenues in the fourth quarter led to a value of 19.9 %
(21.0 %) as at December 31, 2013. Beside the decrease in NOWC, which was also due to exchange
rate movements, the higher sales revenues recorded in the fourth quarter of 2013 over the same
quarter of the previous year also had a positive effect on this ratio. The average capital tie-up period
dropped to 73 days (77).
Beside net operating working capital, the Group also held cash and cash equivalents of €175.2 million
(143.7) on the balance sheet date.
SHAREHOLDERS’ EQUIT Y AND EQUIT Y R ATIO U P AGAIN
The shareholders’ equity of the FUCHS PETROLUB Group increased once again. At € 853.5 million
(781.7) and an EQUIT Y R ATIO of 73.5 % (70.5 %), it represents a new high. The Group was able
to finance all of its investments in property, plant and equipment within the scope of its growth
initiative using shareholders’ equity.
A KPI for measuring the profitability of the shareholders’ equity deployed is return on equity
(ROE = profit after tax relative to the average shareholders’ equity determined on the basis of interim
quarterly reports). In the light of a more pronounced increase in equity capital (+ 14.6 %) than
the cor re sponding increase in profit after tax (+ 5.6 %), the ROE in 2013 declined to 26.7 % (29.0 %)
in 2013.
At € 41.0 million (54.4), the Group only makes use of long-term liabilities to a very limited extent.
Pension liabilities once again displayed a downward trend at just €15.8 million net (26.4). In Great
Britain further risks were transferred to an insurance company, resulting in further risks being
reduced in the reporting year.
The high proportion of long-term capital, in particular shareholders’ equity, provides FUCHS
with financial flexibility. The Group is in a position to continue its growth initiative, while at the same
time seeking external acquisition options and also maintaining its continuous dividend policy. In
November 2013, the Group began using a portion of its liquidity surplus to buy back own shares, in
addition to its dividend policy. The intention is to buy back own shares equal to no more than
€100 million by March 2015 at the latest. Our objective with this approach is to get closer to our
long-term goal of a balanced financing structure made up of shareholders’ equity and borrowed
capi tal. The buyback program can be prematurely terminated at any time, for example if a suitable
acquisition requires a greater allocation of funds.
As at the end of 2013, the Group held short-term liabilities of € 267.5 million (272.6). This corre-
sponds to 22.9 % (24.6 %) of the balance sheet total. Around half of this was attributable to trade
payables, which increased to €132.3 million (119.8). Financial liabilities were € 7.8 million (8.9).
At €127.4 million (143.9), other short-term liabilities, including tax liabilities and provisions, declined
from the previous year’s level.
Glossary page 208
a–z

91G R O U P M A N A G E M E N T R E P O R T2.5 Net assets and financial position
Taking into account short-term financial liabilities of € 7.8 million (8.9), the Group had net liquidity
of €167.4 million (134.8) on the balance sheet date. The buyback of own shares for € 22.0 million is
already included in this figure.
In light of the current financial situation, external ratings are not necessary. However, the Group
is capable of subjecting itself to a rating process at any time if this becomes necessary for refinancing
purposes on the capital market. The internal processes required for this are already in place. The
FUCHS Value Added system of value-oriented corporate control is a powerful instrument that is well
suited to this.
FUCHS REMAINS A STRONG PARTNER TO CUSTOMERS AND SU PPLIERS
With its high equity ratio and good level of liquid funds available, FUCHS not only remains a
reli able supplier, but also a solvent customer. Technical performance coupled with economic and
financial stability.
DEVELOPMENT OF THE KEY DR IVERS OF AVER AGE C APITAL EMPLOYED*
in € million 2013 2012Change
absoluteChange
relative in %
Property, plant and equipment * 267.8 231.3 36.5 15.8
Intangible assets * 111.7 115.0 – 3.3 – 2.9
Net operating working capital * 376.5 371.5 + 5.0 + 1.3
Sum of significant drivers * 756.0 717.8 38.2 5.3
Other items * 30.3 19.5 10.8 55.4
Capital employed * 786.3 737.3 49.0 6.6
* Average figures, each based on five quarterly values.
As a result of comprehensive investments in new and existing facilities, FUCHS PETROLUB employed
significantly greater property, plant and equipment in 2013 (+ 15.8 %) than in the previous year.
At 6.6 %, however, the overall increase in total capital employed was more moderate.
The drivers specifically addressed within the scope of value-driven corporate governance of invest-
ments (property, plant and equipment, as well as intangible assets) and net operating working capi-
tal (in particular inventories and receivables) increased by 5.3 % in total.
The increase due to investments developed according to plan. With regard to NOWC we are target-
ing a reduction or a disproportionately low increase in the future, irrespective of the management
limits resulting from our business model. In particular, inventories can only be reduced slightly in a
specialty enterprise with a high level of service quality.

92 G R O U P M A N A G E M E N T R E P O R T
CAPITAL EXPENDITURE AND ACQUISITIONS
C APITAL EXPENDITURES
Pursuant to our forecast at the start of the year, capital expenditures in 2013 remained at the previous
year’s level. FUCHS PETROLUB invested € 72.8 million (71.4). Construction work on new facili-
ties and modernization of existing facilities will continue for a few more years. Once the projects are
complete, however, the investment level will go down again.
The largest investment in property, plant and equipment in the reporting year we made in China.
The new facility in Yingkou was opened on October 20, 2013 and has now replaced production at the
old site, which had become too small. FUCHS is therefore not only capable of meet ing customer
requirements more quickly and efficiently, but also has sufficient capacities to continue the excellent
growth it has recorded over the last few years in the Chinese market.
We were also able to largely complete another key investment in the reporting year at our facility in
Harvey near Chicago, where the production site has been considerably extended and modernized.
This creates solid foundations for further growth, both in our traditional industrial business and in the
OEM business.
The opening of our new Russian facility in Kaluga to the south west of Moscow was a third milestone.
This newly constructed facility replaces a small site in Yaroslawl to the north east of Moscow and
offers many opportunities to maintain the dynamic growth recorded over the last few years through
improvements in production and logistics.
In addition to this, we made investments at various other locations. In Brazil, preparatory work
for construction of a new facility is well underway. Having overcome many administrative hurdles, con-
struction work is now scheduled to commence in 2014. Appreciable funds were also invested
into the existing infrastructure in Germany (Mannheim and Kaiserslautern), as well as in Melbourne,
Australia, with a view to modernizing and extending existing facilities.
The Group spent a total of € 70.2 million (61.0) on property, plant and equipment, as well as intan-
gible assets. A further € 2.6 million were allocated to financial assets. These include the business
acquired in Norway in the summer of 2013. Our current sales partner, FUCHS LUBRICANTS NORWAY AS
(formerly FUCHS OFF SHORE LUBRICANTS AS) in Bergen, Norway, supplies industrial customers,
primarily in the offshore industry, and generates sales revenues in the low single-digit million range.

93G R O U P M A N A G E M E N T R E P O R T2.5 Net assets and financial position
DEPREC IATION AND AMORTIZ ATION
Depreciation of property, plant and equipment, intangible assets and financial assets increased to
€ 28.2 million (26.9).
INVESTMENTS IN ACQUIS IT IONS
In the reporting year, FUCHS acquired the minority interests of the co-shareholder in the Ukraine.
2013 70.2
27.7
2012 61.0
26.9
2011 35.6
26.7
2010 32.5
23.3
2009 30.1
22.7
C APITAL EXPENDITURE AND DEPREC IAT ION AND AMORTIZ AT ION – TANGIBLE AND INTANGIBLE ASSETS
(excluding goodwill) in € million
Capital expenditure Depreciation and amortization
STATEMENT OF CASH FLOWS
FUCHS PETROLUB generated free C ASH FLOW of €149.9 million in 2013 (140.4), despite its high level
of capital expenditure.
The basis for this success was another year of record earnings after taxes of € 218.6 million (207.0).
Primarily taking into account amortization expenses of € 28.2 million (26.9), gross cash flow increased
to € 224.6 million (219.0).
LOW ADDIT IONAL COMMIT TED FUNDS FROM OPER ATING AC TIVIT IES
Additional net operating working capital, as well as a small balance of other assets and liabilities, was
financed using gross cash flow. Adjusted for currency effects, net operating working capital
increased by € 8.6 million (24.9), while other assets and liabilities tied up € 0.9 million (9.0). Cash flow
from operating activities therefore increased to € 215.1 million (203.1).
Statement of changes in long-term assets
120
Glossary page 208
a–z

94 G R O U P M A N A G E M E N T R E P O R T Net assets and financial position2.5
The funds used within the scope of investing activities led to a cash outflow of € 65.2 million
(62.7). This figure includes record investments in fixed assets of € 72.8 million (71.4) and also takes
into account € 5.4 million in dividends received from companies consolidated at equity (7.9).
Free cash flow therefore increased to an impressive €149.9 million in the reporting year (140.4),
which is in line with the forecast we made at the end of the third quarter (more than €130 million).
FREE C ASH FLOW OF €149.9 MILL ION FACIL ITATES A H IGHER DIVIDEND PAYOUT AND INC REASES OUR L IQUIDIT Y CUSHION
In 2013, the Group paid out a large portion of its free cash flow to shareholders in the form of divi-
dend payments and share buybacks. The dividends paid for the previous year were increased by
€ 21.1 million to € 92.0 million (70.9), and € 22.0 million (0.0) was deployed for share buyback purposes.
Cash and cash equivalents increased by € 31.5 million to €175.2 million (143.7).
LIQUIDITY SITUATION, FINANCING STRUCTURE, AND DIVIDEND POLICY
L IQUIDIT Y DEVELOPMENT AND F INANCING STR ATEGY
The Group has significant cash and cash equivalents. These secure its flexibility and independence.
At the same time, they also support a continuous dividend policy, which targets constant increases
or at the very least stable dividend payouts to shareholders in the SE. The Group and its con-
trolling holding company thereby pursue a continuous dividend policy and do not apply a fixed distri-
bution rate to the earnings generated in the respective year.
Cash and cash equivalents also enable FUCHS to act quickly should suitable acquisition oppor-
tunities arise. In addition to this, the Group has access to free lines of credit of €140 million (148) at
banks. The company also has the option to raise funds from the capital market.
In the fourth quarter of 2013, FUCHS PETROLUB SE began buying back its own shares. This decision
was taken due to the robust level of shareholders’ equity and further increases of cash and cash
equivalents, as well as to optimize the capital structure. Aside from this, there were no appreciable
liquidity requirements for acquisitions at this time. Shares up to a total value of €100 million can
be bought back, and € 22.0 million was already allocated to this purpose in the period under review.
Statement of cash flows
122
95G R O U P M A N A G E M E N T R E P O R T2.6 Overall position and performance indicators
Overall position and performance indicators
The Executive Board is convinced that the FUCHS PETROLUB Group is in an excellent economic posi-
tion, as underlined by the company’s earning power, stability, and liquidity.
EARNING POWER AS A PERFORMANCE INDICATOR
Pursuant to the description of the controlling system (see page 65), FUCHS employs a uniform KPI for
the purposes of value-oriented corporate control in the form of FUCHS Value Added (FVA). The
earnings position as well as the net assets and financial position are included in FVA. The earnings
position is represented by earnings before interest and tax (EBIT). The net assets and financial
position are reflected in the costs for the average capital employed. Only when the recorded EBIT is
higher than the costs of capital employed is value added.
THE WEIGHTED INTEREST R ATE (WACC)
The costs of capital employed are calculated using a weighted interest rate (WACC), the level
of which is reviewed annually at the end of each year using the Capital Asset Pricing Model (CAPM)
and financial market data.
The following values were recorded as at the end of 2013:
■■ Shareholders’ equity costs ¹ = 8.4 % (8.3 %) after and 12.0 % (11.9 %) before taxes■■ Borrowing costs ² = 2.5 % (2.2 %) after and 3.6 % (3.1 %) before taxes■■ Financing structure ³ = 88 % (88 %) shareholders’ equity and 12 % (12 %) borrowed capital■■ Typical Group rate of taxation = 30 % (30 %)
1 (Risk-free interest + market risk premium × sectoral risk in the form of the beta factor).
2 (Risk-free interest + sector-specific risk surcharge).
3 (Sectoral or target financing structure at market values).
For several years, FUCHS PETROLUB has been using a weighted cost of capital of 11.5 % before taxes
within the scope of its value-oriented corporate control approach, both for internal performance
calculations and when determining the level of profit-sharing for the holding company’s management
and employees.
If the review performed on the balance sheet date does not indicate any significant deviations, this
WACC will be maintained for reasons of continuity, as was also the case at the end of 2012.
The calculated shareholders’ equity and borrowing costs increased again slightly since the turn of
2012 / 2013, as did the WACC determined on the basis of this.
Controlling system
65

96 G R O U P M A N A G E M E N T R E P O R T
Pursuant to CAPM and financial market data at the end of 2013, the calculated WACC is 11.0 %
(10.9 %) before or 7.7 % (7.6 %) after taxes. We consider these figures to confirm the appropriateness
of the WACC used by FUCHS of 11.5 % before taxes for 2013.
For calculating FVA, the WACC is employed as the pre-tax interest rate, since the earnings position is
also incorporated as a pre-tax figure in the value determination process.
F VA INC REASED AGAIN IN 2013
in € million 2013 2012Change
absoluteChange
relative in %
EBIT 312.3 293.0 19.3 6.6
Capital employed
Equity * 819.7 715.5 104.2 14.6
+ Financial liabilities * 7.4 12.1 4.7 – 38.8
+ Net pension provisions * 20.1 17.6 2.5 14.2
+ Amortized goodwill * 85.2 85.2 – –
– Cash * 146.1 93.1 53.0 56.9
Capital employed total 786.3 737.3 49.0 6.6
Pre-tax WACC (in %) 11.5 11.5
Cost of capital 90.4 84.8 5.6 6.6
FVA 221.9 208.2 13.7 6.6
* Average figures, each based on five quarterly values.
Both control variables and drivers of FVA, i. e. earnings and capital employed, increased by 6.6 % in
2013. The Group therefore also increased FVA, in other words its economic profit, by 6.6 %.
Having remained unchanged from the previous year at 39.7 %, the total return on capital employed
(ROCE = EBIT relative to average capital employed) is significantly higher than the weighted
capital costs before taxes at 11.5 %.
This high return on capital, coupled with the increase in FVA, means that the same high return was
generated with both the additional capital employed and the existing capital.
Glossary page 209
a–z

97G R O U P M A N A G E M E N T R E P O R T2.6 Overall position and performance indicators
STABILITY AS A PERFORMANCE INDICATOR
An established KPI for assessing the FUCHS PETROLUB Group’s net assets and financial position is
net gearing. Net gearing is the ratio of financial liabilities less cash and cash equivalents to share-
holders’ equity. In the light of the high level of cash and cash equivalents at €175.2 million, which
greatly exceeded the low financial liabilities of just € 7.8 million, the Group was essentially debt-
free in 2013. This KPI therefore once again had a value of zero in the reporting year, which serves to
further underline the Group’s excellent financial stability.
LIQUIDITY AS A PERFORMANCE INDICATOR
Free cash flow represents a suitable measurement for assessing the Group’s ability to distribute divi-
dends and repay debts. In 2013, FUCHS PETROLUB generated free cash flow of €149.9 mil lion
140.4). This figure, in combination with the cash and cash equivalents in place from the previous year,
will allow the share buyback program initiated in 2013 to continue in 2014. In addition to this, it
will also be possible to pay higher dividends than in the previous year and provide sufficient funds
for acquisitions.

98 G R O U P M A N A G E M E N T R E P O R T Supplementary report2.7
Supplementary report
No transactions of particular importance with an appreciable bearing on the results of opera-
tions, net assets, or financial position of the FUCHS PETROLUB Group occurred after the end of the
financial year.

99G R O U P M A N A G E M E N T R E P O R T2.8 Opportunity, risk and forecast report
Opportunity, risk and forecast report
Our opportunity and risk policy focuses primarily on sustainably securing the going concern and
growth of the company value of the FUCHS PETROLUB Group. Early and successful detection
of opportunities, as well as identification, appropriate assessment, and adequate reaction to the risks
associated with business operations meet our company objective and form the basis for our actions.
The diverse opportunities for the Group result from its technological leadership in important business
areas, the broad range of its product portfolio, cooperations with local and international custom-
ers, as well as its global positioning. On the basis of this, we see potential for developing further sec-
tors and niches, as well as for stable and continuous company development.
The following outlines our understanding of opportunities and risks:
■■ Opportunities represent possible future developments or events that could lead to positive devia-
tions from the company’s forecasts or targets.■■ Risks represent possible future developments or events that could lead to negative deviations from
the company’s forecasts or targets.
The analysis and assessment of the Group’s opportunity and risk position are subject to continuous
examination by the Executive Board and Group Management Committee (GMC).
OPPORTUNITY REPORT
THE GROU P ’S OPPORTUNIT Y MANAGEMENT SYSTEM
Within a dynamic market environment, the FUCHS PETROLUB Group’s global business operations
continuously present new opportunities, the systematic detection and utilization of which are
key components of our sustainable growth policy. The Executive Board, the GMC, the central func-
tions and the subsidiaries all cooperate closely within the scope of our opportunity management
approach. The Executive Board and the GMC substantiate these opportunities within the scope of
annual business planning and target agreements and then coordinate them with the manage-
ment supervisor responsible for operations at the subsidiaries. The Executive Board will endeavor to
secure an adequate balance between opportunities and risks on the basis of the business model,
whereby the objective of generating added value for our shareholders is pursued. We are planning to
introduce a system of opportunity reporting for 2014 that is analog to our risk reporting approach.
The Group employs planning, governance, and reporting processes to ensure early detection of oppor-
tunities. The global information is regularly consolidated within the scope of budget and general
projections. The scope of opportunity consolidation does not deviate from the scope of consolidation
for the Group financial statements.

100 G R O U P M A N A G E M E N T R E P O R T
MAC ROECONOMIC OPPORTUNIT IES
We continually diversify and strengthen both our customer structure and our product portfolio
through the global presence of the FUCHS PETROLUB Group in all industrial markets of established
and emerging economies. Our goal is to participate in dynamic developments, acquire new cus-
tomers, and win additional orders. The business model contributes to diverse opportunities resulting
from the various regions, sectors, products, and customers. On the basis of economic analyses of
recognized institutes, market information, and our monitoring systems, we endeavor to react appro-
priately to the latest developments.
CORPOR ATE STR ATEGY OPPORTUNIT IES
On the basis of our mission statement LUBRICANTS.TECHNOLOGY.PEOPLE., our focus on lubri-
cants, our capacity for innovation, our technological product leadership, our pronounced quality con-
sciousness and our qualified employees represent important pillars for corporate success. These
strengths, together with a financially sound business model and early detection of future requirements
with regard to product, environmental protection, legal and regulatory requirements, support
further expansion of our leading position in the global lubricant markets and development of optimum
lubricant solutions. The FUCHS PETROLUB Group maintains development partnerships between
its own powerful R&D centers and universities, associated research institutes, and customers. Our
strategy is defined within the scope of our growth initiative.
In addition to this, the sustainability activities initiated by the Executive Board bundle and combine the
economic, ecological, and social aspects of our management actions with consistent develop-
ment of opportunities in a targeted way and with a view to further increasing company value, as well
as contributing to a reduction in energy use and further saving of resources.
SEC TOR-SPEC IF IC AND MARKET-SPEC IF IC OPPORTUNIT IES
The physical and organizational structure of our high level, global network of sales staff, applica-
tion engineers, and commercial partners is aligned with the sector-specific and market-specific require-
ments of our customers. The corporate strategy stipulations resulting from our mission statement
are operatively implemented at the subsidiaries and in the central functions. We therefore consider
the aspect of sustainability not only as an opportunity, but also work continuously to secure fur-
ther positive development of our company value, to anticipate and then implement new trends in the
field of energy saving and environmentally friendly products, as well as to use the expertise and
capacities of our employees and managers (the latter in particular within the scope of the global
talent promotion program) for business development.

101G R O U P M A N A G E M E N T R E P O R T2.8 Opportunity, risk and forecast report
RISK REPORT
THE GROU P ’S R ISK MANAGEMENT SYSTEM
The risk management system (RMS) stipulated by the Executive Board of the FUCHS PETROLUB
Group and implemented in all Group units governs the way in which risks are handled within FUCHS
via the risk management guideline and defines a uniform methodology to be employed through-
out the Group, which is integrated into the planning, governance, and reporting processes of all oper-
ating units and central functions. In this endeavor, we target comprehensible and transparent
presentation of the risks associated with all business activities / procedures via a structured process
that identifies, assesses, and then formulates countermeasures, as well as providing regular
report ing and tracking. The practical implementation of this objective takes place via strategic plan-
ning, mid-term planning, budgeting, reporting, permanent controlling, risk reporting, the Internal
Control System (as a constituent of the RMS), the compliance management system, and the Internal
Audit department. The Group’s RMS and scope of risk consolidation, which matches the scope
of consolidation employed in the Group’s financial statements, remained unchanged from the previ-
ous year.
The generally accepted COSO I I framework (Committee of Sponsoring Organizations of the Treadway
Commission) forms the systematic basis of the RMS and the internal control system (ICS), the
scope and alignment of which are set out and revised by the Executive Board, taking into account
company-specific requirements.
Global risk control in the Group is secured through drafting of budgets and forecast calculations,
as well as the risk inventories performed by management of the operating units (six-monthly) and in
the central units (annually). As a general rule, risks are captured and monitored where the respon-
sible risk elimination experts operate. In addition to this, ad-hoc reporting is available during the year,
insofar as important new risks occur at times other than the regular reporting times. Responsibil-
ity for processing risk reporting lies with the internal audit department and encompasses the follow-
ing steps:
■■ The Group’s business operations and their operational implementation at the level of the sub-
sidiaries are closely related to the way in which the risks resulting from this are handled. Among
other things, the set of guidelines issued by the Executive Board at FUCHS PETROLUB SE
encompasses the behavioral requirements of all Group employees, which is formulated in the Code
of Conduct. The Group’s risk policy is also defined in this context.■■ The risk inventories at the subsidiaries or in the specialist departments are performed by the persons
involved in the reporting process within the scope of a structured procedure. Suitable risk cate-
gories are available for risk identification on the basis of defined corporate goals, as well as the envi-
ronment in which the business operates.

102 G R O U P M A N A G E M E N T R E P O R T
■■ The risks are assessed using the criteria of gross and net potential loss, as well as the likelihood of
their occurrence. The gross potential loss (i. e. before counter-measures take effect) and the net
potential loss (i. e. after counter-measures have taken effect) are generally disclosed in relation to
EBIT. These are supplemented by verbal descriptions of the risks themselves, as well as descrip-
tions of the planned counter-measures. The reporting process is rounded off by stipulation of a
completion date. Where appropriate, we transfer risks that lie beyond our core processes to
other risk carriers or reduce them through other suitable counter-measures. To determine which risks
are most likely to pose a real threat to the FUCHS PETROLUB Group, the risks reported are clas-
sified on the basis of the likelihood of their occurrence and the severity of their effects. The scaling
and accompanying explanations are shown in the table below.
Likelihood of occurrence Description Severity of effects Description
0 to 10 % Low Insignificant Negligible negative effects
11 to 25 % Medium Low Several negative effects
26 to 50 % Medium – high Moderate Considerable negative effects
51 to 100 % High Significant Harmful negative effects
The combination of the likelihood of occurrence and severity of the effects determines which risk cat-
egories are considered significant from the Group’s perspective. This is presented in a second
table. Risks are grouped as low (L = green), medium (M = yellow), and high (H = red). In line with our
risk methodology, only high risks are classified as significant.
Likelihood of occurrence
Seve
rity
of
effe
cts
Low (0 – 10 %) Medium (11 – 25 %) Medium – high (26 – 50 %) High (51 – 100 %)
Medium Medium High HighSignificant (> €15 million)
Low Medium Medium HighModerate (> €10 million but ≤ €15 million)
Low Low Medium MediumLow (> € 5 million but ≤ €10 million)
Low Low Low LowInsignificant (≤ € 5 million)

103G R O U P M A N A G E M E N T R E P O R T2.8 Opportunity, risk and forecast report
The reporting units and their direct supervisors discuss all risk data and then report this within the
scope of a structured process that is supported by an intranet-based IT solution. The information
is prepared by the Internal Audit department, which reports to the Executive Board. Ultimately, the
results of the entire process are presented to the Supervisory Board at least once a year.
It must be taken into account that even appropriately designed and fully functional systems can-
not offer absolute security with regard to the identification and controlling of risks. Based on our cur-
rent knowledge and the information available to us, we have appropriately taken into account
and presented the risks associated with business operations. We are not currently aware of any fur-
ther non-disclosed or avoidable risks. On the basis of the risk classification presented above, there
are no significant (in the sense of high) risks for the FUCHS PETROLUB Group. The only risks classi-
fied as medium are the currency risks. All other risks are insignificant.
SIGNIF IC ANT FEATURES OF THE INTERNAL CONTROL AND R ISK MANAGEMENT SYSTEM WITH REGARD TO THE ENTIRE COM PANY AND THE GROU P ACCOUNTING PROC ESS
The Executive Board of the FUCHS PETROLUB Group uses an internal control system (ICS) in order
to secure the effectiveness and efficiency of business operations, true and fair as well as reliable
accounting treatment, and ensure compliance with the key legal and internal regulations for the
company.
The control hierarchy implemented by the Executive Board at FUCHS PETROLUB SE encompasses
three levels:
Controls, guidelines, and measures for controlling the entire company are in place, such as the Code
of Conduct, Corporate Governance Report, Group guidelines, system of risk reporting, the Super-
visory Board’s Audit Committee, the Compliance Committee, the IT Steering Committee, and the
Internal Audit department.
The systems in place for monitoring the entire company comprise a comprehensive control system
for monitoring operational and financial processes in the form of periodical financial reports, projec-
tions, budgets, compliance reports, and audit reports.
Ultimately, there are controls within individual business processes and business transactions, such
as implementation of the aforementioned stipulations using the four-eyes principle, segregation of
duties, authorization levels, etc.

104 G R O U P M A N A G E M E N T R E P O R T
The Group accounting process is designed in such a way that uniform reporting of all business trans-
actions is guaranteed throughout the Group in line with legal requirements, generally accepted
accounting principles, international accounting standards (IFRS), and internal Group guidelines. The
components are the accounting processes of all consolidated companies, reporting to the con-
trolling parent company of the Group, all necessary measures for consolidation and preparing the
annual accounts, as well as the publicity of the reports and financial statements.
The decentralized organization of the Group accounting process starts in the Group’s subsidiaries
and encompasses reporting with comprehensive monthly key figures, as well as detailed quarterly
interim and annual financial statements. These are regularly analyzed and reviewed within the
Group to ensure completeness, accuracy and plausibility. The technical handling of the reporting pro-
cesses is performed via a uniform, Group-wide intranet-based reporting application.
The set of guidelines employed by the FUCHS PETROLUB Group contains a FUCHS Accounting Man-
ual (FAM), a Financial Guideline, an Investment Guideline, a Receivables Guideline and a Guide-
line for Inter-Company Payments. Any amendments to existing accounting regulations with effects
on the annual financial statements of FUCHS PETROLUB SE are analyzed timely and, where appli-
cable, communicated to the Group companies for implementation. The professional competence
of the staff involved in the financial accounting process is ensured through careful selection,
initial training and continuous further training of the involved employees. The largely standardized
IT systems and corresponding security concepts provide the EDP systems employed in the field of
accounting with the best possible protection from unauthorized access. Within the scope of the audit
plan drafted annually and the corresponding audit scope, the Group audit department checks the
effectiveness of the internal control system and risk management system with regard to the account-
ing process. The audit results are then followed up in the subsequent year. Beside this, the results
of the financial statement audits are also followed up by Group accounting (balance sheet) and the
internal audit department (ICS). Both of these departments report directly to the Chief Financial
Officer at FUCHS PETROLUB SE. The Supervisory Board receives regular reporting on the results of
risk inventories and the audit results.
The diverse activities performed within the scope of the internal control system and risk management
system (particularly with regard to the Group accounting process) at FUCHS PETROLUB SE, which
should not be seen detached from the system of opportunity management, are spe cifically designed
to detect potential risks and undesirable developments as early as possible. However, even our
systems cannot provide absolute security against potential issues. Within the scope of the annual
audit, KPMG confirmed that the early risk detection system applied by FUCHS PETROLUB is suit-
able for early detection of risks that threaten the going concern of the Group. KPMG detected no
significant weaknesses with regard to the internal controls over financial reporting within the
scope of its audit.
105G R O U P M A N A G E M E N T R E P O R T2.8 Opportunity, risk and forecast report
INDIVIDUAL R ISKS
On the basis of the risk classification presented above, there are no significant (in the sense of high)
risks for the FUCHS PETROLUB Group. The aggregation across all risks is not significant from the
Group’s perspective. Nevertheless, the risks which are permanently examined due to their importance
for the Group and the subsidiaries are presented in the following.
Macroeconomic risks
Within the scope of the FUCHS PETROLUB Group’s global business operations, we still consider the
ongoing sovereign debt crisis in Europe, potential geopolitical tensions, as well as VOL ATIL IT Y
in terms of raw material costs in the context of macroeconomic developments as risks that we are
exposed to. With 50 operating companies in 44 countries, a large number of lubricants and
related specialties for a wide range of applications, as well as sales to over 100,000 customers in more
than 100 countries, we believe our business model is balanced and reduces the risk of depen-
dency on any individual regions, sectors, companies, products, or customers. Further activities to
reduce and prevent risks are in place in the form of intensive monitoring systems (e. g. volume
and margin management), a system of strict cost management and strict cost control, periodic report-
ing on the net operating working capital (NOWC), as well as intensive communication with the
foreign subsidiaries.
Procurement risks
On the procurement side, we see key risks in the availability of raw materials, market changes,
the oligopoly situation of suppliers, and price fluctuations this entails. In terms of organization, cen-
tral departments and the various departments at our foreign subsidiaries monitor the procure-
ment markets within the Group to detect any unfavorable developments early on and ensure rapid
reactions. Further counter-measures include securing our supply of base oils and important chemi-
cals via a broad procurement basis, continuously searching for alternative suppliers, and collaboration
on technical committees to help secure a greater substitutability of base oils.
Product and environmental protection risks
The process for manufacturing chemical products throughout the chain of production, filling,
storage and transport of raw materials, products and waste includes potential product and environ-
mental protection risks, which can present themselves in the form of malfunctions with direct
effects on persons, the environment and production processes. We therefore work to high technical
(safety) standards when building, running, and maintaining production equipment. The use of
raw materials and our product manufacturing process are both subject to consistent worldwide mon-
itoring of quality requirements and standards. We also employ targeted measures to comply with
soil and water protection regulations. As is standard in the industry, FUCHS is also insured against
any potential loss that may result from this. We have made adequate provisions for all known risks.
Glossary page 209
a–z

106 G R O U P M A N A G E M E N T R E P O R T
Legal, regulatory and location risks
The FUCHS PETROLUB Group’s global business operations are also influenced by the respective
regulatory environment. We address any legal or regulatory risks resulting from this, with appropriate
legal and insurance law advice, as well as our own experts. Sufficient provisions have been put
in place to cover local tax risks. We are not currently aware of any legal, insurance or tax risks, or of
any pending or threatened legal actions with a significant impact on the Group.
Based on the judgment of December 21, 2012, FUCHS partially lost the legal case taken out against
FUCHS PETROLUB SE by our co-shareholder in FUCHS OIL MIDDLE EAST in the first instance
in December 2010 due to the alleged violation of the duties required under corporate law. The co-
shareholder had also submitted an appeal, as one of the asserted claims (buyout) had been
rejected. The appeal was rejected based on the judgment of September 18, 2013. At the end of
2013, the co-shareholder lodged an appeal with the Judicial Committee of the Privy Council in
London (final instance). Provisions have been put in place for the costs of any legal proceedings and
known risks as the situation stands today. Despite this, it is impossible to completely rule out
risks to the company’s future development and earning power. However, the contribution of the
ASSOCIATED COMPANY to the earnings before interest and tax (EBIT) of the FUCHS PETROLUB
Group is below one percent.
In the context of the European regulation on chemicals REACH (Registration, Evaluation, and Autho-
rization of Chemicals), all staff-related and organizational measures have been implemented to
comply with the regulatory requirements and monitor further development. Preregistration has already
been completed.
The legislator’s aim with the GHS legislation (Globally Harmonized System), which came into force
on January 20, 2009, was to introduce a uniform worldwide system for classifying and labeling
chemicals. This involves reassessing the toxicity properties of substances and formulations, which in
turn means that products in the FUCHS portfolio might need to be relabeled accordingly or may
potentially result in a ban of certain products. Alternative formulas have already been developed for
products for which modifications are anticipated. Our research and development departments
are also working on further alternatives. The introduction of GHS is now supported worldwide
through the establishment of corresponding organizational structures.
The objective of the compliance organization implemented by the Executive Board at FUCHS
PETROLUB SE, which comprises a Compliance Management System (CMS) and a Compliance Com-
mittee with regular meetings, corresponding reporting paths and training measures, is to ade-
quately cover both the aforementioned risks and any further risks resulting from international business
operations, for example in the fields of product liability, competition and antitrust legislation,
occupational health and safety, patent law, and branding law.
Glossary page 208
a–z

107G R O U P M A N A G E M E N T R E P O R T2.8 Opportunity, risk and forecast report
Regular reviews, assessments and, where necessary, revisions of the regulatory country-specific and
location risks, as well as the risk management, are performed. The insurance programs in place
throughout the Group cover the risks of damage to property, liability risks, transport risks, as well as
risks posed by potential interruptions in business.
Sector risks
The Group’s business operations are also influenced by the various sectors in which our companies
support customers and sell products. The intensive competition on the local sales markets, increas-
ing customer quality standards, technological progress, as well as default and inventory risks form the
focus of our examinations here. In this context, we constantly strive to maintain and further build
on our position as technological leader in strategically important business fields and niches directly
with customers through continuous innovation activities, partnership-based research and devel-
opment work, as well as application-based support. The Group’s profitability will also continue to be
supported in future by this strategy of innovation, quality and niche development, global presence,
high degree of specialization, permanent cost management, as well as active NOWC management.
Risks from research and development (R&D)
The opportunities of a major capacity for innovation and high degree of specialization also lead to
risks of high complexity and limited predictability of research and development projects in the
research and development arena. To govern these risks, most products are developed in collabora-
tion with our customers and also in joint research projects with universities or other research insti-
tutions. The development of new and innovative products requires effective intellectual property pro-
tection, which we secure internally through our organization and procedures.
Currency risk
The FUCHS PETROLUB Group’s currency risk comprises transaction risks due to income and
expenses in foreign currency which result, among other things, from the procurement of raw mate-
rials, as well as translation risks due to the conversion of balance sheets from outside the euro-
zone into euros. Besides detailed guidelines and stipulations, which are monitored and controlled by
the central Treasury department, currency risks are controlled through maturity-congruent or
local currency financing, as well as (where necessary) the use of DERIVATIVES . Transaction and trans-
lation risks counterbalance each other at Group level and have a compensatory effect.
Pension risks
In 2013, the Group once again significantly reduced its pension risks by transferring the commitments
for pensioners in the UK to external service providers. The remaining pension risks for entitle-
ments and retired staff are easily controlled and, since they are so minor relative to the total assets
held by the Group, do not represent any appreciable risk.
Glossary page 208
a–z

108 G R O U P M A N A G E M E N T R E P O R T
IT risks
The organizational and IT-based networking of locations and systems encompasses risks in the form
of increasingly complex electronic communication technologies, which could potentially lead to
loss / theft of data, business downtimes, and complete system failure. The counter measures we have
implemented here are based on processes, guidelines, measures, collaboration with established
IT service providers, implementation of detailed backup and recovery procedures, as well as the use
of virus scanners and firewalls. Employees are kept up-to-date with current practices, develop-
ments, and technologies through regular training events. In addition to this, worldwide IT security
assessment was performed in 2013, and both short-term and long-term measures for increasing
IT security resulting from this were initiated respectively agreed.
OVER ALL ASSESSMENT OF THE GROU P ’S OPPORTUNIT IES AND R ISKS
The way in which the Group presents opportunities represents a consolidated assessment of all oppor-
tunities resulting from the aggregated examination of all budget reports for 2014. A separate
examination by segment was not performed. There were no important changes over the previous year.
The way in which risks are presented throughout the Group represents a consolidated assess ment of
all significant risks derived from the budget reports, individual risks, or reports submitted by the
subsidiaries and central functions for the 2014 budget period (twelve months). Separate exam inations
by segment were not performed. Instead, the Group was examined as a whole. The overall risk
profile of FUCHS PETROLUB SE has not changed in comparison to the previous year.
The Group’s balanced system of opportunity and risk management, stable financial situation with an
equity ratio of 73.3 %, debt-equity ratio of zero, increasing net profits and cash flows, as well as
solid business model limit the risks associated with business operations and also provide further oppor-
tunities for development of both sales revenues and earnings.
The opportunity and risk management system set up by the Executive Board and implemented
worldwide is appropriately aligned with the FUCHS PETROLUB Group’s opportunity and risk profile
and is also subject to constant further development, taking into account new opportunities and
risks where appropriate. The results of these efforts are reflected in an adequate general risk situa-
tion. From the Executive Board’s current perspective, however, there are no discernible risks that
jeopardize the company’s going concern. We believe the systems currently in place to be appropri-
ate and consider simultaneous occurrence of all individual risks unlikely.

109G R O U P M A N A G E M E N T R E P O R T2.8 Opportunity, risk and forecast report
FORECAST REPORT
GROU P ALIGNMENT AND ECONOMIC FR AMEWORK
The business model of the FUCHS PETROLUB Group is based on broad regional use of business
opportunities spread across many sectors. The business portfolio is aligned with products that place
great demands on technology and are associated with high service costs. Particular emphasis
is placed on the development of niche and regional market segments here. FUCHS PETROLUB is
therefore broadly diversified. There are no plans to expand the Group’s activities to business
areas outside the field of lubricants.
The sales markets for the technological solutions and processes available in the FUCHS PETROLUB
Group include both mature markets and markets in global growth regions displaying particularly fast
economic development.
The Group therefore constantly searches for new business opportunities through continuous
development of new products that reduce costs and solve technical issues in complex processes. At
the same time, existing products are centrally and regionally modified to match the ever chang-
ing requirements. In the latter case, this involves a large number of solutions to problems, not basic
technological impetuses.
GENER AL ECONOMIC DEVELOPMENT FOREC ASTS
As at January 2014, the International Monetary Fund (IMF) is forecasting growth in the global
economy of around 3.7 % for 2014. It therefore expects an increase in global production for 2014
slightly above the anticipated value of 3.0 % for 2013.
At 5.1 % (previous year 4.7 %), the greatest gains are expected in the developing countries and
emerging markets. These are followed by the US at 2.8 % (previous year 1.9 %), Central and Eastern
Europe also at 2.8 % (previous year 2.5 %), the UK at 2.4 % (previous year 1.7 %), and the euro-
zone at 1.0 % (previous year – 0.4 %). In China, an important market for FUCHS PETROLUB, the growth
forecast is for 7.5 % (previous year 7.7 %).
EFFEC TS ON OUR BUSINESS MODEL
Based on these forecasts, we anticipate growth of the lubricant market in all regions for 2014.
In Europe, however, lubricant consumption is only likely to increase slightly, while it may increase by
around 1 % in the other regions.
Average raw material costs in 2013 remained at around the level observed at the start of the year.
There are currently no appreciable signs that anything about this situation is likely to change in the
short term.

110 G R O U P M A N A G E M E N T R E P O R T
Irrespective of this relative calm, the fundamental risks for global economic developments persist.
These include the national debt crises of various countries, the difficult situation still being encoun-
tered by many banks, currency conversion imbalances, as well as a high level of central bank liquidity
and the risks of asset price bubbles and increasing inflation that result from this.
These risks can have an equally negative impact on the Group’s sales markets as potential political
tensions in individual global regions. In addition, exchange rate fluctuations could also have a
significant effect on the Group in terms of raw material purchasing by Group companies, conversion
of the balance sheet and income statement, and dividend income of the holding company.
Political or other events with effects on the oil price (and thereby our raw material costs) can also
occur at any time.
ANTIC IPATED RESULTS OF OPER ATIONS , NET ASSETS AND F INANCIAL POSIT ION
The FUCHS PETROLUB Group’s planning is based on continuation of the growth initiative for 2014
and thereby further increases in both volumes and sales revenues. In the light of the described eco-
nomic framework conditions, the Group is planning for organic growth in the low single-digit per-
centage range in 2014. Additional external growth through acquisitions is possible, although the
impact of changes to currency exchange rates cannot be planned.
Assuming largely stable raw material prices, the Executive Board expects a gross margin at the same
level as in 2013.
The budget for personnel and other direct overhead costs also includes an increase in the low
single-digit percentage range. EBIT will therefore also rise by a low single-digit percentage and the
margin of EBIT before income from companies consolidated at equity will remain at the previous
year’s level.
Maintaining low interest costs and a similar R ATE OF TA X ATION to 2013 (31.0 %), earnings after taxes
are also likely to record an increase in the low single-digit percentage range. In terms of earnings
per share, we expect a slightly higher increase than profit after tax in the light of the share buyback,
which can likely be completed in the first half of 2014.
Should the global economy and global lubricant consumption display significantly stronger growth
than forecast in 2014, FUCHS will also gain positive stimulus from this. Stronger than anticipated
growth in sales revenues could, assuming compensating increases in raw material prices do not
occur at the same time, lead to disproportionately high growth in EBIT in the middle to higher single-
digit percentage range.
Glossary page 209
a–z

111G R O U P M A N A G E M E N T R E P O R T2.8 Opportunity, risk and forecast report
On the other hand, if growth in the global economy and the global demand for lubricants are weaker
than forecast, it will take special efforts to absorb increased costs caused by inflation and the
establishment of additional technical or, in particular, personnel capacities. In unfavorable circum-
stances, a decline in EBIT in the low single-digit percentage range is also conceivable. Extreme
circumstances, such as those encountered during the global financial crisis in 2008 / 2009, are not taken
into account here.
We are budgeting for slight organic growth in sales revenues in all regions. In Asia, we expect
the high growth rates to continue, particularly in China. We primarily anticipate income gains in Asia-
Pacific, Africa. In Europe, it will not be possible to repeat the previous year’s positive earnings
dynam ics. We currently anticipate a slightly disproportionately low increase in earnings. In North and
South America, we expect earnings to remain stable or increase slightly.
Based on investments in property, plant and equipment, as well as increased net operating working
capital (NOWC) due to business conducted, the capital employed will increase. NOWC as a per-
centage of sales revenues should not exceed 20 %. Assuming that the weighted capital costs remain
the same, we expect a further increase in FVA, since the anticipated growth in EBIT is likely to
exceed the anticipated increase in costs of capital employed. We expect to record an increase in FVA
in the low single-digit percentage range.
As was the case in 2013, the anticipated gross cash flow will allow the entire increase in net oper-
ating working capital due to business conducted and also all planned investments to be financed inter-
nally. In addition to this, it will provide sufficient scope for us to maintain our consistent, share-
holder-friendly dividend policy. The Executive Board and Supervisory Board will present the concrete
dividend proposal to the Annual General Meeting based on the respective framework conditions.
The Group also has access to sufficient cash and cash equivalents from previous years to finance the
ongoing share buyback program internally. Should any additional financial resources be required
for acquisitions, which we cannot judge from today’s perspective, sufficient internal funds and lines
of credit are in place, depending on the size of the acquisition in question.
In terms of the net assets and financial position or balance sheet structure, we do not anticipate any
significant changes, especially since no changes of strategic or business policy nature are expected.
The statements made assume that the positive overall framework conditions for FUCHS remain
in place and that the various company-specific and economic risks do not materialize in any appre-
ciable form.
BUSINESS DEVELOPMENT IN THE F IRST T WO MONTHS OF 2014
We have recorded an encouraging start to 2014. Our expectations have been met in the first
two months of the new financial year, and sales revenues and income above the previous year’s level
have been generated.

112 G R O U P M A N A G E M E N T R E P O R T Legal disclosures2.9
DEPENDENT COMPANY REPORT / REPORT ON INVESTMENTS IN AFFIL IATED COMPANIES
The Fuchs family holds the majority of the capital stock with voting rights. RUDOLF FUCHS GMBH
& CO KG, via which most of the Fuchs family’s ordinary stock is held, is the controlling enterprise for
FUCHS PETROLUB SE, which is a dependent company.
A dependent company report has therefore been prepared on relationships with related parties
pursuant to Section 312 of the German Stock Corporation Act (AktG) with the concluding declara-
tion: “In the legal transactions listed in the dependent company report, and according to the
circumstances that were known to us when those legal transactions were performed, our company
received an appropriate consideration in each legal transaction. No actions subject to disclosure
occurred on the instruction or in the interest of the controlling company nor any company associated
with it.”
KPMG AG Wirtschaftsprüfungsgesellschaft, Mannheim, the independent auditors of FUCHS
PETROLUB SE, have audited this dependent company report and provided it with an unqualified
audit opinion.
DECLARATION OF CORPORATE GOVERNANCE
The Declaration of Corporate Governance to be submitted pursuant to Section 289 a of the German
Commercial Code (HGB) can be found in the Corporate Governance Report on pages 37 to 45 and
is part of the Group management report. It is also available online at www.fuchs-oil.com / dcg.html.
MAIN FEATURES OF THE COMPENSATION SYSTEM OF FUCHS PETROLUB SE FOR MEMBERS OF THE EXECUTIVE BODIES
The main features of the compensation system of FUCHS PETROLUB SE for members of the
Executive Bodies are presented on pages 46 to 47 of the Corporate Governance Report and form part
of the Group management report.
INFORMATION REQUIRED UNDER TAKEOVER LAW PURSUANT TO SECTION 315 (4) OF THE GERMAN COMMERCIAL CODE (HGB)
The relevant disclosures required pursuant to Section 315 (4) of the German Commercial Code (HGB)
is presented on pages 53 to 55 and form part of the Group management report.
Further information at www.fuchs-oil.com / dcg.html
www
Corporate Governance Report
46
Disclosure required under takeover law
53
Legal disclosures

Our business model is successful: FUCHS once again reports record earnings and generates organic growth in sales revenues across all regions.
€1,832I N 2 0 13 , G R O U P S A L E S R E V E N U E S G R E W B Y € 12 . 5 M I L L I O N T O
E B I T G R E W B Y 6 . 6% T O
€312.3MILLION
MILLION

3 F I N A N C I A L R E P O R T
3.1 Consolidated financial statements of FUCHS PETROLUB SE 115
■■ Income statement 115■■ Statement of comprehensive income 116■■ Balance sheet 117■■ Statement of changes in shareholders’ equity 118■■ Statement of changes in long-term assets * 120■■ Statement of cash flows 122■■ Segments * 124
3.2 Notes to the consolidated financial statements 126■■ Basis of preparation 126
– General information 126
– Application of new accounting standards 126
– Scope of consolidation 132
– Changes in the scope of consolidation 133
– Consolidation principles 134
– Foreign currency translation 135■■ Accounting and valuation methods 137■■ Notes to the income statement 150
1 Sales revenues 150 2 Cost of sales 151 3 Selling and distribution expenses 151 4 Administrative expenses 152 5 Other operating income and expenses 152 6 Income from companies consolidated at equity 153 7 Financial result 153 8 Income taxes 154 9 Minority interest 155 10 Earnings per share 155 11 Other taxes 156 12 Personnel expenses / employees 156
■■ Notes to the balance sheet 157
13 Long-term assets 157 14 Property, plant and equipment 157 15 Intangible assets 157 16 Shares in companies consolidated at equity 161 17 Other financial assets 161 18 Deferred tax assets and liabilities 162 19 Long-term other receivables and other assets 163 20 Inventories 163 21 Trade receivables 163
22 Short-term tax receivables (income tax) 165 23 Short-term other receivables and other assets 165
24 Cash and cash equivalents 165 25 Shareholders’ equity 166 26 Pension provisions 169 27 Other long-term provisions 177 28 Other long-term liabilities 177 29 Trade payables 177 30 Short-term provisions 178 31 Short-term tax liabilities 179 32 Short-term financial liabilities 179 33 Other short-term liabilities 179 34 Contingent liabilities and other financial obligations 180 35 Financial instruments 181
■■ Further notes to the consolidated financial statements 191
36 Notes to the statement of cash flows 191 37 Notes to the segment reporting 191 38 Relationships with related parties 192 39 Executive bodies 194 – Supervisory Board 194 – Executive Board 195 – Compensation for members of the
Executive Board 196 – Compensation for members of the
Supervisory Board 197 40 Declaration on the German Corporate
Governance Code as per Section 161 of the German Stock Corporation Act (AktG) 198
41 Fees and services of the auditor 198 42 Events after the balance sheet date 198 43 Shareholding 198
■■ Declaration of the Executive Board and assurance pursuant to Section 297 (2), Section 315 (1) of the German Commercial Code (HGB) 203
3.3 Independent auditor’s report 204
3.4 FUCHS PETROLUB SE (HGB) 206■■ Consolidated income statement 206■■ Balance sheet 206
3.5 Proposal on the appropriation of profits 207
* Part of the notes
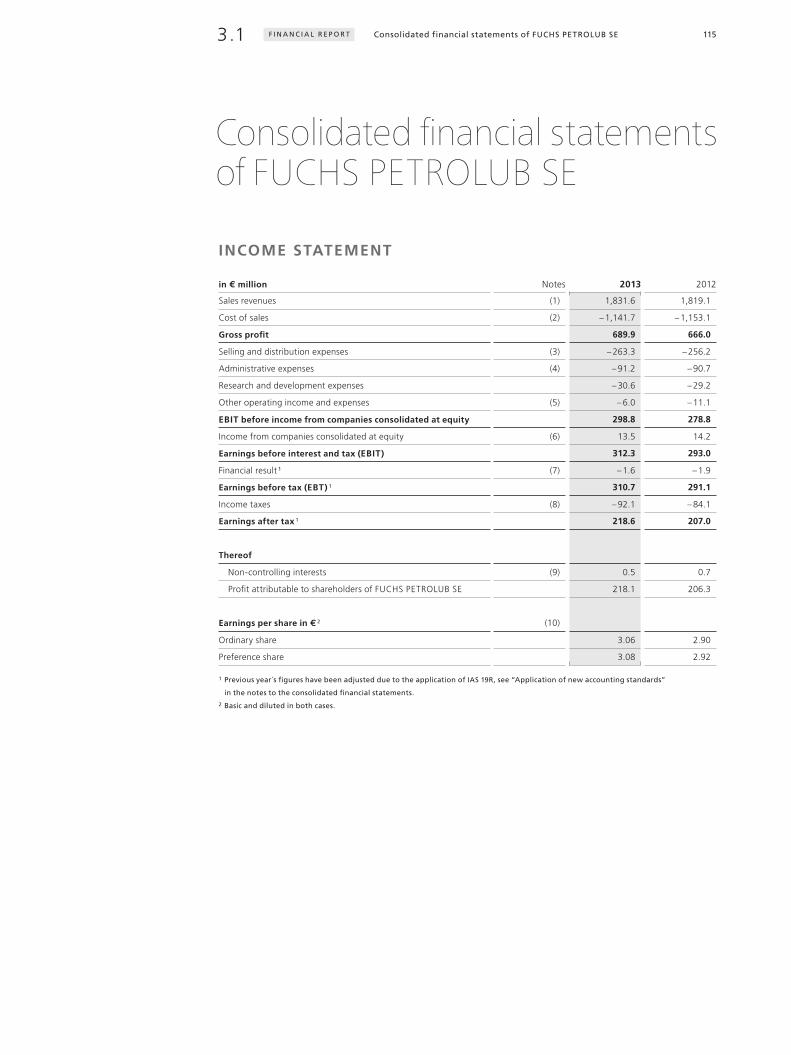
115Consolidated financial statements of FUCHS PETROLUB SE3.1 F I N A N C I A L R E P O R T
INCOME STATEMENT
in € million Notes 2013 2012
Sales revenues (1) 1,831.6 1,819.1
Cost of sales (2) – 1,141.7 – 1,153.1
Gross profit 689.9 666.0
Selling and distribution expenses (3) – 263.3 – 256.2
Administrative expenses (4) – 91.2 – 90.7
Research and development expenses – 30.6 – 29.2
Other operating income and expenses (5) – 6.0 – 11.1
EBIT before income from companies consolidated at equity 298.8 278.8
Income from companies consolidated at equity (6) 13.5 14.2
Earnings before interest and tax (EBIT) 312.3 293.0
Financial result 1 (7) – 1.6 – 1.9
Earnings before tax (EBT) 1 310.7 291.1
Income taxes (8) – 92.1 – 84.1
Earnings after tax 1 218.6 207.0
Thereof
Non-controlling interests (9) 0.5 0.7
Profit attributable to shareholders of FUCHS PETROLUB SE 218.1 206.3
Earnings per share in € 2 (10)
Ordinary share 3.06 2.90
Preference share 3.08 2.92
1 Previous year´s figures have been adjusted due to the application of IAS 19R, see “Application of new accounting standards”
in the notes to the consolidated financial statements.
2 Basic and diluted in both cases.
Consolidated financial statements of FUCHS PETROLUB SE

116 F I N A N C I A L R E P O R T
Note 26
169
STATEMENT OF COMPREHENSIVE INCOME
in € million 2013 2012
Earnings after tax 1 218.6 207.0
Income and expenses recognized in equity
Amounts of other comprehensive income that may be
reclassified to profit or loss in future periods
Change in foreign currency translation adjustments
Foreign subsidiaries – 24.7 – 3.9
Shares in companies consolidated at equity – 5.3 0.1
Amounts of other comprehensive income that will not
be reclassified to profit or loss in future periods
Remeasurements of defined benefit pension commitments 1, 2 – 1.1 – 11.8
Deferred taxes on these amounts 2 0.1 3.0
Total income and expenses recognized directly in equity 1 – 31.0 – 12.6
Total income and expenses for the period 187.6 194.4
Thereof
Non-controlling interests 0.5 0.7
Shareholders of FUCHS PETROLUB SE 187.1 193.7
1 Previous year´s figures have been adjusted due to the application of IAS 19R, see “Application of new accounting standards”
in the notes to the consolidated financial statements.
2 For further information, please refer to the notes under item 26.

117Consolidated financial statements of FUCHS PETROLUB SE3.1 F I N A N C I A L R E P O R T
BALANCE SHEET
in € million Notes Dec. 31, 2013 Dec. 31, 2012
Assets
Intangible assets (15) 108.2 112.7
Property, plant and equipment (14) 284.5 252.9
Shares in companies consolidated at equity (16) 43.3 40.4
Other financial assets (17) 6.2 3.8
Deferred tax assets (18) 25.5 29.8
Other receivables and other assets (19) 0.5 0.8
Long-term assets (13) 468.2 440.4
Inventories (20) 232.4 239.3
Trade receivables (21) 260.4 250.4
Tax receivables (22) 5.3 3.3
Other receivables and other assets (23) 20.5 31.6
Cash and cash equivalents (24) 175.2 143.7
Short-term assets 693.8 668.3
Total assets 1,162.0 1,108.7
Equity and liabilities
Subscribed capital 71.0 71.0
Group reserves 1 563.4 502.8
Group profits 1 218.1 206.3
Equity of shareholders of FUCHS PETROLUB SE 852.5 780.1
Non-controlling interests 1.0 1.6
Total equity (25) 853.5 781.7
Pension provisions (26) 15.8 26.4
Other provisions (27) 3.1 4.9
Deferred tax liabilities (18) 18.7 19.0
Financial liabilities 0.0 0.0
Other liabilities (28) 3.4 4.1
Long-term liabilities 41.0 54.4
Trade payables (29) 132.3 119.8
Provisions (30) 27.4 27.9
Tax liabilities (31) 23.4 28.7
Financial liabilities (32) 7.8 8.9
Other liabilities (33) 76.6 87.3
Short-term liabilities 267.5 272.6
Total equity and liabilities 1,162.0 1,108.7
1 Previous year´s figures have been adjusted due to the application of IAS 19R, see “Application of new accounting standards”
in the notes to the consolidated financial statements.

118 F I N A N C I A L R E P O R T
Changes in shareholders’ equity are illustrated in the notes under item 25.
166
STATEMENT OF CHANGES IN SHAREHOLDERS’ EQUITY
in € millionOutstanding shares
(units) 4Subscribed capital
SECapital reserves
SE Reserve for own
shares
Equity capital generated
in the Group
Differences arising from currency
translation 1
Equity of shareholders
of FUCHS PETROLUB SE
Non-controlling interests
Total equity
As at December 31, 2011 70,980,000 71.0 94.6 0.0 478.2 12.9 656.7 1.5 658.2
Dividend payments – 70.3 – 70.3 – 0.6 – 70.9
Earnings after tax 2012 2 206.3 206.3 0.7 207.0
Change in income and expenses recognized directly in equity 2 – 8.8 3 – 3.8 – 12.6 – 12.6
As at December 31, 2012 2 70,980,000 71.0 94.6 0.0 605.4 9.1 780.1 1.6 781.7
Share buy-back – 338,470 – 22.0 – 22.0 – 22.0
Purchase of non-controlling interests – 1.1 – 1.1 – 0.7 – 1.8
Dividend payments – 91.6 – 91.6 – 0.4 – 92.0
Earnings after tax 2013 218.1 218.1 0.5 218.6
Change in income and expenses recognized directly in equity – 1.0 3 – 30.0 – 31.0 – 31.0
As at December 31, 2013 70,641,530 71.0 94.6 – 22.0 729.8 – 20.9 852.5 1.0 853.5
1 Income and expenses recognized in equity of shareholders of FUCHS PETROLUB SE.
2 Previous year’s figures have been adjusted due to the application of IAS 19R, see “Application of new accounting standards” in the notes to the consolidated financial statements.
3 Amounts of other comprehensive income that will not be reclassified to profit or loss in future periods solely consist of remeasurements of defined benefit pension commitments.
These amounts are included in the equity capital generated in the Group.
4 The treasury stock has not been redeemed yet.

119Consolidated financial statements of FUCHS PETROLUB SE3.1 F I N A N C I A L R E P O R T
STATEMENT OF CHANGES IN SHAREHOLDERS’ EQUITY
in € millionOutstanding shares
(units) 4Subscribed capital
SECapital reserves
SE Reserve for own
shares
Equity capital generated
in the Group
Differences arising from currency
translation 1
Equity of shareholders
of FUCHS PETROLUB SE
Non-controlling interests
Total equity
As at December 31, 2011 70,980,000 71.0 94.6 0.0 478.2 12.9 656.7 1.5 658.2
Dividend payments – 70.3 – 70.3 – 0.6 – 70.9
Earnings after tax 2012 2 206.3 206.3 0.7 207.0
Change in income and expenses recognized directly in equity 2 – 8.8 3 – 3.8 – 12.6 – 12.6
As at December 31, 2012 2 70,980,000 71.0 94.6 0.0 605.4 9.1 780.1 1.6 781.7
Share buy-back – 338,470 – 22.0 – 22.0 – 22.0
Purchase of non-controlling interests – 1.1 – 1.1 – 0.7 – 1.8
Dividend payments – 91.6 – 91.6 – 0.4 – 92.0
Earnings after tax 2013 218.1 218.1 0.5 218.6
Change in income and expenses recognized directly in equity – 1.0 3 – 30.0 – 31.0 – 31.0
As at December 31, 2013 70,641,530 71.0 94.6 – 22.0 729.8 – 20.9 852.5 1.0 853.5
1 Income and expenses recognized in equity of shareholders of FUCHS PETROLUB SE.
2 Previous year’s figures have been adjusted due to the application of IAS 19R, see “Application of new accounting standards” in the notes to the consolidated financial statements.
3 Amounts of other comprehensive income that will not be reclassified to profit or loss in future periods solely consist of remeasurements of defined benefit pension commitments.
These amounts are included in the equity capital generated in the Group.
4 The treasury stock has not been redeemed yet.

120 F I N A N C I A L R E P O R T
STATEMENT OF CHANGES IN LONG-TERM ASSETS ¹
in € millionG R O S S A M O U N T S
A C Q U I S I T I O N A N D M A N U FA C T O R I N G C O S T S
D E P R E C I AT I O N A N D A M O R T I Z AT I O N
N E T A M O U N T S
2012Dec. 31,
2011Currency
differences
Changes in the scope of consolidation Additions Disposals
Reclassifi-cations
Dec. 31, 2012
Dec. 31, 2011
Currency differences
Changes in the scope of consolidation
Scheduled deprec. &
amortiz.Impairment
losses DisposalsReclassifi-
cationsDec. 31,
2012Dec. 31,
2012Dec. 31,
2011
Intangible assets
Licenses, industrial property rights and similar values 77.5 – 0.6 0.6 1.6 0.2 0.3 79.2 46.3 – 0.4 0.1 5.8 0.0 0.2 0.0 51.6 27.6 31.2
Goodwill 2 94.9 – 1.1 0.5 0.1 0.0 0.0 94.4 9.5 0.1 0.0 0.0 0.0 0.0 0.0 9.6 84.8 85.4
Other intangible assets 0.3 0.0 0.0 0.3 0.0 – 0.3 0.3 0.0 0.0 0.0 0.0 0.0 0.0 0.0 0.0 0.3 0.3
172.7 – 1.7 1.1 2.0 0.2 0.0 173.9 55.8 – 0.3 0.1 5.8 0.0 0.2 0.0 61.2 112.7 116.9
Property, plant and equipment
Land, land rights and buildings 178.9 – 1.0 0.0 6.3 0.3 9.5 193.4 71.0 – 0.8 0.0 5.0 0.0 0.2 0.0 75.0 118.4 107.9
Technical equipment and machinery 193.7 – 0.2 0.0 7.8 3.1 7.0 205.2 136.9 – 0.2 0.0 8.5 0.0 2.8 0.0 142.4 62.8 56.8
Other equipment, factory and office equipment 100.9 0.2 0.0 9.5 4.2 1.9 108.3 71.9 0.3 0.0 7.6 0.0 4.0 0.0 75.8 32.5 29.0
Work in progress 21.8 – 0.4 0.0 36.3 0.0 – 18.4 39.3 0.1 0.0 0.0 0.0 0.0 0.0 0.0 0.1 39.2 21.7
495.3 – 1.4 0.0 59.9 7.6 0.0 546.2 279.9 – 0.7 0.0 21.1 0.0 7.0 0.0 293.3 252.9 215.4
Financial assets
Shares in affiliated companies 0.9 0.0 – 0.7 0.0 0.2 0.0 0.0 0.0 0.0 0.0 0.0 0.0 0.0 0.0 0.0 0.0 0.9
Shares in companies consolidated at equity 24.6 0.2 0.0 24.0 8.4 0.0 40.4 0.0 0.0 0.0 0.0 0.0 0.0 0.0 0.0 40.4 24.6
Investment in companies 2.3 0.0 0.0 0.0 0.0 0.0 2.3 1.2 0.0 0.0 0.0 0.0 0.0 0.0 1.2 1.1 1.1
Other loans 2.8 0.0 0.0 0.3 0.7 0.0 2.4 – 0.1 0.0 0.0 0.0 0.0 0.0 0.0 – 0.1 2.5 2.9
Long-term securities 0.3 0.0 0.0 0.0 0.0 0.0 0.3 0.1 0.0 0.0 0.0 0.0 0.0 0.0 0.1 0.2 0.2
30.9 0.2 – 0.7 24.3 9.3 0.0 45.4 1.2 0.0 0.0 0.0 0.0 0.0 0.0 1.2 44.2 29.7
Long-term assets (excluding deferred taxes and
other receivables and other assets)
698.9
– 2.9
0.4
86.2
17.1
0.0
765.5
336.9
– 1.0
0.1
26.9
0.0
7.2
0.0
355.7
409.8
362.0
2013Dec. 31,
2012Currency
differences
Changes in the scope of consolidation Additions Disposals
Reclassifi-cations
Dec. 31, 2013
Dec. 31, 2012
Currency differences
Changes in the scope of consolidation
Scheduled deprec. &
amortiz.Impairment
losses DisposalsReclassifi-
cationsDec. 31,
2013Dec. 31,
2013Dec. 31,
2012
Intangible assets
Licenses, industrial property rights and similar values 79.2 – 1.6 0.0 3.8 0.2 0.4 81.6 51.6 – 1.0 0.0 5.1 0.0 0.2 0.0 55.5 26.1 27.6
Goodwill 2 94.4 – 2.9 0.0 0.0 0.0 0.0 91.5 9.6 – 0.6 0.0 0.0 0.5 0.0 0.0 9.5 82.0 84.8
Other intangible assets 0.3 0.0 0.0 0.2 0.0 – 0.4 0.1 0.0 0.0 0.0 0.0 0.0 0.0 0.0 0.0 0.1 0.3
173.9 – 4.5 0.0 4.0 0.2 0.0 173.2 61.2 – 1.6 0.0 5.1 0.5 0.2 0.0 65.0 108.2 112.7
Property, plant and equipment
Land, land rights and buildings 193.4 – 7.3 0.0 12.6 0.7 8.9 206.9 75.0 – 3.1 0.0 5.8 0.0 0.1 0.0 77.6 129.3 118.4
Technical equipment and machinery 205.2 – 6.9 0.0 13.4 2.2 11.4 220.9 142.4 – 4.7 0.0 9.2 0.0 1.5 0.0 145.4 75.5 62.8
Other equipment, factory and office equipment 108.3 – 2.9 0.0 7.4 2.3 2.6 113.1 75.8 – 2.1 0.0 7.6 0.0 2.0 0.0 79.3 33.8 32.5
Work in progress 39.3 – 3.1 0.0 32.8 0.2 – 22.9 45.9 0.1 – 0.1 0.0 0.0 0.0 0.0 0.0 0.0 45.9 39.2
546.2 – 20.2 0.0 66.2 5.4 0.0 586.8 293.3 – 10.0 0.0 22.6 0.0 3.6 0.0 302.3 284.5 252.9
Financial assets
Shares in affiliated companies 0.0 0.0 0.0 1.3 0.0 0.0 1.3 0.0 0.0 0.0 0.0 0.0 0.0 0.0 0.0 1.3 0.0
Shares in companies consolidated at equity 3 40.4 – 4.4 0.0 12.7 5.4 0.0 43.3 0.0 0.0 0.0 0.0 0.0 0.0 0.0 0.0 43.3 40.4
Investment in companies 2.3 0.0 0.0 0.0 0.1 0.0 2.2 1.2 0.0 0.0 0.0 0.0 0.1 0.0 1.1 1.1 1.1
Other loans 2.4 0.0 0.0 1.3 0.2 0.0 3.5 – 0.1 0.0 0.0 0.0 0.0 0.0 0.0 – 0.1 3.6 2.5
Long-term securities 0.3 0.0 0.0 0.0 0.0 0.0 0.3 0.1 0.0 0.0 0.0 0.0 0.0 0.0 0.1 0.2 0.2
45.4 – 4.4 0.0 15.3 5.7 0.0 50.6 1.2 0.0 0.0 0.0 0.0 0.1 0.0 1.1 49.5 44.2
Long-term assets (excluding deferred taxes and
other receivables and other assets)
765.5
– 29.1
0.0
85.5
11.3
0.0
810.6
355.7
– 11.6
0.0
27.7
0.5
3.9
0.0
368.4
442.2
409.8
1 Part of the notes.
2 The amortization on goodwill accumulated by December 31, 2004 was balanced with historical acquisition costs.
3 The inflows to the financial assets also contain partial proceeds of the shares in companies consolidated at equity.

121Consolidated financial statements of FUCHS PETROLUB SE3.1 F I N A N C I A L R E P O R T
STATEMENT OF CHANGES IN LONG-TERM ASSETS ¹
in € millionG R O S S A M O U N T S
A C Q U I S I T I O N A N D M A N U FA C T O R I N G C O S T S
D E P R E C I AT I O N A N D A M O R T I Z AT I O N
N E T A M O U N T S
2012Dec. 31,
2011Currency
differences
Changes in the scope of consolidation Additions Disposals
Reclassifi-cations
Dec. 31, 2012
Dec. 31, 2011
Currency differences
Changes in the scope of consolidation
Scheduled deprec. &
amortiz.Impairment
losses DisposalsReclassifi-
cationsDec. 31,
2012Dec. 31,
2012Dec. 31,
2011
Intangible assets
Licenses, industrial property rights and similar values 77.5 – 0.6 0.6 1.6 0.2 0.3 79.2 46.3 – 0.4 0.1 5.8 0.0 0.2 0.0 51.6 27.6 31.2
Goodwill 2 94.9 – 1.1 0.5 0.1 0.0 0.0 94.4 9.5 0.1 0.0 0.0 0.0 0.0 0.0 9.6 84.8 85.4
Other intangible assets 0.3 0.0 0.0 0.3 0.0 – 0.3 0.3 0.0 0.0 0.0 0.0 0.0 0.0 0.0 0.0 0.3 0.3
172.7 – 1.7 1.1 2.0 0.2 0.0 173.9 55.8 – 0.3 0.1 5.8 0.0 0.2 0.0 61.2 112.7 116.9
Property, plant and equipment
Land, land rights and buildings 178.9 – 1.0 0.0 6.3 0.3 9.5 193.4 71.0 – 0.8 0.0 5.0 0.0 0.2 0.0 75.0 118.4 107.9
Technical equipment and machinery 193.7 – 0.2 0.0 7.8 3.1 7.0 205.2 136.9 – 0.2 0.0 8.5 0.0 2.8 0.0 142.4 62.8 56.8
Other equipment, factory and office equipment 100.9 0.2 0.0 9.5 4.2 1.9 108.3 71.9 0.3 0.0 7.6 0.0 4.0 0.0 75.8 32.5 29.0
Work in progress 21.8 – 0.4 0.0 36.3 0.0 – 18.4 39.3 0.1 0.0 0.0 0.0 0.0 0.0 0.0 0.1 39.2 21.7
495.3 – 1.4 0.0 59.9 7.6 0.0 546.2 279.9 – 0.7 0.0 21.1 0.0 7.0 0.0 293.3 252.9 215.4
Financial assets
Shares in affiliated companies 0.9 0.0 – 0.7 0.0 0.2 0.0 0.0 0.0 0.0 0.0 0.0 0.0 0.0 0.0 0.0 0.0 0.9
Shares in companies consolidated at equity 24.6 0.2 0.0 24.0 8.4 0.0 40.4 0.0 0.0 0.0 0.0 0.0 0.0 0.0 0.0 40.4 24.6
Investment in companies 2.3 0.0 0.0 0.0 0.0 0.0 2.3 1.2 0.0 0.0 0.0 0.0 0.0 0.0 1.2 1.1 1.1
Other loans 2.8 0.0 0.0 0.3 0.7 0.0 2.4 – 0.1 0.0 0.0 0.0 0.0 0.0 0.0 – 0.1 2.5 2.9
Long-term securities 0.3 0.0 0.0 0.0 0.0 0.0 0.3 0.1 0.0 0.0 0.0 0.0 0.0 0.0 0.1 0.2 0.2
30.9 0.2 – 0.7 24.3 9.3 0.0 45.4 1.2 0.0 0.0 0.0 0.0 0.0 0.0 1.2 44.2 29.7
Long-term assets (excluding deferred taxes and
other receivables and other assets)
698.9
– 2.9
0.4
86.2
17.1
0.0
765.5
336.9
– 1.0
0.1
26.9
0.0
7.2
0.0
355.7
409.8
362.0
2013Dec. 31,
2012Currency
differences
Changes in the scope of consolidation Additions Disposals
Reclassifi-cations
Dec. 31, 2013
Dec. 31, 2012
Currency differences
Changes in the scope of consolidation
Scheduled deprec. &
amortiz.Impairment
losses DisposalsReclassifi-
cationsDec. 31,
2013Dec. 31,
2013Dec. 31,
2012
Intangible assets
Licenses, industrial property rights and similar values 79.2 – 1.6 0.0 3.8 0.2 0.4 81.6 51.6 – 1.0 0.0 5.1 0.0 0.2 0.0 55.5 26.1 27.6
Goodwill 2 94.4 – 2.9 0.0 0.0 0.0 0.0 91.5 9.6 – 0.6 0.0 0.0 0.5 0.0 0.0 9.5 82.0 84.8
Other intangible assets 0.3 0.0 0.0 0.2 0.0 – 0.4 0.1 0.0 0.0 0.0 0.0 0.0 0.0 0.0 0.0 0.1 0.3
173.9 – 4.5 0.0 4.0 0.2 0.0 173.2 61.2 – 1.6 0.0 5.1 0.5 0.2 0.0 65.0 108.2 112.7
Property, plant and equipment
Land, land rights and buildings 193.4 – 7.3 0.0 12.6 0.7 8.9 206.9 75.0 – 3.1 0.0 5.8 0.0 0.1 0.0 77.6 129.3 118.4
Technical equipment and machinery 205.2 – 6.9 0.0 13.4 2.2 11.4 220.9 142.4 – 4.7 0.0 9.2 0.0 1.5 0.0 145.4 75.5 62.8
Other equipment, factory and office equipment 108.3 – 2.9 0.0 7.4 2.3 2.6 113.1 75.8 – 2.1 0.0 7.6 0.0 2.0 0.0 79.3 33.8 32.5
Work in progress 39.3 – 3.1 0.0 32.8 0.2 – 22.9 45.9 0.1 – 0.1 0.0 0.0 0.0 0.0 0.0 0.0 45.9 39.2
546.2 – 20.2 0.0 66.2 5.4 0.0 586.8 293.3 – 10.0 0.0 22.6 0.0 3.6 0.0 302.3 284.5 252.9
Financial assets
Shares in affiliated companies 0.0 0.0 0.0 1.3 0.0 0.0 1.3 0.0 0.0 0.0 0.0 0.0 0.0 0.0 0.0 1.3 0.0
Shares in companies consolidated at equity 3 40.4 – 4.4 0.0 12.7 5.4 0.0 43.3 0.0 0.0 0.0 0.0 0.0 0.0 0.0 0.0 43.3 40.4
Investment in companies 2.3 0.0 0.0 0.0 0.1 0.0 2.2 1.2 0.0 0.0 0.0 0.0 0.1 0.0 1.1 1.1 1.1
Other loans 2.4 0.0 0.0 1.3 0.2 0.0 3.5 – 0.1 0.0 0.0 0.0 0.0 0.0 0.0 – 0.1 3.6 2.5
Long-term securities 0.3 0.0 0.0 0.0 0.0 0.0 0.3 0.1 0.0 0.0 0.0 0.0 0.0 0.0 0.1 0.2 0.2
45.4 – 4.4 0.0 15.3 5.7 0.0 50.6 1.2 0.0 0.0 0.0 0.0 0.1 0.0 1.1 49.5 44.2
Long-term assets (excluding deferred taxes and
other receivables and other assets)
765.5
– 29.1
0.0
85.5
11.3
0.0
810.6
355.7
– 11.6
0.0
27.7
0.5
3.9
0.0
368.4
442.2
409.8
1 Part of the notes.
2 The amortization on goodwill accumulated by December 31, 2004 was balanced with historical acquisition costs.
3 The inflows to the financial assets also contain partial proceeds of the shares in companies consolidated at equity.

122 F I N A N C I A L R E P O R T
STATEMENT OF CASH FLOWS
in € million 2013 2012
Earnings after tax 1 218.6 207.0
Depreciation and amortization of long-term assets 28.2 26.9
Change in long-term provisions and in other non-current assets (covering funds) 1 – 12.7 – 0.4
Change in deferred taxes 4.0 – 0.3
Non-cash income from shares in companies consolidated at equity – 13.5 – 14.2
Gross cash flow 224.6 219.0
Gross cash flow 224.6 219.0
Change in inventories – 5.2 – 11.5
Change in trade receivables – 21.0 – 3.4
Change in other assets 7.8 3.2
Change in trade payables 17.6 – 10.0
Change in other liabilities (excluding financial liabilities) – 8.7 5.8
Net gain / loss on disposal of long-term assets 0.0 0.0
Cash flow from operating activities 215.1 203.1
Investments in long-term assets – 72.8 – 71.4
Acquisition of subsidiaries and other business units 0.0 – 0.9
Proceeds from the disposal of long-term assets 2.2 1.5
Change in cash and cash equivalents due to change in the scope of consolidation 0.0 0.2
Dividends received 5.4 7.9
Cash flow from investing activities – 65.2 – 62.7
Free cash flow 2 149.9 140.4
Dividends paid for previous year – 92.0 – 70.9
Purchase of own shares – 22.0 0.0
Changes in bank and leasing commitments 0.5 – 4.9
Purchase of non-controlling interests – 0.7 0.0
Cash flow from financing activities – 114.2 – 75.8
Cash and cash equivalents at the end of the previous period 143.7 79.0
Cash flow from operating activities 215.1 203.1
Cash flow from investing activities – 65.2 – 62.7
Cash flow from financing activities – 114.2 – 75.8
Effect of currency translations – 4.2 0.1
Cash and cash equivalents at the end of the period 3 175.2 143.7

123Consolidated financial statements of FUCHS PETROLUB SE3.1 F I N A N C I A L R E P O R T
Note 36
191
1 Previous year’s figures have been adjusted due to the application of IAS 19R, see “Application of new accounting standards” in the notes
to the consolidated financial statements.
2 Total of cash flow from operating activities and cash flow from investing activities.
3 Cash and cash equivalents comprise total liquid funds of the Group.
The paid taxes on income total € 96.0 million (87.1). They are included in the Cash flow from oper-
ating activities.
€ 2.3 million (2.4) was paid for interest. Interest payments received totaled €1.0 million (1.0).

124 F I N A N C I A L R E P O R T
SEGMENTS ¹
E U R O P E
A S I A - PA C I F I C , A F R I C A
N O R T H A N D S O U T H A M E R I C A
T O TA L F O R O P E R AT I N G
C O M PA N I E S
H O L D I N G I N C L U D I N G
C O N S O L I D AT I O N
F U C H S P E T R O L U B G R O U P
in € million 2013 2012 Change 2013 2012 Change 2013 2012 Change 2013 2012 Change 2013 2012 Change 2013 2012 Change
Sales revenues by
customer location 958.5 958.3 0.2 560.3 535.4 24.9 312.8 325.4 – 12.6 1,831.6 1,819.1 12.5 0.0 0.0 0.0 1,831.6 1,819.1 12.5
Sales revenues by
company location 1,104.2 1,080.7 23.5 497.9 486.8 11.1 307.3 320.3 – 13.0 1,909.4 1,887.8 21.6 – 77.8 – 68.7 – 9.1 1,831.6 1,819.1 12.5
thereof with other
segments 75.6 66.2 9.4 0.0 0.1 – 0.1 2.2 2.4 – 0.2 77.8 68.7 9.1 – 77.8 – 68.7 – 9.1 0.0 0.0 0.0
Scheduled depreciation 2 17.1 17.4 – 0.3 5.9 4.5 1.4 4.2 4.5 – 0.3 27.2 26.4 0.8 0.5 0.5 0.0 27.7 26.9 0.8
Impairment losses 2 0.5 0.0 0.5 0.0 0.0 0.0 0.0 0.0 0.0 0.5 0.0 0.5 0.0 0.0 0.0 0.5 0.0 0.5
EBIT before income from
companies consolidated
at equity 151.3 132.6 18.7 91.1 83.1 8.0 62.2 67.5 – 5.3 304.6 283.2 21.4 – 5.8 – 4.4 – 1.4 298.8 278.8 20.0
Income from companies
consolidated at equity 1.2 1.0 0.2 12.3 13.2 – 0.9 0.0 0.0 0.0 13.5 14.2 – 0.7 0.0 0.0 0.0 13.5 14.2 – 0.7
Segment earnings (EBIT) 152.5 133.6 18.9 103.4 96.3 7.1 62.2 67.5 – 5.3 318.1 297.4 20.7 – 5.8 – 4.4 – 1.4 312.3 293.0 19.3
Financial result 3 – 1.6 – 1.9 0.3
Income taxes – 92.1 – 84.1 – 8.0
Earnings after tax 3 218.6 207.0 11.6
Segment assets 4 537.6 530.0 7.6 278.7 262.9 15.8 223.6 211.6 12.0 1,039.9 1,004.5 35.4 122.1 104.2 17.9 1,162.0 1,108.7 53.3
thereof shares from
companies consolidated
at equity 2.6 2.4 0.2 40.7 38.0 2.7 0.0 0.0 0.0 43.3 40.4 2.9 0.0 0.0 0.0 43.3 40.4 2.9
Segment liabilities 5 148.5 139.2 9.3 72.4 62.8 9.6 30.7 32.4 – 1.7 251.6 234.4 17.2 33.3 57.3 – 24.0 284.9 291.7 – 6.8
Financial liabilities 7.8 8.9 – 1.1
Pension provisions 15.8 26.4 – 10.6
Cash and cash equivalents 175.2 143.7 31.5
Group liabilities 6 133.3 183.3 – 50.0
Additions to property,
plant and equipment and
intangible assets 7 30.7 34.6 – 3.9 21.2 14.2 7.0 17.1 13.7 3.4 69.0 62.5 6.5 1.2 0.5 0.7 70.2 63.0 7.2
Additions to financial assets 1.3 0.3 1.0 0.0 10.1 – 10.1 0.0 0.0 0.0 1.3 10.4 – 9.1 1.3 0.0 1.3 2.6 10.4 – 7.8
Employees (average number) 2,356 2,311 45 866 838 28 540 524 16 3,762 3,673 89 84 81 3 3,846 3,754 92
Key performance indicators
Ratio of EBIT before income
from companies consolidated
at equity to sales revenues in % 13.7 12.3 18.3 17.1 20.2 21.1 16.3 15.3
1 Part of the notes.
2 Relating to property, plant and equipment, intangible assets, goodwill and financial assets.
3 Previous year’s figures have been adjusted due to the application of IAS 19R, see “Application of new accounting standards” in the notes to the consolidated financial
statements.
4 Including shares in companies consolidated at equity, excluding income tax receivables and financial receivables.
5 Non-interest bearing borrowed capital: trade payables, other provisions and other liabilities, excluding income tax liabilities; Group value including tax liabilities.
6 Segment liabilities, financial liabilities, pension provisions, minus cash and cash equivalents.
7 In the previous year including aquisitions and changes in the scope of consolidation.

125Consolidated financial statements of FUCHS PETROLUB SE3.1 F I N A N C I A L R E P O R T
SEGMENTS ¹
E U R O P E
A S I A - PA C I F I C , A F R I C A
N O R T H A N D S O U T H A M E R I C A
T O TA L F O R O P E R AT I N G
C O M PA N I E S
H O L D I N G I N C L U D I N G
C O N S O L I D AT I O N
F U C H S P E T R O L U B G R O U P
in € million 2013 2012 Change 2013 2012 Change 2013 2012 Change 2013 2012 Change 2013 2012 Change 2013 2012 Change
Sales revenues by
customer location 958.5 958.3 0.2 560.3 535.4 24.9 312.8 325.4 – 12.6 1,831.6 1,819.1 12.5 0.0 0.0 0.0 1,831.6 1,819.1 12.5
Sales revenues by
company location 1,104.2 1,080.7 23.5 497.9 486.8 11.1 307.3 320.3 – 13.0 1,909.4 1,887.8 21.6 – 77.8 – 68.7 – 9.1 1,831.6 1,819.1 12.5
thereof with other
segments 75.6 66.2 9.4 0.0 0.1 – 0.1 2.2 2.4 – 0.2 77.8 68.7 9.1 – 77.8 – 68.7 – 9.1 0.0 0.0 0.0
Scheduled depreciation 2 17.1 17.4 – 0.3 5.9 4.5 1.4 4.2 4.5 – 0.3 27.2 26.4 0.8 0.5 0.5 0.0 27.7 26.9 0.8
Impairment losses 2 0.5 0.0 0.5 0.0 0.0 0.0 0.0 0.0 0.0 0.5 0.0 0.5 0.0 0.0 0.0 0.5 0.0 0.5
EBIT before income from
companies consolidated
at equity 151.3 132.6 18.7 91.1 83.1 8.0 62.2 67.5 – 5.3 304.6 283.2 21.4 – 5.8 – 4.4 – 1.4 298.8 278.8 20.0
Income from companies
consolidated at equity 1.2 1.0 0.2 12.3 13.2 – 0.9 0.0 0.0 0.0 13.5 14.2 – 0.7 0.0 0.0 0.0 13.5 14.2 – 0.7
Segment earnings (EBIT) 152.5 133.6 18.9 103.4 96.3 7.1 62.2 67.5 – 5.3 318.1 297.4 20.7 – 5.8 – 4.4 – 1.4 312.3 293.0 19.3
Financial result 3 – 1.6 – 1.9 0.3
Income taxes – 92.1 – 84.1 – 8.0
Earnings after tax 3 218.6 207.0 11.6
Segment assets 4 537.6 530.0 7.6 278.7 262.9 15.8 223.6 211.6 12.0 1,039.9 1,004.5 35.4 122.1 104.2 17.9 1,162.0 1,108.7 53.3
thereof shares from
companies consolidated
at equity 2.6 2.4 0.2 40.7 38.0 2.7 0.0 0.0 0.0 43.3 40.4 2.9 0.0 0.0 0.0 43.3 40.4 2.9
Segment liabilities 5 148.5 139.2 9.3 72.4 62.8 9.6 30.7 32.4 – 1.7 251.6 234.4 17.2 33.3 57.3 – 24.0 284.9 291.7 – 6.8
Financial liabilities 7.8 8.9 – 1.1
Pension provisions 15.8 26.4 – 10.6
Cash and cash equivalents 175.2 143.7 31.5
Group liabilities 6 133.3 183.3 – 50.0
Additions to property,
plant and equipment and
intangible assets 7 30.7 34.6 – 3.9 21.2 14.2 7.0 17.1 13.7 3.4 69.0 62.5 6.5 1.2 0.5 0.7 70.2 63.0 7.2
Additions to financial assets 1.3 0.3 1.0 0.0 10.1 – 10.1 0.0 0.0 0.0 1.3 10.4 – 9.1 1.3 0.0 1.3 2.6 10.4 – 7.8
Employees (average number) 2,356 2,311 45 866 838 28 540 524 16 3,762 3,673 89 84 81 3 3,846 3,754 92
Key performance indicators
Ratio of EBIT before income
from companies consolidated
at equity to sales revenues in % 13.7 12.3 18.3 17.1 20.2 21.1 16.3 15.3
1 Part of the notes.
2 Relating to property, plant and equipment, intangible assets, goodwill and financial assets.
3 Previous year’s figures have been adjusted due to the application of IAS 19R, see “Application of new accounting standards” in the notes to the consolidated financial
statements.
4 Including shares in companies consolidated at equity, excluding income tax receivables and financial receivables.
5 Non-interest bearing borrowed capital: trade payables, other provisions and other liabilities, excluding income tax liabilities; Group value including tax liabilities.
6 Segment liabilities, financial liabilities, pension provisions, minus cash and cash equivalents.
7 In the previous year including aquisitions and changes in the scope of consolidation.

126 F I N A N C I A L R E P O R T
BASIS OF PREPARATION
GENER AL INFORMATION
The consolidated financial statements of FUCHS PETROLUB SE, Mannheim, as at December 31, 2013,
have been prepared in accordance with the standards and interpretations as specified in the
guidelines of the International Accounting Standards Board (IASB), London, to be applied within the
EU, and in accordance with the supplementary regulations to be applied as specified by Section
315 a (1) of the German Commercial Code (HGB), as applicable on the balance sheet date. All of the
International Financial Reporting Standards (I FRS), formerly International Accounting Standards
(IAS), and interpretations of the International Financial Reporting Interpretations Committee (IFRIC),
formerly the Standing Interpretations Committee (SIC), applicable in the EU and that were
required for the 2013 financial year have been applied.
The Annual General Meeting on May 8, 2013 approved the change of legal form of the formerly
FUCHS PETROLUB AG stock corporation into an SE. The company was finally entered in the Com-
mercial and Companies Register as FUCHS PETROLUB SE on July 18, 2013.
The currency used in this report is the euro (€). All amounts are stated in millions of euros (€ million),
unless otherwise indicated. The previous year’s figures are stated in parentheses. In order to sim-
plify the presentation, some individual items have been grouped together in the balance sheet and
the income statement; however, these items are listed separately and explained in the notes.
On March 14, 2014, the Executive Board at FUCHS PETROLUB SE prepared the consolidated finan-
cial statements and discussed these with the Audit Committee of the Supervisory Board on
March 19, 2014. The consolidated financial statements will be presented to the Supervisory Board in
its meeting on March 19, 2014 for approval and release for publication.
APPLIC ATION OF NEW ACCOUNTING STANDARDS
The accounting standards relevant to the FUCHS PETROLUB Group, which are to be adopted for
the first time for the financial year 2013, are outlined in the following. The effects on the net assets,
financial position and results of operations of the FUCHS PETROLUB Group are insignificant.
Amendment to IAS 1 “Presentation of items of Other Comprehensive Income” in the statement of comprehensive income
This amendment affects the presentation of other comprehensive income in the statement of
comprehensive income. The items of other comprehensive income which will subsequently be reclas-
sified (“recycled”) to the income statement must be presented separately from the items of other
comprehensive income that are not to be reclassified. Insofar as the items are disclosed gross, i. e.
without netting with effects from deferred taxes, the deferred taxes must no longer be disclosed
as a total amount, but be allocated to the two groups of items. The presentation of the statement of
comprehensive income was therefore revised for the FUCHS PETROLUB Group.
Glossary page 209
a–z
Notes to the consolidated financial statements

1273.2 Notes to the consolidated financial statementsF I N A N C I A L R E P O R T
IAS 19 (revised 2011) “Employee Benefits”
The most significant amendment resulting from the revision of IAS 19 (revised 2011) concerns the way
in which pension obligations from defined benefit plans are recognized in the balance sheet.
With the revision of IAS 19, actuarial gains and losses must always be recognized directly and
in full under other comprehensive income. The amendment will not have any effects on the FUCHS
PETROLUB Group, as the Group has already been recognizing actuarial gains and losses directly
in equity (OCI) since the financial year 2008. In addition to this, a past service cost is now also to be
recognized directly in the income statement in the year in which it occurs. This did not have any
effect on the net assets, financial position or results of operations of the FUCHS PETROLUB Group.
The revised recognition and disclosure requirements for administration costs associated with
plan assets also have no material effect on the presentation of the financial and earnings position of
FUCHS.
In addition to this, the return on plan assets is no longer recorded based on management expecta-
tions regarding the performance of the investment portfolio, but rather set at the start of the
period at the typical level of the discount interest rate of the pension obligations. In comparison with
the previous regulation, the financial result was therefore reduced by € 0.8 million in the financial
year 2013. Since the amendment is also to be applied retroactively, this requires the previous year’s
figures to be revised. For the financial year 2012 this represents a € 0.3 million reduction of the
financial result in the income statement, as well as a corresponding increase in actuarial gains and
losses of € 0.3 million recorded under other comprehensive income in the statement of compre-
hensive income. The retroactive application of the IAS 19 standard (revised) does not have any influ-
ence on the level of pension provisions or the total amount of shareholders’ equity in the consoli-
dated balance sheet. Within the scope of adopting the amendments of IAS 19 (revised), actuarial
gains and losses were recorded under equity capital generated in the Group in the statement of
changes in shareholders’ equity. The effects on income taxes and dividends per share were insignifi-
cant, both in the financial year 2013 and in the same period of the previous year.
Beside changes to accounting, the consolidated financial statements have been extended by the addi-
tion of further notes, e. g. in the form of sensitivity analyses.
The revised definition of termination benefits and the resulting change in the accounting treat-
ment of partial retirement agreements did not have any effects on the level of provisions for partial
retirement.
Amendments to IFRS 7 “Disclosures – Offsetting Financial Assets and Financial Liabilities”
With this amendment to IFRS 7, the disclosure requirements for offset and offsetable financial
instruments have been extended. The first-time adoption of this standard did not have any effects on
the FUCHS PETROLUB Group’s net assets, financial position, or results of operations.

128 F I N A N C I A L R E P O R T
IFRS 13 “Fair Value Measurement”
This standard creates uniformity in fair value measurement for IFRS financial statements. The
first-time adoption of this standard did not have any effects on the FUCHS PETROLUB Group’s net
assets, financial position, or results of operations.
Improvements to IFRS 2009 – 2011
Five standards were revised within the scope of the annual improvement project. The goal of the
revised formulations in individual IFRS is to clarify the existing regulations. Beside this, there are also
changes with effects on recognition, measurement, and notes to the consolidated financial state-
ments. The first-time adoption of this standard did not have any effects on the FUCHS PETROLUB
Group’s net assets, financial position, or results of operations.
The FUCHS PETROLUB Group has decided to make use of a voluntary early adoption of the follow-
ing amendments to IAS 36 (2013) “Recoverable Amount Disclosures” as of the financial year 2013.
Amendment to IAS 36 – “Recoverable Amount Disclosures”
In the course of a subsequent amendment from IFRS 13 “Fair Value Measurement”, a new obligatory
disclosure was introduced for the goodwill impairment test as per IAS 36. Based on this, the recov-
erable amount of the cash-generating units had to be disclosed, regardless of whether an impairment
was actually performed. Since this note was introduced unintentionally, it was removed again
with this amendment from May 2013. However, the amendment also requires additional disclosures
if an impairment has actually been performed and the recoverable amount was determined on
the basis of fair value. The amendments are to be applied for the first time for financial years starting
on or after January 1, 2014.
The following standards and amendments to standards / interpretations, which are relevant to
the FUCHS PETROLUB Group and have been endorsed by the EU, will only become binding in the
financial year 2014 or later and were not adopted early.
Amendments to IAS 27 “Separate Financial Statements”
Within the scope of the adoption of IFRS 10 “Consolidated Financial Statements”, the regula-
tions for the principle control and the requirements when preparing consolidated financial statements
have been removed from IAS 27 and ultimately incorporated in IFRS 10 (see details on IFRS 10).
As a result of this, IAS 27 will in future only contain those regulations concerning the accounting
treatment of subsidiaries, joint ventures and associated companies in IFRS individual financial
statements. The amendment is to be applied for the first time for financial years starting on or after
January 1, 2014.

1293.2 Notes to the consolidated financial statementsF I N A N C I A L R E P O R T
IFRS 11 “Joint Arrangements”
IFRS 11 changes the accounting process for joint arrangements. Based on the new concept, a deci-
sion must be reached as to whether the activities relate to a joint operation or a joint venture. In
future, joint ventures must be consolidated at equity. The option to incorporate these joint ventures
in the consolidated financial statements on a pro rata basis has therefore been eliminated. The
new standard is to be applied for the first time for financial years starting on or after January 1, 2014.
Amendments to IAS 28 “Shares in Associates and Joint Ventures”
Within the scope of the adoption of IFRS 11 “Joint Arrangements”, revisions were also made
to IAS 28. As is already the case, IAS 28 governs the application of the EQUIT Y METHOD. However,
the scope of application has been significantly extended with adoption of IFRS 11, since in future
not only investments in associated companies, but also in joint ventures (IFRS 11) must be measured
using the equity method. The use of pro rata consolidation for joint ventures has therefore been
eliminated.
Another amendment concerns the accounting method as per IFRS 5 when only a portion of a stake
in an associated company or a joint venture is to be sold. IFRS 5 is applied to the stake to be sold,
while the remaining stake must continue to be recog nized using the equity method until the stake
to be sold has actually been sold. The amendment is to be applied for the first time for financial
years starting on or after January 1, 2014.
Since the FUCHS PETROLUB Group already includes all joint ventures in its consolidated financial
statements on the balance sheet date using the equity method and the other amendments currently
do not hold any relevance for the FUCHS PETROLUB Group, we do not expect adoption of
IFRS 11 in connection with the amended IAS 28 to have any significant effect on the Group’s net
assets, financial position or results of operations.
IFRS 10 “Consolidated Financial Statements”
This standard comprehensively redefines the term “control”. When one company controls another
company, the parent company must consolidate its SUBSID IARY. This new standard could poten-
tially have effects on the scope of consolidation, such as for special purpose entities. The new stan-
dard is to be applied for the first time for financial years starting on or after January 1, 2014.
From today’s perspective, we do not expect this standard to have any effects on the scope of con-
solidation.
Glossary page 208
a–z
Glossary page 209
a–z

130 F I N A N C I A L R E P O R T
IFRS 12 “Disclosure of Interests in Other Entities”
This standard governs the disclosure requirements regarding stakes held in other companies. The nec-
essary disclosures are significantly more extensive than the former requirements in accordance
with IAS 27, IAS 28 , and IAS 31. The new standard is to be applied for the first time for financial years
starting on or after January 1, 2014.
Amendments to IFRS 10, IFRS 11 and IFRS 12 – Transition Guidance
The amendments include clarification and additional simplifications for transitioning to IFRS 10,
IFRS 11, and IFRS 12. Adjusted comparison information now only needs to be provided for the previ-
ous period. The amendments to IFRS 10, IFRS 11 and IFRS 12 are to be applied for the first time
for financial years starting on or after January 1, 2014.
Amendments to IAS 32 – “Offsetting Financial Instruments”
This amendment to IAS 32 clarifies the prerequisites for offsetting financial instruments. The amend-
ment to IAS 32 is to be applied for the first time for financial years starting on or after January 1,
2014. From today’s perspective, the first-time adoption of this standard does not have any effects
on the FUCHS PETROLUB Group’s net assets, financial position, or results of operations.
Amendment to IAS 39 – “Novation of Derivatives and Continuation of Hedge Accounting”
As a result of this amendment, derivatives continue to be designated as hedging instruments in exist-
ing hedging relationships under certain conditions, despite novation of a hedging instrument to
a central counterparty as a result of legally stipulated requirements. The amendments are to be applied
for the first time for financial years starting on or after January 1, 2014. From today’s perspec-
tive, the FUCHS PETROLUB Group does not anticipate any effects, as it uses derivative financial instru-
ments (derivatives) solely to limit the risks in its operating business and the resultant financial
transactions arising from fluctuations in interest rates and exchange rates. All hedging instruments
are recognized in the income statement. The hedge accounting rules were not applied.
The following standards and amendments to standards respectively interpretations are relevant to
the FUCHS PETROLUB Group, but have not yet been adopted by the EU. Subject to their endorse-
ment by the EU, they will only become binding from the financial year 2014 or later and were also
not adopted earlier.
The FUCHS PETROLUB Group is currently still investigating the effects of these amendments, but
from today’s perspective does not expect any significant effects on the Group’s net assets, financial
position or results of operations.

1313.2 Notes to the consolidated financial statementsF I N A N C I A L R E P O R T
IFRS 9 “Financial Instruments”
The IFRS 9 method for recognition and measurement of financial instruments will replace IAS 39.
The date for first-time adoption of IFRS 9 is currently still open, although it is not likely to be before
January 1, 2017.
IFRS 9 – Hedge Accounting and Amendments to IFRS 9, IFRS 7 and IAS 39
Initial adoption of the new provisions on hedge accounting follows the provisions for first-time adop-
tion of IFRS 9.
Amendments to IFRS 9 and IFRS 7 – Mandatory Effective Date and Transition Disclosures
Similarly to the provisions of IFRS 9, the date for first-time adoption of these amendments is still open,
but is not likely to be before January 1, 2017.
Amendments to IAS 19 – Defined Benefit Plans: Employee Contributions
The amendments clarify the regulations addressing the allocation of employee premiums or third
party premiums to periods of service if the premiums are linked to years of service. Subject to
endorsement by the EU, which is still pending, the amendments are to be applied for the first time
for financial years starting on or after July 1, 2014.
IFRIC 21 – “Levies”
IFRIC 21 “Levies” is an interpretation of IAS 37 “Provisions, Contingent Liabilities and Contingent
Assets”. It primarily provides clarification to the question of when a current obligation arises with
levies raised by public authorities and a provision or liability is to be recognized. Subject to endorse-
ment by the EU, which is still pending, the amendments are to be applied for the first time for finan-
cial years starting on or after January 1, 2014.
Improvements to IFRS 2010 – 2012
Seven standards were revised within the scope of the annual improvement project. Subject to
endorsement by the EU, which is still pending, the amendments are to be applied for the first time
for financial years starting on or after July 1, 2014.
Improvements to IFRS 2011 – 2013
Four standards were revised within the scope of the annual improvement project. Subject to
endorsement by the EU, which is still pending, the amendments are to be applied for the first time
for financial years starting on or after July 1, 2014.

132 F I N A N C I A L R E P O R T
SCOPE OF CONSOLIDATION
Number EuropeAsia-Pacific,
AfricaNorth and
South America Total
Fully consolidated companies
(incl. parent company)
January 1, 2013 29 16 8 53
Additions
Disposals – 1 – 1
December 31, 2013 29 15 8 52
Companies consolidated at equity
January 1, 2013 / December 31, 2013 1 4 0 5
Unconsolidated companies
January 1, 2013 1 2 0 3
Additions 1 1 2
Disposals
December 31, 2013 2 3 0 5
Fundamentally, all German and international subsidiaries are included in the consolidated financial
statements of FUCHS PETROLUB SE, Mannheim, Germany. The year-end financial statements of
the subsidiaries are prepared with the same balance sheet date as the consolidated financial state-
ments (December 31). Disclosure of shareholdings is given in note 43.
The financial results of certain subsidiaries that have no material effect upon the consolidated finan-
cial results of the Group have not been included in FUCHS PETROLUB’s consolidated financial
statements. Five foreign companies were not included. The non-consolidated companies generated
total sales revenues of € 3.3 million and earnings after tax of € 0.3 million.
Subsidiaries
198
1333.2 Notes to the consolidated financial statementsF I N A N C I A L R E P O R T
The exemption from the disclosure requirement pursuant to 264 (3) of the German Commercial
Code (HGB) was used for the following subsidiaries included in the consolidated financial statements:
■■ BREMER & LEGUIL GMBH, Duisburg,■■ FUCHS EUROPE SCHMIERSTOFFE GMBH, Mannheim,■■ FUCHS FINANZSERVICE GMBH, Mannheim,■■ FUCHS LUBRITECH GMBH, Kaiserslautern,■■ PARAFLUID MINERALOELGESELLSCHAFT MBH, Hamburg, and■■ WISURA GMBH, Bremen.
The large and medium-sized corporations were also exempted from preparing a management report.
The scope of consolidation includes a total of 52 (53) companies. The changes to the scope of consoli-
dation in 2013 are stated in the section below.
CHANGES IN THE SCOPE OF CONSOLIDATION
Disposals at fully consolidated companies in %
FUCHS LUBRICANTS (PHILIPPINES) INC. 100
Additions at non-consolidated companies in %
FUCHS LUBRICANTS NORWAY AS 100
FUCHS LUBRICANTS VIETNAM COMPANY LIMITED 100
FUCHS LUBRICANTS (PHILIPPINES) INC. was liquidated and deconsolidated in 2013. This had
no appreciable effect on the net assets, financial position and results of operations of the FUCHS
PETROLUB Group.
In 2013, the shares in the former sales partner in Norway were acquired. This company supplies
industrial customers, operating primarily in the offshore industry, and currently generates sales reve-
nues in the low single-digit millions. A new subsidiary was founded in Vietnam. Both subsidiaries
will be included considering materiality reasons in the consolidated financial statements from the
financial year 2014 onward.

134 F I N A N C I A L R E P O R T
CONSOLIDATION PRINC IPLES
The acquisition accounting for acquisitions prior to March 31, 2004 has been accounted in accor-
dance with the regulations of IAS 22. For acquisitions after March 31, 2004, the principles of IFRS 3
apply. All business combinations are accounted for using the purchase method of accounting at
the acquisition date. Initially, all assets, liabilities and intangible assets that are to be capitalized are
valued at fair value. The acquisition costs are then compared with the proportional share of the
net assets acquired at fair value. The resulting positive differences are capitalized as goodwill. Nega-
tive differences are reviewed once more, then recognized directly in profit or loss. The inciden-
tal acquisition costs of a business combination are recognized in the income statement. Pursuant to
IAS 36, the recoverable amount is calculated on the basis of goodwill impairment tests per formed
at least once each year or whenever there are indications of an impairment. For details on this, please
refer to the section “Accounting and valuation methods”.
Changes to the percentage of shares held which do not lead to a loss of control are treated as
a transaction between shareholders and recognized directly under shareholders’ equity. Transactions
of this nature do not result in the recognition of goodwill or the realization of disposal proceeds.
The consolidation principles apply accordingly to the joint ventures and associated companies
consolidated at equity. In the event of losing joint control or a key influence, the remaining shares are
re-measured at fair value through profit and loss.
The shares in companies consolidated at equity are measured at acquisition costs plus or less
the accumulated changes in net assets, whereby goodwill is recognized in the carrying amount of
the investment.
Inter-company sales, expenses and income as well as receivables and liabilities between consoli-
dated companies are netted off. Inter-company profits resulting from sales and services rendered
between consolidated companies are eliminated. This does not apply to profits or losses which
in total are of minor importance for forming a true and fair view of the Group’s assets, liabilities, finan-
cial position and earnings.
Minority interests on the consolidated equity and consolidated net profit are shown separately from
the parent company’s ownership interest.
Accounting and valuation methods
137

1353.2 Notes to the consolidated financial statementsF I N A N C I A L R E P O R T
FOREIGN CURRENC Y TR ANSL ATION
The translation of financial statements prepared in foreign currencies by consolidated companies
is accounted for in accordance with IAS 21 on the basis of the functional currency concept.
The functional currency is the currency of the primary economic environment in which a company
operates. All subsidiaries use their local currency as their functional currency. For the companies
included in the consolidated financial statements, a foreign currency transaction will be valued in
its functional currency and converted by the spot rate valid on the day of the business transaction.
In the financial statements of FUCHS PETROLUB SE and its subsidiaries, assets and liabilities in
foreign currencies are translated at the exchange rates on the balance sheet date. Any exchange rate
gains or losses not yet realized on the balance sheet date are recognized in the income statement.
For consolidation purposes, the financial statements of the subsidiaries prepared in a foreign currency
have been translated to euros as follows:
Expenses and income are recognized at the average annual exchange rate in line with the simplifica-
tion rule of IAS 21.40; shareholders’ equity at historical exchange rates and assets and liabilities
at the exchange rate applicable on the balance sheet date. The resulting translation adjustments are
recognized directly in equity. The year-on-year change is presented in the statement of compre-
hensive income. The respective cumulative translation differences are released to income at the time
of disposal of subsidiaries.
The currency differences resulting from the consolidation of inter-company debts are also recognized
in the income statement under “Other operating income and expenses”.
In the statement of changes in long-term assets, the starting and closing balances have been
translated at the exchange rate on the balance sheet date, and the other items have been translated
at average exchange rates. Any differences arising from exchange rate movements are shown in
a separate column as exchange rate differences within acquisition and manufacturing costs and with
depreciation and amortization adjustments.
Note 5
152
Statement of changes in long-term assets
120

136 F I N A N C I A L R E P O R T
Currency translation for the pro rata equity capital of associated companies is performed at the
respective exchange rates on the balance sheet date. Translation of the annual results con-
cerned is carried out at the average exchange rate on the balance sheet date. Dividend payments
by associated companies are translated at the exchange rate on the date of the distribution.
The exchange rates with a significant influence on the consolidated financial statement have moved
against the euro as follows:
Closing rate (€1) Dec. 31, 2013 Dec. 31, 2012
Change in foreign currency
in %
US dollar 1.377 1.318 – 4.3
British pound 0.833 0.815 – 2.2
Chinese renminbi yuan 8.331 8.212 – 1.4
Australian dollar 1.540 1.271 – 17.5
South African rand 14.504 11.190 – 22.8
Polish zloty 4.151 4.093 – 1.4
Brazilian real 3.252 2.695 – 17.1
Argentinean peso 8.974 6.474 – 27.9
Russian ruble 45.26 40.20 – 11.2
South Korean won 1,452.97 1,411.37 – 2.9
Average annual exchange rate (€1) 2013 2012
Change in foreign currency
in %
US dollar 1.328 1.286 – 3.2
British pound 0.849 0.812 – 4.4
Chinese renminbi yuan 8.233 8.129 – 1.3
Australian dollar 1.377 1.242 – 9.8
South African rand 12.833 10.569 – 17.6
Polish zloty 4.199 4.189 – 0.2
Brazilian real 2.873 2.513 – 12.5
Argentinean peso 7.289 5.858 – 19.6
Russian ruble 42.35 40.04 – 5.5
South Korean won 1,459.27 1,453.29 – 0.4

1373.2 Notes to the consolidated financial statementsF I N A N C I A L R E P O R T
ACCOUNTING AND VALUATION METHODS
In conformity with IAS 27, the financial statements of FUCHS PETROLUB SE and its subsidiaries
in Germany and abroad are prepared in accordance with uniform accounting and valuation
princi ples. Valuations that deviate from the Group’s principles in the annual financial statements
of associated companies are retained where they are of negligible significance.
The primary assessment concept is the inclusion of historical purchasing or manufacturing costs.
Applicable exceptions are indicated accordingly.
The consolidated financial statements are prepared in accordance with the principles of IFRS, as
applied in the EU. The recognition, measurement and disclosure methods, as well as the notes
and disclosures regarding the consolidated financial statements for the financial year 2013 are all
made on the same consistent basis.
Exceptions arise from changes made due to the adoption of new / revised accounting principles (see
“General disclosures”) and in the sense of conveying relevant information. Insofar as adjustments
are made to the previous year’s figures, these are documented and explained in the corresponding
notes to the consolidated financial statements.
In addition to the Group’s earnings before interest and tax (EBIT), the earnings before interest, taxes,
and companies consolidated at equity is disclosed in the income statement. When comparing
this KPI in relation to sales revenues, only those amounts generated from the fully consolidated com-
panies are taken into account in the relative value, both for income and sales revenues. The EBIT
figure also contains earnings of companies consolidated at equity. The sales revenues generated by
companies consolidated at equity are not included in Group sales revenues.
SIGNIF IC ANT DISC RETIONARY DEC IS IONS , EST IMATES AND ASSUM P TIONS
The preparation of the consolidated financial statements requires management to make estimates and
assumptions that affect the reported amounts of assets and liabilities and disclosure of contin-
gent assets and liabilities at the date of the Group’s financial statements and the reported amounts
of revenues and expenses during the reporting period. The estimates and assumptions are based
on experience values, the current level of knowledge, information currently available, as well as other
factors which the Executive Board deems to be applicable under the respective circumstances.
Future-related assumptions and estimates are necessary, in particular for the assessment, recognition,
and measurement of assets and liabilities as follows:
General disclosures
126

138 F I N A N C I A L R E P O R T
Goodwill
Pursuant to IAS 36, the recoverable amount is calculated on the basis of goodwill impairment
tests performed at least once each year or whenever there are indications of an impairment loss. An
asset’s recoverable amount is the higher amount of the fair value of the asset minus selling costs
and the value in use. For the purpose of testing impairment, the cash generating units to which good-
will is assigned are measured.
A cash-generating unit is generally formed by a subsidiary. If the recoverable amount is lower than
the carrying amount of the reporting unit, goodwill will be amortized in the income statement
to the recoverable amount. The recoverable amount is defined by the value in use, which itself is
determined using a discounted cash flow method. The subsidiaries’ mid-term planning, which
generally consists of the budget plan 2014 and the plan years 2015 and 2016, serves as the basis
for planning.
Besides the fundamental cash flow plans, the determination of the discount rate is also of sig-
nificance for the impairment test calculations. The discount rate is a weighted average cost of capital
(WACC), which is made up of the costs of borrowed capital and equity capital weighted with
the capital structure. The shareholders’ equity costs are determined from capital market data using
the Capital Asset Pricing Model (CAPM) and are made up of a risk-free interest rate and a risk
pre mium (consisting of the market risk premium and beta factor). The borrowing costs correspond
to the risk-free interest rate plus a premium for the credit risk. To present the sustainable
growth of the companies in the years following mid-term planning, a deduction from the growth
rate was taken into account in the discount rate for the terminal value. Please refer to note 15
for further information.Note 15
157

1393.2 Notes to the consolidated financial statementsF I N A N C I A L R E P O R T
Provisions for pensions and defined benefit assets
The expenses of defined benefit plans and pension provisions, as well as assets from pension
plans, are determined using actuarial calculations. An actuarial assessment is made on the basis of
various assumptions, which can deviate from actual future developments. These include determi-
nation of discount rates, future salary and wage increases, future pension increases and the mortality
rate. Due to the complexity of the measurement, the basic assumptions made and the long-term
nature of the investments involved, defined benefit obligations are extremely sensitive to changes in
these assumptions. All parameters are checked on each balance sheet date. Actuarial gains and
losses are offset against the Group’s retained earnings directly in shareholders’ equity. They occur
due to deviations in the actual development of pension obligations and pension plan assets from
assumptions made at the start of the year, as well as updates in actuarial assumptions. Please refer
to note 26 for further information.
Feasibility of deferred tax assets
The realizability of deferred tax assets depends on the future taxable profits of the respective
Group company. If there are any doubts regarding realizability, corresponding impairments are made
to the deferred tax assets in individual cases. Please refer to note 18 for further information.
Other important future-related assumptions and estimates are also necessary, particularly for valuation, recognition, and measurement of:
■■ impairments of intangible assets and property, plant and equipment,■■ impairments and write-ups to trade receivables,■■ other provisions, such as environmental obligations and costs for legal proceedings.
Future actual developments may deviate from these assumptions and estimates due to a variety of
factors. The estimates and assumptions used are regularly reviewed. Changes will be recognized
in the income statement at a time when better estimates are available. The estimates for the previous
year do not need to be adjusted.
Note 26
169
Note 18
162
140 F I N A N C I A L R E P O R T
SALES REVENUES
Sales revenues comprise revenues from the sale of goods or services within the scope of ordinary
business operations. They are disclosed without sales tax or any other taxes accrued in the context of
sales revenues, as well as net of sales deductions and after the elimination of intra-group transac-
tions. Sales revenues are realized upon delivery of the products and services, when all essential risks
and opportunities have been transferred to the buyer. Sales revenues from services are realized
as soon as the respective service has been provided. Sales revenues also include fees for chemical pro-
cess management services.
FUCHS PETROLUB does not engage in any business that requires realization of sales revenues in the
form of long-term production orders in line with the percentage-of-completion method.
COST OF SALES
Cost of sales includes the manufacturing costs associated with products, merchandise and services
sold. In accordance with IAS 2, it contains not only directly attributable costs such as cost of material,
personnel and energy, but also direct manufacturing costs and indirect production-related over-
heads. These overheads also include depreciation of production buildings and equipment, write-downs
of inventories, etc.
SELLING AND DISTRIBUTION EXPENSES
Selling and distribution expenses include the costs of the sales organization and application
sup port and advice for our customers, as well as advertising expenses, commission expenses, and
shipping costs.
ADMINISTR ATIVE EXPENSES
Administrative expenses comprise the personnel and related costs of the management and
administration departments, if these have not been allocated to other functional areas as internal
services.
RESEARCH AND DEVELOPMENT EXPENSES
Research expenses include costs for identifying alternative materials / products for technical processes.
Development work includes application of research results for the purpose of developing new
products and / or processes prior to their commercial use. Development expenses are only recognized
as intangible assets when all of the following criteria are met:

1413.2 Notes to the consolidated financial statementsF I N A N C I A L R E P O R T
■■ the expenses attributable to the development of the intangible asset can be reliably determined,■■ technical and economic completion is feasible,■■ future economic benefit is probable and■■ there is an intention to bring the intangible asset to completion in order to use or sell it.
The criteria for recognition of intangible assets created in-house are only met in full in our product
segments shortly before the products reach market maturity. Development costs that occur after
the recognition criteria have been met are insignificant. The development costs are therefore recog-
nized as expenses at the time when they occur.
F INANCIAL RESULT
Financing costs will be differentiated in the income statement and accounted for using the effec-
tive interest method, provided they are not capitalized as part of the historical cost of the asset in line
with IAS 23.8.
Interest income will be differentiated in the income statement and accounted for using the effective
interest method. Dividends will be recorded at the time of the payment claim.
Interest expenses from pension obligations will be netted against the interest income from plan assets
on the basis of actuarial calculations and disclosed in the financial result.
INTANGIBLE ASSETS
Acquired intangible assets are measured and recognized at cost in accordance with IAS 38. It must
be determined whether the useful life of an asset is finite or indefinite. The useful life is indefinite
if there is no foreseeable limit to the period over which the asset is expected to generate net cash
flows for the Group.
Indefinite-lived intangible assets and goodwill are not subject to scheduled amortization, but undergo
an impairment test at least once a year and also whenever there are indications of an impairment.
Definite-lived intangible assets will be subjected to scheduled amortization over their useful lifetimes
using the straight-line method.Accounting and valuation methods
137

142 F I N A N C I A L R E P O R T
For software, a useful life of three to five years is scheduled within the Group. Other intangible assets,
such as patents and licenses, are amortized as per their respective, contractually agreed useful life.
The amortization will be recorded in the income statement under the department costs for manu-
facturing, administration, distribution, as well as research and development.
PROPERT Y, PL ANT AND EQUIPMENT
All items of property, plant and equipment are recognized at their cost of acquisition or manu-
facture, less accumulated depreciation and impairment. Government grants are offset against acqui-
sition costs. No re-measurement of property, plant and equipment is performed on the basis of
the provisions of IAS 16. Straight-line depreciation is applied over the useful life of the property, plant
and equipment.
Within the Group, property, plant and equipment are amortized on the basis of the following esti-
mated useful lives:
Useful life
Buildings 20 to 40 years
Plant and machinery 5 to 20 years
Vehicles 5 years
Factory and office equipment 3 to 10 years
IM PAIRMENTS FOR DEF INITE - L IVED INTANGIBLE ASSETS AND PROPERT Y, PL ANT AND EQUIPMENT
As per IAS 36, the carrying value of definite-lived intangible assets is evaluated whenever cir-
cumstances or events dictate this. The recoverable amount of assets is compared to their carrying
value if there are indications of a potential impairment. An impairment loss is recognized if the
recover able value of an asset (defined as the higher of the asset’s net selling price or its value in use)
is lower than the carrying amount. If the reason for a previously recognized impairment no longer
exists, the impairment is reversed at its brought-forward depreciated or amortized cost of purchase
or manufacture.
1433.2 Notes to the consolidated financial statementsF I N A N C I A L R E P O R T
LEASING
Long-term assets also include leased assets. IAS 17 includes rules for determining, on the basis
of the risks and rewards of the parties to a lease, whether the lessor or the lessee is the economic
owner of the assets. In the case of finance leases, the assets are capitalized by the lessee and in
the case of operating leases the assets are recorded by the lessor. The payment obligations resulting
from the future leasing installments are recognized at their present values as financial liabilities.
The lease payments should be apportioned between the finance charge and the reduction of the
outstanding liability.
If economic ownership remains with the lessor (operating lease), the lease payments are recognized as
expenses over the lease term.
SHARES IN COM PANIES CONSOLIDATED AT EQUIT Y AND OTHER F INANCIAL ASSETS
Interests in joint ventures and associates are carried in the consolidated financial statements at equity.
Proportionate earnings are recognized in the income statement and added to the carrying amount.
Dividend payments of joint ventures and associated companies reduce their shareholders’ equity and
are deducted from the carrying amount without affecting net income. Proportionate earnings
are recognized as an addition in the statement of changes in fixed assets and dividend payments are
shown as disposals.
In accordance with IAS 39 shares and investments in non-consolidated subsidiaries and affiliated
companies are shown at cost minus depreciation, as these assets are unlisted shares in corporations,
for which the fair value to be attributed cannot be reliably determined.
Loans are shown at cost or, in the case of non-interest-bearing loans, at their present value. Identifi-
able risks are taken into account by recognizing impairment losses.
For securities held as long-term assets, according to IAS 39 a distinction must be made between
securities which are held for trading purposes, available-for-sale securities and held-to-maturity
secu rities. The FUCHS PETROLUB Group does not hold any securities for trading purposes. Avail-
able-for-sale securities are recorded at their fair values if these exist; if not, they are recorded
at amortized costs. If they are recorded at fair value, unrealized profits and losses are recognized in
shareholders’ equity net of deferred taxes. Held-to-maturity financial assets are measured at
the lower figure of either cost or fair value. This fair value is equal to the market value on the bal-
ance sheet date without deduction of transaction costs.

144 F I N A N C I A L R E P O R T
F INANCIAL INSTRUMENTS
A financial instrument is a contract that gives rise to a financial asset of one entity and a financial lia-
bility or equity instrument of another entity.
Financial assets and financial liabilities are recorded if the company is a contractual party in rela-
tion to a financial instrument. Financial assets are derecognized if the contractual rights to payments
arising from the financial assets expire or if the financial assets are transferred with all material
risks and opportunities. Financial liabilities are derecognized if the contractual obligations have been
settled, extinguished or have expired. Regular-way purchases and sales of financial instruments
are generally recognized in the balance sheet on their settlement date. Derivatives are recorded on
their day of trading.
Pursuant to IAS 39, financial instruments are divided into the following measurement categories:
Financial assets■■ Financial assets to be measured at fair value through profit and loss: At the FUCHS PETROLUB
Group this category only includes derivatives (forward currency transactions) with a positive fair
value. They are disclosed under Other assets.
■■ Held-to-maturity investments consist of non-derivative financial assets with fixed or determinable
payments. These financial instruments have a fixed term, for which the company has the ability
and intent to hold until maturity, and they do not fall under other measurement categories. In the
FUCHS PETROLUB Group there are no financial assets that fall under this category.
■■ Loans and receivables: These comprise financial assets with fixed or determinable payments, which
are not quoted on an active market and are not derivatives or classified as available-for-sale. In
addition to trade receivables this category includes financial assets contained in other long-term
financial assets and in Other receivables and other assets. Initial measurement is done at fair
value, which generally matches the nominal value of the receivable or loan. Interest-free and low-in-
terest long-term loans and receivables are recorded at present value. Subsequent measure-
ments are generally done at amortized cost under consideration of the effective interest method.
1453.2 Notes to the consolidated financial statementsF I N A N C I A L R E P O R T
■■ Available-for-sale financial assets comprise financial assets which are not derivatives and do
not fall under any of the previously stated measurement categories. In the FUCHS PETROLUB Group
there are no financial assets that fall under this category.
Financial liabilities■■ Financial liabilities to be measured at fair value through profit and loss: At the FUCHS PETROLUB
Group this category only includes derivatives (forward currency transactions) with a negative fair
value. They are disclosed under other short-term liabilities.
■■ Other financial liabilities: among other things, these include trade payables, bank liabilities and
customer advance payments. They are carried at amortized costs, which generally correspond to
the repayable amount.
Pursuant to IAS 39, DERIVATIVE F INANCIAL INSTRUMENTS , such as the forward exchange transac-
tions used by the Group are recognized in the balance sheet at their fair market values. Fair value
is the amount for which an asset could be exchanged, or a liability settled, between knowledgeable,
willing parties in an arm’s length transaction. The valuation of these financial instruments is based
on generally recognized evaluation models and mathematical processes (present value method for
forward exchange transactions) on the basis of current market data.
As derivatives are used solely within the framework of risk limitation or hedging strategies, the
regulations for hedge accounting can be applied provided that the measures are documented prop-
erly. In this respect, IFRS differentiates in particular between “fair value hedges” and “cash flow
hedges”.
A fair value hedge is based on the change in value of an asset or a liability. Since the correspond ing
change in value of the hedged item affects net income, then the (opposing) change in value of the
derivative is also recorded in the income statement.
Note 33
179
Glossary page 208
a–z

146 F I N A N C I A L R E P O R T
A cash-flow hedge arises when the derivative secures compensation for the risks in the future cash
flow of an existing hedged item or most probable future transaction (e. g. the possible exchange
rate disadvantage of a scheduled revenue item in foreign currency). The effectiveness of a cash flow
hedge is determined by how a specific hedged item is secured with a corresponding derivative.
The portion of the gain or loss on the hedging instrument that is determined to be an effective hedge
is recognized directly in equity (Group reserves) and recycled to the income statement when
the hedged cash transaction affects profit or loss. Conversely, the profit or loss arising from the non-
effective part of a hedge is always recognized in the income statement.
The FUCHS PETROLUB Group uses derivative financial instruments (derivatives) solely to limit
the risks in its operating business and the resultant financial transactions arising from fluctuations in
interest rates and exchange rates. All hedging instruments are recognized in the income state-
ment. The hedge accounting rules were not applied, thus no hedging instruments are recognized
directly in equity.
Revenue from interest-bearing assets is recognized on the outstanding receivables at the reporting
date using the interest rates calculated under the effective interest method.
If there is objective evidence for an impairment of a receivable or loan, an individual valuation
adjustment is undertaken. When assessing the need for an impairment, regional, sector and compa-
ny-specific conditions are considered. In addition, use is made of external ratings as well as the
assessments of debt collection agencies and credit insurers when available. In this way, it can be
ensured that all receivables and loans which are not of excellent credit quality are immediately
impaired. Receivables and loans are derecognized when their uncollectibility is finally determined.
If the reason for an impairment no longer exists, a write-up is recognized in profit or loss totaling
not more than the amortized cost. Impairment losses on financial instruments are booked separately
in an allowance account.
Detailed information on financial instruments can be found in the notes to the balance sheet under
note 35.Note 35
181

1473.2 Notes to the consolidated financial statementsF I N A N C I A L R E P O R T
DEFERRED TA XES
In accordance with IAS 12, deferred taxes should be recognized for all taxable temporary differ-
ences between tax base and IFRS-compliant accounting methods at the consolidated companies, and
for consolidation measures with an effect on the income statement. Deferred tax assets essen-
tially relate to tax effects on eliminated intercompany profits within the Group, particularly in the cat-
egory of inventories, and to pension provisions. They also include tax credits which result from
the expected use of loss carryforwards over subsequent years and which are likely to be realized with
sufficient certainty. Deferred tax assets are subject to impairment if the realization of the tax
claim is unlikely. Deferred tax liabilities mainly result from long-term asset depreciation differences
between the Group’s uniform depreciation rules and applicable tax laws. Deferred taxes are deter-
mined on the basis of tax rates to be applied or expected to be applied on the date of realization pur-
suant to the legislation in the countries involved. Deferred tax assets and liabilities are netted to
the extent that they are handled by a single tax authority. The changes in deferred tax assets and
liabilities are recognized through profit or loss. In cases where gains and losses are recognized
directly under shareholders’ equity, any tax assets and liabilities to be deferred in this context are
also recognized directly as equity.
INVENTORIES
Inventories comprise raw materials and supplies, work in progress and services, as well as finished
products and merchandise. Inventories are measured at their cost of acquisition or manufacture. If
the market price or fair value of the sales product which forms the basis for the net realizable value
is lower, then this is applied and an impairment charge recorded. The majority of inventory is valued
using the weighted average cost method. The manufacturing costs comprise production-related
full costs, determined on the basis of standard capacity utilization. In accordance with IAS 2, they
include materials and supplies that are consumed in production. In addition, all overheads related
to the production process, taxes on consumption, and depreciation of production equipment are
included. General administrative expenses and the expenses of company welfare institutions, vol-
untary welfare benefits and company pension plans that are not attributable to manufacturing as well
as financing costs (IAS 23) are not included in the cost of manufacture.
Write-downs are effected to cover risks resulting from inventory coverage or reduced salability.
Uniform write-down stipulations are in place throughout the Group for any cases in which certain
shelf lives are exceeded.

148 F I N A N C I A L R E P O R T
REC EIVABLES AND OTHER SHORT-TERM ASSETS
Receivables and other assets are accounted for at amortized cost. Credit risks are accounted for by
appropriate valuation allowances. Individual allowances are recognized if receivables cannot be
collected or if collection is unlikely. Non-interest-bearing receivables with terms of more than one year
are discounted. Receivables in foreign currencies are translated at exchange rates on the balance
sheet date. In line with the business model, there are no receivables from long-term production orders
in the FUCHS PETROLUB Group.
C ASH AND C ASH EQUIVALENTS
The liquid funds include cash at banks with a maturity of less than three months, checks not yet
tendered, drafts and cash in hand. They are measured at cost of acquisition. Assets denominated in
foreign currencies are converted at the exchange rates on the balance sheet date.
The development of liquid funds, which, pursuant to IAS 7, corresponds to cash and cash equivalents,
is shown in the consolidated statement of cash flows.
SHAREHOLDERS’ EQUIT Y
Costs for procuring the shareholders’ equity are deducted directly from the shareholders’ equity.
Preference share capital is shown in the balance sheet as shareholders’ equity because the
requirements of IAS 32 for an equity instrument are fulfilled. Dividends on both preference shares
and ordinary shares are shown as shareholders’ equity expenses.
PENSION PROVIS IONS AND S IMIL AR OBLIGATIONS
The provisions for pensions are recognized using the projected-unit-credit method in accordance
with IAS 19. This method covers not only the pensions and acquired entitlements known on the bal-
ance sheet date, but also future anticipated increases in pensions and salaries, with the relevant
input factors being estimated. The calculation is based on actuarial expertise taking into account the
relevant biometric factors.
With the revision of IAS 19, actuarial gains and losses must always be recognized directly and in full
under other comprehensive income. The amendment will not have any effects on the FUCHS
PETROLUB Group, as the Group has already been recognizing actuarial gains and losses directly in
equity (OCI) since the financial year 2008.

1493.2 Notes to the consolidated financial statementsF I N A N C I A L R E P O R T
Pension obligations are disclosed net of plan assets at their fair values. Any asset surplus is recognized
under long-term assets.
The charges from forming pension provisions at the level of current service expenses are recog-
nized under personnel costs in the function categories. The interest on pension obligations and the
interest income from plan assets are disclosed in the financial result.
OTHER PROVIS IONS
Pursuant to IAS 37 “Provisions, Contingent Liabilities and Contingent Assets”, other provisions are
formed insofar as there is an obligation to third parties resulting from a previous event which
can be expected to lead to outflows of funds, the level of which can be reliably determined. They
represent uncertain obligations, which are recognized at best estimate levels to meet the respec-
tive obligation.
The values shown for provisions indicate those amounts which are required for covering future pay-
ment obligations, identifiable risks and uncertain liabilities of the Group. Possible price and cost
increases are included in the measurement. Insofar as the level of the provision can only be determined
within a certain bandwidth, the most likely value is taken. In the case of equal probability, the
mean average value is recognized. Long-term provisions with a remaining term of more than one year
are discounted at market interest rates which correspond to the risk and the time period up to
completion. Claims for reimbursement against third parties are not offset against the provisions, but
rather recognized as a separate asset, insofar as their realization is virtually certain.
L IABIL IT IES
Liabilities are stated in the balance sheet at their acquisition costs brought-forward. The valuation
of liabilities in connection with derivatives (fair value hedge accounting) may deviate from this rule.
These liabilities as well as the derivatives themselves are recorded at their fair values. Liabilities
from finance leases are stated at the present value of the future lease payments and shown under
Other financial liabilities.

150 F I N A N C I A L R E P O R T
NOTES TO THE INCOME STATEMENT
SALES REVENUES
Sales revenues by product groups are broken down as follows:
in € million 2013 Share in % 2012 Share in %Change
absoluteChange
in %
Automotive lubricants * 740.8 40.4 719.6 39.5 21.2 3.0
Industrial lubricants and specialties * 1,025.2 56.0 1,038.1 57.1 – 12.9 – 1.2
Other Products 65.6 3.6 61.4 3.4 4.2 6.8
1,831.6 100.0 1,819.1 100.0 12.5 0.7
* and related products.
The main areas of the automotive lubricants product segment are engine oil, gear oil, and shock-ab-
sorber oil. At € 740.8 million (719.6), sales revenues in this segment increased by 3.0 %. The segment
share in Group sales revenues increased to 40.4 % (39.5 %).
The industrial lubricants and specialties product segment mainly comprises metal-working fluids, cor-
rosion preventatives, hydraulic and gear oils, greases, and other specialties. Sales revenues in this
operating segment decreased 1.2 % to €1,025.2 million (1,038.1). At 56.0 % (57.1 %), the segment rep-
resents the largest part of Group sales revenues.
Other products mainly include toll blending, chemical process management and trade activities. This
segment increased by € 4.2 million or 6.8 % to € 65.6 million (61.4).
The development of sales revenues by geographic region can be seen under segment reporting on
pages 124 to 125.
1
segment reporting
124

1513.2 Notes to the consolidated financial statementsF I N A N C I A L R E P O R T
COST OF SALES
in € million 2013 2012
Cost of purchased raw materials, supplies, goods for resale and purchased services 1,038.6 1,054.4
Cost of materials 1,038.6 1,054.4
Personnel costs 54.5 52.9
Depreciation of property, plant and equipment and intangible assets 13.3 12.5
Third party services 12.4 10.8
Energy costs 9.7 9.8
Maintenance costs 7.5 6.8
Other costs 5.7 5.9
1,141.7 1,153.1
SELLING AND DISTRIBUTION EXPENSES
in € million 2013 2012
Personnel costs 104.2 98.4
Freight 63.4 61.5
Commission payments 35.0 36.1
Travel expenses 11.8 12.4
Marketing costs 9.1 9.1
Rental and lease expenses 10.3 9.6
Third party services 10.0 9.1
Depreciation of property, plant and equipment and intangible assets 6.1 6.5
Maintenance costs 2.8 2.9
Taxes 1.5 1.4
Other costs 9.1 9.2
263.3 256.2
Marketing costs also include expenses for car and motorbike sponsoring, participation in trade fairs,
advertising materials, promotional gifts, and advertisements. Third party services comprise services
commissioned for laboratory work, distribution services, trademark management and the operation
of the computer center. Other costs include costs of communication and pro rata insurance premiums.
2
3
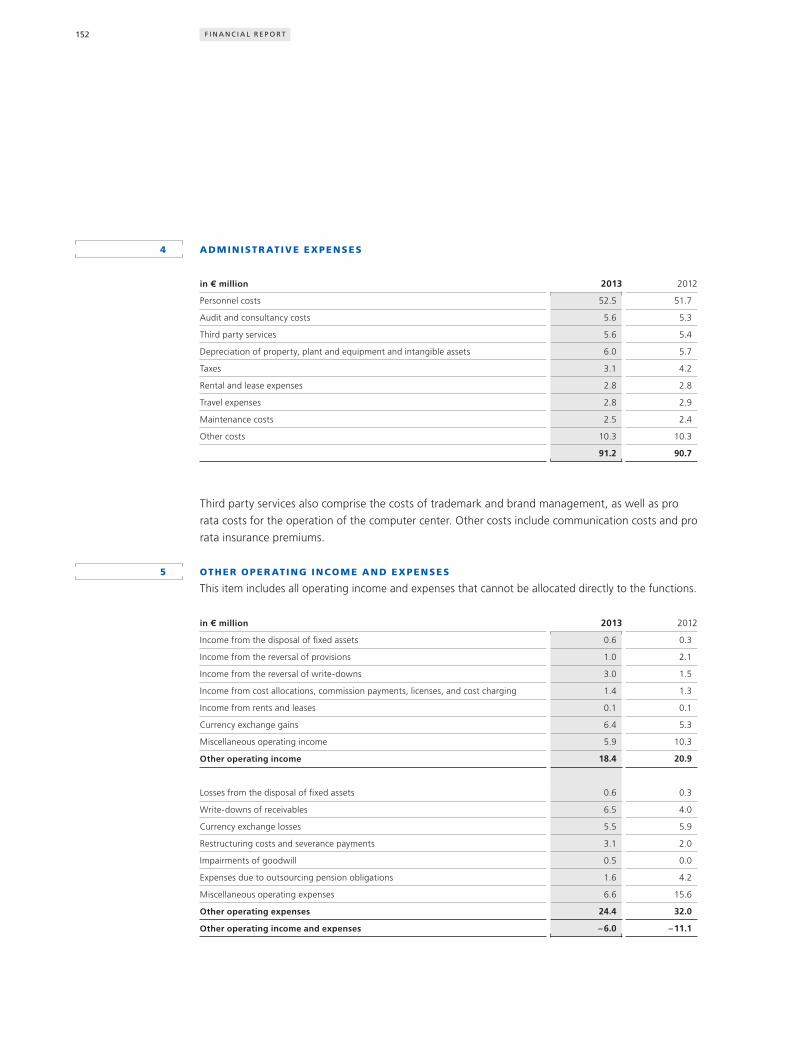
152 F I N A N C I A L R E P O R T
ADMINISTR ATIVE EXPENSES
in € million 2013 2012
Personnel costs 52.5 51.7
Audit and consultancy costs 5.6 5.3
Third party services 5.6 5.4
Depreciation of property, plant and equipment and intangible assets 6.0 5.7
Taxes 3.1 4.2
Rental and lease expenses 2.8 2.8
Travel expenses 2.8 2.9
Maintenance costs 2.5 2.4
Other costs 10.3 10.3
91.2 90.7
Third party services also comprise the costs of trademark and brand management, as well as pro
rata costs for the operation of the computer center. Other costs include communication costs and pro
rata insurance premiums.
OTHER OPER ATING INCOME AND EXPENSES
This item includes all operating income and expenses that cannot be allocated directly to the functions.
in € million 2013 2012
Income from the disposal of fixed assets 0.6 0.3
Income from the reversal of provisions 1.0 2.1
Income from the reversal of write-downs 3.0 1.5
Income from cost allocations, commission payments, licenses, and cost charging 1.4 1.3
Income from rents and leases 0.1 0.1
Currency exchange gains 6.4 5.3
Miscellaneous operating income 5.9 10.3
Other operating income 18.4 20.9
Losses from the disposal of fixed assets 0.6 0.3
Write-downs of receivables 6.5 4.0
Currency exchange losses 5.5 5.9
Restructuring costs and severance payments 3.1 2.0
Impairments of goodwill 0.5 0.0
Expenses due to outsourcing pension obligations 1.6 4.2
Miscellaneous operating expenses 6.6 15.6
Other operating expenses 24.4 32.0
Other operating income and expenses – 6.0 – 11.1
4
5

1533.2 Notes to the consolidated financial statementsF I N A N C I A L R E P O R T
Miscellaneous operating income also includes subsidies, compensation payments received, refund
claims, and income from other sales and services.
Write-downs of receivables include irrecoverable receivables of €1.1 million (1.1).
Among other things, miscellaneous operating expenses include the purchase costs for other sales,
as well as provisions for risks from non-operating items, e. g. environmental commitments. In the pre-
vious year, additions were made to provisions in connection with the legal case concerning the
shareholder dispute at one of the two companies in which the Group holds an interest in the Middle
East.
INCOME FROM COM PANIES CONSOLIDATED AT EQUIT Y
The income from companies consolidated at equity encompasses the proportionate income from
joint ventures and associates.
in € million 2013 2012
Income from companies consolidated at equity 13.5 14.2
F INANCIAL RESULT
in € million 2013 2012
Other interest and similar income
Others (mainly banks) 1.0 1.0
Interest income 1.0 1.0
Interest and similar expenses
Others (mainly banks) – 2.3 – 2.5
Pension obligations
Interest expense – 4.0 – 4.7
Interest income from plan assets 1 3.7 4.2
Interest expenses – 2.6 – 3.0
Net interest income – 1.6 – 2.0
Income from companies consolidated at equity 0.0 0.1
Financial result 1 – 1.6 – 1.9
1 Previous year’s figures adjusted due to the application of IAS 19R, see “Application of new accounting standards”
in the notes to the consolidated financial statements.
6
7

154 F I N A N C I A L R E P O R T
The net interest expenses from defined pension obligations are the balance resulting from interest
expenses of € 4.0 million (4.7) from the interest expense associated with the pension obligations less
interest income of € 3.7 million (4.2) from the return on plan assets. Due to the retroactive appli-
cation of the amendments to IAS 19 (revised), the interest income from the return on plan assets
declined by € 0.3 million in the previous year compared to the originally disclosed figure.
INCOME TA XES
Taxes on income comprise income taxes paid or payable in the various countries, plus deferred taxes.
Calculation of deferred taxes are based on the tax rates expected to apply in the various coun-
tries at the time of realization, based on the tax laws applicable or passed at the balance sheet date.
in € million 2013 2012
Current taxes 88.4 83.8
thereof Germany 32.6 28.4
thereof international 55.8 55.4
Deferred taxes 3.7 0.3
thereof Germany – 1.5 1.3
thereof international 5.2 – 1.0
Total 92.1 84.1
Current taxes comprise € 0.3 million in tax expenses (0.6 tax income) for previous financial years.
The German tax rate is based on the corporation tax rate of 15.83 % and includes the solidarity sur-
charge of 5.5 %. Including trade tax, the total tax burden in Germany is about 30.9 % (30.9 %).
Profits generated by our companies outside Germany are taxed at the respective local rates. The tax
rates applied in the various countries for calculation of deferred taxes range from 12.2 % (12.3 %)
to 38.9 % (38.9 %). The local taxation rates largely decreased over the previous year in Great Britain,
Thailand, and the Ukraine. The local taxation rate increased in Greece.
Tax assets and liabilities are netted to the extent that they relate to the same taxation authority and
may be offset.
8

1553.2 Notes to the consolidated financial statementsF I N A N C I A L R E P O R T
The difference between anticipated and recognized income tax expense is attributable to
the following.
in € million 2013 in % 2012 in %
Earnings before tax (EBT) 310.7 291.1
Expected tax expense 96.0 30.9 90.0 30.9
Taxation rate differences – 3.0 – 1.0 – 4.4 – 1.5
Non-deductible expenses 2.7 0.9 2.2 0.8
Tax-free income – 1.3 – 0.4 – 2.2 – 0.7
Income from companies consolidated at equity – 4.2 – 1.4 – 4.4 – 1.5
Effect of tax loss carryforwards, for which no
deferred tax assets had been recognized 0.0 0.0 0.2 0.0
Taxes for prior periods – 0.5 – 0.2 – 0.6 – 0.2
Withholding taxes 3.4 1.1 2.9 1.0
Other – 1.0 – 0.3 0.4 0.1
Actual tax expense 92.1 29.6 84.1 28.9
The actual tax expense relative to earnings before tax (EBT) leads to a rate of taxation of 29.6 %
(28.9). The Group’s rate of taxation adjusted by the income from companies consolidated at equity
is 31.0 % (30.4).
MINORIT Y INTEREST
Profits attributable to minority interests of € 0.7 million (0.7) relate to shareholders in Austria, Greece,
and France, and in the previous year also to shareholders in Ukraine.
EARNINGS PER SHARE
in € million 2013 2012
Profit attributable to equity holders of FUCHS PETROLUB SE 218.1 206.3
Earnings per ordinary share in €
Earnings per share 3.06 2.90
Weighted average number of ordinary shares 35,480,979 35,490,000
Earnings per preference share in €
Earnings per share 3.08 2.92
Weighted average number of preference shares 35,480,979 35,490,000
9
10

156 F I N A N C I A L R E P O R T
Pursuant to IAS 33, the additional dividend of € 0.02 per share to be distributed to the preference
shareholders is allocated in advance. The remainder of the Group’s profit after taxes and minority
interests is distributed on a weighted basis among the two share classes.
In accordance with IAS 33.20, own shares bought back within the scope of the share buyback program
are not included in the calculation of earnings per share.
Diluted earnings per share are the same as basic earnings per share.
OTHER TA XES
in € million 2013 2012
5.5 6.5
The disclosed figure concerns non-income taxes, which are included in the operating function
costs. € 4.3 million (5.1) of this amount is attributable to foreign Group companies in Argentina, China,
France, Great Britain and the United States.
PERSONNEL EXPENSES / EM PLOYEES
Personnel expenses (in € million) 2013 2012
Wages and salaries 218.2 207.7
Social security contributions and expenses for pensions and similar obligations 37.5 41.4
thereof for pensions 4.2 4.8
255.7 249.1
Pension expenses do not include the interest expense arising from pension provisions, which is
included in the net financial result, nor does it include any income from plan assets for financing
pension obligations.
Number of employees (annual average) 2013 2012
Salaried staff 2,854 2,758
Wage earners 992 996
3,846 3,754
11
12

1573.2 Notes to the consolidated financial statementsF I N A N C I A L R E P O R T
NOTES TO THE BALANCE SHEET
LONG -TERM ASSETS
The composition of the items recognized in the balance sheet as intangible assets, property, plant
and equipment, shares in companies consolidated at equity, and other financial assets, as well as
their development in 2013, are disclosed in the statement of changes in long-term assets on pages
120 and 121.
PROPERT Y, PL ANT AND EQUIPMENT
The additions recorded in 2013 essentially affected the construction of new facilities and production
equipment at the locations in Australia, China, Russia and the United States, as well as investments
in Germany, Poland and Brazil. Property, plant and equipment includes lease assets (finance leases)
totaling € 0.4 million (0.4).
There were no indications of impairment in the reporting year in the impairment tests carried out for
the subsidiaries.
The impairment test method is described in the section “Accounting and valuation methods”.
INTANGIBLE ASSETS
Development of goodwill in 2013
in € million from
Separate financial
statementsBusiness
combinations Total
Historical acquisition costs
Balance at January 1, 2013 40.1 54.3 94.4
Currency translation effects – 2.1 – 0.8 – 2.9
Additions 0.0 0.0 0.0
Disposals 0.0 0.0 0.0
As at December 31, 2013 38.0 53.5 91.5
Accumulated amortization
Balance at January 1, 2013 – 8.6 – 1.0 – 9.6
Currency translation effects 0.6 0.0 0.6
Impairment losses 0.0 – 0.5 – 0.5
Disposals 0.0 0.0 0.0
As at December 31, 2013 – 8.0 – 1.5 – 9.5
Carrying amount as at December 31, 2013 30.0 52.0 82.0
13
Statement of changes in long-term assets
120
14
Accounting and valuation methods
137
15

158 F I N A N C I A L R E P O R T
Development of goodwill in 2012
in € million from
Separate financial
statementsBusiness
combinations Total
Historical acquisition costs
Balance at January 1, 2012 40.6 54.3 94.9
Currency translation effects – 0.6 – 0.5 – 1.1
Additions 0.1 0.5 0.6
Disposals 0.0 0.0 0.0
As at December 31, 2012 40.1 54.3 94.4
Accumulated amortization
Balance at January 1, 2012 – 8.5 – 1.0 – 9.5
Currency translation effects – 0.1 0.0 – 0.1
Impairment losses 0.0 0.0 0.0
Disposals 0.0 0.0 0.0
As at December 31, 2012 – 8.6 – 1.0 – 9.6
Carrying amount as at December 31, 2012 31.5 53.3 84.8
Goodwill of the cash-generating units
Of the € 82.0 million (84.8) in goodwill recognized as at December 31, 2013, € 52.0 million (53.3)
is due to business combinations and € 30.0 million (31.5) is due to separate financial statements of
subsidiaries. Total goodwill of € 67.0 million (68.3), made up of € 41.7 million (41.8) from business
combinations and € 25.3 million (26.5) from goodwill recorded on separate company financial state-
ments, is attributable to the sub-group FUCHS CORPORATION, USA.

1593.2 Notes to the consolidated financial statementsF I N A N C I A L R E P O R T
The remaining goodwill is due to five (six) further cash-generating units.
2013 2012
in € million from
Separate financial
statements
Business combina-
tions Total
Separate financial
statements
Business combina-
tions Total
FUCHS CORPORATION, USA 25.3 41.7 67.0 26.5 41.8 68.3
Five further (in the previous year: six)
cash-generating units 4.7 10.3 15.0 5.0 11.5 16.5
Goodwill 30.0 52.0 82.0 31.5 53.3 84.8
Goodwill is not subject to any scheduled amortization, but undergoes an impairment test at least
once a year in line with IAS 36 and also whenever there are indications of an impairment. Impairment
losses are recognized as and when appropriate.
An impairment is to be recognized if the carrying amount of the cash-generating unit’s net assets,
including assigned goodwill, exceeds the recoverable amount. A cash-generating unit is generally
formed by a subsidiary. The recoverable amount was determined using the concept of value in use.
A discounted cash flow method is used to determine the value in use. The subsidiaries’ mid-term plan-
ning, which generally consists of the budget plan 2014 and the plan years 2015 and 2016, serves
as the basis for planning for the cash flows. The planning is based on past experience, the current
operating results, and the best possible estimate of corporate management regarding future
developments. The projected figures are based on detailed individual budgets and their extrapolation.
These incorporate growth rate assumptions, which take into account the conditions in the local
sales markets at the time of budget drafting, current expectations regarding price trends in the pro-
curement markets and inflation expectations. Alongside inflation and country risks, local taxation
rates are also considered in the discount rate.
160 F I N A N C I A L R E P O R T
For the time period following mid-term planning, a terminal value is extrapolated based on the
last detailed planning year. When determining the terminal value, country-specific growth rates of
between 0.5 % (0.5 %) and 1.0 % (1.0 %) are taken into account as inflation-based growth. The
impairment tests performed by the FUCHS CORPORATION, USA are based on the assumption of a
long-term, country-specific growth rate of 0.5 % (0.5 %).
The discount rate is a weighted average cost of capital (WACC), which is made up of the costs of bor-
rowed capital and equity capital weighted with the capital structure. The shareholders’ equity
costs are determined from capital market data using the Capital Asset Pricing Model (CAPM) and
are made up of a risk-free interest rate and a risk premium (consisting of the market risk pre-
mium and beta factor). When determining the value in use of the individual cash-generating units,
discount rates of between 8.0 % (8.0 %) and 14.0 % (13.0 %) after taxes were applied, taking into
account country-specific risks. A weighted cost of capital of 8.0 % (8.0 %) after taxes was taken into
account in the impairment tests performed at FUCHS CORPORATION, United States.
Impairment losses for goodwill of € 0.5 million were charged in the financial year 2013 for one
European subsidiary and are recorded under other operating expenses. There were no impairment
losses in the previous year.
To take into account potential deviations in the key assumptions, sensitivities were calculated and a
20 % reduction in future cash flows assumed. Based on previous experience we believe that larger
variations are unlikely. If actual cash flows were 20 % lower than cash flows assumed in impairment
tests, this would not lead to any impairment loss in the Group’s goodwill.
Industrial property rights and similar values
Intangible assets also include industrial property rights and similar rights and assets. These consist
mainly of capitalized licenses for computer software, acquired formulas and product technolo gies,
restraints on competition, and acquired customer lists. These rights and assets amount to € 26.1 million
(27.6) in total. Intangible assets comprises advance payments of € 0.1 million (0.3).

1613.2 Notes to the consolidated financial statementsF I N A N C I A L R E P O R T
SHARES IN COM PANIES CONSOLIDATED AT EQUIT Y
This item is made up of five companies consolidated at equity. For the measurement using the equity
method the proportionate equity was determined on the basis of financial statements prepared
in accordance with the respective national legislation adapted in line with the requirements of IFRS.
For the three associated companies, the assets (100 % values) were €133.5 million (136.4), while
liabilities were € 30.5 million (45.4). Sales revenues of € 234.1 million (264.8) were generated and the
net profit for 2013 was € 32.7 million (38.6).
The two joint ventures, which are also consolidated at equity, recorded the following figures
(100 % values):
in € million 2013 2012
Total of all short-term assets 51.7 56.7
Total of all long-term assets 31.3 33.9
Assets as at December 31 83.0 90.6
Total of all short-term liabilities 54.4 61.2
Total of all long-term liabilities 0.1 0.2
Liabilities as at December 31 54.5 61.4
Total of all income 115.1 115.8
Total of all expenses 108.3 113.7
OTHER F INANCIAL ASSETS
This item includes shares in affiliated companies not consolidated, investments in and loans to
PARTIC IPAT ION INTEREST, long-term securities, and other loans. In accordance with their financing
nature, the long-term portion of the receivables relating to delivery agreements in France of
€ 3.4 million (2.4) is disclosed under Other loans.
The statement of changes in long-term assets on pages 120 and 121 shows the changes in and the
amount of the individual items.
16
17
Glossary page 209
a–z
Statement of changes in long-term assets
120

162 F I N A N C I A L R E P O R T
DEFERRED TA X ASSETS AND L IABIL IT IES
The deferred taxes recognized in the balance sheet result from the following temporary differences
and items:
in € million
D E F E R R E D TA X A S S E T S D E F E R R E D TA X L I A B I L I T I E S
2013 2012 2013 2012
Property, plant and equipment 1.2 0.9 10.9 10.0
Other long-term assets 3.5 1.4 8.0 7.8
Inventories 6.9 6.2 0.2 0.1
Other short-term assets 2.0 5.9 0.6 0.8
Long-term provisions 11.4 15.9 0.6 1.7
Other long-term liabilities 0.4 0.5 4.1 4.1
Short-term provisions and liabilities 6.4 5.4 0.6 0.9
Expected use of loss carryforwards 0.0 0.0 0.0 0.0
Sum of deferred taxes asset / liability 31.8 36.2 25.0 25.4
Tax offset – 6.3 – 6.4 – 6.3 – 6.4
Total assets / liabilities 25.5 29.8 18.7 19.0
Deferred tax assets of € 25.5 million (29.8) are essentially attributable to measurement differences
between the carrying amounts of inventories (elimination of intercompany profits), other short-
term assets, pension obligations, and short-term provisions and liabilities in the IFRS balance sheet
and their tax base. The deferred tax liabilities essentially result from temporary differences between
the carrying amounts of long-term assets in the IFRS balance sheet and their tax base (different depre-
ciation methods and useful lives).
Tax loss carryforwards in the Group amount to € 2.6 million (3.2). The deferred tax assets of
€ 0.8 million (1.0) recognized in this connection are impaired as it is not probable that loss carryfor-
wards will be utilized in the foreseeable future.
A deferred tax liability of € 4.1 million (4.1) is recorded for future tax burdens from planned dividend
payments from foreign subsidiaries. In addition, there are further retained earnings at the subsid-
iaries of € 303.4 million (248.7) which are to remain invested permanently and consequently will not
result in a deferred tax debt.
18

1633.2 Notes to the consolidated financial statementsF I N A N C I A L R E P O R T
The change in the net amount of deferred taxes is – € 4.0 million (3.3) in the year under review.
Taking into account the deferred taxes for the financial year 2013 recognized directly in equity and
resulting essentially from the allocation of pension obligations of € 0.1 million (3.0), the deferred
tax expense reported in the income statement amounts to € 3.7 million (0.3) after allowing for cur-
rency effects.
LONG -TERM OTHER REC EIVABLES AND OTHER ASSETS
in € million Dec. 31, 2013 Dec. 31, 2012
Asset surplus arising from the netting of pension provisions with associated plan assets 0.0 0.1
Other assets 0.5 0.7
0.5 0.8
INVENTORIES
Inventories comprise the following:
in € million Dec. 31, 2013 Dec. 31, 2012
Raw materials and supplies 94.5 97.2
Work in progress 11.7 13.6
Finished goods and merchandise 126.2 128.5
232.4 239.3
Write-downs of inventories totaling € 0.7 million (0.3) were recognized in the income statement in
the year under review due to reduced salability. On the balance sheet date, the residual carry-
ing amount of inventories that were written down amounted to € 2.5 million (2.3). Inventories of
€1,038.6 million (1,054.4) were recorded as costs of materials in the reporting period.
TR ADE REC EIVABLES
in € million Dec. 31, 2013 Dec. 31, 2012
Receivables due from affiliated companies 0.2 0.2
Receivables due from joint ventures and associated companies 2.3 1.3
Receivables due from other companies 257.9 248.9
260.4 250.4
19
20
21
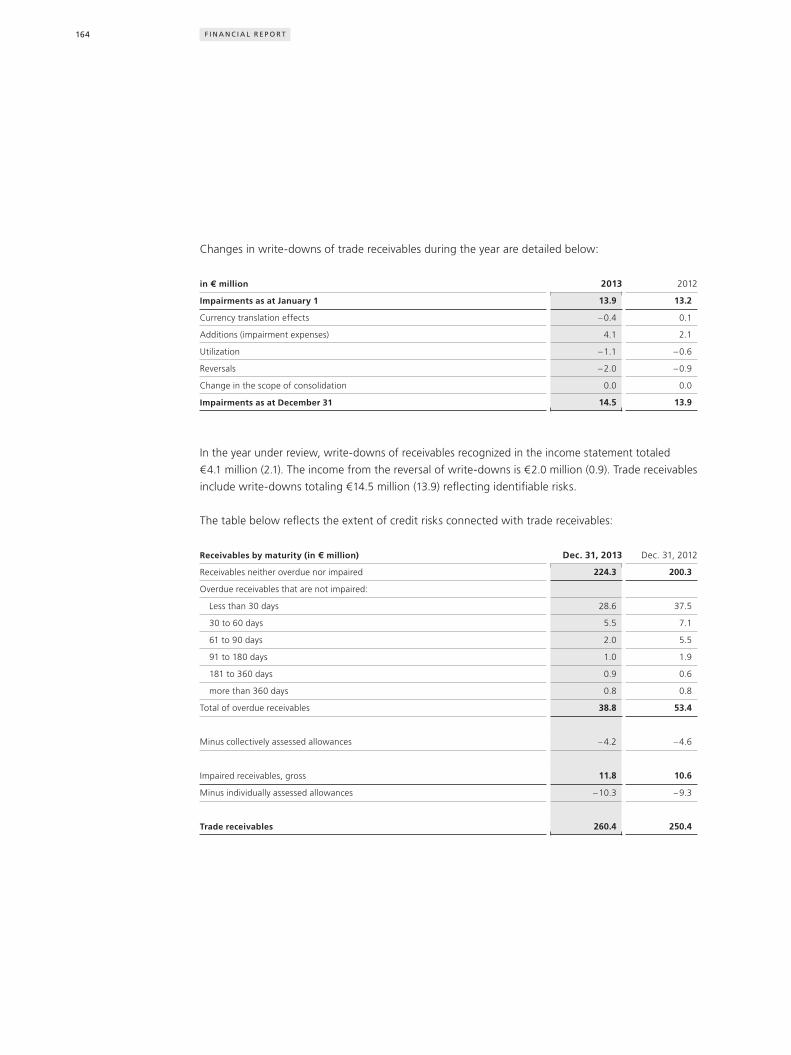
164 F I N A N C I A L R E P O R T
Changes in write-downs of trade receivables during the year are detailed below:
in € million 2013 2012
Impairments as at January 1 13.9 13.2
Currency translation effects – 0.4 0.1
Additions (impairment expenses) 4.1 2.1
Utilization – 1.1 – 0.6
Reversals – 2.0 – 0.9
Change in the scope of consolidation 0.0 0.0
Impairments as at December 31 14.5 13.9
In the year under review, write-downs of receivables recognized in the income statement totaled
€ 4.1 million (2.1). The income from the reversal of write-downs is € 2.0 million (0.9). Trade receivables
include write-downs totaling €14.5 million (13.9) reflecting identifiable risks.
The table below reflects the extent of credit risks connected with trade receivables:
Receivables by maturity (in € million) Dec. 31, 2013 Dec. 31, 2012
Receivables neither overdue nor impaired 224.3 200.3
Overdue receivables that are not impaired:
Less than 30 days 28.6 37.5
30 to 60 days 5.5 7.1
61 to 90 days 2.0 5.5
91 to 180 days 1.0 1.9
181 to 360 days 0.9 0.6
more than 360 days 0.8 0.8
Total of overdue receivables 38.8 53.4
Minus collectively assessed allowances – 4.2 – 4.6
Impaired receivables, gross 11.8 10.6
Minus individually assessed allowances – 10.3 – 9.3
Trade receivables 260.4 250.4

1653.2 Notes to the consolidated financial statementsF I N A N C I A L R E P O R T
SHORT-TERM TA X REC EIVABLES ( INCOME TA X)
This item comprises tax refund claims which are mainly attributable to Argentinian, German, Italian
and American income taxes.
SHORT-TERM OTHER REC EIVABLES AND OTHER ASSETS
in € million Dec. 31, 2013 Dec. 31, 2012
Receivables due from joint ventures and associated companies 0.2 0.3
Tax receivables (transaction tax) 3.8 2.1
Sundry other assets 16.5 29.2
20.5 31.6
At € 3.0 million (1.8), tax receivables predominantly concern VAT receivables.
The Group’s sundry other assets include customer loans of € 2.6 million (3.4) in connection with
delivery agreements in France. The long-term part of this loan is disclosed under Other long-term
financial assets. This item for 2012 also includes €14.0 million that was held on a fiduciary basis
for an associated company in the Middle East. These were repaid in 2013. The same amount was also
recognized on the assets side under Liabilities due to associated companies in the previous year.
In addition to this, other assets include forward currency transactions with positive fair values of
€1.3 million (0.0). Other assets also include advance rental payments, prepaid expenses, refund
claims, and other customer loans, and receivables from other sales. Total impairments of € 4.5 million
(4.1) are taken into account here.
C ASH AND C ASH EQUIVALENTS
Cash and cash equivalents of €175.2 million (143.7) comprise bank deposits with a maturity of less
than three months, checks and bills of exchange not yet presented, and cash in hand.
22
23
Note 17
161
24

166 F I N A N C I A L R E P O R T
SHAREHOLDERS’ EQUIT Y
A solid equity capital backing is indispensable for the continued existence of the company. Gear-
ing (the ratio of financial liabilities minus cash and cash equivalents to shareholders’ equity) and the
equity ratio are important indicators of the capital structure.
Subscribed capital
The subscribed and fully paid capital of FUCHS PETROLUB SE remained unchanged during the
reporting year.
in € million
As at December 31, 2013 (in € million) 71.0
Consisting of
35,490,000 ordinary shares at €1 each = € 35,490,000
35,490,000 preference shares at €1 each = € 35,490,000
The shares of FUCHS PETROLUB SE are bearer shares. Each ordinary share carries one vote at the
Annual General Meeting. The preference shares carry no voting rights, except in cases prescribed
by law. Under the Articles of Association, each preference share receives a premium of € 0.02 per share
compared to an ordinary share.
Authorized capital amounts to € 35.5 million. Authorized capital expires on May 5, 2014 and enti-
tles the Executive Board to increase the share capital, with the consent of the Supervisory Board, one
or more times by issuing up to 35,490,000 new no-par value shares (ordinary and / or preference
shares without voting rights) against cash or contributions in kind. In the financial year 2013, no use
was made of the authorization granted by the Annual General Meeting on May 6, 2009.
25

1673.2 Notes to the consolidated financial statementsF I N A N C I A L R E P O R T
Share buyback program
On November 26, 2013, the Executive Board at FUCHS PETROLUB SE passed a resolution, exer-
cising the authorization issued by the Annual General Meeting on May 5, 2010, to acquire a
maximum of one million ordinary and preference shares in the company for a total purchase price
of up to €100 million, i. e. a maximum of 10 % of the share capital in place when the resolution
was passed. All transactions in connection with the share buyback program are published on a weekly
basis on the FUCHS PETROLUB SE website under “Investor Relations / Share buyback program”.
Furthermore, the Executive Board intends to propose a capital increase from corporate funds to
the Annual General Meeting on May 7, 2014. This capital increase would involve issuing bonus shares
at a ratio of 1:1. The share buyback and the proposal to issue bonus shares are an expression
of the Executive Board’s confidence in the future economic development of the FUCHS Group. This
should also result in an increased trading liquidity of the FUCHS shares.
FUCHS PETROLUB commenced the buyback of its own shares on November 27, 2013 and will com-
plete the buyback process by March 31, 2015.
The shares will be acquired for the purpose of redemption based on the authorization resolution of
the Annual General Meeting from May 5, 2010.
In the period from November 27, 2013 to December 31, 2013, the company bought back a total
of 338,470 own shares. 169,235 ordinary shares at a total value of €10.2 million (average price per
share: € 60.14) and 169,235 preference shares with a total value of €11.8 million (average price
per share: € 69.65) were purchased. The buybacks represent 0.48 % of the company’s share capital as
at December 31, 2013. The treasury stock has not yet been redeemed.
The € 22.0 million spent, including transaction costs, has been deducted from shareholders’ equity.
Pursuant to IAS 33.20, the shares bought back are no longer taken into account when calculating the
earnings per share.

168 F I N A N C I A L R E P O R T
The number of outstanding shares is therefore:
Number of shares Dec. 31, 2013 Dec. 31, 2012
Ordinary shares 35,320,765 35,490,000
Preference shares 35,320,765 35,490,000
Total 70,641,530 70,980,000
Group reserves
This item consists of the capital reserves of FUCHS PETROLUB SE (agio), the unappropriated
profi ts and currency reserves as well as the remeasured net debt resulting from the defined pension
obligations of the companies included in the consolidated financial statements. The unappropri-
ated profits contain the profits generated in the past to the extent that these were not distributed.
Differences arising from translation of the financial statements of foreign subsidiaries as well as
joint ventures and associated companies consolidated at equity are taken directly to equity and car-
ried under currency reserves.
Group reserves do not include net profit after tax, which is shown in the Group profits item.
Group profits
Group profits correspond to the Group’s net profits after taxes and minority interests.
Proposal on the appropriation of profits at FUCHS PETROLUB SE
The Executive Board will recommend to the Supervisory Board that it presents the following dividend
proposal at the 2014 Annual General Meeting: €1.38 per ordinary share entitled to dividend and
€1.40 per preference share entitled to dividend. Dividends of €1.28 per ordinary share and €1.30 per
preference share were paid for the financial year 2012.
If the company holds additional own shares not entitled to dividends on the day of the Annual
General Meeting, the proposed resolution will be changed to the effect that the amounts attributable
to these shares will be carried forward to new account.
Non-controlling interests
This item contains the shareholders’ equity and earnings of consolidated subsidiaries attributable
to minority interests. The €1.0 million attributable to minority interests (1.6) relate to shareholders in
Austria, Greece, and France; In the previous year, it also affected shareholders in the Ukraine.
Balance sheet
117

1693.2 Notes to the consolidated financial statementsF I N A N C I A L R E P O R T
PENSION PROVIS IONS
Pension provisions are recognized for obligations arising from entitlements to future benefits and from
current benefits paid to former employees of the FUCHS PETROLUB Group and their surviving
dependents. The occupational pension plans in place within the Group are financed by provisions
and funds and consist of defined contribution and defined benefit plans.
The provisions recognized in the balance sheet are determined in accordance with IAS 19, with
measurement based on actuarial opinions. The provisions are calculated using the projected unit credit
method. Besides basic biometric data and the current long-term capital market interest rate,
assumptions with regard to future salary and pension increases are also factored in. In Germany, the
biometric data is based on the 2005 G mortality tables by Prof. Dr. Klaus Heubeck.
For details on the effects of the first-time adoption of IAS 19 (revised 2011) “Employee Benefits” from
January 1, 2013, please refer to the section entitled “Application of new accounting standards”.
As of 2008, changes resulting from the remeasurement of net debt are recognized directly in
equity in the period in which they occur and are offset against Group reserves. These adjustments
are set out in the statement of changes in equity of the Group on page 118.
In Germany, measurement is based on the following assumptions:
in % 2013 2012
Discount rate 3.5 3.3
Salary trend 2.5 2.5
Pension trend 1.8 1.8
Return on plan assets 1 3.3 4.6
1 Previous year’s figures adjusted due to the application of IAS 19R, see “Application of new accounting standards”
in the notes to the consolidated financial statements.
26
Statement of changes in shareholders’ equity
118
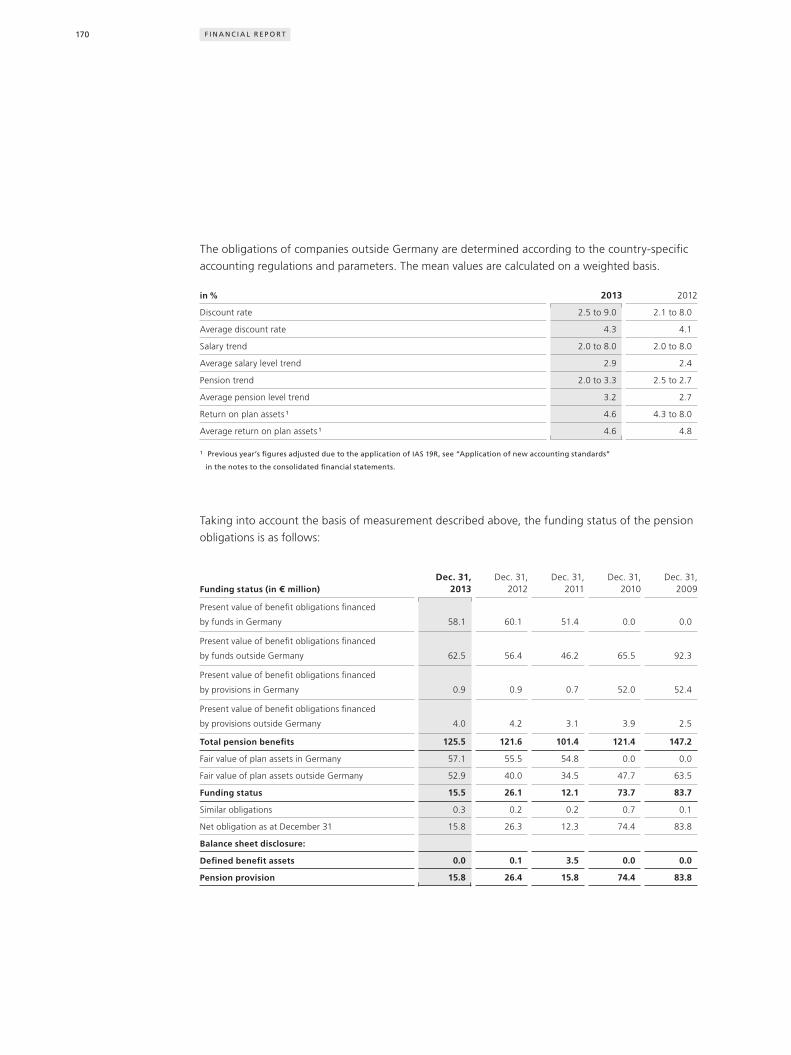
170 F I N A N C I A L R E P O R T
The obligations of companies outside Germany are determined according to the country-specific
accounting regulations and parameters. The mean values are calculated on a weighted basis.
in % 2013 2012
Discount rate 2.5 to 9.0 2.1 to 8.0
Average discount rate 4.3 4.1
Salary trend 2.0 to 8.0 2.0 to 8.0
Average salary level trend 2.9 2.4
Pension trend 2.0 to 3.3 2.5 to 2.7
Average pension level trend 3.2 2.7
Return on plan assets 1 4.6 4.3 to 8.0
Average return on plan assets 1 4.6 4.8
1 Previous year’s figures adjusted due to the application of IAS 19R, see “Application of new accounting standards”
in the notes to the consolidated financial statements.
Taking into account the basis of measurement described above, the funding status of the pension
obligations is as follows:
Funding status (in € million)Dec. 31,
2013Dec. 31,
2012Dec. 31,
2011Dec. 31,
2010Dec. 31,
2009
Present value of benefit obligations financed
by funds in Germany 58.1 60.1 51.4 0.0 0.0
Present value of benefit obligations financed
by funds outside Germany 62.5 56.4 46.2 65.5 92.3
Present value of benefit obligations financed
by provisions in Germany 0.9 0.9 0.7 52.0 52.4
Present value of benefit obligations financed
by provisions outside Germany 4.0 4.2 3.1 3.9 2.5
Total pension benefits 125.5 121.6 101.4 121.4 147.2
Fair value of plan assets in Germany 57.1 55.5 54.8 0.0 0.0
Fair value of plan assets outside Germany 52.9 40.0 34.5 47.7 63.5
Funding status 15.5 26.1 12.1 73.7 83.7
Similar obligations 0.3 0.2 0.2 0.7 0.1
Net obligation as at December 31 15.8 26.3 12.3 74.4 83.8
Balance sheet disclosure:
Defined benefit assets 0.0 0.1 3.5 0.0 0.0
Pension provision 15.8 26.4 15.8 74.4 83.8

1713.2 Notes to the consolidated financial statementsF I N A N C I A L R E P O R T
The key pension plan provisions are described in the following:
In Germany, defined benefit occupational pension provision plans are in place for some of the
employees working for German Group companies. The benefits are generally based on the term of
employment and fixed amounts or the final salary of the beneficiary. The benefits comprise an
old-age pension, disability pension and survivors’ pension. The domestic defined benefit pension plans
have in principle been closed since 1983.
Following transfer to an external pension provider (ALLIANZ) in 2011, virtually all domestic (Ger-
man) pension obligations, which were up to then financed by provisions, were assigned to pension
obligations financed by funds. The remaining amount is funded by provisions. The transfer com-
prises a combined model, made up of transferal of already vested benefits in the ALLIANZ pension
fund and future benefits still to be vested in the ALLIANZ relief fund.
In addition to this, employee-financed benefit obligations from the so-called “deferred compen-
sation program” are also in place in Germany. As at December 31, 2013, benefit obligations amount
to € 5.3 million (5.0), which are offset against assets of € 5.0 million (4.8) in the consolidated bal-
ance sheet. The € 0.3 million balance (0.2) of obligations and asset values is disclosed under “Similar
obligations”.
Where occupational pension plans are in place at Group companies outside Germany, these are
fund-financed provision systems with “defined benefit” commitments and, in some cases, “defined
contribution” commitments.
Meanwhile, contribution-based plans have been introduced for new pension commitments in the
United States and Great Britain. Existing defined benefit obligations in the US were frozen in
2009 and transferred to a defined contribution system. The plan termination and payment of these
balances in the United States took place in 2011.
The pension obligations financed by funds outside Germany concern our companies in Great Britain.
The occupational pension provision schemes based on defined benefit obligations arise from a
performance-based provision plan based on years of service and final salary, which is now closed.
The benefits comprise an old-age pension and survivors’ pension. These are financed via a fund,
which is independent from the company. The fund manager is legally obliged to act in the interests
of the beneficiaries and specifies the goals and strategies of the fund, for example the invest-
ment policy, premium contributions or indexing. Both employer and employee pay premiums into
the fund.

172 F I N A N C I A L R E P O R T
The following table shows the development in the present value of benefit obligations:
Benefit obligations (in € million) 2013 2012
Present value as at January 1 121.6 101.4
Currency effects – 1.4 1.5
Current service cost 1.7 1.5
Past service cost 0.0 0.0
Interest expense 4.0 4.7
Remeasurements
Actuarial losses due to financial assumptions 1.2 13.4
Actuarial losses due to demographic assumptions 1.2 0.0
Actuarial losses and gains due to experience adjustments 0.4 – 0.8
Outsourcing to external pension provider (Great Britain) 1.6 4.2
Benefits paid – 4.8 – 4.3
Present value as at December 31 125.5 121.6
Netting with plan assets 110.0 95.5
Similar obligations 0.3 0.2
Net obligation as at December 31 15.8 26.3
Thereof
Pension provision 15.8 26.4
Defined benefit assets 0.0 0.1
For the proportion of pension obligations attributable to pensioners at FUCHS LUBRICANTS UK a
decision was taken to transfer these to an insurance company.

1733.2 Notes to the consolidated financial statementsF I N A N C I A L R E P O R T
Sensitivity analyses
If all other assumptions remained constant, a 0.5 % change to the discount rate and a 0.25 %
change to the wage / salary or pension developments would have the following effects on the pres-
ent value of benefit obligations at the end of the current financial year:
Effects (in € million) Germany International Total
Effects on the present value of defined benefit
obligations due to
Changes in the discount rate
Increase by 0.5 % points – 3.7 – 3.7 – 7.4
Decrease by 0.5 % points 4.2 4.2 8.4
Change in anticipated wage / salary developments
Increase by 0.25 % points 0.7 1.0 1.7
Decrease by 0.25 % points – 0.5 – 1.0 – 1.5
Change in anticipated pension developments
Increase by 0.25 % points 1.4 1.4 2.8
Decrease by 0.25 % points – 1.2 – 1.4 – 2.6
As at December 31, 2013, the weighted average term of defined benefit obligations was 12.3 years
(13.3) for plans in Germany and 22 years (21) for plans outside Germany.
Additional life expectancy of one year would lead to an increase in the present value of the bene-
fit obligations of €1.9 million, of which €1.0 million is attributable to plans in Germany and € 0.9 mil-
lion is due to plans outside Germany.
Changes to plan assets during the year are detailed below:
Plan assets (in € million) 2013 2012
Fair value as at January 1 95.5 89.3
Currency effects – 0.8 1.1
Interest income from plan assets 1 3.7 4.2
Running contributions 6.4 4.5
Special payments to the funds outside Germany 8.3 0.0
Benefits paid – 4.8 – 4.3
Remeasurements
Actuarial gains and losses due to financial assumptions 1 2.2 0.7
Actuarial losses due to experience adjustments – 0.5 0.0
Market value as at December 31 110.0 95.5
1 Previous year’s figures adjusted due to the application of IAS 19R, see “Application of new accounting standards”
in the notes to the consolidated financial statements.

174 F I N A N C I A L R E P O R T
To finance the transfer of defined benefit obligations at the companies in Great Britain to an insur-
ance company, special payments of € 8.3 million were made into plan assets.
The fair value of the plan assets is spread over the following asset classes:
D E C . 3 1 , 2 0 1 3 D E C . 3 1 , 2 0 12
in € million
Market price quotation
in an active market
No market price quo-
tation in an active market Total
Market price quotation
in an active market
No market price quo-
tation in an active market Total
Insurance policies 80.5 80.5 55.5 55.5
Equity instruments 23.5 23.5 24.9 24.9
Debt instruments 5.8 5.8 12.4 12.4
Raw material funds 0.0 0.0 0.0 2.6 2.6
Cash and cash equivalents 0.0 0.2 0.2 0.1 0.1
Fair value of plan assets 29.3 80.7 110.0 40.0 55.5 95.5
The German plan assets are financed solely by insurance policies with ALLIANZ life insurance.
The return on plan assets for the year 2013 was based on the discount rate of 3.3 % (4.6). The actual
return on plan assets calculated was 2.8 % (3.5 %). A limited risk of a supplementary financing
requirement can occur due to the selected ALLIANZ insurance tariff (risk-opportunity portfolio) in the
event of a decrease in the overall interest rate.
The plan assets in Great Britain comprise insurance policies, equity instruments, debt instruments,
cash and cash equivalents and, in the previous year, also raw material funds. The return on plan
assets was based on an average rate of 4.6 % (4.8 %). The average actual return on plan assets was
13.9 % (8.3 %).
Total running contributions of € 3.6 million (3.3) are budgeted for 2014 in Germany and abroad. Stat-
utory minimum funding requirements are taken into account in Great Britain. FUCHS LUBRICANTS UK
has made a commitment to make annual payments of at least €1.6 million, with an annual rate
of increase of 3 %, into the funds as of December 31, 2013 for a period of 7 years and 10 months.

1753.2 Notes to the consolidated financial statementsF I N A N C I A L R E P O R T
Asset-liability matching strategy
The asset-liability matching strategy employed at FUCHS aims for the most congruent financing
of pension obligations possible. Key elements are a comparable maturity profile of assets and liabil-
ities, as well as (where technically feasible and financially prudent) coverage of longevity risks.
This explains the high proportion of insurance policies. These allow the longevity risk to be covered,
coupled with reduced VOL ATIL IT Y of the assets.
73 % of plan assets are invested in insurance policies. There are no market price quotations for these in
an active market. The asset-liability matching strategy is reviewed annually by the fund manager.
Market prices are available for equity and debt instruments. Around 22 % of plan assets is invested in
equity instruments, while a further 5 % is invested in debt instruments. The fund managers pursue
risk reduction strategies through use of swaps and index-linked instruments. The mix of equity and
debt instruments takes into account the maturity profile of the pension obligations. A regular
review of the asset-liability matching strategy can potentially also lead to a revision of the asset mix.
Pension expenses arising from the pension plans in place within the FUCHS PETROLUB Group amount
to €10.6 million (13.2) and are made up of the following components:
Total pension expense (in € million) 2013 2012 1
Current service cost 1.7 1.5
Interest expense 4.0 4.7
Interest income from plan assets – 3.7 – 4.2
Outsourcing to external pension provider (Great Britain) 1.6 4.2
Expenses for defined benefit pension plans 3.6 6.2
Expenses for defined contribution pension plans 7.0 7.0
Total pension expense 10.6 13.2
1 Previous year’s figures adjusted due to the application of IAS 19R, see “Application of new accounting standards”
in the notes to the consolidated financial statements.
Glossary page 209
a–z

176 F I N A N C I A L R E P O R T
The net interest expense from defined pension obligations amounting to € 0.3 million (0.5) is the bal-
ance resulting from interest expenses of € 4.0 million (4.7) from the interest expense associated
with the pension obligations less interest income of € 3.7 million (4.2) from the return on plan assets.
Due to the retroactive application of the amendments to IAS 19 (revised), the interest income
from the return on plan assets declined by € 0.3 million in the previous year compared to the originally
disclosed figure.
In the context of the approved transfer of defined benefit obligations in Great Britain, expenses of
€1.6 million (4.2) were accrued. These expenses are recorded under other operating expenses.
At € 3.8 million (3.8), the share of pension contributions paid by the employer in Germany has been
included in defined contribution pension plans.
Pension expenses and benefit payments also include the payments for the defined contribution
pension plans.
Pension expense breaks down among the following functions or cost types:
Total pension expense (in € million) 2013 2012
Cost of sales 1.9 1.9
Research & development expenses 0.9 0.9
Selling and distribution expenses 2.6 2.9
Administrative expenses 3.3 2.8
Other operating expenses 1.6 4.2
Financial result 1 0.3 0.5
Total pension expense 1 10.6 13.2
1 Previous year’s figures adjusted due to the application of IAS 19R, see “Application of new accounting standards”
in the notes to the consolidated financial statements.
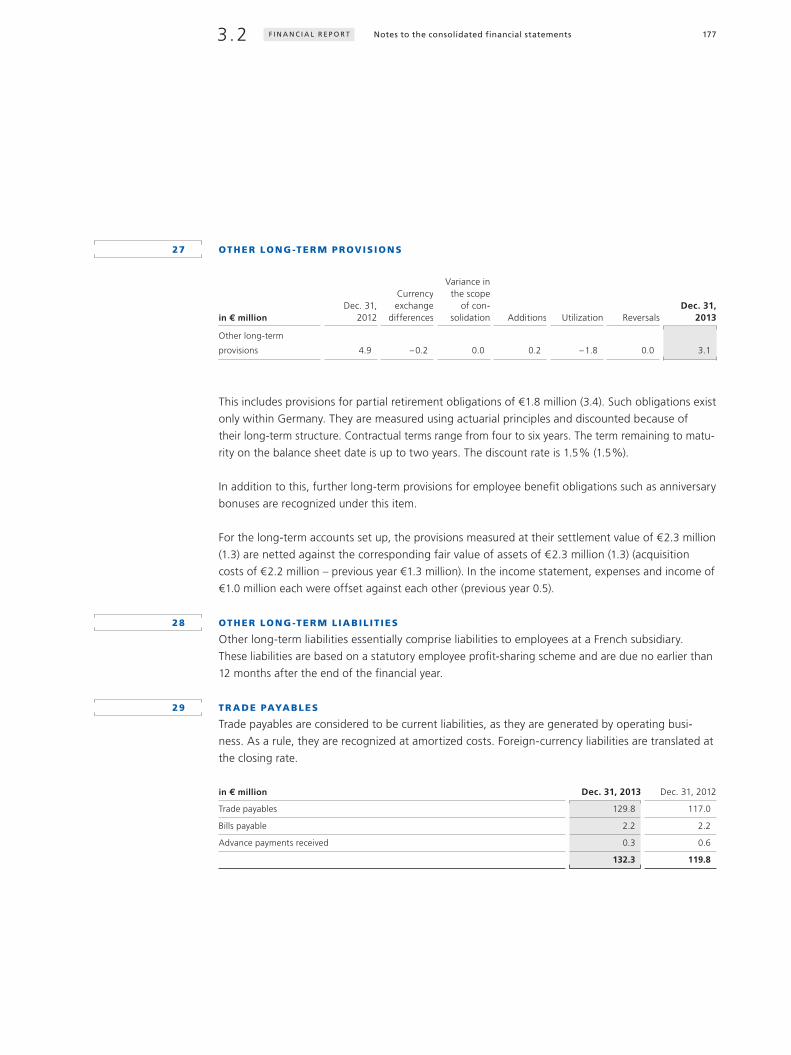
1773.2 Notes to the consolidated financial statementsF I N A N C I A L R E P O R T
OTHER LONG -TERM PROVIS IONS
in € millionDec. 31,
2012
Currency exchange
differences
Variance in the scope
of con-solidation Additions Utilization Reversals
Dec. 31, 2013
Other long-term
provisions 4.9 – 0.2 0.0 0.2 – 1.8 0.0 3.1
This includes provisions for partial retirement obligations of €1.8 million (3.4). Such obligations exist
only within Germany. They are measured using actuarial principles and discounted because of
their long-term structure. Contractual terms range from four to six years. The term remaining to matu-
rity on the balance sheet date is up to two years. The discount rate is 1.5 % (1.5 %).
In addition to this, further long-term provisions for employee benefit obligations such as anniversary
bonuses are recognized under this item.
For the long-term accounts set up, the provisions measured at their settlement value of € 2.3 million
(1.3) are netted against the corresponding fair value of assets of € 2.3 million (1.3) (acquisition
costs of € 2.2 million – previous year €1.3 million). In the income statement, expenses and income of
€1.0 million each were offset against each other (previous year 0.5).
OTHER LONG -TERM L IABIL IT IES
Other long-term liabilities essentially comprise liabilities to employees at a French subsidiary.
These liabilities are based on a statutory employee profit-sharing scheme and are due no earlier than
12 months after the end of the financial year.
TR ADE PAYABLES
Trade payables are considered to be current liabilities, as they are generated by operating busi-
ness. As a rule, they are recognized at amortized costs. Foreign-currency liabilities are translated at
the closing rate.
in € million Dec. 31, 2013 Dec. 31, 2012
Trade payables 129.8 117.0
Bills payable 2.2 2.2
Advance payments received 0.3 0.6
132.3 119.8
27
28
29

178 F I N A N C I A L R E P O R T
SHORT-TERM PROVIS IONS
Short-term provisions mainly consist of the following:
in € million Dec. 31, 2013 Dec. 31, 2012
Warranty 0.8 0.8
Costs for preparing the annual financial statements 1.5 1.5
Credit notes and bonuses 2.6 3.0
Restructuring work and redundancy payments 1.2 1.5
Environmental obligations 6.0 5.4
Supervisory Board compensation 0.5 0.5
Other obligations 14.8 15.2
27.4 27.9
Changes to short-term provisions during the year are detailed below:
in € millionDec. 31,
2012
Currency exchange
differences Additions Utilization ReversalsDec. 31,
2013
Warranty 0.8 0.0 0.1 0.0 0.1 0.8
Costs for preparing the annual
financial statements 1.5 – 0.1 1.6 1.5 0.0 1.5
Credit notes and bonuses 3.0 – 0.3 2.9 3.0 0.0 2.6
Restructuring work and
redundancy payments 1.5 0.0 0.3 0.6 0.0 1.2
Environmental obligations 5.4 – 0.4 1.7 0.7 0.0 6.0
Supervisory Board compensation 0.5 0.0 0.5 0.5 0.0 0.5
Other obligations 15.2 – 0.9 11.1 9.7 0.9 14.8
27.9 – 1.7 18.2 16.0 1.0 27.4
The provisions for restructuring work and redundancy payments contain redundancy payments for
employees leaving the company, as well as expected costs for site closures.
The provisions for environmental obligations focus on rehabilitation work at contaminated sites and
cover costs associated with the elimination of soil contamination.
Other obligations also include provisions for contractual risks, premium payment obligations, discounts
and costs of legal proceedings.
Interest has not been accrued for any short-term provisions.
30
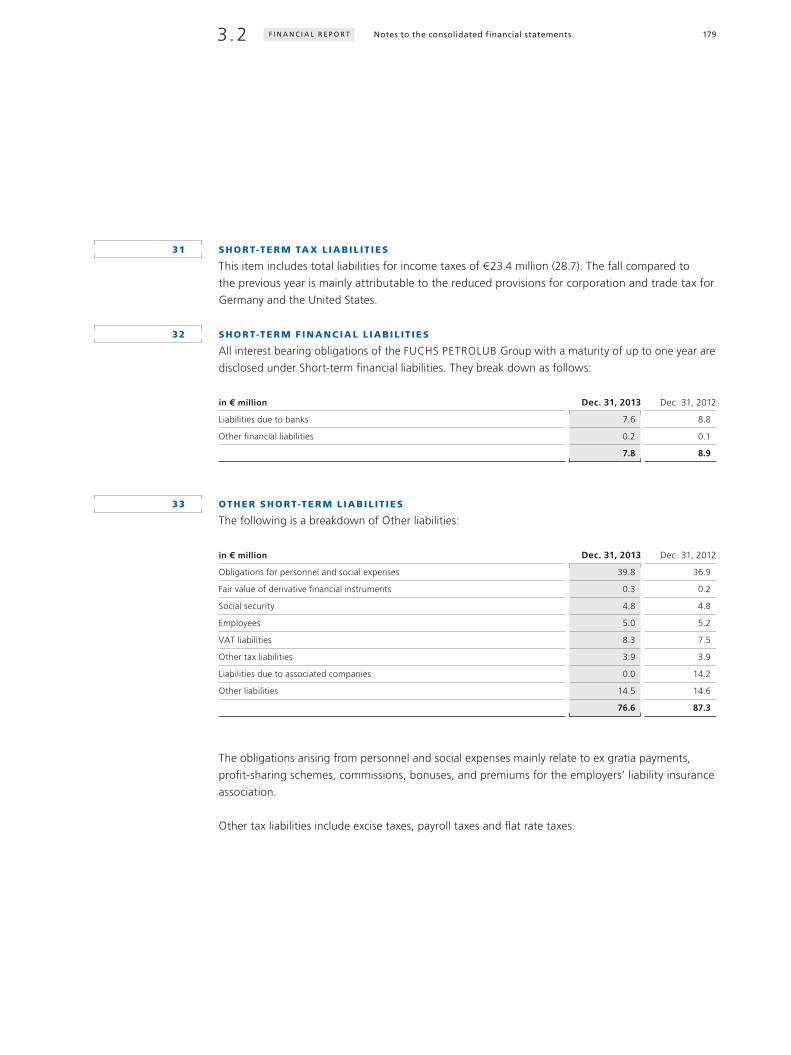
1793.2 Notes to the consolidated financial statementsF I N A N C I A L R E P O R T
SHORT-TERM TA X L IABIL IT IES
This item includes total liabilities for income taxes of € 23.4 million (28.7). The fall compared to
the previous year is mainly attributable to the reduced provisions for corporation and trade tax for
Germany and the United States.
SHORT-TERM F INANCIAL L IABIL IT IES
All interest bearing obligations of the FUCHS PETROLUB Group with a maturity of up to one year are
disclosed under Short-term financial liabilities. They break down as follows:
in € million Dec. 31, 2013 Dec. 31, 2012
Liabilities due to banks 7.6 8.8
Other financial liabilities 0.2 0.1
7.8 8.9
OTHER SHORT-TERM L IABIL IT IES
The following is a breakdown of Other liabilities:
in € million Dec. 31, 2013 Dec. 31, 2012
Obligations for personnel and social expenses 39.8 36.9
Fair value of derivative financial instruments 0.3 0.2
Social security 4.8 4.8
Employees 5.0 5.2
VAT liabilities 8.3 7.5
Other tax liabilities 3.9 3.9
Liabilities due to associated companies 0.0 14.2
Other liabilities 14.5 14.6
76.6 87.3
The obligations arising from personnel and social expenses mainly relate to ex gratia payments,
profit-sharing schemes, commissions, bonuses, and premiums for the employers’ liability insurance
association.
Other tax liabilities include excise taxes, payroll taxes and flat rate taxes.
31
32
33

180 F I N A N C I A L R E P O R T
In the previous year, the liabilities due to associated companies were €14.0 million held on a fidu-
ciary basis for an associated company in the Middle East which were recognized on the assets side
under Short-term other receivables and other assets.
Other liabilities include financing liabilities of € 4.7 million (4.9) related to the delivery agreements
in France that are disclosed under Other assets. This item also includes commission obligations and
customers with credit balances.
CONTINGENT L IABIL IT IES AND OTHER F INANCIAL OBLIGATIONS
Contingent liabilities and other financial obligations were as follows:
Contingencies (in € million) 31. 12. 2013 31. 12. 2012
Guaranties 0.0 2.7
thereof in favor of subsidiaries 0.0 0.0
Securing third-party liabilities 12.8 14.6
The item Securing third-party liabilities refers mainly to “garagiste” loans. Under this business model,
which is common in France, our subsidiary guarantees repayment of loans granted directly by the
bank to our contracting partner. This guaranty is part of our supply and financing agreements with
our partners.
Contractual obligations for the purchase of property, plant and equipment amount to €10.0 million
(20.2) on December 31, 2013. The lower figure is mainly attributable to our subsidiaries in China and
the United States.
Operating lease agreements
The Group mainly utilizes rental or operating lease agreements for a high rack warehouse, a produc-
tion plant, warehouses, vehicles, fork-lift trucks, IT equipment and software.
34
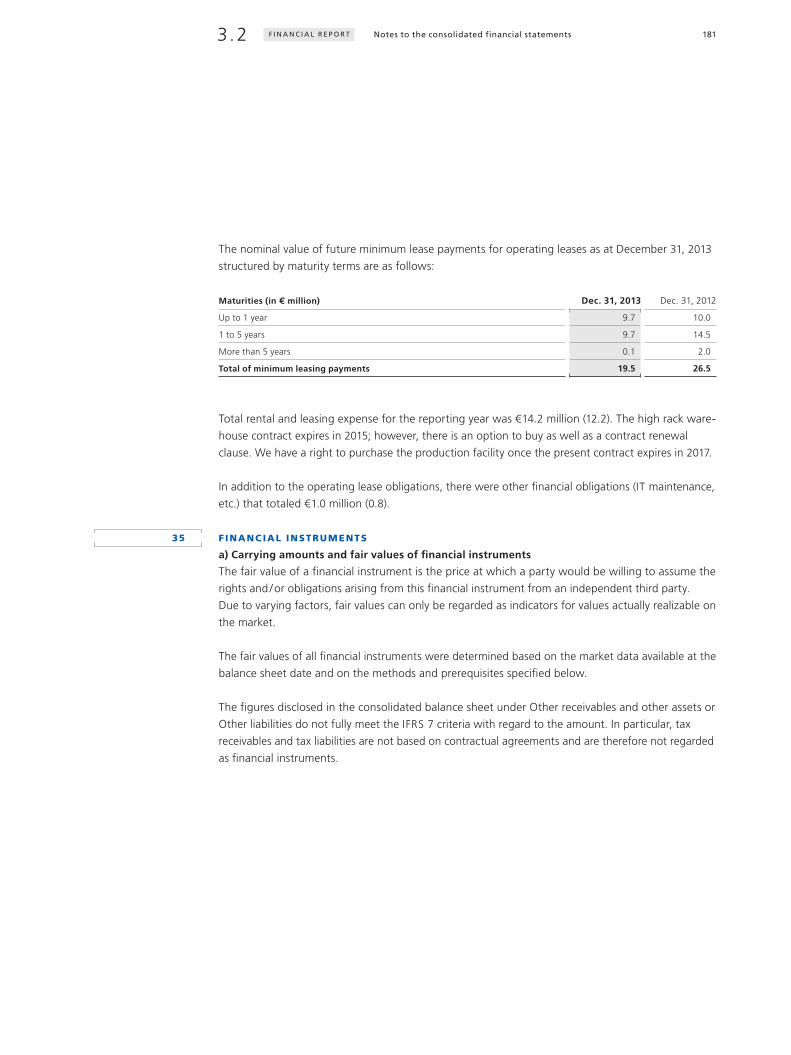
1813.2 Notes to the consolidated financial statementsF I N A N C I A L R E P O R T
The nominal value of future minimum lease payments for operating leases as at December 31, 2013
structured by maturity terms are as follows:
Maturities (in € million) Dec. 31, 2013 Dec. 31, 2012
Up to 1 year 9.7 10.0
1 to 5 years 9.7 14.5
More than 5 years 0.1 2.0
Total of minimum leasing payments 19.5 26.5
Total rental and leasing expense for the reporting year was €14.2 million (12.2). The high rack ware-
house contract expires in 2015; however, there is an option to buy as well as a contract renewal
clause. We have a right to purchase the production facility once the present contract expires in 2017.
In addition to the operating lease obligations, there were other financial obligations (IT maintenance,
etc.) that totaled €1.0 million (0.8).
F INANCIAL INSTRUMENTS
a) Carrying amounts and fair values of financial instruments
The fair value of a financial instrument is the price at which a party would be willing to assume the
rights and / or obligations arising from this financial instrument from an independent third party.
Due to varying factors, fair values can only be regarded as indicators for values actually realizable on
the market.
The fair values of all financial instruments were determined based on the market data available at the
balance sheet date and on the methods and prerequisites specified below.
The figures disclosed in the consolidated balance sheet under Other receivables and other assets or
Other liabilities do not fully meet the IFRS 7 criteria with regard to the amount. In particular, tax
receivables and tax liabilities are not based on contractual agreements and are therefore not regarded
as financial instruments.
35

182 F I N A N C I A L R E P O R T
For trade receivables, Other receivables and other assets, Cash and cash equivalents and Financial
liabilities, Trade payables and Other liabilities the carrying amount of the financial instrument largely
corresponds to the fair value.
Concerning the measurement categories of IAS 39, the category of loans and receivables includes
the carrying amounts of the balance sheet items Trade receivables and Other receivables and other
assets.
Carrying amounts of trade payables, financial liabilities and miscellaneous other financial liabilities
belong to the category of financial liabilities measured at amortized cost.
Cash and cash equivalents and liabilities from finance leases are not included in the classification by
categories as these financial instruments are not assigned to a measurement category of IAS 39.
b) Net profit or loss from financial instruments
The table below states the net profit or loss arising from financial instruments recorded in the
income statement:
in € million 2013 2012
Financial assets and financial liabilities at fair value through profit and loss 1.2 – 0.2
Available-for-sale financial assets 0.0 0.0
Loans and receivables – 3.5 – 2.5
Financial liabilities measured at their cost of acquisition 0.3 0.4
Net profit and loss from loans and receivables comprises the balance of allowances for bad debts
recognized and reversed, as well as the derecognition of irrecoverable receivables. They are disclosed
under Other operating expenses and income.

1833.2 Notes to the consolidated financial statementsF I N A N C I A L R E P O R T
c) Total interest income and expense
Total interest income and expense for financial assets and financial liabilities which were not measured
at fair value through profit and loss are as follows:
in € million 2013 2012
Total interest income 1.0 1.0
Total interest expenses – 2.3 – 2.5
The interest from these financial instruments is recognized in the Group’s financial result.
d) Information on derivative financial instruments
Use of derivatives. The objective of using derivative financial instruments is to hedge interest
rate and currency risks. In light of the Group’s low level of gross financial debt – taking cash and cash
equivalents into account, the Group is even in a net cash position – the Group’s strategy does
not involve entering into fixed interest rate agreements or making use of any other interest hedging
methods. For this reason no derivatives were concluded to hedge interest rate risks, as in the
previous year. The table below shows derivative financial instruments in place at the balance sheet
date for hedging currency risks and sorted by their time to maturity:
Nominal values (in € million) D E C . 3 1 , 2 0 1 3 D E C . 3 1 , 2 0 12
InstrumentUp to 1 year
1 – 5 years
More than
5 years TotalUp to 1 year
1 – 5 years
More than
5 years Total
Forward currency transactions 23.1 0.0 0.0 23.1 16.0 0.0 0.0 16.0
Nominal volume of derivatives 23.1 0.0 0.0 23.1 16.0 0.0 0.0 16.0
The nominal volume is the total of all buying and selling amounts of currency derivatives. The nominal
amounts generally correspond with the volumes of the underlying hedged transactions.
Forward currency contracts employed by the FUCHS PETROLUB Group are exclusively used to hedge
assets and liabilities. The change in the derivative’s fair value is recognized in the income statement.
The same applies to the changes in the fair value of assets or liabilities hedged by this. Both changes
equalize each other.

184 F I N A N C I A L R E P O R T
On the balance sheet date there were forward currency transactions solely for the purpose of
securing existing hedged items (mainly receivables and liabilities from inter-company loans). The inter-
company loans were eliminated in the consolidated financial statements through consolidation
entries. In addition, there was a small range of forward currency transactions for the purpose of
hedging firm commitments. Future (anticipated) transactions were not hedged.
The fair values of the derivative financial instruments were as follows:
Fair value as at December 31, 2013
Instrument (in € million) Nominal valueFair value
(net)
Recognized in the income
statement
Recognized in shareholders’
equity
Forward currency transactions 23.1 1.2 1.2 0.0
Total derivatives 23.1 1.2 1.2 0.0
Fair value as at December 31, 2012
Instrument (in € million) Nominal valueFair value
(net)
Recognized in the income
statement
Recognized in shareholders’
equity
Forward currency transactions 16.0 – 0.2 – 0.2 0.0
Total derivatives 16.0 – 0.2 – 0.2 0.0
MANAGEMENT OF R ISKS FROM F INANCIAL INSTRUMENTS
Due to its international business activities, the FUCHS PETROLUB Group is exposed to numerous
risks from financial instruments. In particular, these include credit risks, e. g. those inherent to trade
receivables, and market risks, e. g. changes in foreign exchange rates, interest rates and raw mate-
rial prices. In addition, liquidity risks may arise due to these risks, due to the operating business and
because of sudden fluctuations in the financial markets.
Major financial risks are monitored and controlled by the central treasury department of FUCHS
PETROLUB SE. There are detailed guidelines and requirements, approved by the company’s Board,
specifying how financial risks are to be controlled. Financial and currency risks are reduced by
entering into term and currency-matched financing and by making use of derivatives. We employ
these instruments for hedging purposes only. The fair value of the forward currency transactions
is calculated on the basis of recognized valuation models and current market data. The models are
assigned to tier 2 in the fair value hierarchy. This control is employed strictly according to binding
internal guidelines that utilize a four-eye-principle that guarantees adequate functional separation
between trading and processing.

1853.2 Notes to the consolidated financial statementsF I N A N C I A L R E P O R T
Credit risks
A credit risk arises if one party of a financial instrument causes a financial loss thereby damaging the
other party by not fulfilling an obligation. Credit risks may result from the investment of liquid
funds and the granting of payment terms for goods and services as well as from other agreements to
be fulfilled by the counterparty only at a later date.
C A SH AND C A SH EQUIVALENTS
The Group usually limits its cash and cash equivalents to the extent required for its operating
business. If liquid funds are not needed for the ongoing operating business, the funds will be invested
within the Group. The Group’s finance directive also requires that liquid funds may only be placed
at banks with an excellent credit standing (Standard & Poor’s / Moody’s / Fitch short-term rating of
A1 / P1 / F1 or higher).
TR ADE RECEIVABLES
Due to its business relations maintained with more than 100,000 customers worldwide, the
FUCHS PETROLUB Group permanently keeps significant trade receivables. The handling of the inher-
ent credit risks is defined in a directive permitting procedures that may differ from one coun try
to another. If the internal credit risk assessment – which is based on external credit information reveals
that a credit risk is too high, credit collaterals must be provided, e. g. in the form of bank guaran-
tees or documentary credits. Alternatively, credit insurance is also used. On the balance sheet date,
receivables totaling € 3.9 million (4.1) were secured.
For the remaining credit risks bad debt allowances are recorded as soon as they exceed certain limits
(see note 21).
DERIVATIVE FINANCIAL INSTRUMENTS AND OTHER RECEIVABLES AND OTHER A SSETS
When selecting banks with which derivative transactions are concluded, FUCHS PETROLUB ensures
that the counterparty is sufficiently creditworthy. All derivative transactions are concluded with
banks carrying a Moody’s long-term rating in the investment sector. Through these processes, the
default risk by contracting parties (credit risk) is minimized.
The maximum credit risk regarding the above-mentioned positions is the carrying amount of
the receivable or of the financial asset – also if the asset concerns derivative financial instruments or
liquid funds. The FUCHS PETROLUB Group is only exposed to limited credit risks thanks to a natu-
ral diversification and its successful credit risk management. No concentration risks can currently be
ascertained.
Note 21
163

186 F I N A N C I A L R E P O R T
Liquidity risks
A liquidity risk arises if a company cannot fully meet its financial obligations.
The funds of the FUCHS PETROLUB Group mainly come from its operating business. Occasionally
revolving funds are employed in the form of bonds or bank loans, for example, primarily to finance
working capital and investment projects.
Beside the € 7.8 million (8.9) in lines of credit already utilized, the Group also had access to other free
lines of credit of €140.3 million (148.7). Furthermore, the Group has the option to use other finan-
cial resources by taking up additional bank loans and / or by issuing promissory note loans, private
placements or bonds.
The following overview shows how the Group’s contractually fixed payments for repayments and
interest from the recognized financial liabilities as at December 31, 2013 affect the Group’s liquidity
situation (non-discounted):
MATURIT IES OF CONTR AC TUAL C ASH FLOWS FROM F INANCIAL L IAB IL IT IES AS AT DECEMBER 31, 2013
Financial liabilities (in € million) Total 2014 2015 2016 2017 2018 ≥ 2019
Financial liabilities incl. interest 7.8 7.8 0.0 0.0 0.0 0.0 0.0
Derivative financial instruments 0.3 0.3 0.0 0.0 0.0 0.0 0.0
Trade payables 132.3 132.3 0.0 0.0 0.0 0.0 0.0
Other financial liabilities 11.6 11.6 0.0 0.0 0.0 0.0 0.0
Total 152.0 152.0 0.0 0.0 0.0 0.0 0.0
MATURIT IES OF CONTR AC TUAL C ASH FLOWS FROM F INANCIAL L IAB IL IT IES AS AT DECEMBER 31, 2012
Financial liabilities (in € million) Total 2013 2014 2015 2016 2017 ≥ 2018
Financial liabilities incl. interest 9.0 9.0 0.0 0.0 0.0 0.0 0.0
Derivative financial instruments 0.2 0.2 0.0 0.0 0.0 0.0 0.0
Trade payables 119.8 119.8 0.0 0.0 0.0 0.0 0.0
Other financial liabilities 11.4 11.4 0.0 0.0 0.0 0.0 0.0
Total 140.4 140.4 0.0 0.0 0.0 0.0 0.0

1873.2 Notes to the consolidated financial statementsF I N A N C I A L R E P O R T
In comparison to the previous year (140.4), financial liabilities rose by €11.6 million to €152.0 million.
All financial liabilities are of short-term nature.
The FUCHS PETROLUB Group considers its liquidity situation to be stable and not subject to any sig-
nificant liquidity risk. The Group has access to cash and cash equivalents of €175.2 million (143.7)
and €140.3 million in free lines of credit (148.7). Beside this, the Group has short-term trade receiv-
ables of € 260.4 million from operating activities (250.4).
Market risks
As a result of its global business activities, the FUCHS Group faces market risks in the form of foreign
exchange risks and interest rate risks. There are no stock market risks since the Group does not
hold any freely tradable securities. The assets held by pension funds to meet pension obligations are
explained in note 26.
EXCHANGE R ATE RISKS
In regard to exchange rate risks, we distinguish between transaction and translation risks.
The Group’s transaction risks result in particular from purchases of operating companies in a cur-
rency which differs from the one in which sales proceeds are achieved. Some of the raw materials
processed by FUCHS are traded in US dollars. At the same time companies generate most of the
sales revenues on the markets of their respective home country. Thus all companies located outside
the US dollar zone are exposed to a US dollar transaction risk.
When exporting finished products, the currency used by the exporting company is at the same
time its invoicing currency. For this reason, the importing Group companies or third-party customers
are exposed to transaction risks.
Because of dividend and license income of the holding company, which is almost always obtained
in the currency of the paying company, the holding company is also exposed to a transaction risk.
Particularly in relation to the US dollar, this risk counters the transaction risk of many operating
companies so that a natural hedge is in place which leads to the minimization of the transaction risks
existing across the entire Group.
Note 26
169

188 F I N A N C I A L R E P O R T
Exchange rate risks arising from the granting of intra-group foreign currency loans are generally
hedged by concluding forward currency transactions or other original or derivative hedging instru-
ments such as foreign currency borrowing or interest rate and currency swaps.
Due to the structure of the lubricants business, which does not involve long run-up periods or a high
level of orders on hand, FUCHS does not hedge currency positions in the context of its operating
business on a long-term basis. For the operating companies the exchange rate is rather one of sev-
eral price-determining factors which is to be taken into account when calculating prices.
The FUCHS PETROLUB Group comprises a large number of Group companies located outside the
eurozone. Therefore so-called translation risks arise due to fluctuating exchange rates when
con verting the sales proceeds and the results for the Group’s income statement. They may have a
considerable influence on the Group’s income statement.
For FUCHS significant translation risks exist due to its activities in North and South America, the Asian-
Pacific area and Africa. To the extent that these risks are directly or also indirectly linked to the
US dollar, they represent a natural hedge of the above-mentioned US dollar transaction risk. Trans-
action and translation risks thus have a compensatory effect at Group level.
The Group also faces translation risks when converting the figures of the assets and liabilities held
by subsidiaries abroad. To contain these risks, assets to be financed on a short term basis are usually
refinanced in the local currency and only assets needed on a long-term basis are backed by equity.
The changes in the equity position are continuously monitored, but normally not hedged against fluc-
tuations in the exchange rate.
Financial liabilities exist in the following currencies:
Financial liabilities (in € million) 2013 in % 2012 in %
Euro 0.2 2.6 0.4 4.5
Indian rupee 4.4 56.4 4.6 51.7
South African rand 1.5 19.2 0.0 0.0
Indonesian rupiah 0.9 11.5 0.0 0.0
Brazilian real 0.5 6.4 2.2 24.7
Other currencies 0.3 3.9 1.7 19.1
7.8 100.0 8.9 100.0

1893.2 Notes to the consolidated financial statementsF I N A N C I A L R E P O R T
INTEREST R ATE RISKS
Based on a continuous decrease of its financial liabilities, the Group has considerably minimized
its interest rate risk over the past years. While in earlier years derivative instruments were used to limit
interest rate risks, today’s low volume of financial liabilities makes them obsolete. The aim is to
ensure that the maturity of funds for financing short-term assets is maturity-congruent with short-
term interest rates.
The financial liabilities break down by interest rate agreement as follows. No collaterals were provided.
Financial liabilities (in € million)Effective
interest rateFixed
interest rate
Carrying amount
Dec. 31, 2013
Carrying amount
Dec. 31, 2012
EUR short term loans
Variable
interest rate < 1 year 0.2 0.4
INR short term loans
Variable
interest rate < 1 year 4.4 4.6
ZAR short term loans
Variable
interest rate < 1 year 1.5 0.0
IDR short term loans
Variable
interest rate < 1 year 0.9 0.0
BRL short term loans
Variable
interest rate < 1 year 0.5 2.2
Short term loans in other currencies
Respective
variable
interest rates < 1 year 0.3 1.7
7.8 8.9
Summary of interest rate hedging periods
Interest rate hedging periods (in € million) 2013 in % 2012 in %
Up to 1 year 7.8 100.0 8.9 100.0
1 to 5 years 0.0 0.0 0.0 0.0
More than 5 years 0.0 0.0 0.0 0.0
7.8 100.0 8.9 100.0

190 F I N A N C I A L R E P O R T
Other price risks
The FUCHS PETROLUB Group is exposed to risks arising from changes in the prices of goods
which the Group needs to manufacture its finished products. Purchases of these goods are not hedged
by derivatives since the available instruments are not effective enough. Changes in the prices of
raw materials are usually passed on to the market, possibly with a certain delay. Hence, these price
risks are limited.
Sensitivity analyses
Underlying certain assumptions, sensitivity analyses provide an approximation of risks arising
when certain influencing factors change. In terms of the interest rate risk and the foreign exchange
rate risk we anticipate the following changes:
■■ an increase of the market interest rates of all currencies by one percentage point (parallel shift of
the yield curves);■■ a concurrent revaluation of the euro relative to all foreign currencies by 10 %.
When determining the interest rate risk for FUCHS at the balance sheet date, only original finan-
cial instruments carrying variable interest are included. Original financial instruments with fixed
interest measured at amortized costs do not entail interest rate risks pursuant to IFRS 7. There were
no interest rate derivatives which could possibly have an effect on the financial result.
Thus, an increase by one percentage point of the market’s interest rate level on financial liabilities
with a variable interest rate disclosed on December 31, 2013 would have reduced the financial result
by € 0.1 million (0.1) – assuming that the higher interest rate had been valid during the entire year.
The foreign currency risk is determined based on all net foreign currency positions not hedged
at the balance sheet date. A simultaneous depreciation of the euro by 10 % in comparison to all for-
eign currencies would have reduced the financial result by € 0.3 million (0.2).

1913.2 Notes to the consolidated financial statementsF I N A N C I A L R E P O R T
FURTHER NOTES TO THE CONSOLIDATED FINANCIAL STATEMENTS
NOTES TO THE STATEMENT OF C ASH FLOWS
The statement of cash flows shows how the liquid funds of the FUCHS PETROLUB Group have
changed in the course of the year as a result of cash inflows and outflows. In accordance with
IAS 7 (Cash Flow Statements), cash flows are classified into cash flows from or into operating, invest-
ing and financing activities.
Cash and cash equivalents as shown in the statement of cash flows comprise the cash and cash
equivalents recognized in the balance sheet. Beside cash and cash equivalents in the more literal sense,
i. e. checks, cash on hand and bank deposits, this item also includes short-term investments which
can be converted to cash amounts at any time and are only subject to insignificant changes in fair
value. Cash and cash equivalents are measured at amortized costs.
Cash flow from operating activities is calculated indirectly based on earnings after tax. With this
method, the underlying changes in balance sheet items are adjusted for currency translation
effects and for changes in the scope of consolidation. These changes in the balance sheet items,
therefore, do not directly correspond to the amounts shown in the balance sheet.
The cash flows from / into investing and financing activities are determined on the basis of actual pay-
ments, adjusted by effects from currency translation and from the change in the scope of con-
solidation. Insofar as subsidiaries or business activities are acquired or disposed of, the influences of
these transactions are disclosed in dedicated items in the statement of cash flows.
Free cash flow is calculated from the cash flow from operating activities and the cash outflow from
investing activities.
NOTES TO THE SEGMENT REPORTING
Within the scope of segment reporting, the operating segments are made up of the geographical
regions reflecting the FUCHS PETROLUB Group’s internal organization and reporting structure. In line
with the principles of IFRS 8 “Operating segments”, this structure is aligned to the Group’s inter-
nal control system and reflects segment reporting in the Group management committees. Accordingly,
the primary reporting format is the regions. These are defined as Europe, Asia-Pacific, Africa and
North and South America. The individual companies are allocated to the segments according to the
regions in which they are located.
36
37

192 F I N A N C I A L R E P O R T
The segment information is based on the same recognition and valuation methods as the con-
solidated financial statements. Receivables and liabilities, income and expenses, and profits between
the segments are eliminated in the consolidation process. The reconciliation of segment data to
the total amounts for the Group is shown in the column “Holding companies including consolidation”.
This includes not only the depreciation, earnings, assets and liabilities of the Group companies,
but also the inter-segment eliminations with regard to sales revenues. Intra-group revenues and trans-
fers are transacted at prices and terms of independent business partners.
Segment data includes all direct segment costs as well as indirect costs to a limited degree. The
segment assets and segment liabilities include only those assets and liabilities that have contributed
towards the achievement of the segment earnings before interest and tax (EBIT).
In Germany, long-term assets (intangible assets and property, plant and equipment) are €175.0 mil-
lion (172.8). € 217.7 million (192.8) is attributable to foreign countries of which € 72.1 million (66.1)
is attributable to the USA.
The overall development of the segments is disclosed on pages 124 and 125 stating the figures for the
reporting year and the corresponding figures of the previous year. The statement shows sales
revenues, depreciation and amortization expenses and the respective segment earnings (EBIT) as cen-
tral key performance indicators for each geographic region. The total of segment earnings is
transferred to the net profit after tax. Additionally, segment assets and liabilities of the individual seg-
ments are disclosed, with the latter being transferred to Group liabilities. Furthermore, the state-
ment contains investments in intangible assets, property, plant and equipment, and financial assets,
as well as the average number of employees and EBIT margin of each segment.
Sales revenues by product groups are disclosed in note 1 to the income statement.
REL ATIONSHIPS WITH REL ATED PARTIES
The related parties of the FUCHS PETROLUB Group as defined according to IAS 24 are:
■■ Directly and indirectly held subsidiaries, and FUCHS PETROLUB SE companies consolidated at equity,■■ Executive Board and Supervisory Board of FUCHS PETROLUB SE,■■ RUDOLF FUCHS GMBH & CO KG, through which most of the Fuchs family’s ordinary stock is held,■■ its full partner FUCHS INTEROIL GMBH and its management■■ and pension funds benefiting the Group’s employees.
The controlling company is RUDOLF FUCHS GMBH & CO KG.
Segments
124
Note 1
150
38
1933.2 Notes to the consolidated financial statementsF I N A N C I A L R E P O R T
FUCHS PETROLUB SE provides services to the related companies RUDOLF FUCHS GMBH &
CO KG and FUCHS INTEROIL GMBH, for which it is compensated with a contribution to its adminis-
trative costs. The scope of these services is not material.
Furthermore, there are intercompany transactions (such as loans, provision of goods and services)
between the holding company, FUCHS PETROLUB SE, and its consolidated subsidiaries. All inter-
company transactions and balances have been eliminated in the consolidated financial statements.
License fees are charged to the subsidiaries according to their sales revenues for services pro-
vided by the holding company in the areas of research and development, product marketing, brand
management, advertising, etc. Fees are also allocated for management and similar services. Ser-
vices provided to related companies and persons are charged on the same basis as those for indepen-
dent business partners.
The FUCHS PETROLUB Group has receivables of € 2.3 million (1.3) relating to supplies and ser-
vices, as well as other receivables of € 0.2 million (0.3) due from companies consolidated at equity.
The liabilities are € 0.0 million (14.2). In the previous year, €14.0 million were held on a fiduciary
basis for an associated company in the Middle East which were recognized on the assets side under
“Short-term other receivables and other assets”.
The value of goods delivered in 2013 to companies consolidated at equity was €15.5 million (11.1),
while Other operating income was €1.3 million (1.1).
The FUCHS PETROLUB Group has receivables relating to supplies and services of € 0.2 million (0.2),
other receivables of € 0.2 million (0.0) and other liabilities of € 0.1 million (0.0) due from two
(in the previous year one) non-consolidated subsidiaries. The value of goods supplied in 2013 was
€1.3 million (0.9).
No consultant contracts are in place with any members of the Executive Board or Supervisory Board.
For information on pension plans please refer to note 26.
A dependent company report has been prepared on relationships with related parties pursuant to
Section 312 of the German Stock Corporation Law (AktG) with the concluding declaration: “In
the legal transactions listed in the dependent company report, and according to the circumstances
that were known to us when those legal transactions were performed, our company received an
appropriate consideration in each legal transaction. No actions subject to disclosure occurred on the
instruction or in the interest of the controlling company nor any company associated with it.”
KPMG AG Wirtschaftsprüfungsgesellschaft, the independent auditors of FUCHS PETROLUB SE, have
audited this dependent company report and provided it with an unqualified audit opinion.
Note 26
169

194 F I N A N C I A L R E P O R T
EXECUTIVE BODIES
SU PERVISORY BOARD
Dr. Jürgen Hambrecht Chairman
Neustadt an der Weinstraße Former chairman of the Executive Board at BASF SE
Other mandates*:
■ Daimler AG
■ Deutsche Lufthansa Aktiengesellschaft
■ Berthold Leibinger GmbH (general partner of
TRUMPF GmbH + Co. KG) ¹
Dr. Dr. h.c. Manfred Fuchs Deputy Chairman
Mannheim Former Chairman of the Executive Board of FUCHS PETROLUB SE
Ines Kolmsee Chairwoman of the Executive Board at SKW Stahl-Metallurgie
Tutzing Holding AG
Other mandates*:
■ UMICORE S.A.
Horst Münkel ² Chairman of the joint works council at
Mannheim FUCHS EUROPE SCHMIERSTOFFE GmbH
Lars-Eric Reinert ² Chairman of the European SE works council and
Altenholz the Group work council at FUCHS PETROLUB SE
Dr. Erhard Schipporeit Former member of the Executive Board of E.ON SE
Hannover
Other mandates*:
■ BDO AG Wirtschaftsprüfungsgesellschaft
■ Deutsche Börse Aktiengesellschaft
■ Hannover Rückversicherung AG
■ SAP AG
■ Talanx Aktiengesellschaft
Comparable German and international supervisory bodies:
■ Fidelity Funds SICAV (Luxembourg)
■ TUI Travel Plc. (Great Britain)
1 Chairman
2 Employee representative
* Supervisory Board memberships pursuant to Section 100 (2) of the German Stock Corporation Act (AktG)
39

1953.2 Notes to the consolidated financial statementsF I N A N C I A L R E P O R T
EXECUTIVE BOARD
Stefan R. Fuchs
HirschbergFirst appointment: 1999Expiration of the mandate: 2016
Chairman
Other mandates*:■■ ■Berthold Leibinger GmbH (general partner of TRUMPF GmbH + Co. KG)
Group mandates:■■ FUCHS CORPORATION■■ FUCHS LUBRICANTS CO.■■ FUCHS OIL MIDDLE EAST LTD.
Dr. Alexander Selent
LimburgerhofFirst appointment: 1999Expiration of the mandate: 2017
Deputy Chairman
Other mandates*:■■ Vossloh AG
Group mandates:■■ FUCHS CORPORATION■■ FUCHS LUBRICANTS (CHINA) LTD.■■ ALHAMRANI-FUCHS PETROLEUM SAUDI ARABIA LTD.
Dr. Lutz Lindemann
KerzenheimFirst appointment: 2009Expiration of the mandate: 2018
Member
Dr. Georg Lingg
MannheimFirst appointment: 2004Expiration of the mandate: 2015
Member
Group mandates:■■ FUCHS LUBRICANTS (YINGKOU) LTD.■■ FUCHS LUBRICANTS (KOREA) LTD.■■ FUCHS LUBRICANTS (CHINA) LTD.■■ FUCHS LUBRICANTS (AUSTRALASIA) PTY. LTD.■■ FUCHS LUBRICANTS TAIWAN CORP.■■ FUCHS OIL MIDDLE EAST LTD.■■ OPET FUCHS MADENI YAG SANAYI VE TICARET A.S.
Dr. Ralph Rheinboldt
HeddesheimFirst appointment: 2009Expiration of the mandate: 2018
Member
Group mandates:■■ FUCHS LUBRICANTS BENELUX N.V. / S.A.¹■■ FUCHS HELLAS S.A.■■ FUCHS LUBRICANTES S.A.U.¹■■ FUCHS LUBRICANTS (UK) PLC■■ FUCHS LUBRIFIANT FRANCE S.A.¹■■ FUCHS LUBRIFICANTI S.P.A.¹■■ FUCHS OIL FINLAND OY■■ MOTOREX AG LANGENTHAL
1 Chairman
* Supervisory Board memberships pursuant to Section 100 (2) of the German Stock Corporation Act (AktG)

196 F I N A N C I A L R E P O R T
COM PENSATION FOR MEMBERS OF THE EXECUTIVE BOARD
Compensation of the Executive Board (in € thousand) 2013 2012
Compensation of the Executive Board 7,164 7,011
thereof fixed compensation 1,549 1,513
thereof variable compensation 5,615 5,498
Current service cost for pension commitments to active members
of the Executive Board 496 352
Former member of the Executive Board
Total compensation of former board members 433 411
Balance of pension obligations and plan assets 239 737
The compensation of the Executive Board is made up of a fixed and a variable component. The
fixed compensation was paid in the last financial year, while the variable compensation will be paid
in the subsequent year. The fixed compensation portions enjoyed an inflation-linked increase.
The variable compensation of the Executive Board is based on an incentive agreement geared toward
sustainable company success. This agreement tracks the FUCHS Value Added (FVA) concept
and is linked to a performance factor. FVA represents the earnings before interest and tax (EBIT)
less the capital costs. The performance factor measures on an annual basis the achievement of
the long-term goals set for the entire Executive Board. The variable compensation of the Executive
Board increased due to the change to the FVA and the relative weighting of the performance
factor. Benefits arising from the occasion of the ending of the working relationship of the Executive
Board are not provided for, nor are there any share-based payments.
The balance of pension obligations and plan assets of € 239 thousand (737) for former members
of the Executive Board results from the existing plan assets of € 5,303 thousand (5,128), minus pension
obligations of € 5,542 thousand (5,865).
According to a resolution passed by the Annual General Meeting of FUCHS PETROLUB SE on
May 11, 2011 there shall be no individual disclosure of the Executive Board compensation for the dura-
tion of five years.

1973.2 Notes to the consolidated financial statementsF I N A N C I A L R E P O R T
COM PENSATION FOR MEMBERS OF THE SU PERVISORY BOARD
The compensation received by the individual members of the Supervisory Board break down
as follows:
The compensation rules for the Supervisory Board are presented in Section 16 of the company’s
Articles of Association.
The fixed compensation and compensation for committee work is paid after the end of the financial
year, while the attendance allowance is paid after the respective Supervisory Board or committee
meeting. The variable compensation for the completed financial year is paid out in the subsequent
year as per the resolution passed by the Annual General Meeting.
The main features of the compensation system for members of the Executive Board and of the Super-
visory Board of FUCHS PETROLUB SE are disclosed in the Group’s management report in accor-
dance with Section 315 (2) no. 4 of the German Commercial Code (HGB). The Supervisory Board’s
compensation is also described in detail on page 46 f.
Figures (in € thousand) Members of the Supervisory Board
Fixed compensation
Variable compensation
Compensation for committee work
Attendance allowance / ancillary
payments Total
2013 2012 2013 2012 2013 2012 2013 2012 2013 2012
Dr. Jürgen Hambrecht 60 60 50 48 10 10 18 16 138 134
Dr. Dr. h. c. Manfred Fuchs 45 45 38 36 22 22 18 15 123 118
Dr. Erhard Schipporeit 30 30 25 24 30 30 14 13 99 97
Ines Kolmsee 30 30 25 24 20 20 13 10 88 84
Horst Münkel 30 30 25 24 0 0 6 5 61 59
Lars-Eric Reinert 30 30 25 24 0 0 6 5 61 59
Total 225 225 188 180 82 82 75 64 570 551
46

198 F I N A N C I A L R E P O R T
DECL AR ATION ON THE GERMAN CORPOR ATE GOVERNANC E CODE AS PER SEC TION 161 OF THE GERMAN STOCK CORPOR ATION AC T (AK TG)
The Executive Board and Supervisory Board at FUCHS PETROLUB SE submitted the Declaration of
Compliance required pursuant to Section 161 of the German Stock Corporation Act (AktG). The
wording of this Declaration of Compliance is printed on page 45 and is publicly available on the web-
site at www.fuchs-oil.com / declarationcompliance.html.
FEES AND SERVIC ES OF THE AUDITOR
The auditor of the consolidated financial statements is KPMG AG Wirtschaftsprüfungsgesellschaft,
Mannheim.
Audit fees of € 414 thousand (359) for the annual audit, €15 thousand of which is for services
concerning the previous year, and €11 thousand (14) for other tax consulting services were domesti-
cally recorded as expenses. There were no tax consulting services or expenses for other services.
Expenses for other services of € 37 thousand were accrued in the previous year.
EVENTS AF TER THE BAL ANC E SHEET DATE
Subsequent to the balance sheet date there have been no events that would materially affect the
financial condition or results of operations of the Group.
SHAREHOLDING
As at December 31, 2013
40
Text of the declaration of compliance
45
41
42
43
I. SUBSIDIARIES
GERMANY
Name and registered office of the company (in € thousand)
Share of equity capital
(in %) 1Shareholders’
equity 2Sales revenues
2013 2 Consolidation 3
BREMER & LEGUIL GMBH, Duisburg 4 100 324 31,047 F
FUCHS EUROPE SCHMIERSTOFFE GMBH, Mannheim 4 100 60,000 535,140 F
FUCHS FINANZSERVICE GMBH, Mannheim 4 100 8,615 0 F
FUCHS LUBRITECH GMBH, Kaiserslautern 4 100 5,021 103,889 F
PARAFLUID MINERALOELGESELLSCHAFT MBH, Hamburg 4 100 628 14,405 F
WISURA GMBH, Bremen 4 100 1,100 13,394 F

1993.2 Notes to the consolidated financial statementsF I N A N C I A L R E P O R T
EUROPE (EXCLUDING GERMANY )
Name and registered office of the company (in € thousand)
Share of equity capital
(in %) 1Shareholders’
equity 2Sales revenues
2013 2 Consolidation 3
CENTURY OILS INTERNATIONAL LTD., Stoke-on-Trent / Great Britain 100 676 7 0 7 F
FUCHS AUSTRIA SCHMIERSTOFFE GMBH, Thalgau / Austria 70 2,942 16,075 F
FUCHS HELLAS S.A., Athens / Greece 97.4 671 3,701 F
FUCHS LUBRICANTES S.A.U., Castellbisbal / Spain 100 20,740 53,077 F
FUCHS LUBRICANTS BENELUX N.V. / S.A., Huizingen / Belgium 100 9,396 28,555 F
FUCHS LUBRICANTS NORWAY AS, Bergen / Norway 100 203 1,644 N
FUCHS LUBRICANTS (UK) PLC., Stoke-on-Trent / Great Britain (subgroup) 100 34,511 150,812 F
FUCHS LUBRIFIANT FRANCE S.A., Nanterre Cedex / France 99.7 19,488 109,049 F
FUCHS LUBRIFICANTES UNIPESSOAL LDA., Moreira-Maia / Portugal 100 2,653 9,026 F
FUCHS LUBRIFICANTI S.P.A., Buttigliera d’Asti / Italy 100 17,569 59,673 F
FUCHS LUBRITECH INTERNATIONAL (UK) LTD., London / Great Britain 100 6,048 0 F
FUCHS LUBRITECH S.A.S., Ensisheim / France 100 1,991 9,078 F
FUCHS LUBRITECH (UK) LTD., London / Great Britain 100 3,039 3,577 F
FUCHS MAK DOOEL, Skopje / Macedonia 100 842 1,648 N
FUCHS MAZIVA D.O.O., Samobor / Croatia 100 2,404 4,863 F
FUCHS MAZIVA LSL D.O.O., Brezice / Slovenia 100 944 2,400 F
FUCHS OIL CORPORATION (CZ) SPOL. S R.O., Stráncice / Czech Republic 100 3,100 9,240 F
FUCHS OIL CORPORATION (PL) SP. Z O.O., Gliwice / Poland 100 14,517 52,733 F
FUCHS OIL CORPORATION (SK) SPOL. S.R.O., Brezno / Slovak Republic 100 1,576 6,693 F
FUCHS OIL FINLAND OY, Vaasa / Finland 100 662 2,974 F
FUCHS OIL HUNGARIA KFT, Budaörs / Hungary 100 352 3,369 F
FUCHS SMÖRJMEDEL SVERIGE AB, Helsingborg / Sweden 100 148 2,561 F
TOV FUCHS MASTYLA UKRAINA (formerly JV FUCHS MASTYLA UKRAINA),
Lviv / Ukraine 100 3,486 10,187 F
OOO FUCHS OIL, Moscow / Russia 100 9,294 33,417 F

200 F I N A N C I A L R E P O R T
A SIA- PACIFIC / AFRIC A
Name and registered office of the company (in € thousand)
Share of equity capital
(in %) 1Shareholders’
equity 2Sales revenues
2013 2 Consolidation 3
FUCHS JAPAN LTD., Tokyo / Japan 100 2,171 9,100 F
FUCHS LUBRICANTS (AUSTRALASIA) PTY. LTD.,
Sunshine-Melbourne / Australia (subgroup) 100 33,319 134,963 F
FUCHS LUBRICANTS (CHINA) LTD., Shanghai / People’s Republic of China 100 48,472 141,489 F
FUCHS LUBRICANTS (INDIA) PVT. LTD., Mumbai / India 100 4,770 14,360 F
FUCHS LUBRICANTS (KOREA) LTD., Seoul / South Korea 100 5,647 19,540 F
FUCHS LUBRICANTS (SOUTH AFRICA) (PTY.) LTD.,
Johannesburg / South Africa
100
11,897
48,591 F
FUCHS LUBRICANTS (YINGKOU) LTD.,
Yingkou-City / People’s Republic of China
100
41,426
112,699 F
FUCHS LUBRICANTS (NEW ZEALAND) LTD., Auckland / New Zealand 100 3,565 8 15,136 8 F
FUCHS LUBRICANTS PTE. LTD., Singapore / Singapore 100 2,693 11,592 F
FUCHS LUBRICANTS REGIONAL HEADQUARTERS (EAST ASIA) LTD.,
Shanghai / People’s Republic of China 100 1,448 392 F
FUCHS LUBRICANTS TAIWAN CORP., Taipei / Taiwan 100 1,444 6,198 F
FUCHS LUBRICANTS (THAILAND) CO., LTD., Bangkok / Thailand 100 1,490 5,529 F
FUCHS LUBRICANTS VIETNAM COMPANY LIMITED,
Ho Chi Minh City / Vietnam 100 0 0 N
FUCHS PETROLUBE (MALAYSIA) SDN. BHD., Shah Alam / Malaysia 100 1,758 6,262 F
FUCHS THAI HOLDING LTD., Bangkok / Thailand 100 434 0 F
PT FUCHS INDONESIA, Jakarta / Indonesia 100 1,829 8,072 F

2013.2 Notes to the consolidated financial statementsF I N A N C I A L R E P O R T
NORTH AND SOUTH AMERIC A
Name and registered office of the company (in € thousand)
Share of equity capital
(in %) 1Shareholders’
equity 2Sales revenues
2013 2 Consolidation 3
FUCHS ARGENTINA S.A., El Talar de Pacheco / Argentina (subgroup) 100 4,002 13,319 F
FUCHS CORPORATION, Dover, Delaware / USA (subgroup) 100 124,938 256,250 F
FUCHS DO BRASIL S.A., City of Barueri, State of São Paulo / Brazil 100 8,837 38,008 F
FUCHS LUBRICANTS CANADA LTD., Cambridge, Ontario / Canada 100 10,814 5 26,509 5 F
FUCHS LUBRICANTS CO., Harvey, Illinois / USA 100 109,138 5 219,816 5 F
FUCHS URUGUAY S.A., Montevideo / Uruguay 100 56 6 0 6 F
LUBRICANTES FUCHS DE MEXICO S.A. DE C.V., Querétaro / Mexico 100 3,060 5 16,093 5 F
PROMOTORA FUCHS S.A. DE C.V., Querétaro / Mexico 100 74 5 1,382 5 F

202 F I N A N C I A L R E P O R T
I I . JOINT VENTURES AND ASSOCIATED COMPANIES
Name and registered office of the company (in € thousand)
Share of equity capital
(in %) 1Shareholders’
equity 2Sales revenues
2013 2 Consolidation 3
ALHAMRANI-FUCHS PETROLEUM SAUDI ARABIA LTD., Jeddah / Saudi Arabia 32 49,415 186,054 E
FUCHS LUBRICANTS IRANIAN COMPANY (PJS), Tehran / Iran 50 2,890 11,840 E
FUCHS OIL MIDDLE EAST LTD., Sharjah / United Arab Emirates 50 50,745 36,166 E
MOTOREX AG LANGENTHAL, Langenthal / Switzerland 50 5,189 22,973 E
OPET FUCHS MADENI YAG SANAYI VE TICARET A.S., Cigli-Izmir / Turkey 50 23,363 91,926 E
I I I . OTHER COMPANIES IN WHICH THE GROUP HOLDS AN INTEREST (PERCENTAGE OF SHARES HELD > 5 %)
Name and registered office of the company (in € thousand)
Share of equity capital
(in %) 1Shareholders’
equity 2Sales revenues
2013 2 Consolidation 3
NIPPECO LTD., Tokyo / Japan 11
1 Share of FUCHS PETROLUB SE, including indirect holdings.
2 Shareholders’ equity and sales revenues are disclosed at 100 %. At domestic companies, the values are based on the German annual financial statements (HB I), while at
companies domiciled outside Germany they are generally based on the tried and tested or certified IFRS financial statements (HB II) prior to consolidation. The conversion of
shareholders’ equities to the Group currency of euros was performed using the closing rate as at December 31, 2013, while the accumulated average annual exchange rate of
2013 was used when converting sales revenues.
3 Inclusion in the consolidated financial statements:
F = full consolidation as per IAS 27,
E = equity method as per IAS 28,
N = non-consolidated due to immateriality.
4 Company with profit / loss transfer agreement.
5 Included in the subgroup financial statements (HB II) FUCHS CORPORATION, USA.
6 Included in the subgroup financial statements (HB II) FUCHS ARGENTINA S.A., Argentina.
7 Included in the subgroup financial statements (HB II) FUCHS LUBRICANTS (UK) PLC., Great Britain.
8 Included in the subgroup financial statements (HB II) FUCHS LUBRICANTS (AUSTRALASIA) PTY. LTD., Australia.

2033.2 Notes to the consolidated financial statementsF I N A N C I A L R E P O R T
DECLARATION OF THE EXECUTIVE BOARD AND ASSURANCE PURSUANT TO SECTION 297 (2), SECTION 315 (1) OF THE GERMAN COMMERCIAL CODE (HGB)
To the best of our knowledge, and in accordance with the applicable reporting principles, the con-
solidated financial statements give a true and fair view of the assets, liabilities, financial position
and profit or loss of the Group, and the Group management report includes a fair review of the devel-
opment and performance of the business and the position of the Group, together with a descrip-
tion of the principal opportunities and risks associated with the expected development of the Group.
Mannheim, March 14, 2014
FUCHS PETROLUB SE
Executive Board
S. Fuchs Dr. A. Selent
Dr. L. Lindemann Dr. G. Lingg Dr. R. Rheinboldt
204 F I N A N C I A L R E P O R T
Independent auditor’s report
TO FUCHS PETROLUB SE
REPORT ON THE CONSOLIDATED F INANCIAL STATEMENTS
We have audited the accompanying consolidated financial statements of FUCHS PETROLUB SE, Mann-
heim, (until July 18, 2013: FUCHS PETROLUB AG) and its subsidiaries, which comprise the con-
solidated statement of financial position, the consolidated statement of comprehensive income, the
consolidated statement of changes in equity, the consolidated statement of cash flows, and notes
to the consolidated financial statements for the business year from January 1 to December 31, 2013.
Management’s Responsibility for the Consolidated Financial Statements
The management of FUCHS PETROLUB SE is responsible for the preparation of these consoli-
dated financial statements. This responsibility includes that these consolidated financial statements
are prepared in accordance with International Financial Reporting Standards, as adopted by the
EU, and the additional requirements of German commercial law pursuant to Section 315 a (1) of the
German Commercial Code (HGB) and that these consolidated financial statements give a true
and fair view of the net assets, financial position and results of operations of the Group in accordance
with these requirements. The Executive Board is also responsible for the internal controls which
the Executive Board deems to be necessary to enable the preparation of consolidated financial state-
ments that are free from material misstatement, whether due to fraud or error.
Auditor’s responsibility
Our responsibility is to express an opinion on these consolidated financial statements based on our
audit. We conducted our audit in accordance with Section 317 HGB and German generally accepted
standards for the audit of financial statements promulgated by the Institut der Wirtschaftsprüfer
(Institute of Public Auditors in Germany) (IDW), and additionally observed the International Standards
on Auditing (ISA). Accordingly, we are required to comply with ethical requirements and plan
and perform the audit to obtain reasonable assurance about whether the consolidated financial state-
ments are free from material misstatement.
An audit involves performing audit procedures to obtain audit evidence about the amounts and
disclosures in the consolidated financial statements. The selection of audit procedures depends on
the auditor’s professional judgment. This includes the assessment of the risks of material mis-
statement of the consolidated financial statements, whether due to fraud or error. In assessing those
risks, the auditor considers the internal control system relevant to the entity’s preparation of con-
solidated financial statements that give a true and fair view. The aim of this is to plan and perform
audit procedures that are appropriate in the given circumstances, but not for the purpose of
expressing an opinion on the effectiveness of the Group’s internal control system. An audit also
includes evaluating the appropriateness of accounting policies used and the reasonableness of
accounting estimates made by the Executive Board, as well as evaluating the overall presentation of
the consolidated financial statements.
We believe that the audit evidence we have obtained is sufficient and appropriate to provide a basis
for our audit opinion.

2053.3 Independent auditor’s reportF I N A N C I A L R E P O R T
Audit opinion
According to Section 322 (3) sentence 1 of the German Commercial Code (HGB) we state that our
audit of the consolidated financial statements has not led to any reservations.
In our opinion based on the findings of our audit, the consolidated financial statements comply,
in all material respects, with IFRSs, as adopted by the EU, and the additional requirements of German
commercial law pursuant to Section 315 a (1) of the German Commercial Code (HGB) and give
a true and fair view of the net assets and financial position of the Group as at December 31, 2013
as well as the results of operations for the financial year then ended, in accordance with these
requirements.
REPORT ON THE GROU P MANAGEMENT REPORT
We have audited the accompanying Group management report, which is combined with the manage-
ment report of the parent company, of FUCHS PETROLUB SE, Mannheim, for the financial year
from January 1 to December 31, 2013. The Executive Board of FUCHS PETROLUB SE is responsible
for the preparation of the Group management report in accordance with the requirements of
German commercial law applicable pursuant to Section 315 a (1) of German Commercial Code (HGB).
We conducted our audit in accordance with Section 317 (2) of the German Commercial Code
(HGB) and German generally accepted standards for the audit of the combined management report
promulgated by the Institut der Wirtschaftsprüfer (Institute of Public Auditors in Germany) (IDW).
Accordingly, we are required to plan and perform the audit of the Group management report to
obtain reasonable assurance about whether the Group management report is consistent with
the con solidated financial statements and the audit findings, as a whole provides a suitable view of
the Group’s position and suitably presents the opportunities and risks of future development.
According to Section 322 (3) sentence 1 of the German Commercial Code (HGB) we state that our
audit of the Group management report has not led to any reservations.
In our opinion based on the findings of our audit of the consolidated financial statements and Group
management report, the Group management report is consistent with the consolidated financial
statements, as a whole provides a suitable view of the Group’s position and suitably presents the
opportunities and risks of future development.
Mannheim, March 19, 2014
KPMG AG
Wirtschaftsprüfungsgesellschaft
Krauß Beyer
Auditor Auditor

206 3.4 F I N A N C I A L R E P O R T
FUCHS PETROLUB SE (HGB)
in € million 2013 2012
Investment income 203.6 186.6
Administrative expenses – 31.7 – 28.9
Other operating income 31.5 36.5
Other operating expenses – 4.9 – 7.6
26.6 28.9
Earnings before interest and tax (EBIT) 198.5 186.6
Financial result – 4.9 – 2.3
Earnings from ordinary business activities 193.6 184.3
Income taxes – 32.5 – 28.4
Profit after tax 161.1 155.9
Retained earnings brought forward from the previous year 49.0 62.6
Transfer to other retained earnings – 80.6 – 78.0
Unappropriated profit 129.5 140.5
in € millionDec. 31,
2013Dec. 31,
2012
Assets
Intangible assets 3.1 2.3
Property, plant and equipment 3.8 3.9
Financial assets 425.3 427.4
Property, plant and equipment 432.2 433.6
Receivables due from affiliated companies 216.6 227.1
Other receivables and other assets 3.5 16.4
Receivables and other assets 220.1 243.5
Cash and cash equivalents 56.5 1.0
Short-term assets 276.6 244.5
Prepaid expenses 0.9 0.7
Total assets 709.7 678.8
Equity and liabilities
Subscribed capital 71.0 71.0
Accounting par value of shares purchased for redemption purposes – 0.4 0.0
70.6 71.0
Capital reserves 95.7 95.7
Retained earnings 388.3 329.3
Unappropriated profit 129.5 140.5
Shareholders’ equity 684.1 636.5
Pension provisions and similar obligations 0.1 0.1
Other provisions 21.0 24.5
Provisions 21.1 24.6
Liabilities 4.5 17.7
Liabilities 4.5 17.7
Total equity and liabilities 709.7 678.8
CONSOLI -DATED INCOME STATEMENT
BALANCE SHEET
FUCHS PETROLUB SE (HGB)

2073.5 Proposal on the appropriation of profits
Proposal on the appropriation of profits
F I N A N C I A L R E P O R T
The Executive Board will recommend to the Supervisory Board that it proposes the following appro-
priation of profits to the 2014 Annual General Meeting:
Proposal on the appropriation of profits (in €)
Distribution of a dividend of €1.38 for each ordinary share
entitled to dividend on the balance sheet date; these were 35,320,765 shares 48,742,655.70
Distribution of a dividend of €1.40 for each preference share
entitled to dividend on the balance sheet date; these were 35,320,765 shares 49,449,071.00
98,191,726.70
Balance carried forward 31,337,299.57
Unappropriated profit (HGB) of FUCHS PETROLUB SE 129,529,026.27
If the company holds additional own shares not entitled to dividends on the day of the Annual
General Meeting, the proposed resolution will be changed to the effect that the amounts attributable
to these shares will be carried forward to new account.

208 F U R T H E R I N F O R M AT I O N
Glossary
A
A SSOCIATED COMPANY
An associated company is an entity in
which the investor has significant influence
(investor owns 20 % or more of the
voting shares) and which is not a controlled
entity of the investor.
C
C APITAL EMPLOYED
Average capital employed consists of share-
holders’ equity, interest-bearing liabil-
ities, pension provisions and accumulated
goodwill amortization, after the deduc-
tion of cash and cash equivalents.
C A SH FLOW
The difference between income and
expenditure in a reporting period. The gross
cash flow presented by the FUCHS
PETROLUB Group in the Annual Report is
calculated on the basis of
Profit after tax
+ Depreciation and amortization of long-
term assets
± Change in long-term provisions
± Change in deferred taxes
± Non-cash income from companies
consolidated at equity.
The gross cash flow is an indication of a
company’s internal financial resources avail-
able for investment, financing net cur-
rent assets, debt repayment, dividend pay-
ments and maintaining liquidity.
COMPLIANCE
Compliance with all legal requirements,
guidelines and ethical standards relevant to
the company.
CORPOR ATE GOVERNANCE
Internationally used term for responsible
management and supervision with a view to
long-term value creation. Corporate
governance comprises the entire system of
managing and supervising a company
and includes its organization, business-policy
principles and guidelines, as well as all
internal and external controlling and moni-
toring mechanisms.
D
DECL AR ATION OF COMPLIANCE
Declaration by the Supervisory Board and
Executive Board pursuant to Section 161
of the German Stock Corporation Act (AktG)
concerning the implementation of the
recommendations of the German Corporate
Governance Code.
DERIVATIVE FINANCIAL
INSTRUMENTS
Financial products whose own value is
primarily derived from the price, price fluc-
tuations and price expectations of an
underlying hedged transaction, without this
transaction actually having to be per-
formed. Derivatives are used by the FUCHS
PETROLUB Group solely to limit exchange
rate and interest-rate risks from the operat-
ing business.
E
EBIT
Abbreviation for earnings before interest
and tax. Profit before financial result, taxes,
and including shares of non-controlling
shareholders.
EBITDA
Abbreviation for earnings before interest,
tax, depreciation and amortization.
EBIT before amortization and depreciation
of property, plant and equipment.
EBIT MARGIN
Earnings before interest and tax (EBIT) in
relation to sales revenue.
EBT
Abbreviation for earnings before tax.
Profit before tax, and including shares of
non-controlling shareholders.
EQUIT Y METHOD
Method of consolidation for including
joint ventures and associated companies in
the consolidated financial statements.
The Group’s ownership interest is entered
as its share of these companies’ equity
capital. Changes in the equity capital of
these companies have an effect on the
valuation of the Group balance sheet item
“Shares in companies consolidated at
equity”, proportionate net profits are shown
under “Income from companies con-
solidated at equity” in the consolidated
income statement.
EQUIT Y R ATIO
Proportion of capital resources (= sub-
scribed capital, reserves and accumulated
other capital) to the balance-sheet total.

209GlossaryF U R T H E R I N F O R M AT I O N
I
IA S
Abbreviation for International Account ing
Standards. Accounting principles intended
to guarantee international harmonization
and the comparability of financial statements
and disclosure. They are prepared by an
international committee, the “International
Accounting Standards Board” (IASB).
I FRS
Acronym for “International Financial Report-
ing Standards”: They have replaced
the “International Accounting Standards”
(IAS) since 2001. FUCHS PETROLUB SE
has compiled its consolidated financial state-
ments in line with IAS / IFRS since 2002.
INCOME FROM COMPANIES
CONSOLIDATED AT EQUIT Y
Proportional net profit from joint ventures
and associated companies that are
included in the consolidated financial state-
ments using the equity method.
J
JOINT VENTURES
Enterprises managed jointly with other
companies, where each company has an
equal share.
M
MDA X
Share index of German companies with a
medium market capitalization. The MDAX,
which comprises 50 companies, is the
second value segment after the DAX (30
companies with a high market capi-
talization). The FUCHS PETROLUB prefer-
ence shares have been approved for
the Prime Standard section of the German
Stock Exchange since January 1, 2003
and have been included in the MDAX seg-
ment since June 2008.
N
NET OPER ATING WORKING C APITAL
Net operating working capital (NOWC)
is made up of inventories, trade receivables
minus trade payables. It defines the
capital needed directly for the generation
of sales revenues.
P
PARTIC IPATION INTEREST
Company, upon which no significant
influence is exercised (shareholding less than
20 %).
R
R ATE OF TA X ATION
Corporate income tax expense relative to
EBIT before income from companies
consolidated at equity minus financial result
RETURN ON EQUIT Y
Profit after tax, in relation to shareholders’
equity.
RETURN ON SALES
Earnings after tax in relation to sales
revenues.
ROCE
Abbreviation for return on capital employed
(earnings before scheduled goodwill
amortization, financial result, taxes, and
non- controlling shareholders in relation
to capital employed).
S
SUBSIDIARY
Company controlled by another company.
V
VOL ATIL IT Y
Volatility is the measure of how much the
price of securities or exchange rates
has moved around the mean price over a
certain period of time.

210
Publisher
FUCHS PETROLUB SE
Friesenheimer Straße 17
68169 Mannheim, Germany
Telephone: +49-(0)621-3802-0
Fax: +49-(0)621-3802-7190
www.fuchs-oil.com
Investor Relations
Telephone: +49-(0)621-3802-1105
Fax: +49-(0)621-3802-7274
Press
Telephone: +49-(0)621-3802-1104
Fax: +49-(0)621-3802-7274
Imprint
Concept and design
3st kommunikation GmbH, Mainz
Photography | picture credits
Matthias Müller BFF
Mick Ryan
Shutterstock
FUCHS photo gallery
Illustration
Xenia Fink
Composition
BG media design GmbH, Darmstadt
Stork Druckerei GmbH, Bruchsal
This annual report was published on March 20, 2014 and can be ordered from FUCHS PETROLUB SE,
Investor Relations, in both German and English.
You can also access and download all financial reports of FUCHS PETROLUB SE on our website and
view the German and English versions of the annual report as interactive online annual reports.
www.fuchs-oil.com

February 28 Provisional fi gures for the fi nancial year 2013
March 20 Annual report 2013
May 5 Interim report as at March 31, 2014
May 7 Annual General Meeting in Mannheim
May 8 Information event for Swiss shareholders in Zurich
August 1 Interim report as at June 30, 2014
October 31 Interim report as at September 30, 2014
Financial Calendar
ANNUAL GENER AL MEETING 2014
The Annual General Meeting will take place on Wednesday, May 7, 2014 at
10.00 a.m. in the Mozart Room of the Rosengarten Congress Center, Rosengarten-
platz 2 in Mannheim. Shareholders will also receive an invitation and the
agenda via their depository banks. The payment of dividends to be approved by
the Annual General Meeting will be made on May 8, 2014.
DISC L AIM ER
This annual report contains statements about future developments that are based
on assumptions and estimates by the management of FUCHS PETROLUB SE.
Even if the management is of the opinion that these assumptions and estimates
are accurate, future actual developments and future actual results may differ
signifi cantly from these assumptions and estimates due to a variety of factors.
These factors can include changes in the overall economic climate, changes
to exchange rates and interest rates, and changes in the lubricants industry. FUCHS
PETROLUB SE provides no guarantee that future developments and the
results actually achieved in the future will match the assumptions and estimates
set out in this annual report and assumes no liability for such.
DATES 2014
210
Publisher
FUCHS PETROLUB SE
Friesenheimer Straße 17
68169 Mannheim, Germany
Telephone: +49-(0)621-3802-0
Fax: +49-(0)621-3802-7190
www.fuchs-oil.com
Investor Relations
Telephone: +49-(0)621-3802-1105
Fax: +49-(0)621-3802-7274
Press
Telephone: +49-(0)621-3802-1104
Fax: +49-(0)621-3802-7274
Imprint
Concept and design
3st kommunikation GmbH, Mainz
Photography | picture credits
Matthias Müller BFF
Mick Ryan
Shutterstock
FUCHS photo gallery
Illustration
Xenia Fink
Composition
BG media design GmbH, Darmstadt
Stork Druckerei GmbH, Bruchsal
This annual report was published on March 20, 2014 and can be ordered from FUCHS PETROLUB SE,
Investor Relations, in both German and English.
You can also access and download all fi nancial reports of FUCHS PETROLUB SE on our website and
view the German and English versions of the annual report as interactive online annual reports.
www.fuchs-oil.com

Ten-year overview
FUCHS PETROLUB GROU P
Amounts in € million 2013 2012 201110 2010 2009 2008 2007 2006 2005 2004
Earnings
Sales revenues 1,831.6 1,819.1 1,651.5 1,458.6 1,178.1 1,393.7 1,365.3 1,323.3 1,192.2 1,096.3
Germany 1 410.3 411.1 380.9 351.8 267.1 343.7 324.7 300.8 268.2 262.2
International 1 1,421.3 1,408.0 1,270.6 1,106.8 911.0 1,050.0 1,040.6 1,022.5 924.0 834.1
Cost of materials 1,038.6 1,054.4 954.9 808.0 645.4 820.7 776.7 777.4 682.0 605.6
Gross Profi t 689.9 666.0 604.6 567.0 457.1 488.1 509.2 466.9 424.8 407.7
in % of sales revenues 37.7 36.6 36.6 38.9 38.8 35.0 37.3 35.3 35.6 37.2
Earnings before interest and tax (EBIT) 312.3 293.0 263.5 250.1 179.9 171.7 195.2 161.2 128.8 86.2
in % of sales revenues 17.0 16.1 16.0 17.1 15.3 12.3 14.3 12.2 10.8 7.9
Financial result 2 – 1.6 – 1.9 – 3.7 – 4.7 – 7.0 – 8.9 – 8.5 – 11.8 – 15.7 – 18.8
Earnings after tax 2 218.6 207.0 183.1 171.6 121.4 110.3 120.3 97.2 74.2 40.1
in % of sales revenues 11.9 11.4 11.1 11.8 10.3 7.9 8.8 7.3 6.2 3.7
Assets / equity and liabilities
Long-term assets 468.2 440.4 392.1 358.8 307.2 292.7 265.8 266.8 279.6 254.0
Short-term assets 693.8 668.3 593.2 535.4 438.5 411.1 449.1 419.6 411.7 374.6
Balance sheet total 1,162.0 1,108.7 985.3 894.2 745.7 703.8 714.9 686.4 691.3 628.6
Shareholders’ equity 3 853.5 781.7 658.2 545.9 392.9 315.3 325.9 303.2 232.6 159.8
in % of total assets 73.5 70.5 66.8 61.0 52.7 44.8 45.6 44.2 33.6 25.4
Provisions 3, 4 46.3 59.2 46.6 97.9 129.2 111.0 111.1 97.0 94.7 97.5
Financial liabilities 7.8 8.9 14.1 19.7 58.2 124.1 71.9 98.5 157.3 194.2
in % of total assets 0.7 0.8 1.4 2.2 7.8 17.6 10.1 14.4 22.8 30.9
Net gearing 5 – 0.18 – 0.14 – 0.08 0.00 0.13 0.56 0.23 0.38 0.80 1.39
Other liabilities 4 254.4 258.9 266.4 230.7 165.4 153.4 206.0 187.7 206.7 177.1
Return on equity in % 6 26.7 29.0 31.0 36.6 35.3 33.3 37.1 36.9 38.1 32.5
Financing
Gross cash fl ow 224.6 219.0 134.9 173.4 139.9 126.8 147.8 116.8 100.8 81.7
Cash infl ow from operating activities 215.1 203.1 89.2 133.2 206.3 59.6 152.2 90.7 77.8 84.7
Cash outfl ow from investing activities – 65.2 – 62.7 – 30.2 – 55.5 – 25.5 – 52.1 – 23.8 – 4.3 – 26.1 – 28.6
Cash fl ow from fi nancing activities – 114.2 – 75.8 – 71.4 – 80.0 – 110.7 – 50.6 – 103.2 – 71.2 – 54.7 – 57.4
Free cash fl ow 149.9 140.4 59.0 77.7 180.8 7.5 128.4 86.4 51.7 56.1
Investments in property, plant and
equipment and intangible assets 70.2 61.0 35.6 32.4 29.9 46.6 24.4 18.1 28.8 22.1
Depreciation of property, plant and equip-
ment and intangible assets (scheduled) 27.7 26.9 26.4 22.5 20.1 18.8 18.8 19.7 21.9 24.3
in % of investments 39.5 44.1 74.2 69.4 67.2 40.3 77.0 108.8 76.0 110.0
TE
N-Y
EA
R O
VE
RV
IEW

FUCHS PETROLUB GROU P
Amounts in € million 2013 2012 201110 2010 2009 2008 2007 2006 2005 2004
Employees
Number of employees (average) 3,846 3,754 3,646 3,534 3,587 3,864 3,807 3,909 4,149 4,221
Germany 1,180 1,143 1,086 1,010 1,003 1,073 1,044 1,077 1,101 1,094
International 2,666 2,611 2,560 2,524 2,584 2,791 2,763 2,832 3,048 3,127
Personnel expenses 255.7 249.1 226.8 215.9 193.8 191.0 182.0 181.5 174.4 173.5
in % of sales revenues 14.0 13.7 13.7 14.8 16.5 13.7 13.3 13.7 14.6 15.8
Sales revenues per employee
(in € thousand) 476.2 484.6 453.0 412.7 328.4 360.7 358.6 338.5 287.3 259.7
Research and development
Research and development expenses 30.6 29.2 27.5 25.1 22.2 22.7 23.7 22.1 20.6 21.4
in % of sales revenues 1.7 1.6 1.7 1.7 1.9 1.6 1.7 1.7 1.7 2.0
FUCHS SHARES
Amounts in € 2013 2012 201110 2010 2009 2008 2007 2006 2005 2004
Earnings
per share 7, 8
Ordinary 3.06 2.90 2.56 2.39 1.69 1.48 1.54 1.23 0.93 0.60
Preference 3.08 2.92 2.58 2.41 1.71 1.50 1.56 1.25 0.95 0.62
Dividend distribution
(in € million) 9 98.2 91.6 70.3 63.2 39.5 37.1 37.0 25.2 17.4 13.7
Dividend per ordinary share 8, 9 1.38 1.28 0.98 0.88 0.55 0.51 0.48 0.31 0.21 0.17
Dividend per preference share 8, 9 1.40 1.30 1.00 0.90 0.57 0.53 0.50 0.33 0.23 0.19
Number of shares
in thousand as at 31. 12. 8Ordinary 35,321 35,490 35,490 35,490 35,490 35,792 37,749 38,907 38,907 38,907
Preference 35,321 35,490 35,490 35,490 35,490 35,792 37,755 38,907 38,907 38,907
Stock exchange prices on December 31
Ordinary share 8 61.8 53.0 30.1 32.9 20.2 13.0 21.0 17.3 10.6 8.6
Preference share 8 71.0 56.2 33.8 37.0 21.6 11.3 20.2 19.3 11.0 8.0
Participation certifi cate 1998 – 2008 (in %) – – – – – – 103.5 109.8 113.9 115.3
1 Sales revenues by customer location.
2 Previous year’s fi gures have been adjusted due to the application of IAS 19R, see “Application of new accounting standards” in the notes to the consolidated
fi nancial statements.
3 From 2007 on direct allocation of actuarial gains and losses against equity.
4 From 2011 on employee-related liabilities are shown under Other liabilities. Until 2010 they were stated under Provisions.
5 The ratio of fi nancial liabilities plus pension provisions and minus cash and cash equivalents to shareholders’ equity.
6 The calculation has been based on average shareholders’ equity.
7 Before scheduled goodwill amortization.
8 For better comparability, the prior-year fi gures have been adjusted for changes in the equity structure (bonus shares, share split, capital increases).
9 Dividend proposal for 2013.
10 Figures 2011 adjusted, see “Application of new accounting standards” in the notes to the consolidated fi nancial statements 2012.

FU
CH
S P
ET
RO
LU
B S
E |
AN
NU
AL
RE
PO
RT
20
13

FU
CH
S P
ET
RO
LU
B S
E |
AN
NU
AL
RE
PO
RT
20
13


![Protective Effect of Conventional Antioxidant ( -Carotene ... · persions was measured using pH meter (HANNA instru-ments, HI8417, Portugal) [12]. Morphology of the Gels The samples](https://static.fdocuments.net/doc/165x107/5e77019973547d1f0f14a9b4/protective-effect-of-conventional-antioxidant-carotene-persions-was-measured.jpg)