Fundamental Concepts In Inferential Statistics1 · Fundamental concepts in inferential statistics 1...
12
Fundamental Concepts In Inferential Statistics1
Transcript of Fundamental Concepts In Inferential Statistics1 · Fundamental concepts in inferential statistics 1...
Fundamental Concepts In Inferential Statistics1
___Published by European Centre for Research Training and Development UK (www.eajournals.org)
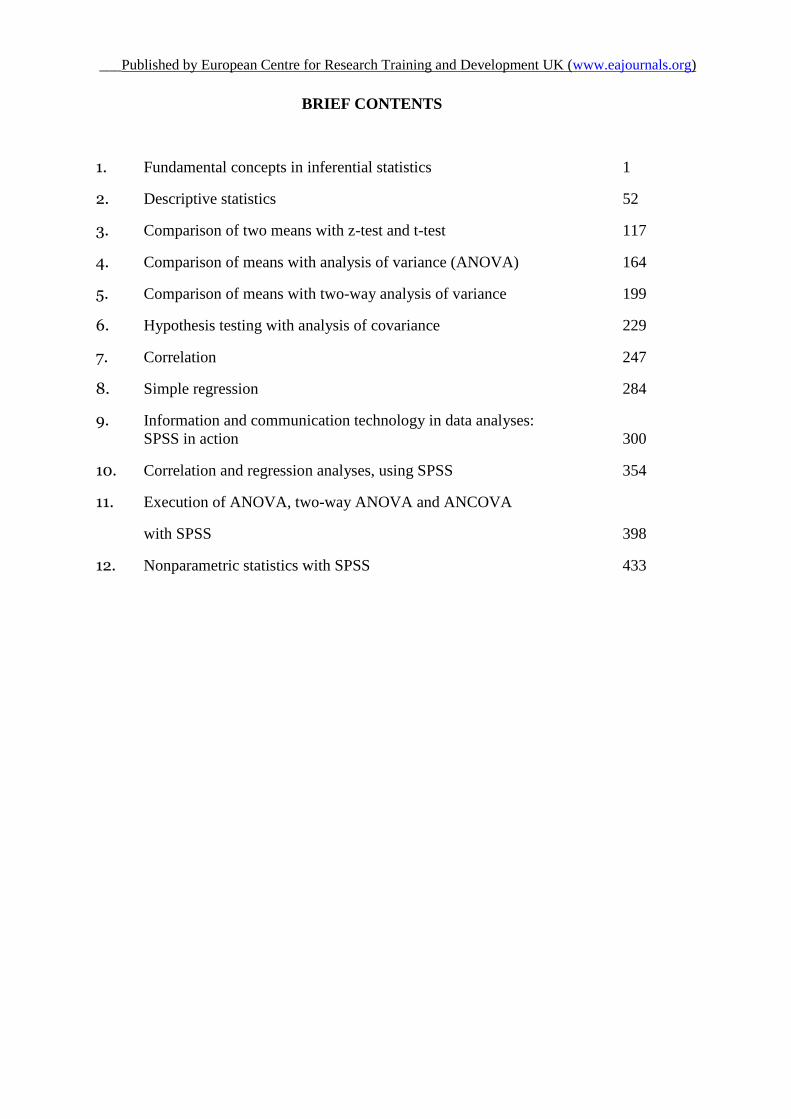
BRIEF CONTENTS
1. Fundamental concepts in inferential statistics 1
2. Descriptive statistics 52
3. Comparison of two means with z-test and t-test 117
4. Comparison of means with analysis of variance (ANOVA) 164
5. Comparison of means with two-way analysis of variance 199
6. Hypothesis testing with analysis of covariance 229
7. Correlation 247
8. Simple regression 284
9. Information and communication technology in data analyses:
SPSS in action 300
10. Correlation and regression analyses, using SPSS 354
11. Execution of ANOVA, two-way ANOVA and ANCOVA
with SPSS 398
12. Nonparametric statistics with SPSS 433
___Published by European Centre for Research Training and Development UK (www.eajournals.org)
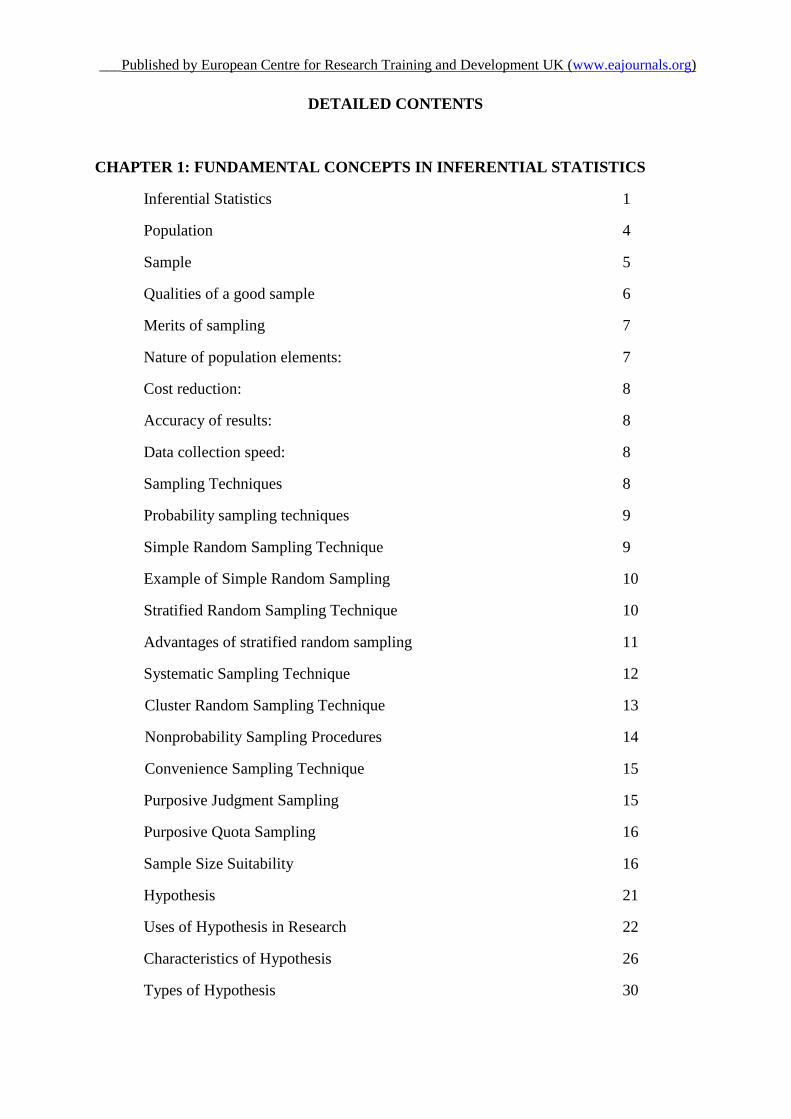
DETAILED CONTENTS
CHAPTER 1: FUNDAMENTAL CONCEPTS IN INFERENTIAL STATISTICS
Inferential Statistics 1
Population 4
Sample 5
Qualities of a good sample 6
Merits of sampling 7
Nature of population elements: 7
Cost reduction: 8
Accuracy of results: 8
Data collection speed: 8
Sampling Techniques 8
Probability sampling techniques 9
Simple Random Sampling Technique 9
Example of Simple Random Sampling 10
Stratified Random Sampling Technique 10
Advantages of stratified random sampling 11
Systematic Sampling Technique 12
Cluster Random Sampling Technique 13
Nonprobability Sampling Procedures 14
Convenience Sampling Technique 15
Purposive Judgment Sampling 15
Purposive Quota Sampling 16
Sample Size Suitability 16
Hypothesis 21
Uses of Hypothesis in Research 22
Characteristics of Hypothesis 26
Types of Hypothesis 30
___Published by European Centre for Research Training and Development UK (www.eajournals.org)
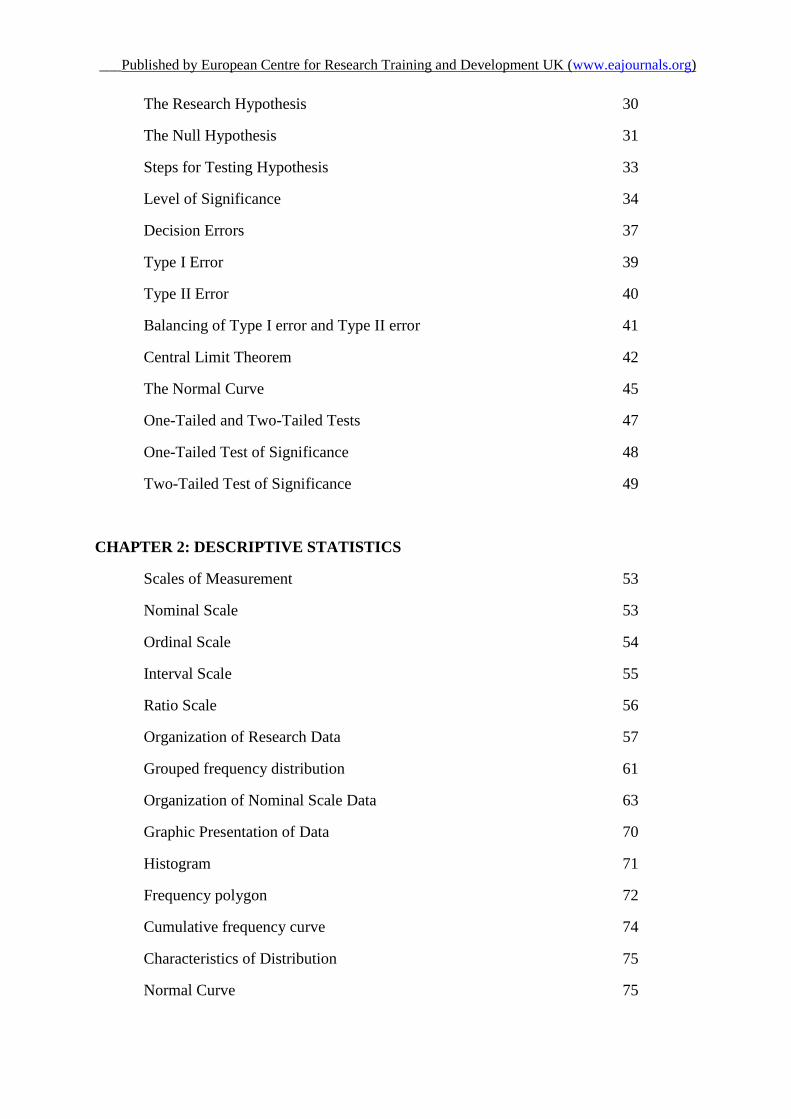
The Research Hypothesis 30
The Null Hypothesis 31
Steps for Testing Hypothesis 33
Level of Significance 34
Decision Errors 37
Type I Error 39
Type II Error 40
Balancing of Type I error and Type II error 41
Central Limit Theorem 42
The Normal Curve 45
One-Tailed and Two-Tailed Tests 47
One-Tailed Test of Significance 48
Two-Tailed Test of Significance 49
CHAPTER 2: DESCRIPTIVE STATISTICS
Scales of Measurement 53
Nominal Scale 53
Ordinal Scale 54
Interval Scale 55
Ratio Scale 56
Organization of Research Data 57
Grouped frequency distribution 61
Organization of Nominal Scale Data 63
Graphic Presentation of Data 70
Histogram 71
Frequency polygon 72
Cumulative frequency curve 74
Characteristics of Distribution 75
Normal Curve 75
___Published by European Centre for Research Training and Development UK (www.eajournals.org)
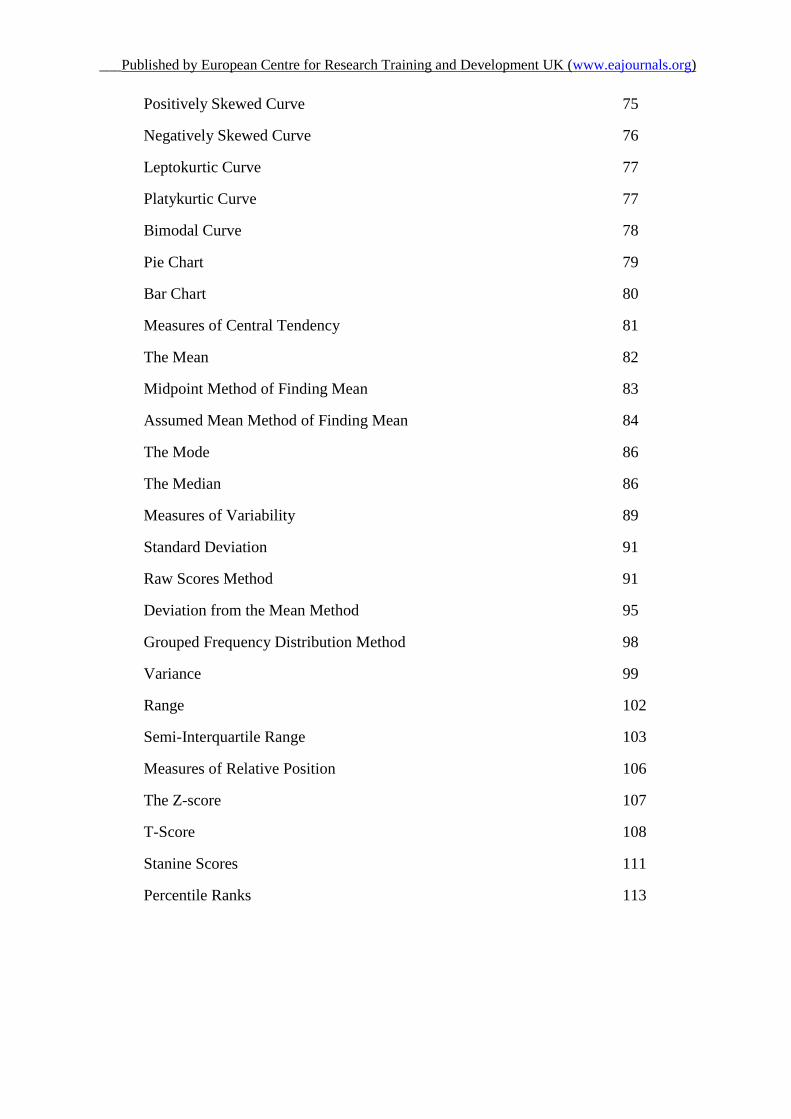
Positively Skewed Curve 75
Negatively Skewed Curve 76
Leptokurtic Curve 77
Platykurtic Curve 77
Bimodal Curve 78
Pie Chart 79
Bar Chart 80
Measures of Central Tendency 81
The Mean 82
Midpoint Method of Finding Mean 83
Assumed Mean Method of Finding Mean 84
The Mode 86
The Median 86
Measures of Variability 89
Standard Deviation 91
Raw Scores Method 91
Deviation from the Mean Method 95
Grouped Frequency Distribution Method 98
Variance 99
Range 102
Semi-Interquartile Range 103
Measures of Relative Position 106
The Z-score 107
T-Score 108
Stanine Scores 111
Percentile Ranks 113
___Published by European Centre for Research Training and Development UK (www.eajournals.org)
CHAPTER 3: COMPARISON OF TWO MEANS WITH Z-TEST AND T-TEST
Distribution of means 117
The Z-Test for Difference Between One Sample Mean And 117
Population Mean When the Population Standard Deviation Is Known 121
The T-Test for Difference between One Sample Mean and
Population Mean When the Population Standard Deviation is Unknown 125
The T-Test for Difference Between Means from Two Independent
Samples 131
Corrected Sum of Squares Method for Computation of Two
Independent Samples T-Test 138
Unbiased Variance Method for Computation of Two Independent
Samples T-Test 140
Summary of Results for Research Articles 143
The Z-Test for Difference Between Two Independent Samples 144
The T-Test for Dependent Samples 150
Difference Scores Standard Deviation Method 152
Direct Difference Scores Method 156
Standard Error of the Difference Between Two Dependent Means Method 158
CHAPTER 4: COMPARISON OF MEANS WITH ANALYSIS OF VARIANCE
(ANOVA)
Assumptions that Underlie ANOVA 165
Normal Distribution of the Population 165
Independence of Observations 165
Homoscedasticity 166
Example of ANOVA for Hypothesis Testing 166
Raw-Scores Method of ANOVA Computation 168
The F-Ratio 168
Mean square 168
Degrees of freedom 169
Sources of variation 170
___Published by European Centre for Research Training and Development UK (www.eajournals.org)
Summary of ANOVA Equations 172
Sources of variation 173
Degrees of freedom 174
Mean squares 175
The F-ratio 175
Summary of ANOVA Results 175
Deviation from Grand Mean Method of Computing ANOVA 177
The F-ratio 177
Mean squares 177
Degrees of freedom 178
Sources of variation 178
Degrees of freedom 181
Mean squares 181
The F-ratio 182
Multiple Comparisons 183
Post Hoc or a Posteriori Tests 183
Fisher’s Protected T-Tests (ť) 184
Fisher’s LSD 185
Application of Fisher’s LSD: 189
Scheffé’s Test (Fs) 190
Tukey’s HSD (q) 196
CHAPTER 5: COMPARISON OF MEANS WITH TWO-WAY ANALYSIS OF
VARIANCE
Advantages of Two-Way ANOVA 199
Greater generalizability of results 200
Determination of Interaction Effect 200
Two-way ANOVA is more economical 201
Example of Two-Way ANOVA for Hypothesis Testing 201
Raw-Scores Method of Computing Two-Way ANOVA 204
___Published by European Centre for Research Training and Development UK (www.eajournals.org)
The F ratios in two-way ANOVA 204
Mean squares in two-way ANOVA 206
Degrees of freedom in two-way ANOVA 208
Sources of variation in two-way ANOVA 208
Summary of two-way ANOVA equations 212
Calculation of Sources of Variation in Two-Way ANOVA with
Raw-Scores Method 213
Calculation of degrees of freedom in Two-Way ANOVA 216
Calculation of Two-way ANOVA Mean Squares 216
Calculation of F ratios in two-way ANOVA 217
Deviation from Grand Mean Method of Calculating Two-Way ANOVA 220
The F ratios 221
Sources of variation 221
The mean squares 222
Degrees of freedom 223
CHAPTER 6: HYPOTHESIS TESTING WITH ANALYSIS OF COVARIANCE
Uses of Analysis of Covariance 229
Determination of change 230
Elimination of nuisance variables effects 230
ANCOVA reduces the error term 230
ANCOVA adjusts the group means 231
ANCOVA uses randomization 231
Assumptions that Underlie ANCOVA 232
Valid and reliable measurement of the covariate 232
Linearity of the dependent variable and covariate relationship
Homogeneity of regression 233
Example of Analysis of Covariance 233
The F ratio of ANCOVA 236
Adjusted mean squares 236
___Published by European Centre for Research Training and Development UK (www.eajournals.org)
Adjusted degrees of freedom 236
Sources of Variation 237
Sum of products of X and Y 238
Summary of ANCOVA equations 240
Calculation of the ANCOVA 241
CHAPTER 7: CORRELATION
Facts about Correlation 248
Tests of Relationships and Tests of Differences 250
Correlation Statistical Techniques 251
Pearson Product Moment Correlation Coefficient 252
Standard Scores Method 252
Example of Correlation, Using Standard Scores Method 253
Testing Significance of Correlation Coefficient with t Distribution 256
Sum of Squared Deviations Method of Calculating Correlation 258
Raw Scores Method of Calculating Correlation 260
Population Standard Deviation Method 264
Scatterplot 267
Partial Correlation 271
Partial Correlation as Coefficient of Correlation between Residuals of
Variables X and Y on a Third Variable 271
Conventional Technique for Computation of Partial Correlation 275
Multiple Correlation Coefficient 276
Multiple Correlation and Hypothesis Testing 279
Importance of Multiple Correlation 281
CHAPTER 8: SIMPLE REGRESSION
Regression and Correlation Compared 284
Raw Scores Regression Coefficient Method 285
Example of Regression 286
___Published by European Centre for Research Training and Development UK (www.eajournals.org)
Regression Slope and Regression Intercept 289
Standardized Regression Coefficient 291
Regression Analysis in Hypothesis Testing 295
CHAPTER 9: INFORMATION AND COMMUNICATION TECHNOLOGY IN DATA
ANALYSES: SPSS IN ACTION
Execution of Descriptive Statistics with SPSS 307
T-Test Analyses with SPSS 328
Execution of Independent Samples T-Test, Using SPSS 328
Application of SPSS in Correlated-Samples T Test 341
Single Sample T Test with SPSS 349
CHAPTER 10: CORRELATION AND REGRESSION ANALYSES, USING SPSS
Execution of Pearson Product Moment Correlation, Using SPSS 355
Partial Correlation with the Use of SPSS 364
Multiple Correlation Execution with SPSS 373
Execution of Simple Regression with SPSS 378
Multiple Regression Execution with SPSS 386
Enter Method of Executing Multiple Regression with SPSS 387
Stepwise Method of Executing Multiple Regression with SPSS 392
CHAPTER 11: EXECUTION OF ANOVA, TWO-WAY ANOVA AND ANCOVA
WITH SPSS
Application of SPSS in Independent Samples ANOVA 399
Application of SPSS in Repeated Measures ANOVA 406
Two-Way ANOVA Execution with SPSS 415
Execution of ANCOVA with SPSS 424
___Published by European Centre for Research Training and Development UK (www.eajournals.org)
CHAPTER 12: NONPARAMETRIC STATISTICS WITH SPSS
Wilcoxon Test for Two Related Samples 434
Sign Test for Two Related Samples 437
Mann-Whitney U-Test 439
Kruskal-Wallis K Independent Samples Test 443
Friedman K Related Samples Test 447
Spearman Correlation Coefficient with SPSS 450
Chi-Square, Using SPSS 458

___Published by European Centre for Research Training and Development UK (www.eajournals.org)