Forecasting Final Energy Consumption using the Centered Moving ...
Upload
alexander-deckerCategory
view
372download
1
Journal of Energy Technologies and Policy www.iiste.org
ISSN 2224-3232 (Paper) ISSN 2225-0573 (Online)
Vol.3, No.11, 2013 – Special Issue for International Conference on Energy, Environment and Sustainable Economy (EESE 2013)
170
EESE-2013 is organised by International Society for Commerce, Industry & Engineering.
Forecasting of Electric Consumption in a Semiconductor Plant
using Time Series Methods
Prayad B.1*
Somsak S.2
Spansion Thailand Limited 229 Moo 4, Changwattana Road, Pakkred, Nonthaburi 11120 Nonthaburi, Thailand
*[email protected] , [email protected]
Abstract
This paper presents the method of electric consumption forecasting by using time series in analyzing data. The
source of time series data come from the Metropolitan Electricity Authority (MEA) monthly energy consumption
(kWh) during 2010 – 2012, 36 months in total. The objective is to select the best forecasting method from least
Mean Absolute Present Error (MAPE). The results of this study show that single exponential smoothing was the
best method and least MAPE at 5.60 smoothing constant = 0.706780 and also shows the highest significant
level compared to the others by using interpolation model in Minitab program. The best forecasting method will
be used in forecasting the electricity consumption in the future.
Keywords: time series method, electric consumption forecasting, means absolute present error, energy
consumption charge
1. Introduction
1.1 Introduce the Problem
There are many cases in which a business will make use historic data based on customer information to make
predictions or forecast future trends. Forecasting is an important planning tool of particular relevance in the
business environment. So then, electrical load forecasting is a main to planning due to it have many parameters
relevant such as ft, exchange rate, electricity tariff rate, and volume driven. The researcher has an opportunity to
work in a semiconductor plant. Found that, it is a difficult in electric load forecasting because it is a dynamic
machine running as demand or volume driven. However, electricity planning system must be accurate for the
optimal operation process to least unit cost as well.
Electrical load forecasting is an antique issue in the electricity planning in a semiconductor plant because; it is a
big cost to consider for maximizes profit or least unit cost. From the earliest times, it has always been a way to
enable the physical balance between the supply and the demand, allowing a reliable system operation. Its role is
fundamental to support the analysis of the capacity expansion of existing processes. In a short term perspective,
it is also valuable to provide an optimized machine running, helping to manage at least unit cost process. It is
therefore essential, according to an operational and planning perspective, to make sure that electricity is available
for any period of time align with budget. Electrical load forecasting classified into three categories; short term,
medium term and long term load forecasting (C. Narumol, 2002). Over the past several decades, researchers
have studied a problem to improving load forecast accuracy, and a wide variety of models have been presented.
For instance, (D. Srinivasan, C.S. Chang, A.C. Liew, 1995) presented linear regression models for electricity
consumption forecasting, (Bianco V, Manca O, Nardini S., 2009) applied grey prediction model for energy
consumption, (Zhou P, Ang BW, Poh KL., 2006) presented an improved singular spectral analysis method for
short-term load forecasting in Iran electricity market, (Kumar and Jain, 2010) applied three time series models,
namely, Grey-Markov model, Grey-Model with rolling mechanism, and singular spectrum analysis to forecast
the consumption of conventional energy in India (6 Afshar K, Bigdeli N., 2011).
Forecasting models merely identify patterns in the data being analyzed and using these patterns, forecast what
the variable will do in the future. They are relatively simple to build and use. It is does not depend on some
underlying theory, they were based on mathematical relationships designed to capture patterns in the data and
this paper using electricity in the past totally 36 months to forecasting and facilitated using Minitab program. In
section II literature reviews each time series forecasting method is presented and discussed. The methodology is
performing in section 2. In section 3 presented and evaluated the results each time series forecasting method.
Conclusions and discussion follow in section 4.
1.2 Literature reviews
Discuss Electric load forecasting method has many methods and interested in study, however, the constraint of

Journal of Energy Technologies and Policy www.iiste.org
ISSN 2224-3232 (Paper) ISSN 2225-0573 (Online)
Vol.3, No.11, 2013 – Special Issue for International Conference on Energy, Environment and Sustainable Economy (EESE 2013)
171
EESE-2013 is organised by International Society for Commerce, Industry & Engineering.
time which is researcher decision selected time series method to apply to semiconductor plant who has the six
methods detail as following;
· Trend analysis method (Bianco V, Manca O, Nardini S., 2009)
This method makes use of statistical technique known as the time series. The time series is an ordered sequence
of events over a period of time relating to a certain variety. It shows a series of values of a dependent variable as
it changes from one point of time to another by using time series it is possible to project the trend of scales in the
future. These are one method used for trend projection was the least square method. It uses data in the part to
future projections by using fit linear equation. Equation (1) is used to compute the average and to forecast the
next period.
Y(t+1) = (1)
Where Y= Forecasting data, t = Time, Yt = Value of times, n = total data
The first n data points are used as the initialization part and the rest as a test part.
· Decomposition method (Benaoudaa D, Murtaghb F, Starckc JL, 2006)
Decomposition method is a generic term for solutions of various problems and design of algorithms in which the
basic idea is to decompose the problem into sub problems. It can be an effective procedure for the analytical
solution of a wide class of dynamical systems without linearization or weak nonlinearity assumptions, closure
approximations, perturbation theory, or restrictive assumptions on stochasticitiy and used data in the part to fours
portions and each portion is trending, season, cycle, uncertain variation. The equation as (2)
Yt = Tt *St *Ct *It; t = 1, 2,… (2)
· Moving average (Pappas SS, Ekonomou L, Karamousantas DC, 2008)
A moving average is commonly used with time series data to smooth out short-term fluctuations and highlight
longer-term trends or cycles. The threshold between short-term and long-term depends on the application, and
the parameters of the moving average will be set accordingly. It uses data in the part to future projections by
using averages from starting point to periods to desire, who is this paper used three months average for analysis.
The equation (3) is used to compute the moving average and to forecast the next period.
Yt = / n (3)
Where n is the number of periods in the moving average.
· Single Exponential smoothing method (Christiaanse W., 1971)
Exponential smoothing is a technique that can be applied to time series data, either to produce smoothed data for
presentation, or to make forecasts. The time series data themselves are a sequence of observations. The observed
phenomenon may be an essentially random process, or it may be an orderly, but noisy, process. Whereas in the
simple moving average the past observations are weighted equally, exponential smoothing assigns exponentially
decreasing weights over time. It is a forecasting method that is easy to use and is handled efficiently by computer
program. The formula can be shown as equation (4)
Yt = Y(t-1)+ α(A(t-1) - Y(t-1)) (4)
Where Yt is new forecast, Y (t-1) is previous forecast, α is smoothing constant (0≤α≤1), A (t-1) is previous period
actual demand.
· Double exponential method (Gelper, S., Fried, R., Croux, C., 2010)
Like the regression forecast, the double exponential smoothing forecast is based on the assumption of a model
consisting of a constant plus a linear trend. It is used for forecasting technique to smooth the trend and slope
directly by using different smoothing constants for each and gives more flexibility in selecting the rates at which
the trend and slope are tracked. The formula can be shown as equation (5)
Y (t+k) = Xt+kTt (5)
Xt = αYt+(1-α)(X(t-1)+ T(t-1) ), Tt= β(Xt-X(t-1) )+(1-β)T(t-1)
Where Tt is estimated of trend, α, β are smoothing parameters, in the range 0 to 1, for the constant and the trend.
· Winter’s method (Gelper, S., Fried, R., Croux, C., 2010)
This method can be extended to deal with time series which contain both trend and seasonal variations. The
Holt-Winters method has two versions, additive and multiplicative, the use of which depends on the
characteristics of the particular time series. The latter will be considered first. It is similar to Holt’s method with
Journal of Energy Technologies and Policy www.iiste.org
ISSN 2224-3232 (Paper) ISSN 2225-0573 (Online)
Vol.3, No.11, 2013 – Special Issue for International Conference on Energy, Environment and Sustainable Economy (EESE 2013)
172
EESE-2013 is organised by International Society for Commerce, Industry & Engineering.
an additional element included to account for seasonality. The formula can be shown as equation (6)
Y (t+k) = (Xt+kTt) *S (t-L+k) (6)
St = γ [Yt/Xt ] + (1-γ)*S(t-L+k)
γ is smoothing parameters, in the range 0 to 1, L is the length of seasonality.
2. Method
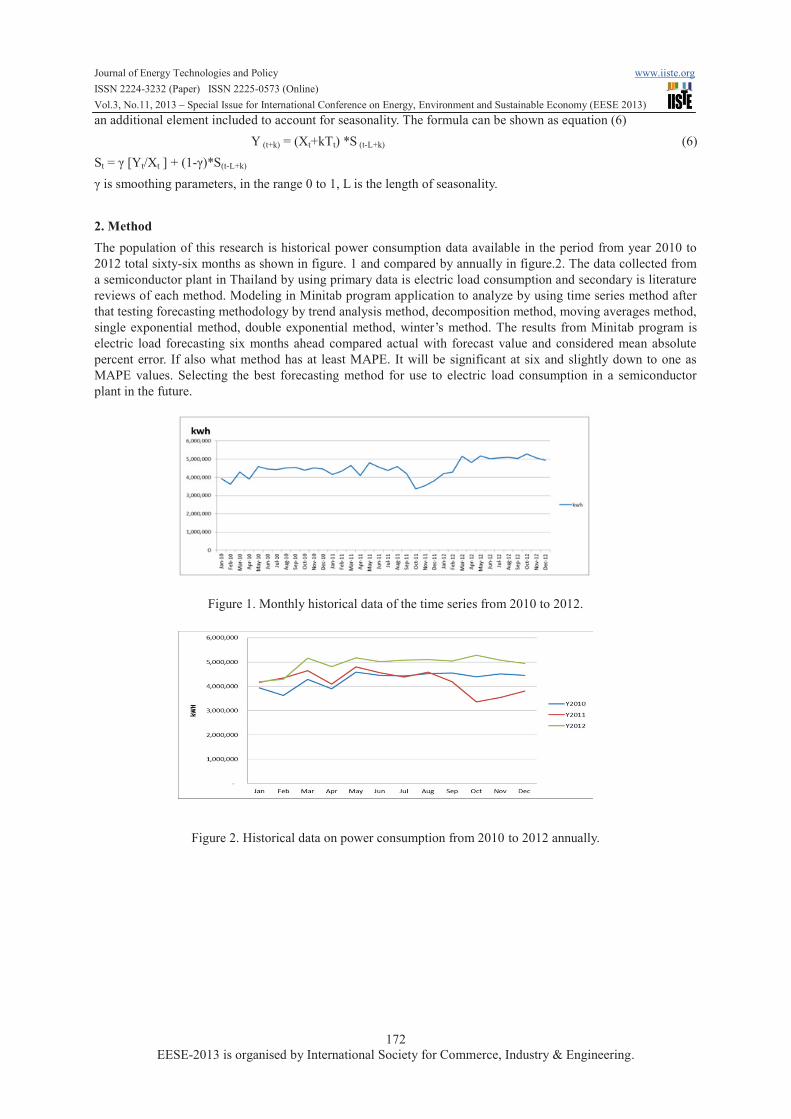
The population of this research is historical power consumption data available in the period from year 2010 to
2012 total sixty-six months as shown in figure. 1 and compared by annually in figure.2. The data collected from
a semiconductor plant in Thailand by using primary data is electric load consumption and secondary is literature
reviews of each method. Modeling in Minitab program application to analyze by using time series method after
that testing forecasting methodology by trend analysis method, decomposition method, moving averages method,
single exponential method, double exponential method, winter’s method. The results from Minitab program is
electric load forecasting six months ahead compared actual with forecast value and considered mean absolute
percent error. If also what method has at least MAPE. It will be significant at six and slightly down to one as
MAPE values. Selecting the best forecasting method for use to electric load consumption in a semiconductor
plant in the future.
Figure 1. Monthly historical data of the time series from 2010 to 2012.
Figure 2. Historical data on power consumption from 2010 to 2012 annually.
Journal of Energy Technologies and Policy www.iiste.org
ISSN 2224-3232 (Paper) ISSN 2225-0573 (Online)
Vol.3, No.11, 2013 – Special Issue for International Conference on Energy, Environment and Sustainable Economy (EESE 2013)
173
EESE-2013 is organised by International Society for Commerce, Industry & Engineering.
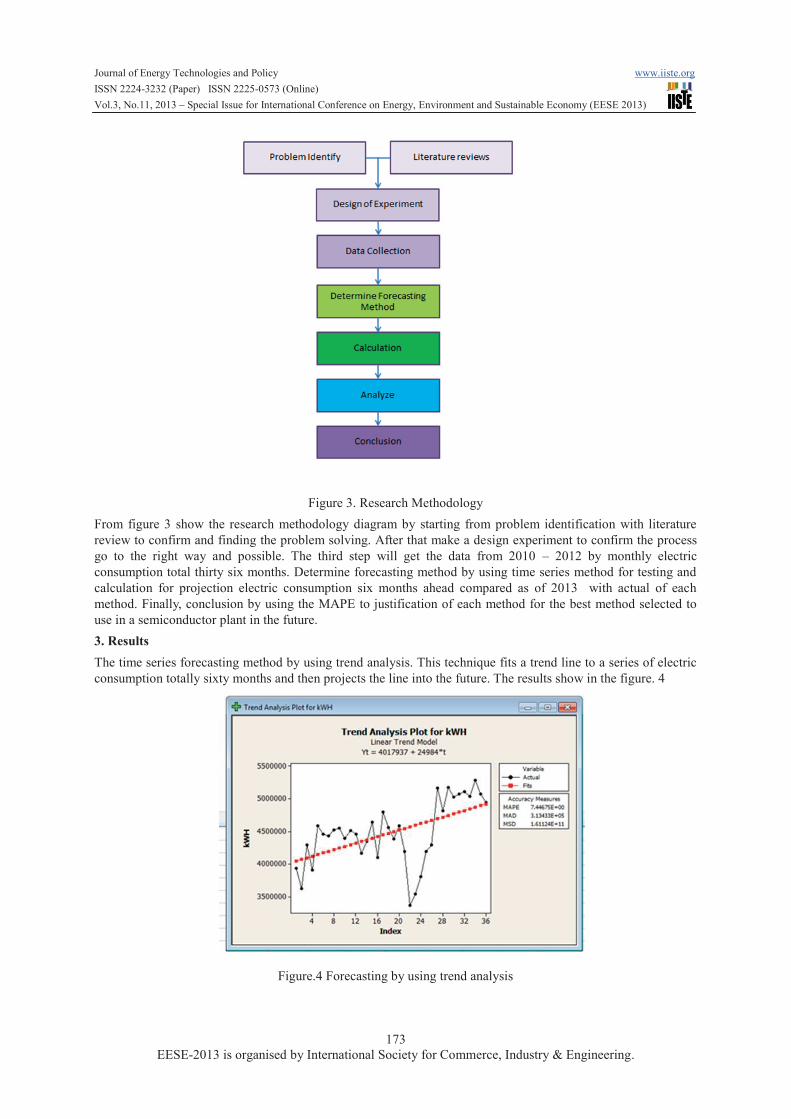
Figure 3. Research Methodology
From figure 3 show the research methodology diagram by starting from problem identification with literature
review to confirm and finding the problem solving. After that make a design experiment to confirm the process
go to the right way and possible. The third step will get the data from 2010 – 2012 by monthly electric
consumption total thirty six months. Determine forecasting method by using time series method for testing and
calculation for projection electric consumption six months ahead compared as of 2013 with actual of each
method. Finally, conclusion by using the MAPE to justification of each method for the best method selected to
use in a semiconductor plant in the future.
3. Results
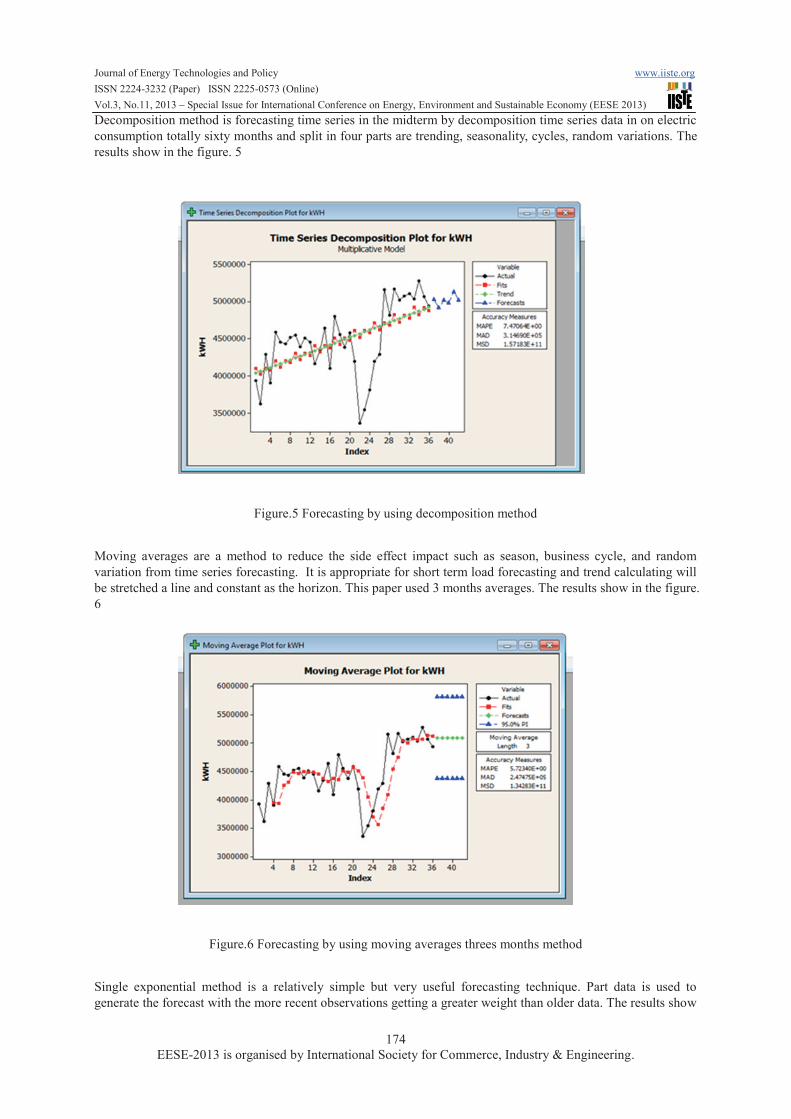
The time series forecasting method by using trend analysis. This technique fits a trend line to a series of electric
consumption totally sixty months and then projects the line into the future. The results show in the figure. 4
Figure.4 Forecasting by using trend analysis
Journal of Energy Technologies and Policy www.iiste.org
ISSN 2224-3232 (Paper) ISSN 2225-0573 (Online)
Vol.3, No.11, 2013 – Special Issue for International Conference on Energy, Environment and Sustainable Economy (EESE 2013)
174
EESE-2013 is organised by International Society for Commerce, Industry & Engineering.
Decomposition method is forecasting time series in the midterm by decomposition time series data in on electric
consumption totally sixty months and split in four parts are trending, seasonality, cycles, random variations. The
results show in the figure. 5
Figure.5 Forecasting by using decomposition method
Moving averages are a method to reduce the side effect impact such as season, business cycle, and random
variation from time series forecasting. It is appropriate for short term load forecasting and trend calculating will
be stretched a line and constant as the horizon. This paper used 3 months averages. The results show in the figure.
6
Figure.6 Forecasting by using moving averages threes months method
Single exponential method is a relatively simple but very useful forecasting technique. Part data is used to
generate the forecast with the more recent observations getting a greater weight than older data. The results show
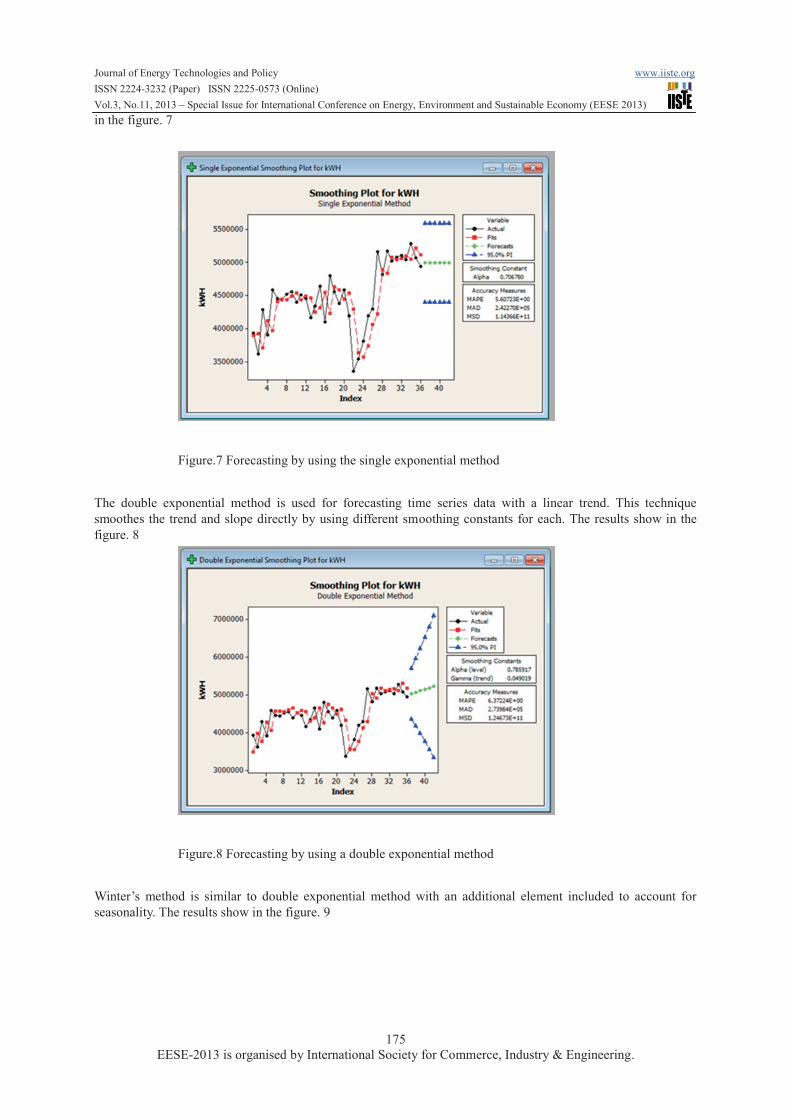
Journal of Energy Technologies and Policy www.iiste.org
ISSN 2224-3232 (Paper) ISSN 2225-0573 (Online)
Vol.3, No.11, 2013 – Special Issue for International Conference on Energy, Environment and Sustainable Economy (EESE 2013)
175
EESE-2013 is organised by International Society for Commerce, Industry & Engineering.
in the figure. 7
Figure.7 Forecasting by using the single exponential method
The double exponential method is used for forecasting time series data with a linear trend. This technique
smoothes the trend and slope directly by using different smoothing constants for each. The results show in the
figure. 8
Figure.8 Forecasting by using a double exponential method
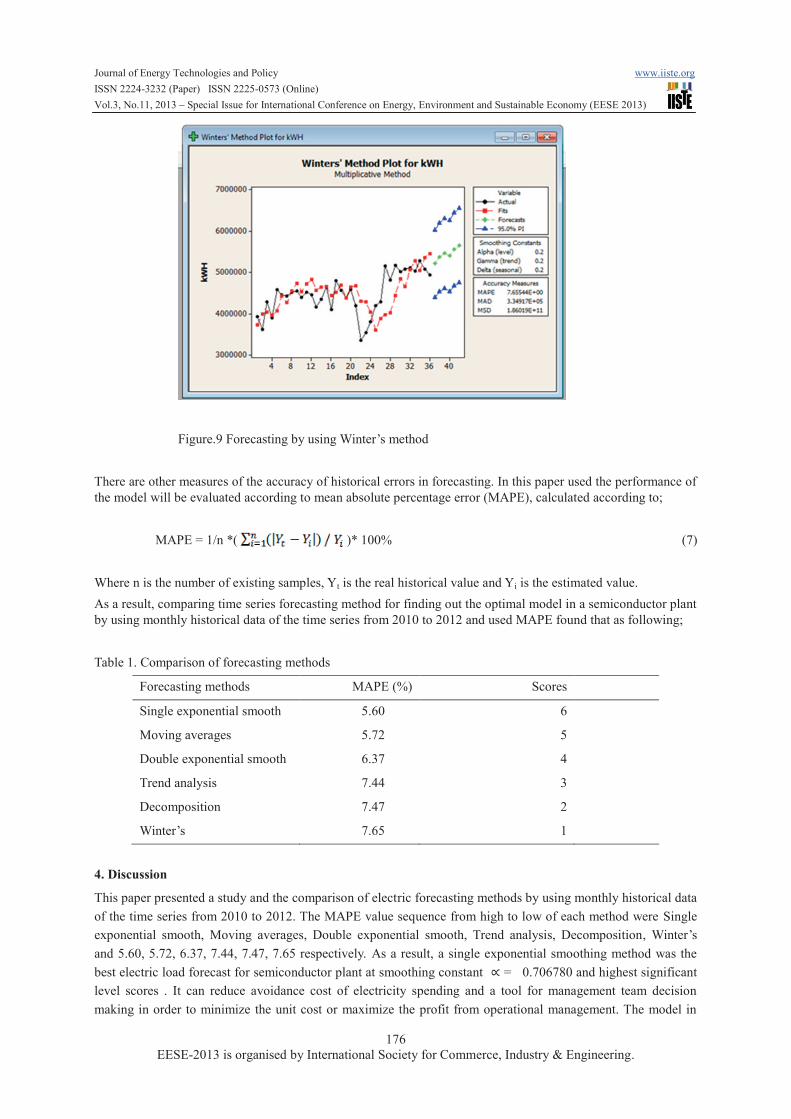
Winter’s method is similar to double exponential method with an additional element included to account for
seasonality. The results show in the figure. 9
Journal of Energy Technologies and Policy www.iiste.org
ISSN 2224-3232 (Paper) ISSN 2225-0573 (Online)
Vol.3, No.11, 2013 – Special Issue for International Conference on Energy, Environment and Sustainable Economy (EESE 2013)
176
EESE-2013 is organised by International Society for Commerce, Industry & Engineering.
Figure.9 Forecasting by using Winter’s method
There are other measures of the accuracy of historical errors in forecasting. In this paper used the performance of
the model will be evaluated according to mean absolute percentage error (MAPE), calculated according to;
MAPE = 1/n *( )* 100% (7)
Where n is the number of existing samples, Yt is the real historical value and Yi is the estimated value.
As a result, comparing time series forecasting method for finding out the optimal model in a semiconductor plant
by using monthly historical data of the time series from 2010 to 2012 and used MAPE found that as following;
Table 1. Comparison of forecasting methods
Forecasting methods MAPE (%) Scores
Single exponential smooth 5.60 6
Moving averages
Double exponential smooth
Trend analysis
Decomposition
Winter’s
5.72
6.37
7.44
7.47
7.65
5
4
3
2
1
4. Discussion
This paper presented a study and the comparison of electric forecasting methods by using monthly historical data
of the time series from 2010 to 2012. The MAPE value sequence from high to low of each method were Single
exponential smooth, Moving averages, Double exponential smooth, Trend analysis, Decomposition, Winter’s
and 5.60, 5.72, 6.37, 7.44, 7.47, 7.65 respectively. As a result, a single exponential smoothing method was the
best electric load forecast for semiconductor plant at smoothing constant = 0.706780 and highest significant
level scores . It can reduce avoidance cost of electricity spending and a tool for management team decision
making in order to minimize the unit cost or maximize the profit from operational management. The model in
Journal of Energy Technologies and Policy www.iiste.org
ISSN 2224-3232 (Paper) ISSN 2225-0573 (Online)
Vol.3, No.11, 2013 – Special Issue for International Conference on Energy, Environment and Sustainable Economy (EESE 2013)
177
EESE-2013 is organised by International Society for Commerce, Industry & Engineering.
this research, can be applied to others time series.
Acknowledgements
The author wishes to thank Dr. Nopphorn for his guidance and provide moral support during this research effort
and Spansion (Thailand) Co., LTD. for helping with electricity data.
References
C.Narumol, J.Somchart. (2002). The forecasting using an average methods and exponential smoothing methods., Ladklabang
Engineering Journal, Vol.19, No.1.
D. Srinivasan, C.S. Chang, A.C. Liew, (1995). Survey of hybrid fuzzy neural approaches to electrical load forecasting.,
Proceedings on IEEE International Conference on Systems, Man and Cybernetics, Part 5, Vancouver, pp. 4004–4008.
Bianco V, Manca O, Nardini S. (2009). Electricity consumption forecasting in Italy using linear regression models, Energy;
34(9):1413e21.
Zhou P, Ang BW, Poh KL. (2006). A trigonometric grey prediction approach to forecasting electricity demand. Energy;
31(14):2839e47.
Kumar U, Jain VK. (2010). Time series models to forecast energy consumption in India., Energy ;35(4):1709e16.
Afshar K, Bigdeli N. (2011). Data analysis and short term load forecasting in Iran electricity market using singular spectral
analysis (SSA). Energy; 36(5): 2620e7.
Bianco V, Manca O, Nardini S. (2009). Electricity consumption forecasting in Italy using linear regression models. Energy;
34(9):1413e21.
Benaoudaa D, Murtaghb F, Starckc JL, (2006). Wavelet-based nonlinear multiscale decomposition model for electricity load
forecasting. Neurocomputing;70(1):139–54.
Pappas SS, Ekonomou L, Karamousantas DC, (2008). Electricity demand loads modeling using autoregressive moving
average (ARMA) models. Energy; 33(9):1353–60.
Christiaanse W. (1971). Short-term load forecasting using general exponential smoothing. Power Apparatus Syst IEEE Trans;
PAS-90(2):900–11.
Gelper, S., Fried, R., Croux, C., (2010). Robust forecasting with exponential and holt winters smoothing. J. Forecast. 29,
285–300.
About Minitab [Online]. Available: http://www.minitab.com/.
This academic article was published by The International Institute for Science,
Technology and Education (IISTE). The IISTE is a pioneer in the Open Access
Publishing service based in the U.S. and Europe. The aim of the institute is
Accelerating Global Knowledge Sharing.
More information about the publisher can be found in the IISTE’s homepage:
http://www.iiste.org
CALL FOR JOURNAL PAPERS
The IISTE is currently hosting more than 30 peer-reviewed academic journals and
collaborating with academic institutions around the world. There’s no deadline for
submission. Prospective authors of IISTE journals can find the submission
instruction on the following page: http://www.iiste.org/journals/ The IISTE
editorial team promises to the review and publish all the qualified submissions in a
fast manner. All the journals articles are available online to the readers all over the
world without financial, legal, or technical barriers other than those inseparable from
gaining access to the internet itself. Printed version of the journals is also available
upon request of readers and authors.
MORE RESOURCES
Book publication information: http://www.iiste.org/book/
Recent conferences: http://www.iiste.org/conference/
IISTE Knowledge Sharing Partners
EBSCO, Index Copernicus, Ulrich's Periodicals Directory, JournalTOCS, PKP Open
Archives Harvester, Bielefeld Academic Search Engine, Elektronische
Zeitschriftenbibliothek EZB, Open J-Gate, OCLC WorldCat, Universe Digtial
Library , NewJour, Google Scholar