FEASIBILITY OF CASSAVA INDUSTRIALISATION IN...
73
Feasibility and Market for Cassava Industrialisation in Uganda: A Strategic Study Confidential – February 2017 FEASIBILITY OF CASSAVA INDUSTRIALISATION IN UGANDA A STRATEGIC STUDY A. GRAFFHAM, LIANG GUOTAO, U. KLEIH, F. ALACHO, G. OKELLO, & A. AKULLU FEBRUARY 2017
Transcript of FEASIBILITY OF CASSAVA INDUSTRIALISATION IN...
Feasibility and Market for Cassava Industrialisation in Uganda: A Strategic Study Confidential – February 2017
FEASIBILITY OF CASSAVA INDUSTRIALISATION IN UGANDA
A STRATEGIC STUDY
A. GRAFFHAM, LIANG GUOTAO, U. KLEIH, F. ALACHO, G. OKELLO, & A. AKULLU
FEBRUARY 2017

Feasibility and Market for Cassava Industrialisation in Uganda: A Strategic Study Confidential – February 2017
Table of Contents ACKNOWLEDGEMENT ............................................................................................ 4
GLOSSARY ................................................................................................................. 5 EXECUTIVE SUMMARY ........................................................................................... 6
1.0 INTRODUCTION .............................................................................................. 9 2.0 CURRENT STATUS OF CASSAVA IN UGANDA ................................... 11
2.1 GEOGRAPHY OF UGANDA’S CASSAVA ECONOMY ......................................... 11
Labor and economic returns ....................................................................... 13 2.2 HOUSEHOLD FOOD SECURITY VERSUS INDUSTRIAL COMMODITY ................. 15
3.0 MARKET OPPORTUNITIES FOR CASSAVA AND OTHER STARCH-BASED PRODUCTS ................................................................................................ 18
3.1 NATIONAL MARKETS ...................................................................................... 18
3.2 IMPORTS ........................................................................................................ 20 3.2.1 Ethanol ................................................................................................... 20 3.2.2 Sugar Syrups .......................................................................................... 21
3.2.3 Starches .................................................................................................. 23
3.3 REGIONAL AND INTERNATIONAL MARKETS .................................................... 24
3.3.1 Global trade in cassava ......................................................................... 24
3.3.2 Growth opportunities for cassava products ........................................... 25 3.3.3 Kenyan Markets for Fast Moving Consumer Goods (FMCG) and
Animal Feed ......................................................................................................... 26
3.4 CASSAVA’S COMPETITIVE POSITION AGAINST OTHER SOURCES OF STARCH 31
3.5 SUMMARY OF POTENTIAL MARKETS .............................................................. 33
4.0 LARGE-SCALE PROCESSING OF CASSAVA ...................................... 35
4.1 TECHNOLOGIES & PRODUCTS ....................................................................... 35 4.1.1 Dry chips ................................................................................................ 35
4.1.2 Hard pellets ............................................................................................ 35
4.1.3 High quality cassava flour (HQCF) ...................................................... 36 4.1.4 Native and modified starches ................................................................. 38 4.1.5 Sugar syrups........................................................................................... 39 4.1.6 Industrial & Extra neutral alcohol ........................................................ 40
4.2 LOCATION OF PROCESSING UNIT ................................................................... 40 4.3 RAW MATERIAL SUPPLY ................................................................................. 42
5.0 COMPETITIVENESS AND INNOVATION................................................. 50 5.1 EXPLOITING INNOVATION IN CASSAVA INDUSTRIALISATION .... 50
5.2 LESSON LEARNING FROM CASSAVA INDUSTRIES OUTSIDE UGANDA ............ 50
5.3 LESSON LEARNING FROM PREVIOUS UGANDAN INVESTMENTS IN INDUSTRIAL
PROCESSING OF CASSAVA ....................................................................................... 53
5.4 CREATING & SUPPORTING A COMPETITIVE ADVANTAGE ............................... 53
6.0 BUSINESS AND FINANCE ......................................................................... 55 6.1 FISCAL ASPECTS ............................................................................................ 55
6.2 SOURCES OF FINANCE ................................................................................... 56 7.0 POLICY AND INSTITUTIONS ..................................................................... 59
7.1 ROLE OF GOVERNMENT IN SUPPORTING CASSAVA INDUSTRIALISATION ....... 59 7.2 CREATING AN ENABLING ENVIRONMENT ....................................................... 59
7.3 STIMULATING INVESTMENTS IN CASSAVA INDUSTRIALISATION ...................... 59

Feasibility and Market for Cassava Industrialisation in Uganda: A Strategic Study Confidential – February 2017
8.0 OUTLINE OF PROPOSALS FOR LARGE-SCALE INVESTMENTS IN CASSAVA .................................................................................................................. 62
8.1 GENERAL THOUGHTS ..................................................................................... 62 8.2 SPECIFICATIONS OF THE FACTORIES ............................................................ 63
8.3 ESTIMATED INVESTMENT SCALE .................................................................... 63 8.4 ANTICIPATED BENEFIT .................................................................................... 65
9.0 CONCLUSIONS AND RECOMMENDATIONS ........................................ 67 10.0 ANNEXES.................................................................................................... 73
ANNEX 1 - PRELIMINARY DESIGN FOR 20TPD HQCF & STARCH PLANT IN UGANDA
.................................................................................................................................. 73
ANNEX 2 - PRELIMINARY DESIGN FOR 100TPD GLUCOSE PLANT IN UGANDA ....... 73

Feasibility and Market for Cassava Industrialisation in Uganda: A Strategic Study Confidential – February 2017
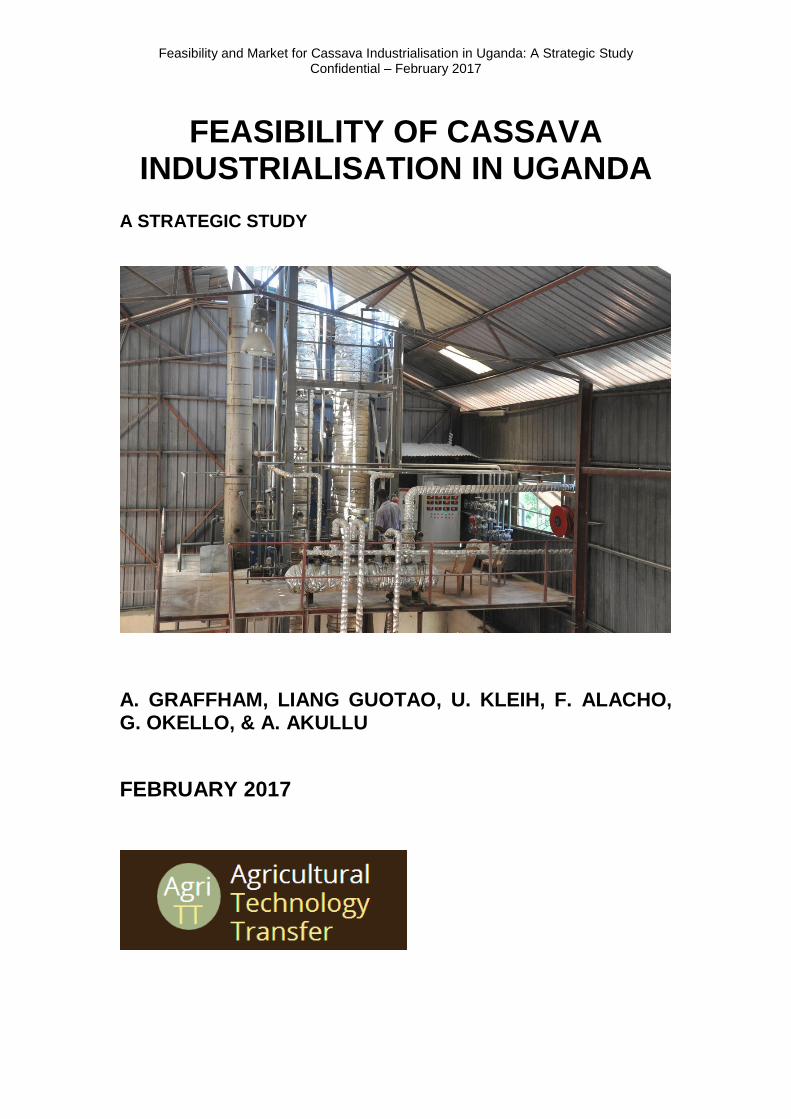
ACKNOWLEDGEMENT The research team was multi-institutional and reflected the collaborative spirit and partnership between Uganda, China and the United Kingdom. The team consisted of Andrew Graffham (technologist) and Ulrich Kleih (economist) of the Natural Resources Institute (NRI) of the University of Greenwich in the United Kingdom, Francis Alacho, Gloria Okello & Audrey Akullu of the African Innovations Institute (AfrII) based in Uganda and Liang Guotao of Acro Bio-Tech Company Ltd in China. The authors would like to thank all of the government and private sector personnel across Uganda for their unstinting efforts, hard work and true friendship that made the fieldwork in Uganda not only highly productive but most enjoyable as well. We cannot mention all persons by name as they are too numerous but we wish to offer our special thanks and gratitude to all the personnel of Uganda Revenue Authority, Uganda Development Bank, Uganda Development Corporation, Uganda Investment Authority, Farm Uganda, Riham Foods, Uganda Breweries, KLUL Distillers, Ntake Mill & Bakery, Windwood Millers (Lira), Landmark Millers (Soroti) and all the farmers and extension staff across Uganda who gave up their time to discuss production and processing of cassava. Without the help and friendship of these people the AgriTT research mission to assess the feasibility for large-scale industrialisation of cassava would not have been successful. Special thanks go to the Department of International Development (DFID) of the UK for funding the work and to the Ministry of Agriculture, Animal Industries & Fisheries (MAAIF) of the Government of Uganda for providing excellent support and cooperation at national and district level. We would also wish to thank the Foreign Economic Cooperation Centre of the Ministry of Agriculture of the Peoples Republic of China. Picture Credits – Title page: Production of cassava-based ethanol at KLUL distillers in Lira. All pictures used in this report were taken by Dr Andrew Graffham of the Natural Resources Institute, United Kingdom. Exchange Rates: US$1 = 3,380 Ugandan Shillings (UGS) Exchange rates correct as of 31st October 2016

Feasibility and Market for Cassava Industrialisation in Uganda: A Strategic Study Confidential – February 2017
GLOSSARY AfrII African Innovations Institute AgriTT Agricultural Technology Transfer Project BOI Bank of Investment (Nigeria) C:AVA Cassava Adding Value for Africa (Bill & Melinda Gates Foundation) CBSD Cassava Brown Streak Disease CMD Cassava Mosaic Disease CTAP Cassava Transformation for Agriculture Programme (Nigeria) DAO District Agricultural Officer DFID Department for International Development (UK Government) DLG District Local Government DPO District Production Officer DSIP Development Strategy & Investment Plan (GoU) EAAPP East African Agricultural Productivity Programme EAC East African Community ENA Extra Neutral Alcohol (potable ethanol) FG Farmer Group FCR Fresh Cassava Root FMARD Federal Ministry of Agriculture & Rural Development (Nigeria) GAP Good Agricultural Practice GoC Government of Peoples Republic of China GoU Government of Uganda HFS High Fructose Syrup HQCC High Quality Cassava Chips HQCF High Quality Cassava Flour HP Horse Power (1HP = ~0.746kW) IA Industrial Alcohol (non potable alcohol) ICM Integrated Crop Management IITA International Institute for Tropical Agriculture LG Local Government MAAIF Ministry of Agriculture Animal Industries & Fisheries (GoU) MC Moisture content MT Metric MT NAADS National Agricultural Advisory Services (agency of MAAIF) NaCCRI National Crop Resources Research Institute (part of NARO) NARO National Agricultural Research Organisation (agency of MAAIF) NRI Natural Resources Institute PDP Pilot Development Project (Uganda) PMO Project Management Office TPD Metric MT per day SACCO Savings and Credit Co-operative SC Steering Committee SME Small-Medium Scale Enterprise TCGRI Tropical Crops Genetic Resources Institute UBOS Ugandan Bureau of Statistics UGS Ugandan Shillings UN United Nations US$ US Dollars WCF Whole Cassava Flour

Feasibility and Market for Cassava Industrialisation in Uganda: A Strategic Study Confidential – February 2017
6
EXECUTIVE SUMMARY As part of the DFID funded AgriTT project a study was commissioned to look at the potential for large-scale cassava industrialisation in Uganda. A team of experts was convened from the Natural Resources Institute (NRI) of the United Kingdom, African Innovations Institute (AfrII) in Uganda and Acro Bio-Tech Company of China. The study has been conducted between September and November 2016, involving a desk study, fieldwork, and preparation of the report. Cassava is one of the major crops produced in Uganda, together with plantain, maize, sweet potatoes, and sugar cane. According to statistics by the Food and Agriculture Organization of the United Nations (FAO), annual production of cassava roots was of the order of about 5 million MT until 2011, when it dropped to approximately 3 million MT per annum due to factors such as plant diseases (e.g. Cassava Brown Streak Disease). Northern and Eastern Uganda account for the bulk of cassava production in the country. Although it is recognised that cassava is a food crop in Uganda, it is also evident that demand for a range of industrially manufactured products is increasing, and cassava can be used in different forms as raw material for the production of these products. Field surveys undertaken to assess the demand for industrially processed cassava products established that there is demand for high quality cassava flour (HQCF) in bakeries (in particular rural ones), institutions such as schools or prisons, manufacturers of composite flour, breweries using cassava flour as adjunct in the brewing of clear lager beer, and the paperboard manufacturing industry which can use HQCF or starch as a glue extender. Starch is also used by other industries such as the food industry. In addition, cassava can be used for the production of ethanol and a factory has recently been constructed producing ethanol from dried cassava chips. Sweeteners such as glucose syrup can also be manufactured from cassava, although it proved difficult to estimate exact demand figures (apart from using Uganda Revenue Authority data on syrup imports). Cassava based animal feed products are entering the market when the maize price is high. The demand for the aforementioned products is increasing in both Uganda and other East African Community (EAC) countries due to factors such as economic growth, changing consumer preferences, urbanisation, and demographic growth. The section dealing with large-scale processing of cassava outlines the processing steps, equipment, raw material, and other inputs required for the production of six products, namely dried cassava chips, hard pellets for animal feed, high quality cassava flour (HQCF), sugar syrups, native and modified starches, industrial and extra-neutral alcohol (ENA). Factors regarding the location of a factory include access to the following: good raw material supply (i.e. fresh cassava roots), road infrastructure, electricity grid, mains or borehole water supply, skilled labour. In particular, the supply of fresh cassava roots is exemplified with experience from a range of countries, namely Thailand, Vietnam, Malawi, and Nigeria, detailing good agricultural practices (GAP), production costs, mechanisation of production, specification of cassava roots, amongst other things. The section on innovation and competitiveness provides examples of experiences with cassava industries in other countries, as well as experience with previous cassava related investments in Uganda. Business and finance planning involves assessing the range of finance available, including, Uganda Development Bank (UDB), Uganda Development Corporation (UDC), Uganda Investment Authority (UIA), investment funds in China, Africa, or other parts of the world. Fiscal aspects of planning include the presentation of key aspects of the “Guide on Tax Incentives/Exemptions available to investors in Uganda”. The agricultural sector including cassava has a high priority as far as policy making by the Government of Uganda is concerned. The same applies to the establishment of agricultural

Feasibility and Market for Cassava Industrialisation in Uganda: A Strategic Study Confidential – February 2017
7
enterprises and industries, in order to, amongst other things, create employment, and reduce the balance of payment deficit. In view of the aforementioned analyses, the processing options presented by Acro Bio-Tech Company of China are based on two stages, which can also be seen as options, namely the construction of:
(a) 10 medium-scale, satellite type, factories that process fresh cassava roots (FCR) into HQCF and starch. The factories would each have a daily output of 20 MT (minimum industrial size of a factory), or 3000 MT of HQCF plus 3000 MT of starch, assuming the factories operate 300 days per annum.
(b) A factory with a daily capacity of 100 MT of glucose syrup per day (i.e. 30,000 MT
p.a.), using 27,600 MT of starch from the 10 satellite factories as raw material. The remainder of starch produced by these factories (i.e. 2,400 MT) would be destined for the local market. Given the size of the Ugandan market for syrups, the bulk of this would have to be sold outside the country or region.
A risk assessment of the two options demonstrates that the construction of a medium-sized factory (Option a.) producing 20 MT of output per day (HQCF and/or starch), is more suitable for Uganda, in that the output of one or two factories of this size corresponds to what the Ugandan market can absorb in terms of HQCF and starch in the short-term. If the establishment of one factory of this scale proves successful then the construction of more factories of this scale can be implemented. Output would be destined for the Ugandan or EAC market. Access to finance (mix of equity and loan) should be relatively straightforward given the size of the investment (US$ 1.64 million per plant). The annual operational and management costs for one plant would be US$ 1.52 million. A similar-sized investment is already in place in the form of an ethanol plant. Development finance may be available for the project if certain criteria are fulfilled (e.g. support of small-holder farmers). The weaknesses or challenges of Option a. (medium-sized factory) include the supply of raw material in the form of fresh cassava roots (FCR), given that continuous supply of FCR (~80MT per day) are required. Nonetheless, the supply of FCR from a combination of estate and outgrower scheme appears feasible at this scale if improved cassava varieties can be used, and yields of 20 MT/hectare can be achieved. The energy for heating of the boiler would come from fuelwood (0.2 MT per MT of output) in the case of HQCF, and a combination of fuelwood (0.2 MT per MT of output) and coal (0.12 MT per MT of output) in the case of starch. This is in addition to electricity (~200 kWh/MT of output). The availability of these amounts of energy plus water needs to be confirmed for the area where the factory will be located, or alternatives identified if needed. Effluent control at the plant has to be ensured. Option b. (i.e. the construction of a large-scale glucose syrup plant to be fed with cassava starch from 10 satellite type HQCF/starch plants) is riskier. Although the potential benefits in terms of employment creation, GDP growth, and trade balance contributions look significant, there are several key challenges/weaknesses to be considered. The Ugandan or EAC markets for a large-scale plant producing 30,000 MT of glucose syrup p.a. are too small. Sales in other parts of Africa or in other continents would have to be envisaged, necessitating further investigations. The supply of raw material for a scheme requiring in excess of 200,000 MT of FCR per annum would be problematic. Assuming a combination of estate and outgrower produced supply would be put in place, the availability of land (in excess of 10,000 hectares) for the production of roots is likely to become an issue. Social studies assessing landownership, food security, and other matters would be required, in addition to technical and economic inputs. As for energy supply of the glucose plant, about 40 MT of firewood would be required per day, in addition to electricity (40 kWh per MT of
Feasibility and Market for Cassava Industrialisation in Uganda: A Strategic Study Confidential – February 2017
8
glucose produced) and water. In addition, the energy needs of the ten satellite plants would have to be met. The availability of this amount of energy needs to be confirmed through further studies and alternatives have to be identified if necessary. Technical studies regarding effluent control are also required (at both, plants for glucose and starch production). As for funding sources, given the size of the investment (US$ 27.7 million in total for glucose factory, ten satellite plants, and infrastructure), delays are likely. The money would have to come from a consortium of investors. Recommendation: It is recommended to focus on a medium-scale industrial cassava processing option for the time being (i.e. a factory able to produce 20 MT of HQCF and starch per day), with funding coming from a mix of equity and loans. In the medium-term, if such a factory proves successful, then more similar plants can be constructed. More detailed analyses will be required as for the construction of the plant, as well as supply of raw material and energy sources. In particular, the availability of fuelwood for the boiler needs to be assured, and, if needed, alternatives will have to be investigated. The construction of a large-scale factory able to produce 30,000 MT of glucose syrup per annum, should be put on halt for the time being. This is due to the risks and challenges involved with such a project. A review of the situation is recommended in four years’ time. This will require relevant technical, economic, social, and environmental assessments.

Feasibility and Market for Cassava Industrialisation in Uganda: A Strategic Study Confidential – February 2017
9
1.0 INTRODUCTION As part of the DFID funded AgriTT project a study was commissioned to look at the potential for large-scale cassava industrialisation in Uganda. A team of experts was convened from the Natural Resources Institute (NRI) of the United Kingdom, African Innovations Institute (AfrII) in Uganda and Acro Bio-Tech Company of China. An examination of the TOR led to the conclusion that the commission could be divided into two parts. The first part consisted of a strategic investment study (report sections 2-7 & 10) to provide the Government of Uganda and potential private sector investors with sufficient information to guide investment decisions. This study is not a feasibility study much less a bankable business plan as it does not deal with a detailed case for a specific investment but rather in the more generic aspects of investing in cassava processing at a scale of >10 MT of product per day. Personnel from NRI, AfrII and Acro Bio-Tech were involved in preparation of the strategic investment study. Research work for the investment study involved a combination of two weeks’ fieldwork in Uganda to obtain context specific information from stakeholders around the country. There was also a considerable element of desk work as members of the team brought together relevant experiences from other parts of Africa and Asia. The second part of the study focussed on specific proposals for large-scale investments in cassava and generic business plans for these investments (sections 8 & 10). The detailed proposals and business plans were prepared by personnel from Acro Bio-Tech in China with support from AfrII in Uganda. The NRI team made no inputs to the development of the specific proposals and generic business plans detailed in section 8 of the report and the annexes as this was outside of the agreed scope for the strategic investment study. Section 9 presents conclusions and recommendations. The strategic investment study has been divided into a number of sections to cover a range of key aspects that need to be considered when planning an investment in large-scale processing of cassava in Uganda. In section 2 we look at the current status and geography of cassava production in Uganda. This is important as the investor should have an idea where supplies of cassava could be found and what competition might be encountered from existing markets. There is a sub-section looking at the role of cassava in food security versus that of an industrial crop. Most countries with successful cassava based processing industries use cassava almost exclusively as an industrial crop with very little of the crop going for food use at household level. In Uganda and most parts of sub-Saharan Africa cassava is an important food staple and source of food security for rural families. Investors must take care to avoid undermining food security and should try to minimise competition with traditional food markets as this simply pushes up the cost of the raw material and makes the industry less competitive. Section 3 deals with national, regional and international markets for cassava-based products. There are also sections on the competitive position of cassava versus other sources of starch and our expert view on the best and least likely options for investment in the short to medium-term. Potential investors should develop a good understanding of the potential markets for the product both in terms of volumes, specifications and unit price. Price is a critical factor as any product produced in Uganda will have to be competitive against competition from major players such as the Thai cassava starch industry. Section 4 provides an overview of the various technologies available for large-scale cassava processing. In this section we look at the range from the simple process of chip production through animal feed pellets to sophisticated products such as starches, sugar syrups and potable alcohol. Sub-sections are provided to highlight the potential of China as a source of good quality processing equipment at competitive prices. We provide details of local fabricators in Uganda but note that most of these lack the capacity to supply equipment suitable for large-scale operations. Sub-sections are provided that deal with the key factors to take into account when choosing the site of a cassava processing industry and there is

Feasibility and Market for Cassava Industrialisation in Uganda: A Strategic Study Confidential – February 2017
10
also a discussion of important aspects of raw material supply. Raw material supply in the form of Fresh Cassava Roots (FCR) or dried cassava chips can account for 50-60% of the costs of producing a cassava-based product. Investors in processing need to also give much thought to investing in production of cassava roots and effective management of outgrower schemes. In the early stages of an investment the factory must rely on available raw materials which are likely to be insufficient, expensive and contain much lower than expected levels of starch. With care and good management volumes, quality and starch levels will all increase after 2-3 years of operations. If investment is made in all aspects of good agricultural practice (GAP) yields will increase and this coupled with better starch contents will bring down the unit price per MT paid by the factory whilst increasing the farmers’ income and ability to invest in further improvements. Section 5 looks at the role of competitiveness and innovation in the success of a cassava-based processing industry. We address this important topic using experience and lessons from Thailand and Nigeria, and previous investments in cassava-processing in Uganda. We also look at the more generic factors that impact on the business and role of government and donors in creating and supporting a competitive advantage for Ugandan made products. Section 6 focusses on how to finance a larger-scale investment in Uganda. Credit can offer one route and is useful for working capital but can often be an expensive way to borrow money for capital investments. An alternative mechanism might be sharing of equity whereby another investor steps in to help fund the project in return for a share of the revenue of the investment for an agreed period. At the conclusion of this time, the equity investor will normally sell off their stake in the business. We provide information on the various options for investment support in Uganda. We also cover fiscal aspects of tax and duty regimes as this is a good way by which the Government might encourage and nurture the development of a large-scale cassava-based industry in Uganda. In a final sub-section we present experience from Nigeria on the Government’s use of taxes on imported wheat to finance a cassava investment fund. This was not completely successful but still offers valuable lessons of potential use to the Government of Uganda. Section 7 leads on from the themes developed in section 6 and looks at the role of Government in using policy and institutional support to create an enabling environment for cassava industrialisation. We also look at the Nigerian experience where government tried to use regulation to create he market for high quality cassava flour in bread making. This has shown that regulation alone may not be enough to create sustainable markets for commodity products. Instead aggressive promotion and marketing is needed to build consumer preference and acceptability. It is far better to support markets that are already emerging as success stories in Uganda such as cassava-based clear beers and potable alcohol and avoid trying to force markets using regulations. Sections 8 and 10 (annexes) deal with the Chinese proposals for investments in large-scale cassava processing and include outlines of the technology and generic business plans for both the satellite starch factories and central sugar syrup factory. These ideas are of technical interest but potential investors would be wise to evaluate the proposals in the light of information provided in the strategic investment study and to keep in mind the context of making such investments in Uganda. Section 9 provides conclusions and recommendations.

Feasibility and Market for Cassava Industrialisation in Uganda: A Strategic Study Confidential – February 2017
11
2.0 CURRENT STATUS OF CASSAVA IN UGANDA This section provides information on the current status of cassava in Uganda, related to the geography of Uganda’s cassava economy in terms of area planted, yields, production volumes and geographical distribution. Also, the aspect of food security versus industrial crop is explored.
2.1 GEOGRAPHY OF UGANDA’S CASSAVA ECONOMY Uganda is ranked as the 6th largest cassava producer in Africa and cassava is one of the most important staple foods in Uganda (USAID 2010). The FAO STAT data further shows that whereas Uganda has the 5th largest cassava area harvested in 2014, its production in MTnages is ranked as the 12th largest in Africa in 2014. This is consistent with the country production data that shows a drop in cassava production in 2012 to less than 3 million MT of fresh cassava roots from over 5 million MT reported in 2010 (Figure 4). In contrast, the country’s cassava area harvested increased in 2012 from 400,000ha to over 800,000ha as shown in Figure 1. Whilst the area planted has more or less doubled between 2012 and 2014, this was accompanied by a yield drop from about 12 MT per hectare in 2010/11 to approximately 4 MT per hectare in 2012 (FAO, 2014). It is assumed that one of the reasons leading to the drop in yields and production was related to Cassava Brown Streak Disease (CBSD). However, there are several ongoing interventions to address this constraint and evidence is mounting that in areas where disease tolerant varieties have been deployed and farmers trained on the control of CBSD, GAP and the use of clean planting materials yields have tremendously increased. For instance, farmers benefiting from AfrII’s C:AVA (Cassava: Adding Value for Africa) and CSS (Cassava Seed Systems) projects are harvesting yields of 15 MT per hectare.
Figure 1: Changes in Cassava Area Harvested, corresponding yield and production of
cassava from 2004 – 2014 (FAO, 2014)

Feasibility and Market for Cassava Industrialisation in Uganda: A Strategic Study Confidential – February 2017
12
There are wide variations that exist in the data on the production and yields of cassava in Uganda from different sources. For example, UBOS gives average yields of 3.3 MT/ha, whereas EAAPP (2011) quotes figures of 7.9 MT/ha and FAO quotes 11.1 MTs/ha (before the yield drop in 2012). However, many agronomists agree that yields of 15 - 20 MT/ha are achievable. The observation in our recent study (AfrII, 2016) indicate yields as high as 15 MT/ha, particularly in well managed farms. Therefore, there is an opportunity for achieving higher yields using good agricultural practices and controlling CBSD and other diseases.
As for geographical distribution of cassava production, according to UBOS (2010), the Eastern region reported the highest production of cassava with a total output of 1.1 million MT (36%) followed by the northern region with 983,000 MT (34%), followed by Western region (15.2%) and Central region with 410,000 MT (14.2%) (Figure 2). Figure 2: Cassava production by region
Source: UBOS 2010 Cassava productivity: cassava yields in Uganda are fairly low compared to what is achievable. These low yields have been attributed to a lack of access to improved varieties, poor soils, low plant density inadequate weed management and water stress, as well as the long-term effects of diseases such as CMD and CBSD. Use of fertilizers is also rare as cassava has always been viewed as a subsistence crop. Closing the considerable yield gap between actual and attainable cassava yields at farm level, will therefore require use of integrated management practices such as improved varieties, good quality planting materials, good agronomic practices, integrated pest, weeds and soil fertility management. Field trials have shown that yields could be doubled through the use of improved seed and the application of fertilizer1. Table 1 shows the new varieties released since 2011 and their attributes.
1http://microlinks.kdid.org/sites/microlinks/files/group/resource/files/Cassava_vcnotes.pdf

Feasibility and Market for Cassava Industrialisation in Uganda: A Strategic Study Confidential – February 2017
13
Table 1: Details and attributes of improved cassava varieties since 2011 Breeder’s code Variety name Year of
release Reaction to Yield (t/ha)
CMD CBSD
MH97/2961 Nase 13 2011 Resistant Tolerant 20-30
NM96/4271 Nase 14 2011 Resistant Tolerant 20-35
28-TME 14 Nase 15 2011 Resistant Tolerant 20-35
266-BAM Nase 16 2011 Resistant Tolerant 20-30
349-KAK Nase 17 2011 Resistant Tolerant 20-30
109-TME14 Nase 18 2011 Resistant Tolerant 20-35
72-TME14 Nase 19 2013 Resistant Tolerant 20-35
NAM 130/Tz130 NAROCASS 1
2015 Resistant Tolerant 20-35
MM/96/0130 NAROCASS 2
2015 Resistant Tolerant 20-35
Source: EAAPP, 2013 and NARO personal communication. Use of inputs: Few inputs are applied in cassava production with the key one being labour, estimated at 188 man-days per hectare. Land clearing and harvesting often takes most labour days (52 %) and is particularly high compared to other countries where cassava is more commercialized (Fig. 3). The majority of cassava farmers either used manual labour (68%) or oxen (30%) to plough the land. Use of oxen was more pronounced in the North East zone (65%). A majority of farmers use planting materials from their own farms (64%), fellow farmers and relatives (32%). Use of fertilizers and agro-chemicals is very low at 3% and 15% respectively.
Labor and economic returns
Kraybill and Kidoido (2009) found that small scale subsistence farmers mainly depend on family labour for the production of cassava. After factoring in the cost of family labour, the authors concluded that the farmers earn 56% profit while using local varieties. This figure was reduced to 34% if the farmer used improved technologies and management practices. But commercial cassava farmers who invest in hired labour, inputs and mechanisation using local technologies earn 77% profit. However, when they use improved technologies their profit increases to 82%. These findings are significant in that it demonstrates the need for commercial farmers to use improved technologies in order to maximize productivity and farm income. The study therefore indicated it is under a high inputs regime that the benefit of improved varieties become higher implying that resource constrained farmers may not be able to get the full benefits of improved varieties (Figure 4).

Feasibility and Market for Cassava Industrialisation in Uganda: A Strategic Study Confidential – February 2017
14
Figure 4: Cost structure and Profitability of Improved Vs Local Varieties (Low and high Input Scenario)

Feasibility and Market for Cassava Industrialisation in Uganda: A Strategic Study Confidential – February 2017
15
2.2 HOUSEHOLD FOOD SECURITY VERSUS INDUSTRIAL COMMODITY
In Uganda cassava plays a very important role in both household and national food security. It is estimated that in some parts of Uganda, nearly 90% of the people consume cassava in different forms at least daily (EAAPP, 2011). The crop is one of the eleven commodities that have been prioritized by the Government of Uganda in its agriculture sector Development Strategy and Investment Plan (DSIP). The crop is recognized as a major agricultural commodity for poverty eradication, ensuring food and nutrition security and as an industrial raw material. In addition, cassava has a strategic role in addressing the adverse effects of climate change. Demand for cassava is expected to increase at a faster pace than its supply as new alternative uses emerge and as consumer preferences change with the development of new cassava products (ACET 2014). Figure 5: Showing Banana and Cassava as the leading food crops in Uganda
(production in MT per annum)
Source: FAO STAT data (NB. Banana & plantain figures for 2014 were not available)
What to note in Figure 5 is the significant increase in maize production over the years in comparison to the traditional crops like cassava and sweet potato which show a steady decline. Rice Vs staples (Changing lifestyles) Industrial use of cassava roots has only recently begun and the quantities used as raw material are very small compared to the amounts of cassava used for food consumption by both the rural and urban populations. For example, if 100,000 MT of fresh cassava roots are used per annum for the manufacture of industrial products then this corresponds to only 3.3% of total production if the latter is 3 million MT. Nonetheless, an eye needs to be kept on communities where a large proportion of cassava is sold for industrial purposes, in that they may encounter food security problems if too much of the farm production goes into cash crops and not enough is left for household

Feasibility and Market for Cassava Industrialisation in Uganda: A Strategic Study Confidential – February 2017
16
consumption. This may be accompanied by market conditions where it is difficult for farmers to buy food if the latter becomes highly prized or scarce. Although it is sometimes argued that the industrial use of cassava has not well succeeded in countries where the crop is a food crop, this can be compared to countries where some crops have become important sources of industrial raw material whilst remaining food crops at the same time (e.g. potatoes in Europe, rice in Asia). Commercialisation of cassava in Uganda - AfrII experience The Cassava: Adding Value for Africa (C:AVA) project is funded by the Bill and Melinda Gates Foundation (BMGF) with NRI-UoG as the grantee. Africa Innovations Institute is the implementing partner in Uganda since 2009. The project is also based in Tanzania, Malawi, Ghana and Nigeria. The vision of C:AVA is to develop a vibrant and competitive High Quality Cassava Flour (HQCF) industry based on market-led efficient production and processing, which leads to a reduction in rural poverty. C:AVA rationale for focusing on HQCF is that a clear market opportunity for HQCF (as a local food product, as replacement flour in wheat, as ingredient to starch and plywood etc.) that is not fully exploited exists. Further value can be added at the rural household level by processing. The requirements for capital investment are lower and many farmers already know how to create the basic raw material for HQCF (grated cassava). The main objectives are to:
Ensure increased production and sales of consistent quality and quantity of HQCF.
Ensure that farmers and processors benefit from sun-dried or mechanically dried
HQCF production.
Ensure that regular and increased quantities of HQCF are purchased by end user
industries.
C:AVA activities in Uganda are focused on developing capacity for production and marketing of High Quality Cassava Flour (HQCF). There are interventions being undertaken at all levels of the HQCF value chain including supporting farmers in increasing yields and in processing at farm levels, supporting the development of bulking agents and intermediate processors and supporting the end market for products development using HQCF. The main results of C:AVA to date has been the successful piloting of value chains for HQCF, by supporting 3,200 farmer processors to establish 12 HQCF processing sites in the Eastern and Northern regions of Uganda. By September 2013 the project had enabled the supply of 3,207 MT of HQCF to rural bakeries, paper board manufacturer, composite flour millers and biscuit manufactures where it is being used as a partial wheat substitute, and agri-food industries where it is being used for the manufacture of flour for porridge to be consumed by babies and adults as well as flours for millet bread (Atap) and maize meal (posho). The smallholder farmers participating in the value chain are the 3,700 cassava farmers who supplied cassava fresh roots from their gardens for processing into HQCF. Currently the process is constrained by reliance on sun-drying. There is need for technology transfer from Nigeria which is already using flash drying in order to meet the medium-term projected HQCF demand of over 30,000 MT per annum.
The key outcomes from this project were:
Rural farmers and other intermediaries have processed and marketed over 3,000 MT
of HQCF.
End users such as rural bakers, paper board manufacturers, composite flour millers,
breweries, and biscuit manufacturers are utilizing HQCF in their products

Feasibility and Market for Cassava Industrialisation in Uganda: A Strategic Study Confidential – February 2017
17
Increased markets for HQCF from zero in 2009 to 6,000 MT by 2013 and expected to
grow to 30,000 MT by 2019.
Increased cassava farm yields by 50% for participating farmers.
Processing equipment is now fabricated locally.
Increased interest from stakeholders in HQCF production.
This project followed a market driven approach in value chain development. It started by developing the market, then organizing production and supply of HQCF to meet market demand and then linking producers to market and developing business support services such as equipment fabricators and micro credit providers. The increased income from sales of HQCF acted as an incentive to farmers to adopt improved production and processing technologies. This project has demonstrated that improved processing of cassava from traditional chips of flour to HQCF can significantly increase value of the product from a price per kg of about 500 for traditional cassava flour to at least 1,500 Uganda shillings. In addition, farm yields have increased by 50 % and rural women are earning increased income from sale of bakery products from HQCF. The project has developed three agri-business models (Community based Processor groups, SMEs based on sun-drying and SMEs based on flash dryer technology) for commercialization of cassava and is currently encouraging the private sector to invest in cassava processing. 2 flash-dryers, which are still under-going trials, have recently been installed in Lira and Apac Districts. It is expected that these two flash driers will be operational later in 2017, as well as the batch drier which is being installed in Kiryandongo District with the assistance of the AgriTT project.

Feasibility and Market for Cassava Industrialisation in Uganda: A Strategic Study Confidential – February 2017
18
3.0 MARKET OPPORTUNITIES FOR CASSAVA AND OTHER STARCH-BASED
PRODUCTS This section shows to what extent the market opportunities for some cassava and other starch-based products have been developed during the last decade, and to what extent there are still open market opportunities for other products. The information and data is based on both fieldwork and import data obtained from the Uganda Revenue Authority (URA). The fieldwork focused on the following industries currently or potentially requiring cassava based raw material: breweries, ethanol manufacturer, soft drinks manufacturer, bakery. Other markets (e.g. paperboard market, biscuit manufacturers, animal feed producers) have been visited during previous fieldwork for the C:AVA (Cassava: Adding Value for Africa) project between 2009 and 2013.
3.1 NATIONAL MARKETS The brewery (Uganda Breweries Limited, part of East African Breweries Limited) visited in Kampala started to use dried cassava in 2014, and is now using about 5,000 MT per annum of high quality cassava flour which is mainly being supplied by intermediary traders as well as processors belonging to groups supported by C:AVA. Intermediary traders would buy cassava chips, mill them on their premises, and then supply the flour to the brewery. The latter uses the cassava flour as ingredient for the making of two lager type beers containing 60% and 68% cassava flour respectively, as part of their ingredients. Local sourcing of raw material as well as tax incentives (i.e. reduction of excise duty from 60% to 30% if local raw materials are used) are major motivations for the use of dried cassava by the brewery. The brewery currently pays USh 1000 /kg of cassava flour, and it was indicated that USh1100/kg was the highest they could go, depending on market conditions. The brewery has quality assurance in place regarding different parameters (e.g. moisture content of cassava flour). Rejected dried cassava tends to be higher during the rainy season when drying conditions are not very good (i.e. in particular when sun-drying is used). In view of this, some suppliers have started to invest in artificial drying (e.g. batch-dryer installed in 2016 in Kiryandongo District with the support of the AgriTT project) and are preparing for the supply of HQCF to the brewery. An ethanol distillery (KLUL) has been visited in Lira. The company was registered in 2008 and started production in May 2015. The factory has a capacity to produce 6,000 litres of ethanol (industrial alcohol which requires further processing) and in October 2016 produces 4,000 litres per day, requiring 10 MT of cassava chips as raw material. The price paid by the factory for dried cassava chips is of the order of USh 900/kg in October 2016, which reportedly helps farmers to secure income and livelihoods in procurement areas (i.e. mainly Northern and Eastern Uganda). The company obtains the bulk of the raw material through intermediary traders, but also from farmers, and there are plans to buy from a farmer cooperative society in Kitgum district. As yet, the company does not have a large enough procurement team however it was indicated that it would be preferable to have outgrowers supplying the factory with raw material. It was reported that the selling price of the alcohol is USh 6,400 / litre, and that the product requires further refining before it can be used. The factory investment costs were US$ 1.8 million, out of which the equipment costs were US$ 680,000. The equipment was procured in China.

Feasibility and Market for Cassava Industrialisation in Uganda: A Strategic Study Confidential – February 2017
19
Constraints indicated by the company include lack of supply of dried cassava chips, as a result of which the company engages with Local Government agricultural authorities to assist them (e.g. strengthening of farmer communities; supply of cassava cuttings). Quality of chips has also been indicated as an issue and reportedly farmers ask for assistance with drying technology. With an annual production of about 1.2 million litres of ethanol, KLUL is a relatively small player in this market. At the same time, it is understood that Kakira Sugar are investing in an ethanol plant that is due to produce 20 million litres of ethanol per annum. In addition, in 2012 it has been reported that the Sugar Corporation of Uganda Ltd (SCOUL) was contemplating to invest in an expansion of their ethanol production by 8 – 10 million litres per annum. Their distillery mainly produced industrial alcohol from the molasses, which are a by-product from their sugar production. In 2012 it was indicated that Uganda imports 90% (i.e. about 20 million litres p.a.) of its ethanol requirements. This needs to be compared with annual imports of undenatured alcohol of 28,278 cubic metres in 2015/16 according to URA data (see below). The company Riham was visited as they are a major producer of soft drinks, but also biscuits (which was their original core business before they focused more on the soft drinks industry), and as such represent a potential market for cassava based products in the form of sweetener or HQCF. It was stated that the company currently (i.e. in October 2016) uses 80 – 90 MT of sucrose (i.e. white sugar) per month. Currently, no glucose syrup or HFS (high fructose syrup) are being used by the company although it is understood that they have the facility to make syrup. Imported sucrose incurs an import duty of 12% and 18% VAT. Incentives to use locally sourced raw material (e.g. cassava) would be to encounter less risk, which is associated with imports, and better prices. At the same time, the main challenges with local raw material would be quality and volumes of supply. As for their market share, it is estimated that Riham have about 25% of the market, Coca Cola have approximately 50%, and Pepsi Cola also have about 25%. Riham have managed to develop their own market niche in that they produce less expensive, good quality, soft drink products, thereby forcing the major brands to lower their prices. It is understood that the company also exports to neighbouring countries (South Sudan, Kenya, Democratic Republic of Congo), while the Ugandan market is still growing. Ntake bakery has been visited and it was reported that their management are not keen on including HQCF in their wheat flour, which is currently available at an attractive price. At the same time, HQCF is used in the production of baked goods by rural bakeries, and composite flours. There was some limited use of HQCF in biscuit manufacture, however it is understood that this sector is currently struggling, in particular due to imported biscuits (e.g. from Middle East). In previous studies for C:AVA, the animal feed sector has been identified as a potential market for high quality and improved quality cassava products (e.g. dried chips), however further feed use demonstrations with different types of animals would be required in this respect. Members of the animal feed industry need to be convinced of technical performance of cassava, and that improved chips or grits can be produced at prices that make inclusion of cassava attractive. As for the paperboard industry, HQCF and cassava starch have already been successfully used in production of glue for paperboard in Uganda. All companies are understood to be
Feasibility and Market for Cassava Industrialisation in Uganda: A Strategic Study Confidential – February 2017
20
keen on conducting trials using HQCF as a glue extender. It is understood that potential annual demand for HQCF or cassava starch is of the order of 1400 MT in the long-term.
3.2 IMPORTS
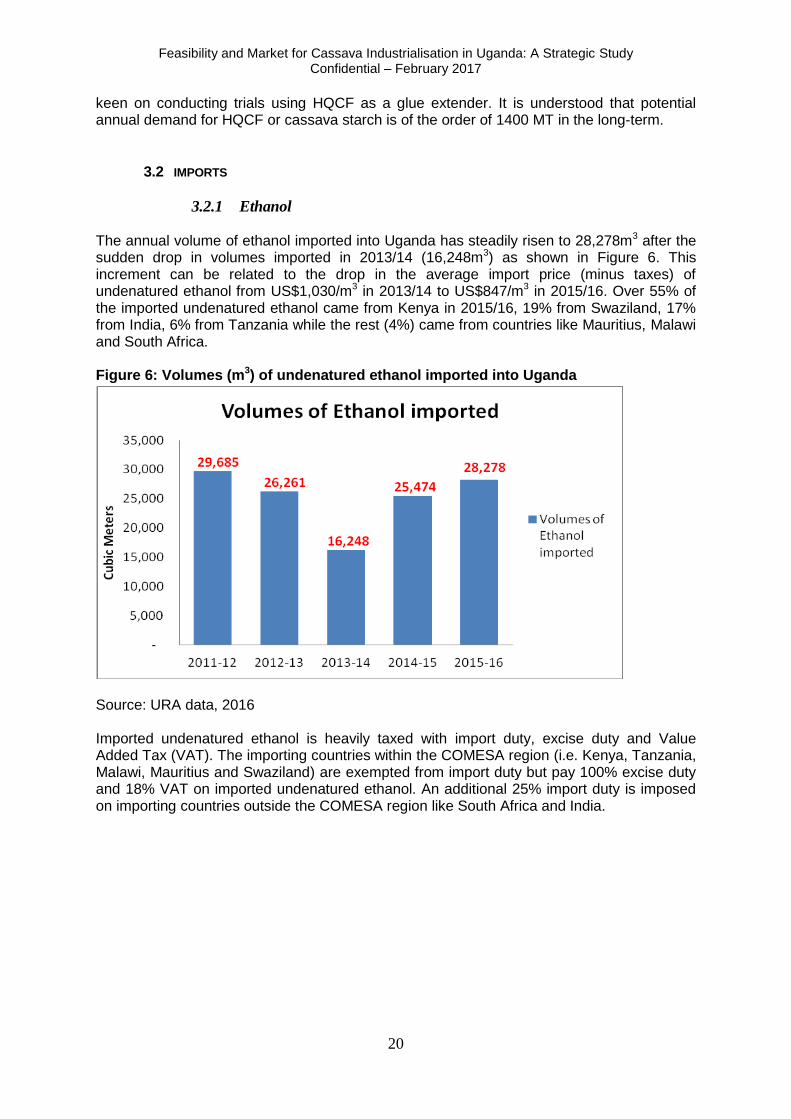
3.2.1 Ethanol The annual volume of ethanol imported into Uganda has steadily risen to 28,278m3 after the sudden drop in volumes imported in 2013/14 (16,248m3) as shown in Figure 6. This increment can be related to the drop in the average import price (minus taxes) of undenatured ethanol from US$1,030/m3 in 2013/14 to US$847/m3 in 2015/16. Over 55% of the imported undenatured ethanol came from Kenya in 2015/16, 19% from Swaziland, 17% from India, 6% from Tanzania while the rest (4%) came from countries like Mauritius, Malawi and South Africa. Figure 6: Volumes (m3) of undenatured ethanol imported into Uganda
Source: URA data, 2016 Imported undenatured ethanol is heavily taxed with import duty, excise duty and Value Added Tax (VAT). The importing countries within the COMESA region (i.e. Kenya, Tanzania, Malawi, Mauritius and Swaziland) are exempted from import duty but pay 100% excise duty and 18% VAT on imported undenatured ethanol. An additional 25% import duty is imposed on importing countries outside the COMESA region like South Africa and India.
Feasibility and Market for Cassava Industrialisation in Uganda: A Strategic Study Confidential – February 2017
21
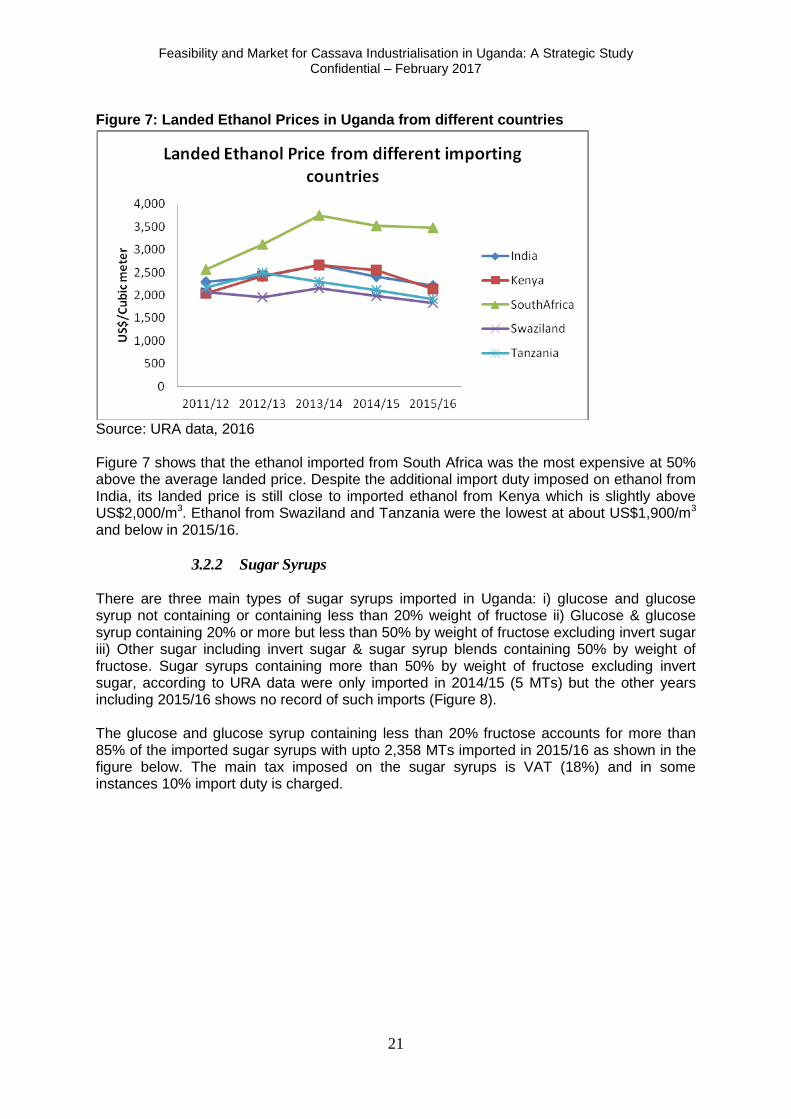
Figure 7: Landed Ethanol Prices in Uganda from different countries
Source: URA data, 2016 Figure 7 shows that the ethanol imported from South Africa was the most expensive at 50% above the average landed price. Despite the additional import duty imposed on ethanol from India, its landed price is still close to imported ethanol from Kenya which is slightly above US$2,000/m3. Ethanol from Swaziland and Tanzania were the lowest at about US$1,900/m3 and below in 2015/16.
3.2.2 Sugar Syrups There are three main types of sugar syrups imported in Uganda: i) glucose and glucose syrup not containing or containing less than 20% weight of fructose ii) Glucose & glucose syrup containing 20% or more but less than 50% by weight of fructose excluding invert sugar iii) Other sugar including invert sugar & sugar syrup blends containing 50% by weight of fructose. Sugar syrups containing more than 50% by weight of fructose excluding invert sugar, according to URA data were only imported in 2014/15 (5 MTs) but the other years including 2015/16 shows no record of such imports (Figure 8). The glucose and glucose syrup containing less than 20% fructose accounts for more than 85% of the imported sugar syrups with upto 2,358 MTs imported in 2015/16 as shown in the figure below. The main tax imposed on the sugar syrups is VAT (18%) and in some instances 10% import duty is charged.

Feasibility and Market for Cassava Industrialisation in Uganda: A Strategic Study Confidential – February 2017
22
Figure 8: Quantity of Sugar syrups imported in Uganda (URA Data, 2016)
Figure 9 shows sugar syrup with 50% fructose as the most expensive at a current price of US$1,400/MT, glucose syrup with >20% but <50% fructose was priced at US$1,299/MT in 2015/16 while glucose syrup <20% fructose was the least expensive at US$627/MT. India is the largest importer of sugar syrup to Uganda accounting for 64% of the total imported sugar syrups while imports from Kenya and Canada also constitute 12% each of the total imported sugar syrups.
Figure 9: Prices of imported Sugar syrups (URA data, 2016)
Feasibility and Market for Cassava Industrialisation in Uganda: A Strategic Study Confidential – February 2017
23
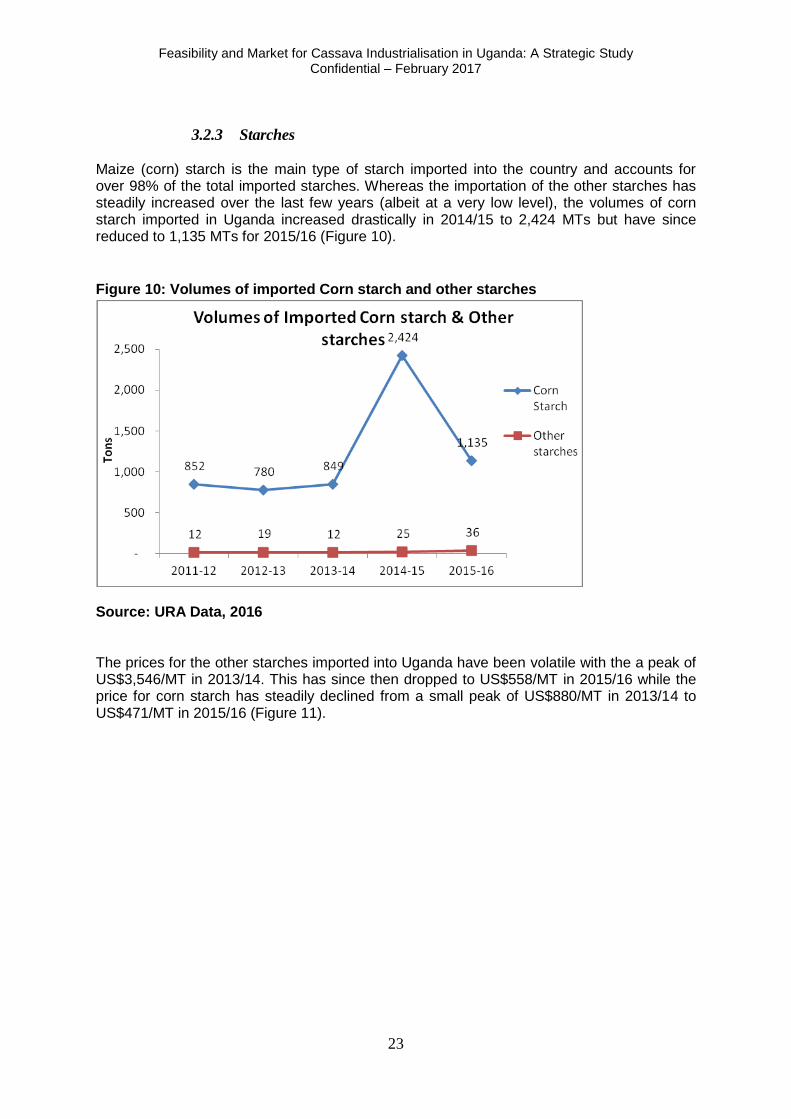
3.2.3 Starches Maize (corn) starch is the main type of starch imported into the country and accounts for over 98% of the total imported starches. Whereas the importation of the other starches has steadily increased over the last few years (albeit at a very low level), the volumes of corn starch imported in Uganda increased drastically in 2014/15 to 2,424 MTs but have since reduced to 1,135 MTs for 2015/16 (Figure 10).
Figure 10: Volumes of imported Corn starch and other starches
Source: URA Data, 2016 The prices for the other starches imported into Uganda have been volatile with the a peak of US$3,546/MT in 2013/14. This has since then dropped to US$558/MT in 2015/16 while the price for corn starch has steadily declined from a small peak of US$880/MT in 2013/14 to US$471/MT in 2015/16 (Figure 11).

Feasibility and Market for Cassava Industrialisation in Uganda: A Strategic Study Confidential – February 2017
24
Figure 11: Price trends for Imported Starches (URA Data, 2016)
3.3 REGIONAL AND INTERNATIONAL MARKETS This section provides overviews of global cassava trade as well as regional markets (in particular Kenya), which can use cassava based products as ingredients.
3.3.1 Global trade in cassava
Globally, the trade in cassava products has grown substantially between 2010 and 2014 mainly due to Chinese imports, which account for about 90% of total trade (Dalberg, IDH, and GrowAfrica, 2015) (Figure 12). The growth in China’s demand for cassava is related to the establishment in 2006 of restrictions on the use of molasses and maize as the primary input for ethanol production. These trade barriers were aimed at preventing environmental effects of waste (from use of molasses) and to curb food price increases. Given that, due to the nature of fresh cassava roots, which are highly perishable, it can be assumed that starch and dried roots are the predominant forms of cassava traded.
Figure 12: Global Trade in Cassava Products (million MT)
NB. Total value of trade in cassava starch and fresh or dried cassava in 2014 was US$ 2.8 billion Source: Dalberg et al, 2015
1.8
3.0
2.3
4.1
3.0
4.64.1
5.0
6.8 6.8
0.0
1.0
2.0
3.0
4.0
5.0
6.0
7.0
8.0
2010 2011 2012 2013 2014
Mill
ion
MT
Cassava starch Fresh/dried cassava

Feasibility and Market for Cassava Industrialisation in Uganda: A Strategic Study Confidential – February 2017
25
The leading exporters of cassava and its derivatives are Thailand and Vietnam, supplying nearly 95% of the traded volume in 2013. The implementation of a free trade agreement between Thailand and China in 2013 resulted in the abolition of a 6% tariff on Thai cassava products, which meant that the market price of imported cassava starch to China became lower than the price of Chinese manufactured starch, which further increased global trade. According to statistics, African countries only play a small role in the global trade of cassava products. Uganda is the continent’s largest exporter—though it ranks 12th globally—with exports of 9,000 MT of fresh/dried cassava and 1,300 MT of cassava starch in 2013 (Dalberg et al, 2013). These exports are mainly destined for neighbouring countries within the East African Community, with small volumes also exported to the United Kingdom.
3.3.2 Growth opportunities for cassava products In order to compete in the global commodity markets, cassava products must be price-competitive compared to their substitute products like maize starch and ethanol made from other sources. It is useful to review key trends in the trade of substitute products to understand what prices are required to compete and what the key drivers of market growth are. Trends in the global trade in starch reveal a market price that has grown by over 20% since 2008. As of 2014, corn starch prices were almost double the price of cassava starch at $830/MT, however it is understood that international corn starch prices have subsequently declined to below $500/MT (also see Figure 12 above). Relatively high corn starch prices suggest a growing opportunity for many industries to substitute with cheaper cassava starch. However, given that the price of cassava starch does not appear to be affected by trends in the price of corn starch, it does not appear that significant substitution is occurring today. The top seven leading importers of starch, accounting for over three million metric MT of imports in 2013, are: China, Germany, Malaysia, Indonesia, the United States, the Netherlands, and the United Kingdom (Figure 13). Figure 13: Top Starch Importers in 2013 (‘000 MT)
0
200
400
600
800
1000
1200
1400
1600
'00
0 M
T
Source: Dalberg et al, 2015

Feasibility and Market for Cassava Industrialisation in Uganda: A Strategic Study Confidential – February 2017
26
Trends in ethanol prices show a relatively volatile pattern between 2010 and 2014 (Figure 14). These price fluctuations suggest that the ethanol sector may be somewhat risky, and that local production may be a good hedge against uncertainty in the global market. The top ten importers of ethanol, accounting for 6600 million litres in 2013, are: United States, Germany, Canada, United Kingdom, Japan, Italy, Jamaica, Philippines, Denmark, and Columbia. Figure 14: Price of Ethanol in Brazil (US$/litre)
Source: Dalberg et al, 2015 Trends in trade of dried cassava chips indicate a dip in global prices between 2010 and 2014, with the price at approximately $211/MT in 2014, down from about US$280/MT where it was for a brief period in 2010/2011 (Dalberg et al, 2015). China is by far the largest importer of cassava chips and the key driver of demand, with about 8.65 million MT of imports in 2014 (up from 5.76 million MT), largely for use in the bio-ethanol production industry. The next largest importer, Korea, imported approximately 600,000 MT in 2013. The relatively low price of cassava chips makes the opportunity less attractive for African producers given high production and logistics costs. Experts suggest that sale of chips to Chinese importers is not profitable unless cassava is grown on commercial farms at very low unit production costs (Dalberg et al, 2015).
3.3.3 Kenyan Markets for Fast Moving Consumer Goods (FMCG) and
Animal Feed
The Kenyan market has been analysed for selected goods which can be produced from processed cassava (e.g. starch, glucose syrup, or chips/pellets). The following analysis ought to be seen in light of this, also because the Kenyan economy is the largest in East Africa and hence a large buyer (current and potential) of Ugandan commodities.
Fast Moving Consumer Goods (FMCG) Key drivers for consumption of fast moving consumer goods (FMCG) include population size, urbanisation, population density, purchasing power, tastes, buying habits (e.g. Coca Cola vs Pepsi Cola). Figure 15 shows the estimated population growth in selected African countries according to United Nations estimates.

Feasibility and Market for Cassava Industrialisation in Uganda: A Strategic Study Confidential – February 2017
27
Table 2: Drivers and Risks for the Consumption of FMCG in Kenya.
Drivers Risks
Strong population growth;
Growing middle class;
Educated labour force;
Dynamic private sector;
Regional leader – possibilities for regional expansion;
Relatively well developed retail infrastructure.
Risk of terror attacks by Al Shabaab;
Private consumption partly dependent on agricultural earnings;
Risk of inflation and higher taxes;
Exposure to Europe for export and tourism revenues.
Source: KPMG (2014) Table 2 summarises the key drivers and risks for the consumption of FMCG in Kenya, which is the largest market in the East Africa region (KPMG, 2014). The same source (KPMG, ibid) estimates the spending power of Kenya’s population as follows:
10.83 million people in the bracket of US$ 2 – 4/capita;
5.86 million people in the bracket of US$ 4 – 10/capita. Figure 15: Population of selected countries in Africa, in 2013 and 2030
Source: KPMG (2014) Kenya has a strong domestic soft drinks manufacturing sector. KPMG (2014) estimates that Kenya’s soft drinks consumption increased from 306.8 million litres in 2007 to 350.7 million litres in 2011. Over this period, per capita consumption of soft drinks rose from 8.13 litres per person per year to 8.35 litres. Per capita consumption of soft drinks in Kenya is projected to reach 14 litres p.a. by 2030, and 30 litres by 2050. Kenya imports a large amount of soft drinks from Austria (e.g. energy drinks), and to a lesser extent from Mauritius, the United Arab Emirates (UAE), Thailand, South Africa, and the UK. On the other hand, Kenya’s soft drinks exports are mainly destined for Sudan, Uganda, Tanzania, and Somalia. Consumption of Coca-Cola products has shown moderate growth in recent years, with per capita consumption of company beverage products (in units of 237 ml of a finished product) falling from 35 in 1992 to 31 in 2002, before increasing to 39 (approximately 9.2 litres) in

Feasibility and Market for Cassava Industrialisation in Uganda: A Strategic Study Confidential – February 2017
28
2012. In comparison, per capita consumption was 26 servings (6.2 litres) in Nigeria, 39 in China, and 87 (20.6 litres) in Morocco (KPMG, 2014). East African Breweries Limited (EABL, a subsidiary of Diageo) controls around 90% of the Kenyan beer market, and continues to expand into the rest of East Africa (KPMG, 2014). A glance at the company’s subsidiaries acts as confirmation of this: Kenya Breweries Limited, Uganda Breweries Limited, Serengeti Breweries Limited, United Distiller Ventnor, Central Glass Industries, and East African Malting Limited. EABL is listed on the Nairobi, Uganda, and Dar es Salaam stock exchanges. The company has invested in new supply chain capacity, including a new canning line, in order to boost production levels. East African Breweries has 26,000 local partners across the value chain, and sources 10,000 MT of sorghum in Kenya (from only 400 MT four years ago), while two new varieties of high-yielding barley seed were recently launched. According to KPMG (2014) a big focus for East African Breweries is to boost the spirits penetration rate amongst East African consumers; the company has accordingly invested in marketing and sales capabilities in this area (e.g. Johnnie Walker, Smirnoff, Baileys). In the oral care market, Unilever (Close Up) faces competition from Colgate-Palmolive East Africa (Colgate) and GlaxoSmithKline Kenya Limited (Aquafresh). Throughout the Middle East and African region, Colgate is the number one brand for toothpaste (which includes sorbitol, which could be derived from cassava) and toothbrushes, and the second most popular brand for mouthwash.
Kenya’s animal feed market The use of manufactured animal feeds and feed supplements in Kenya has increased steadily over the last ten years. Data by Kenya’s State Department of Livestock estimates that demand for feeds and supplements is about 650,000 MT up from 300,000 MT in 2008 (GAIN, 2014). Registered feed manufacturers account for about 60 percent of the demand; while the unregistered small scale manufacturers, home/community-based formulators, and importers account for the remainder. Some of the challenges facing the animal feeds industry in Kenya include: erratic supply of raw materials, lack of standardization, and low quality of ingredients. The size of the animal feed industry in Kenya has been steadily increasing in the last ten years, mainly due to the growth of the livestock subsector. In 2008 there were about 100 registered livestock feed manufacturers, and by 2013 the number had increased to about 150. Of these, twenty are also large grain millers, and eight are oil seed manufacturers. There are also nearly fifty registered raw material importers and six suppliers of feed premixes (mineral, vitamin and other mineral elements). In addition, there are hundreds of home/community-based formulators whose growth is driven by farmers’ desire to contain increasing production costs.

Feasibility and Market for Cassava Industrialisation in Uganda: A Strategic Study Confidential – February 2017
29
Figure 16: Kenyan Animal Feed Supply and Demand Situation
Source: GAIN (2014), based on information by State Department of Livestock, Kenya, and AKEFEMA The Association of Kenya Feeds Manufacturers (AKEFEMA) affirms that the installed production capacity is adequate to meet the demand. However, actual capacity utilization is constrained by inadequate and erratic supply of raw materials (Figure 16). High cost of some of the ingredients, such as oil-seed cakes and meals, finer mineral elements, fish meal, amino-acids, has also affected the quality and quantity of production. The main livestock feeds consist of roughages, concentrates, minerals and vitamins. The raw materials originate from cereals (corn, wheat, barley, oats, and millet), legumes and oilseeds cakes (soybeans, and cotMT seed cake) and animal by-products (fish meal, blood meal, meat and bone meal). Industry sources indicate that fishmeal as a protein source has become expensive and unreliable owing to dwindling supply and the industry is keen on replacing it with cheaper alternatives, such as soya (GAIN, 2014). The poultry and dairy sub-sectors in Kenya absorb most of the feeds (Figure 17). Both subsectors are based on intensive production systems and located in high potential rural and semi-urban areas, where commercial demand for milk and meat is high. In the lower potential rural areas, extensive livestock keeping is practiced, and livestock nutrition is rarely supplemented with concentrates. Figure 17: Kenyan Animal Feeds Demand by Category
Source: GAIN (2014)

Feasibility and Market for Cassava Industrialisation in Uganda: A Strategic Study Confidential – February 2017
30
In the absence of established aquaculture feed manufacturers, fish farmers resorted to home-made feeds. Currently, some of the existing animal feed manufacturers are exploring investments in specialized manufacturing plants due to sustained demand. Dried cassava is one of the ingredients that can be used for fish feed manufacturing. In order to put the demand for dried cassava in animal feed into context, it needs to be recalled that large quantities of cassava chips and later pellets have been exported principally from Thailand but also Indonesia into European countries mainly in the 1980s and 1990s (FAO/IFAD, 2004). This was due to agricultural policies which favoured the blending of protein rich feeds (e.g. soya beans) with energy rich feeds, such as dried cassava, to produce animal feed. At the time, the price of locally produced grains such as maize or barley was too high compared to the blend of dried cassava and protein balancers to make it attractive for feed manufacturers. In 1990, at the height of dried cassava imports into Europe, about 8.1 million MT of cassava chips or pellets were imported by European countries. This amount started to decline later in the 1990s when feed grains became more competitive due to changes of the Common Agricultural Policy of the European Community. This section shows that there is a market for products that can be made from cassava based ingredients at national as well as regional levels, in that countries such as Uganda, Kenya, and other EAC member states have economic growth, increasing purchasing power, changing consumer habits, and population growth. The countries attempt to meet demand through their own production but there are also imports which weigh on the balance of trade. In view of this, the production and processing of agricultural products that can substitute these products is to be encouraged. Figure 18 shows that, according to UN trade data, in 2013 the value of Ugandan merchandise exports was US$ 2.4 billion, compared to imports worth US$ 5.8 billion. This resulted in a merchandise trade balance deficit of US$ 3.4 billion. The value of exports of services (e.g. transportation) was US$ 1.9 million in 2012, while imports of services were US$ 2.4 billion, resulting in a trade in services deficit of US$ 0.5 billion. In comparison, in 2010 the value of Kenya’s merchandise exports was US$ 5.2 billion, whilst the merchandise imports reached US$ 12.1 billion, resulting in a merchandise trade deficit of US$ 6.9 billion. Kenya’s trade balance in services was US$ 2.4 billion in surplus in 2012, due to exports of US$ 4.8 billion and imports of US$ 2.3 billion (rounded figures). Figure 18: Uganda’s and Kenya’s merchandise trade balance, by value (in US$)
Uganda Kenya
Source: UN Comtrade and UN Service Trade
Feasibility and Market for Cassava Industrialisation in Uganda: A Strategic Study Confidential – February 2017
31
3.4 CASSAVA’S COMPETITIVE POSITION AGAINST OTHER SOURCES OF STARCH
Mature fresh cassava roots contain between 15% and 32% starch by weight, the question must be asked how does this starch compare against competing sources of starch and sugar? The competitive position of cassava as a source of starch or sugar varies according to the intended application and the final form of the starch (dry chip, high quality flour, native or modified starch). In terms of physico-chemical properties native cassava starch can be used as a direct replacement for wheat starch without difficulty. In some cases (such as starch for textile sizing or paperboard adhesive) the unique properties of cassava starch convey advantages that make cassava starch the first choice for the customer. In a sophisticated industry cassava starch can be chemically modified in much the same way as maize starch to deliver directly equivalent products. When it comes to enzymatic conversion of starch into sugar syrups cassava offers the same degree of suitability as any other starch and hence could be the crop of choice if readily available at a competitive price. For production of extra neutral alcohol (ENA) cassava starch would always be the second choice with the first choice feedstock being sugar cane or sweet sorghum. Sugar cane and sweet sorghum have the obvious advantage that they yield fermentable sugar directly making production less complex and costly. In the case of cassava starch (or any starch), the starch must first be extracted and then jet cooked with thermostable enzymes to break the starch down into fermentable sugar. Jet cooking requires heat and therefore is energy intensive. Thermostable enzymes are expensive and for many countries are imported commodities. High quality cassava flour (HQCF) has some potential for use as a glue extender in plywood manufacture, as a replacement for starch in paperboard adhesive, as a source of carbohydrate in brewing, as a replacement for starch in extruded meats, and as a partial replacement for wheat flour in bread and bakery products. HQCF can be the first choice for plywood manufacture as long as alternatives such as wheat flour are more expensive and as long as the plywood is of good quality. Low-grade plywood can be made using cheaper fermented cassava flours as the life expectancy of the plywood is much shorter. HQCF can be a first choice for paperboard adhesive as long as it is cheaper than the competing starches and contains a maximum fibre content of 3%. At concentrations above 3% the paperboard will tend to come apart (so called “zipper board”) a situation that is unacceptable for the packaging industry. HQCF would be the second choice when compared to pure starch for brewing purposes. However, if the price is competitive and especially if a tax or duty break is on offer HQCF can become attractive for brewing of clear beer. If the brewer wishes to use 30% or more HQCF in the brew the fibre content must be extremely low to avoid additional energy costs for brewing and other problems with filtration. Small-scale manufacturers of HQCF will always have difficulty delivering an ideal product for a brewery. Large-scale processors have the option to use similar equipment to that found in starch factories to reduce the fibre level to a very low level. This type of HQCF is still cheaper to produce than native starch and could prove attractive for the clear beer industry.
Feasibility and Market for Cassava Industrialisation in Uganda: A Strategic Study Confidential – February 2017
32
HQCF can be the first choice for replacement of pure native starches as fillers and binding agents in extruded meats such as the meat filling used in sausage rolls (a very common street food in Nigeria). There is scope to use HQCF at levels from 10-20% in sweet and hard dough biscuits. However, as the percentage is increased machinability problems are encountered on the production line and the biscuits lose volume, have reduced colour and become more brittle. Many of these problems can be overcome by developing recipes designed to cope with inclusion of 20% HQCF but not all biscuit makers are willing to make this investment even when the business case looks attractive. Gluten is a protein found in wheat flour but absent from HQCF. Gluten is an essential of bread baking as the gluten helps to create and stabilise the aerated structure essential for loaf volume and texture. Even quite small reductions in gluten will result in much reduced loaf volume and a heavy cake like texture. HQCF can be added at levels up to 5% without significant adverse effects. At levels >10% the volume is noticeably reduced and the texture becomes much denser, these characteristics are unacceptable for most consumers of bread. Specialised bakery improvers (designed specifically for use with HQCF) can prove useful (but are expensive) at inclusion levels of 20% to 25% but the effect of the HQCF is still noticeable and many consumers complain of an off putting flavour. Looking at the economics of bread production offsetting the high cost of the improvers against the reduced cost of HQCF versus the cost of wheat flour it is necessary to use an inclusion level of 40% to make inclusion of HQCF worthwhile for the baker. However, there are no reliable bakery improver solutions available at the present time to support this level of inclusion. Experience from Nigeria has shown that reliance on inclusion of HQCF in bread as a cornersMTe for industrialisation of cassava is most unwise and an almost guaranteed recipe for failure. Production of dry chips offers the simplest way to process cassava. Dry chips have many problems associated with fermented flavours, taints from direct fired drying and poor quality characteristics such as moulds and high fibre. Dry chips are not suitable for processing into starch (except in very specialised situations such as production of oxidised starch) and cannot be used for production of HQCF. However, they are very popular as a carbohydrate source for production of industrial alcohol. China is the world’s biggest importer of dried cassava chips for alcohol production importing >7.5 million MT per year mostly from South East Asia (Myanmar, Cambodia, Indonesia, Laos, Thailand and Vietnam). However, pricing is extremely competitive with prices in the range CIF US$240-US$280/ MT into Behai Port in Guangxi Province. Nigeria attempted to access this market but cost of production ranged from US$359 to US$479 making exports to China impossible. Cassava chips can be used as a carbohydrate source for production of feed for beef cattle and pigs and also for production of cooked and extruded pellets for aquaculture feeds. The main factor determining the business case for any of these feeds is the cost and availability of the protein component of the feed. Cassava has a poor record as an ingredient in poultry feed with complaints being made about poor feeding, loss of weight and transmission of diseases such as Salmonellosis via cassava-based feeds. Cassava is not recommended as a feed for poultry. Cassava chips have some potential for use at low levels of inclusion as an adjunct in production of clear beer but the end products often have unpleasant taints such as butyric acid flavour that many consumers find unpalatable. Some of the major breweries in Africa are experimenting with chips, HQCF, wet-cake and native cassava starch for production of clear beers. Native cassava starch is the clear winner in terms of product quality and ease of use but requires the highest level of investment to produce the starch. Wet-cake has proved a failure in Mozambique and Ghana resulting in sub-standard products and unexpected cost implications. HQCF could be a cheaper alternative to pure starch but it is essential to invest in a relatively sophisticated process to remove fibre during processing.
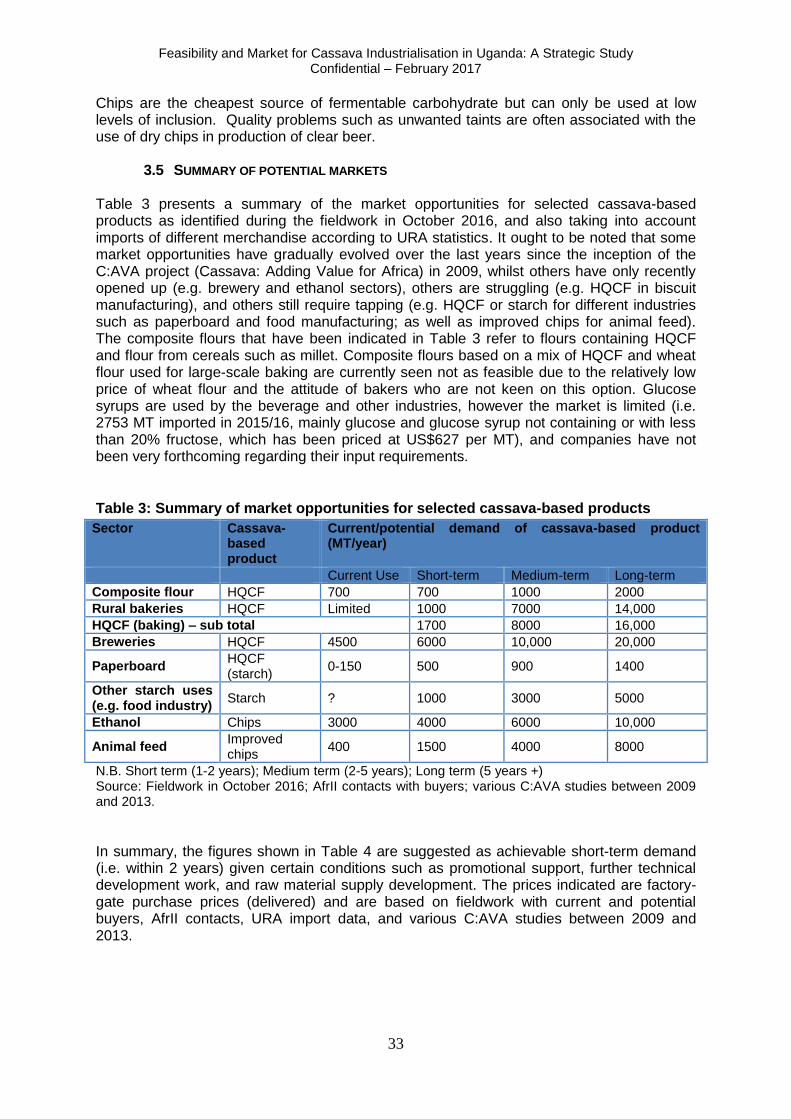
Feasibility and Market for Cassava Industrialisation in Uganda: A Strategic Study Confidential – February 2017
33
Chips are the cheapest source of fermentable carbohydrate but can only be used at low levels of inclusion. Quality problems such as unwanted taints are often associated with the use of dry chips in production of clear beer.
3.5 SUMMARY OF POTENTIAL MARKETS Table 3 presents a summary of the market opportunities for selected cassava-based products as identified during the fieldwork in October 2016, and also taking into account imports of different merchandise according to URA statistics. It ought to be noted that some market opportunities have gradually evolved over the last years since the inception of the C:AVA project (Cassava: Adding Value for Africa) in 2009, whilst others have only recently opened up (e.g. brewery and ethanol sectors), others are struggling (e.g. HQCF in biscuit manufacturing), and others still require tapping (e.g. HQCF or starch for different industries such as paperboard and food manufacturing; as well as improved chips for animal feed). The composite flours that have been indicated in Table 3 refer to flours containing HQCF and flour from cereals such as millet. Composite flours based on a mix of HQCF and wheat flour used for large-scale baking are currently seen not as feasible due to the relatively low price of wheat flour and the attitude of bakers who are not keen on this option. Glucose syrups are used by the beverage and other industries, however the market is limited (i.e. 2753 MT imported in 2015/16, mainly glucose and glucose syrup not containing or with less than 20% fructose, which has been priced at US$627 per MT), and companies have not been very forthcoming regarding their input requirements.
Table 3: Summary of market opportunities for selected cassava-based products
Sector Cassava-based product
Current/potential demand of cassava-based product (MT/year)
Current Use Short-term Medium-term Long-term
Composite flour HQCF 700 700 1000 2000
Rural bakeries HQCF Limited 1000 7000 14,000
HQCF (baking) – sub total 1700 8000 16,000
Breweries HQCF 4500 6000 10,000 20,000
Paperboard HQCF (starch)
0-150 500 900 1400
Other starch uses (e.g. food industry)
Starch ? 1000 3000 5000
Ethanol Chips 3000 4000 6000 10,000
Animal feed Improved chips
400 1500 4000 8000
N.B. Short term (1-2 years); Medium term (2-5 years); Long term (5 years +) Source: Fieldwork in October 2016; AfrII contacts with buyers; various C:AVA studies between 2009 and 2013.
In summary, the figures shown in Table 4 are suggested as achievable short-term demand (i.e. within 2 years) given certain conditions such as promotional support, further technical development work, and raw material supply development. The prices indicated are factory-gate purchase prices (delivered) and are based on fieldwork with current and potential buyers, AfrII contacts, URA import data, and various C:AVA studies between 2009 and 2013.

Feasibility and Market for Cassava Industrialisation in Uganda: A Strategic Study Confidential – February 2017
34
Table 4: Short-term demand for cassava products and factory purchase prices
Products required by end-user industries Quantity
(MT) Price
(USh/kg) Price
(US$/MT)
HQCF for bakeries/ institutions/ composite flour 1700 1500 – 2000 444 – 592
HQCF for breweries (i.e. milled chips and grits) 6000 1000 – 1200 296 - 355
HQCF (starch) for paperboard 500 1500 – 2000 444 - 592
Starch for other industries (e.g. food industry) 1000 1500 – 2000 444 - 592
Chips for ethanol production 4000 800 – 1000 237 - 296
Improved chips or grits for animal feed 1500 800 – 1100 237 - 325
Sources: Fieldwork in October 2016, AfrII contacts with buyers, import data, and C:AVA studies between 2009 and 2013. NB. US Dollar prices have been rounded
Feasibility and Market for Cassava Industrialisation in Uganda: A Strategic Study Confidential – February 2017
35
4.0 LARGE-SCALE PROCESSING OF CASSAVA
Under current conditions Uganda’s cassava is used primarily for household food security and production of traditional food products. Production of traditional foods is mainly conducted on a small scale at household level with limited technology. The main technical requirement is for access to a hammer mill to convert the dried chips into flour. Projects such as the Bill and Melinda Gates Foundation (BMGF) funded C:AVA II programme have introduced the concept of small-scale production of high quality cassava flour (HQCF) using graters, presses and either solar or flash-drying technology. There are currently two small to medium scale enterprises in Lira and Apac that use small flash dryers to produce HQCF. The capacity of each factory is 3 MT of HQCF per day. However, for the purposes of this report we will only be looking at large scale processing of cassava-based products. For the sake of convenience, we have defined large-scale operations as those producing >10 MT per day of dry product or its equivalent.
4.1 TECHNOLOGIES & PRODUCTS In this section we will look at the range of cassava-based products and technologies available for processing on a commercial scale. The technologies have been arranged in order of sophistication starting with dry chips which offer the simplest entry point and then moving up the scale to finish with sugar syrup and potable alcohol which represent the highest level of technology and capital investment.
4.1.1 Dry chips Production of dry cassava chips is the simplest form of cassava processing but is not well suited to industrialisation. To keep costs down it would be best to continue to rely on manual peeling followed by mechanised chipping or slicing. The chips are best dried in the sun in areas with long periods of dry weather and low atmospheric humidity. Chips intended for food uses such as animal feeds, brewing and potable alcohol should be peeled prior to chipping. If artificial drying is contemplated heat must be provided indirectly via a heat exchanger to avoid contaminating the chips with toxic by-products from burning of the fuel source intended for heating the air stream intended for drying. Chips intended for production of industrial (non-potable) alcohol do not need to be peeled and can be directly dried (easily detected by a smell of wood smoke or burnt oil). However, this type of chip must never be used for production of animal or human food products or beverages. The conversion ratios for peeled and unpeeled chips are 3:1 and 2.5:1 respectively.
4.1.2 Hard pellets Production of hard pellets for animal feed can offer an attractive entry point for large-scale cassava processing as the technology and level of investment required is much lower than that seen with other forms of industrial processing of cassava. However, there are some caveats to take into consideration. Cassava-based pellets are usually made for use in the animal feed industry. The formulation of the pellets is a skilled job requiring the expert input from an animal feed technologist with experience in feeding of animals intended as consumers of the product. Aquaculture feed is an attractive area but the prospective investor should take expert advice not only on the formulations for different fish species and growth stages. Some species prefer sinking pellets whereas others require a floating pellet. Some species require floating pellets in the early stages of growth but move to sinking pellets as they mature. The second factor to consider is the source and cost of the protein component of the feed. Cassava is an excellent source of energy but has almost no protein or lipid and an inadequate amino acid profile. For this reason, pellets made from cassava will also contain a protein and lipid source, and an amino acid supplement. For aquaculture imported fish meal and amino acid supplements are commonly used. Given that issues of
Feasibility and Market for Cassava Industrialisation in Uganda: A Strategic Study Confidential – February 2017
36
formulation and cost of other ingredients have been sorted out the rest of the production process is straightforward. Hard pellets are produced using dried cassava chips with no special quality requirements. The cassava chips can be purchased from village processing sites and milled into flour when required for use. The cassava flour is then mixed with water, fish meal and amino acid supplements and fed into a heated screw fed extruder. The extruder forms and cooks the pellets. The extruder system can be adjusted to vary the level of air trapped in the pellets. Dense pellets will sink when placed in water, whereas pellets containing a lot of trapped air will float. After extrusion the pellets are passed through a continuous belt oven. The oven reduces the moisture content of the pellets to 11-13%. The end product is a hard dry pellet that can be bagged for sale as aquaculture feed. The capital investment for a Chinese made aquaculture feed line with a capacity of 1000kg of dry pellets per hour is ~US$500,000. It is worth noting that although aquaculture using artificial feeds may not be well developed in Uganda, Kenya or Tanzania there could be potential to target Egypt which has a large and well developed aquaculture sector that relies on pelletized feeds.
4.1.3 High quality cassava flour (HQCF) Traditionally prepared cassava flour is a well known product in Uganda and many other countries across sub-Saharan Africa. However, these traditionally prepared flours are often coarsely milled (to meet customer requirements), contain fairly high level of fibre and are often fermented. Combinations of fermentation and long drying times produce flours that have a strong fermented and acidic taste. The colour of these flours varies from cream to brown but is rarely white in colour. Traditional flours can be made to a very high standard but some outlets sell flour that is contaminated with insect debris and even rodent droppings. Such contaminants can result in traditional flours having a bad name that puts off high value customers such as food processors and breweries. High quality cassava flour (HQCF) was developed in West Africa as a new product that would be white/light cream in colour, unfermented, low fibre, finely milled and of a generally high quality suited for use in bakeries and industrial applications. The name HQCF was chosen to distinguish the new product from the many traditional flours. HQCF is also produced from crushed roots to ensure sufficient removal of cyanogenic glucosides especially when using bitter varieties of cassava. Use of cassava chips for production of HQCF was discouraged in West Africa as flour produced from chips was often found to contain potentially hazardous levels of residual cyanide. The traditional SME process (suitable for producing 0.05 to 4 MT of HQCF per day) for production of HQCF involves manual peeling of roots to remove the bark and peel layers. Peeled roots are washed in water and then passed through a mechanised grater or wet hammer mill to crush the tissues (an essential step for removal of cyanide). The wet pulp discharged from the grater or wet mill is packed into sacks for de-watering. Each 50kg bag is filled with ~12-15kg of wet cassava mash containing 65-70% moisture. Mechanical de-watering is achieved using a hydraulic jack press fitted with a 32 or 50 MT lorry jack. The bags are stacked within the frame and pressure is then applied slowly using the jack. Care must be taken to avoid bursting the sacks or overloading the jack’s seals when applying pressure. Typically, pressure is applied for about 10 minutes to allow water to drain from the mash. The pressure is then briefly relaxed before increasing the pressure again. This is done several times over a 2-hour period and allows water to migrate outwards from the centre of the cake to emerge and drain away. Simply applying a lot of pressure can trap water within the mass of the wet cake. Operating a jack press takes practice but a good operator using a 50 MT jack should be able to reduce the moisture content to ~41-42%. The wet cake is then passed through the grater again to reduce the cake to fine particles. The fine granules are then dried. At village level this is often done using sun drying mats or racks but capacity is limited. SME industries would normally use a Nigerian made small-

Feasibility and Market for Cassava Industrialisation in Uganda: A Strategic Study Confidential – February 2017
37
scale flash dryer such as the Nobex 6 cyclone. A flash dryer of this type has an output of ~300kg of dry product per hour under optimal conditions. The flash dryer uses indirectly heated air to dry the flour particles to 10-12% moisture content within 2-3 seconds. A series of cyclones are used to separate the dry flour from the hot air stream. The dry product is then passed through a hammer mill and screened to provide a final flour of the desired particle size. For most applications HQCF is screened to 0.25mm but for composite flour products a coarser screen is used to give a particle size of 0.5mm. The hammer mill and screening step also serves to reduce the fibre content of the final product. This is important for users such as paperboard industries and breweries. An SME factory will cost around US$200-250,000 including the Nigerian flash dryer at ~US$50,000. The SME process is fine for outputs of upto 4 MT per day. However, this approach is not suited for large-scale operations due to the labour intensive nature of manual peeling and issues with using jack presses to de-water large volumes of wet cake. There are two broad approaches for larger-scale production of HQCF (20 MT and above per day). One approach relies on hammer milling and multi-stage screening of the dry product to separate the HQCF from contaminating materials such as fibre and peel fragments. The other more elegant approach uses some of the equipment found in a starch factory to remove peel fragments and fibre before drying. China can supply equipment for either of these options at a similar cost. Both options start with dry washing and counter-current paddle washing to remove all of the outer bark and some of the inner peel layer. Roots are then chopped into small pieces and fed into a “jain” type rasper to crush the tissues. Crushed material is mixed with treated water (sulphur treated) to create a slurry with about 10% solids. The suspension is passed through a magnetic trap and sand cyclone to remove any contaminants and then pumped to large holding tanks fitted with continuous stirrers to prevent settling out. These tanks feed material alternately to one of two membrane presses. The membrane filter press (MFP) has special bags to hold the cassava slurry and hydraulic rams to apply pressure to the pulp and remove the water. De-watering typically takes around 90 minutes to reduce moisture content to 41-42%. Once de-watering is complete the press discharges the wet cake into the inlet of the flash dryer. The flash dryer has a disintegrator in its inlet to reduce the cake to fine particles. The flash dryer works in the same way as the one seen in the SME operation but has a higher capacity, better process control and is more energy efficient. Dry product emerging from the flash dryer is passed through a hammer mill and then three stages of screening. The first stage is essential for removing heavy fibre and bark fragments that would quickly block the finer sieves in the secondary screens. The secondary screens complete the process of separating the HQCF from the fine fragments of fibre and peel fragments. In a typical process approximately 85% of the dry material is recovered as HQCF and 15% goes for animal feed as black flour. The second approach uses the same steps to wash, peel, chop and crush the roots. The resultant slurry passes through the same magnetic trap and sand cyclone to remove contaminants. After the sand cyclone the process changes as the suspension of fine particles is fed to a centri-sieve unit for removal of fibrous material and other contaminants. The output from the centri-sieve is pumped to a small bank of hydrocyclones (3-4 units only). The hydrocyclones serve to remove most of the fine fibre and concentrate the suspension to around 15% solids. The concentrated suspension is pumped into a centri-peeler. The centri-peeler provides a final stage of washing and removal of fine fibres followed by rapid de-watering. In just a few minutes moisture content is reduced to 33-34% and the wet cake is discharged to the flash dryer for drying. The dry product is hammer milled and passed through a single stage of fine sieving (70-80 mesh screen) to produce a very high grade of HQCF. This type of HQCF has high purity with very low fibre levels and is ideally suited for the production of clear beers and paperboard adhesives but would also be suitable for all food uses. The conversion ratio for HQCF is ~4:1. The total investment cost of a 20 MT per day factory would be in the range US$2-2.5 million. In a recent commercial contract Chinese suppliers quoted prices of US$815,000 for a processing line designed for dry

Feasibility and Market for Cassava Industrialisation in Uganda: A Strategic Study Confidential – February 2017
38
removal of fibre and US$797,000 for wet removal of fibre (these prices were FOB Wuhan, China). The dry removal of fibre option works out more costly due to the need to purchase two membrane filter units. The experience of the authors of this report would suggest that the process that removes fibre pre-drying using technology borrowed from starch processing offers the best option in terms of capital and operating costs and end product quality.
4.1.4 Native and modified starches Mature cassava roots (10-12 months old) can contain between 15 and 32% starch depending on the variety and agronomic conditions. Cassava has an advantage over other sources of starch as mature roots contain mainly water and starch with only small amounts of protein, fat and fibre. As the roots become over mature the amount of fibre increases reducing the amount of recoverable starch. For large-scale production of native cassava starch (unmodified starch) the minimum scale is ~20 MT of starch per 12-hour shift. This is really a small factory and would not be seen in Thailand, China or India. In these countries the minimum size is a least 100 MT of starch in 12 hours. Most factories produce a minimum of 250 MT of starch per day and some factories in Thailand produce as much as 2,000 MT of starch per day. The conversion ratio for native cassava starch ranges from 4.6 to 5:1. Production of native cassava starch starts with dry washing of roots followed by vigorous washing in a counter-current paddle washer. The paddle washer removes all of the outer bark and a significant amount of the inner peel layer. The washed roots are then chopped into small chunk and fed into a “jain” type rasper (rotating drum fitted with numerous toothed blades) supplied with a continuous stream of treated water. The rasper ruptures the tissues and releases the starch granules into suspension. The resultant starch milk is passed through a magnetic trap and sand cyclones to remove any metallic material and sand particles present in the milk. The milk is then passed through several stages of centrisieves. The centri-sieves use a combination of centrifugal force and fine mesh sieves to separate the starch granules from contaminating materials such as fibre and protein. The milk exiting the final centrisieve is passed to a bank of hydrocyclone units. Each unit has numerous hydrocyclone cones made from Teflon. The hydrocyclones provide a further stage of purification and also concentrate the milk upwards from 2-3% to ~15%. The concentrated pure starch milk is passed to a centri-peeler unit. The centri-peeler unit serves two functions. In the first stage of operation the centri-peeler uses water and centrifugal force to give the starch a final wash to achieve the highest level of purity. In the second stage of operation centrifugal force is used for mechanical dewatering. A good quality centri-peeler will discharge wet starch cake with a moisture content of ~32-34%. Mechanical de-watering is an important step as this process saves energy by reducing the amount of water that must be evaporated off by the flash dryer. Wet cake emerging from the centri-peeler is fed into a pneumatic dryer (also known as a flash dryer). The flash dryer is designed to use an indirectly heated air stream to reduce the moisture content of the starch particles to 10-12% in 1-2 seconds. The reduction in moisture is so fast that the starch does not cook. The air stream rising within the flash dryer contains a mixture of hot air and dry starch particles. This air stream is fed to one or more cyclone units. These units use a cyclonic action to separate the air stream from the dry powder. On smaller units the hot air stream is simply discharged to the atmosphere, larger units have hot air recycling to improve energy
efficiency. The dry powder is passed through heat exchangers and cooled to ~30C before emerging from the dryer. This dry product is passed through a hammer mill and screened to give a particle size of ~0.18mm. The milled and screened product can be held in silo’s or sent directly to the bagging machines. Machines are available for both small bags (50kg) or bulk bagging (750kg). There are no reputable makers in Thailand that still make 20 MT/day processing lines. However, these can be imported from suppliers in China and India. A native cassava starch (NCS) line with an output of approximately 20 MT of NCS per day will cost between US$3-

Feasibility and Market for Cassava Industrialisation in Uganda: A Strategic Study Confidential – February 2017
39
3.5 million. Native cassava starch is the basic product of a starch factory and can be used directly in paperboard glues and textile sizing. However, the real money and wider market lies in the production of chemically and physically modified starches. These starches are produced by treating wet starch with various chemicals under controlled conditions to produce products with novel properties desired by the customer. In China modified starches can sell for US$250-US$300 per MT more than NCS. A higher capital investment is required for the chemical modification facility but the products are all typically high value materials with a wide range of applications in the food, beverages, textile, paper, pharmaceutical, mining and explosives industries to name just a few areas. Production of modified starch is a sophisticated process and is unlikely to yield a good return on investment at a scale less than 250 MT/day under most circumstances. Potential investors are advised to check the size of potential markets and price of competing products. As a general rule of thumb it is always worth checking on the price of a comparable product exported from Thailand. The Thai cassava starch is the largest and most efficient in the world and sets the bench mark for pricing of native and modified cassava starches.
4.1.5 Sugar syrups Starch from cassava roots or other carbohydrate sources such as maize can be hydrolysed using enzymes to form glucose syrup. Glucose syrup is actually a mixture of malto-dextrins of varying chain lengths. Glucose syrup is not particularly sweet when compared to sucrose but has applications in the food and beverage industries as a thickener used to give products body. Glucose syrup can be further refined to produce pure glucose for use as a sweetener. Alternatively the syrup can be treated with glucosisomerase to form high fructose syrup (HFS). HFS has the advantage of intense sweetness at low concentrations and is favoured for carbonated drinks. The basic conversion yields a syrup containing 42% fructose, 55% glucose & 3% dextrin’s which has many applications but is not of the right sweetness for use in beverages. HFS-42 can be further refined for industrial purposes to produce 90% fructose syrup which is then blended with HFS42 to produce HFS-55 (55% fructose, 41% glucose & 4% dextrin’s) for sale to the beverage industries. HFS55 has the correct sweetness, is stable, extremely soluble in water and thus has considerable advantages as a replacement for sucrose. It can also be used in bakery products, confectionary, soft ice-cream and other dairy products. HFS has received a bad press recently especially in the US. Allegations have been made of links between HFS in the diet and obesity, diabetes and related complaints, but the medical evidence is inconclusive. Sorbitol is a low-energy sugar alcohol produced by catalytic hydrogenation of glucose syrup. Sorbitol is commonly used in health (for dieting) foods, as an ingredient in toothpaste and also by pharmaceutical industries. The basic conversion ratios are 4.6:1 for glucose syrup and 5:1 for HFS. Production of sugar syrups is a major investment in complex processing technology and is relatively energy intensive. To be sure of success prospective investors need to look carefully at availability, quality (starch content minimum of 25%) and cost of fresh cassava roots as raw materials will account for >30% of production costs. The market for the end products must also be clearly defined. Beverage plants use large amounts of sugar but it is essential to determine whether they rely on sucrose (readily available from Uganda’s sugar industry) or imported sugar syrups. If the factories use sucrose they would need to make major capital investments to switch over to using sugar syrups. They are unlikely to do this in support of a fledgling cassava-based sugar syrup industry as the risks to their business would be too high. If the factory is targeting import substitution or exports of sugar syrups it will be important to understand whether production in Uganda can compete against the imported products. The failure of Ekha Agro Limited in Nigeria is a good example of the difficulties of trying to compete with imported products. Ekha-Agro was established on the understanding that Nigeria’s snack-food, brewing and pharmaceutical industries import ~70,000 MT of sugar syrups per annum from China. There was also the hope that Nigeria’s soft drinks industry
Feasibility and Market for Cassava Industrialisation in Uganda: A Strategic Study Confidential – February 2017
40
would change from imported sucrose to locally produced HFS creating an additional market of 150,000 MT per annum. Chinese sugar syrups were initially costing US$800 per MT to import but changes in import tariffs pushed import costs to US$933/MT thus giving Ekha-Agro some chance of success. The reality was quite different in that Ekha-Agro’s main customer offered between US$700-US$800 per MT for glucose syrup (for use in brewing). However, Ekha-Agro’s production cost was US$1,288/MT. These high production costs were associated with high cost for fresh cassava roots, poor starch yields (14-16%), high cost of using generator power (in the absence of a reliable national grid) and competition with processors of traditional food products. The company was unable to compete and the factory was shut-down in December 2012 and remains closed (as of October 2016).
4.1.6 Industrial & Extra neutral alcohol Cassava roots can be used in either fresh or dry form as a feedstock for production of ethyl alcohol. The conversion ratio for fresh cassava roots is ~7.5:1 (7.5 MT of FCR per m3 of extra neutral alcohol) and ~3:1 for dried cassava chips (3 MT of chip per m3 of extra neutral alcohol). The end product is determined by the number of distillation plates in the distillation columns and hence the level of refining. Extra neutral alcohol (ENA) has a high level of purity and can be used directly in the production of alcoholic beverages. Industrial alcohol (IA) is cheaper to produce with better conversion ratios (~6:1 for FCR & 2.5:1 for dry chips). IA is suitable for use by chemical industries and as a biofuel for blending with petrol. However, it is not potable and cannot be used safely for beverage production without further refining. The production of cassava-based ethanol involves extraction of starch from the
roots with water. The starch suspension is then jet cooked at 100-110C to gelatinise the starch and make it available for enzymatic hydrolysis. Enzymatic hydrolysis is a two stage process using thermostable alpha amylase and glucoamylase to produce a suspension of
fermentable sugars. The fermentable sugar suspension is cooled to 30-32C inoculated with activated yeast and left to ferment for ~72hours. Post fermentation the liquid will contain ~7.5% ethyl alcohol. This suspension is filtered to remove the yeast and other solids and then passed through multiple distillation columns heated with steam. In the production of ENA only the pure fraction of ethanol (containing 96-99% ethyl alcohol) is taken as the final product. The other toxic fractions are discarded as part of the waste stream known in the industry as vinesse. Production of ethyl alcohol is an energy intensive, environmentally unfriendly process generating large amounts of toxic effluent (known as vinesse), which has a high biological and chemical oxygen demand and acidic pH. If FCR is used the factory will generate 13m3 of vinesse per m3 of ENA. Dry chips will generate 8.5m3 of vinesse per m3 of ENA. This effluent must be treated before discharge to the environment. Smaller-scale factories normally rely on aerobic lagoons, larger factories (>20m3 ENA per day) can use anaerobic digestion and recover biogas as a useful by-product. To achieve an energy efficient process with opportunities for recovery of biogas, the minimum size for an ENA factory should be ~33m3 of ENA per day. A plant of this size will involve an investment of ~US$30 million and consume either 250 MT of FCR or 100 MT of dried cassava chips per day. Smaller plants are hampered by high energy costs relative to the yield of product leading to high costs per litre of ethanol produced which are normally uncompetitive against local or imported ethanol from large-scale operations.
4.2 LOCATION OF PROCESSING UNIT Where should you locate your factory? This is a question asked by most investors new to industrial scale processing of cassava. In this section we provide a summary of the key factors to take into account.
Feasibility and Market for Cassava Industrialisation in Uganda: A Strategic Study Confidential – February 2017
41
Access to raw material supply – The factory needs to be located in an area where fresh cassava roots or dry chips (depending on the choice of raw material) are readily available in the required volume on a year round basis. The raw material needs to be competitively priced and hence areas with well established alternative markets for their roots or chips should be avoided as these markets will compete with the factory for raw material. Any sensible investment is likely to derive its supplies from a combination of own farm sites, commercial growers (if possible) and smallholder farms. A factory that relies entirely on smallholders is almost certain to fail due to erratic raw material supply. Ideally the factory should derive 70% of its raw material from its own farms and larger-scale commercial growers and 30% from small-scale farming. The geography of the production area needs consideration. Flatter land with larger open areas will be better suited for growing cassava on a commercial scale as the land can be cleared and mechanisation introduced. Even the smallholder farmers will have a better chance of introducing good agricultural practices (GAP) on reasonably flat land. Checks should be made on water availability, rainfall and soil fertility to get the best chance of good yields and high starch content in the roots. Access to good roads – The factory should be located on or very close to a main road with a tarmac surface. This is important as large lorries will be going in and out of the factory delivering raw material and consumables and taking away the end product. If the access roads are bad this could disrupt the work of the factory during the rainy season. Access to reliable national grid power – Mains electricity is invariably much cheaper than using generator power. For example, at the KLUL distillery in Lira mains power costs US$20.37 per m3 of industrial alcohol produced. When the factory is forced by load shedding to switch to diesel generator electricity costs rise to US$71 per m3 of industrial alcohol produced. Actual costs will vary from factory to factory but the example of KLUL illustrates the point that generator power is always an expensive option and can have a major influence of competiveness of the end product. For all of the industries discussed in this study it will be essential to have access to three phase power running at 380/415V. In most cases the factory will require its own 11kv stepdown transformer to take power from the grid. You will also need to factor in the cost of electrical poles and cabling to bring the supply from the main line onto the factory site. Access to mains or borehole water – With the possible exception of dry chip production access to large volumes of clean water is critical for all of the cassava processing industries. Abstraction from rivers without extension treatment is a big mistake as this will undermine product quality. Ideally the factory should have access to mains water as this is normally the cheapest supply. However, cassava processing industries are often located in rural locations away from the mains supply. In rural areas it will be necessary to have a borehole with pump and storage tanks. For production of HQCF, starch and sugar syrups it will be necessary to split the supply into untreated and treated water for the different stages of the factory. Borehole or mains water can be supplied directly (untreated) to the initial stages of processing where the roots are cleaned, peeled and chopped. Approximately 40% of the washing water can be re-cycled in the washing area. However, for rasping and subsequent stages of processing only treated water should be used. Treatment is very simple and cheap and involves passing the mains or borehole water through a sulphur generating unit costing approximately US$3,000. Access to skilled labour – Any form of large-scale processing will need skilled personnel as well as general labourers. There will be a need for competent managers, an electrician and mechanic, laboratory staff for quality assurance, clerks and an accountant. The management team will include a general manager, production manager and dedicated procurement manager to take care of raw-material supply. Factories making use of outgrower schemes should also have a manager with experience of cassava farming on a large-scale to organise the outgrowers and supervise the provision of advice on good

Feasibility and Market for Cassava Industrialisation in Uganda: A Strategic Study Confidential – February 2017
42
agricultural practices (GAP), input supplies on credit etc. The factory needs to be located in an area where such labour is available or is willing to work on a long-term basis. In very rural locations there tends to be a high turnover of key personnel and this will undermine the business.
4.3 RAW MATERIAL SUPPLY Raw material supply is the most critical component for the success of a large-scale cassava processing factory. The factory must ensure regular supplies of sufficient volumes of FCR on a daily basis throughout the year in order to keep the factory operational. Just getting the correct volume of FCR is not sufficient, in order to maximise cost efficiency the FCR must contain the highest possible level of starch and lowest level of fibre possible. The cost per MT of FCR must be as low as possible to give the factory a chance of producing a competitive product. Volume and regularity of supply are associated with development of an integrated supply chain for FCR supplies. Starch percentages, yields and production costs per unit area are associated with the implementation of good agricultural practice (GAP) at the farm sites. Developing an integrated supply chain for deliveries of FCR is a time consuming and costly exercise requiring investment in a procurement manager and staff equipped with motorbikes that can travel to the farms to make arrangements for production of FCR for the factory. The same staff will play a role in providing advice on GAP and supervising demonstration plots. A typical procurement system is likely to take several seasons to become established and deliver reliable results especially if heavy reliance is placed on smallholder farmers who have no prior experience of growing cassava as an industrial crop. The factory’s management must take this into account in developing the units’ business plan. During year 1-2 roots supplies are likely to be insufficient, quality control will be less than ideal with lower than expected starch contents and higher levels of fibre and rotten roots. All of this will impact on profitability in the early days. However, patience and investment in good management will yield good results by the third year of production and the early losses will gradually be recovered. The company should encourage the gradual adoption of GAP (see detailed discussion below) and assist the growers to access supplies of clean planting material for new disease resistant/tolerant high yielding varieties. From the factories perspective the best varieties will be those that yield the highest levels of starch in the shortest period of time. Cooking characteristics are not important as the crop is not intended for use in preparation of traditional cassava foods. The company will need to encourage a new culture of payment by weight right from the start. This might seem a self-evident concept but the reality in rural Uganda is quite different. The majority of farmers met during the recent mission (and during previous assignments) are unfamiliar with selling cassava by weight and actually prefer selling the contents of a plot (sight unseen) for an agreed price. This is a sort of gamble which favours the factory if yields are high but works better for the farmer if yields are lower than expected. Some farmers are even hostile to the idea of the cassava being harvested weighed and sold by the kg/MT. However, payment by weight is better for all parties and is an essential feature of implementing GAP. If payment by weight is used the farmer will soon see an increased return on their investment in GAP for a given plot size. GAP costs money to implement but the benefits outweigh the costs. In the early days payment will simply be for a weight of roots with no attempt to assess the starch content. However, once farmers start adopting GAP it is a good idea to invest in a Rehmann type displacement scale to make field based measurements of starch content in the roots. Rehmann scales are cheap to buy (import from Thailand, India or China) and easy to use as the operator simply weighs some roots and then puts them in a known volume of water and measures the displacement of water against a scale to make an

Feasibility and Market for Cassava Industrialisation in Uganda: A Strategic Study Confidential – February 2017
43
estimate of the starch content. This is not a precise measure but it works well for determining the level of starch and hence the relative value of the roots. Cassava roots grown under good conditions should contain at least 25% starch but in the right circumstances smallholders in Nigeria have shown that they can achieve 30-32% starch. Increasing starch levels are an indication that investment in GAP is worthwhile and higher starch contents will make the processing factory much more competitive. Once GAP becomes established the factory should start paying premiums on a sliding scale for increased starch content. For example, the base level could be 15% starch, for every 2% extra starch a premium is paid. Under this method a farmer who makes the effort to deliver 2 MT of FCR containing 30% starch will get a much better payment than one delivering 2.5 MT of roots containing 15% starch. This is a win-win situation for all parties and has proved very effective in Asia and Nigeria. However, this approach will not work in the first season as the farmers will not have had time to adopt the GAP system properly and starch yields will be quite low leading to disappointment. Another aspect of the supply chain is the choice of farm size. It is tempting to simply work with large numbers of existing small-scale farmers. However, the 100% smallholder approach has many disadvantages. Small-scale farmers have limited resources (in terms of land area, finance and personnel) and find it difficult to adopt GAP and get the best yields for the factory. They are also most likely to divert roots away from the factory at short notice due to financial pressures and temptations to make a quick sale to a passing trader. It is better to develop a supply chain based around a combination of smallholder farmers, emerging commercial farmers and larger-scale farms. Small-scale farmers typically have 0.1-4ha of land available for planting of cassava and rarely have sufficient access to mechanisation. The emerging commercial farmer refers to a farmer with 10ha or more of land available for production of cassava (preferably in a continuous block). Such farmers either own tractors or have more resources to hire tractors and implements making adoption of GAP easier. Many of these farmers have better educational backgrounds and a much better understanding of business and the importance of long-term relationships with the processing factory. They are much less likely to be tempted into side-selling of roots. Larger-scale farmers with 50ha or more of land for production of cassava have the most potential for successful adoption of GAP with optimal yields of starch and lowest production costs per unit area. In Uganda larger-scale production of cassava is not well developed and none of the farmers is growing cassava as an industrial crop as this is a novel area. It is likely that investors in processing will also have to consider investing in their own larger-scale farms in order to ensure a reliable supply of cassava. The distribution of production between the different farm sizes is a matter of choice but as a rule of thumb the percentage derived from smallholders should not normally go above 30%. The remaining 70% might be divided to source 50% from the factory farm and 20% from emerging commercial farmers but the exact percentages will be determined by the size of the factory farm and availability of suitable commercial out-growers to take on part of the burden of producing the factories supply of cassava roots. As discussed earlier good agricultural practices (GAP) are a key factor for success involving investment in the crop but given much better yields and higher starch contents. The following provides more detail on GAP using examples of experiences of commercial production of cassava roots in Asia and other parts of Africa. Cassava is often highlighted as a food security crop capable of growing on poor soils under drought conditions with little or no inputs or management whilst still providing some form of yield of energy rich carbohydrate. In Africa cassava is most often seen growing in small plots or strips along field margins. Yields are typically poor (6-10 MT/ha) when compared to theoretical yields of 40-60 MT/ha for some varieties. Production is highly inefficient implying high production costs per MT but this is not of importance when the crop is seen as being

Feasibility and Market for Cassava Industrialisation in Uganda: A Strategic Study Confidential – February 2017
44
mainly for household food security. In contrast once cassava becomes a commercial crop grown for sale to industries or for processing into high-value products the game changes and it becomes essential to maximise yields per hectare and minimise costs per MT. To achieve these aims of maximum yield at minimum cost growers need to change their attitude to production and adopt a series of better practices and management strategies generally known as good agricultural practices (GAP). An outline GAP system for cassava might include:
Provision of high quality clean planting material (preferably from a certified source);
Mechanised land preparation to reduce labour and time inputs and allow larger areas to be cultivated;
Optimised planting practices including correct spacing and ridging to encourage root development and ease of harvesting;
Use of mechanical planting machines to reduce labour and time inputs and thus enable larger areas to be planted;
Use of chemical and organic fertilisers to ensure optimal nutrient availability;
Use of organic or plastic mulches to reduce water losses and restrict weed growth;
Use of crop rotations and nitrogen rich green manures/mulches to maintain soil fertility and prevent the build-up of pests and diseases;
Use of pre-emergence and foliar herbicides to limit or prevent weed growth and reduce labour and time inputs for manual weeding;
Use of some manual weeding to supplement chemical methods and avoid over-use of chemical herbicides;
Use of irrigation to supplement rain-fed systems and prevent water stress in the crop;
Use of chemical insecticides to control insect pests and disease vectors such as whiteflies and spider mites;
Use of integrated pest management techniques including, crop scouting, removal and destruction of diseased plants and targeted spraying based on exceedance of pre-determined threshold levels;
Use of mechanical harvesting (ripping and lifting) to reduce time and labour inputs and allow greater areas to be harvested in a short period of time;
Introduction of management practices including a planting plan (often with staggered planting) to increase the harvesting season and optimise starch content.
The introduction of GAP is not an all or nothing scenario, implementation of a full package will give the highest yields but farmers can increase yields and reduce costs with a partial implementation of GAP measures. Implementation of GAP measures can have real benefits in terms of increased yields and reduced production costs on a per MT basis. However, all this comes at a price both in terms of capital investment and higher variable costs per ha of land farmed. Is there any evidence to support adoption of GAP systems for commercial cassava production? Are there any caveats or risks associated with adoption of GAP systems? As a starting point we have a comparison of cassava farms in Thailand and Vietnam reported by Howeler (2006). According to Howeler (2006), Thailand’s cassava farmers faced difficulties with high labour and input costs that coupled with low yields threatened to make cassava uncompetitive as an industrial crop in the mid 1990’s. As a result the larger farms introduced packages of GAP measures and mechanisation to reduce production costs and increase yields per unit area. Labour inputs were halved (see table 5), yields were increased and the cost per MT of cassava reduced to US$17.73/MT. In the same time period most Vietnamese farmers had continued with traditional practices providing a point of contrast with the more advance practices in Thailand (Table 5). Unlike the Thai farmers the Vietnamese continued with manual and ox plough tillage, manual methods of weeding and made very little use of fertilisers or crop protection chemicals. As a result, even though

Feasibility and Market for Cassava Industrialisation in Uganda: A Strategic Study Confidential – February 2017
45
labour in Vietnam was half the price of that in Thailand, yields were much lower (14.5 MT/ha in Vietnam compared to 23.4 MT/ha in Thailand) and costs much higher at US$30.69/MT. Howeler (2006) notes that the Thai farmers had larger areas of land and much better access to affordable finance thus making adoption of GAP easier. Table 5: Comparison of costs and yields/ha for cassava farms in Thailand versus
those in Vietnam during 1999-2000
Item Thailand1 Vietnam
Cost of labour $167 $214
Other direct costs $199 $171
Man days of labour/ha 50 120
Cost of labour $/day $3-$4 $1-$2
Land rents, taxes & depreciation $49 $60
Total production cost/ha $415 $445
Average yield of FCR in MT/ha 23.4 14.5
Production cost US$/MT of FCR $17.73 $30.69
Method of land preparation Tractor Manual / Ox plough
Method of weed control Chemical Manual
Use of fertilisers & manures High Low 1 Note the Thai farmers had greater areas of land (typically 4-5ha of cassava as opposed to 0.6-0.8ha in Vietnam) and better access to finance than those in Vietnam Adapted from Howeler (2006) Not all farms in Thailand invested to the same level in GAP, Table 6 compares traditional and more modern farms in Thailand for the same time period as that covered by Table 5. The more traditional farms made less use of mechanisation and much lower levels of chemical inputs than the more modern farms. The traditional approach resulted in a lower production cost per hectare when compared to the modern farms. According the Howeler (2006) the main costs from adoption of GAP were upfront costs for tractor hire, fuel, and chemical inputs. Although production costs per hectare were ~18% higher when compared to traditional farms, root yields were increased by ~30%. This significantly reduced the production cost/MT of fresh cassava roots (FCR). In addition, the net income per hectare was ~5 times better than for the traditional farm. Table 6: Comparison of costs and yields/ha for traditional and modern farming of
cassava in Thailand in 1999-2000
Item Traditional Farm Modern Farm1
Cost of labour $168 $167
Other direct costs $126 $199
Land rents, taxes & depreciation $48 $49
Total production cost/ha $342 $415
Average yield of FCR in MT/ha 16.5 23.4
Production cost US$/MT of FCR $20.73 $17.73
Price of FCR US$/MT $22 $22
Net income per ha $21 $99.8 1 Modern farms used to spend three times as much on fertiliser & manure and 4 times as much on herbicides and pesticides, and were less labour intensive than the traditional farms (irrigation was NOT used). Adapted from Howeler (2006) The evidence from Thailand indicates that adoption of mechanisation and GAP systems can have significant benefits but with the caveats that such systems are better suited to larger

Feasibility and Market for Cassava Industrialisation in Uganda: A Strategic Study Confidential – February 2017
46
land areas and require greater investment in upfront costs to achieve good returns. This is fine in a strong market (such as that found in Thailand) for cassava roots but is riskier in most African countries where root prices are more volatile and demand for large volumes of cassava cannot be guaranteed. Introduction of mechanisation and GAP systems has had most success in Africa where private sector companies have invested in root procurement systems to supply factories producing cassava starch, high quality cassava flour (HQCF) and industrial alcohol. Raw material supply accounts for between 40 and 65% of production costs for these products thus providing a powerful incentive to reduce the cost of cassava root production and maximise yield of utilisable starch. Table 7: Costs and yields/ha for an emerging commercial farmer in Nigeria supplying
cassava to a large-scale cassava processing factory in 2012-2013
Item Unit cost US$ Total cost US$
Land rental for 15 months $19.35
1st Plough
Tractor hire 25.81 $53.23
Fuel (25 litres) 25.81
Operator 1.61
2nd Plough
Tractor hire 25.81 $53.23
Fuel (25 litres) 25.81
Operator 1.61
Ridging
Tractor hire 25.81 $53.23
Fuel (25 litres) 25.81
Operator 1.61
Planting
Stems (inc delivery & cutting) 96.6 $135.31
Labour for planting 38.71
Chemical weeding (manual application)
Glyphosate (4 litres) 51.61 $129.03
S-metolochlor/atrazine1 (5 litres) 38.71
Labour for spraying (2MD/ha) 38.71
Manual weeding (once only) 64.52 $64.52
Fertiliser
NPK (15:15:15) 6 bags/ha 112.26 $139.35
Transport to field 7.74
Labour for manual application 19.35
Harvesting & delivery to collection point (20 workers)
Labour for harvesting 258.06 $296.77
Bags 38.71
TOTAL COST US$/ha $944.02
Average yield MT FCR/ha 20 MT/ha
Cost US$/MT FCR $47.20 1 Note atrazine is banned in the EU on the basis of toxicity & environmental damage Graffham unpublished data A commercial processor in Nigeria started an outgrower scheme based on production of several high yielding varieties including one known as TMS30572. On the research station TMS30572 gave yields of 35 MT per hectare, but local smallholders with no access to GAP achieved just 12 MT per hectare with this variety. Starch contents were disappointing
Feasibility and Market for Cassava Industrialisation in Uganda: A Strategic Study Confidential – February 2017
47
averaging around 14-15% as compared to 32-35% on the research station. The company created their own demonstration plots using GAP without irrigation and achieved yields of 28 MT/ha and starch contents of 30-32%. Some emerging commercial farmers with access to larger land areas (4-20ha) have adopted many of the GAP practices as seen on the companies’ demonstration plots. Results from these farms indicate starch contents of 25-30% and average yields of 20 MT per hectare. Production costs for one of these Nigerian commercial growers are given in Table 7. As well as having better yields and starch contents, the production cost per MT on the commercial farm is ~27% lower than that seen on neighbouring traditional farms that also supply the process industry. However, the upfront cost per hectare is 34% higher than for traditional production and the grower usually has 5 to 10 times as much land committed to cassava when compared to the traditional growers. There is also clearly room for improvement in implementation of the GAP system as yields were only 20 MT/ha when compared to 28 MT/ha on the companies’ demonstration farms. This is likely to be due partly to lack of experience of GAP by the Nigerian farmers. Another possible reason relates to the companies scheme for subsidised provision of inputs whereby the processing company supplies “trusted” farmers with inputs on credit at bulk prices and deducts the cost of inputs on delivery of the roots. Experience has shown that some farmers will divert some of these inputs to other crops or even for sale to other farmers. Large-scale commercial farming of cassava is a very new concept in sub-Saharan Africa with only a relatively few examples being seen in Nigeria and Malawi. In Nigeria, one of the large-scale processing industries has invested in development of cassava farms of 3,000 to 5,000 ha in Kwara State in North Central Nigeria with imported ex Zimbabwean tobacco farmers to provide management skills. These farms are of interest in showing the scale of investment required to convert bush land into cultivatable land on a large-scale. However, these farms do not implement a full range of GAP. In Malawi, several well established tobacco growers have attempted to diversify into large-scale production of maize, cassava and beans to meet existing and anticipated demand for these crops. The tobacco farms have the advantage of large areas of well developed land for production, good management systems and access to mechanisation and irrigation on the majority of the farms without additional investment. Cassava has also been identified as a suitable crop for inclusion in a typical tobacco crop rotation system. Table 8 provides details of production costs for cassava on one of the tobacco estates in Malawi. This is the only example available where irrigation has been used to supplement rainfall. Typically 40mm was applied every 2 weeks between May and August and 60mm every 2 weeks between September and October using a drip-feed system as this had been found to use 50% less water when compared to flood irrigation. There was no need for irrigation between November and April. Full implementation of GAP gave a very high yield (for sub-Saharan Africa) of 40 MT/ha. Production costs per hectare appear high due to the upfront cost of the GAP system but the high yield results in a very low cost per MT of cassava produced. The farm manager claimed a net return on investment of 17% once loan re-payments had been taken into account. All of this assumes a reliable market for the cassava which has not always been the case in Malawi.
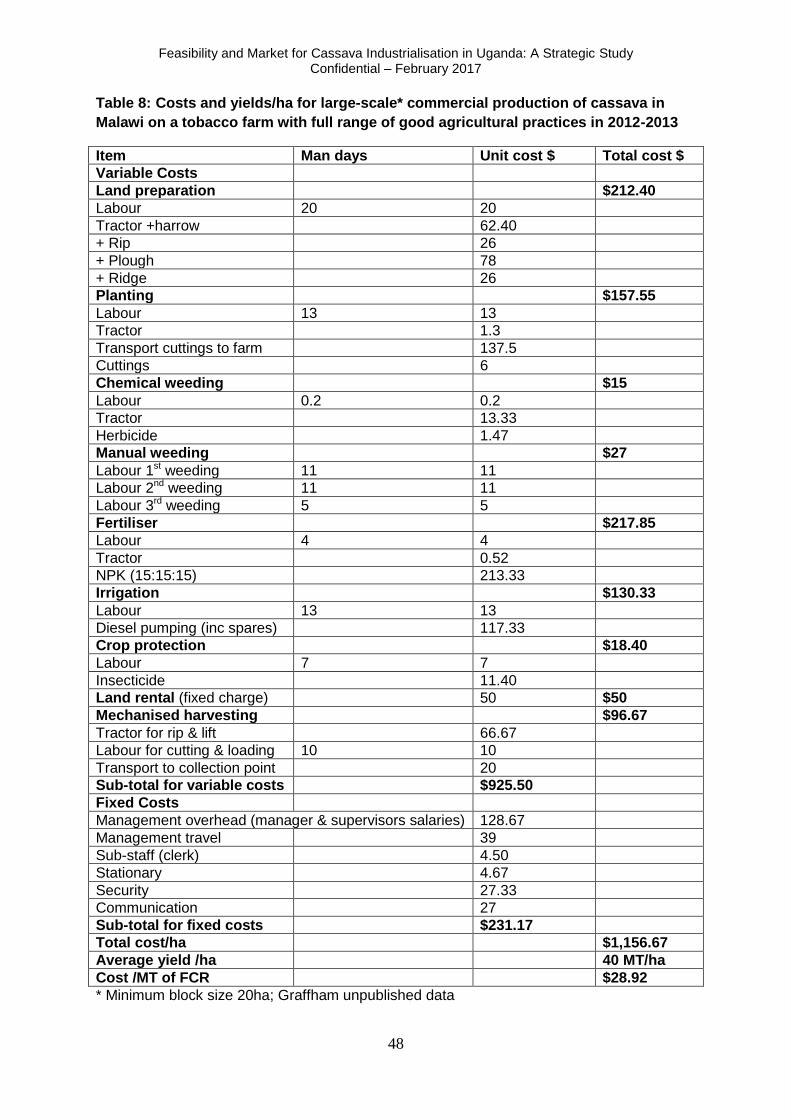
Feasibility and Market for Cassava Industrialisation in Uganda: A Strategic Study Confidential – February 2017
48
Table 8: Costs and yields/ha for large-scale* commercial production of cassava in
Malawi on a tobacco farm with full range of good agricultural practices in 2012-2013
Item Man days Unit cost $ Total cost $
Variable Costs
Land preparation $212.40
Labour 20 20
Tractor +harrow 62.40
+ Rip 26
+ Plough 78
+ Ridge 26
Planting $157.55
Labour 13 13
Tractor 1.3
Transport cuttings to farm 137.5
Cuttings 6
Chemical weeding $15
Labour 0.2 0.2
Tractor 13.33
Herbicide 1.47
Manual weeding $27
Labour 1st weeding 11 11
Labour 2nd weeding 11 11
Labour 3rd weeding 5 5
Fertiliser $217.85
Labour 4 4
Tractor 0.52
NPK (15:15:15) 213.33
Irrigation $130.33
Labour 13 13
Diesel pumping (inc spares) 117.33
Crop protection $18.40
Labour 7 7
Insecticide 11.40
Land rental (fixed charge) 50 $50
Mechanised harvesting $96.67
Tractor for rip & lift 66.67
Labour for cutting & loading 10 10
Transport to collection point 20
Sub-total for variable costs $925.50
Fixed Costs
Management overhead (manager & supervisors salaries) 128.67
Management travel 39
Sub-staff (clerk) 4.50
Stationary 4.67
Security 27.33
Communication 27
Sub-total for fixed costs $231.17
Total cost/ha $1,156.67
Average yield /ha 40 MT/ha
Cost /MT of FCR $28.92
* Minimum block size 20ha; Graffham unpublished data

Feasibility and Market for Cassava Industrialisation in Uganda: A Strategic Study Confidential – February 2017
49
The Malawian example shows what can be achieved but also illustrates the high upfront costs of GAP and is the only example where the farm manager provided data on management costs (typical for tobacco estates which have good record and financial systems in place). Implementation of a full GAP system was only possible due to existence of a full set of supporting infrastructure and management team on the tobacco estates. For those starting from scratch major capital investment is usually required to convert bush lands into fields suitable for intensive production via hired bulldozers and grading machines. For production tractors with basic ploughs, fertiliser spreaders and boom sprayer units are required (for large-scale operations, smaller farms can rely on knapsack sprayers). For cassava a mechanised planting attachment is required for larger areas. For harvesting a ripper and lifter is needed. Mechanical harvesters from Brazil and China provide the necessary lifting mechanism but a separate ripper is normally required to break the ground especially during the dry season. A secure compound is required with lockable containers (20-40’ long) for safe storage of tractors, machinery, tools, spares and fuel. As mentioned earlier it is not essential to implement all of the GAP system in order to get improvements in yield. Experience from Nigeria suggests that the capital investment required for an irrigation system (including borehole) may not provide a good return on investment for cassava under current conditions and hence irrigation is not seen on most commercial cassava farms in Africa. Some farms do not use insecticides as they say that chemical control does not provide a good return on investment. However, good management is always essential with regular crop scouting (every 2 weeks) and removal and destruction of diseased plants. Herbicides and fertilisers are important for any improvement in yield and mechanisation is essential for larger land areas to reduce the labour and time inputs. Mechanisation also makes good practices such as ridging feasible on plots of >0.5ha. Management and production experience are also an important factor, in the Nigerian example the production manager is an Indian national with 35 years’ experience of commercial production of cassava using GAP systems it therefore perhaps unsurprising that he can achieve yields of 28-35 MT per hectare even with irrigation. In contrast the large-scale farms are managed by former Zimbabwean tobacco farmers who have had to learn a new crop and adapt to unfamiliar climatic conditions. The Nigerian emerging commercial farmers are familiar with the climate but have no prior knowledge of commercial farming of cassava. Data provided by the processing company indicates that it can take several seasons for yields and starch contents for roots from newly established farms to increase to a desirable level. Implementation of full GAP systems is best suited to large-scale producers with good resources and secure access to land. As farm size decreases, full implementation becomes increasingly difficult as the farmers have more limited technical and managerial resources and less access to affordable finance upfront expenditure for fixed and variable costs. Ariyo and Mortimore (2011) studied the development of large-scale commercial farms in Kwara District in Nigeria and observed that the security of land tenure was essential for infrastructural investment. The former Zimbabwean tobacco farmers were given 25 year leases on large tracts of land with options for renewal at no extra cost at the end of the lease. In contrast smallholders and many of the smaller emerging commercial farmers could only guarantee access to land for periods of 1-2 years and hence were reluctant to invest in upgrading of the land. Some farmers were of the opinion that if they improved the land it would be taken away from them and given to more favoured individuals linked to community chiefs.
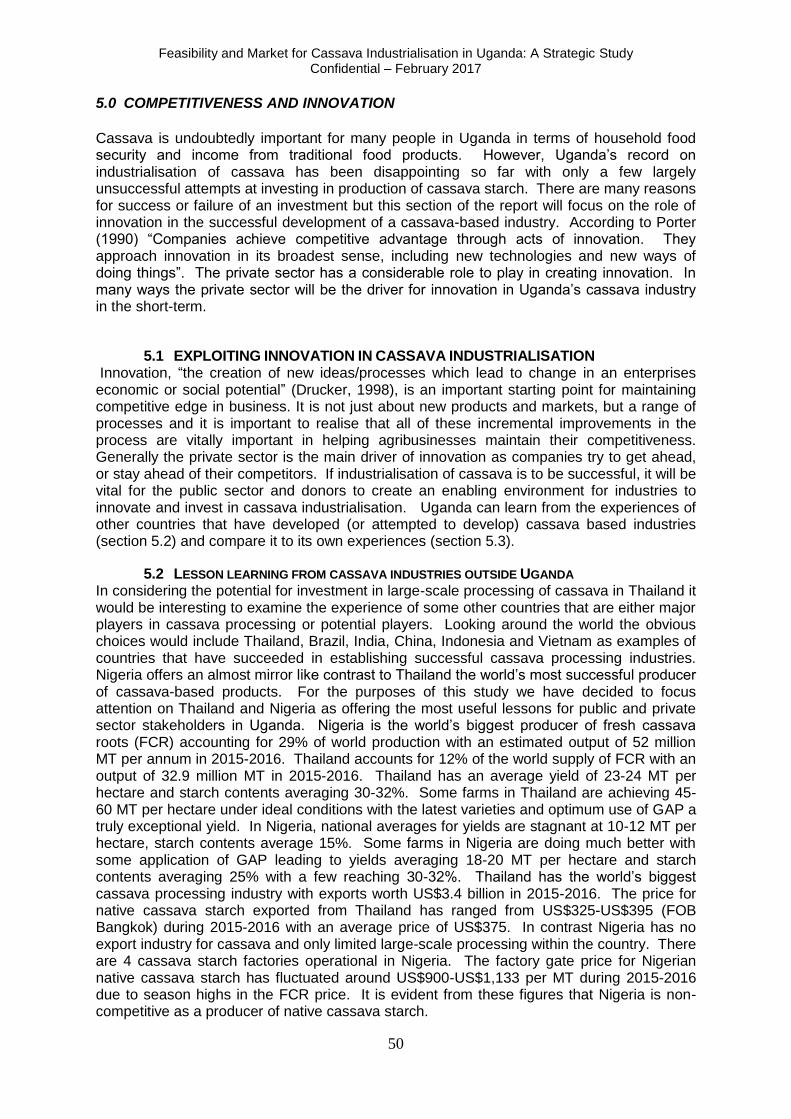
Feasibility and Market for Cassava Industrialisation in Uganda: A Strategic Study Confidential – February 2017
50
5.0 COMPETITIVENESS AND INNOVATION
Cassava is undoubtedly important for many people in Uganda in terms of household food security and income from traditional food products. However, Uganda’s record on industrialisation of cassava has been disappointing so far with only a few largely unsuccessful attempts at investing in production of cassava starch. There are many reasons for success or failure of an investment but this section of the report will focus on the role of innovation in the successful development of a cassava-based industry. According to Porter (1990) “Companies achieve competitive advantage through acts of innovation. They approach innovation in its broadest sense, including new technologies and new ways of doing things”. The private sector has a considerable role to play in creating innovation. In many ways the private sector will be the driver for innovation in Uganda’s cassava industry in the short-term.
5.1 EXPLOITING INNOVATION IN CASSAVA INDUSTRIALISATION Innovation, “the creation of new ideas/processes which lead to change in an enterprises economic or social potential” (Drucker, 1998), is an important starting point for maintaining competitive edge in business. It is not just about new products and markets, but a range of processes and it is important to realise that all of these incremental improvements in the process are vitally important in helping agribusinesses maintain their competitiveness. Generally the private sector is the main driver of innovation as companies try to get ahead, or stay ahead of their competitors. If industrialisation of cassava is to be successful, it will be vital for the public sector and donors to create an enabling environment for industries to innovate and invest in cassava industrialisation. Uganda can learn from the experiences of other countries that have developed (or attempted to develop) cassava based industries (section 5.2) and compare it to its own experiences (section 5.3).
5.2 LESSON LEARNING FROM CASSAVA INDUSTRIES OUTSIDE UGANDA In considering the potential for investment in large-scale processing of cassava in Thailand it would be interesting to examine the experience of some other countries that are either major players in cassava processing or potential players. Looking around the world the obvious choices would include Thailand, Brazil, India, China, Indonesia and Vietnam as examples of countries that have succeeded in establishing successful cassava processing industries. Nigeria offers an almost mirror like contrast to Thailand the world’s most successful producer of cassava-based products. For the purposes of this study we have decided to focus attention on Thailand and Nigeria as offering the most useful lessons for public and private sector stakeholders in Uganda. Nigeria is the world’s biggest producer of fresh cassava roots (FCR) accounting for 29% of world production with an estimated output of 52 million MT per annum in 2015-2016. Thailand accounts for 12% of the world supply of FCR with an output of 32.9 million MT in 2015-2016. Thailand has an average yield of 23-24 MT per hectare and starch contents averaging 30-32%. Some farms in Thailand are achieving 45-60 MT per hectare under ideal conditions with the latest varieties and optimum use of GAP a truly exceptional yield. In Nigeria, national averages for yields are stagnant at 10-12 MT per hectare, starch contents average 15%. Some farms in Nigeria are doing much better with some application of GAP leading to yields averaging 18-20 MT per hectare and starch contents averaging 25% with a few reaching 30-32%. Thailand has the world’s biggest cassava processing industry with exports worth US$3.4 billion in 2015-2016. The price for native cassava starch exported from Thailand has ranged from US$325-US$395 (FOB Bangkok) during 2015-2016 with an average price of US$375. In contrast Nigeria has no export industry for cassava and only limited large-scale processing within the country. There are 4 cassava starch factories operational in Nigeria. The factory gate price for Nigerian native cassava starch has fluctuated around US$900-US$1,133 per MT during 2015-2016 due to season highs in the FCR price. It is evident from these figures that Nigeria is non-competitive as a producer of native cassava starch.
Feasibility and Market for Cassava Industrialisation in Uganda: A Strategic Study Confidential – February 2017
51
Thailand Thailand’s cassava industry started around 1959 initially with large numbers of low technology processors of dried cassava chips for domestic and export sales to animal feed markets. Over a 40 year period the Government and private sector invested in the development of the industry with investments in transport infrastructure, breeding of improved varieties for industrial use and processing technologies. The livestock feed market gradually developed from simple chips to soft pellets and then to hard pellets mainly for export to the EU. The EU offered a lucrative market for the export of chips and pellets that peaked in 1992 with exports of ~6.5 million MT to the EU. However, in 1992 reforms to the EU common agricultural policy started to undermine the EU market and by 2005 this export opportunity had virtually disappeared. This could have been disastrous but the Thai industry had invested in innovative technologies to diversify production into other products including native and modified starches, sugar syrups and industrial alcohol. Even waste pulp of the starch industries was targeted as a value added product with export potential. The focus of primary production has been to increase yields and starch content whilst decreasing the unit cost of raw material. In processing Thailand has moved towards a smaller number (~200 units) of much larger processing industries with outputs ranging from 500-2000 MT of product per day. The technology for processing has been optimised to improve energy efficiency, reduce waste and convert liquid and solid wastes into value added materials such as biogas and animal feed. The Thai industry has shown ability to innovate rapidly to take account of changing market trends. Back in 2008 hard pellets were still an important product with exports of 1.5 million MT per annum, dried chip exports were decreasing and had fallen to just 1.2 million MT. However, in 2009 the world started to demand cassava chips as a feedstock for production of biofuel. Thailand responded and by 2015 exports of cassava chips had risen to 7.2 million MT, in contrast export of hard pellets had fallen to just 39,000 MT. Cassava chips is not the only success story for Thailand. In the area of native and modified cassava starches exports have increased from 1.5 million MT and 736,000 MT respectively in 2007 to 2.9 million MT and 905,000 MT respectively in 2015. The success of the Thai cassava processing industry has been associated with a long-term approach to cooperation between Government and industry with the Government working to create the right environment to ensure the competitiveness of Thai cassava products. The Government of Thailand has a long-term strategy known as the “Cassava Roadmap”. The roadmap consists of implementing four major strategies for development. Governments wishing to invest in the cassava sector can learn from this lesson and put in place a long term strategy and plan for cassava industrialization in the country. The first strategy under the roadmap recognises that Thailand only has a limited area of land for production of cassava (~1.5 million ha) and thus focuses on improving productivity from the available land. The current average yield is 23 MT per hectare but a target has been set of 31 MT per hectare by 2020. This increase in yield is being driven by a combination of GAP, dissemination of clean planting material, maintenance of soil fertility, promotion of intercropping, crop rotation, weed control and improvements to harvesting practices. It is interesting to note that in the last years yields have increased by 50%, production costs have risen but improved yields have increased farm incomes by 300%. The second strategy is concerned with value addition as has focussed on improving management of the industrial ethanol supply chains. Contract farming is being actively encouraged, a price guarantee scheme has been implemented to stabilise the FCR price. The government has sought to clarify its policy on biofuel to encourage investment and is supporting SME chip producers to produce high quality chips (clean chip technology). The third strategy focusses on supporting market expansion through innovation and research and development. The keys for Thailand are to increase volumes improve quality

Feasibility and Market for Cassava Industrialisation in Uganda: A Strategic Study Confidential – February 2017
52
and product range whilst remaining competitive against rival products. Thailand already controls 83% of the world market for cassava-based products. The government and industry have set a target of >85% by 2020. The final strategy under the roadmap is for the government and private sector to share support for research and development in the nations’ universities and also to ensure a supply of skilled personnel to feed into the industry. Research deals with both primary production, processing and end-user applications such as the development of cassava-based biodegradable plastics. The cassava roadmap is not the only initiative of the government in Thailand. The Ministry of Commerce and Ministry of Foreign Affairs are working with the national association of the cassava processing industry to ensure collection and public dissemination of detailed and accurate data and analysis on the industry. This strategic information system (www.thaitapiocastarch.org ) is essential for guiding investment decisions and helps all stakeholders to have a clear picture of the industry and makes it easier to see where innovation is needed to remain competitive. Other interesting features of the system include the provision of soft loans for cassava production via the Bank of Agriculture and Agricultural Cooperatives. According to researchers at KU University >50% of Thai cassava farmers (mostly smallholders) access these loans on an annual basis to support purchase of farm inputs for cassava. In 2010-2011 serious floods caused major devastation in the cassava growing areas of Thailand. The government responded with a farmer income guarantee scheme as an insurance against the adverse impacts of disease and bad weather. A sum of US$79 million was allocated for the scheme in its first year of operation. Following the floods, 391,000 farms registered for the scheme and made claims for flood damage. The average payment was US$206 per farmer. This may be only a token payment in real terms but it did a lot to maintain the farmers confidence and the production system recovered rapidly over the following 2 years. Nigeria Nigeria is an industrialised country with the highest population in Africa and is also the largest producer of cassava in the world. An obvious move for Nigeria was to develop a cassava processing industry to eliminate reliance on imported starches, sugar syrups and ethanol and then to develop a competitive export industry for cassava products. This was indeed the ambition of the Government of Nigeria after independence in 1960. By 1964 an ambitious plan had been developed that resulted in 15 native cassava starch factories with a capacity of ~100 MT of starch per day for each factory. More than 50 years on only one of these factories is still operating and only at ~10% of installed capacity. Numerous failed investments have been constructed over the years but in 2016 Nigeria had 4 operational starch factories with a combined capacity of less than 100 MT per day. There is also one cassava ethanol factory (output 33m3/day) and one HQCF factory with a capacity of 90 MT per day but only operating at ~45%of capacity. With the exception of the ethanol factory Nigeria’s cassava processing industries are inefficient and completely non-competitive. Cassava starch costs between US$900 and US$1,133 per MT depending on fluctuations in the FCR price. Import of cassava starch is prohibited but maize starch remains competitive at US$800/MT even with high import duties and taxes. Nigeria had a sugar syrup factory but production costs were close to US$1,300 per MT making the factory uncompetitive against imported Chinese sugar syrups at US$900/MT. Successive governments have invested in pro-cassava policies with no success and the current government announced in September 2016 that it would support development of a cassava industry to generate US$5 billion per annum in profits by 2020 and employ almost 10% of Nigeria’s population. Whilst this is an

Feasibility and Market for Cassava Industrialisation in Uganda: A Strategic Study Confidential – February 2017
53
admirable aspiration the track record of previous initiatives indicates almost certain failure. Is it possible to identify any reasons for this poor state of affairs? Nigeria’s industries face numerous challenges. There is a total absence of reliable national grid electricity forcing any factory to rely on expensive diesel powered generators. Road infrastructure is poor making transportation a costly undertaking. Production of FCR is done in an absence of any form of GAP, yields are relatively low and production costs high due to the lack of mechanisation and poor yield per unit area. Cassava is a major food crop in much of Nigeria and this impacts on pricing with roots prices being subject to unexpected periods of high prices that make industrial processing uneconomic. The governments biggest success story has been the development of improved varieties and this has helped to improve productivity to some extent. There have also been several major cassava initiatives such as the Presidential Initiative for Cassava (2002-2007) and Cassava Transformation for Agriculture Programme (2011-2015). These initiatives have sought to achieve the same impact as seen in Thailand
5.3 LESSON LEARNING FROM PREVIOUS UGANDAN INVESTMENTS IN INDUSTRIAL
PROCESSING OF CASSAVA The Lira Starch Factory was established in 1968 with the aim of manufacturing commercial starch from cassava. Until the 1980s the factory purchased fresh cassava roots from farmers in eastern and northern Uganda and sold starch and by-products both on the domestic and international markets.2 Unfortunately, the factory was badly damaged during the civil strife of the 1980s and has never been rehabilitated. A group of local investors in Lira, registered under the company name Sunset International, bought the Lira Starch Factory in 1996 under the GoU privatization scheme (Uganda Radio Network, 2006)3. The company undertook four feasibility studies between 1989 and 2007. The results consistently showed that the project was unviable. The main reasons being the high price of raw material, the small starch market in Uganda, competition from cheap imported starch from India and Thailand. Landed starch was $809 while projected starch cost was $1,200 per MT. At the start of the new millennium the company was unable to start work because of the insecurity in Northern Uganda. A study by the Commonwealth & COMESA in 2001 recommended a smaller factory to produce cassava flour. A visit has been paid in October 2016 to a starch factory in Mbale, however it has been learnt that the factory is currently defunct. It is understood that amongst other reasons the factory did not invest in developing a raw material supply chain and was therefore unable to acquire sufficient amounts of raw material (i.e. fresh cassava roots) from farmers. More interaction with the factory owners and managers will be sought. WindWood Millers Ltd and Adyaka Wholesalers Ltd have each established a flash dryer in 2016 (3 MT capacity of output per day each) in Lira and Apac districts respectively, and have started to produce cassava on their own farm, plus are planning to buy fresh cassava roots from smallholder farmers for processing into HQCF. Teething problems with the flash dryer factory are being ironed out in late 2016.
5.4 CREATING & SUPPORTING A COMPETITIVE ADVANTAGE The prime way to create a competitive company out of a comparative advantage is through the way the business is managed, in other words through the employees of the company.
2 Otim-Nape et al; Cassava Development in Uganda. 3 http://ugandaradionetwork.com/story/lira-starch-company-to-manufacture-iv-fluids (article published on 23/12/2006; accessed 29/11/2016).

Feasibility and Market for Cassava Industrialisation in Uganda: A Strategic Study Confidential – February 2017
54
The public sector and donors can also facilitate or accelerate the development of competitive advantage The following factors should be considered in creating this advantage: Management Management is vital for creating and maintaining competitive advantage. Good management involves efficient exploitation of comparative advantage. It is also management that conveys the culture for a continual improvement in quality, yields and standard of service to customers. It is also management that is continually looking for ways to reduce costs, develop new products and improvements to business processes. Nigeria’s few successes in cassava-based industries have all made use of imported foreign management to ensure that they have the technical skills for effective management of raw material supply chains, efficient processing and aggressive marketing of their products. Developing an understanding of the performance of the competition (often international) and benchmarking of the companies’ own performance are essential to enable management to identify strengths and weaknesses and establish targets for improvement. Professionalism Running a professional business is really a variant on good management. High-value and export markets are highly attractive for cassava-based businesses but to become and remain competitive costs must be carefully managed, all activities must be optimised and waste kept to a minimum. In other words, it is important to have accurate and timely management information systems. It is also necessary to have well qualified and trained staff to deal with all aspects of running a successful business. In cassava processing two of the biggest costs are purchase of raw material and provision of energy and power for artificial drying. It is not enough just to grow enough cassava for the factories needs. Primary production must be optimised to maximise yield of starch at the minimum unit cost per hectare. This will involve higher capital and operating costs and good management but the reward is much lower raw material costs overall. In processing it is essential to understand your process and invest in technologies to optimise efficiency. For example, in large-scale HQCF production investing in a centri-peeler as opposed to a membrane filter press will improve the efficiency of mechanical dewatering and thus reduce fuel costs for artificial drying. Creating an enabling environment Government can help establish industries through subsidised finance, fiscal incentives, provision of good infrastructure (especially roads and reliable electrical power) as well as providing straightforward and efficient mechanisms for investment promotion. This does not actually ensure that a company will be competitive but it does make it easier for them to become established. Capacity building Having a well-educated management and trained staff is vitally important for establishment and operation of a cassava-based industry. Elsewhere successful companies have invested in more highly qualified staff for lower level supervision of primary production and processing operations. Incentives are provided to help retain and improve the capacity of useful personnel. In contrast the majority of smaller operations and some larger factories have attempted to cut costs by hiring inexperienced staff and paying poor salaries with no incentive to remain in the company. These companies suffer from high staff turnover and this in turn leads to costly mistakes in operation of expensive processing equipment.

Feasibility and Market for Cassava Industrialisation in Uganda: A Strategic Study Confidential – February 2017
55
6.0 BUSINESS AND FINANCE
6.1 FISCAL ASPECTS The Government of Uganda has a range of tools at its disposition to encourage investment in the cassava industry (production, processing, and marketing). These incentives are outlined in documents available at the Uganda Investment Authority and other Government institutions. For example, the documents “Inventory of tax Incentives”, “Tax Incentives for Agriculture Sector”, and “A Guide on Tax Incentives/Exemptions available to Investors in Uganda” outline the various incentives available to stimulate investments in the agricultural and other sectors. Given the length of the documents it will not be possible to provide a detailed account of all incentives but only to provide a selection of key point so to consider. Amongst other things, the document “Tax Incentives for Agriculture Sector” states that:
For the import of plant and machinery the import duty is NIL by tariff; the value added tax (VAT) is deferred and withholding tax (WHT) is 6% as long as the cost of plant and machinery is above US$ 22,500. Potential investors are required to apply in writing to the Commissioner Trade Customs for the facility and must register for VAT.
As far as agro-processing is concerned, the same document states that the applicant or associate of applicant has not previously carried out agro-processing of a similar or related agricultural product in Uganda and the applicant must invest in plant and machinery not previously used in Uganda by any person to process agricultural products for final consumption.
The preferential treatment of imported goods from the COMESA Region and the East African Community (EAC) stipulates import duty rates of 0%, 4% and 6% for capital goods and raw materials; semi-finished goods and finished goods, respectively.4
There are VAT exemptions regarding the supply of machinery, tools and implements suitable for use only in agriculture meaning, amongst other things, knapsack sprayers, ox ploughs, agricultural tractors (including walking tractors); (v) disk harrows; (vi) cultivators; (vii) ploughs; etc. Also there are VAT exemptions for the supply of unimproved land and the supply of unprocessed foodstuffs, unprocessed agricultural products except wheat grain and livestock.
The “Guide on Tax Incentives/Exemptions available to investors in Uganda” states that agro-processors have to apply to the Commissioner for a certificate of exemption, and that the
Applicant or associate of the applicant has not previously carried out agro-processing of a similar or related agricultural product in Uganda, and
Applicant must invest in plant and machinery that has not previously been used in Uganda by any person to process agricultural products for final consumption.
Process agricultural products grown and produced in Uganda.
Person regularly files return and fulfils all his tax obligations under the income act.
Certificate of exemption issued is valid for one year and may be renewed.
4 Otherwise, duty tariffs for goods imported from outside these free trade areas are: 25% for
finished goods, 10% for intermediary goods, and 0% for raw material, respectively.
Feasibility and Market for Cassava Industrialisation in Uganda: A Strategic Study Confidential – February 2017
56
These documents, as well as “Tax Legislation Uganda – An up-to-date reproduction of the Income Tax Act, and the Value Added Tax Act” (459 pages) are available on the website of the Uganda Investment Authority (UIA). The latter has several functions in facilitating investments in Uganda, such as:
One-Stop-Centre to have offices of institutions, which are important for investors, in one place, namely:
o Uganda Investment Authority (Provision of business and investment information);
o Uganda Registration Services Bureau (URSB) – company incorporation/ registration;
o Uganda Revenue Authority (URA) – tax registration (TIN, Income tax, VAT etc.);
o Immigration Department – work permits, special passes etc; o NEMA – Environmental Impact Assessment (EIA) studies; o Ministry of Lands, Housing and Urban Development – land registration &
titling.
Provision of land at subsidised rates in agro-industrial parks. UIA currently has 9 industrial parks under development, and a further 16 industrial parts are planned, in addition to 4 proposed regional science and technology parks.
Facilitation of links with potential investors, buyers of end-products, trade associations, government authorities and other stakeholders in a value chain.
6.2 SOURCES OF FINANCE According to its website (www.udc.go.ug)5, Uganda Development Corporation (UDC) is the development and investment arm of the Government of Uganda, with the mandate to promote and facilitate the industrial and economic development of Uganda. The objective of UDC is to promote and facilitate the economic and industrial development of Uganda. In order to achieve its objective, it is mandated to establish subsidiary and associated companies; enter into public and private partnerships with any commercial, industrial or agricultural undertaking or enterprise; through public private partnerships (PPPs), assist in the financing and management of undertakings promoting industrial and economic development; promote and facilitate research into industrial or economic development of Uganda among others. The functions of UDC are to facilitate Government investment in strategic sectors of the economy for the purposes of industrial and economic development through PPPs or joint ventures or other arrangements with any domestic or foreign entity, to take over, manage, promote and facilitate entities in which the Government of Uganda has interest; advise the Minister of Trade and Industry on the industrial and economic development of Uganda; promote, finance, or guarantee the financing of any undertaking in Uganda or outside Uganda among others as mandated by law. As for the nature of investment, UDC aims to invest in sectors of the Ugandan economy that are perceived to be high risk or are deemed not to be attractive for the private sector (local and foreign) especially when it relates to large infrastructure and industrialisation projects
5 Also, see: http://www.mtic.go.ug/index.php?/The-Project/uganda-development-cooperation/

Feasibility and Market for Cassava Industrialisation in Uganda: A Strategic Study Confidential – February 2017
57
either due to high initial capital requirements, resource constraints, or low returns in the immediate future and yet provide a strategic bridge that would foster private sector developments due to minimized risk. The investments by UDC are not restricted to any particular sector of the economy or geographical region of the country or asset class. In the performance of its functions, the UDC consistently follows the Government policy on industrial and economic development. The Uganda Development Corporation Bill 2014 establishes the Uganda Development Corporation as a body corporate with perpetual succession and a common seal; to promote and facilitate the industrial and economic development of Uganda; and for related matters. UDC is governed in its operations by a series of corporate values and beliefs. In ensuring that it’s run as a self-sustaining and profitable corporate entity, and for every venture and undertaking that UDC is involved in, UDC ensures the following:
Compliance with prevailing laws in Uganda and all international conventions to which GOU is a signatory;
Transparency in the implementation of its operations in order to be fully accountable to the public and the GOU;
Deliberate policy of corporate social responsibility;
Integrity and ethical conduct in the decisions and actions of employees, management, shareholders and clients; and
Provision of the best possible environment for employee retention, employee skills development and employee loyalty.
Uganda Development Bank Limited (UDBL) is a public enterprise wholly owned by the Government of Uganda and carrying out business as a Development Finance Institution (DFI). The bank, a successor company to Uganda Development Bank, was incorporated as a limited liability company under the Public Enterprises Reform and Divestiture Act, Cap.98, Laws of Uganda, and it is mandated to finance enterprises in key growth sectors of the economy. The Bank has been in existence since 1972. UDBL re-positioned itself as a key partner to the Government of Uganda in delivering its National Development Plan (NDP). In order to deliver this aspiration, the Bank focuses on the key growth sectors of the economy by financing development projects at attractive terms (e.g. at interest rates that are well below commercial market rates). UDBL supports Small & Medium Enterprises (SMEs including farmer groups or SACCOs with track record and which fulfil all legal requirements) and large scale development projects in the various key growth sectors notably:
Infrastructure development Industrialization Primary agriculture, fisheries and livestock and, agro-processing Natural resources extraction Hospitality and Tourism Real estate development Information technology and telecommunication Social services like Education including vocational and tertiary education and, health. Trade and Commerce Sectors.
The core values of UDBL are commitment, excellence, and integrity. Whilst there appear to be some overlaps in the functions of UDC and UDBL, both are financial institutions that are willing to either provide credit for an enterprise or enter into a joint venture/equity capital type agreement. UDBL tends to provide credit for smaller projects (at 12% interest per annum; 2-year grace period; pay-back of loan and interest within 10
Feasibility and Market for Cassava Industrialisation in Uganda: A Strategic Study Confidential – February 2017
58
years), whilst they are prepared to enter into equity capital arrangements when projects are larger (i.e. worth several million US$). Both UDC and UDBL require the following for a successful cooperation:
Detailed proposal, which is fully costed and which includes a risk analysis. Appendix 2 provides an example of what UDBL require from applicants in detail.
Type of financial venture (e.g. loan or equity capital) will have to be negotiated;
Exit strategy in case of joint equity capital arrangement will have to be negotiated;
Enterprises have to be commercially viable, no matter their size;
As for raw material requirements for a agro-processing company to be set up, both organisations appear to be open to supply of raw material from outgrowers and nucleus estate;
Once investors are clear about their plans, they can approach one or both of these financial institutions with a letter addressed to their executive director, stating their intentions.
In addition to UDBL and UDC, there are other financial institutions such as commercial banks or development partner organisations that can provide financial contributions to a project in one way or another. For example, some organisations have challenge fund rounds which qualify for investments in agro-processing. Also, there are cases where financial engagements in projects (e.g. by banks or investment funds) are accompanied by development projects (e.g. providing extension services related to farmer group organisation, good agricultural practices, or technical aspects of agro-processing). Other sources of finance. According to sources from China, the following other options exist regarding financing of such a project:
a. If the project owner in Uganda can establish an appropriate guarantee, then 80% of loan can be financed from China Eximbank or another commercial bank;
b. Discussions with “Standard Bank of South Africa” suggested to use “Project financing” to obtain a loan representing 70% of the project investment value;
c. There is the possibility of “China-Africa Development Fund” to directly invest up to a maximum of 51% of the project value;
d. The African Development Bank has expressed interest in the project but was not able to provide information on loan terms and conditions;
e. There is the possibility of investment by Chinese private enterprises under the support of the China “One Belt One Road” policy, but until now no positive answer was obtained. Nonetheless, it is felt that perhaps a solution can be found through this direction.

Feasibility and Market for Cassava Industrialisation in Uganda: A Strategic Study Confidential – February 2017
59
7.0 POLICY AND INSTITUTIONS
7.1 ROLE OF GOVERNMENT IN SUPPORTING CASSAVA INDUSTRIALISATION Cassava production and processing is high on the agenda of the Government of Uganda, in that cassava has been selected as a priority crop for the development of the agricultural sector. This is reflected in Government documents, as well as projects undertaken by the Government of Uganda in collaboration with development partners (e.g. World Bank). For example, cassava production has been prioritised not least through the multiplication of improved planting material. Amongst other things, the latter is expected to assist farmers to overcome the negative impact of plant diseases such as cassava brown streak disease (CBSD).
7.2 CREATING AN ENABLING ENVIRONMENT A presentation by the Uganda Investment Authority (UIA) points out constraints to investment which can be turned into opportunities, namely:
Access to Finance (Establishment of commercial banks & long term lending institutions)
Administrative Barriers
Power (Generation & distribution of power, Hydro, Solar, Bio, Wind e.t.c)
Infrastructure (new roads & maintenance). Whilst a lot of progress has been made in terms of road construction and maintenance, as well as availability of vehicles, there are still bottle-necks in particular in more remote parts of the country where roads become impassable during parts of the rainy season. Likewise, electricity and water supplies have improved, but further work is required in parts of the country where these amenities are less reliable or still absent. The alternatives such as generator supplied electricity are substantially more expensive than electricity from the grid.
7.3 STIMULATING INVESTMENTS IN CASSAVA INDUSTRIALISATION Several Nigerian Governments have attempted to promote industrialisation of cassava as a way to reduce reliance on imported foodstuffs such as wheat and to create employment and income generating opportunities for the nation. The use of high quality cassava flour (HQCF) for a proportion of wheat flour in bread is seen as an attractive entry point for pro-cassava policies. However, technical issues ensure only very weak demand in this sub-sector. As an alternative to a market driven approach, these regimes have experimented with using regulation to create demand as outlined briefly below:
1. As part of the Presidential Initiative on Cassava (PIC) (2002-2007) the Federal Government of Nigeria formulated a policy for 10% inclusion of HQCF in flour intended for baking. For 2.5 years, attempts were made to enforce this policy as a mandatory requirement. Government officials carried out on the spot inspections of the premises of the major wheat millers who were supposed to be blending HQCF into the wheat flour at their mills. The millers were however not able to fully comply
because of limited availability of HQCF; unreliable HQCF quality; and low consumer acceptability of the bread made from wheat flour blended with HQCF.
2. Another Nigerian government introduced a flagship policy in 2011 for 20%
inclusion of HQCF in bread flour as part of the Cassava Transformation for Agriculture Programme (CTAP). CTAP was an attempt to achieve Nigeria’s ambition to use industrialisation of cassava as a means of generating employment, improving rural
Feasibility and Market for Cassava Industrialisation in Uganda: A Strategic Study Confidential – February 2017
60
livelihoods, import substation and ultimately foreign exchange earnings through export of cassava products. Partial substitution (20-40%) of imported wheat flour with high quality cassava flour (HQCF) was seen as the flagship and cornersMTe for success of CTAP. The millers were reluctant to comply with this policy citing the bad experience from the previous 10% inclusion policy. The Federal Government was unwilling to formalise the policy into law due to unreliable supply of HQCF. However, the government attempted to encourage uptake with the following incentives:
Duty on imported wheat was increased from 5% to 20% to reduce imports. Some of the revenue generated was used to create a fund to support investment in HQCF (see section 6.4);
Taxation on flour milling was reduced by 12% for mills that were able to demonstrate 20% inclusion of HQCF in their flour;
Duty and taxes on imported bread improvers was removed to make production of 20% HQCF bread technically feasible and more affordable;
A US$21.25 million fund was established to provide combinations of soft-loans and grants for HQCF producers and bakeries to purchase essential equipment.
The cassava bread fund was reasonably successful with 60 HQCF factories and 60 bakeries taking up the offer of subsidised equipment. In addition training and technical support was provided to bakeries by CTAP and the C:AVA project. Two millers released blended flours containing 10% HQCF and 90% wheat flour however this programme ended abruptly with the change of Government in 2015.
3. In September 2016, a national cassava summit was held in Abuja to discuss a road-map for the new Government to support creation of a US$5 billion industry by 2021. The Minister for Agriculture and Rural Development (MARD) outlined a policy for 15% inclusion of cassava in bread flour which he believes could save Nigeria US$5 million per day on wheat imports.
The lessons from the Nigerian experience suggest that government can stimulate investment in the sector by creating enabling environment and incentive mechanisms for the private sector to engage in the cassava value chain. The driver of this could be the cassava innovation fund among other initiatives.
CREATION OF A CASSAVA INVESTMENT FUND BY GOVERNMENT
Under the CTAP, the Nigerian government experienced challenges with the uptake of HQCF by wheat millers and bakers. Of the many reasons for this the government decided to focus on complaints from HQCF makers that they lacked the equipment to produce HQCF competitively, and from master bakers that they lacked the necessary equipment to be able to produce acceptable loaves containing 20% HQCF and bakery improvers. Both bakers and processers suggested that they lacked access to affordable finance to address these issues. Therefore, the government conceived a plan to increase the duty on imported wheat from 5% to 20% and then to use the revenue generated to create a cassava bread development fund to provide soft loans and grant for processors and bakers. About US$63 million was generated in extra revenue, of this US$21.25 million was used to create the cassava bread development fund lodged with the Bank of Industry (BOI). From mid-2013 until the end of 2014 the BOI offered finance based on a 50% grant and 50% loan for equipment purchases. The maximum size of the payment was US$100,000 per applicant. The loan component attracted between 5% and 12% interest which compared favourably with the commercial rate

Feasibility and Market for Cassava Industrialisation in Uganda: A Strategic Study Confidential – February 2017
61
which was ranging between 30% and 34%. To avoid abuse of the scheme no moneys were paid directly to the processors or bakers. Upon approval recipients were able to choose sets of equipment to be supplied by approved contractors. Training and support were provided by staff from CTAP and the C:AVA project. Processors had a choice of different Nigerian made flash dryers, heat exchangers and wet hammer mills. Bakers were supplied with a set of modern baking equipment including a spiral mixer, refrigerator (to make chilled water to enable the use of bakery improvers) and a modern bread oven. During a 12-month period some 60 HQCF processors received upgraded processing equipment and some 250 bakers received upgraded baking equipment and training in use of HQCF in bread making and support for recipe development. Approval of payments was linked to an assessment of the business and evaluation of a business plan by officials at the BOI. CTAP made considerable efforts to promote HQCF in bread through newspaper and magazine articles, stories on the internet and television and radio interviews as well as participating in agricultural and trade fairs (baking demonstrations and tasting sessions). Taken at face value the cassava bread development fund was a success, a significant proportion of the funds reached the intended beneficiary, the financial provisions were affordable, training and mentoring support was given and the processors and bakers gained useful improvements to their capacity that gave real potential to improve competitiveness of the businesses. The bakers benefited the most as the equipment supplied can be used for any form of baking and not just for production of bread containing HQCF. Uganda can learn from this on how to create a cassava investment fund. In addition, some resources should also go into market intelligence, consumer testing, and research and development (R&D).

Feasibility and Market for Cassava Industrialisation in Uganda: A Strategic Study Confidential – February 2017
62
8.0 OUTLINE OF PROPOSALS FOR LARGE-SCALE INVESTMENTS IN CASSAVA
8.1 GENERAL THOUGHTS Based on the aforementioned assessments of markets in Uganda and the region, Acro Bio-Tech Company presents proposals for establishing a large scale cassava industry in Uganda. The preliminary thought is to start processing of 5 - 10% of the national supply of fresh cassava roots in Uganda, which corresponds to 200,000 MT - 300,000 MT of fresh cassava roots (FCR) per annum. As described, there are 6 cassava products that could be manufactured in Uganda. Regarding cassava chips and pellets, considering their high processing and transportation costs, at present it is not possible to compete with cassava chip producers from South Asian countries. As a consequence, the cassava chip production is not a good choice at first stage. The production of industrial & extra neutral alcohol is a profitable business but due to its market size still being at a small level it is suggested to develop it at the next stage. Therefore, in a first stage, designs for investments in HQCF/starch and glucose/maltose syrup production are presented. For HQCF/starch production, 20TPD (MT per day) is the minimum industrial size, the economical size could be 60TPD, 120TPD or 200TPD. The capacity design for glucose/maltose syrup production design is flexible from 20TPD - 200TPD, but considering the capability to continuously supply syrup to large consumers (such as beverage and beer producers), the capacity should not be less than 100TPD. Based on the above concept, it is possible to develop a cassava industry along the following lines: Annually process 120,000 MT of fresh roots into 30,000 MT of starch, therein 27,600 MT starch supply to glucose/maltose syrup factory for 30,000 MT syrup production, and another 2400 MT starch supply to the local market. Annually process 105,000 MT of fresh roots into 30,000 MT HQCF, supplied to local and international markets. Since the cassava starch and HQCF could be processed in the same production line, the investment plan could be:
In total production of 200 TPD cassava starch/HQCF by a maximum of ten of 20TPD satellite cassava starch/flour processing plants. It can be considered to build some 60TPD or 120TPD plants, the number of factories depending on the capacity of the cassava roots supply chain.
One central value added cassava products processing plant, starting with the production of 100TPD of glucose syrup.
Space can be reserved for a future investment in ethanol or other value added products.
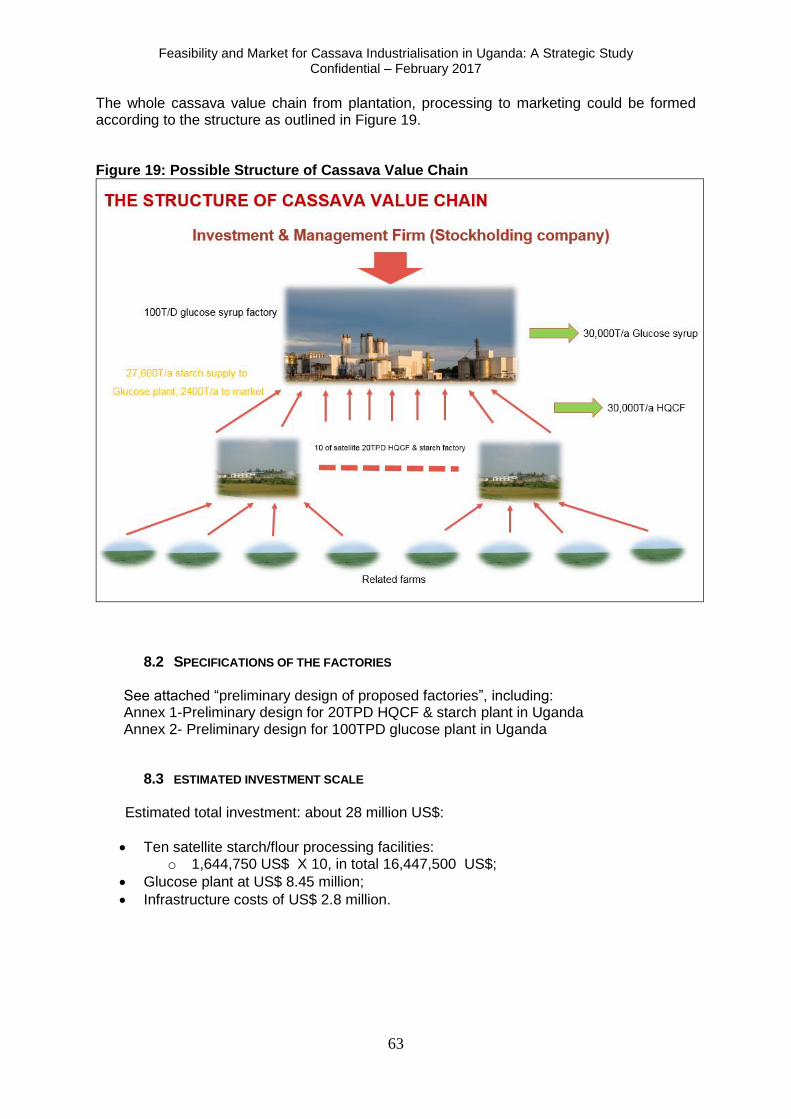
Feasibility and Market for Cassava Industrialisation in Uganda: A Strategic Study Confidential – February 2017
63
The whole cassava value chain from plantation, processing to marketing could be formed according to the structure as outlined in Figure 19. Figure 19: Possible Structure of Cassava Value Chain
8.2 SPECIFICATIONS OF THE FACTORIES See attached “preliminary design of proposed factories”, including: Annex 1-Preliminary design for 20TPD HQCF & starch plant in Uganda Annex 2- Preliminary design for 100TPD glucose plant in Uganda
8.3 ESTIMATED INVESTMENT SCALE Estimated total investment: about 28 million US$:
Ten satellite starch/flour processing facilities: o 1,644,750 US$ X 10, in total 16,447,500 US$;
Glucose plant at US$ 8.45 million;
Infrastructure costs of US$ 2.8 million.

Feasibility and Market for Cassava Industrialisation in Uganda: A Strategic Study Confidential – February 2017
64
Project:
Cost Evaluation (in US$) Unit Index of Buildings account forCivil work Equipments Others Total Unit Quant. Price(US$) %
I Section One:Engineering cost 526,360 789,366 144,623 1,460,349 88.79
1 Starch & Flour work shop 184,320 433,366 86,673 704,359 m2
576 320 42.82
2 Warehouse for finish products 86,400 30,000 6,000 122,400 m2
288 300 7.44
3 Fresh cassava deposition ground 23,040 30,000 6,000 59,040 m2
288 80 3.59
4 Power distribution station (01 set 500KW DG) 18,000 80,000 16,000 114,000 m2
60 300 6.93
5 Maintenance work shop 10,800 30,000 4,500 45,300 m2
36 300 2.75
6 Boiler room (1 boiler 2t/h, 0.8MPa) 34,800 30,000 4,500 69,300 m2
116 300 4.21
7 Depositing ground for cassava fiber 12,200 0 12,200 m2
244 50 0.74
8 Water supply station (Fresh water 20m3/h) & drainage 21,600 15,000 2,250 38,850 m
272 300 2.36
9 Bridge scale 3,800 40,000 8,000 51,800 m2
38 100 3.15
10 Office and lab 45,000 70,000 10,500 125,500 m2
150 300 7.63
11 Kitchen and other rooms 20,400 30,000 50,400 m2
68 300 3.06
12 Gate of entrance 6,000 1,000 200 7,200 m2
20 300 0.44
13 Parking lot 5,000 0 5,000 m2
100 50 0.30
14 Road 40,000 0 40,000 m2
800 50 2.43
15 Enclosing wall 15,000 0 15,000 m 300 50 0.91
16 Wastwater pond (360M3/d COD5500) 100,000 0 100,000 m
25000 20 6.08
II Section Two:Other cost 0 67,573 4.11
1 Reconnaissance engineering 4,381 0.30%
2 General designing (including civil works) 29,207 2.00%
3 Insurance of the engineering 4,381 0.30%
4 Cost of office furniture and commodities 10,000
5 Preparation cost of testing and running 5,000
6 Cost of combining testing and running 14,603 1.00%
III Section three:Fund of preparation 0 116,828 7.10
1 Basic fund of preparation 43,810 3.00%
2 Price difference fund of preparation 0 73,017 5.00%
IV Total of fixed assets (Section one ~three) 526,360 789,366 144,623 1,644,750 100.00
V Tax 0 ?
VI Interest 0 0.00 ?
VII Total Amount 526,360 789,366 144,623 1,644,750 100.00
Note: 1. The unit price in "Unit Index of buildings" will be revised in according to site situation.
2. The culumn "Others" ) refers to cost of design, packing, transporting, installation and testing
3. Cost of purchased or rented terra land are not included in this budget
Budget Estimation of 20TPD HQCF & Starch Plant in Uganda
Item Content Note
8.3.2 The investment for 100T/D glucose syrup production: 8,453,473US$
Project:
Cost Evaluation (in US$) Unit Index of Buildings account forCivil work Equipments Others Total Unit Quant. Price(US$) %
I Section One:Engineering cost 2,521,060 4,391,210 658,682 7,570,952 89.56
1 100TPD Glucose Syrup plant 655,200 3,351,829 502,774 4,509,804 m2
1872 350 53.35
2 Warehouse for finish products 216,000 30,000 4,500 250,500 m2
720 300 2.96
3 Spare parts warehouse and maintenance work shop 113,400 74,361 11,154 198,915 m2
378 300 2.35
4 Boiler room (1 boiler 6t/h, 0.8MPa) 60,000 40,000 6,000 106,000 m2
200 300 1.25
5 Power supply station (1000Kw, 2*500 Diesel generators) 113,400 150,000 22,500 285,900 m2
378 300 3.38
6 Water supply and fireflighting station 67,200 10,000 1,500 78,700 m2
224 300 0.93
7 Office, Lab & Canteen 216,000 100,000 15,000 331,000 m2
720 300 3.92
8 Fire wood yard 21,240 0 21,240 m2
1062 20 0.25
9 Gate of entrance and house 13,200 1,000 150 14,350 m2
44 300 0.17
10 Bridge scale 8,000 40,000 6,000 54,000 m2
100 80 0.64
11 Parking lot 11,900 0 11,900 m2
238 50 0.14
12 Road 391,520 0 391,520 m2
4894 80 4.63
13 Fencing 34,000 0 34,000 m 680 50 0.40
14 Wastwater treatment 600,000 594,020 89,103 1,283,123 m2
2000 300 15.18
II Section Two:Other cost 0 352,554 4.17
1 Reconnaissance engineering 22,713 0.30%
2 General designing (including civil works) 151,419 2.00%
3 Insurance of the engineering 22,713 0.30%
4 Cost of office furniture and commodities 60,000
5 Preparation cost of testing and running 20,000
6 Cost of combining testing and running 75,710 1.00%
III Section three:Fund of preparation 0 529,967 6.27
1 Basic fund of preparation 151,419 2.00%
2 Price difference fund of preparation 0 378,548 5.00%
IV Total of fixed assets (Section one ~three) 2,521,060 4,391,210 658,682 8,453,473 100.00
V Tax 0 ?
VI Interest 0 0.00 ?
VII Total Amount 2,521,060 4,391,210 658,682 8,453,473 100.00
Note: 1. The unit price in "Unit Index of buildings" will be revised in according to site situation.
2. The culumn "Others" ) refers to cost of design, packing, transporting, installation and testing
3. Cost of purchased or rented terra land are not included in this budget
Budget Estimation of 100TPD Glucose Plant in Uganda
Item Content Note
8.3.3. 2.8 Million US$ for logistic facilities. (In total 27,700,253 USD)

Feasibility and Market for Cassava Industrialisation in Uganda: A Strategic Study Confidential – February 2017
65
8.4 ANTICIPATED BENEFIT Annual benefit:
8.4.1 Ten of satellite starch/flour plant: The Annual Operation & Management cost of 20TPD HQCF & Starch plant
Quantity Unit price Amount
year US$ US$
1.1 Raw material MT 22500 45.00 1,012,500
1.2 Water M3
69000 0.20 13,800
1.3 Fuel for boiler MT 1200 25.00 30,000 base on fire wood
1.4 Power consumption kwh 1200000 0.19 229,200
1.5 Package (50kg/bag) PSC 120000 0.30 36,000
1,321,500
2.1 Marketing and factory management cost 117,660 5% of sales income
2.2 Labour cost Person 29 1200 34,800
2.3 Spare parts + maintenance unit 22500 2 45,000
197,460
1,518,960
II. Operation & Management cost
Sub total
Total Amount
Annual Operation & Management cost of 20TPD HQCF & Starch Plant
Item Content Unit Note
I. Cost of Input and Consumption for 20t/d cassava starch and flour line
Sub total
The Annual sales income of 20TPD HQCF & Starch plant
Item Products Unit Quantity Unit price (US$) Total(US$)
1 Cassava Flour MT 3000 320.00 960,000.00
2 Cassava starch MT 3000 450.00 1,350,000.00
3 Cassava fiber MT 3600 12.00 43,200.00
2,353,200.00
Annual Sales Income of 20TPD HQCF & Starch Plant
Total Amount Gross profit of 10 starch/flour plant: ( 2,353,200-1,518,960)X10=8,324,000 US$
8.4.2 100T/D glucose syrup factory: The Annual Production cost of 100TPD Glucose Plant in Uganda
Unit price Total
Per ton syrup Per year US$ 1000US$
1.1 Raw material (Starch)Starch≥85%
MT 0.92 27,600.00 480.00 13,248,000.00300 working days per
year
1.2 Fire woodRated heat value
3500Kcal/kgMT 0.2 6,000.00 25.00 150,000.00
1.3 Water Drinkable water M3 2 60,000.00 0.30 18,000.00
1.4 Electricity kwh 40 1,200,000.00 0.19 229,200.00
1.5 Chemicals for syrup production Batch 1 30,000.00 22.50 675,000.00
1.6Package
50kg/barrel pcs 20 600,000.00 1.50 900,000.00The barrel could be
reused 6 times
15,220,200.00
2.1Marketing and factory
management cost1,268,949.00
5% of sales income
2.2 Labor unit 1 30,000.00 3.50 105,000.00
2.3 Spare parts + maintenance unit 1 30,000.00 3.00 90,000.00
1,463,949.00
16,684,149.00
I. Cost of Input and Consumption for 100t/d Glucoe syrup production line
II. Operation & Management cost
Sub total
Sub total
Total Amount
Annual Production Cost of 100TPD Glucose Plant in Uganda
Item Content Specification UnitConsumption
Note

Feasibility and Market for Cassava Industrialisation in Uganda: A Strategic Study Confidential – February 2017
66
The Annual Sales Income of 100TPD Glucose Plant in Uganda
Item Contents Unit Quantity Unit price Total(US$)
1 Glucose syrup MT 30000 845.00 25,350,000.00
2 Crude protein MT 96.6 300.00 28,980.00
25,378,980.00
Annual Sales Income of 100TPD Glucose Plant in Uganda
Total Amount Gross profit of Glucose plant: 25,378,980-16,684,149 =8,694,831 US$ Gross profit in total= 8,324,000+8,694,831=17,037,230 US$ per year

Feasibility and Market for Cassava Industrialisation in Uganda: A Strategic Study Confidential – February 2017
67
9.0 CONCLUSIONS AND RECOMMENDATIONS A team of experts from the Natural Resources Institute (NRI) of the United Kingdom, African Innovations Institute (AfrII) in Uganda and Acro Bio-Tech Company of China was commissioned to investigate the potential for large-scale cassava industrialisation in Uganda. The study has been conducted between September and November 2016, involving a desk study, fieldwork, and preparation of the report. The tasks as agreed in the terms of reference (ToR), include the following:
(a) To carry out cassava sub-sector analysis and the feasibility of setting up and managing profitable large-scale cassava processing investment opportunities and recommend the best investment opportunities.
(b) To undertake a detailed study of potential markets for cassava products identified in (a) above and recommend measures to be put in place in order to penetrate them.
(c) To investigate and identify the most appropriate technologies that can be introduced from China into Uganda for large scale cassava processing and recommend how these can be acquired.
(d) To examine cassava investment policy environment, and identify sources of affordable investment capital from Uganda and China that can support large scale cassava processing in Uganda and recommend how these can be accessed.
(e) To disseminate findings of the feasibility study, and interest potential investors to develop their own robust and fundable business plans, and invest in the most appropriate cassava processing opportunity.
Cassava is one of the major crops produced in Uganda, together with plantain, maize, sweet potatoes, and sugar cane. According to statistics by the Food and Agriculture Organization of the United Nations (FAO), annual production of cassava roots was of the order of about 5 million MT until 2011, when it dropped to approximately 3 million MT per annum due to factors such as plant diseases (e.g. Cassava Brown Streak Disease). Northern and Eastern Uganda account for the bulk of cassava production in the country. Although it is recognised that cassava is a food crop in Uganda, it is also evident that demand for a range of industrially manufactured products is increasing, and cassava can be used in different forms as raw material for the production of these products. A demand for 200,000 MT of fresh cassava roots (FCR), which is a potential amount of FCR to be industrially processed, represents only 4% of annual national production if the latter is 5 million MT of FCR. At the same time, whilst the impact on food security may be relatively small at national level, the impact at local level is likely to be significant regarding issues such as food security, and land ownership for production of raw material by nucleus estates and out-growers. Field surveys undertaken to assess the demand for industrially processed cassava products established that there is demand for high quality cassava flour (HQCF) in bakeries (in particular rural ones), institutions such as schools or prisons, manufacturers of composite flour, breweries using cassava flour as adjunct in the brewing of clear lager beer, and the paperboard manufacturing industry which can use HQCF or starch as a glue extender. Starch is also used by other industries such as the food industry. The ethanol industry imports ethanol for industrial (e.g. cleaning of hospitals) or potable alcohols. There is also the option that the Government of Uganda (GoU) might decide that ethanol should be included at a certain percentage in fuel for cars or other vehicles. There is one medium-sized ethanol factory operational in Lira District (using dried cassava chips as raw material for the production of industrial alcohol), and a sugar factory is also manufacturing ethanol (using molasses as raw material). In addition, it is understood that another sugar production scheme is planning to produce substantial quantities of ethanol. As for animal feed, there have been unofficial accounts of livestock feeders using traditionally dried cassava as a

Feasibility and Market for Cassava Industrialisation in Uganda: A Strategic Study Confidential – February 2017
68
source of energy when maize is expensive. It is felt that there is scope for industrially manufactured animal feed using dried cassava and protein balancers as raw materials, in particular in view of an increasing demand for animal feeds within Uganda and the region. It is understood that sweeteners such as glucose syrup can be manufactured from cassava, although it proved difficult to estimate exact figures of demand (apart from using Uganda Revenue Authority data on syrup imports, which are 2,753 MT in 2015-16). In several cases industries have started to use cassava based materials as ingredients (e.g. baking, brewing, ethanol production, paperboard manufacturing), although the consistent supply of high-quality, dried, cassava products is often seen as a constraint (e.g. either quantities available, the prices on offer, or the quality of the products). It is suggested that the figures in Table 9 represent an achievable short-term demand for cassava based products (i.e. within 2 years) and a range of purchase prices offered at factory gate. The medium to long-term demand will be larger, taking into account factors such as increasing purchasing power, demographic growth, and changing consumer preferences.
Table 9: Short-term demand for cassava based products and factory purchase prices
Products required by end-user industries Quantity (MT)
Price (USh/kg)
Price (US$/MT)
HQCF for bakeries/ institutions/ composite flour 1700 1500 – 2000 444 – 592
HQCF for breweries (i.e. milled chips and grits) 6000 1000 – 1200 296 - 355
HQCF (starch) for paperboard 500 1500 – 2000 444 - 592
Starch for other industries (e.g. food industry) 1000 1500 – 2000 444 - 592
Chips for ethanol production 4000 800 – 1000 237 - 296
Improved chips or grits for animal feed 1500 800 – 1100 237 - 325
Sources: Fieldwork in October 2016, AfrII contacts with buyers, import data, and C:AVA studies. NB. US Dollar prices have been rounded. A medium to long-term demand for cassava products is presented in the main report.
The processing steps, equipment, raw material, and other inputs required for the production of six products, namely dried cassava chips, hard pellets for animal feed, high quality cassava flour (HQCF), sugar syrups, native and modified starches, industrial and extra-neutral alcohol (ENA) are being presented in the section dealing with large-scale processing of cassava. Factors regarding the location of a processing plant include access to the following: good raw material supply (i.e. fresh cassava roots), road infrastructure, electricity grid, mains or borehole water supply, skilled labour. In particular, the supply of fresh cassava roots is exemplified with experience from a range of countries, namely Thailand, Vietnam, Malawi, and Nigeria, detailing good agricultural practices (GAP), production costs, mechanisation of production, specification of cassava roots, amongst other things. The section on innovation and competitiveness provides examples of experiences with cassava industries in other countries, as well as experience with previous cassava related investments in Uganda. Business and finance planning involves assessments of the range of finance available, including, Uganda Development Bank (UDB), Uganda Development Corporation (UDC), Uganda Investment Authority (UIA), investment funds in China, Africa, or other parts of the world. Fiscal aspects of planning include the presentation of key aspects of the “Guide on Tax Incentives/Exemptions available to investors in Uganda”. The agricultural sector including cassava has a high priority as far as policy making by the Government of Uganda is concerned. The same applies to the establishment of agricultural enterprises and industries, in order to, amongst other things, create employment, and reduce the balance of payment deficit.

Feasibility and Market for Cassava Industrialisation in Uganda: A Strategic Study Confidential – February 2017
69
In view of this, the processing options presented by Acro Bio-Tech Company are based on two stages, namely the construction of:
(a) 10 medium-scale, satellite type, factories that process fresh cassava roots (FCR) into HQCF and starch. The factories would have a daily output of 20 MT, or 3000 MT of HQCF plus 3000 MT of starch, assuming the factories operate 300 days per annum. For HQCF/starch production, 20TPD (MT per day) is the minimum industrial size, the economical size could be 60TPD, 120TPD or 200TPD.
(b) A factory with a daily capacity of 100 MT of glucose syrup per day (i.e. 30,000 MT
p.a.), using 27,600 MT of starch from the 10 satellite factories as raw material. The remainder of starch produced by these factories (i.e. 2,400 MT) would be destined for the local market. Given the size of the Ugandan market for syrups, the bulk of this would have to be sold outside the country or region.
The two stages, which can also be seen as options, are presented in Table 10. Whilst Option a, in the form of one or several factories producing HQCF and starch, can be implemented without Option b, vice versa cannot be envisaged in the context given.
Table 10: Summary of industrial cassava processing options for Uganda
Option a: Medium-scale processing Option b: Large-scale processing
Processing factory producing 20 metric MT of output per day (TPD), half of this in the form of HQCF and half in the form of starch. The annual output of the factory would be 3000 MT of HQCF and 3000 MT of starch (based on 300 working days). If the conversion ratios are 4 to 1 for HQCF and 5 to 1 for starch, then 12,000 MT of fresh cassava roots (FCR) would be annually required for HQCF production and 15,000 MT of FCR for starch manufacturing. 1,350 hectares of land would be required if the total demand for FCR is of the order of 27,000 MT per annum, and the yields are 20 MT per hectare. A combination of nucleus estate and small-holder outgrowers can be envisaged for the supply of FCR. The investment cost for the processing factory would be of the order of US$ 1.64 million. The location of the plant would have to be decided, depending on availability of labour, fresh cassava roots, infrastructure, fuel, etc. The demand for the industrial cassava products would be mainly coming from Uganda, and part of it could come from
Factory producing 100 TPD of glucose syrup would be supplied by ten medium-scale, satellite type, processing factories described on the left with 27,600 MT of cassava starch as raw material. A total of 13,500 hectares of land would be required to produce 270,000 MT of fresh cassava roots per annum for the 10 satellite plants. The amount of land and raw material required for the enterprise is likely to pose a challenge. The large glucose syrup factory would produce 30,000 MT of syrup p.a., requiring 27,600 MT of starch from the 10 satellite factories. The latter would sell 30,000 MT of HQCF p.a. on the open market (e.g. to breweries and other end-users), plus 2400 MT of starch, and 36,000 MT of cassava fibre. The investment costs of the glucose plant are estimated at US$ 8.45 million, plus the cost of the 10 satellite plants at a total of US$16.44 million, plus US$ 2.8 million for infrastructure. This would bring the total cost of the scheme to about US$27.7 million. The focus of this cost would be on processing. The investment for preparing the land and

Feasibility and Market for Cassava Industrialisation in Uganda: A Strategic Study Confidential – February 2017
70
neighbouring countries within East Africa. The total annual operational and management costs for 20 TPD HQCF & starch plant are estimated by Acro Bio-Tech to be of the order of US$ 1,518,960. The annual sales income of a 20 MT per day HQCF & starch plant is estimated to be of the order of US$2,353,200, which is based on the sales of 3000 MT of HQCF (at $320/t), 3000 MT of starch (at $450/t), and 3600 MT of cassava fibre (at $12/t).
the provision of extension services to farmers would be separate. The annual production costs of the glucose plant are estimated to be US$16.7 million, compared to a sales income of US$25.35 million from 30,000 MT of glucose syrup (at $845/t), plus US$ 28,980 from the sales of 96.6 MT of crude protein (at $300/t). As for the markets, the bulk of the product would have to be exported, given the quantities involved, and the limited size of the Ugandan market.
Table 11 outlines an assessment of the cassava industrialisation options using criteria such as raw material supply, access to finance, markets, and energy supply. Table 11: Assessment of strengths and weaknesses of cassava industrialisation options
Strengths Weaknesses / Challenges
Option a: Construction of medium -sized factory producing 20 MT of output per day (HQCF and starch). If successful, this can be followed by the construction of several factories of this size.
The output of one or two factories of this size corresponds to what the Ugandan market can absorb in terms of HQCF and starch in the short-term. If the establishment of one factory of this scale proves successful then the construction of more factories of this scale can be implemented. Output would be destined for the Ugandan or EAC market. Access to finance (mix of equity and loan) should be relatively straightforward given the size of the investment (US$ 1.64 million per plant). The annual operational and management costs for one plant would be US$ 1.52 million. A similar-sized investment is already in place in the form
The supply of raw material in the form of fresh cassava roots (FCR) needs to be assured, given that continuous supply of FCR (~80MT per day) are required. The supply of FCR from a combination of estate and outgrower scheme appears feasible at this scale if improved cassava varieties can be used. The energy for heating of the boiler would come from fuelwood (0.2 MT per MT of output) in the case of HQCF, and a combination of fuelwood (0.2 MT per MT of output) and coal (0.12 MT per MT of output) in the case of starch. This is in addition to electricity (~200 kWh/MT of output). The availability of these amounts of energy plus water needs to be affirmed for the area where the plant will be located.
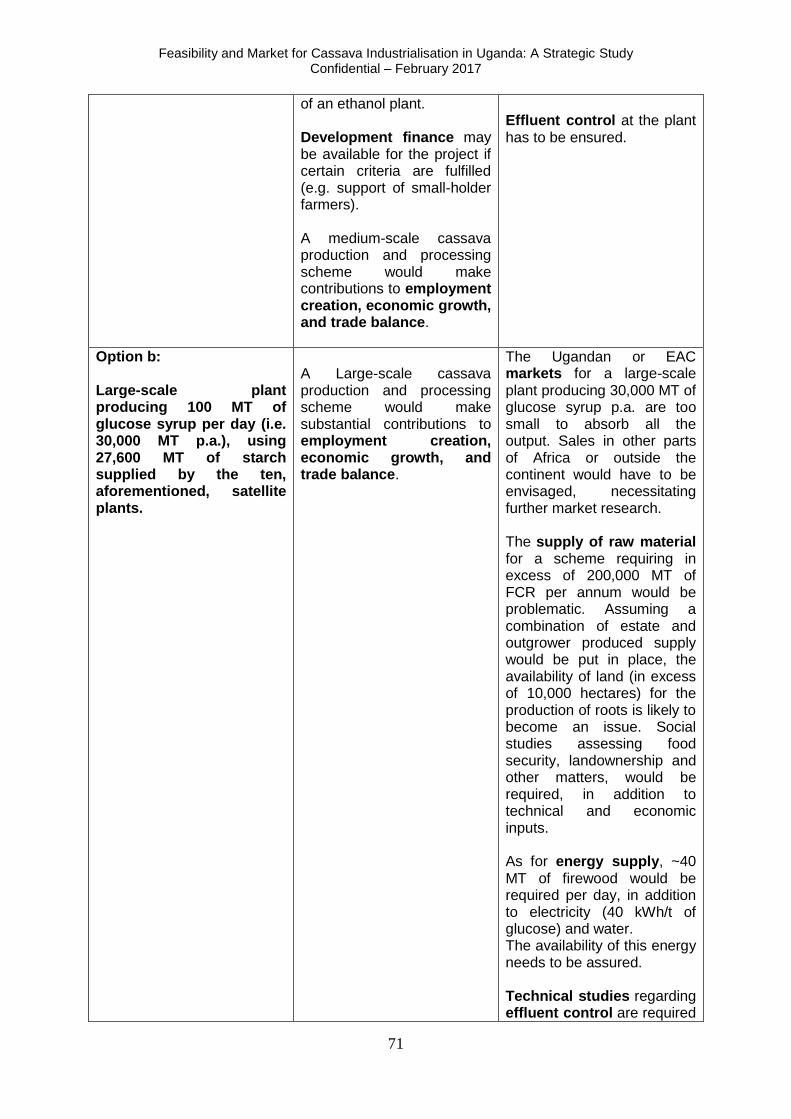
Feasibility and Market for Cassava Industrialisation in Uganda: A Strategic Study Confidential – February 2017
71
of an ethanol plant. Development finance may be available for the project if certain criteria are fulfilled (e.g. support of small-holder farmers). A medium-scale cassava production and processing scheme would make contributions to employment creation, economic growth, and trade balance.
Effluent control at the plant has to be ensured.
Option b: Large-scale plant producing 100 MT of glucose syrup per day (i.e. 30,000 MT p.a.), using 27,600 MT of starch supplied by the ten, aforementioned, satellite plants.
A Large-scale cassava production and processing scheme would make substantial contributions to employment creation, economic growth, and trade balance.
The Ugandan or EAC markets for a large-scale plant producing 30,000 MT of glucose syrup p.a. are too small to absorb all the output. Sales in other parts of Africa or outside the continent would have to be envisaged, necessitating further market research. The supply of raw material for a scheme requiring in excess of 200,000 MT of FCR per annum would be problematic. Assuming a combination of estate and outgrower produced supply would be put in place, the availability of land (in excess of 10,000 hectares) for the production of roots is likely to become an issue. Social studies assessing food security, landownership and other matters, would be required, in addition to technical and economic inputs. As for energy supply, ~40 MT of firewood would be required per day, in addition to electricity (40 kWh/t of glucose) and water. The availability of this energy needs to be assured. Technical studies regarding effluent control are required
Feasibility and Market for Cassava Industrialisation in Uganda: A Strategic Study Confidential – February 2017
72
(at both plants for glucose and starch production). As for funding, given the size of the investment (US$ 27.7 million in total), delays are likely. The money would have to come from a consortium of investors.
Recommendation: It is recommended to focus on a medium-scale industrial cassava processing option for the time being (i.e. a factory able to produce 20 MT of HQCF and starch per day), with funding coming from a mix of equity and loans. For HQCF/starch production, 20TPD (MT per day) is the minimum industrial size, the economical size could
be 60TPD, 120TPD or 200TPD. In the medium-term, if such a factory proves successful,
then more similar plants can be constructed. More detailed analyses will be required as for the construction of the plant, as well as supply of raw material and energy sources. In particular, the availability of fuelwood for the boiler needs to be assured, and, if needed, alternatives will have to be investigated. The construction of a large-scale factory able to produce 30,000 MT of glucose syrup per annum, should be put on halt for the time being. This is due to the risks and challenges involved with such a project. A review of the situation is recommended in four years’ time. This will require relevant technical, economic, social, and environmental assessments. As for the capacity of a syrup production factory, the design is flexible from 20TPD - 200TPD, which can be reviewed at the time.
Feasibility and Market for Cassava Industrialisation in Uganda: A Strategic Study Confidential – February 2017
73
10.0 ANNEXES
ANNEX 1 - PRELIMINARY DESIGN FOR 20TPD HQCF & STARCH PLANT IN UGANDA
ANNEX 2 - PRELIMINARY DESIGN FOR 100TPD GLUCOSE PLANT IN UGANDA