EVIDENCE FROM S P 1500 COMPANIES -...
38
ARE FOUNDER CEOs MORE OVERCONFIDENT THAN PROFESSIONAL CEOs? EVIDENCE FROM S&P 1500 COMPANIES Joon Mahn Lee Krannert School of Management Purdue University 403 W State Street, West Lafayette, IN 47907 [email protected] Byoung-Hyoun Hwang 1 Dyson School of Applied Economics and Management Cornell University Warren Hall, Ithaca, NY 14853 [email protected] and Korea University Business School Korea University Anam-dong, Seongbuk-gu, Seoul, Korea 136-701 Hailiang Chen Department of Information Systems City College of Business University of Hong Kong Kowloon Tong, Hong Kong [email protected] Keywords: Overconfidence, Founder CEOs, Professional CEOs, Corporate Governance 1 All authors contributed equally. Corresponding author: Byoung-Hyoun Hwang, [email protected].
Transcript of EVIDENCE FROM S P 1500 COMPANIES -...
ARE FOUNDER CEOs MORE OVERCONFIDENT THAN PROFESSIONAL CEOs?
EVIDENCE FROM S&P 1500 COMPANIES
Joon Mahn Lee
Krannert School of Management
Purdue University
403 W State Street, West Lafayette, IN 47907
Byoung-Hyoun Hwang 1
Dyson School of Applied Economics and Management
Cornell University
Warren Hall, Ithaca, NY 14853
and
Korea University Business School
Korea University
Anam-dong, Seongbuk-gu, Seoul, Korea 136-701
Hailiang Chen
Department of Information Systems City
College of Business
University of Hong Kong
Kowloon Tong, Hong Kong
Keywords: Overconfidence, Founder CEOs, Professional CEOs, Corporate Governance
1 All authors contributed equally. Corresponding author: Byoung-Hyoun Hwang, [email protected].
2
ABSTRACT
Research Summary
We provide evidence that founder CEOs of large S&P 1500 companies are more
overconfident than their non-founder counterparts (“professional CEOs”). We measure
overconfidence via CEO tweets, CEO statements during earnings conference calls,
management earnings forecasts, and CEO option-exercise behavior. Compared with
professional CEOs, founder CEOs use more optimistic language on Twitter and during
earnings conference calls. In addition, founder CEOs are more likely to issue earnings
forecasts that are too high; they are also more likely to perceive their firms to be
undervalued, as implied by their option-exercise behavior. To date, investors appear
unaware of this “overconfidence bias” among founders.
Managerial Summary: This paper helps to explain why firms managed by founder CEOs
behave differently from those managed by professional CEOs. We study a sample of S&P
1500 firms and find strong evidence that founder CEOs are significantly more
overconfident than professional CEOs. To date, investors appear unaware of this
overconfidence bias among founders. Our study should help firm stakeholders, including
investors, employees, suppliers, and customers put the statements and actions of founder
CEOs in perspective. Our study should also help members of corporate boards make more
informed decisions about whether to retain (or bring back) founder CEOs or hire
professional CEOs.
1
INTRODUCTION
Many U.S. companies are managed by founder CEOs, including some of the largest, such as
Google, Facebook, and Amazon (e.g., Certo et al., 2001; Fahlenbrach, 2009; Nelson, 2003;
Villalonga and Amit, 2006; Villalonga and Amit, 2009). In light of the economic significance of
these large founder-managed firms, a growing body of research compares the behavior and
performance of large firms managed by founder CEOs with those of firms managed by
professional CEOs. For example, Fahlenbrach (2009) finds in his sample of mostly S&P 500 firms
that founder-CEO firms invest 22% more in research and development (R&D) and incur 38%
higher capital expenditures. In their study of Fortune 500 companies, Villalonga and Amit (2006)
find that founder-managed firms have higher firm-valuation ratios than their non-founder-
managed counterparts.
These studies point to substantial differences between firms managed by founder CEOs
and those managed by professional CEOs. Yet, we know relatively little about what attributes of
founder CEOs and professional CEOs lead to these differences in the first place.1 Our purpose in
this paper is to identify one such attribute. Specifically, we conjecture that founder CEOs are more
overconfident (optimistic)2 than professional CEOs. Overconfidence is the tendency of individuals
to think that they are better than they truly are with respect to their abilities, judgments, or future
prospects, and to underestimate risk (Barber and Odean, 2001; Dushnitsky, 2010; Malmendier and
Tate, 2005; Simon and Houghton, 2003).
1 Recently, scholars have begun focusing on the sources of differences between founder CEOs and professional CEOs (e.g., Certo
et al., 2001; Fahlenbrach, 2009; Nelson, 2003; Villalonga and Amit, 2006; Villalonga and Amit, 2009) in large public companies.
These scholars have argued that founder CEOs differ from professional CEOs in the following ways: founder CEOs often consider
their firms to be their “babies or legacies,” and their attitudes toward risk differ from those of professional CEOs. Founder CEOs
are also often more knowledgeable about their firms and are better networked with their employees. However, empirical evidence
pertaining to these differences is scarce, leaving the door open for future research. 2 Large bodies of literature exist on overconfidence (e.g., Hayward and Hambrick, 1997; Malmendier and Tate, 2005; Navis and
Ozbek, 2015; Simon and Houghton, 2003) and optimism (e.g., Dushnitsky, 2010; Lowe and Ziedonis, 2006). Following previous
studies (e.g., Cassar, 2010; Landier and Thesmar, 2009), we use “overconfidence” and “optimism” interchangeably.
2
Our suspicion stems from two sources: (1) studies arguing that the average CEO is
overconfident but that there is also considerable variation (Galasso and Simcoe, 2011; Hayward
and Hambrick, 1997; Hirshleifer, Low, and Teoh, 2012; Hribar and Yang, 2013; Malmendier and
Tate, 2005, 2008), and (2) studies seeking to explain why entrepreneurs participate in start-up
activities even though few new venture firms succeed.
Regarding the latter source, entrepreneurship scholars have long considered the possibility
that entrepreneurs have higher dispositional optimism than non-entrepreneurs (e.g., Camerer and
Lovallo, 1999; Cooper, Woo, and Dunkelberg, 1988; Lowe and Ziedonis, 2006). Empirical work
suggests that, in general, founders of small startup firms are more overconfident than professional
managers. 3 Busenitz and Barney (1997) explore differences in cognitive biases between
founders/entrepreneurs in (small) startup firms and executives in large organizations. Using survey
data from 219 entrepreneurs and professional managers, Busenitz and Barney find that
entrepreneurs exhibit significantly greater confidence than professional managers. Forbes (2005)
uses survey data on 108 entrepreneurs and non-founding managers of new venture firms to show
that founder-managers are more confident than professional managers working for companies in
the entrepreneurial stage.
These studies help us understand the behavior of founder CEOs in small startup companies.
However, we do not know with any degree of certainty whether founder CEOs’ overconfidence
remains high or diminishes after the inception stage, especially as firms develop into large publicly
traded companies (Wasserman, 2003): previous studies on corporate life cycles find that the
characteristics required of successful CEOs in new startups are significantly different from the
characteristics required of successful CEOs in large organizations (Boeker and Karichalil, 2002;
3 The average firm age of founder-led firms in the samples of Busenitz and Barney (1997) and Forbes (2005) are 1.7 years and 2
years, respectively.
3
Hambrick and Crozier, 1986). Founder CEOs who fail to adapt to becoming managers of large
organizations or fail, in some regard, to become more like professional CEOs, may therefore find
themselves being replaced.
We contribute to the literature by (1) providing theoretical arguments explaining why
founder CEOs of large publicly traded companies continue to be more overconfident than their
professional counterparts, and (2) taking our prediction to the data using novel, hand-collected
data. To the best of our knowledge, we are the first to conduct such an analysis.
Our sample contains data on S&P 1500 companies for the period running from 2008
through 2012. Our proxies for overconfidence are as follows: (a) tone of CEO tweets, (b) tone of
statements made by CEOs during earnings conference calls, (c) top management predictions of a
company’s future earnings (“management earnings forecasts”), and (d) the degree to which a CEO
exercises his/her exercisable in-the-money options.
In our first test, we build on findings from prior literature indicating that the fraction of
negative words in a text captures the tone of the text (e.g., Das and Chen, 2007; Li, 2008; Loughran
and McDonald, 2011; Tetlock, 2007; Tetlock, Saar-Tsechansky, and Macskassy, 2008). We find
that founder CEOs use substantially fewer negative words in their personal tweets than
professional CEOs. We make analogous observations in our second test, which examines CEO
statements during earnings conference calls. We find that these differences in tone cannot be
explained by differences in firm performance.
Our third test builds on prior studies that suggest that firm management has strong
incentives to lower investors’ earnings expectations prior to earnings announcements to make it
easier for a firm to meet or beat the consensus forecast (e.g., Bergman and Roychowdhury, 2008;
Matsumoto, 2002). In sharp contrast to professional CEOs, we find that founder CEOs frequently
issue earnings forecasts that are too high relative to actual earnings.
4
Our fourth test utilizes options data. CEOs receive large option grants as part of their
compensation. As CEOs’ fortunes are intimately linked to those of their firms in terms of both
human capital and financial wealth, CEOs should exercise their exercisable in-the-money options
as early as possible (in order to diversify), unless they are overconfident about their firms’ future
returns (Malmendier and Tate, 2005). Our analysis suggests that founder CEOs hold on to options
to a greater degree than professional CEOs. Taken together, our results across our four settings
indicate that founder CEOs of large publicly traded companies are more overconfident than their
professional counterparts.
In subsequent tests, we extend our analysis to non-CEO executives. Using options data, we
provide evidence that founder CEOs are more overconfident than non-CEO executives working at
founder firms. At the same time, non-CEO executives working at founder firms are more
overconfident than their counterparts working at firms managed by professional CEOs. We discuss
potential explanations for these differences later in the paper.
In our final analysis, we present evidence that, to date, investors are unaware of the
overconfidence bias among founders documented herein and, instead, take founder CEOs’
statements at face value. Specifically, we show that investors react to the tone of tweets by founder
CEOs in the same way as they do to tweets by professional CEOs despite our evidence that tweets
by founder CEOs are generally much more positive and that this difference in tone cannot be
explained by firm performance.
In sum, our study contributes to the management and finance literature by being the first
to produce systematic evidence of strong differences in the level of overconfidence between
founder CEOs and professional CEOs within the largest and, economically speaking, most relevant
organizations in the marketplace.
5
Given the significance of founder-managed firms to the overall economy, a large body of
work has begun to examine the behavior of founder-managed firms and contrast it to that of firms
managed by professional CEOs. The literature finds that firms managed by founder CEOs engage
in more merger and acquisition (M&A) activities and invest more heavily in capital expenditures
and (risky) R&D (Fahlenbrach (2009). Founder-managed firms also trade at higher valuation ratios
(Villalonga and Amit (2006). While the observed differences are strong and statistically reliable,
the exact economic mechanisms that underlie these aforementioned differences remain unclear.
Our study helps to fill this gap: our evidence that founder CEOs are systematically more
overconfident than professional CEOs helps in part to explain the observed difference in
investment behavior. By providing evidence that investors are as yet unaware of this particular
overconfidence bias, our findings also help explain why firms managed by founder CEOs trade at
substantially higher valuation ratios than their counterparts managed by professional CEOs.
THEORY AND HYPOTHESES
Overconfidence as a managerial bias
Management and psychology scholars provide strong evidence that individuals tend to
overestimate their own abilities. For example, Bazerman and Moore (2012) find that most people
are overconfident in estimating their own abilities and that they do not assess the actual degree of
uncertainty pertaining to their abilities correctly. Svenson (1981) reports that the vast majority of
subjects in his study of automobile drivers regard themselves as more skillful and less risky than
the average driver.
Top management executives are known to be particularly vulnerable to overconfidence
bias, as overconfidence is stronger among highly skilled individuals than among less skilled
individuals (Camerer and Lovallo, 1999). The implications of this particular cognitive bias have
6
been widely studied in the management and finance literature, both conceptually and empirically.
In a conceptual study on managerial overconfidence, Roll (1986) argues that corporate takeovers
may be explained by the overconfidence of acquiring firms’ top managers. Building on Roll’s
work, Hiller and Hambrick (2005) suggest that overconfidence and optimism lead to faster, less
comprehensive, and more centralized decisions as well as higher-stake strategic actions.
Complementing such theoretical work on managerial overconfidence, Malmendier and
Tate (2008) develop options-based proxies for CEO overconfidence and provide evidence that
more overconfident CEOs tend to overestimate their ability to generate returns and are more likely
to overpay for target companies and undertake value-destroying M&As.
On a more positive note, Hirshleifer et al. (2012) suggest that firms with more
overconfident CEOs invest more heavily in innovation, obtain more patents, and achieve greater
innovative success than other firms. Galasso and Simcoe (2011) also find a positive association
between proxies of overconfidence and innovative behavior.
The aforementioned literature finds substantial variation in overconfidence levels and
provides evidence that such variation captures differences in firm behavior, such as M&A activity
and R&D intensity. But what is the cause of this variation in CEO overconfidence? Which
managers are most likely to be overconfident?
Founder CEOs in entrepreneurial firms versus professional CEOs
A large body of research investigates overconfidence bias among entrepreneurs. While many
people participate in start-up activities every year, few ventures succeed; and most fail within a
few years (Cooper et al., 1988). Scholars attribute this phenomenon to overconfidence bias (e.g.,
Koellinger, Minniti, and Schade, 2007; Shepperd, Ouellette, and Fernandez, 1996). Specifically,
people who choose to become entrepreneurs tend to overestimate their own abilities while
7
underestimating the degree of risk that is involved in starting a new venture (Busenitz and Barney,
1997; De Meza and Southey, 1996). For example, using survey data on 2,994 founding executives,
Cooper et al. (1988) find that founders often perceive the odds of success of their new ventures to
greatly exceed those of similar startups. Similarly, Camerer and Lovallo (1999) use experiments
to study entrepreneurial decision-making regarding market entry. The authors find that although
participants accurately estimate that, on average, the expected value of starting a new business is
negative, founding activity still occurs, perhaps because participants overestimate the prospects
for success for their own particular ventures.
The abovementioned literature does not suggest that entrepreneurs have a higher tolerance
for risk (e.g., Brockhaus and Howtz, 1982; Kahneman and Lovallo, 1993). Instead, entrepreneurs
have biased beliefs and overestimate their own odds of success while underestimating the amount
of risk involved (Busenitz and Barney, 1997). In other words, it is not the risk-taking propensity
of entrepreneurs per se but the misunderstanding of the true probability distribution that, in the
end, makes entrepreneurs take on greater risks than their counterparts.
In contrast to entrepreneurs, professional CEOs often start at the bottom of the pyramid
and rise to the CEO position through an “internal horserace” that requires professional CEOs to
become more rational, conservative, and realistic (e.g., Busenitz and Barney, 1997; Pfeffer and
Lammerding, 1981). Employees who fail to learn and adapt to the needs and norms that large
organizations require (e.g., professionalism, conservatism) are often eliminated by the internal
selection process (Schneider, 1987; Tsui, Egan, and O'Reilly III, 1992). Consequently,
professional managers in existing firms use (relatively speaking) more rational decision-making
processes and are more analytical and realistic (Fraser and Greene, 2006; Hayes and Abernathy,
1980; Smith et al., 1988). In the end, the literature generally suggests that the overconfidence level
of founder CEOs of new venture firms is higher than that of professional CEOs.
8
Founder CEOs in large public firms versus professional CEOs
The aforementioned evidence, while suggestive, does not justify strong statements regarding CEO
overconfidence within large organizations. Founder CEOs are often pressured to adjust their
approach to become more appropriate for leading large organizations. The corporate lifecycle
literature suggests that, as new startups grow significantly, managerial styles and CEO capabilities
must evolve as priorities shift from viability and survival to managing complex organizational
systems (Boeker and Karichalil, 2002; Jain and Tabak, 2008; Tushman and Romanelli, 2008).
Making the transition to large public corporations requires new tasks of CEOs resulting from
changes in ownership and governance structures, increased market monitoring, and pressure to
meet analyst expectations (Jain and Tabak, 2008). Thus, the attributes that large companies require
of their CEOs (e.g., management skills, the ability to meeting investor needs, rational decision-
making) differ significantly from those that new startups require of their CEOs (e.g.,
entrepreneurial passion, being visionary, willingness to take risks) (Boeker and Wiltbank, 2005;
Wasserman, 2012). Founder CEOs who fail to adapt to the new needs and conditions that large
organizations require are often replaced by professional CEOs (Boeker and Fleming, 2010). Thus,
founder CEOs in large organizations often learn to think and behave more like professional CEOs
who make more rational, realistic, and logical decisions.
The counter-argument, namely that founder CEOs remain overconfident even as their
startups become large publicly traded firms, can be found in the literature on entrepreneurial
optimism, which suggests that founder CEOs’ overconfidence stems largely from an inherent
disposition (e.g., Hmieleski and Baron, 2009; Lowe and Ziedonis, 2006), which makes it difficult
for them to reduce their overconfidence even as they become leaders of large organizations. De
Meza and Southey (1996) argue, for example, that entrepreneurs are born overconfident and have
unrealistic expectations by nature. Hayward, Shepherd, and Griffin (2006) and McCarthy,
9
Schoorman, and Cooper (1993) suggest that founder CEOs’ overconfidence persists over time.
Hence, while founder CEOs may alter certain personal attributes following the growth stage of
their firms, they are unlikely to materially alter their level of overconfidence which is spawned by
an inherent disposition.
Drawing from the literature on managerial overconfidence, one could even make the
argument that founder CEOs become more overconfident as their firms develop into large public
companies. Founder CEOs spearheading organizations that eventually become large publicly
traded companies have beaten extreme odds, insofar as most of their fellow entrepreneurs fail
during the entrepreneurial stage or falter in the post-IPO stage. That is, they have survived
immense “external competition” (Camerer and Lovallo, 1999). Founder CEOs are likely to
attribute much of that success to their own competitive attributes (Hayward and Hambrick, 1997),
which can inflate their confidence.
In addition, founder CEOs’ biographies are often romanticized as stories of “[underdogs]
who, against all odds, rose to the top” (Chatterji, 2009). Perhaps as a result, founder CEOs tend to
receive more attention from the media and more favorable coverage, both of which can increase
overconfidence.
We therefore propose the following hypothesis:
Hypothesis: Holding all else equal, founder CEOs of large publicly traded firms are more
overconfident than their professional counterparts.
EMPIRICAL SETTINGS
To measure overconfidence, we use data on CEOs’ Twitter posts, statements made in earnings
conference calls, management earnings forecasts, and option-exercise behavior. For our control
variables, we use data on financial statements, financial markets, financial analysts, and
10
institutional holdings from COMPUSTAT, the Center for Research in Security Prices (CRSP), the
Institutional Brokers’ Estimate System (IBES), and Thomson Reuters, respectively. We collect
biographical data from Marquis Who’s Who.
We construct these variables for a sample of S&P 1500 firms. Our sample period begins in
2008, when the first tweet was posted on the Twitter account of an S&P 1500 CEO, and ends in
2012.4
Dependent variable: Measures of overconfidence
Prior literature gauges entrepreneur overconfidence at the personal level through surveys and
direct questioning of entrepreneurs themselves. However, overconfidence at the personal level
may not survive within a group setting, as CEOs’ actions are constantly monitored and influenced
by other actors (e.g., other corporate executives, directors, auditors, investor relation firms).
Put differently, in order to explain differences in firm behavior via CEO overconfidence,
it is a necessary condition that some CEOs are more overconfident than others and prior literature
produces important evidence on this matter (e.g., Busenitz and Barney, 1997; Forbes, 2005).
However, CEO overconfidence by itself is not a sufficient condition to explain differences at the
firm level, as CEO overconfidence might not express itself at the group level and, thus, may not
translate into differences in firm behavior.
Our empirical setting is unique in that we utilize a full set of measures which, taken together,
capture overconfidence at both the personal level and the group level. Utilizing the full set of
measures helps to alleviate concern about omitted variable bias and strengthens the argument that
4 As we describe later, we compile a list of all CEOs that are in our various samples and, through a very labor-intensive process,
determine, for each CEO, whether he/she is a founder CEO. We note that data on CEO earnings conference call statements,
management earnings forecasts, and CEO options are all available for the pre-2008 period. We believe that examining whether our
observations, which are made for the 2008 through 2012 period, are weaker or stronger in the pre-2008 period represents an
interesting avenue for future research. We would be happy to share our founder data to facilitate research on this matter (please
contact the corresponding author).
11
it is truly overconfidence that is causing the observed differences in firm behavior and
performance.5
Each of our proxies has its own strengths, weaknesses, and differentiating features: (a)
CEO tweets can be work-related (e.g., “Earnings call. T- 1 hr away. I enjoy taking a step back
from the day to day and reflecting on all we have accomplished over the past qtr,” a tweet sent by
John Heyman, former CEO of Radiant Systems, on 10/29/2009). However, they can also reflect
personal moods and views with no direct bearing on a CEO’s organization (e.g., “About to land in
CT. Time to switch from global econ and hyper-development to legalized pot, Sunday booze and a
debate on min wage. Oh well,” a tweet sent by Mark T. Bertolini, current CEO of Aetna, on
3/20/2012).
As such, CEO tweets likely capture how CEOs feel about their businesses; they also
capture how they feel about their lives generally. How CEOs feel about their lives can, in turn,
indirectly, yet importantly, affect a firm’s investment and financing decisions (e.g., Cain and
McKeon, 2014; Chyz, 2013; Cronqvist, Makhija, and Yonker, 2012). CEO tweets also provide a
relatively uncensored and, consequently, clean picture of a CEO’s personal traits. These features
are not shared by the other three proxies. In that regard, CEO tweets provide the most complete
picture of a CEO’s personal level of confidence.
(b) Compared with CEO tweets, CEO statements made during earnings conference calls
are more likely to be prepared/well-reflected upon. They are also likely to be influenced by other
parties such as an auditor and an investor relations firm.
5 Our paper also differs from Busenitz and Barney (1997) and Forbes (2005) by using a secondary data approach rather than a
survey approach. Our secondary data approach has the advantage of utilizing data that are systematically available, which renders
our measures attractive for use in future studies. Furthermore, our measures are likely to capture both the more obvious and the
more subconscious/spontaneous forms of overconfidence, which are difficult to capture in survey responses.
12
(c) Management earnings forecasts are also well-reflected upon and reflect a more
conscious form of confidence that is directly pertinent to a given firm. They are also made in
conjunction with other parties and allow us to capture the degree to which CEO overconfidence
persists within a group and translates into actual firm behavior. The appealing feature of
management earnings forecasts is that a clear benchmark exists, namely, actual earnings, against
which management’s reported earnings forecast can be compared.
(d) Overconfidence inferred via CEO option-exercise behavior reflects personal
confidence that is directly pertinent to a firm. Given that option-exercise behavior has important
implications for a CEO’s personal wealth, it is likely well-reflected upon. An important restriction
is that the decision to exercise an option is co-determined by a host of factors such as tax and
liquidity considerations (i.e., how much cash a CEO needs at hand), which are difficult to fully
control for (e.g., Malmendier and Tate, 2005).
We now detail our data collection efforts and our variable construction for each of our four
proxies for overconfidence.
CEO tweets. Twitter is a social media outlet that allows a user to post short messages with a
maximum of 140 characters to his/her network of followers. These short messages are referred to
as microblogs or, more commonly, as “tweets.”
We start with the complete list of CEOs that are in the Execucomp database6 (as of the time
of the download)7 and locate users with active Twitter accounts that have the same first and last
names as the CEOs in question. We then cross-check each executive’s middle name, gender, and
company information with the user characteristics associated with the Twitter account; we also
6 The Execucomp database compiles information on the compensation packages of all S&P 1500 executives from the corresponding
firms’ annual financial statements. 7 Time of download: February 2014.
13
read the tweets in an attempt to determine whether any account that we find indeed belongs to the
executive in question. We separate out Twitter accounts that are managed by firms. The first tweet
from an S&P 1500 CEO’s personal Twitter account was sent in April 2008, which marks the
beginning of our Twitter sample period. Our sample ends in December 2012. After adding our
control variables, our final sample for the CEO tweets analysis contains 71 CEOs from 71 firms.
To capture confidence, we build on prior literature, which suggests that the frequency of
negative words used in a text captures the tone of the text (e.g., Das and Chen, 2007; Loughran
and McDonald, 2011; Tetlock, 2007). Any neutral text should contain a baseline number of
negative words. Writers who are pessimistic should use a greater number of negative words.
Writers who are optimistic and overconfident should avoid negative language. We use the negative
words list compiled by Loughran and McDonald (2011), which they designed specifically for use
in management and economics studies.8
Our first measure of CEO confidence is a continuous variable that equals the average
fraction of negative words used across all tweets posted by a given CEO in a day, Neg. Tweets.
The observations are on the CEO/firm-day level. A lack of negative words indicates that the CEO
is confident. Therefore, the lower the value for Neg. Tweets is, the more confident we deem the
CEO to be.
Earnings conference calls. Our second measure of CEO overconfidence is similar to the first
measure, but we now compute the fraction of negative words across CEO statements made during
conference calls in which they discuss their firms’ quarterly earnings. Processing all quarterly
earnings conference calls for all S&P 1500 firms is very costly. We therefore construct a random
subsample via stratified random sampling of all S&P 1500 firms over our 2008–2012 sample
8 The full word list can be seen here: http://www.nd.edu/~mcdonald/Word_Lists.html.
14
period based on industry with a sampling fraction of 10%. We download the quarterly earnings
conference call transcripts for each firm in our subsample from the CQ FD disclosure database
over our 2008–2012 sample period. In total, we have 160 CEOs from 133 firms with transcript
data and with the data to construct the controls used in our regression analysis.
Our second measure of CEO overconfidence is a continuous variable that equals the
fraction of negative words used by a given CEO during the conference call discussing quarterly
earnings, Neg. Calls. The observations are on the CEO/firm-month level. Again, the lower the
value of Neg. Calls is, the more confident we deem the CEO to be.
Management earnings forecasts. Management sometimes issues predictions for firms’ upcoming
earnings announcements, and both investors and sell-side analysts pay close attention to such
management earnings forecasts (Baginski and Hassell, 1990; Pownall, Wasley, and Waymire,
1993). Management earnings forecasts have been found to be “pessimistic,” as the vast majority
of actual earnings are above management earnings forecasts, and it has been argued that this bias
arises from management’s desire to lower earnings expectations prior to earnings announcements
in order to reduce the likelihood of negative earnings surprises (e.g., Bergman and Roychowdhury,
2008; Matsumoto, 2002).
Given that managers have an incentive to issue earnings forecasts that are low (relative to
their true expectations), the degree to which issued earnings forecasts are above actual earnings
provides information about management’s overconfidence level.
The backbone of our analysis is the FirstCall database, which compiles data on
management earnings forecasts. Our third measure of CEO overconfidence, Misguidance, is a
continuous variable that equals the difference between forecasted quarterly earnings-per-share
(EPS) and actual quarterly EPS, scaled by lagged price-per-share. The observations are on the
15
CEO/firm-month level. Our final sample contains 714 CEOs from all 652 S&P 1500 firms that
provide earnings guidance during our 2008—2012 sample period as per the FirstCall database.
CEO options. Our final measure of CEO overconfidence draws on CEOs’ option-exercise
behavior. CEOs receive a substantial portion of their pay in the form of call options. Given that a
substantial portion of CEOs’ human and financial capital is tied to the firms for which they work,
it is generally optimal for CEOs to exercise their exercisable in-the-money options as soon as
possible and to exchange them for cash, which is then no longer tied to the success or failure of
the firm in question (e.g., Hall and Murphy, 2002; Lambert, Larcker, and Verrecchia, 1991). A
CEO who delays the exercise of his/her options is likely overly optimistic and overconfident about
the firm’s prospects (e.g., Li, 2008; Malmendier and Tate, 2005; Malmendier and Tate, 2008;
Schrand and Zechman, 2012).
Our data source for this variable is the Execucomp database. We follow Dezsö and Ross
(2012) and construct the natural log transformation of the ratio of a given CEO’s vested in-the-
money option value to the CEO’s total compensation value (all by fiscal year), Options.9 The
observations are on the CEO/firm-year level. In total, we have 1,392 CEOs from all 1,238 S&P
1500 firms that have the data to perform our regression analysis over our 2008—2012 sample
period.
9 Specifically, we use Execucomp’s TDC1 field. Using TCC, which is a variant of total compensation, does not alter our findings.
In untabulated analyses, we follow Schrand and Zechman (2012) and we compute, for each firm-year, the natural logarithm of the
value of each CEO’s unexercised in-the-money options. If the natural logarithm is above the 3-digit industry median, the CEO is
deemed to be overconfident; otherwise, the CEO is deemed to be not overconfident. We find that the results are very similar to
those presented in this study (the results are available upon request).
16
Independent variable: founder CEO versus professional CEO
To determine whether a CEO is the founder or co-founder of a company, we utilize public
information from multiple sources. First, we check the company’s official website and SEC filings
to determine whether it provides information on the company’s founder or co-founders. Second,
we conduct a Google search by using the company name plus the word “founder” to determine
whether Google has compiled a list of founders/co-founders for the company in question. Third,
we seek out the CEO’s profile page on Bloomberg Businessweek, Forbes, and Wikipedia. In many
cases, we also search for the company’s profile page on these websites to double-check the validity
of the information that we obtain. Our main explanatory variable, Founder CEO, equals one for
founder CEOs and zero for professional CEOs.
In our regression analyses using Twitter data, we find that 22 out of 71 CEOs are founder
CEOs. In our regression analyses using conference call data, we find that 15 out of 160 CEOs are
founder CEOs. In our regression analyses using management earnings forecasts, we find that 90
out of 714 CEOs are founder CEOs. Finally, in our regression analyses using CEO options data,
we find that 159 out of 1,392 CEOs are founder CEOs.
CEO-specific control variables
Building on prior literature on managerial overconfidence, we include a number of CEO-specific
and firm-specific control variables (e.g., Galasso and Simcoe, 2011; Hayward and Hambrick,
1997; Hirshleifer et al., 2012; Hribar and Yang, 2013; Malmendier and Tate, 2005; Malmendier
and Tate, 2008). CEO Age denotes the age of the focal CEO at the time of the explained variable’s
measurement. CEO Tenure is the number of years the executive has been the CEO of the focal
firm. Male equals one if the CEO is male and zero otherwise.
17
One concern pertinent to our option-exercise analysis is that CEO wealth is correlated with
both CEO options-exercise behavior and whether the CEO is a founder or not. To address this
omitted variable concern, we construct CEO Wealth, which denotes the wealth of a given CEO at
the time of the explained variable’s measurement. We follow Dittmann and Maug (2007) and turn
to the Execucomp database, which tracks all executives of S&P 1500 firms and the compensations
they receive starting in 1992. To estimate a CEO’s wealth at a given point in time, we take his/her
stock holdings and cumulate all historical compensation-related cash inflows received up to that
point in time (adjusted for taxes) and we assume that the rate of return the CEO earned on his/her
previously received cash inflows is that of a typical savings account.10
Firm-specific control variables
We use data on financial statements, financial markets, financial analysts, and institutional
holdings from COMPUSTAT, CRSP, IBES, and Thomson Reuters, respectively, to construct the
following firm-specific control variables: Log(Size), Log(Market-to-Book), Monthly Volatility,
Institutional Holdings, Log(Price), Earnings Surprise, Past Stock Market Performance and ROA.
Size is the market value of a firm’s equity as of the month prior to the month of the
explained variable’s measurement. Market-to-book is the market value of a firm’s assets divided
by the book value of its assets, measured as of the most recent fiscal year end. Monthly Volatility
is the standard deviation of a firm’s daily stock return in the month prior to the month of the
explained variable’s measurement. Institutional Holdings is the fraction of a firm’s shares held by
institutional investors, measured as of the most recent calendar-quarter end. Price is a firm’s share
price as of the month prior to the month of the explained variable’s measurement.
10 Specifically, a CEO’s cash inflow in a given year is the sum of his/her salary, bonus, and other compensation net of taxes, plus
the value of stock awards, minus taxes on stocks that become unrestricted, plus the value realized from exercising options, minus
the value of any change in the CEO’s stock holdings, plus dividend payouts net of taxes. Please see Dittmann and Maug (2007) for
more details.
18
Earnings Surprise is the difference between the most recent reported quarterly EPS and the
corresponding consensus forecast (both from IBES), scaled by the lagged price-per-share. For the
CEO tweets analysis, which is conducted at the firm-day level, this variable is set to zero when no
earnings announcement is made at the time of the tweet; for the CEO tweets analysis, we also
include I(Earnings Announcement), denoting whether an earnings announcement was made to
differentiate between no earnings announcement and an earnings announcement where the
earnings surprise was truly zero.
Past Stock Market Performance is the cumulative abnormal stock market performance over
the previous quarter. For the CEO-options analysis, which is conducted at the firm-year level, Past
Stock Market Performance is the cumulative abnormal stock market performance over the
previous year. We compute abnormal stock market performance as the difference between raw
stock returns and stock returns on a value-weighted portfolio of similar-size firms with similar
book-to-market ratios and past returns (Daniel et al., 1997). ROA is a firm’s net income as of the
most recent fiscal year end, divided by the lagged book value of its assets.
RESULTS
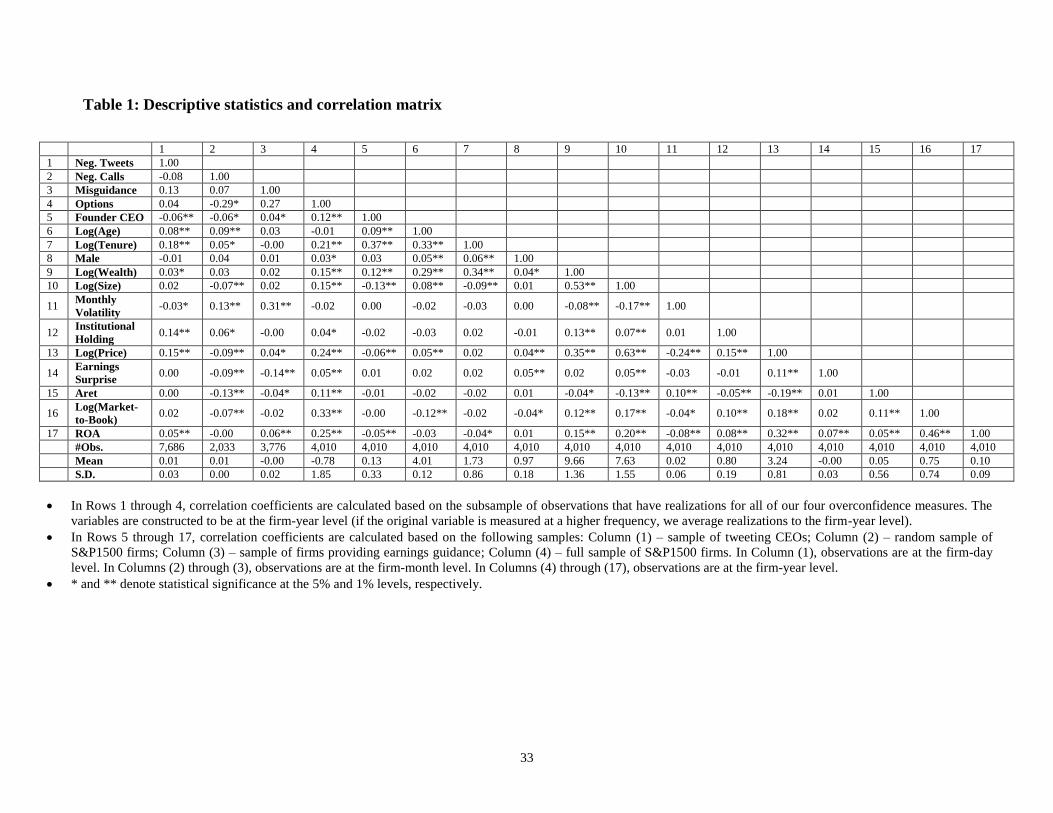
Table 1 reports a correlation matrix and descriptive statistics for our sample. Perhaps the most
revealing figure from Table 1 is that 13% of the firms in our sample are managed by founder
CEOs, further cementing the view that founder-managed firms are an economically important
component of the U.S. economy.
While our sample includes multiple observations per firm, because founder CEO status is
essentially time-invariant at the firm level, a firm fixed effects model is not suitable for our
19
purposes.11 Specifically, we find that, in our sample, there is only one instance in which a firm is
initially managed by a professional CEO after which the founder CEO returns and replaces the
professional CEO. Conversely, in our Twitter sample no founder-CEO-managed firm is
subsequently managed by a professional CEO. In our conference call, earnings forecast, and
options samples, of the firms that are founder-CEO managed, only 2, 7, and 18 firms, respectively,
experience a replacement by a professional CEO.
In our analyses, we therefore estimate random effects Generalized Least Square (GLS)
models with clustered standard errors. These models are robust to first-order autoregressive
disturbances within unbalanced panels and to cross-sectional correlation and heteroskedasticity
across panels (Baltagi, 2008).
Table 2 presents the results from our main regression equation:
(1) Yi,t = α + β Founder CEOi + Xδ + εi,t.
The dependent variable, Yi,t , is one of our four measures of overconfidence: Neg. Tweets, Neg.
Calls, Misguidance, and Options. Our key independent variable is Founder CEO, which equals
one for founder CEOs and zero for professional CEOs. Following prior studies on managerial
overconfidence, we include various controls (X), all of which are described above. X also contains
year-month fixed effects for regressions based on Neg. Tweets, Neg. Calls, and Misguidance, and
year fixed effects for the regression based on Options.
The regression results show when the dependent variable is Neg. Tweets, the coefficient
estimate for Founder CEO equals -0.011 (p-value < 0.01). When the dependent variable is Neg.
11 Fixed-effect estimation requires significant within-panel variation of the variable values to produce consistent and efficient
estimates (Wooldridge, 2002). While founder CEO status is essentially time-invariant at the firm level, we do find two founder
CEOs who later become executives at firms managed by professional CEOs. We observe no significant change in their option-
exercise behavior, suggesting that their level of overconfidence is person-specific rather than firm-specific and that what we are
capturing is a person-specific trait rather than a firm-level characteristic. Unfortunately, our sample is extremely small and we are
unable to draw strong inferences.
20
Calls, the coefficient estimate for Founder CEO equals -0.001 (p-value < 0.01). These estimates
suggest that founder CEOs use fewer negative words than professional CEOs and that these
differences can be explained neither by CEO or firm characteristics (other than founder status) nor
by measures of firm performance.
To put these coefficient estimates in perspective, our regression analysis indicates that, all
else remaining equal, the fraction of negative words used by founder CEOs is 1.08% lower than
that of professional CEOs. Specifically, the fraction of negative words used by professional CEOs
is 1.32% whereas that of founder CEOs is 0.24%. Given that the average tweet of a professional
CEO (founder CEO) contains 15.8 (15.6) words, these numbers imply that, across 1,000 tweets,
professional CEOs use 208 negative words whereas founder CEOs only use 37 negative words.
Correspondingly, our regression on the earnings conference call sample indicates that, all
else remaining equal, the difference in the fraction of negative words used by professional CEOs
versus founder CEOs is 0.13% (1.60% versus 1.47%). Given that the average professional CEO’s
(founder CEO’s) earnings conference call statement contains 3,491 (3,102) words, our regression
analysis indicates that, in a given earnings conference call, professional CEOs use 56 negative
words whereas founder CEOs only use 46 negative words. The difference in the use of negative
words is smaller (yet still economically meaningful) for earnings conference calls than for tweets.
One potential explanation is that the former is more likely to be scripted/well-reflected upon as
well as influenced by other parties such as an auditor or an investor relations company. Tweets
therefore provide a more powerful measure of the corresponding CEO’s behavioral traits.
Both Neg. Tweets and Neg. Calls are expressed in fractions and, as a result, may suffer
from zero inflation. In untabulated analyses, we assess the robustness of our findings to zero
inflation by estimating fractional response regression models (Papke and Wooldridge, 1996). In
short, our results are robust to this model specification (the results are available upon request).
21
In the interest of symmetry, we also experiment with the fraction of positive words. Prior
literature finds little value in positive word lists (e.g., Engelberg, 2008; Kothari, Li, and Short,
2008; Loughran and McDonald, 2011; Tetlock, 2007) because the use of positive words in the
English language is highly nuanced and parsing programs, which rely on simple word lists, are
unable to differentiate statements such as “we are profitable” [positive] from statements such as
“we could be more profitable” [negative]. Negative words such as “delayed” or “discredited” have
a much more pervasive effect as, irrespective of the sentence structure, these words generally
convey negative sentiments (“we are delayed” versus “we could be more delayed”.)
As negated positive words are frequently used as euphemisms for bad states (e.g., “not
good” in lieu of “bad”), we do not count positive words that are negated; negation is defined as an
occurrence of one of six words (no, not, none, neither, never, nobody) within three words preceding
a positive word (Loughran and McDonald, 2011). Pos. Tweets and Pos. Calls then are the fractions
of non-negated positive words in CEO tweets and CEO statements made during earnings
conference calls, respectively. In short and in a way consistent with prior literature, we find no
reliable difference in the use of positive words between founder CEOs and professional CEOs.
Table 2 also reports results for the earnings-guidance and the options-exercise analyses.
We find that when the dependent variable is Misguidance, the coefficient estimate for Founder
CEO equals 0.003 (p-value < 0.05). The average Misguidance in our sample is -0.001. That is,
consistent with prior literature, the average management earnings forecast is too “pessimistic” and
is generally beaten by actual earnings. Our regression analysis suggests that, all else remaining
equal, the price-scaled quarterly EPS forecast issued by founder CEOs is 0.003 higher than that of
professional CEOs, which is economically meaningful. When the dependent variable is Options,
the coefficient estimate for Founder CEO equals 0.470 (p-value < 0.01), which suggests that the
ratio of the value of a CEO’s vested in-the-money options to his/her total compensation is, on
22
average, 47.0% higher for founder CEOs than for professional CEOs. Given that the average ratio
in our sample is 45.8%, the difference of 47.0% is substantial.12
Overall, our results are consistent with the hypothesis that, all else remaining equal,
founder CEOs are more overconfident than professional CEOs. The implied differences in
overconfidence between founder CEOs and professional CEOs are statistically significant and
economically meaningful.
***** Insert Tables 1 and 2 about here *****
ADDITIONAL ANALYSES
Option-exercise behavior of executives working at founder firms
Our analysis raises the question of whether the overconfidence level of other executives in founder-
CEO-managed firms is similarly high. For convenience, we hereafter refer to “non-CEO
executives” as “executives” and to “founder-CEO-managed firms” as “founder firms.”
On the one hand, executives in founder firms have been part of their firms’ (and founders’)
success stories and have beaten extreme odds working alongside founder CEOs. Furthermore, it
seems reasonable to expect that founder CEOs hire executives who share a similar level of what
we are measuring as overconfidence. Viewed from this angle, executives in founder firms may be
just as overconfident as founder CEOs.
On the other hand, executives in founder firms are perhaps more accurately described as
“mid-stage employees” and, thus, are more likely to exhibit traits typical of professional employees
than those of entrepreneurs. Also, unlike founder CEOs, executives in founder firms likely receive
little praise from the media. To examine this question, we compare the overconfidence level of
12 To check whether our results are driven by outliers of the Options variable, we compare the Options variable’s distribution across
founder CEOs and professional CEOs. We find that our main results are due to a shift in distribution, not outliers. This pattern
holds when we match each founder CEO observation with a professional CEO observation based on CEO characteristics, such as
CEO tenure. We also run a sub-sample regression analysis by dropping “outliers” (observations that are above and below two
standard deviations of the mean) and we still find support for our hypothesis. All results are available upon request.
23
founder CEOs with that of executives in founder firms. We also conduct comparisons with
professional CEOs and executives in non-founder firms.
The number of executives working at founder firms in which founder CEOs have active
Twitter accounts and the executives themselves also tweet actively is very small. Executives other
than CFOs rarely speak up during earnings conference calls. Management earnings forecasts are
issued at the firm level. Given these various data constraints, we conduct our additional test using
options data only. Specifically, we extend our options dataset to include all CEOs and executives
working for S&P 1500 firms over our 2008–2012 sample period. Our sample contains 8,026 CEOs
and executives working for 1,238 firms. We create two categorical variables in addition to Founder
CEO: Founder-Firm-Exec, which equals one for executives of founder firms and zero otherwise;
and Professional-Firm-Exec, which equals one for executives of professional-CEO-managed firms
and zero otherwise. The baseline category is that of professional CEOs. Otherwise, the regression
equation is very similar to equation (1), but we now no longer control for executive tenure since
there are few data available indicating when non-CEO executives join their firms.
Table 3 reports our findings. Model 1 includes all CEOs and executives working for S&P
1500 firms. The coefficient estimate for Founder CEO is 0.674 (p-value <0.01), confirming our
main prediction that founder CEOs are more overconfident than professional CEOs. The
coefficient estimate for Founder-Firm-Exec is positive but insignificant. The coefficient estimate
for Professional-Firm-Exec is -0.173 (p-value <0.01).
When we perform a Wald test, we find that the coefficient estimate for Founder CEO is
significantly greater than that for Founder-Firm-Exec, suggesting that founder CEOs are more
overconfident than executives working at founder firms, a finding that is confirmed by Model 2,
with which we conduct a subsample analysis using founder firms only. At the same time, a Wald
test comparing the estimate for Founder-Firm-Exec with that on Professional-Firm-Exec reveals
24
that executives working at founder firms are more overconfident than executives working at non-
founder firms. This result is in line with the intuition outlined above that some executives have
been part of success stories working alongside founder CEOs and that founder CEOs, through
homophily, attract like-minded kinds. In the end, our “overconfidence ranking” is as follows:
Founder CEOs >> executives working at founder firms ≈ professional CEOs >> executives
working at firms managed by professional CEOs, whereby “>>” denotes differences that are
statistically significant at the 1% level.13
***** Insert Table 3 about here *****
We are mindful of the possibility that our options-based results suffer from omitted variable
bias in the sense that founder CEOs and their executives hold on to “too many” options simply
because they have more positive inside information. Malmendier and Tate (2005) examine the
possibility that their options-based measure of overconfidence proxies for positive inside
information. They point to the fact that, in the data, options-based overconfidence is very persistent.
Positive information that is not yet reflected in stock prices, on the other hand, should be transitory.
Malmendier and Tate also find that their options-based measure does not predict performance.
Motivated by Malmendier and Tate (2005), we estimate a regression of a firm’s one-year
stock return on lagged values of Options, past one-year stock-market performance, past book-to-
market ratio, and market capitalization, the latter three of which have been found to capture most
of the variation in average stock returns (Daniel et al., 1997; Fama and French, 1992).14 The
13 Some of the executives in our sample may have founded or co-founded their own firms at some point in their careers. Comparing
the overconfidence level of founder executives with that of founder CEOs should prove to be an interesting avenue for future
research. 14 Our relatively short sample period of five years (and the associated lack of power) complicates the assessment of whether Options
is persistent in our sample. Given that Malmendier and Tate (2005) provide strong evidence of the persistence of their options-
based measure, our measure, which is similar to theirs, is likely to be persistent as well.
25
estimate for Options is -0.013 (p-value < 0.10). That is, high overconfidence weakly predicts more
negative stock returns, which contrasts with the positive inside information view.
Entrepreneurial optimism discount
The results of our previous analysis suggest that founder CEOs’ tweets are more clouded by
overconfidence and perhaps more biased and less informative than professional CEOs’ tweets. We
thus may expect the association between the tone of CEOs’ tweets and their firms’ future stock
market performance to be weaker for founder CEOs than for professional CEOs, as investors
discount founder-CEO tweets.
To assess the possibility of an “entrepreneurial optimism discount,” in our final analysis
we test for differences in investor responses between founder CEOs and professional CEOs. We
follow Chen, Hwang, and Liu (2014), who test how CEO Twitter accounts affect the underlying
firms (in terms of a firm’s ability to connect with customers and investors), and estimate the
following regression equation:
(2) AReti,t+2 = α + β Neg. Tweetsi,t +Xδ + εi,t.
AReti,t+2 is a measure of abnormal stock market performance, where i indexes firms and t denotes
the day on which tweets are posted. Abnormal returns are the difference between raw returns minus
returns on a value-weighted portfolio of firms that are similar in size, and have similar book-to-
market ratios and past returns (Daniel et al., 1997). By testing whether the tone of tweets predicts
future stock market performance, rather than contemporaneously correlating with stock prices, we
follow the approach used in the literature (Tetlock et al., 2008, p.1452).
To keep information transmitted through tweets distinct from news announcements and
investor opinions on social media, we control for information transmitted through a major news
aggregator and a financial opinion aggregator, respectively: Dow Jones News Service (DJNS) and
26
Seeking Alpha (SA). Neg. DJNS and Neg. SA are the average fractions of negative words across
all articles published in the DJNS and SA about a given company. Neg. SA-Comment is the average
fraction of negative words across SA comments posted over days t through t+1 in response to the
SA articles. I(DJNS), I(SA), and I(SA-Comment) are indicator variables denoting whether there
were articles published in the DJNS and SA, and whether there were any comments posted in
response to SA articles. Upgrade and Downgrade reflect recommendation upgrades/downgrades
for the focal company from the IBES recommendation file. Other control variables are as before.
Table 4 reports our findings. The coefficient estimate for Neg. Tweets is -0.015 (p-value <
0.05), suggesting that future abnormal returns are approximately 0.05% lower when the fraction
of negative words in tweets is one standard deviation higher. Thus, investors do appear to react to
CEOs’ tweets and, specifically, to the tone of their tweets. When we include Founder CEO and
Neg. Tweets * Founder CEO as additional independent variables, the coefficient estimate for
Founder CEO is 0.001 (p-value > 0.10) and the coefficient estimate for the interaction terms is -
0.016 (p-value > 0.10). These results suggest that investors are unaware of any incremental bias in
founder-CEO tweets.
***** Insert Table 4 about here *****
DISCUSSION AND CONCLUSION
In this study we theorize that founder CEOs are more overconfident than their professional
counterparts. We find support for our arguments using the following four proxies for
overconfidence: (a) tone of CEO tweets, (b) tone of CEO statements made during earnings
conference calls, (c) management earnings forecasts, and (d) the extent to which a CEO exercises
his/her exercisable in-the-money options.
Specifically, we find that founder CEOs use substantially fewer negative words than
professional CEOs. This pattern is observed for CEOs’ (a) personal tweets and (b) statements made
27
during earnings conference calls. We also find that (c) founder CEOs tend to provide more
optimistic earnings forecasts. Finally, in our analysis of CEO option-exercise behavior, we find
that (d) founder CEOs are much more likely to hold on to an unreasonably high number of options
than professional CEOs.
In a separate test, we provide evidence that founder CEOs are more overconfident than
other executives working at their own firms. In addition, we find that executives working at
founder firms are more overconfident than executives working at non-founder firms, suggesting
that the overconfidence level of founder CEOs spills over to key employees. The spillover effect
could be due to key employees’ becoming overconfident as they (together with founder CEOs)
successfully turn their start-ups into large publicly traded companies or because CEOs attract like-
minded kinds.
Finally, we provide evidence that, to date, investors are unaware of overconfidence bias
among founders and that, instead, they take founder CEOs’ statements at face value, suggesting
that an entrepreneurial optimism discount does not exist in the stock market.
Our study makes several contributions to the management and finance literature. Founder-
managed firms comprise an economically substantial component of the economy and a large body
of research has begun to compare the behavior and performance of those managed by founder
CEOs with those of firms managed by professional CEOs (e.g., Certo et al., 2001; Fahlenbrach,
2009; Jayaraman et al., 2000; Nelson, 2003; Villalonga and Amit, 2006). While this literature
documents several statistically robust differences, we know relatively little about the source that
generates the aforementioned differences. We identify one key characteristic along which captains
of the largest and, economically speaking, most significant organizations differ, and, by doing so,
provide an economic explanation for the observed differences in behavior and performance.

28
Second, we add to the literature on managerial overconfidence (e.g., Galasso and Simcoe,
2011; Hayward and Hambrick, 1997; Malmendier and Tate, 2005, 2008; Roll, 1986), which builds
on the notion that some CEOs are more overconfident than others and utilizes this variation in
overconfidence to study how more (or less) overconfidence translates into varying firm outcomes.
Our results suggest that differences in overconfidence can be traced, at least partially, to
differences in CEO type, i.e., whether a CEO is a founder or a professional.
Third, we contribute to the emerging literature on an entrepreneurial optimism discount
(e.g., Certo et al., 2001; Dushnitsky, 2010). Several studies argue that sophisticated investors (e.g.,
investment bankers, venture capitalists) are likely to be aware of an entrepreneurial optimism bias
and discount entrepreneurs’ intentions and their corresponding firms’ market value
correspondingly. We test this conjecture by studying the market’s reaction to founder CEOs’
tweets and professional CEOs’ tweets. We observe no meaningful difference in market reaction to
founder CEOs’ tweets and professional CEOs’ tweets, suggesting that, in the stock market,
investors do not recognize the stronger bias in founder-CEO tweets.
On the methodological front, we point out that overconfidence at the CEO level is not a
sufficient condition for explaining firm behavior. We propose a set of measures, which, when used
jointly, capture overconfidence at the personal and group levels and can help assess the robustness
and validity of the interpretation. In a related contribution, we propose a novel setting—CEO
tweets—in which to infer CEO characteristics. We argue that CEO tweets exhibit features
(unfiltered, personal, and spontaneous), which are unique and make them attractive for use in
future studies, whether on overconfidence or some other personal trait.15
15 In an attempt to facilitate research on this matter, in our Online Appendix (posted on bhwang.com), we make available the full
list of CEOs with personal Twitter accounts so that interested readers may easily download and process these tweets.
29
Our findings have practical implications for firm stakeholders, including investors,
employees, suppliers, and customers, as well as for boards of directors. Our results point to
differences in overconfidence by CEO type and investors may decide to discount or surcharge their
opinions and predictions accordingly. This is not to say that investors should
always/unconditionally discount the value of founder-managed firms, as founders’ overconfidence
may also have positive effects (Navis and Ozbek, 2015). We merely note the possibility that,
compared with professional managers, founder CEOs make faster (but less comprehensive) and
riskier (but potentially more rewarding) decisions, and they create unrealistic (but perhaps
motivating) goals for employees and other stakeholders.
For members of boards of directors, our study suggests that when board members decide
whether to replace a founder CEO with a professional CEO, they should consider differences in
behavioral traits. Hiring a professional CEO brings new knowledge, routines, networks, and other
resources to a firm but also changes the level of optimism in the firm, which may have a substantial
impact on both the firm’s strategy and employees’ morale.
ACKNOWLEDGEMENTS
We thank the associate editor James Westphal, two anonymous referees, Gary Dushnitsky, Yeejin
Jang, Fabrice Lumineau, Chad Navis, Yongwook (Yong) Paik, Michael Roach and Scott Yonker
for their helpful comments, as well as Jinhee Kim, Jayoung Myoung, and Steve Sibley for their
help in putting together our earnings conference call data.
30
REFERENCES
Baginski SP, Hassell JM. 1990. The market interpretation of management earnings forecasts as a predictor of subsequent financial analyst forecast revision. Accounting Review: 175-190. Baltagi B. 2008. Econometric analysis of panel data. John Wiley & Sons Barber BM, Odean T. 2001. Boys will be boys: Gender, overconfidence, and common stock investment. Quarterly journal of Economics: 261-292. Bazerman M, Moore DA. 2012. Judgment in managerial decision making. Bergman NK, Roychowdhury S. 2008. Investor sentiment and corporate disclosure. Journal of Accounting Research 46(5): 1057-1083. Boeker W, Fleming B. 2010. Parent firm effects on founder turnover: parent success, founder legitimacy, and founder tenure. Strategic Entrepreneurship Journal 4(3): 252-267. Boeker W, Karichalil R. 2002. Entrepreneurial transitions: Factors influencing founder departure. Academy of Management Journal 45(4): 818-826. Boeker W, Wiltbank R. 2005. New venture evolution and managerial capabilities. Organization Science 16(2): 123-133. Brockhaus RH, Howtz P. 1982. The psychology of the entrepreneur. CA Kent, DL Sexton, and KG Vesper, eds. The Encyclopedia of Entrepre-neurship. Prentice Hall, Englewood Cliffs, NJ Busenitz LW, Barney JB. 1997. Differences between entrepreneurs and managers in large organizations: Biases and heuristics in strategic decision-making. Journal of business venturing 12(1): 9-30. Cain MD, McKeon SB. 2014. CEO personal risk-taking and corporate policies. Journal of Financial and Quantitative Analysis (JFQA), Forthcoming Camerer C, Lovallo D. 1999. Overconfidence and excess entry: An experimental approach. American economic review: 306-318. Cassar G. 2010. Are individuals entering self‐employment overly optimistic? an empirical test of plans and projections on nascent entrepreneur expectations. Strategic Management Journal 31(8): 822-840. Certo ST, Covin JG, Daily CM, Dalton DR. 2001. Wealth and the effects of founder management among IPO‐stage new ventures. Strategic Management Journal 22(6‐7): 641-658. Chatterji AK. 2009. Spawned with a silver spoon? Entrepreneurial performance and innovation in the medical device industry. Strategic Management Journal 30(2): 185. Chen H, Hwang B, Liu B. 2014. The economic consequences of having ‘social’ executives. . SSRN eLibrary Chyz JA. 2013. Personally tax aggressive executives and corporate tax sheltering. Journal of Accounting and Economics 56(2): 311-328. Cooper AC, Woo CY, Dunkelberg WC. 1988. Entrepreneurs' perceived chances for success. Journal of business venturing 3(2): 97-108. Cronqvist H, Makhija AK, Yonker SE. 2012. Behavioral consistency in corporate finance: CEO personal and corporate leverage. Journal of financial economics 103(1): 20-40. Daniel K, Grinblatt M, Titman S, Wermers R. 1997. Measuring mutual fund performance with characteristic‐based benchmarks. The Journal of finance 52(3): 1035-1058. Das SR, Chen MY. 2007. Yahoo! for Amazon: Sentiment extraction from small talk on the web. Management Science 53(9): 1375-1388. De Meza D, Southey C. 1996. The borrower's curse: optimism, finance and entrepreneurship. The Economic Journal: 375-386. Dezsö CL, Ross DG. 2012. Does female representation in top management improve firm performance? A panel data investigation. Strategic Management Journal 33(9): 1072-1089. Dittmann I, Maug E. 2007. Lower salaries and no options? On the optimal structure of executive pay. The Journal of Finance 62(1): 303-343. Dushnitsky G. 2010. Entrepreneurial optimism in the market for technological inventions. Organization Science 21(1): 150-167.
31
Engelberg J. 2008. Costly information processing: Evidence from earnings announcements, AFA 2009 San Francisco Meetings Paper: Fahlenbrach R. 2009. Founder-CEOs, investment decisions, and stock market performance. Journal of Financial and Quantitative Analysis 44(02): 439-466. Fama EF, French KR. 1992. The cross‐section of expected stock returns. the Journal of Finance 47(2): 427-465. Forbes DP. 2005. Are some entrepreneurs more overconfident than others? Journal of Business Venturing 20(5): 623-640. Fraser S, Greene FJ. 2006. The effects of experience on entrepreneurial optimism and uncertainty. Economica 73(290): 169-192. Galasso A, Simcoe TS. 2011. CEO overconfidence and innovation. Management Science 57(8): 1469-1484. Hall BJ, Murphy KJ. 2002. Stock options for undiversified executives. Journal of accounting and economics 33(1): 3-42. Hambrick DC, Crozier LM. 1986. Stumblers and stars in the management of rapid growth. Journal of Business Venturing 1(1): 31-45. Hayes RH, Abernathy WJ. 1980. Managing our way to economic decline. Harvard Bus. Rev.;(United States) 58(4) Hayward ML, Hambrick DC. 1997. Explaining the premiums paid for large acquisitions: Evidence of CEO hubris. Administrative Science Quarterly: 103-127. Hayward ML, Shepherd DA, Griffin D. 2006. A hubris theory of entrepreneurship. Management Science 52(2): 160-172. Hiller NJ, Hambrick DC. 2005. Conceptualizing executive hubris: the role of (hyper‐) core self‐evaluations in strategic decision‐making. Strategic Management Journal 26(4): 297-319. Hirshleifer D, Low A, Teoh SH. 2012. Are overconfident CEOs better innovators? The Journal of Finance 67(4): 1457-1498. Hmieleski KM, Baron RA. 2009. Entrepreneurs' optimism and new venture performance: A social cognitive perspective. Academy of management Journal 52(3): 473-488. Hribar P, Yang H. 2013. CEO overconfidence and management forecasting. Available at SSRN 929731 Jain BA, Tabak F. 2008. Factors influencing the choice between founder versus non-founder CEOs for IPO firms. Journal of Business Venturing 23(1): 21-45. Jayaraman N, Khorana A, Nelling E, Covin J. 2000. CEO founder status and firm financial performance. Strategic Management Journal 21(12): 1215-1224. Kahneman D, Lovallo D. 1993. Timid choices and bold forecasts: A cognitive perspective on risk taking. Management science 39(1): 17-31. Koellinger P, Minniti M, Schade C. 2007. “I think I can, I think I can”: Overconfidence and entrepreneurial behavior. Journal of Economic Psychology 28(4): 502-527. Kothari S, Li X, Short JE. 2008. The effect of disclosures by management, analysts, and financial press on cost of capital, return volatility, and analyst forecasts: A study using content analysis. Lambert RA, Larcker DF, Verrecchia RE. 1991. Portfolio considerations in valuing executive compensation. Journal of Accounting Research: 129-149. Landier A, Thesmar D. 2009. Financial contracting with optimistic entrepreneurs. Review of financial studies 22(1): 117-150. Li F. 2008. Annual report readability, current earnings, and earnings persistence. Journal of Accounting and economics 45(2): 221-247. Loughran T, McDonald B. 2011. When is a liability not a liability? Textual analysis, dictionaries, and 10‐Ks. The Journal of Finance 66(1): 35-65. Lowe RA, Ziedonis AA. 2006. Overoptimism and the performance of entrepreneurial firms. Management Science 52(2): 173-186.
32
Malmendier U, Tate G. 2005. CEO overconfidence and corporate investment. The journal of finance 60(6): 2661-2700. Malmendier U, Tate G. 2008. Who makes acquisitions? CEO overconfidence and the market's reaction. Journal of financial Economics 89(1): 20-43. Matsumoto DA. 2002. Management's incentives to avoid negative earnings surprises. The Accounting Review 77(3): 483-514. Navis C, Ozbek OV. 2015. THE RIGHT PEOPLE IN THE WRONG PLACES: THE PARADOX OF ENTREPRENEURIAL ENTRY AND SUCCESSFUL OPPORTUNITY REALIZATION. Academy of Management Review: amr. 2013.0175. Nelson T. 2003. The persistence of founder influence: Management, ownership, and performance effects at initial public offering. Strategic Management Journal 24(8): 707-724. Papke LE, Wooldridge JM. 1996. Econometric methods for fractional response variables with an application to 401 (k) plan participation rates. Journal of Applied Econometrics 11(6): 619-632. Pfeffer J, Lammerding C. 1981. Power in organizations. Pitman Marshfield, MA Pownall G, Wasley C, Waymire G. 1993. The stock price effects of alternative types of management earnings forecasts. Accounting Review: 896-912. Roll R. 1986. The hubris hypothesis of corporate takeovers. Journal of business: 197-216. Schneider B. 1987. The people make the place. Personnel psychology 40(3): 437-453. Schrand CM, Zechman SL. 2012. Executive overconfidence and the slippery slope to financial misreporting. Journal of Accounting and Economics 53(1): 311-329. Shepperd JA, Ouellette JA, Fernandez JK. 1996. Abandoning unrealistic optimism: Performance estimates and the temporal proximity of self-relevant feedback. Journal of Personality and Social Psychology 70(4): 844. Simon M, Houghton SM. 2003. The relationship between overconfidence and the introduction of risky products: Evidence from a field study. Academy of Management Journal 46(2): 139-149. Smith KG, Gannon MJ, Grimm C, Mitchell TR. 1988. Decision making behavior in smaller entrepreneurial and larger professionally managed firms. Journal of Business Venturing 3(3): 223-232. Svenson O. 1981. Are we all less risky and more skillful than our fellow drivers? Acta Psychologica 47(2): 143-148. Tetlock PC. 2007. Giving content to investor sentiment: The role of media in the stock market. The Journal of Finance 62(3): 1139-1168. Tetlock PC, Saar-Tsechansky M, Macskassy S. 2008. More Than Words: Quantifying Language to Measure Firms' Fundamentals. Journal of Finance 63(3): 1437-1467. Tsui AS, Egan TD, O'Reilly III CA. 1992. Being different: Relational demography and organizational attachment. Administrative science quarterly: 549-579. Tushman ML, Romanelli E. 2008. Organizational evolution'. Organization change: A comprehensive reader 155: 2008174. Villalonga B, Amit R. 2006. How do family ownership, control and management affect firm value? Journal of financial Economics 80(2): 385-417. Villalonga B, Amit R. 2009. How are US family firms controlled? Review of Financial Studies 22(8): 3047-3091. Wasserman N. 2003. Founder-CEO succession and the paradox of entrepreneurial success. Organization Science 14(2): 149-172. Wasserman N. 2012. The founder's dilemmas: Anticipating and avoiding the pitfalls that can sink a startup. Princeton University Press Wooldridge JM. 2002. Econometric Analysis of Cross Section and Panel Data. MIT Press
33
Table 1: Descriptive statistics and correlation matrix
1 2 3 4 5 6 7 8 9 10 11 12 13 14 15 16 17
1 Neg. Tweets 1.00
2 Neg. Calls -0.08 1.00
3 Misguidance 0.13 0.07 1.00
4 Options 0.04 -0.29* 0.27 1.00
5 Founder CEO -0.06** -0.06* 0.04* 0.12** 1.00
6 Log(Age) 0.08** 0.09** 0.03 -0.01 0.09** 1.00
7 Log(Tenure) 0.18** 0.05* -0.00 0.21** 0.37** 0.33** 1.00
8 Male -0.01 0.04 0.01 0.03* 0.03 0.05** 0.06** 1.00
9 Log(Wealth) 0.03* 0.03 0.02 0.15** 0.12** 0.29** 0.34** 0.04* 1.00
10 Log(Size) 0.02 -0.07** 0.02 0.15** -0.13** 0.08** -0.09** 0.01 0.53** 1.00
11 Monthly
Volatility -0.03* 0.13** 0.31** -0.02 0.00 -0.02 -0.03 0.00 -0.08** -0.17** 1.00
12 Institutional
Holding 0.14** 0.06* -0.00 0.04* -0.02 -0.03 0.02 -0.01 0.13** 0.07** 0.01 1.00
13 Log(Price) 0.15** -0.09** 0.04* 0.24** -0.06** 0.05** 0.02 0.04** 0.35** 0.63** -0.24** 0.15** 1.00
14 Earnings
Surprise 0.00 -0.09** -0.14** 0.05** 0.01 0.02 0.02 0.05** 0.02 0.05** -0.03 -0.01 0.11** 1.00
15 Aret 0.00 -0.13** -0.04* 0.11** -0.01 -0.02 -0.02 0.01 -0.04* -0.13** 0.10** -0.05** -0.19** 0.01 1.00
16 Log(Market-
to-Book) 0.02 -0.07** -0.02 0.33** -0.00 -0.12** -0.02 -0.04* 0.12** 0.17** -0.04* 0.10** 0.18** 0.02 0.11** 1.00
17 ROA 0.05** -0.00 0.06** 0.25** -0.05** -0.03 -0.04* 0.01 0.15** 0.20** -0.08** 0.08** 0.32** 0.07** 0.05** 0.46** 1.00
#Obs. 7,686 2,033 3,776 4,010 4,010 4,010 4,010 4,010 4,010 4,010 4,010 4,010 4,010 4,010 4,010 4,010 4,010
Mean 0.01 0.01 -0.00 -0.78 0.13 4.01 1.73 0.97 9.66 7.63 0.02 0.80 3.24 -0.00 0.05 0.75 0.10
S.D. 0.03 0.00 0.02 1.85 0.33 0.12 0.86 0.18 1.36 1.55 0.06 0.19 0.81 0.03 0.56 0.74 0.09
In Rows 1 through 4, correlation coefficients are calculated based on the subsample of observations that have realizations for all of our four overconfidence measures. The
variables are constructed to be at the firm-year level (if the original variable is measured at a higher frequency, we average realizations to the firm-year level).
In Rows 5 through 17, correlation coefficients are calculated based on the following samples: Column (1) – sample of tweeting CEOs; Column (2) – random sample of
S&P1500 firms; Column (3) – sample of firms providing earnings guidance; Column (4) – full sample of S&P1500 firms. In Column (1), observations are at the firm-day
level. In Columns (2) through (3), observations are at the firm-month level. In Columns (4) through (17), observations are at the firm-year level.
* and ** denote statistical significance at the 5% and 1% levels, respectively.
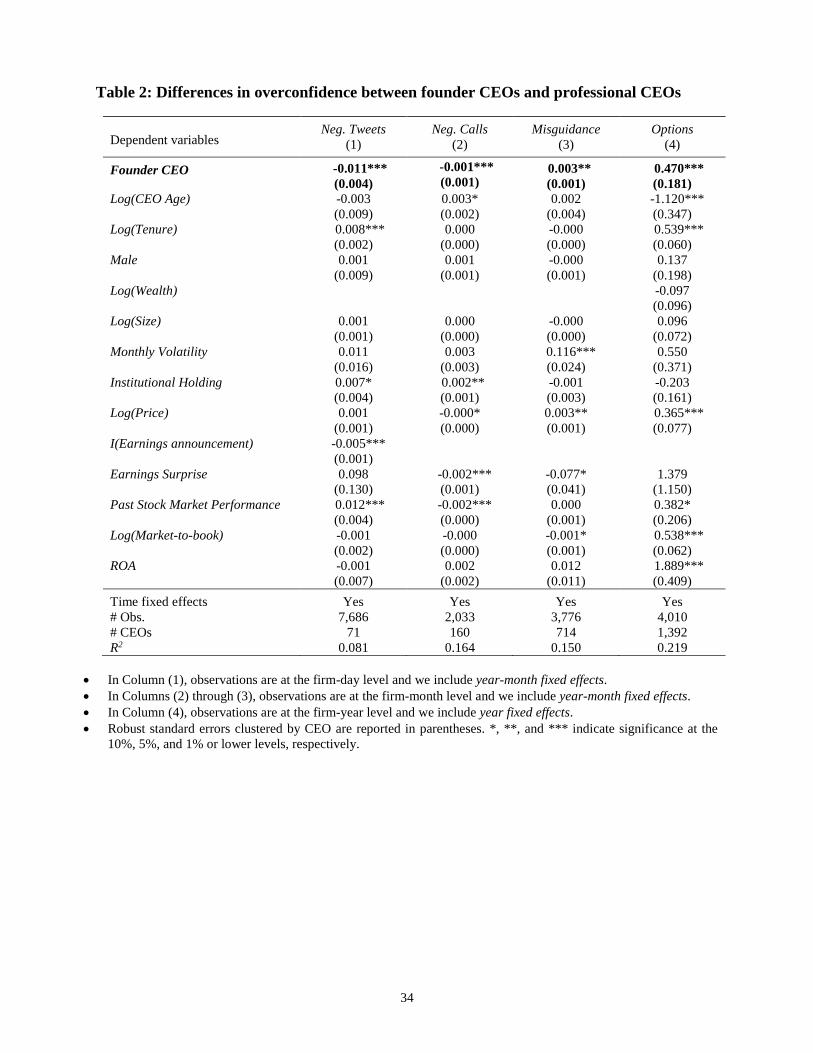
34
Table 2: Differences in overconfidence between founder CEOs and professional CEOs
Dependent variables
Neg. Tweets
(1)
Neg. Calls
(2)
Misguidance
(3)
Options
(4)
Founder CEO
-0.011***
(0.004)
-0.001***
(0.001) 0.003**
(0.001)
0.470***
(0.181)
Log(CEO Age) -0.003
(0.009)
0.003*
(0.002)
0.002
(0.004)
-1.120***
(0.347)
Log(Tenure) 0.008***
(0.002)
0.000
(0.000)
-0.000
(0.000)
0.539***
(0.060)
Male 0.001
(0.009)
0.001
(0.001)
-0.000
(0.001)
0.137
(0.198)
Log(Wealth)
-0.097
(0.096)
Log(Size) 0.001
(0.001)
0.000
(0.000)
-0.000
(0.000)
0.096
(0.072)
Monthly Volatility 0.011
(0.016)
0.003
(0.003)
0.116***
(0.024)
0.550
(0.371)
Institutional Holding 0.007*
(0.004)
0.002**
(0.001)
-0.001
(0.003)
-0.203
(0.161)
Log(Price) 0.001
(0.001)
-0.000*
(0.000)
0.003**
(0.001)
0.365***
(0.077)
I(Earnings announcement) -0.005***
(0.001)
Earnings Surprise 0.098
(0.130)
-0.002***
(0.001)
-0.077*
(0.041)
1.379
(1.150)
Past Stock Market Performance 0.012***
(0.004)
-0.002***
(0.000)
0.000
(0.001)
0.382*
(0.206)
Log(Market-to-book) -0.001
(0.002)
-0.000
(0.000)
-0.001*
(0.001)
0.538***
(0.062)
ROA -0.001
(0.007)
0.002
(0.002)
0.012
(0.011)
1.889***
(0.409)
Time fixed effects
Yes
Yes
Yes
Yes
# Obs. 7,686 2,033 3,776 4,010
# CEOs 71 160 714 1,392
R2 0.081 0.164 0.150 0.219
In Column (1), observations are at the firm-day level and we include year-month fixed effects.
In Columns (2) through (3), observations are at the firm-month level and we include year-month fixed effects.
In Column (4), observations are at the firm-year level and we include year fixed effects.
Robust standard errors clustered by CEO are reported in parentheses. *, **, and *** indicate significance at the
10%, 5%, and 1% or lower levels, respectively.
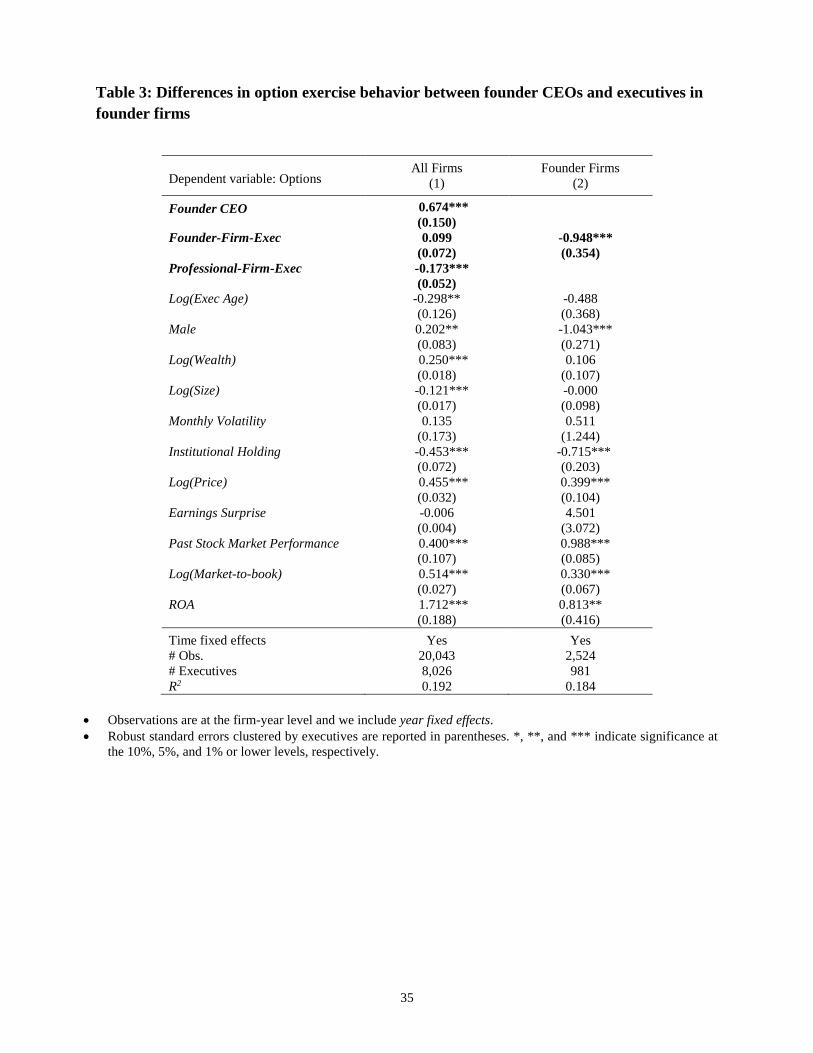
35
Table 3: Differences in option exercise behavior between founder CEOs and executives in
founder firms
Dependent variable: Options
All Firms
(1)
Founder Firms
(2)
Founder CEO
0.674***
(0.150)
Founder-Firm-Exec 0.099
(0.072)
-0.948***
(0.354)
Professional-Firm-Exec -0.173***
(0.052)
Log(Exec Age) -0.298**
(0.126)
-0.488
(0.368)
Male 0.202**
(0.083)
-1.043***
(0.271)
Log(Wealth) 0.250***
(0.018)
0.106
(0.107)
Log(Size) -0.121***
(0.017)
-0.000
(0.098)
Monthly Volatility 0.135
(0.173)
0.511
(1.244)
Institutional Holding -0.453***
(0.072)
-0.715***
(0.203)
Log(Price) 0.455***
(0.032)
0.399***
(0.104)
Earnings Surprise -0.006
(0.004)
4.501
(3.072)
Past Stock Market Performance 0.400***
(0.107)
0.988***
(0.085)
Log(Market-to-book) 0.514***
(0.027)
0.330***
(0.067)
ROA 1.712***
(0.188)
0.813**
(0.416)
Time fixed effects
# Obs.
# Executives
Yes
20,043
8,026
Yes
2,524
981
R2 0.192 0.184
Observations are at the firm-year level and we include year fixed effects.
Robust standard errors clustered by executives are reported in parentheses. *, **, and *** indicate significance at
the 10%, 5%, and 1% or lower levels, respectively.
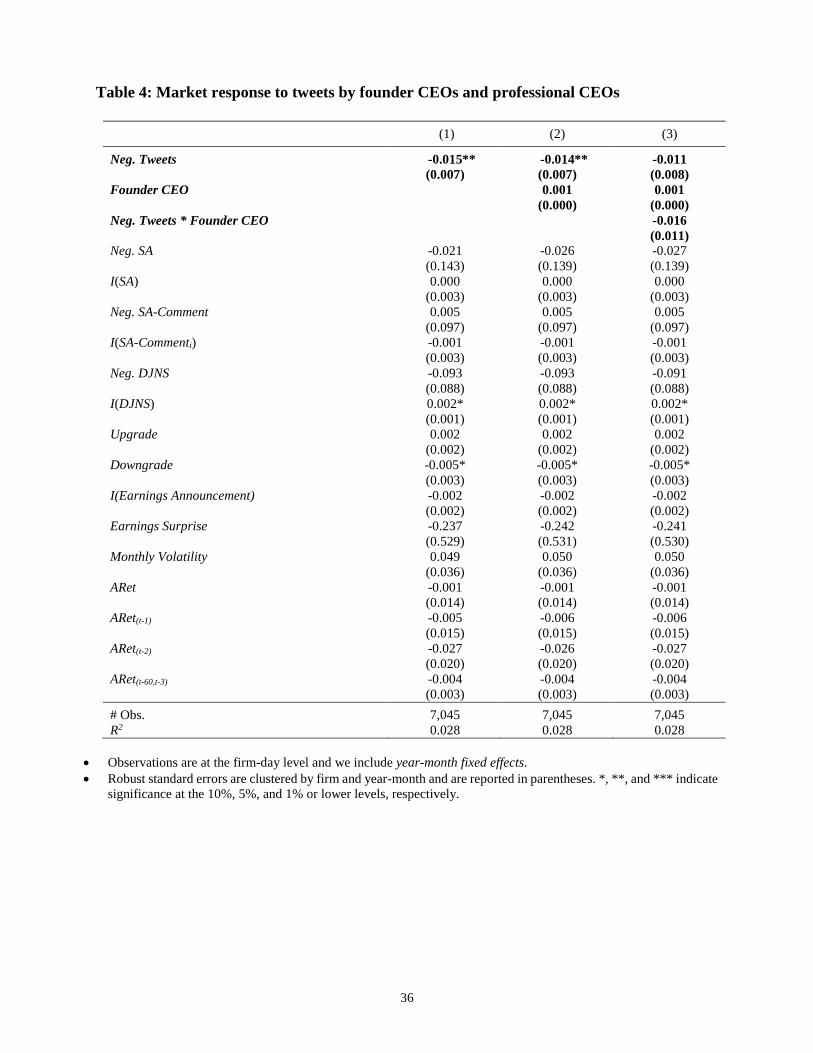
36
Table 4: Market response to tweets by founder CEOs and professional CEOs
(1)
(2)
(3)
Neg. Tweets
-0.015**
(0.007)
-0.014**
(0.007)
-0.011
(0.008)
Founder CEO
0.001
(0.000)
0.001
(0.000)
Neg. Tweets * Founder CEO
-0.016
(0.011)
Neg. SA -0.021
(0.143)
-0.026
(0.139)
-0.027
(0.139)
I(SA) 0.000
(0.003)
0.000
(0.003)
0.000
(0.003)
Neg. SA-Comment 0.005
(0.097)
0.005
(0.097)
0.005
(0.097)
I(SA-Commenti) -0.001
(0.003)
-0.001
(0.003)
-0.001
(0.003)
Neg. DJNS -0.093
(0.088)
-0.093
(0.088)
-0.091
(0.088)
I(DJNS) 0.002*
(0.001)
0.002*
(0.001)
0.002*
(0.001)
Upgrade 0.002
(0.002)
0.002
(0.002)
0.002
(0.002)
Downgrade -0.005*
(0.003)
-0.005*
(0.003)
-0.005*
(0.003)
I(Earnings Announcement) -0.002
(0.002)
-0.002
(0.002)
-0.002
(0.002)
Earnings Surprise -0.237
(0.529)
-0.242
(0.531)
-0.241
(0.530)
Monthly Volatility 0.049
(0.036)
0.050
(0.036)
0.050
(0.036)
ARet -0.001
(0.014)
-0.001
(0.014)
-0.001
(0.014)
ARet(t-1) -0.005
(0.015)
-0.006
(0.015)
-0.006
(0.015)
ARet(t-2) -0.027
(0.020)
-0.026
(0.020)
-0.027
(0.020)
ARet(t-60,t-3) -0.004
(0.003)
-0.004
(0.003)
-0.004
(0.003)
# Obs.
7,045
7,045
7,045
R2 0.028 0.028 0.028
Observations are at the firm-day level and we include year-month fixed effects.
Robust standard errors are clustered by firm and year-month and are reported in parentheses. *, **, and *** indicate
significance at the 10%, 5%, and 1% or lower levels, respectively.