Declining Business Dynamism: Implications for Productivity? · 1 . Declining Business Dynamism:...
69
1 Declining Business Dynamism: Implications for Productivity? Ryan A. Decker, John Haltiwanger, Ron S. Jarmin, Javier Miranda* August 2016 Abstract We summarize the accumulating evidence on declining business dynamism in the U.S. and describe new findings on its implications for aggregate productivity. A growing literature demonstrates secular declines in a variety of measures of business dynamism in the U.S. over the last few decades and particularly since 2000. This trend is evident in data on new firm formations, gross job creation and destruction, and worker flows. A large fraction of aggregate (industry-level) productivity growth is accounted for by the movement of resources from less- productive to more-productive businesses within industries, so a reduction in dynamism may imply that there has been a slowdown in productivity-enhancing reallocation. Of particular interest is that there has been a reduction in high-growth entrepreneurship in the U.S. in the post- 2000 period especially in innovative sectors like High Tech (which has historically been an important source of productivity growth). Since this is a period in which the aggregate data show an overall productivity slowdown in information technology producing and using industries, we investigate how the micro and macro patterns are related. We exploit new longitudinal firm microdata that enable tracking the connection between productivity and reallocation dynamics for the entire U.S. economy. We find the distribution of firm-level real revenue growth dynamics exhibits similar patterns to employment growth with declining dispersion and skewness in key sectors like High Tech in the post-2000 period. In addition, we find that high-productivity firms in the High Tech sector and elsewhere are less likely to grow in the post-2000 period, and we describe an exercise showing a declining contribution of reallocation to productivity growth since 2000—particularly in the High Tech sector. * Board of Governors of the Federal Reserve System, University of Maryland and NBER, U.S. Census Bureau, and U.S. Census Bureau, respectively. We thank the Kauffman Foundation for financial support, and we thank Cody Tuttle for excellent research assistance. We thank John Abowd, Martin Baily and Kristin McCue for helpful comments on an earlier draft. Any opinions and conclusions expressed herein are those of the author(s) and do not necessarily represent the views of the U.S. Census Bureau or of the Board of Governors or its staff. All results have been reviewed to ensure that no confidential information is disclosed.
Transcript of Declining Business Dynamism: Implications for Productivity? · 1 . Declining Business Dynamism:...

1
Declining Business Dynamism: Implications for Productivity?
Ryan A. Decker, John Haltiwanger, Ron S. Jarmin, Javier Miranda*
August 2016
Abstract
We summarize the accumulating evidence on declining business dynamism in the U.S. and describe new findings on its implications for aggregate productivity. A growing literature demonstrates secular declines in a variety of measures of business dynamism in the U.S. over the last few decades and particularly since 2000. This trend is evident in data on new firm formations, gross job creation and destruction, and worker flows. A large fraction of aggregate (industry-level) productivity growth is accounted for by the movement of resources from less-productive to more-productive businesses within industries, so a reduction in dynamism may imply that there has been a slowdown in productivity-enhancing reallocation. Of particular interest is that there has been a reduction in high-growth entrepreneurship in the U.S. in the post-2000 period especially in innovative sectors like High Tech (which has historically been an important source of productivity growth). Since this is a period in which the aggregate data show an overall productivity slowdown in information technology producing and using industries, we investigate how the micro and macro patterns are related. We exploit new longitudinal firm microdata that enable tracking the connection between productivity and reallocation dynamics for the entire U.S. economy. We find the distribution of firm-level real revenue growth dynamics exhibits similar patterns to employment growth with declining dispersion and skewness in key sectors like High Tech in the post-2000 period. In addition, we find that high-productivity firms in the High Tech sector and elsewhere are less likely to grow in the post-2000 period, and we describe an exercise showing a declining contribution of reallocation to productivity growth since 2000—particularly in the High Tech sector.
* Board of Governors of the Federal Reserve System, University of Maryland and NBER, U.S. Census Bureau, and U.S. Census Bureau, respectively. We thank the Kauffman Foundation for financial support, and we thank Cody Tuttle for excellent research assistance. We thank John Abowd, Martin Baily and Kristin McCue for helpful comments on an earlier draft. Any opinions and conclusions expressed herein are those of the author(s) and do not necessarily represent the views of the U.S. Census Bureau or of the Board of Governors or its staff. All results have been reviewed to ensure that no confidential information is disclosed.

2
I. Introduction
A growing body of research documents that various indicators of business dynamism
have been in secular decline in the U.S. since the 1980s. This trend is evident in data on new
firm formations, gross job creation and destruction, and worker flows.1 Canonical models of
firm dynamics and empirical evidence indicate that there is a tight link between business
dynamism and productivity growth. That is, theory and evidence suggests a substantial fraction
of aggregate productivity growth is accounted for by the reallocation of resources away from
lower-productivity to higher-productivity firms. In particular, firm entry and exit are an
especially critical component of these productivity enhancing reallocation dynamics. Thus, a
prima facie concern arising from these trends is that they may have had adverse effects on
aggregate productivity growth.
At first glance, medium-run fluctuations in economy-wide productivity growth do not
match up with patterns of declining business formation and business dynamism. Productivity
growth accelerated in the U.S. in the late 1980s through the early 2000s. Since the early 2000s
there has been a trend decline in economy-wide productivity growth that has persisted through
the slow recovery from the Great Recession. The acceleration period in productivity in the late
1980s to the early 2000s corresponds to a period of overall declining pace of business formation
and business dynamism.
However, a more careful review of theory and evidence suggests the observed
fluctuations in the pace of productivity growth, business formation and reallocation dynamics are
not inconsistent. During the 1980s and 1990s, the decline in entrepreneurship and reallocation
dynamics is dominated by the Retail Trade sector. In that sector, the declines in the pace of
1 See Davis et al. (2007); Davis, Faberman and Haltiwanger (2012); Hyatt and Spletzer (2013); Decker et al. (2014); Haltiwanger, Hathaway and Miranda (2014); Decker et al. (2016a,b).

3
business formation and reallocation arguably do not reflect adverse developments but rather
benign factors consistent with rising productivity in the Retail Trade sector observed over that
period. The patterns in the Retail Trade sector remind us that a high pace of startups and
reallocation is not inherently positively correlated with economic performance. Moreover,
patterns of declining job reallocation in other sectors in the 1980s and 1990s are not
characterized by a loss of high-growth firm activity but reflect a symmetric narrowing of the
employment growth rate distribution (Decker et al. (2016b)).2
Fernald (2014) highlights that the surge in productivity from the late 1980s to early 2000s
and subsequent decline was led by the ICT-producing and intensive ICT-using sectors.
Interestingly, the High Tech sector exhibits a rise in business formation and the pace of
reallocation over the first period and a sharp decline in the post-2000 period.3
In this paper, we explore the possible connection between the changing dynamics of
business formation and reallocation—evident in sources of business microdata—and aggregate
patterns in productivity growth. This exploration is in two distinct but related steps. First, we
take stock of what we know about the changing patterns of business formation and business
dynamism, and the possible connections with productivity, by describing recent research using
detailed business microdata on productivity and employment. We summarize the recent findings
in this burgeoning literature and discuss open questions. Second, we exploit a newly developed
economy-wide longitudinal firm database that tracks real revenue growth, employment growth,
2 As shown by Decker et al. (2016b), measures of gross job flows such as job reallocation are closely related to the dispersion of the distribution of firm growth rates. The growth rate distribution can be summarized with measures of dispersion and further explored with measures of skewness, which indicates the importance of high-growth firm activity. A symmetric narrowing of the firm growth rate distribution is a reduction of growth rate dispersion that does not involve a reduction in skewness, or high-growth firm activity. 3 For this purpose, we follow Hecker (2005) and construct a High Tech sector based on the 14 four-digit NAICS sectors with the largest shares of STEM workers. The 14 sectors are listed in Table A.1 in the appendix of Decker et al. (2016a).

4
and the connection of employment growth to labor productivity dynamics at the firm level.
Consistent with previous, more narrowly focused research, we uncover compelling connections
between firm-level growth dynamics, economy-wide trends in job reallocation, and aggregate
productivity growth. High-productivity firms are more likely to grow while low-productivity
firms are more likely to contract. This productivity/growth covariance weakens over the post-
2000 period. This weakening is especially noticeable in the High Tech sector. We conduct a
diff-in-diff counterfactual exercise that implies there have been substantial reductions in
industry-level productivity growth from this weakening relationship. Our analysis is still
exploratory but suggests that business microdata may be important for understanding the striking
changes in U.S. productivity growth.
The next section summarizes recent microdata-based research on dynamism, its
relationship with productivity, and its evolution in recent years. We outline what is currently
known then explore specific outstanding questions and summarize recent and current efforts at
answering those questions. The third section describes the rich new data source we are using.
Section IV presents new evidence on the changing nature of business dynamism as measured by
changes in the growth rate distribution of real revenue (as opposed to employment) across firms.
Section V uses this newly developed data source to characterize the changing patterns of within-
industry dispersion in productivity along with changes in the covariance between employment
growth and productivity, followed by exercises quantifying the declining contribution of
reallocation to aggregate productivity growth. We conclude by summarizing our main findings
and highlighting avenues for future research that will contribute to our understanding of this
issue.

5
II. Taking Stock and Open Questions
A. Taking Stock
a. Changing Patterns of Business Formations, Dispersion and Skewness in Firm
Employment Growth Rate Distributions
Using measures such as the pace of job reallocation, the dispersion of growth rates across
businesses and within-business volatility, the decline in business dynamism for the U.S. private
non-farm sector dates at least to the mid-1980s (see Davis, Haltiwanger, Jarmin and Miranda
(2007), Davis and Haltiwanger (2014), Decker et. al. (2014, 2016a, 2016b), Hyatt and Spletzer
(2013) and Molloy et al. (2016)). The remainder of this section provides a brief synopsis of the
findings from this recent literature.
The declining firm startup rate is one of the most often cited artifacts of overall declining
business dynamism.4 This is illustrated in Figure 1, which reports national startup and exit rates
based on aggregated Census Bureau microdata. The decline has been substantial enough that the
net entry rate has been negative in some of the last few years. The decline in firm startup rates
and the accompanying decline in the share of activity accounted for by young firms is a core
component of the overall decline in dynamism. Young businesses are the most volatile
businesses, so a decline in the share of activity accounted for by young businesses yields a
decline in the pace of reallocation. This shift away from young firms accounts for about 30
percent of the decline in gross job flows (Decker et al. (2014)).
These structural changes imply that the typical worker is increasingly more likely to work
at a large, mature, national (or global) firm. The share of employment at young firms has
4 See Haltiwanger, Jarmin and Miranda (2013), Decker et al. (2014, 2016a, 2016b), Davis and Haltiwanger (2014) for more detailed discussion. A firm startup is a new legal entity with at least one employee where all the establishments are new. A firm exit occurs when a legal entity ceases to exist and all establishments shut down. These definitions abstract from firm entry and exit generated from ownership change and M&A activity.

6
dropped from around 20 to 10 percent over the last several decades while the share of
employment at large, mature firms has risen from about 40 to 50 percent of employment. Large,
mature firms account for less than 1 percent of total firms but a very large and increasing fraction
of activity. This shift to large, mature firms is also accompanied by a shift toward national firms
(with activity in all regions of the country). This shift to large, mature firms has been more
pronounced in some sectors than others.5,6
The pace of the decline in job reallocation exhibits a notable acceleration in the post-2000
period. Decker et al. (2016b) show that the acceleration of the trend decline is associated with a
change in the character of the decline in the post-2000 period. Prior to 2000, the decline in
indicators of business dynamism was dominated by sectors such as Retail Trade and Services. In
the Retail Trade sector, the decline in entrepreneurship and dynamism has arguably been driven
by benign factors reflecting a shift in the business model in Retail Trade. The shift has been
away from single unit establishment firms (“Mom and Pop” firms) to large national and multi-
national chains. The latter have taken advantage of IT7 and globalization8 to build efficient
distribution and supply chain networks. Establishments in Retail Trade that are part of large,
national firms are both more productive and more stable.9
5 Retail Trade, Wholesale Trade, and Services have each seen substantial increases in large firm activity. Measured as the share of employment accounted for by firms with more than 250 employees, these sectors have risen from 49 to 57 percent, 38 to 49 percent, and 48 to 56 percent, respectively, since 1990. The large firm share has fallen slightly in Manufacturing (from 69 to 66 percent) and risen slightly in Transportation and Utilities (from 68 to 71 percent). Similar patterns hold using a 10,000-employee cutoff (data from Business Dynamics Statistics). Using a revenue concept instead of employment yields similar results as well; see Council of Economic Advisers (2016). 6 See Figures 1a and 1b of Decker et al. (2016b). 7 See Doms, Jarmin and Klimek (2004). 8 See Basker and Hoang Van (2010). 9 See Foster, Haltiwanger and Krizan (2006) and Jarmin, Klimek and Miranda (2009) for further discussion. In terms of the rubric of the current paper, the change in the business model yielded a change to firms with higher mean productivity and lower variance and associated dynamism.

7
In contrast, the High Tech sector exhibited increasing indicators of business dynamism
prior to 2000.10 The evidence suggests that in High Tech, high-growth young firms play an
especially critical role in job creation and productivity growth. Likewise, newly listed publicly
traded firms (IPOs) exhibit particularly high job creation and productivity growth. In the robust
period of aggregate productivity and job growth in the 1990s, the High Tech sector and newly
listed public companies (there is considerable overlap here) exhibited increases in indicators in
dynamism and entrepreneurship. However, since 2000 the High Tech sector and publicly traded
firms have exhibited a decline in dynamism. The number of IPOs has fallen in the post-2000
period, and those that have entered have not exhibited the same rapid growth as earlier cohorts.11
The changing nature of the decline in indicators of business dynamism is mimicked in the
changing nature of the decline in business startups. Prior to 2000, the decline in the firm startup
rate is disproportionately accounted for by sectors such as Retail Trade and Services. After 2000
the High Tech sector exhibits a more pronounced decline in the firm startup rate than these
sectors.
The acceleration and changing character of the decline in indicators of business
dynamism in the post-2000 period is also evident in changing patterns of skewness in the firm
employment growth rate distribution, a key focus of Decker et al. (2016b). High-growth firms
(especially high-growth young firms) generate positive right skewness in the firm growth rate
distribution. Prior to 2000, the decline in the pace of job reallocation and other measures of the
dispersion in the firm and establishment employment growth rate distribution reflects a roughly
10 See Comin and Philippon (2005), Davis, Haltiwanger, Jarmin and Miranda (2007), Haltiwanger, Hathaway and Miranda (2014), Decker et al. (2016b). 11 See Davis and Haltiwanger (2014).

8
equal decline in the 90-50 and 50-10 differentials.12 However, after 2000 the 90-50 differential
in the firm growth rate distribution falls much more dramatically than the 50-10 differential.
Several factors underlie this change in the shape of the distribution of firm growth rates since
2000. First, young firms exhibit more positive right skewness than mature firms, and the share
of young firms has declined. Second, sectors like Information (and the broader High Tech sector
that includes most of Information) exhibited a high degree of positive right skewness in the
1990s but exhibited a sharp decline in skewness in the post-2000 period. The post-2000 decline
in skewness in these sectors is accounted for by a smaller share of young firms in these sectors
but also a reduction in high-growth activity amongst young firms in these sectors over this period
of time. Thus, the High Tech sector exhibited not only a decline in dispersion in firm growth
rates but also a decline in skewness in the post-2000 period.
b. Implications for Productivity?
The present question is about the causes of the slowing of aggregate productivity growth
in the U.S. since the early 2000s. Economic theory and a large empirical literature link firm- and
establishment-level productivity and growth to economy-wide patterns, and business microdata
have played a key role in shedding light on the drivers of aggregate productivity (see Syverson
(2011) for a review). In this subsection, we describe the theoretical framework linking business-
level dynamics to both recent empirical patterns of business dynamism and aggregate
productivity. In short, economic theory posits that aggregate dynamism measures (such as gross
job reallocation) reflect business-level responses to idiosyncratic productivity and profitability
conditions (or “shocks”). Looking at the trends for responses versus shocks recent empirical
12 The 90-50 and 50-10 differentials are the gap between the 90th and 50th percentiles and the gap between the 50th and 10th percentiles, respectively, of the employment-weighted distribution of firm growth rates. The difference between the 90-50 and the 50-10 can be thought of as a measure of skewness.

9
evidence for the manufacturing sector suggests that changes in the nature of those shocks cannot
explain recent patterns in business dynamism in manufacturing; rather, businesses have become
less responsive to productivity shocks, which may have negative implications for aggregate
productivity growth.
Whether declining trends in business dynamism have negative implications for aggregate
productivity depends upon the underlying causes of the decline in business formation rates, job
reallocation and other related indicators. According to economic theory, a high pace of
dynamism is part of a healthy economy if that dynamism reflects the movement of resources—
such as jobs—away from less-productive uses and toward more-productive uses. However,
changes in the business model within sectors may imply less need for a high pace of business
formation and reallocation dynamics to achieve productivity growth. As discussed above, the
shift toward large, national and multi-national chain stores in Retail Trade, particularly during
the 1990s, likely fits this pattern. The key question, then, is whether the slowing post-2000 pace
of reallocation described above reflects less of the productivity-enhancing movement of
resources or simply less unnecessary movement due to improvements in business organization
and processes. Detailed business-level data are required for answering this question.
Recent research has made some progress on the nature of slowing business dynamism
and its link to aggregate productivity. Decker et al. (2016a) argue that insights into the question
can be obtained by distinguishing between changes in the dispersion of the within-industry
productivity shock distribution and changes in the responsiveness of firms to their productivity
realizations from that distribution. This insight follows from canonical models of firm dynamics
in which economy- or sector-wide patterns of gross job reallocation reflect the aggregation of
firm-level behavior in response to the idiosyncratic conditions they face. Broadly speaking,

10
these models yield the prediction that firm-level growth in a given period will be an increasing
function of firm-level realizations of productivity or profitability shocks conditional on initial
endogenous state variables (e.g., initial employment) in each period. This model prediction has
been well supported by the evidence. Syverson (2011) highlights that one of the most ubiquitous
findings in the firm dynamics literature is that firms with high realizations of measured
productivity are more likely to survive and grow.
Canonical models thus offer a promising avenue for finding the sources of changes in the
distribution of firm growth rates (inclusive of firm exit). Specifically, basic theory implies that
changes in the distribution of firm-level growth rates can be accounted for either by changes in
the distribution of productivity/profitability of shocks or by changes in the marginal response of
firm-level growth to productivity/profitability shocks.
Changes in the dispersion of realizations of productivity shocks will yield changes in the
dispersion of firm growth rates in canonical firm dynamics models. That is, the dispersion of
realizations of productivity within a sector is a proxy for the distribution of idiosyncratic shocks
impacting firms. A change in the dispersion of idiosyncratic shocks might stem from several
sources. Jovanovic (1982) emphasizes that entering firms do not know their type prior to entry
so that young firms exhibit substantial dispersion in both productivity and outcomes. Acemoglu
et al. (2013) emphasize that young firms are more likely to be engaged in experimental
innovation activity that also yields substantial dispersion in productivity and outcomes.
Changes in the role of learning or experimentation by young firms that yield changes in
the dispersion of idiosyncratic productivity shocks could be from benign factors. For example,
improved pre-entry information may lead to less need for costly entry, learning and
experimentation. Alternatively, the relative importance of young firms vs. mature incumbent

11
firms for technological innovation may change. The shift toward large, national chains in Retail
Trade might be interpreted in this fashion. Globalization and information technology favored a
subset of large incumbents who could take advantage of improved supply chains and distribution
networks in ways that young, smaller firms could not.
Alternatively, changes in adjustment frictions or uncertainty may yield changes in the
responsiveness of firms to a given process of idiosyncratic shocks. As Hopenhayn and Rogerson
(1993) emphasize, an increase in the frictions for any margin of adjustment will impact all
margins of adjustments. Increased barriers to post-entry growth will reduce not only job creation
by young incumbents but also entry as the present discounted value of entry declines. In turn,
reduced job creation by incumbents and entry will yield reduced job destruction by incumbents
and exit as competitive pressures will be reduced.
Using these insights, Decker et al. (2016a) explore the changing pattern of the differences
in productivity across plants within the U.S. Manufacturing sector along with the changing
pattern of responsiveness to those differences. The remainder of this subsection summarizes the
findings from this analysis.
The dispersion of TFP differences between plants rose from the early 1980s to the recent
period. This holds overall in Manufacturing but also in the critical High Tech components of
Manufacturing (e.g., computers and semiconductors). This rise in dispersion in TFP is consistent
with a rising dispersion in the volatility of idiosyncratic productivity shocks impacting
businesses.13 Based on the above discussion, this implies that there should have been a rise in
13 As discussed in Decker et al. (2016a) the evolution of the dispersion in TFP may reflect endogenous factors including changes in the selection margin. For example, if the selection margin is reduced (i.e., low-productivity establishments are less likely to exit) then dispersion in TFP will rise. They show that for High Tech manufacturing, dispersion in TFP increased in the 1990s even when the selection margin became more strict (in the 1990s they find that low productivity plants were more likely to exit). This suggests the increase in dispersion in TFP in high tech more likely reflects a change in the dispersion of shocks. Note that this issue of endogenous changes in measured

12
the pace of reallocation throughout the last several decades as there are increased incentives for
reallocation, but the evidence shows a decline in reallocation—especially in the post-2000
period. In other words, the time series pattern of the establishment-level productivity
distribution, observed in detailed microdata, is inconsistent with the hypothesis that declining
reallocation has been driven by changes in the distribution of productivity or profitability
conditions faced by individual businesses.
To reconcile the observed facts, Decker et al. (2016a) show there has been a changing
pattern of responsiveness of Manufacturing plants, in terms of employment growth and survival,
to TFP shocks. They do this by estimating establishment-level regressions of employment
growth on measured productivity, corresponding with the policy functions implied by firm
dynamics theory. In the High Tech sector, responsiveness first increased through the 1990s and
then sharply decreased in the post-2000 period. That is, the evidence shows that establishments
with high realizations of productivity were more likely to survive and grow in the 1990s but
became less responsive to productivity differences after 2000. The rise and decline in
responsiveness in High Tech is especially pronounced for young firms. This pattern helps
reconcile the rising and then declining pace of reallocation in the High Tech sector described
previously.
The declining responsiveness to idiosyncratic productivity shocks implies the
contribution of reallocation to productivity growth has declined: high-productivity businesses
have become less likely to grow than they were before, and low-productivity businesses have
become less likely to contract or exit than they were before, and the result is that movement of
resources from lower- to higher-productivity businesses has slowed. The estimated changes in
dispersion in productivity looms large in the analysis in section V of this paper. For labor productivity, not only are changes in the selection margin relevant but so are changes in adjustment frictions for continuing firms.

13
productivity responsiveness imply a decline in the contribution of reallocation to productivity
growth in the High Tech sector exceeding more than 1 log point per year after the mid-2000s.
That is, patterns of declining business dynamism are likely linked to slowing aggregate
productivity growth, at least in the Manufacturing sector.
B. Open Questions
Many questions remain regarding the changing patterns of indicators of business
dynamism and the implications for productivity. To start, most of the evidence of changes in
business dynamism is based on the pace of job and worker reallocation. That is, the focus is
employment as the margin of adjustment. It may be that the observed patterns reflect changes in
the nature of the role of workers in the dynamics of businesses. For example, outsourcing and
globalization may have changed the way that productive firms are expanding. It may be, for
example, that it used to be the case that a highly productive young firm expanded domestically
by hiring workers. Instead, it may be that expansion is now on other margins. Expansion may
be via production overseas. Alternatively, expansion may be by machines rather than workers.
Finally, expansion of a highly productive and innovative young firm may increasingly be via the
young firm being acquired by a large firm who takes advantage of the innovation for its own
operations.
Decker et al. (2016a), summarized in the previous subsection, make progress on some of
these open questions for the Manufacturing sector. They find that the decline in productivity
responsiveness in the post-2000 period is concentrated in sectors with the largest increase in the
import penetration ratio from low-wage countries like China, particularly for High Tech firms.
They also find that the decline in responsiveness of employment growth since 2000 is matched
14
by a decline in the responsiveness in the rate of equipment investment, indicating that businesses
have not simply substituted employment adjustment with machine adjustment.
While these findings do not resolve the source of the rise and decline in the pace of
business dynamism in the High Tech sector, the findings do rule out some hypotheses for this
sector. First, the evidence does not support the hypothesis that the decline in the observed
indicators of dynamism is the result of a change in the shock processes driving dynamism.
Productivity differences in TFP across firms within detailed industries in High Tech are rising
and not declining over the last several decades.
Second, the rise and decline of responsiveness of both employment growth and
investment within firm age groups does not support the hypothesis that the patterns simply
reflect a rise and decline in the pace of technological change in High Tech (see, e.g., Gordon
(2016)). A rise and decline in the latter can potentially account for some aspects of the changing
patterns of business dynamism and business formation rates.14 However, a rise and then
slowdown in the pace of technological change is difficult to reconcile with a changing pattern of
responsiveness for young firms to a given or rising dispersion in productivity differentials across
young firms. Differential growth between young firms that are high vs. low in the within-
industry productivity distribution should presumably not change even if the overall pace of
technological change has declined.15
14 Jovanovic (1982) and Gort and Klepper (1982) both highlight that as mean expected profitability in a sector increases then entry rates should increase. In their models, mean expected profitability is positively related to the first moment of productivity within a sector. With a rise in entry rates, the share of young firms will increase and, in these models, young firms are the most volatile firms as they experiment and learn about their profitability. This class of models is consistent with rising dispersion in idiosyncratic profitability shocks accompanying an increase in the pace of technological change. Moreover, this class of models is consistent with an increase in overall responsiveness accompanying an increase in the pace of technological change as young firms respond more to productivity differences than mature firms in these models (given the high pace of learning for young firms). However, for a given dispersion in profitability shocks, these models cannot account for a changing pattern of responsiveness among young firms. 15 Decker et al. (2016a) also find that there is no change in the persistence of idiosyncratic shocks.

15
If it is not a changing pattern of shocks or a changing pattern of industry-wide
technological change then how should we interpret this evidence? This remains an open
question, but it is consistent with some type of increase in firm-level adjustment frictions or
potentially changing margins of adjustment as we have discussed above. An active area of
research is to document and explore the possible sources of changes in frictions or margins of
adjustment.16
While the existing research described above sheds light on dynamism patterns in High
Tech Manufacturing, all of these open questions apply to an even greater extent to the non-
manufacturing economy. Much of the innovation that characterizes the U.S. economy,
especially after 2000, has been in the Information sector (e.g., software publishing, internet
portals and the like). Moreover, the patterns of changes in business formation and in the
dispersion and skewness of firm growth rates are even more dramatic in the non-manufacturing
components of High Tech. Relatively little is known about the connection between reallocation
dynamics and productivity growth outside of Manufacturing.17 In this paper, we make further
progress on these open questions by exploiting a newly developed longitudinal firm microdata
database that cover the entire U.S. private, non-farm economy. The data permit tracking both
revenue growth and employment growth distributions. In addition, measures of labor
productivity can be constructed so that the evolution of the dispersion in productivity across
firms within narrow sectors can be analyzed. In turn, the changing patterns of responsiveness of
16 As mentioned above, Decker et al. (2016a) find suggestive evidence that patterns of globalization may hold clues to changing responsiveness, at least within the manufacturing sector. Using industry variation, Goldschlag and Tabarrok (2014) find no evidence that federal regulation counts relate with changes in the pace of gross flows. Davis and Haltiwanger (2014) find evidence relating employment protection policies to lower rates of reallocation. Molloy et al. (2016) find no evidence of a role for land use regulations or improved worker-firm matches. 17 Exceptions include the numerous studies of Retail Trade cited above that highlight the shift in the business model towards large, national chains that has been productivity enhancing. See, e.g., Foster, Haltiwanger and Krizan (2006), Jarmin, Klimek and Miranda (2009) and Foster et al. (2015).

16
growth and survival can be tracked in the context of the evolving firm-level productivity
distribution.
We exploit these newly developed data in the remainder of the paper. A strength of the
data is the comprehensive coverage of the U.S. private, non-farm sector from the mid-1990s to
2013. A weakness of the data is that the only measure of productivity that is feasible is labor
productivity. This makes methodological approaches and interpretation of results more complex
but, we think, still insightful. In this study, we show that the decline in dynamism and high-
growth activity that is evident in employment data is also apparent in revenue data. We then
document rising within-industry dispersion in firm-level labor productivity throughout the U.S.
economy, consistent with evidence from Decker et al. (2016a) on TFP dispersion within
Manufacturing industries described above. Finally, we estimate regressions, using data for the
entire U.S. economy (and the High Tech sector specifically), relating firm-level employment
growth with labor productivity, finding a weakening productivity/growth relationship that is
consistent with the TFP evidence of Decker et al. (2016a) already discussed. We then exploit
these model estimates to construct a series of counterfactuals to roughly quantify the
implications of the weakening productivity/growth relationship for aggregate productivity.
These exercises are made possible through the use of newly enhanced microdata that we describe
next.
III. Data
For our purposes we make use of a new revenue-enhanced version of the Longitudinal
Business Database (RE-LBD). The RE-LBD integrates employment measures from the
Longitudinal Business Database (LBD) with revenue output measures from administrative files.

17
We describe basic features of its construction and underlying data here (see Haltiwanger, Jarmin,
Kulick and Miranda (2016) for additional details).
The LBD is a longitudinal database of establishments and firms in the U.S. with paid
employees. It is sourced from the Census Bureau Business Register (BR), which is the
enumeration list for the Economic Census and the frame for business surveys (see Jarmin and
Miranda (2002) for details of the LBD’s construction). LBD coverage begins in 1976 (and
currently runs through 2013) and includes the private non-farm economy.
The RE-LBD incorporates the current version of the LBD. In the LBD, business
establishments under common ownership are linked via a common firm identifier, the FIRMID.
Longitudinal establishment identifiers allow us to track establishment opening and closings, firm
startups and shutdowns, the acquisitions and divestitures of establishments as well as merger and
acquisition activity at the firm level. Economic information featured in the LBD includes
employment, payroll, detailed industry, and establishment location (county) among other items.
Missing from the LBD are measures of output. Revenue is available in the Business Register but
only at the tax unit level.
Enhancing the LBD with revenue measures is not trivial. The LBD is an establishment-
level dataset whereas the annual revenue data are only available at the tax unit level, the
Employer Identification Number (EIN)18. For single location businesses, the EIN and the
establishment units coincide. However, this is not necessarily the case for firms with multiple
establishments.19 For these firms we only have annual revenue at the higher EIN-level of
18 The Economic Census conducted in years ending in “2” and “7” collects revenue data from a large sample of establishments although the revenue concept varies across industries. 19 Firms choose how to report their income and payroll activities to the IRS according to multiple criteria including geographic boundaries, tax status, type of activity, division or subsidiary. Often this results in multiple filings for different components of the firm with each filing possibly encompassing multiple establishments.

18
aggregation. Not only will an EIN unit cover multiple establishments for a large firm, the firm
may report under multiple EINs. The mapping of employment reports at the establishment and
annual revenue reported at the EIN level is not always straight forward and can vary over time
within a firm. Thus, given our interest in exploring employment and productivity dynamics this
requires that we use a revenue-enhanced LBD that integrates measures of both employment and
revenue at some minimum common level of aggregation, the firm. The RE-LBD incorporates
firm-level revenue measures by collapsing the EIN revenue measures contained in the Business
Register that belong to the same firm. Firm-level employment measures result from collapsing
employment in the LBD across all establishments that belong to the same firm (for details about
the construction and integration of the revenue field into the LBD see the data appendix to
Haltiwanger, Jarmin, Kulick and Miranda (2016)).
The RE-LBD allows us to track firm employment and revenue dynamics including job
creation, job destruction and net employment and revenue growth by detailed firm characteristics
including firm age, firm size, detailed industry and state. Revenue coverage begins in 1996 and
runs through the end of the current LBD time frame (2013). A critical aspect of the RE-LBD is
that the procedure for calculating the current-year and previous-year employment variables is
adjusted so that all employment growth represents organic changes in establishment-level
employment rather than artificial growth created by mergers and acquisitions (M&A).
Haltiwanger, Jarmin, and Miranda (2013) provide a detailed description of the procedure applied
to net out the results of merger activity in firm-level employment growth. Consistent with that
approach (which is also used to construct the public-use Business Dynamics Statistics), startups
are identified in the data by the entry of new firm identifiers (FIRMIDs) where all the
establishments are new. New firms that are the result of M&A activity are assigned the age of

19
the oldest establishment of the firm at the time of inception. Consistent with these criteria firm
acquisitions are not considered deaths. A firm death takes place when the firm ceases to exist
and all establishments shut down.
Several additional aspects of the RE-LBD are worth mentioning at this point. The
Census Bureau is not always able to tie revenue and employment measures belonging to the
same firm in the BR.20 This results in employment observations with missing revenue data. The
RE-LBD sample excludes observations with missing revenue.21 In addition revenue outliers are
removed to ensure that the observations are suitable for analysis. This includes observations
with unusually high or low labor productivity (real revenue per worker), revenue levels, or
revenue growth/decline (different rules are used for different revenue segments). To account for
the missing data and the potential selection effects that might arise we use inverse propensity
scores to weight the data. Propensity scores are developed using the full LBD compared with the
RE-LBD with models that include firm size, firm age, the employment growth rate, broad
industry and a multi-unit status indicator. We use inverse propensity scores that are generated
independently based on models for continuers, births and deaths (details about the filters used
and the construction of the propensity scores can be found in the data appendix to Haltiwanger et
al. (2016)).
Finally, firms can operate across multiple industries as reflected by establishment-level
activity codes. The RE-LBD assigns a dominant activity for the firm (measured by employment)
using consistent NAICS codes as constructed in Fort and Klimek (2016). We allow the firm
NAICS code to change over time if the dominant activity of the firm changes.
20 This is because firms can report income and payroll activities under different EINs. When this happens the income EIN may fall outside of the set of EINs that the Census considers part of that firm when accounting for employment. 21 Approximately 20 percent of the firm-year observations do not have output measures.

20
In the analysis below, revenue measures are deflated with 3-digit NAICS gross output
price deflators from BEA to generate a real revenue measure. This is the measure used in section
IV below, where our interest is to compare and contrast patterns in the distribution of firm-level
real revenue growth rates with the patterns for employment growth rates we have detected in
prior work. This measure of real revenue growth can be interpreted as real gross output growth,
but variation across firms does include firm and detailed industry (within 3-digit NAICS)
changes in relative prices.
In section V, our objective is to construct a relative measure of firm-level labor
productivity within detailed industries. Specifically, the measure we use is (the log of) real
revenue per worker deviated from detailed (6-digit NAICS) industry-by-year means. By
deviating from detailed industry-year means we control for several factors. First, we control for
relative price differences across detailed industries so our measure of labor productivity is
consistent with a relative gross output per worker measure within detailed industries. Second,
prior research (see, e.g., Foster, Haltiwanger and Krizan (2001, 2006)) has shown that relative
gross output per worker within industries has a high correlation with relative value added per
worker within industries and a strong correlation with relative TFP measures within industries.
This reflects the fact that there are similar patterns of, for example, materials shares across firms
in the same industry as well as other factor shares such as capital shares. The use of a measure
of relative gross output per worker within detailed industries mitigates but does not obviate the
concerns of using this measure of productivity relative to using the more appropriate measure,
TFP.
One potential limitation of our relative labor productivity measure is that large multi-unit
establishment firms may be operating in multiple 6-digit NAICS industries. Our assignment of a

21
firm to a single industry implies a potential source of measurement error especially for such
firms.22 We note, however, that over 95 percent of all firms and more than 99 percent of all
young (less than five year old) firms are single unit establishment firms. This implies that the
industry-by-year mean we deviate from is very similar in practice to the industry-by-year mean
for single unit establishment firms. In turn our quantification of relative within-industry
productivity dispersion and the growth/productivity relationship is very similar to findings that
restrict attention to single unit establishment firms only. Multi-unit firms constitute a small share
of firms but more than 50 percent of employment, so they are important for some of the
counterfactual analysis below when we explore aggregate implications. We provide some
further perspective on their role in our discussion of the counterfactual analysis below.
Given the difficulties associated with measuring the output and productivity of firms in
the Finance, Insurance, and Real Estate sectors, we omit firms in those industries (NAICS 52-53)
from all analysis below.
IV. Declining Dynamism and Skewness in the Growth Rate Distribution of Real
Revenue
An important question raised by the Decker et al. (2016b) study of employment growth
rate distributions (summarized in section II.A.a) is whether post-2000 declines in gross job flows
and the dispersion and skewness of firm employment growth rates have been accompanied by
similar patterns in other measures of business dynamism. In particular, a key question is whether
22 This limitation of assigning a single industry to firm-level observations is a common limitation of using firm-level data (e.g., COMPUTSTAT or ORBIS). We have the advantage that we have the underlying establishment-level data with detailed industries assigned at the establishment level and we know the employment distribution by industry across establishments in the same firm every year. We also have information in the Economic Census years about the sales distribution across establishments within the same firm. We can, in principle, exploit this information to construct measures of relative productivity that take into account the multi-industry activity of large, multi-unit firms. We plan to explore this in future drafts of the paper.

22
the decline of high-employment-growth activity at the firm level has been matched by
adjustment on other margins, such as stronger high-growth activity when measured by real
revenue. Declining high-employment-growth activity matched by stable or rising high-output-
growth activity might suggest that observed changes in labor market dynamism are benign for
productivity or reflect changes in business models that reduce labor demand while preserving
profitability.23
The addition of real revenue to economy-wide business microdata allows us to shed light
on this question; we find that patterns of real revenue growth dispersion and skewness have seen
declines over the same period during which employment growth dispersion and skewness fell.
We study the distribution of real revenue growth rates across firms for the period 1997 to 2013,
the years for which we have real revenue data at the firm level.
For the analysis that follows, we employ a real revenue growth rate concept that is
analogous to the employment growth rate developed by Davis, Haltiwanger and Schuh (1996)
(hereafter DHS) which can accommodate entry and exit. That is, we define real revenue growth
as follows:
𝑔𝑔𝑓𝑓,𝑡𝑡+1𝑌𝑌 =
𝑌𝑌𝑓𝑓,𝑡𝑡+1 − 𝑌𝑌𝑓𝑓,𝑡𝑡
0.5�𝑌𝑌𝑓𝑓,𝑡𝑡+1 + 𝑌𝑌𝑓𝑓,𝑡𝑡� (1)
where 𝑌𝑌𝑓𝑓,𝑡𝑡+1 and 𝑌𝑌𝑓𝑓,𝑡𝑡 are the real revenue of firm 𝑓𝑓 in years 𝑡𝑡 + 1 and 𝑡𝑡, respectively. The
revenue growth rate measure 𝑔𝑔𝑓𝑓,𝑡𝑡+1𝑌𝑌 is bounded in the set [−2,2] and is a second-order
approximation of the log difference for growth rates around zero. Its advantage relative to the
23 Guzman and Stern (2015) find a post-2000 decline in high-quality entrepreneurial outcomes such as high-dollar acquisition and initial public offering.

23
log difference is that it can accommodate entry and exit (i.e., zeros in 𝑡𝑡 or 𝑡𝑡 + 1).24 For ease of
exposition, we refer to real revenue as “revenue” in what follows.
Figure 2 shows the interdecile range (the difference between the 90th and the 10th
percentiles) of the revenue-weighted distribution of firm-level annual revenue growth rates from
1997 to 2013 (note that the Y axis does not begin at zero).25 We report this measure of
dispersion separately for all firms and for continuing firms only (i.e., firms with positive activity
in t and t+1). The solid lines show that this measure exhibits considerable cyclicality, but we
also report Hodrick-Prescott (HP) trends since our aim is to understand longer-term
developments in business dynamism.
Measured by percentage points, the dispersion of revenue growth rates is considerable.
Among continuing firms only, the 90th percentile firm had a growth rate more than 40
percentage points higher than the 10th percentile firm in 1997.26 But a clear downward trend can
be seen in this measure of revenue growth dispersion: from 1997 to 2013 the HP trend falls by
about 10 percentage points for both continuers and all firms. That is, we see that declining
business dynamism is reflected not just in measures of labor market dynamics, but in output-
related statistics such as real revenue growth as well.
We further investigate this decline in revenue growth rate dispersion by decomposing the
interdecile range into the 90-50 differential (the difference between the 90th and the 50th
percentile) and the 50-10 differential (the difference between the 50th and the 10th percentile),
24 Observe that this setup accommodates entry and exit by allowing 𝑌𝑌𝑓𝑓,𝑡𝑡 = 0 (entry) and 𝑌𝑌𝑓𝑓,𝑡𝑡+1 = 0 (exit), with 𝑔𝑔𝑓𝑓,𝑡𝑡+1𝑌𝑌 = 2 and 𝑔𝑔𝑓𝑓,𝑡𝑡+1
𝑌𝑌 = −2, respectively. 25 All results reported in the paper use RE-LBD propensity score weights as described in Section III. Also, all differences in percentiles use fuzzy percentiles where, for example, the 90th percentile is the average of 89th, 90th and 91st percentile. 26 Decker et al. (2016a) find even larger dispersion in employment growth rates; among continuers, the interdecile range of employment growth rates in 1997 was above 50 percent.
24
reported on Figure 3. The relative magnitudes of the 90-50 and the 50-10 differentials provide
an indicator of skewness or high-growth activity (note that the Y axis is again limited to illustrate
the time series patterns). Consistent with the employment-based evidence of Decker et al.
(2016b), we find a decline in the skewness of the revenue growth rate distribution. By 2004 and
2005 the skewness is completely gone.27 In unreported results, we find that this decline does not
only reflect the effects of the Great Recession, though the recession episode did involve a surge
in the 50-10 differential. We conclude that, as in employment growth rate distributions, the
decline in the dispersion of revenue growth rates reflects in part a decline in skewness and high-
growth firm activity.
A contribution of Decker et al. (2016b) was to show substantial cross-sector variation in
patterns of business dynamism over time. Figure 4 shows 90-50 and 50-10 differentials in
revenue growth rates for selected sectors (Information, Retail Trade, Services, and
Manufacturing). As in the employment data, sectors show considerable variation in revenue
growth rate dispersion (recall that the interdecile range is the sum of the 90-50 and the 50-10
gaps); also consistent with employment data, this cross-sector variation declines over time.28
Figure 4 reveals substantial variation in revenue growth skewness patterns that is broadly
consistent with Decker et al. (2016b) findings on employment growth. The Retail Trade sector
exhibits no skewness throughout the 1997-2013 period, with Manufacturing showing only
27 This precedes the closing of the skewness in the employment growth distribution by a couple of years. 28 Decker et al. (2016b) find that the 1997 sector-level interdecile ranges of employment growth rates vary from about 40 percentage points for Manufacturing to just under 70 percentage points for Services. We find that the interdecile ranges of output growth rates vary from about 40 percentage points for both Manufacturing and Retail Trade to just under 60 percentage points for Services in 1997. That is, there is less cross-sector variation in output growth rate dispersion than there is in employment growth rate dispersion, but the former is still considerable. By 2011 (the last year for which Decker et al. (2016b) have data), output growth rate interdecile ranges vary from just over 30 percentage points (Retail Trade) to just over 40 percentage points (Services and Information), while employment growth rate interdecile ranges have a similar spread with Information at the bottom and Services at the top.

25
slightly more skew with a similar time series pattern. Information begins the late 1990s with
significant skewness, suggesting the presence of strong high-revenue-growth firm activity, but
this skewness is eliminated by 2003.29 Services exhibits a similar pattern of initially high
skewness that is absent by the mid-2000s. In general, cross-industry variation in patterns of
business dynamism is present in both employment and revenue data, a potentially important fact
for understanding causes behind aggregate patterns.
Previous research established the importance of the High Tech sector for productivity and
economic growth especially over the period of strong U.S. productivity growth during the
1990’s. The Information sector can be a rough proxy for High Tech activity, but it also includes
industries like newspapers, libraries, and book publishers that do not well capture the High
Technology concept. We follow Hecker (2005) in constructing the High Tech sector based on
the composition of an industry’s workforce in terms of science, technology, engineering, and
mathematics (STEM) workers. High Tech defined in this way includes NAICS industries in
Manufacturing, Information, and Services (see Decker et al. (2016b) for further details). We pay
particular attention to High Tech even though it accounts for only about 7 percent of
employment and 8 percent of gross output in the private sector. The reason is that the High Tech
sector has played an outsized role in the productivity dynamics at the aggregate level (see, e.g.,
Fernald (2014)).
Figure 5 reports 90-50 and 50-10 differentials for both continuers and all firms in the
High Tech sector. The figure reveals a striking pattern of skewness in the sector, which began
the late 1990s at a very high level but diminished rapidly until disappearing entirely before 2008.
29 Notably, both dispersion and skewness of output growth in Information may be again rising by 2013.

26
High-growth activity (in terms of revenue) declined dramatically from its levels in the late 1990s
and has not recovered as of 2013.
Figure 6a reports 90-50 and 50-10 gaps for both young (age less than 5) and mature firms
in High Tech; Figure 6b does the same for continuing firms only. Consistent with evidence from
employment growth data, Figure 6a shows that high revenue growth activity is primarily a
characteristic of young firms (note that Figure 6a includes births and deaths). Skewness has
declined among both young and old firms, among both continuers and all firms generally. The
overall decline in high-growth activity in High Tech shown on Figure 5 reflects both a decline in
skewness within age classes and a compositional shift toward older firms (not shown), though
the entry margin appears to play a dominant role. In general the decline of high growth activity
is very much present in the High Tech sector.
The above evidence and discussion suggest that the patterns in business dynamism seen
in employment-based measures are broadly present in revenue data as well. Cross-sectional
dispersion in business outcomes has narrowed, and this narrowing reflects in part a reduction in
high-growth firm activity.
V. Declining Dynamism: Implications for Productivity
As discussed in Section II, we proceed with a framework guided by canonical models of
firm dynamics. In short, changing patterns of job reallocation at aggregate levels can be the
result of either changing patterns of “shocks” faced by firms (typically TFP shocks in model
settings but could also reflect idiosyncratic demand shocks) or changing marginal responsiveness
of firms to those shocks in terms of labor demand. This approach leads to simple empirical
questions: have shock patterns changed, or has marginal responsiveness changed?

27
To be more specific, canonical models of firm dynamics with adjustment frictions yield
decision rules for employment growth (or other input growth like investment/capital growth) that
are a function of the two key state variables each period: the realization of productivity and the
initial size of the firm. A reduced form representation of this decision rule is given by: 𝑔𝑔𝑓𝑓𝑡𝑡 =
𝑓𝑓𝑡𝑡�𝐴𝐴𝑓𝑓𝑡𝑡,𝑛𝑛𝑓𝑓𝑡𝑡−1� where 𝑔𝑔𝑓𝑓𝑡𝑡 is the growth rate of firm 𝑓𝑓 between 𝑡𝑡 − 1 and 𝑡𝑡, 𝑛𝑛𝑓𝑓𝑡𝑡−1 is initial size,
and 𝐴𝐴𝑓𝑓𝑡𝑡 is the realization of firm (idiosyncratic) productivity. This implies that changes in the
distribution of firm growth rates stem from either changes in the distribution of 𝐴𝐴𝑓𝑓𝑡𝑡 or the
responsiveness of the firm to a given realization of 𝐴𝐴𝑓𝑓𝑡𝑡. As discussed in more detail in Decker et
al. (2016a) the latter can arise from changes in adjustment frictions (see, e.g., Hopenhayn and
Rogerson (1993), Cooper and Haltiwanger (2006) and Elsby and Michaels (2013)).
As detailed in Section II, Decker et al. (2016a) investigate these questions in the
Manufacturing sector with a particular focus on High Tech Manufacturing. The focus on that
sector has the advantage of availability of the data needed to measure TFP, providing a
reasonably clean mapping from the model framework discussed above to the empirical
questions. However, a focus on Manufacturing leaves out the bulk of the U.S economy (and of
the High Tech sector specifically, which includes industries in Information and Services in
addition to Manufacturing).
In the present study, we focus on a labor productivity concept that stretches the “shocks”
vs. “responses” methodology and interpretation of Decker et al. (2016a). Relative gross output
per worker within industries (the measure of labor productivity we use in this section) is an
endogenous object along many dimensions, reflecting not only TFP but also the endogenous
intensity of other inputs such as capital. Perhaps even more importantly, changing dispersion in
measured labor productivity will also reflect changes in adjustment frictions.

28
To understand this latter point, consider the following characterization of the implied
dynamics by the canonical models of adjustment frictions discussed above (in Appendix A we
provide a more formal treatment of these arguments). In any given period, firms have new
realizations of TFP.30 Firms with positive realizations have an increase in the marginal revenue
product of labor while the opposite is true for firms with negative realizations. With adjustment
frictions, adjustment in factors of production takes time but in general those with positive
realizations grow while those with negative realizations contract. The adjustment of
employment will work toward reducing dispersion in the marginal revenue products of labor.
Given that the average revenue product of labor (measured labor productivity) and marginal
revenue product of labor are closely related (under Cobb-Douglas they are proportional),
measured labor productivity will exhibit similar patterns.
This logic implies that if adjustment frictions increase then this will endogenously slow
down the tendency for marginal revenue products to be equalized and will yield an increase in
the dispersion in measured labor productivity.31 Thus, observed increases in the within-industry
dispersion in labor productivity may reflect increases in the dispersion of shocks, increases in
adjustment frictions or both.32
30 As discussed in Decker et al. (2016a) empirical evidence supports treating firm-level TFP as being an AR1 process with a high variance of innovations and substantial persistence (between 0.6 to 0.8). 31 It is this type of insight that have led researchers such as Hsieh and Klenow (2009) to interpret increases in the dispersion of the average product of labor as representing an increase in the distortions or wedges that are impeding the equalization of marginal revenue products. The strict interpretation by Hsieh and Klenow (2009) depends on strong functional form assumptions (see Haltiwanger (2016) and Haltiwanger, Kulick and Syverson (2016)) but this perspective is potentially relevant in our setting. We take a more agnostic position here acknowledging that changes in dispersion of labor productivity may reflect shocks, changes in frictions or both. If we used the Hsieh and Klenow (2009) assumptions of Cobb-Douglas production with constant returns to scale and iso-elastic demand with common markups, then we would interpret the rising dispersion in labor productivity within sectors as reflecting increasing wedges/distortions. We cannot rule out this interpretation, and it is consistent with our findings of smaller responsiveness of growth to productivity differences within sectors. The simple model we consider in Appendix A elaborates on these issues. 32 There may be other factors at work as well. For example, changes in the dispersion of capital intensity across firms in the same industry will yield changes in the dispersion of measured labor productivity. This could arise if there is some change in the production structure of firms. This may be relevant in the presence of biased

29
Investigating the responsiveness mechanism is more complex as well without direct
measures of TFP, but it is still the case that an increase in adjustment frictions will reduce the
covariance between firm employment growth and labor productivity. Following the same logic
as above, an increase in adjustment frictions will imply that differences in marginal revenue
products will be reduced more slowly because employment adjustment will be slower. That is,
the covariance between employment growth and idiosyncratic differences in measured labor
productivity will be reduced with an increase in adjustment frictions.
Given these concerns, appropriate caution should be used in interpreting the results in this
section. They can potentially be interpreted through the lens of the “shocks” vs.
“responsiveness” perspective, but more cautiously the results here provide insights into the
changing distribution of labor productivity across firms in the same industry and the changing
covariance between realizations of labor productivity and firm survival and growth. Of
particular relevance is that the changing distribution of measured labor productivity should not
be thought of as simply a proxy for the distribution of shocks but rather the interaction of the
distribution of shocks and adjustment.33 The advantage of the current relative to prior analysis is
that we are able to study the entire High Tech sector and, indeed, the entire private nonfarm U.S.
economy. With these limitations in mind, we proceed with our investigation.34
A. Patterns of productivity dispersion
technological change where not all firms adopt new technologies. Alternatively, changes in capital intensities may reflect changes in the adjustment frictions for capital. Thus, changes in responsiveness of employment growth detected by our analysis may in fact reflect changes in the responsiveness of capital accumulation. 33 This is also true for TFP dispersion, though to a much weaker degree. Changing responsiveness of entry or exit to TFP shocks can affect measured TFP dispersion through selection. The selection effect is present for labor productivity dispersion as well, in addition to the much more significant and direct mechanism described previously. 34 Many studies have used the covariance relationship between gross output per worker and employment growth to study the contribution of reallocation dynamics to industry level productivity growth. For examples as well as surveys of the literature see Baily, Bartelsman and Haltiwanger (2001), Foster, Haltiwanger and Krizan (2001, 2006) and Syverson (2004, 2011).

30
Figure 7 reports the interdecile range (90-10 differential) of within-industry dispersion in
labor productivity.35 It is useful to note that, as in related literature, we find considerable
productivity dispersion even within detailed industries, with the productivity of the 90th
percentile firm exceeding that of the 10th percentile firm by more than 180 log points in 1996.36
Moreover, since the 1990s productivity dispersion for the U.S. economy as a whole has been
rising rather than falling. The increase over the 1996 to 2012 period is substantial—the 90-10
differential increased by more than 10 log points. In 1996, the 90th percentile firm was about 6.2
times as productive as the 10th percentile firm; by 2012 that ratio was about 6.8.
Drilling down on various slices of the data reveals a pervasive pattern of rising
productivity dispersion. Figure 8 reports the productivity interdecile range for both young and
mature firms. Productivity dispersion is much higher among young firms, but it is still
considerable among mature firms. Dispersion rises among both age classes over the time period,
with young firm dispersion reaching about 220 log points by 2012 (this suggests that young
firms at the 90th percentile are an astounding nine times as productive as the young firms at the
10th percentile). The quantitative increase in the 90-10 differential for both young and mature
firms is above 10 log points—representing a substantial increase in productivity dispersion.
35 We use propensity score weights to control for the patterns of missingness in the revenue data but we don’t use activity weights in the calculations of productivity dispersion. One measurement issue relates to our use of modal industry for multi-unit firms. Recall that we construct firm-level productivity as the log deviation of firm-level real revenue per worker from its industry-year mean (using 6-digit NAICS). Since over 95 percent of firms are single-unit establishment firms, the quantification of dispersion is overwhelmingly dominated by single-unit firms. In unreported results, we find that the dispersion patterns in Figure 7 are almost identical if we focus on single-unit establishment firms. We also find in unreported results that multi-unit establishment firms exhibit somewhat lower dispersion than single-units. We also note that we restrict attention to continuing firms in this section given that in the subsequent section we explore the relationship between growth and productivity for continuing firms. 36 This suggests that the 90th percentile firm is about six times as productive as the 10th percentile firm. These interdecile within-industry dispersion measures are very large but in line with other findings in the literature (see, e.g., Syverson (2004)).

31
In Figure 9, we report the time series of productivity dispersion broken up by broad
NAICS sector. The Information sector is substantially more dispersed than other sectors; we
find that this is (perhaps surprisingly) driven by the Information industries that fall outside of
High Tech. The gap between the Information and the other sectors may be surprising in light of
the results reported on Figure 4; that is, the Information sector is characterized by exceptionally
high productivity dispersion, but the sector’s revenue growth rate dispersion is not significantly
higher than that of other sectors.37 We discuss this finding in more detail below.38
All sectors show considerable within industry productivity dispersion, and all show an
upward trend since the late 1990s. Figure 10 reports results for High Tech only, broken up by
age. Again we see that young firms are more dispersed than mature firms. The slope of the
young firm series is relatively steep, reflecting significantly increased dispersion since the 1990s.
For young firms, the increase in the 90-19 differential is more than 20 log points. In unreported
results, we find upward-trending dispersion in both the High Tech and Nontech portions of the
U.S. economy. We also find increased dispersion among both the High Tech and Nontech
components of each of Manufacturing, Services, and Information.
Our finding of rising productivity dispersion is broadly consistent with other work
documenting increased differences between firms. For example, Andrews, Criscuolo and Gal
(2015) find a widening productivity gap between “frontier firms” and others, concluding that the
pace of technological diffusion has slowed. While the authors do not provide direct evidence for
the hypothesis that slowed technological diffusion is the cause of increasing productivity
37 Decker et al. (2016b) show that Information also does not have exceptionally high employment growth rate dispersion. 38 The Information sector is characterized by a weaker relationship between productivity and growth than other sectors. This dampens the correlation between productivity dispersion and output (and employment) growth dispersion.

32
dispersion, the diffusion hypothesis could play a role. Weakening responsiveness of growth and
survival to productivity that we document in the next section is an alternative, but not mutually
exclusive, explanation. Both explanations allow for a decoupling of technological progress and
aggregate productivity growth.39 However, as we have discussed above, declining
responsiveness is potentially consistent with increased adjustment frictions or other forces that
slow down the tendency for marginal revenue products to be equalized.
In other potentially related work, Song et al. (2016) document rising inter-firm wage
dispersion, suggesting that patterns of rising income inequality are closely linked to the evolution
of the firm distribution.40 Given commonly theorized ties between labor productivity and wages,
a connection between the productivity and wage distributions is likely and represents an
important avenue for future research (see Davis and Haltiwanger (1991) and Foster et al. (2004)
for earlier empirical treatments of the subject).
What do we make of the findings in this subsection? The evidence does not support the
hypothesis that the declining pace of reallocation is due to declining dispersion of idiosyncratic
shocks. Instead, the findings are consistent with either an increase in the dispersion of
39 Andrews, Criscuolo and Gal (2015) (ACG) provide evidence of rising productivity dispersion within broad sectors using ORBIS data on both labor productivity (similar to our approach here) and multifactor productivity (similar to Decker et al. (2016a), which relies on total factor productivity in manufacturing industries). While ORBIS coverage of the U.S. is weaker than its coverage of other countries, we view our evidence as strongly supportive of the notion that gaps between the most productive firms and other firms have increased since the late 1990s. In that sense our work is complementary to the work of ACG, though we caution that their measures of productivity dispersion are sufficiently conceptually different from ours as to make direct quantitative comparisons difficult. ACG measure the difference between “frontier firms” and average firms, where the frontier firms are usually defined as the top 50 or 100 firms within a broad (2-digit) sector, and in the case of the U.S. their unit of analysis is actually the establishment (Pinto Ribeiro, Menghinello and De Backer (2010)). Our measure of dispersion is defined within detailed (6-digit NAICS) industries and is based upon percentiles rather than the selection of an absolute number of businesses. 40 Song et al. (2016) find rising between-firm wage dispersion both in the aggregate and within industries. They point to evidence suggesting that these patterns are driven by increased “segregation” or selection of high-earning workers into high-paying firms (rather than being driven primarily by changes in firm-level earnings premiums). More work is needed to determine whether these patterns in firm-level wage dispersion are related to our findings on increased firm-level productivity dispersion.
33
idiosyncratic productivity shocks or an increase in adjustment frictions or both. In the next
section, we investigate the changing covariance structure between labor productivity and growth
that sheds further light on these issues.
B. The changing relationship between firm productivity and growth
As emphasized by Syverson (2011), one of the most ubiquitous findings in the literature
is that firms with high idiosyncratic realizations of productivity are more likely to survive and
grow. This basic finding has been shown to hold in a wide variety of settings including using
labor productivity as the measure of productivity. In this section, we explore whether the
relationship between labor productivity and growth at the firm level has changed over time. As
noted above, we view this as providing new basic facts about the covariance structure between
labor productivity and growth.
For this purpose, we estimate regressions relating employment growth from 𝑡𝑡 to 𝑡𝑡 + 1
and measured labor productivity in period 𝑡𝑡 with appropriate controls. We define employment
growth for firms between periods 𝑡𝑡 and 𝑡𝑡 + 1 using the DHS concept (see equation (1) and
surrounding discussion) that accommodates, in principle, entry and exit:
𝑔𝑔𝑓𝑓,𝑡𝑡+1𝐸𝐸 =
𝐸𝐸𝑓𝑓,𝑡𝑡+1 − 𝐸𝐸𝑓𝑓,𝑡𝑡
0.5�𝐸𝐸𝑓𝑓,𝑡𝑡+1 + 𝐸𝐸𝑓𝑓,𝑡𝑡� (2)
where 𝐸𝐸𝑓𝑓,𝑡𝑡+1 and 𝐸𝐸𝑓𝑓,𝑡𝑡 are employment at firm 𝑓𝑓 in years 𝑡𝑡 + 1 and 𝑡𝑡, respectively. For this
analysis of changing responsiveness, we restrict our attention to continuing firms (firms with
positive employment in t and t+1). In this respect, our findings on changing responsiveness

34
reflect factors such as changes in adjustment frictions that impact the growth rate of continuing
firms.41
Using various groupings of our data, we estimate the following regression:
𝑔𝑔𝑓𝑓,𝑡𝑡+1𝐸𝐸 = 𝜆𝜆𝑡𝑡+1 + 𝛽𝛽𝑦𝑦 ∗ 𝐿𝐿𝐿𝐿𝑓𝑓𝑡𝑡 ∗ 𝑌𝑌𝑌𝑌𝑌𝑌𝑛𝑛𝑔𝑔𝑓𝑓𝑡𝑡 + 𝛿𝛿1𝑦𝑦 ∗ 𝐿𝐿𝐿𝐿𝑓𝑓𝑡𝑡 ∗ 𝑌𝑌𝑌𝑌𝑌𝑌𝑛𝑛𝑔𝑔𝑓𝑓𝑡𝑡 ∗ 𝑇𝑇𝑇𝑇𝑇𝑇𝑛𝑛𝑑𝑑𝑡𝑡
+𝛿𝛿2𝑦𝑦 ∗ 𝐿𝐿𝐿𝐿𝑓𝑓𝑡𝑡 ∗ 𝑌𝑌𝑌𝑌𝑌𝑌𝑛𝑛𝑔𝑔𝑓𝑓𝑡𝑡 ∗ 𝑇𝑇𝑇𝑇𝑇𝑇𝑛𝑛𝑑𝑑𝑡𝑡2
+𝛽𝛽𝑚𝑚 ∗ 𝐿𝐿𝐿𝐿𝑓𝑓𝑡𝑡 ∗ 𝑀𝑀𝑀𝑀𝑡𝑡𝑌𝑌𝑇𝑇𝑇𝑇𝑡𝑡 + 𝛿𝛿1𝑚𝑚 ∗ 𝐿𝐿𝐿𝐿𝑓𝑓𝑡𝑡 ∗ 𝑀𝑀𝑀𝑀𝑡𝑡𝑌𝑌𝑇𝑇𝑇𝑇𝑓𝑓𝑡𝑡 ∗ 𝑇𝑇𝑇𝑇𝑇𝑇𝑛𝑛𝑑𝑑𝑡𝑡
+𝛿𝛿2𝑚𝑚 ∗ 𝐿𝐿𝐿𝐿𝑓𝑓𝑡𝑡 ∗ 𝑀𝑀𝑀𝑀𝑡𝑡𝑌𝑌𝑇𝑇𝑇𝑇𝑓𝑓𝑡𝑡 ∗ 𝑇𝑇𝑇𝑇𝑇𝑇𝑛𝑛𝑑𝑑𝑡𝑡2 + 𝑋𝑋𝑓𝑓𝑡𝑡′ Θ+ εf,t+1
(3)
where 𝑔𝑔𝑓𝑓,𝑡𝑡+1𝐸𝐸 is the DHS employment growth rate of continuing firm 𝑓𝑓 between years 𝑡𝑡 and 𝑡𝑡 +
1 defined in (2), 𝐿𝐿𝐿𝐿𝑓𝑓𝑡𝑡 is labor productivity for firm 𝑓𝑓 at time 𝑡𝑡 (recall this is log real revenue per
worker for the firm deviated from a detailed 6-digit NAICS industry by year mean), 𝑇𝑇𝑇𝑇𝑇𝑇𝑛𝑛𝑑𝑑𝑡𝑡 is a
simple linear time trend (which we also include as a quadratic term in some specifications),
𝑌𝑌𝑌𝑌𝑌𝑌𝑛𝑛𝑔𝑔𝑓𝑓𝑡𝑡 is a dummy equal to 1 if firm 𝑓𝑓 is young (age less than 5) in year 𝑡𝑡, 𝑀𝑀𝑀𝑀𝑡𝑡𝑌𝑌𝑇𝑇𝑇𝑇𝑓𝑓𝑡𝑡 is a
dummy equal to 1 if firm 𝑓𝑓 is mature (age 5 or greater) in year 𝑡𝑡, and 𝑋𝑋𝑓𝑓𝑡𝑡 is a set of controls.
The 𝑋𝑋𝑓𝑓𝑡𝑡 vector includes firm size, year effects which capture the national cycle and trends, and
the change in state unemployment rates to control for local business cycle effects. We interact
the latter with our productivity measure to permit the marginal response of growth to
productivity to change over the cycle (this is the focus of Foster et al. (2016)). The 𝑇𝑇𝑇𝑇𝑇𝑇𝑛𝑛𝑑𝑑𝑡𝑡
terms do not enter as main effects because we include a full set of year effects; these capture
41 In future drafts we will also consider the exit margin as we have in Decker et al. (2016a). Preliminary results show that the exit margin also becomes less responsive to productivity so that the overall DHS growth rate inclusive of the exit margin becomes less responsive to productivity. This implies that the reduction in the contribution of reallocation is larger taking into account the less responsive exit margin as well.

35
general trends as well as national cyclical effects. Importantly, the inclusion of the 𝑇𝑇𝑇𝑇𝑇𝑇𝑛𝑛𝑑𝑑𝑡𝑡
variable allows us to estimate a time-varying relationship between productivity and growth; in
exercises described following our discussion of the regression analysis, we exploit this time-
varying relationship to understand the changing contribution of reallocation to aggregate
productivity growth.
We estimate equation (3) using our RE-LBD propensity score weights but otherwise we
do not estimate activity-weighted regressions. Since over 95 percent of firms are single-unit
establishment firms, we find in unreported results that all of the findings in this section are robust
to restricting analysis to single unit establishment firms.42 All of the terms involving labor
productivity are fully saturated with young and mature dummies, as the evidence on the
dispersion of productivity, employment, and output growth suggests systematic differences in the
relevant dynamics of young and mature firms.
The regression in (3) is motivated by the policy functions that emerge from canonical
models of firm dynamics discussed above. In applying this logic to annual data, we estimate the
relationship between growth between 𝑡𝑡 and 𝑡𝑡 + 1 based on the realization of productivity in
period 𝑡𝑡. Using lagged productivity helps mitigate concerns about the endogeneity of labor
productivity. As we have noted, we are exploiting only labor productivity differences within
industry by year. Between-industry differences in indicators of productivity and profitability are
likely also important, but we do not have good measures of such variation.
We focus on employment growth as the outcome since it is the only endogenous factor
for which we observe changes at the firm level for the entire non-farm private sector. Decker et
al. (2016a) examine both employment growth and equipment investment in a similar setting.
42 We also find in unreported results that multi-unit establishment firms exhibit declining responsiveness.

36
The advantage of that prior work is that TFP is used as the indicator of productivity. The
disadvantage is that the prior work is restricted to the Manufacturing sector.
The parameters 𝛽𝛽𝑦𝑦 and 𝛽𝛽𝑚𝑚 are important for our analysis because they reflect the
relationship between productivity and firm growth (for young and mature firms, respectively).
Theory and previous empirical research both suggest that these parameters should be positive
and significant, indicating that high-productivity firms grow while low-productivity firms
contract.43 Aggregate (industry-level) productivity growth depends in part on these mechanisms.
Our main question of interest is whether the productivity/growth relationship has changed
over time. The answer will be determined by the parameters 𝛿𝛿1𝑦𝑦 and 𝛿𝛿1𝑚𝑚, the coefficients on the
interaction between productivity and the time trend. A weakening productivity/growth
relationship would be indicated by negative values of these parameters.44 Note that we also
allow for nonlinear behavior in this relationship with the quadratic terms associated with the
parameters 𝛿𝛿2𝑦𝑦 and 𝛿𝛿2𝑚𝑚.
Table 1 reports results of the regression from (3) for all firms and for the High Tech and
Nontech sectors separately.45 Columns 2, 4, and 6 include estimated quadratic terms (parameters
𝛿𝛿2𝑦𝑦 and 𝛿𝛿2𝑚𝑚), while columns 1, 3, and 5 allow only the linear trend effect. In all specifications,
we find a significant positive relationship between productivity in year 𝑡𝑡 and employment growth
from 𝑡𝑡 to 𝑡𝑡 + 1 among both young and mature firms (as shown by the first two rows of
coefficients). This finding is consistent with existing literature (e.g., Syverson (2011)). The
43 Recall that productivity is measured as the (log) deviation of firm-level labor productivity from its industry-year mean, reflecting the notion that the productivity/growth relationship should depend on the competitive environment faced by individual firms in their own industries. 44 Decker et al. (2016a) find negative values for these parameters when applied to TFP in the Manufacturing sector (with particularly notable patterns in High Tech Manufacturing). 45 All regressions include year 𝑡𝑡 observations for the years 1996-2012 and, consistent with the other analyses in this paper, omit the Finance, Insurance, and Real Estate sectors (NAICS 52-53).

37
productivity/growth relationship is stronger for young than for mature firms, though not
dramatically so (Decker et al. (2016a) find a larger difference between young and old firms for
the responsiveness to TFP differences). We also find that the productivity/growth relationship is
stronger among High Tech firms than for the rest of the economy.
Notably, we find a negative and statistically significant declining trend in the strength of
the productivity/growth relationship. This negative trend is typically stronger among young
firms than among mature firms, suggesting a tendency toward convergence of the
productivity/growth relationship between firms of different ages. That is, young firms
increasingly resemble mature firms in terms of the degree to which firm-level growth is related
to firm-level productivity. We also find that the weakening trend is more pronounced in the
High Tech sector than elsewhere. Broadly speaking, the evidence suggests that the growth
differential between high- and low-productivity firms in the High Tech sector is declining over
time.
Table 2 reports regression results by broad sector. As indicated by the first two rows of
coefficients, a significant productivity/growth relationship exists in each sector among firms of
all ages; this relationship is strongest in Retail Trade and weakest in Information. The weak
relationship in Information is consistent with previously discussed evidence that productivity
dispersion is exceptionally high in Information but growth rate dispersion (of either output or
employment) is generally within the range of other sectors. That is, the wide productivity
dispersion that exists in Information does not imply wide dispersion in output or employment
growth because the productivity/growth relationship is weaker in that sector. Also note that the
productivity/growth relationship is weaker in Information than in the High Tech sector (reported

38
on Table 1), again suggesting fundamental differences between the High Tech and Nontech
components of Information.
Again we find a declining trend in the productivity/growth relationship in most sectors.
The interesting exception is Retail Trade, where the trend is actually slightly positive among
young firms and negative among mature firms (though the quadratic term suggests that the
positive trend among young firms is diminishing). Retail Trade is therefore characterized by an
exceptionally high productivity/growth relationship but a much weaker trend in this relationship
than other sectors. The trend decline is remarkably rapid in the Information sector, where the
trend coefficients for both young and mature firms are more than twice as large as in any other
sector.
In summary, we find that the relationship between productivity and growth at the firm
level, while robust, is weakening over time in most sectors of the economy and among both
young and mature firms. The decline in this relationship is particularly pronounced in the High
Tech sector. Due to the limitations discussed above regarding the use of gross labor
productivity, appropriate caution is needed to interpret these results. However, based on the firm
dynamics model framework discussed above, our estimates suggest that declining rates of job
reallocation are related to changes in the firm-level relationship between growth and
idiosyncratic productivity rather than changes in patterns of productivity or profitability
dispersion.
Putting the results together from the last two sub-sections, we have produced evidence
that dispersion in labor productivity has increased over time while the covariance between labor
productivity in period 𝑡𝑡 and firm (employment) growth between 𝑡𝑡 and 𝑡𝑡 + 1 has decreased. As
discussed above, these findings are likely related as an increase in adjustment frictions is

39
consistent with both. In the exercises that follow, we investigate the implications of these
changes in firm-level behavior for aggregate productivity growth.
C. Implications for aggregate (industry-level) productivity growth
Much of the literature on the aggregate relationship between productivity and reallocation
revolves around the extent to which resources are shifted away from less productive to more
productive firms. Our analysis above is very much about such shifts, a fact that we now exploit
in a simple counterfactual exercise to provide some perspective on aggregate implications.
Our estimates described above suggest that there has been a statistically significant
weakening in the relationship between idiosyncratic differences in firm-level productivity within
industries and differences across firms in employment growth. We now attempt to roughly
quantify the substantive magnitude of this estimated trend decline by analyzing what it implies
for the contribution of job reallocation to aggregate (industry-level) productivity growth. Given
that we estimated our growth/productivity relationship for continuing firms, the exercises in this
section focus on the changing contribution of reallocation to productivity growth for continuing
firms.
For each year, we compute a base year (industry-level) productivity index as follows:46
46 This type of productivity index has been actively used in the literature. See Baily, Bartelsman and Haltiwanger (2001) and Foster, Haltiwanger, and Krizan (2001, 2006). This yields measures of labor productivity at the industry and aggregate level that track standard labor productivity measures (e.g., those from BLS) well. In unreported results we find that the index from (4) aggregated to the economy-wide level matches BLS labor productivity patterns quite well. Much of the literature uses various types of shift share decompositions to consider within- and between-firm components of aggregate productivity growth. In this sub-section, we do something related but instead of a simple accounting decomposition, we use the estimated models of the relationship between firm growth and productivity to generate counterfactual estimates of the contribution of reallocation under different scenarios. Specifically, the difference in the contribution using the covariance relationship at the beginning of the sample vs. the contribution using the trend changes in the covariance relationship from Tables 1 and 2. We also note that in this exercise that multi-unit establishment firms play a potentially important role since this is an activity-weighted exercise. Our regression specifications control for firm size but one might want to permit the changing responsiveness to differ between single unit and multi-unit establishment firms. We will consider such specifications in future drafts. We note, however, that in unreported results we find in specifications of the regressions where estimated coefficients are permitted to vary by multi-unit status that we find that multi-unit establishment firms exhibit similar patterns of declines in responsiveness as single-units. This suggests that our

40
𝐿𝐿𝐿𝐿𝑡𝑡 = �𝜃𝜃𝑓𝑓𝑡𝑡𝐿𝐿𝐿𝐿𝑓𝑓𝑡𝑡𝑓𝑓
(4)
where 𝜃𝜃𝑓𝑓𝑡𝑡 is the employment weight for firm 𝑓𝑓 in year 𝑡𝑡, and 𝐿𝐿𝐿𝐿𝑓𝑓𝑡𝑡 is firm-level productivity (log
deviation from industry-year mean). This construction of aggregate productivity readily lends
itself to shift-share counterfactuals. We use the estimated regression models described above to
generate a counterfactual index given by:
𝐿𝐿𝐿𝐿𝑡𝑡+1𝐶𝐶 = �𝜃𝜃𝑓𝑓,𝑡𝑡+1𝐶𝐶 𝐿𝐿𝐿𝐿𝑓𝑓𝑡𝑡
𝑓𝑓
(5)
where 𝜃𝜃𝑓𝑓,𝑡𝑡+1𝐶𝐶 is the predicted employment share for firm 𝑓𝑓 in year 𝑡𝑡 + 1 based upon the estimated
model. In other words, the regression model provides a prediction for employment growth of
every firm based upon “state” variables including firm age and productivity in year 𝑡𝑡; this
prediction implies an employment level for year 𝑡𝑡 + 1 that allows us to generate a counterfactual
employment share for every firm. We conduct this exercise by setting business cycle effects to
zero, and we use the model specifications that include quadratic terms for the trend variable (the
linear models produce nearly identical results).
Given that we use firm-level productivity measured as deviations from within industry-
by-year means, this calculation yields an estimate of the implied increase in within-industry
productivity from reallocation effects alone. Moreover, since the firm-level distribution of
current specifications are likely robust to consideration of this potential source of heterogeneity in changing responsiveness.

41
productivity is held constant (in each year) for this exercise, the change only reflects the
interaction of the predicted changes in the distribution of employment with where firms sit in the
within-industry productivity distribution.
Productivity gains from model-driven reallocation are given by 𝐿𝐿𝐿𝐿𝑡𝑡+1𝐶𝐶 − 𝐿𝐿𝐿𝐿𝑡𝑡, that is, the
difference in aggregate productivity that results only from reallocating employment between
firms of varying productivity according to model growth predictions while holding the
unweighted distribution of productivity constant. We construct two different model
counterfactuals to study the substantive effect of the trend decline in the productivity/growth
relationship. First we construct the gains from reallocation using the full model including the
estimated trend effects. Then we construct the gains from reallocation based on the model but
omitting the trend effects, that is, leaving the productivity/growth relationship at its 1997 level.
The difference between these two quantities reflects the gap between counterfactual aggregate
productivity with and without the declining trend in the productivity/growth relationship. The
exercise can be concisely described as follows:
∆𝑡𝑡𝑡𝑡+1= �𝐿𝐿𝐿𝐿𝑡𝑡+1𝐶𝐶,𝑡𝑡𝑡𝑡𝑡𝑡𝑡𝑡𝑡𝑡 − 𝐿𝐿𝐿𝐿𝑡𝑡� − �𝐿𝐿𝐿𝐿𝑡𝑡+1
𝐶𝐶,𝑡𝑡𝑛𝑛 𝑡𝑡𝑡𝑡𝑡𝑡𝑡𝑡𝑡𝑡 − 𝐿𝐿𝐿𝐿𝑡𝑡� (6)
where 𝐿𝐿𝐿𝐿𝑡𝑡+1𝐶𝐶,𝑡𝑡𝑡𝑡𝑡𝑡𝑡𝑡𝑡𝑡 is the counterfactual model-based aggregate productivity that includes trend
effects, and 𝐿𝐿𝐿𝐿𝑡𝑡+1𝐶𝐶,𝑡𝑡𝑛𝑛 𝑡𝑡𝑡𝑡𝑡𝑡𝑡𝑡𝑡𝑡 is the counterfactual model-based aggregate productivity that excludes
the declining trend in the strength of the growth/productivity relationship. This “diff-in-diff”
counterfactual can be computed for every year and can be thought of as a rough estimate of the
degree to which the weakening relationship between productivity and growth at the firm level
can account for slowed productivity growth.

42
Figure 11 reports this counterfactual exercise for the whole economy (excluding Finance,
Insurance, and Real Estate). Each annual observation reports ∆𝑡𝑡𝑡𝑡+1, or the amount by which the
trend effects in the regression model have reduced reallocation-driven productivity growth from
year 𝑡𝑡 to 𝑡𝑡 + 1. For example, the observation for 𝑡𝑡 + 1 = 1997 has ∆𝑡𝑡𝑡𝑡+1= 0 because the trend
variable begins then. But the 2004 observation shows that the model-generated productivity
growth from 2003 to 2004 would have been about 1 log point higher (∆𝑡𝑡𝑡𝑡+1= −0.01) if the
adjustment dynamics immediately reverted to the stronger responsiveness in 1997 given the
dispersion in productivity in 2003.
This estimate potentially reflects cumulative factors. To understand this, consider an
increase in adjustment frictions as the source of the reduced covariance between firm growth and
the realization of productivity. As adjustment frictions increase, dispersion in labor productivity
will endogenously increase over time for reasons discussed above. Such effects will cumulate
over time reflecting both current and cumulative past shocks that have not been adjusted to (or
have been adjusted to less than in the past). The diff-in-diff calculation each year is thus an
estimate of the gains there would be from reallocation if adjustment dynamics suddenly reverted
to their more responsive 1997 rates using the current dispersion of labor productivity, which is in
part driven by previous adjustment dynamics.
By 2013, the slower implied adjustment over time has potentially built up substantially
increased dispersion in labor productivity. As such, there are large potential gains from reverting
to the rapid responsiveness of the late 1990s applied to the wide dispersion of productivity in
2012. The productivity differentials generated by the counterfactual is about 2.5 log points by
2013. After taking advantage of these immediate gains, the gains would not persist as more
rapid adjustment would imply a reduction in the dispersion in labor productivity. If, for
43
example, the shock processes were the same as back in 1997 then ultimately the gains from
reallocation would converge back to their 1997 level. In sum, the large magnitude of the ∆𝑡𝑡𝑡𝑡+1
productivity growth gaps follows from both the direct effect of a weaker firm-level
productivity/growth relationship in that year and the indirect, cumulative effect of increased
productivity dispersion that creates larger potential gains from reallocation.
Figure 12 reports the results of the counterfactual exercise for both High Tech and
Nontech. As suggested by the results on Table 1, the productivity differential is exceptionally
large and rapidly widening in High Tech, reaching about 5 log points annually by 2013. Again,
this potentially reflects cumulative effects especially given the evidence in the prior section
showing the rapidly rising dispersion in labor productivity in the High Tech sector.47
There are a variety of reasons to be cautious in interpreting the magnitudes of these
counterfactuals. For one, our use of linear and quadratic trends is a simple means of detecting
changing covariance structure between growth and productivity over time. However,
deterministic trends especially with a quadratic can yield quantitatively large predictions at the
end of a sample.48 For another, while we have included many controls to capture potential
changes in the responsiveness of growth to productivity over the cycle, our trend estimates may
be contaminated by the very large cyclical downturn that occurs towards the end of our sample
period. Foster et al. (2016) find that the Great Recession was less cleansing than prior downturns
especially among young firms. They argue this is consistent with the view that the financial
crisis distorted the relationship between fundamentals and growth. It may be that we are in part
47 In unreported results we find that the Information sector has similarly large productivity reduction from reduced responsiveness. 48 We do not consider the inclusion of the quadratic term to be a major concern. In unreported work, we calculate the productivity gap counterfactuals using the linear-only model that omits quadratic terms, and the results are nearly unchanged. In other unreported work we estimate the regression models using year indicator variables in place of the linear and quadratic trend variables. The resulting year-specific productivity/growth relationship terms show a pattern that declines nearly linearly throughout the time period.

44
capturing those effects especially to the extent that credit markets were slow to recover for young
firms (see Fort et. al. (2013) and Davis and Haltiwanger (2016) for analysis supporting this
hypothesis).
Finally, it is important to note that we are focusing only on the reallocation component of
productivity growth. There may be within-firm productivity growth effects that either reinforce
or offset the effects we have detected. Fernald (2014) and Byrne et al. (2016) highlight many
factors that are likely contributing to within firm declines in productivity growth in the post-2000
period. In addition to the factors they emphasized, there may be a role for declining
entrepreneurship in declining within-firm productivity growth. If young firms play a critical role
in the innovative process then a decline in the share of young firm activity can also contribute to
a declining pace of within firm productivity growth. Exploring this hypothesis should be a
priority in future research.
VI. Concluding Remarks
The post-2000 period in the U.S. has exhibited declines both in various indicators of
business dynamism and in aggregate productivity growth. The decline in both has been most
dramatic in the High Tech sectors of the economy. This paper explores possible connections
between these two distinct but potentially related trends by exploiting rich new microdata on
firm-level productivity.
Before focusing on the post-2000 period, reconciling the patterns of dynamism and
productivity growth prior to 2000 is relevant. Productivity growth surged in the U.S. from the
late 1980s through the 1990s. Over this same period, overall indicators of business dynamism
like business formation and job reallocation rates declined. Reconciling these disparate trends is

45
possible by taking into account the changing nature and character of the decline in indicators of
business dynamism over time. During the 1980s and 1990s, the decline in business formation
rates and job reallocation was dominated by the Retail Trade sector. During this period, there
was a well-documented shift away from Mom and Pop retail businesses to large, national chains.
Since the evidence also shows that the productivity of large, national chains is substantially
greater than that of Mom and Pop businesses, this decline in dynamism in Retail Trade arguably
reflects benign changes in the business model so that the typical Retail Trade establishment has
become both more productive and more stable over time. Evidence shows that much of the
aggregate increase in productivity in the Retail Trade sector in the pre-2000 period is associated
with this structural change within Retail Trade. Thus, rather than a source of inconsistency, the
declines in indicators of business dynamism in Retail Trade in the 1980s and 1990s are
consistent with surging productivity in that sector over this period.
In the 1990s, the High Tech sector exhibited increases in the pace of reallocation and
business formation rates. This is the sector that led the aggregate increases in productivity.
After 2000, the High Tech sector was the sector with the largest declines in the indicators of
business dynamism. Thus, the pattern of a rise and then decline in indicators of business
dynamism in the High Tech sector is broadly consistent with the timing of the rise and then
decline in the pace of productivity growth in the High Tech sector. The consistent timing of
these patterns suggests further exploration of the potential connection between them is
warranted.
In our recent research and this paper, we explore the potential connections using
microdata on productivity and firm growth dynamics. Theory and evidence support the view
that a substantial fraction of industry-level productivity growth is associated with productivity-

46
enhancing reallocation facilitated by growth and contraction at the establishment and firm level.
Our analysis is intended to explore whether the declines in the pace of reallocation have been a
drag on productivity. We know from the evidence on Retail Trade that declines in the pace of
reallocation need not be.
Our approach is to exploit insights from canonical models of firm dynamics that imply
that a decline in dynamism should be from one of two sources: either a change in the volatility
of shocks or a change in the responsiveness to shocks. We investigate the role of these
alternative sources with a focus on the High Tech sectors of the economy. Our prior work
focuses on the High Tech component of Manufacturing where we can investigate this connection
using the relationship between productivity as measured by TFP and firm growth dynamics in
terms of both employment growth and investment from the early 1980s to 2010. The current
paper extends this analysis to the entire private non-farm sector but for the period 1996 to 2013,
focusing on the dynamics and connections between firm-level labor productivity and
employment growth.
In our prior work, we found that the within-industry dispersion of TFP rose modestly in
the 1980s and 1990s and more sharply in the post-2000 period in High Tech Manufacturing. In
the current paper, we find that within-industry dispersion of labor productivity rose substantially
in the High Tech sectors of the economy including both the manufacturing and the non-
manufacturing components of High Tech as well as in other sectors. These findings suggest that
it is not changes in the shock processes that account for the changing patterns of reallocation in
the High Tech sector. The patterns of reallocation in High Tech (both manufacturing and non-
manufacturing) are of rising reallocation in the 1990s and then sharply declining reallocation in
the post-2000 period.

47
Instead, we find evidence of changing responsiveness of plant-level and firm-level
growth and survival to idiosyncratic differences in productivity in the High Tech sector. This
change in responsiveness is especially substantial for young firms. In our plant-level analysis of
the High Tech manufacturing sector (Decker et al. (2016a)), we found that the growth rate
differential between high- and low-productivity plants of young firms (where productivity is
measured by TFP) increased in the 1990s and then declined sharply in the post-2000 period. In
our present firm-level analysis of the High Tech sector including both manufacturing and non-
manufacturing, we find that the growth rate differential between high- and low-productivity
young firms (where productivity is measured by labor productivity) declined sharply in the post-
2000 period. In addition, we find a pattern of rising dispersion of labor productivity in High
Tech consistent with slower responsiveness.
The changing pattern of responsiveness of plant-level and firm-level growth to within-
industry productivity differences has implications for aggregate (industry-level) productivity
growth. Decker et al. (2016a) find that the increased responsiveness of growth to idiosyncratic
differences in TFP in High Tech manufacturing during the 1990s yielded an increase in the
contribution of reallocation to industry-level productivity growth. In the present study, the
decline in responsiveness of firm-level growth to idiosyncratic productivity differences within
industries yields a decline in the contribution of reallocation to industry-level productivity
growth in both the manufacturing and non-manufacturing components in the post-2000 period.
While primarily exploratory, our results highlight the importance of microdata and the firm
dynamics framework for the study of U.S. productivity dynamics. Changes in behavior at the
firm level can have quantitatively significant implications for aggregate patterns.

48
The open question is why firms with high realizations of productivity, especially those in
the High Tech sector, do not experience the same high growth as before. In our view, it is
difficult to account for the changing patterns of responsiveness and contribution of reallocation
to productivity growth without appealing to some change in either adjustment frictions for
business-level growth and/or changing margins of adjustments. Whatever the explanation, it
must account for the changing pattern of responsiveness to be greatest for young firms.
There is suggestive evidence that globalization is playing a role for the latter. That is,
within High Tech manufacturing the largest declines in responsiveness of young firms are in
those detailed sectors with the largest increase in the import penetration ratio from low wage
countries. While this can potentially help explain some of the patterns for High Tech
manufacturing, there are even larger swings in the patterns of responsiveness and the
contribution of reallocation in the overall High Tech sector (including both manufacturing and
non-manufacturing). Exploring the potential role of globalization for High Tech outside of
manufacturing is an interesting area for future research.
Since our results are consistent with an increase in adjustment frictions or other
distortions and frictions slowing down firm responsiveness, a high priority should be to
investigate and identify the potential sources of increases in adjustment frictions or other
frictions and distortions. Davis and Haltiwanger (2014) and Molloy et al. (2016) discuss various
potential sources of such increases in adjustment frictions. Given the outsized role the High
Tech sector has played in productivity acceleration and decline understanding this changing
pattern of responsiveness of firms (especially young firms) in High Tech should be a high
priority.

49
References
Acemoglu, Daron, Ufuk Akcigit, Nicholas Bloom, and William R. Kerr. 2013.
“Innovation, Reallocation, and Growth.” NBER Working Paper No. 18993.
Andrews, Dan, Chiara Criscuolo, and Peter N. Gal. 2015. “Frontier Firms, Technology
Diffusion and Public Policy: Micro Evidence from OECD Countries.” OECD:
The Future of Productivity: Main Background Papers.
Bachmann, Rüdiger and Christian Bayer. 2013. “Wait-and-See Business Cycles.”
Journal of Monetary Economics 60(6): 704-19.
Baily, Martin Neil, Charles Hulten, and David Campbell. 1992. “Productivity Dynamics
in Manufacturing Plants.” In Brookings Papers on Economic Activity:
Microeconomics, ed. Clifford Winston and Martin Neil Baily. Washington, DC:
Brookings Institution Press.
Baily, Martin Neil, Eric Bartelsman, and John Haltiwanger. 2001. “Labor Productivity:
Structural Change and Cyclical Dynamics.” Review of Economics and Statistics,
83(3), 420-433.
Barro, Robert J. 1972. “A Theory of Monopolistic Price Adjustment.” The Review of
Economic Studies 39(1): 17-26.
Basker, Emek and Pham Hoang Van, 2010, “Imports “R” Us: Retail Chains as Platforms
for Developing Country Imports”, American Economic Review 100(2): 414-418.
Becker, Randy A., John Haltiwanger, Ron S. Jarmin, Shawn D. Klimek, and Daniel J.
Wilson. 2006. “Micro and Macro Data Integration: The Case of Capital.” Chap.
12 in Studies in Income and Wealth edited by Dale W. Jorgenson, J. Steven

50
Landefeld, and William D. Nordhaus, vol. 66, A New Architecture for the U.S.
National Accounts, pp. 541-609. Chicago, IL: National Bureau of Economic
Research, University of Chicago Press.
Bernard, Andrew B., J. Bradford Jensen, and Peter K. Schott. 2006. Survival of the Best Fit:
Exposure to Low-Wage Countries and the (Uneven) Growth of US Manufacturing Plants.
Journal of International Economics 68(1): 219-237.
Bloom, Nicholas. 2009. “The Impact of Uncertainty Shocks.” Econometrica, 623-85.
Byrne, David M. 2015. “Domestic Electronics Manufacturing: Medical, Military, and Aerospace
Equipment and What We Don’t Know about High-Tech Productivity,” FEDS Notes
2015-06-02. Board of Governors of the Federal Reserve System.
Cairó, Isabel. 2013. “The Slowdown in Business Employment Dynamics: The Role of
Changing Skill Demands.” Mimeo. At http://www.econ.upf.edu/eng/graduates
/gpem/jm/cairo.html.
Comin, Diego A. and Thomas Philippon. 2005. “The Rise in Firm-Level Volatility: Causes
and Consequences.” Chap. 3 in NBER Macroeconomics Annual 2005 edited by
Mark Gertler and Kenneth Rogoff, vol. 20, pp. 167-228. Cambridge, MA: National
Bureau of Economic Research, MIT Press.
Cooper, Russell and John Haltiwanger. 2000. “On the Nature of Capital Adjustment
Costs.” NBER Working Paper No. 7925.
Cooper, Russell and John Haltiwanger. 2006. “On the Nature of Capital Adjustment
Costs.” Review of Economic Studies 73(3); 611-33.

51
Cooper, Russell, John Haltiwanger, and Jonathan Willis. 2007. “Search Frictions:
Matching Aggregate and Establishment Observations.” Journal of Monetary
Economics 54 Supplement 1: 56-78.
Cooper, Russell, John Haltiwanger, and Jonathan Willis. 2015. “Dynamics of labor demand:
Evidence from plant-level observations and aggregate implications,” Research in
Economics, 69: 39-50.
Council of Economic Advisers. 2016. “Benefits of Competition and Indicators of Market
Power.” Council of Economic Advisers Issue Brief, April 2016, at
https://www.whitehouse.gov/sites/default/files/page/files/20160414_cea_competit
ion_issue_brief.pdf
Davis, Steven J. and John Haltiwanger. 1991. “Wage Dispersion Between and Within
U.S. Manufacturing Plants, 1963-1986.” Brookings Papers on Economic Activity:
Microeconomics, 1991, pp. 115-200.
Davis, Steven J. and John Haltiwanger. 2014. “Labor Market Fluidity and Economic
Performance.” NBER Working Paper 20479 (published in the 2014 Federal
Reserve Bank of Kansas City Jackson Hole Conference Symposium).
Davis, Steven J. and John Haltiwanger. 2016. “Dynamism Diminished: The Role of
Housing Markets and Credit Conditions.” Mimeo.
Davis, Steven J., R. Jason Faberman, and John Haltiwanger. 2012. “Labor Market Flows
in the Cross Section and Over Time.” Journal of Monetary Economics 59(1): 1-
18.
Davis, Steven J., John Haltiwanger, Ron Jarmin, and Javier Miranda. 2007. "Volatility
and Dispersion in Business Growth Rates: Publicly Traded versus Privately Held

52
Firms." Chap. 2 in NBER Macroeconomics Annual 2006 edited by Daron
Acemoglu, Kenneth Rogoff, and Michael Woodford, vol. 21, pp. 107-80.
Cambridge, MA: MIT Press.
Davis, Steven J., John C. Haltiwanger, and Scott Schuh. 1996. Job Creation and
Destruction. Cambridge, MA: MIT Press.
Decker, Ryan, John Haltiwanger, Ron Jarmin and Javier Miranda. 2014. “The Role of
Entrepreneurship in US Job Creation and Economic Dynamism” Journal of Economic
Perspectives 28(3) 3-24.
Decker, Ryan A., John Haltiwanger, Ron S. Jarmin, and Javier Miranda. 2016a. “Changing
Business Dynamism: Volatility of Shocks vs. Responsiveness to Shocks?” Working
paper.
Decker, Ryan A., John Haltiwanger, Ron S. Jarmin, and Javier Miranda. 2016b. “Where Has All
the Skewness Gone? The Decline in High-Growth (Young) Firms in the U.S.” European
Economic Review 86 (July): 4-23.
Doms, Mark, Ron Jarmin and Shawn Klimek, 2004, “Information Technology Investment and
Firm Performance in US Retail Trade”, Economics of Innovation and New Technology,
13(7): 595-613.
Dunne, Tim, Lucia Foster, John Haltiwanger and Ken Troske, 2004. “Wages and Productivity
Dispersion in U.S. Manufacturing: The Role of Computer Investment,”, Journal of Labor
Economics, 2004, 397-430.
Elsby, Michael W. L. and Ryan Michaels. 2013. “Marginal Jobs, Heterogeneous Firms, and
Unemployment Flows.” American Economic Journal: Macroeconomics 5 no. 1:1-48.

53
Ericson, Richard, and Ariel Pakes. 1995. “Markov-Perfect Industry Dynamics: A Framework for
Empirical Work.” Review of Economic Studies 62(1): 53–82.
Fernald, John. 2014. “Productivity and Potential Output Before, During, and After the Great
Recession.” Chap. 1 in NBER Macroeconomics Annual 2014 edited by Jonathan A.
Parker and Michael Woodford, vol. 29, pp. 1-51. Cambridge, MA: MIT Press.
Fort, Teresa, John Haltiwanger, Ron Jarmin and Javier Miranda. 2013. “How Firms Respond to
Business Cycles: The Role of the Firm Age and Firm Size”, IMF Economic Review, 520-
559.
Fort, Teresa C. and Shawn D. Klimek. 2016. “The Effects of Industry Classification
Changes on US Employment Composition.” Working paper.
Foster, Lucia, Cheryl Grim, and John Haltiwanger. 2016. “Reallocation in the Great
Recession: Cleansing or Not?” Journal of Labor Economics.
Foster, Lucia, Cheryl Grim, John Haltiwanger, and Zoltan Wolf. 2015a. “From Devilish
Details to Insights: Micro and Macro Productivity,” mimeo.
Foster, Lucia, Cheryl Grim, John Haltiwanger and Zoltan Wolf. 2015b. “Firm-Level
Dispersion in Productivity: Is the Devil in the Details” mimeo.
Foster, Lucia, John Haltiwanger, Shawn Klimek, C.J. Krizan and Scott Ohlmacher. 2015.
“The Evolution of National Chains: How we got here”, Center for Economic
Studies Working Paper No. CES-WP-15-10.
Foster, Lucia, John Haltiwanger, and C.J. Krizan. 2001. “Aggregate Productivity Growth:
Lessons from Microeconomic Evidence.” In New Developments in Productivity Analysis,
eds. Edward Dean, Michael Harper and Charles Hulten, 303-363. Chicago: University of
Chicago Press.

54
Foster, Lucia, John Haltiwanger, and C.J. Krizan. 2006. “Market Selection, Reallocation
and Restructuring in the U.S. Retail Trade Sector in the 1990s.” The Review of
Economics and Statistics 88(4): 748-58.
Foster, Lucia, John Haltiwanger, and Chad Syverson, 2008. “Reallocation, Firm
Turnover, and Efficiency: Selection on Productivity or Profitability?” American
Economic Review, 98(1): 394-425.
Foster, Lucia, John Haltiwanger, and Chad Syverson. 2014. “The Slow Growth of New
Plants: Learning about Demand?” Forthcoming, Economica.
Goldschlag, Nathan and Alex Tabarrok. 2014. “Is Regulation to Blame for the Decline in
American Entrepreneurship?” GMU Working Paper in Economics No. 15-11.
Gordon, Robert J. 2016. The Rise and Fall of American Growth: The U.S. Standard of
Living since the Civil War. Princeton: Princeton University Press.
Gort, Michael and Steven Klepper. 1982. “Time Paths in the Diffusion of Product
Innovations.” Economic Journal 92 no. 367:630-53.
Griliches, Zvi, and Haim Regev. 1995. "Productivity and Firm Turnover in Israeli Industry:
1979-1988, "Journal of Econometrics 65:1, 175-203.
Guzman, Jorge and Scott Stern. 2015. “The State of American Entrepreneurship: New
Estimates of the Quantity and Quality of Entrepreneurship for 15 States, 1988-
2014.” MIT Innovation Initiative Working Paper.
Haltiwanger, John. 2016. “Firm Dynamics and Productivity: TFPQ, TFPR and Demand Side
Factors." Economia, Forthcoming.
Haltiwanger, John, Ian Hathaway, and Javier Miranda. 2014. “Declining Business
Dynamism in the U.S. High-Technology Sector.” The Kauffman Foundation.

55
Haltiwanger, John, Jarmin, Ron, and Javier Miranda. 2009. “Business Dynamics
Statistics: An Overview.” Kauffman Foundation: Other Research. At
http://www.kauffman.org/uploadedFiles/BDS_handout_011209.pdf.
Haltiwanger, John, Ron Jarmin, and Javier Miranda. 2011. “Historically Large Decline in
Job Creation from Startups and Existing Firms in the 2008-09 Recession.”
Business Dynamics Statistics Briefing No. 5, The Kauffman Foundation.
Haltiwanger, John, Ron S. Jarmin, and Javier Miranda. 2013. “Who Creates Jobs? Small
vs. Large vs. Young.” Review of Economics and Statistics 95(2): 347-61.
Haltiwanger, John, Ron S. Jarmin, Robert Kulick and Javier Miranda. 2016. In Measuring
Entrepreneurial Businesses: Current Knowledge and Challenges edited by John
Haltiwanger, Erik Hurst, Javier Miranda, and Antoinette Schoar. Chicago:
University of Chicago Press.
Haltiwanger, John, Robert Kulick, and Chad Syverson, 2016. “Misallocation Measures:
Glowing Like the Metal on the Edge of a Knife,” mimeo.
Hsieh, Chang-Tai and Peter J. Klenow. 2009. “Misallocation and Manufacturing TFP in China
and India.” Quarterly Journal of Economics, 124(4): 1403-48.
Hecker, Daniel. 2005. “High-technology employment: a NAICS-based update,” Monthly Labor
Review (U.S. Dept. of Labor and U.S. Bureau of Labor Statistics), Volume 128, Number
7, July 2005: 58.
Hugo A. Hopenhayn. 1992. “Entry, Exit, and firm Dynamics in Long Run Equilibrium.”
Econometrica, Vol. 60(5): 1127-50
Hopenhayn, Hugo and Richard Rogerson. 1993. “Job Turnover and Policy Evaluation: A
General Equilibrium Analysis.” Journal of Political Economy 101(5): 915-38.

56
Hyatt, Henry R. and James Spletzer. 2013. “The Recent Decline in Employment
Dynamics.” IZA Journal of Labor Economics 2(3): 1-21.
Jarmin, Ron S., Shawn Klimek and Javier Miranda. 2009. "The Role of Retail Chains:
National, Regional and Industry Results." Chap. 6 in Studies in Income and
Wealth edited by Timothy J. Dunne, J. Bradford Jensen, and Mark J. Roberts, vol.
68, Producer Dynamics: New Evidence from Micro Data, pp. 237-62. Chicago,
IL: National Bureau of Economic Research, University of Chicago Press.
Jarmin, Ron S., and Javier Miranda. 2002. "The Longitudinal Business Database." CES
Working Paper no. 02-17. Washington, D.C.: Center for Economic Studies, U.S.
Census Bureau.
Jovanovic, Boyan. 1982. “Selection and the evolution of industry.” Econometrica, 50(3): 649–
70.
Lucas, Robert E. 1978. “On the size distribution of business firms”, in The Bell Journal of
Economics, Vol. 9, No. 2, pp. 508–523.
Molloy, Raven, Christopher L. Smith, Riccardo Trezzi, and Abigail Wozniak. 2016.
“Understanding Declining Fluidity in the U.S. Labor Market.” Brookings Papers on
Economic Activity.
Pierce, Justin and Peter Schott. 2016. “The Surprisingly Swift Decline of U.S. Manufacturing
Employment.” American Economic Review, (forthcoming).
Pinto Ribeiro, Samuel, Stefano Menghinello and Koen De Backer. 2010. “The OECD ORBIS
Database: Responding to the Need for Firm-Level Micro-Data in the OECD.” OECD
Statistics Working Papers No. 2010/01, OECD Publishing, Paris.
57
Reedy, E.J. and Robert E. Litan. 2011. “Starting Smaller; Staying Smaller: America's
Slow Leak in Job Creation.” Kauffman Foundation Research Series: Firm
Foundation and Economic Growth. At http://www.kauffman.org/research-and-
policy/starting-smaller-staying-smaller-americas-slow-leak-in-job-creation.aspx.
Schott, Peter. 2008. “The Relative Sophistication of Chinese Imports.” Economic Policy,
5-49.
Song, Jae, David J. Price, Fatih Guvenen, Nicholas Bloom and Till von Wachter. 2016.
“Firming Up Inequality.” Working paper.
Syverson, Chad. 2004. “Product Substitutability and Productivity Dispersion.” Review of
Economics and Statistics 86(2): 534-50.
Syverson, Chad. 2011. “What Determines Productivity?” Journal of Economic Literature
49(2): 326-65.
Vavra, Joseph. 2014. “Inflation Dynamics and Time-Varying Volatility: New Evidence and SS
Interpretation.” Quarterly Journal of Economics 129(1): 215-58.

58
Figure 1: Annual Firm Startup and Exit Rates, U.S. Private Non-Farm Sector, 1981-2013
Note: Startup rate is the number of new firms divided by all firms. Exit rate is number of exiting firms divided by all firms. Startups are new legal entities with all new establishments. Exits are legal entities that cease to exist with all establishments shutting down. Data from Business Dynamics Statistics. Figure 2: Dispersion in firm real revenue growth rates
Note: Y axis does not begin at zero. Solid lines indicate the interdecile range (i.e., the difference between the 90th and the 10th percentiles) of the revenue-weighted distribution of firm revenue growth rates. Dashed lines reflect HP trends with parameter set to 100. Author calculations from the RE-LBD.
6
7
8
9
10
11
12
13
1419
8119
8219
8319
8419
8519
8619
8719
8819
8919
9019
9119
9219
9319
9419
9519
9619
9719
9819
9920
0020
0120
0220
0320
0420
0520
0620
0720
0820
0920
1020
1120
1220
13
Startup Rate
Exit Rate
20
25
30
35
40
45
50
55 All firms
Continuers
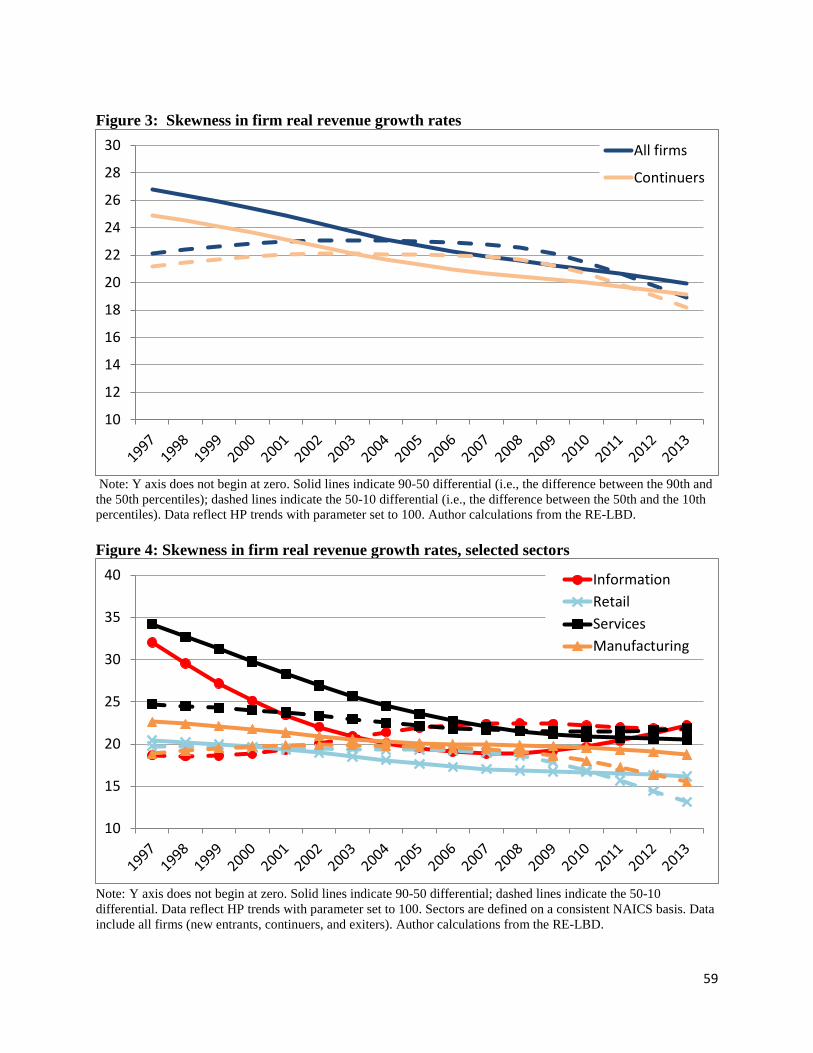
59
Figure 3: Skewness in firm real revenue growth rates
Note: Y axis does not begin at zero. Solid lines indicate 90-50 differential (i.e., the difference between the 90th and the 50th percentiles); dashed lines indicate the 50-10 differential (i.e., the difference between the 50th and the 10th percentiles). Data reflect HP trends with parameter set to 100. Author calculations from the RE-LBD. Figure 4: Skewness in firm real revenue growth rates, selected sectors
Note: Y axis does not begin at zero. Solid lines indicate 90-50 differential; dashed lines indicate the 50-10 differential. Data reflect HP trends with parameter set to 100. Sectors are defined on a consistent NAICS basis. Data include all firms (new entrants, continuers, and exiters). Author calculations from the RE-LBD.
10
12
14
16
18
20
22
24
26
28
30 All firms
Continuers
10
15
20
25
30
35
40 InformationRetailServicesManufacturing

60
Figure 5: Skewness in firm real revenue growth rates in High Tech
Note: Y axis does not begin at zero. Solid lines indicate 90-50 differential; dashed lines indicate the 50-10 differential. Data reflect HP trends with parameter set to 100. High Tech is defined as in Hecker (2005). Author calculations from the RE-LBD.
15
20
25
30
35
40All tech firms
Continuer tech firms

61
Figure 6a: Revenue Growth Skewness for the High Tech sector by firm age (all firms)
Figure 6b: Revenue Growth Skewness for High Tech by firm age (continuers)
Note: Solid lines indicate 90-50 differential; dashed lines indicate the 50-10 differential. Data reflect HP trends with parameter set to 100. Young firms have age less than 5. High Tech is defined as in Hecker (2005). Author calculations from the RE-LBD.
0
20
40
60
80
100
120
140
160
180 Tech youngTech mature
0
10
20
30
40
50
60
70
80 Tech youngTech mature

62
Figure 7: Within-industry dispersion in labor productivity
Note: Y axis does not begin at zero. Data reflect interdecile range (i.e., the difference between the 90th percentile and the 10th percentile) of log labor productivity deviated from industry by year means. Author calculations from the RE-LBD. Figure 8: Within-industry dispersion in labor productivity by firm age
Note: Y axis does not start at zero. Data reflect interdecile range of log labor productivity deviated from industry by year means. Young firms have age less than 5. Author calculations from the RE-LBD.
1.5
1.6
1.7
1.8
1.9
2
2.1
2.2
2.3
2.4
2.5
1.5
1.6
1.7
1.8
1.9
2
2.1
2.2
2.3
2.4
2.5
YoungMature

63
Figure 9: Within-industry dispersion in labor productivity, selected sectors
Note: Y axis does not begin at zero. Data reflect interdecile range of log labor productivity deviated from industry by year means. Sectors are defined on a consistent NAICS basis. Author calculations from the RE-LBD. Figure 10: Within-industry dispersion in labor productivity, High Tech by firm age
Note: Y axis does not begin at zero. Data reflect interdecile range of log labor productivity deviated from industry by year means. Young firms have age less than five. High Tech is defined as in Hecker (2005). Author calculations from the RE-LBD.
1.5
1.6
1.7
1.8
1.9
2
2.1
2.2
2.3
2.4
2.5
InformationRetailServicesManufacturing
1.5
1.6
1.7
1.8
1.9
2
2.1
2.2
2.3
2.4
2.5 Mature
Young

64
Figure 11: Reduction in Contribution of Reallocation to Productivity from Reduced Responsiveness
Note: Corresponds with counterfactual productivity difference-in-difference estimates based on regression reported on Table 1 column 2. Data from the RE-LBD. Figure 12: Reduction in Contribution of Reallocation to Productivity from Reduced Responsiveness, Tech vs. Nontech
Note: Corresponds with counterfactual productivity difference-in-difference estimates based Tech and Nontech regressions reported on Table 1. High Tech is defined as in Hecker (2005). Data from the RE-LBD.
-0.08
-0.07
-0.06
-0.05
-0.04
-0.03
-0.02
-0.01
0
-0.08
-0.07
-0.06
-0.05
-0.04
-0.03
-0.02
-0.01
0
Tech
Nontech

65
Table 1: The Relationship Between Firm Growth Between Period t and t+1 and the Realization of Productivity in Period t, all firms and High Tech All firms All firms High Tech High Tech Nontech Nontech prod*young 0.1506*** 0.1485*** 0.1714*** 0.1890*** 0.1494*** 0.1465*** 0.0002 0.0003 0.0009 0.0013 0.0002 0.0003 prod*mature 0.1267*** 0.1267*** 0.1571*** 0.1648*** 0.1256*** 0.1253*** 0.0002 0.0002 0.0008 0.0013 0.0002 0.0002 prod*trend*young -0.0027*** -0.0019*** -0.0055*** -0.0119*** -0.0025*** -0.0014*** 0.0000 0.0001 0.0001 0.0004 0.0000 0.0001 prod*trend*mature -0.0018*** -0.0018*** -0.0032*** -0.0059*** -0.0018*** -0.0017*** 0.0000 0.0001 0.0001 0.0003 0.0000 0.0001 prod*trend2*young -0.0001*** 0.0004*** -0.0001*** 0.0000 0.0000 0.0000 prod*trend2*mature 0.0000 0.0002*** 0.0000** 0.0000 0.0000 0.0000 N 49806000 49806000 2363000 2363000 47443000 47443000 R2 0.0878 0.0878 0.0937 0.0937 0.0877 0.0877 Dependent variable in all regressions is firm-level employment growth rate (DHS). All regressions include controls for state business cycle (change in state unemployment rate) and firm employment size in period t-1. Labor productivity is measured as log difference from 6-digit NAICS industry mean. High Tech is defined as in Hecker (2005). Observations rounded to nearest thousand. *** p<0.01; ** p<0.05; * p<0.10

66
Table 2: The Relationship Between Firm Growth Between Period t and t+1 and the Realization of Productivity in Period t, Selected sectors Manufacturing Retail Information Services prod*young 0.1607*** 0.1732*** 0.1452*** 0.1479*** 0.0011 0.0006 0.0025 0.0005 prod*old 0.1473*** 0.1354*** 0.1356*** 0.1245*** 0.0008 0.0005 0.0023 0.0004 prod*trend*young -0.0034*** 0.0009*** -0.0090*** -0.0025*** 0.0003 0.0002 0.0007 0.0001 prod*trend*old -0.0013*** -0.0007*** -0.0058*** -0.0012*** 0.0002 0.0001 0.0006 0.0001 prod*trend2*young -0.0001*** -0.0002*** 0.0002*** -0.0001*** 0.0000 0.0000 0.0000 0.0000 prod*trend2*old -0.0001*** -0.0001*** 0.0002*** 0.0000*** 0.0000 0.0000 0.0000 0.0000 . N 3660000 11031000 447000 22137000 R2 0.0987 0.1023 0.0819 0.0795 Dependent variable in all regressions is firm-level employment growth rate (DHS). All regressions include controls for state business cycle (change in state unemployment rate) and firm employment size in period t-1. Labor productivity is measured as log difference from 6-digit NAICS industry mean. Sectors are defined on a consistent NAICS basis. Observations rounded to nearest thousand. *** p<0.01; ** p<0.05; * p<0.10

67
Appendix A: Dispersion in Labor Productivity
To help understand the relationship between dispersion in labor productivity relative to
dispersion in TFP, consider first a simple model where firms within a given industry maximize
profits in the absence of adjustment frictions (or other distortions) given by:
𝜋𝜋𝑓𝑓𝑡𝑡 = 𝐿𝐿𝑡𝑡𝑌𝑌𝑓𝑓𝑡𝑡 − 𝑤𝑤𝑡𝑡𝑛𝑛𝑓𝑓𝑡𝑡 with 𝑌𝑌𝑓𝑓𝑡𝑡 = 𝐴𝐴𝑓𝑓𝑡𝑡𝑛𝑛𝑓𝑓𝑡𝑡𝛼𝛼 (A1)
where 𝑌𝑌𝑓𝑓𝑡𝑡 is output for firm f at time t, 𝑛𝑛𝑓𝑓𝑡𝑡 is the labor input for firm f at time t, 𝐿𝐿𝑡𝑡 is the price of
the output for the industry, 𝐴𝐴𝑓𝑓𝑡𝑡 is TFP of firm f at time t, and 𝑤𝑤𝑡𝑡 is the wage and 𝛼𝛼 < 1. We
assume the latter to put curvature in the profit function at the firm level. It might reflect fixed
factors or decreasing returns to scale from for, for example, Lucas (1978) span of control
reasons. We could also put curvature in the profit function from downward sloping demand
coming from product differentiation and assume CRTS. We only focus on labor here for
expositional ease but the arguments here easily extend to allowing multiple factors. The first
order condition for labor is given by:
𝛼𝛼𝐿𝐿𝑡𝑡𝐴𝐴𝑓𝑓𝑡𝑡𝑛𝑛𝑓𝑓𝑡𝑡𝛼𝛼−1 = 𝑤𝑤𝑡𝑡 (A2)
Firms with high TFP will be larger so that, in turn, dispersion in firm-level TFP within industries
will generate the size distribution of activity within an industry. This characterization of the size
distribution is isomorphic to that discussed and described by Lucas (1978).
However, observe in the absence of frictions or distortions, marginal revenue products
will be equalized so that average revenue product of labor are equalized as well:
𝐴𝐴𝐿𝐿𝐿𝐿𝑓𝑓𝑡𝑡 =𝐿𝐿𝑡𝑡𝑌𝑌𝑓𝑓𝑡𝑡𝑛𝑛𝑓𝑓𝑡𝑡
= 𝐿𝐿𝑡𝑡𝐴𝐴𝑓𝑓𝑡𝑡𝑛𝑛𝑓𝑓𝑡𝑡𝛼𝛼−1 =𝑤𝑤𝑡𝑡
𝛼𝛼 (A3)

68
Marginal revenue products are in this case proportional to average products of labor. This stark
result stems from the simple production function and demand structure assumed but is useful for
us to illustrate the potential role of frictions. As discussed in Haltiwanger (2016) and
Haltiwanger, Kulick and Syverson (2016), richer demand and production structures yield
dispersion in the average product of labor even in the absence of frictions. For our purposes, this
simple structure is useful without such complications because it helps us illustrate that dispersion
in labor productivity arguably stems in part from frictions that impede the instantaneous
equalization of marginal revenue products.
Adding adjustment frictions to this model pushes us toward the standard models of
adjustment frictions discussed in the main text (see, e.g., Cooper and Haltiwanger (2006), Elsby
and Michaels (2013)). With either convex or non-convex adjustment costs, the policy functions
for firms that emerge from such models have the general form: 𝑔𝑔𝑓𝑓𝑡𝑡 = 𝑓𝑓𝑡𝑡�𝐴𝐴𝑓𝑓𝑡𝑡,𝑛𝑛𝑓𝑓𝑡𝑡−1� where 𝑔𝑔𝑓𝑓𝑡𝑡
is the growth rate of firm 𝑓𝑓 between 𝑡𝑡 − 1 and 𝑡𝑡, 𝑛𝑛𝑓𝑓𝑡𝑡−1 is initial size, and 𝐴𝐴𝑓𝑓𝑡𝑡 is the realization of
firm (idiosyncratic) productivity. With such frictions, there will be dispersion in the average
revenue product of labor (labor productivity) in equilibrium that in turn will be positively related
to the dispersion in 𝐴𝐴𝑓𝑓𝑡𝑡. However, dispersion in labor productivity will also be increasing in the
adjustment frictions as is evident from the discussion here. In this simple illustrative example, in
the absence of frictions there is no dispersion in labor productivity, but as frictions increase so
will the dispersion in labor productivity.
Note as well that in the presence of adjustment frictions, increases in 𝐴𝐴𝑓𝑓𝑡𝑡 will yield an
increase in the marginal revenue product of labor (the LHS of (A2)) (and an increase in
measured labor productivity) and in turn induce firms to increase employment over time.
Increased adjustment frictions will reduce the responsiveness of the employment growth to such

69
changes in marginal revenue products (and thus measured labor productivity). Or in the context
of the empirical exercises in the paper, an increase in adjustment frictions will reduce the
covariance between employment growth and labor productivity.