Correlation of Fragility Curves for Vernacular Building ... · CORRELATION OF FRAGILITY CURVES FOR...
15
13 th World Conference on Earthquake Engineering Vancouver, B.C., Canada August 1-6, 2004 Paper No. 485 CORRELATION OF FRAGILITY CURVES FOR VERNACULAR BUILDING TYPES: HOUSES IN LALITPUR, NEPAL AND IN ISTANBUL, TURKEY Dr. Dina D’Ayala 1 SUMMARY Traditional urban housing in developing countries has been substantially eroded in the past 20 years, owing to supposedly better and safer housing conditions offered by new typologies, such as concrete frame apartment blocks. The vernacular historic buildings fall prays not only of socio-economic advancement, but also of the lack of proprietary analytical models, that professionals can reliably use to evaluate the actual safety of these buildings with respect to seismic hazard. This phenomenon is common to many countries worldwide, notwithstanding the evidence of time, i.e. the fact that the building type might have survived many destructive events in the past. The paper proposes a critical analysis of few vernacular construction types in regions of high and medium seismicity, highlighting how specific structural details are included in the construction process to better qualify their behavior against earthquakes. It then shows the application of a numerical procedure to evaluate the vulnerability of such buildings to two typologies, one common to the Katmandu Valley, Nepal and the other found in the historic districts of Istanbul. On the basis of the vulnerability analysis carried out on samples of 50 buildings for each case, fragility curves for each typology are derived and compared to typical fragility curves for modern construction. INTRODUCTION In Earthquake prone countries, vernacular architecture has typically evolved over centuries with recurring constructional details, which testify of practices hundreds of years old, directly related to the seismic hazard of these regions. These features, which enable ordinary buildings to withstand seismic shaking, developed and modified through centuries of direct experience and observation of damage. Specifically, in regions of medium seismicity, the following features will typically be found: • Corner returns and quoins, connection with party walls, regular masonry fabric (stone or brickwork), floor and wall ties, alternate orientation of floor structures; while in regions of higher seismicity, the above features will be accompanied by others, such as: • Timber ring-beams, monolithic lintels and stone frames around openings, framing and bracing of masonry with timber post and struts. 1 Dept. of Architecture and Civil Engineering, University of Bath, UK, [email protected]
-
Upload
nguyencong -
Category
Documents
-
view
224 -
download
0
Transcript of Correlation of Fragility Curves for Vernacular Building ... · CORRELATION OF FRAGILITY CURVES FOR...
13th World Conference on Earthquake Engineering Vancouver, B.C., Canada
August 1-6, 2004 Paper No. 485
CORRELATION OF FRAGILITY CURVES FOR VERNACULAR BUILDING TYPES: HOUSES IN LALITPUR, NEPAL AND IN ISTANBUL,
TURKEY
Dr. Dina D’Ayala1
SUMMARY Traditional urban housing in developing countries has been substantially eroded in the past 20 years, owing to supposedly better and safer housing conditions offered by new typologies, such as concrete frame apartment blocks. The vernacular historic buildings fall prays not only of socio-economic advancement, but also of the lack of proprietary analytical models, that professionals can reliably use to evaluate the actual safety of these buildings with respect to seismic hazard. This phenomenon is common to many countries worldwide, notwithstanding the evidence of time, i.e. the fact that the building type might have survived many destructive events in the past. The paper proposes a critical analysis of few vernacular construction types in regions of high and medium seismicity, highlighting how specific structural details are included in the construction process to better qualify their behavior against earthquakes. It then shows the application of a numerical procedure to evaluate the vulnerability of such buildings to two typologies, one common to the Katmandu Valley, Nepal and the other found in the historic districts of Istanbul. On the basis of the vulnerability analysis carried out on samples of 50 buildings for each case, fragility curves for each typology are derived and compared to typical fragility curves for modern construction.
INTRODUCTION In Earthquake prone countries, vernacular architecture has typically evolved over centuries with recurring constructional details, which testify of practices hundreds of years old, directly related to the seismic hazard of these regions. These features, which enable ordinary buildings to withstand seismic shaking, developed and modified through centuries of direct experience and observation of damage. Specifically, in regions of medium seismicity, the following features will typically be found:
• Corner returns and quoins, connection with party walls, regular masonry fabric (stone or brickwork), floor and wall ties, alternate orientation of floor structures;
while in regions of higher seismicity, the above features will be accompanied by others, such as: • Timber ring-beams, monolithic lintels and stone frames around openings, framing and bracing of
masonry with timber post and struts.
1 Dept. of Architecture and Civil Engineering, University of Bath, UK, [email protected]
Naturally, some of these details where not necessarily first developed consciously to satisfy the demand posed to structures by earthquakes, but very likely, the observation of performance during shaking of buildings with and without certain features, and the recurrence of satisfactory seismic behavior has resulted in a sort of natural selection. In the present paper two samples, one of buildings in Lalitpur, Nepal, and the other in Fener-Balat, Istanbul, Turkey, both part of the historic city centers, and both built in brickwork, are analyzed in details. The two regions are both interested by highly destructive fairly recurrent earthquakes. Specifically the paper discusses the constructional features which qualify their seismic behavior and proceeds to present the results of a limit state statistical vulnerability analysis, which provides for each sample a measure of the efficacy of the constructional features highlighted above. The paper finally develops fragility curves and derives damage scenarios for each sample. The FaMIVE (D’Ayala, Speranza 2003) procedure is used to identify collapse mechanisms corresponding to specific constructional features, and to quantify the collapse load factor associated with each mechanism so as to determine the level of shaking which will trigger a given behavior. The two studies have been carried out within EU funding rehabilitation projects.2
CHOICE AND DESCRIPTION OF THE TWO SAMPLES Fener-Balat Sample Although both districts of Fener and Balat have been inhabited since Byzantine times, and saw their highest expansion and prosperity during the 16th and 17th centuries, the current urban structure is to be dated around the second half of 19th century, and most of the building stock belongs to the period of reconstruction following the earthquake and fire of 1894 (Ambraseys and Finkel, 1991). Although the study is limited to the two districts, the typologies described are common to other historic areas of Istanbul, such as Galata and Fatih, and hence conclusions can be extended beyond the boundaries of the area of study. The fire prevention policy introduced after the great fires of 1856 - 1870 influenced greatly the building typologies and the urban lay out of the area. A regular urban grid was laid out resulting in rectangular and squared blocks, subdivided in similar plots with relatively narrow fronts and depth equal to half the depth of the block leaving little or none internal space. Brickwork construction almost totally replaced timber cladding, and each house was built with independent party walls, usually supporting the floor structures. The sample chosen for the analysis is made up of 45 buildings, and a total of 75 facades have been surveyed. The sample has been chosen so as to be representative of the original typologies of the two districts, including buildings with alterations, such as the addition of a storey or replacement of floor structures, but excluding buildings either completely rebuilt in concrete or in which a concrete frame as been introduced alongside the original masonry structure (14% of the districts total, according to 1998 census). According to a study conducted by the Fatih municipality (Stoquart et al., 1998), 70% of the building constituting the seismic vulnerability study sample were built before 1930 and 75% are listed. Lalitpur Sample The sample chosen for the analysis is made up of the houses clustered around the Chyasal Square in Lalitpur one of the three royal cities of the Katmandu valley. The neighborhood is particularly interesting for its layout and its mixture of buildings of different periods, with very different levels of maintenance,
2 EU-Fatih Municipality Programme DELTUR/MEDTQ/53-02: “Rehabilitation of Fener and Balat Districts” and Aid Asia-Urbs Programme NPL-3-05 Development Project: “Prioritizing the Cultural Heritage: Urban Management and Economic Diversification in the Sub-metropolitan City of Lalitpur and the Village Development Area of Khokana, Kingdom of Nepal” (D’Ayala, 2002)
from the 15th century onward. A significant number of original buildings have been replaced with concrete frames with more than 5 storeys, and this is very worrying, not only in term of the loss of original fabric but also in terms of the associated seismic risk that these buildings pose, given the very poor construction quality revealed during the visual survey has. This, associated with their substantially greater height and their small footprint, highlights a very vulnerable type. The traditional newari house is usually of rectangular plan shape with depth of about six meters and façades of various widths but most commonly between 4 to 8 meters (Korn 1976, NSET-Nepal 2002). The organization of the house is vertical, over 3 storeys, with a spine wall running through the height, creating front and back rooms. At the upper storey the spine wall is sometimes replaced by a timber frame system so as to create a larger continuous space. The staircase is usually a single flight to one side of the plan. The bathroom, where present, is found at ground floor, while the kitchen is on the top floor, usually directly under the roof, as a fire prevention measure. Units are arranged in long arrays around squares and common courtyards. The construction of each unit is usually independent so that the facades are not continuum over party walls but each unit forms a separate cell. In such cases connection between façades and sidewalls are usually very good. The inherent seismic resilience of this construction type is proven by the high rate of survival to historic earthquakes, such as the great Bihar-Nepal earthquake of 1934 and the more recent 1988 Udaypur Gahri earthquake (Pandey, Molnar 1988).
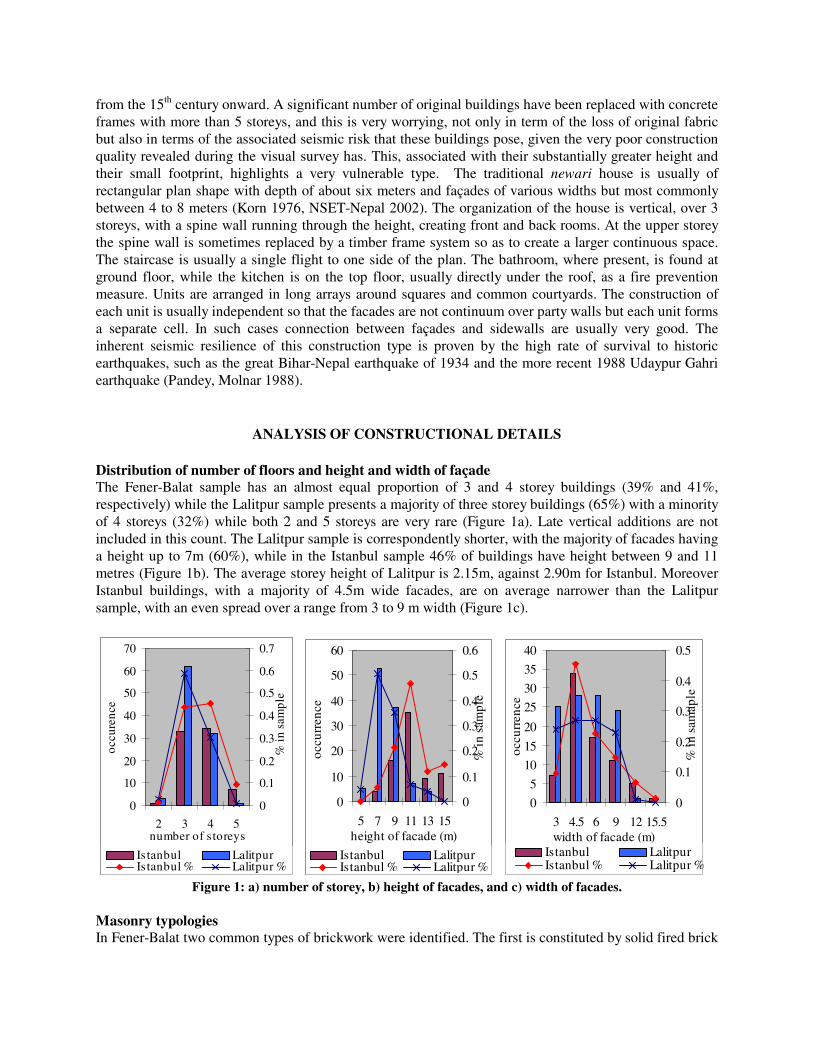
ANALYSIS OF CONSTRUCTIONAL DETAILS Distribution of number of floors and height and width of façade The Fener-Balat sample has an almost equal proportion of 3 and 4 storey buildings (39% and 41%, respectively) while the Lalitpur sample presents a majority of three storey buildings (65%) with a minority of 4 storeys (32%) while both 2 and 5 storeys are very rare (Figure 1a). Late vertical additions are not included in this count. The Lalitpur sample is correspondently shorter, with the majority of facades having a height up to 7m (60%), while in the Istanbul sample 46% of buildings have height between 9 and 11 metres (Figure 1b). The average storey height of Lalitpur is 2.15m, against 2.90m for Istanbul. Moreover Istanbul buildings, with a majority of 4.5m wide facades, are on average narrower than the Lalitpur sample, with an even spread over a range from 3 to 9 m width (Figure 1c).
0
10
20
30
40
50
60
70
2 3 4 5number of s toreys
occu
renc
e
0
0.1
0.2
0.3
0.4
0.5
0.6
0.7
% in
sam
ple
Is tanbul LalitpurIstanbul % Lalitpur %
0
10
20
30
40
50
60
5 7 9 11 13 15height of facade (m)
occu
rren
ce
0
0.1
0.2
0.3
0.4
0.5
0.6
% in
sam
ple
Istanbul LalitpurIstanbul % Lalitpur %
0
5
10
15
20
25
30
35
40
3 4.5 6 9 12 15.5width of facade (m)
occu
rren
ce
0
0.1
0.2
0.3
0.4
0.5
% in
sam
aple
Istanbul LalitpurIstanbul % Lalitpur %
Figure 1: a) number of storey, b) height of facades, and c) width of facades.
Masonry typologies In Fener-Balat two common types of brickwork were identified. The first is constituted by solid fired brick
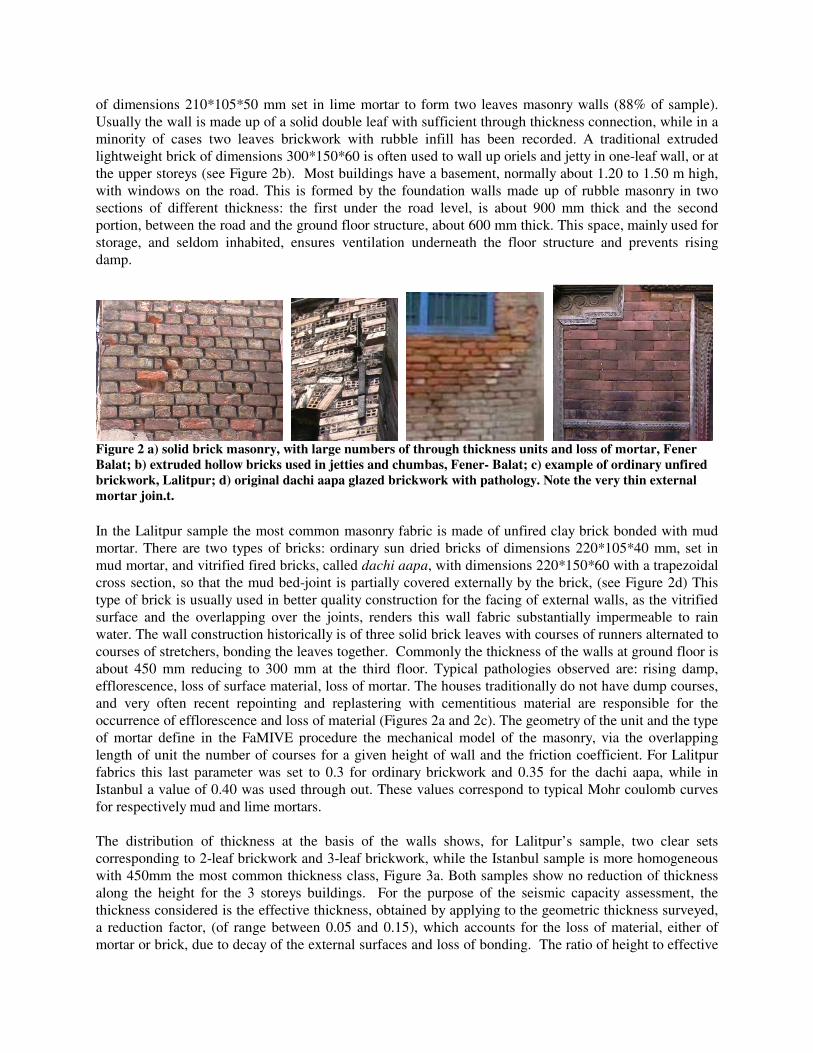
of dimensions 210*105*50 mm set in lime mortar to form two leaves masonry walls (88% of sample). Usually the wall is made up of a solid double leaf with sufficient through thickness connection, while in a minority of cases two leaves brickwork with rubble infill has been recorded. A traditional extruded lightweight brick of dimensions 300*150*60 is often used to wall up oriels and jetty in one-leaf wall, or at the upper storeys (see Figure 2b). Most buildings have a basement, normally about 1.20 to 1.50 m high, with windows on the road. This is formed by the foundation walls made up of rubble masonry in two sections of different thickness: the first under the road level, is about 900 mm thick and the second portion, between the road and the ground floor structure, about 600 mm thick. This space, mainly used for storage, and seldom inhabited, ensures ventilation underneath the floor structure and prevents rising damp.
Figure 2 a) solid brick masonry, with large numbers of through thickness units and loss of mortar, Fener Balat; b) extruded hollow bricks used in jetties and chumbas, Fener- Balat; c) example of ordinary unfired brickwork, Lalitpur; d) original dachi aapa glazed brickwork with pathology. Note the very thin external mortar join.t. In the Lalitpur sample the most common masonry fabric is made of unfired clay brick bonded with mud mortar. There are two types of bricks: ordinary sun dried bricks of dimensions 220*105*40 mm, set in mud mortar, and vitrified fired bricks, called dachi aapa, with dimensions 220*150*60 with a trapezoidal cross section, so that the mud bed-joint is partially covered externally by the brick, (see Figure 2d) This type of brick is usually used in better quality construction for the facing of external walls, as the vitrified surface and the overlapping over the joints, renders this wall fabric substantially impermeable to rain water. The wall construction historically is of three solid brick leaves with courses of runners alternated to courses of stretchers, bonding the leaves together. Commonly the thickness of the walls at ground floor is about 450 mm reducing to 300 mm at the third floor. Typical pathologies observed are: rising damp, efflorescence, loss of surface material, loss of mortar. The houses traditionally do not have dump courses, and very often recent repointing and replastering with cementitious material are responsible for the occurrence of efflorescence and loss of material (Figures 2a and 2c). The geometry of the unit and the type of mortar define in the FaMIVE procedure the mechanical model of the masonry, via the overlapping length of unit the number of courses for a given height of wall and the friction coefficient. For Lalitpur fabrics this last parameter was set to 0.3 for ordinary brickwork and 0.35 for the dachi aapa, while in Istanbul a value of 0.40 was used through out. These values correspond to typical Mohr coulomb curves for respectively mud and lime mortars. The distribution of thickness at the basis of the walls shows, for Lalitpur’s sample, two clear sets corresponding to 2-leaf brickwork and 3-leaf brickwork, while the Istanbul sample is more homogeneous with 450mm the most common thickness class, Figure 3a. Both samples show no reduction of thickness along the height for the 3 storeys buildings. For the purpose of the seismic capacity assessment, the thickness considered is the effective thickness, obtained by applying to the geometric thickness surveyed, a reduction factor, (of range between 0.05 and 0.15), which accounts for the loss of material, either of mortar or brick, due to decay of the external surfaces and loss of bonding. The ratio of height to effective
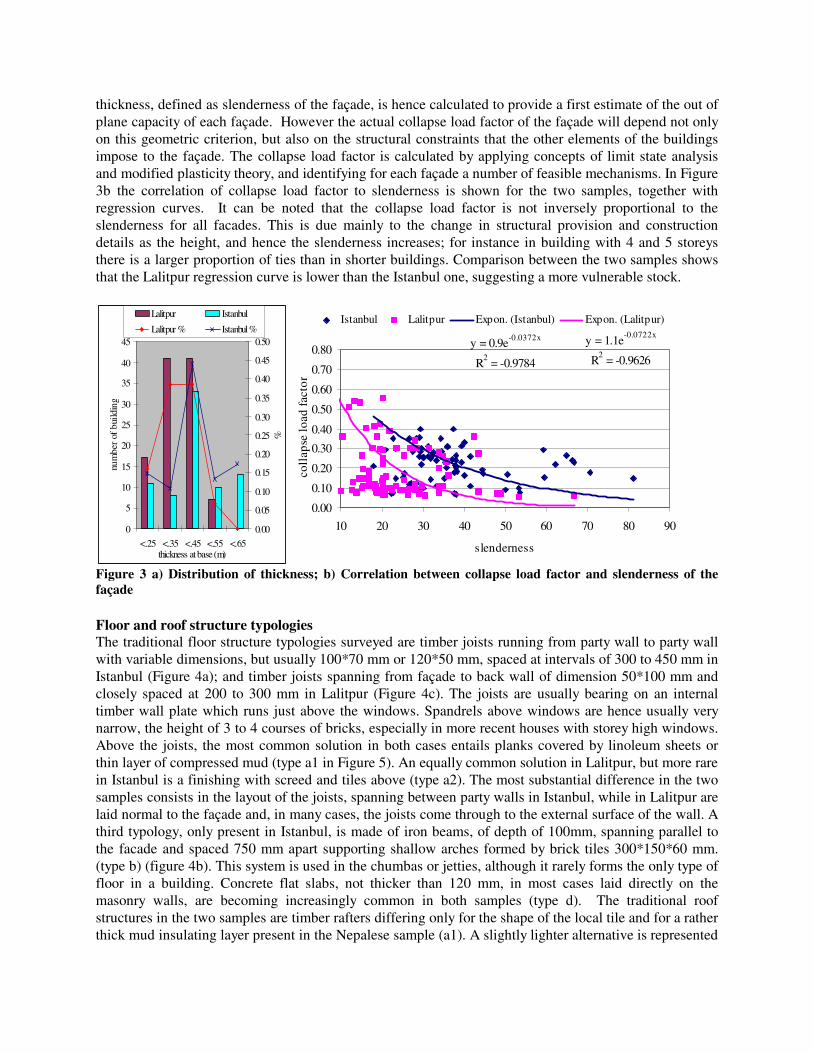
thickness, defined as slenderness of the façade, is hence calculated to provide a first estimate of the out of plane capacity of each façade. However the actual collapse load factor of the façade will depend not only on this geometric criterion, but also on the structural constraints that the other elements of the buildings impose to the façade. The collapse load factor is calculated by applying concepts of limit state analysis and modified plasticity theory, and identifying for each façade a number of feasible mechanisms. In Figure 3b the correlation of collapse load factor to slenderness is shown for the two samples, together with regression curves. It can be noted that the collapse load factor is not inversely proportional to the slenderness for all facades. This is due mainly to the change in structural provision and construction details as the height, and hence the slenderness increases; for instance in building with 4 and 5 storeys there is a larger proportion of ties than in shorter buildings. Comparison between the two samples shows that the Lalitpur regression curve is lower than the Istanbul one, suggesting a more vulnerable stock.
0
5
10
15
20
25
30
35
40
45
<.25 <.35 <.45 <.55 <.65thickness at base (m)
num
ber
of b
uild
ing
0.00
0.05
0.10
0.15
0.20
0.25
0.30
0.35
0.40
0.45
0.50
%
Lalitpur Istanbul
Lalitpur % Istanbul %
y = 0.9e-0.0372x
R2 = -0.9784
y = 1.1e-0.0722x
R2 = -0.9626
0.00
0.10
0.20
0.30
0.40
0.50
0.60
0.70
0.80
10 20 30 40 50 60 70 80 90
slenderness
coll
apse
load
fact
orIstanbul Lalitpur Expon. (Istanbul) Expon. (Lalitpur)
Figure 3 a) Distribution of thickness; b) Correlation between collapse load factor and slenderness of the façade Floor and roof structure typologies The traditional floor structure typologies surveyed are timber joists running from party wall to party wall with variable dimensions, but usually 100*70 mm or 120*50 mm, spaced at intervals of 300 to 450 mm in Istanbul (Figure 4a); and timber joists spanning from façade to back wall of dimension 50*100 mm and closely spaced at 200 to 300 mm in Lalitpur (Figure 4c). The joists are usually bearing on an internal timber wall plate which runs just above the windows. Spandrels above windows are hence usually very narrow, the height of 3 to 4 courses of bricks, especially in more recent houses with storey high windows. Above the joists, the most common solution in both cases entails planks covered by linoleum sheets or thin layer of compressed mud (type a1 in Figure 5). An equally common solution in Lalitpur, but more rare in Istanbul is a finishing with screed and tiles above (type a2). The most substantial difference in the two samples consists in the layout of the joists, spanning between party walls in Istanbul, while in Lalitpur are laid normal to the façade and, in many cases, the joists come through to the external surface of the wall. A third typology, only present in Istanbul, is made of iron beams, of depth of 100mm, spanning parallel to the facade and spaced 750 mm apart supporting shallow arches formed by brick tiles 300*150*60 mm. (type b) (figure 4b). This system is used in the chumbas or jetties, although it rarely forms the only type of floor in a building. Concrete flat slabs, not thicker than 120 mm, in most cases laid directly on the masonry walls, are becoming increasingly common in both samples (type d). The traditional roof structures in the two samples are timber rafters differing only for the shape of the local tile and for a rather thick mud insulating layer present in the Nepalese sample (a1). A slightly lighter alternative is represented
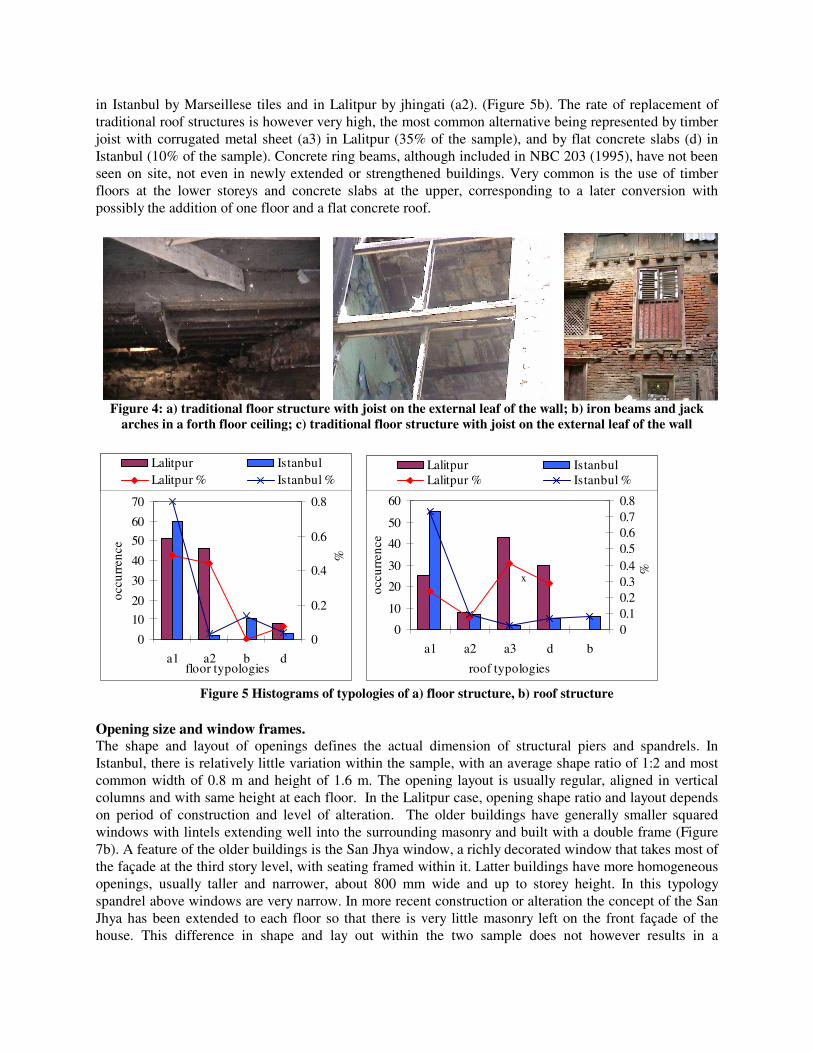
in Istanbul by Marseillese tiles and in Lalitpur by jhingati (a2). (Figure 5b). The rate of replacement of traditional roof structures is however very high, the most common alternative being represented by timber joist with corrugated metal sheet (a3) in Lalitpur (35% of the sample), and by flat concrete slabs (d) in Istanbul (10% of the sample). Concrete ring beams, although included in NBC 203 (1995), have not been seen on site, not even in newly extended or strengthened buildings. Very common is the use of timber floors at the lower storeys and concrete slabs at the upper, corresponding to a later conversion with possibly the addition of one floor and a flat concrete roof.
Figure 4: a) traditional floor structure with joist on the external leaf of the wall; b) iron beams and jack
arches in a forth floor ceiling; c) traditional floor structure with joist on the external leaf of the wall
0
10
20
30
40
50
60
70
a1 a2 b dfloor typologies
occu
rren
ce
0
0.2
0.4
0.6
0.8
%
Lalitpur Istanbul Lalitpur % Istanbul %
0
10
20
30
40
50
60
a1 a2 a3 d b
roof typologies
occu
rren
ce
00.10.20.30.40.50.60.70.8
%
Lalitpur IstanbulLalitpur % Istanbul %
x
Figure 5 Histograms of typologies of a) floor structure, b) roof structure
Opening size and window frames. The shape and layout of openings defines the actual dimension of structural piers and spandrels. In Istanbul, there is relatively little variation within the sample, with an average shape ratio of 1:2 and most common width of 0.8 m and height of 1.6 m. The opening layout is usually regular, aligned in vertical columns and with same height at each floor. In the Lalitpur case, opening shape ratio and layout depends on period of construction and level of alteration. The older buildings have generally smaller squared windows with lintels extending well into the surrounding masonry and built with a double frame (Figure 7b). A feature of the older buildings is the San Jhya window, a richly decorated window that takes most of the façade at the third story level, with seating framed within it. Latter buildings have more homogeneous openings, usually taller and narrower, about 800 mm wide and up to storey height. In this typology spandrel above windows are very narrow. In more recent construction or alteration the concept of the San Jhya has been extended to each floor so that there is very little masonry left on the front façade of the house. This difference in shape and lay out within the two sample does not however results in a
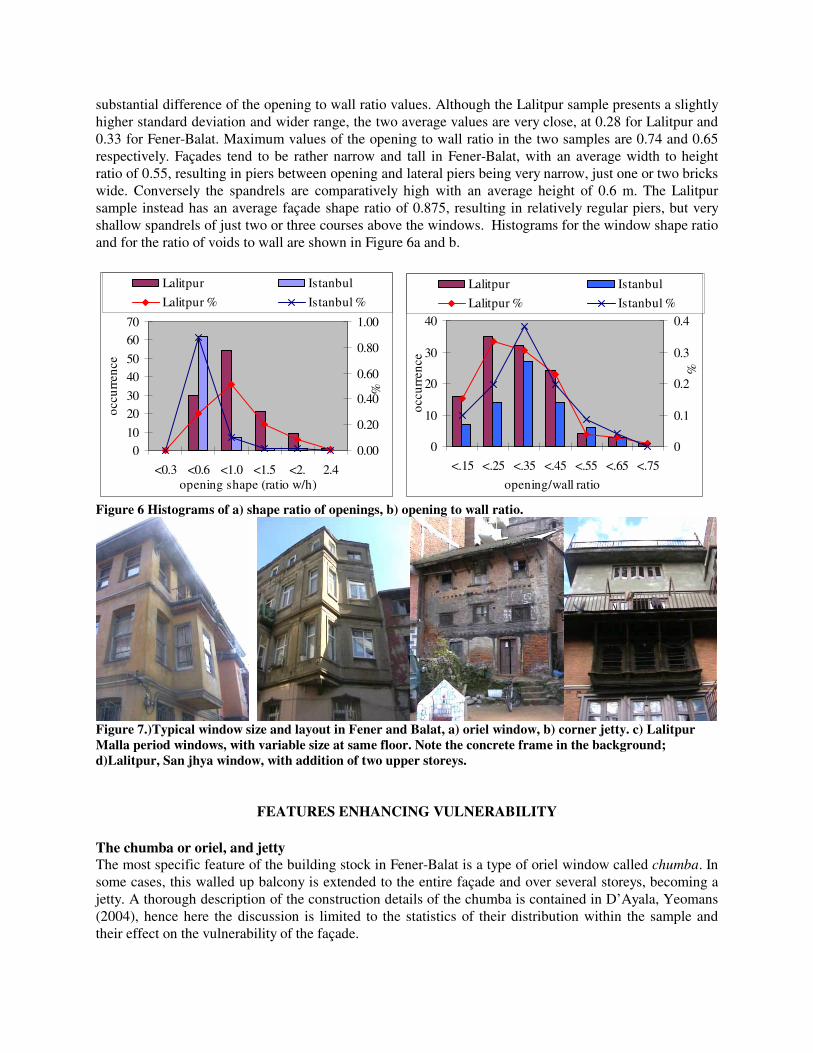
substantial difference of the opening to wall ratio values. Although the Lalitpur sample presents a slightly higher standard deviation and wider range, the two average values are very close, at 0.28 for Lalitpur and 0.33 for Fener-Balat. Maximum values of the opening to wall ratio in the two samples are 0.74 and 0.65 respectively. Façades tend to be rather narrow and tall in Fener-Balat, with an average width to height ratio of 0.55, resulting in piers between opening and lateral piers being very narrow, just one or two bricks wide. Conversely the spandrels are comparatively high with an average height of 0.6 m. The Lalitpur sample instead has an average façade shape ratio of 0.875, resulting in relatively regular piers, but very shallow spandrels of just two or three courses above the windows. Histograms for the window shape ratio and for the ratio of voids to wall are shown in Figure 6a and b.
010
2030
4050
6070
<0.3 <0.6 <1.0 <1.5 <2. 2.4opening shape (ratio w/h)
occu
rren
ce
0.00
0.20
0.40
0.60
0.80
1.00
%
Lalitpur Istanbul
Lalitpur % Istanbul %
0
10
20
30
40
<.15 <.25 <.35 <.45 <.55 <.65 <.75
opening/wall ratio
occu
rren
ce
0
0.1
0.2
0.3
0.4
%
Lalitpur Istanbul
Lalitpur % Istanbul %
Figure 6 Histograms of a) shape ratio of openings, b) opening to wall ratio.
Figure 7.)Typical window size and layout in Fener and Balat, a) oriel window, b) corner jetty. c) Lalitpur Malla period windows, with variable size at same floor. Note the concrete frame in the background; d)Lalitpur, San jhya window, with addition of two upper storeys.
FEATURES ENHANCING VULNERABILITY The chumba or oriel, and jetty The most specific feature of the building stock in Fener-Balat is a type of oriel window called chumba. In some cases, this walled up balcony is extended to the entire façade and over several storeys, becoming a jetty. A thorough description of the construction details of the chumba is contained in D’Ayala, Yeomans (2004), hence here the discussion is limited to the statistics of their distribution within the sample and their effect on the vulnerability of the façade.
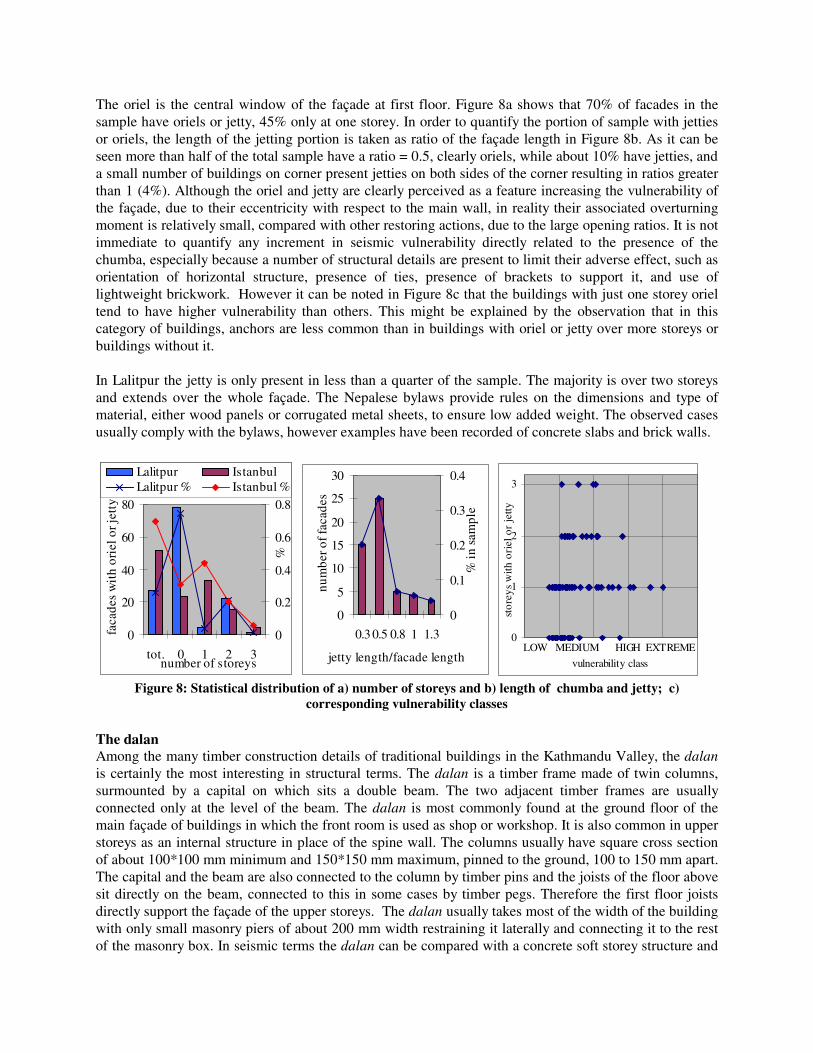
The oriel is the central window of the façade at first floor. Figure 8a shows that 70% of facades in the sample have oriels or jetty, 45% only at one storey. In order to quantify the portion of sample with jetties or oriels, the length of the jetting portion is taken as ratio of the façade length in Figure 8b. As it can be seen more than half of the total sample have a ratio = 0.5, clearly oriels, while about 10% have jetties, and a small number of buildings on corner present jetties on both sides of the corner resulting in ratios greater than 1 (4%). Although the oriel and jetty are clearly perceived as a feature increasing the vulnerability of the façade, due to their eccentricity with respect to the main wall, in reality their associated overturning moment is relatively small, compared with other restoring actions, due to the large opening ratios. It is not immediate to quantify any increment in seismic vulnerability directly related to the presence of the chumba, especially because a number of structural details are present to limit their adverse effect, such as orientation of horizontal structure, presence of ties, presence of brackets to support it, and use of lightweight brickwork. However it can be noted in Figure 8c that the buildings with just one storey oriel tend to have higher vulnerability than others. This might be explained by the observation that in this category of buildings, anchors are less common than in buildings with oriel or jetty over more storeys or buildings without it. In Lalitpur the jetty is only present in less than a quarter of the sample. The majority is over two storeys and extends over the whole façade. The Nepalese bylaws provide rules on the dimensions and type of material, either wood panels or corrugated metal sheets, to ensure low added weight. The observed cases usually comply with the bylaws, however examples have been recorded of concrete slabs and brick walls.
0
20
40
60
80
tot. 0 1 2 3number of storeys
faca
des
wit
h or
iel o
r jet
ty
0
0.2
0.4
0.6
0.8
%
Lalitpur IstanbulLalitpur % Istanbul %
0
5
10
15
20
25
30
0.3 0.5 0.8 1 1.3
jetty length/facade length
num
ber o
f fac
ades
0
0.1
0.2
0.3
0.4%
in s
ampl
e
0
1
2
3
vulnerability class
stor
eys
with
ori
el o
r je
tty
LOW MEDIUM HIGH EXTREME
Figure 8: Statistical distribution of a) number of storeys and b) length of chumba and jetty; c)
corresponding vulnerability classes
The dalan Among the many timber construction details of traditional buildings in the Kathmandu Valley, the dalan is certainly the most interesting in structural terms. The dalan is a timber frame made of twin columns, surmounted by a capital on which sits a double beam. The two adjacent timber frames are usually connected only at the level of the beam. The dalan is most commonly found at the ground floor of the main façade of buildings in which the front room is used as shop or workshop. It is also common in upper storeys as an internal structure in place of the spine wall. The columns usually have square cross section of about 100*100 mm minimum and 150*150 mm maximum, pinned to the ground, 100 to 150 mm apart. The capital and the beam are also connected to the column by timber pins and the joists of the floor above sit directly on the beam, connected to this in some cases by timber pegs. Therefore the first floor joists directly support the façade of the upper storeys. The dalan usually takes most of the width of the building with only small masonry piers of about 200 mm width restraining it laterally and connecting it to the rest of the masonry box. In seismic terms the dalan can be compared with a concrete soft storey structure and
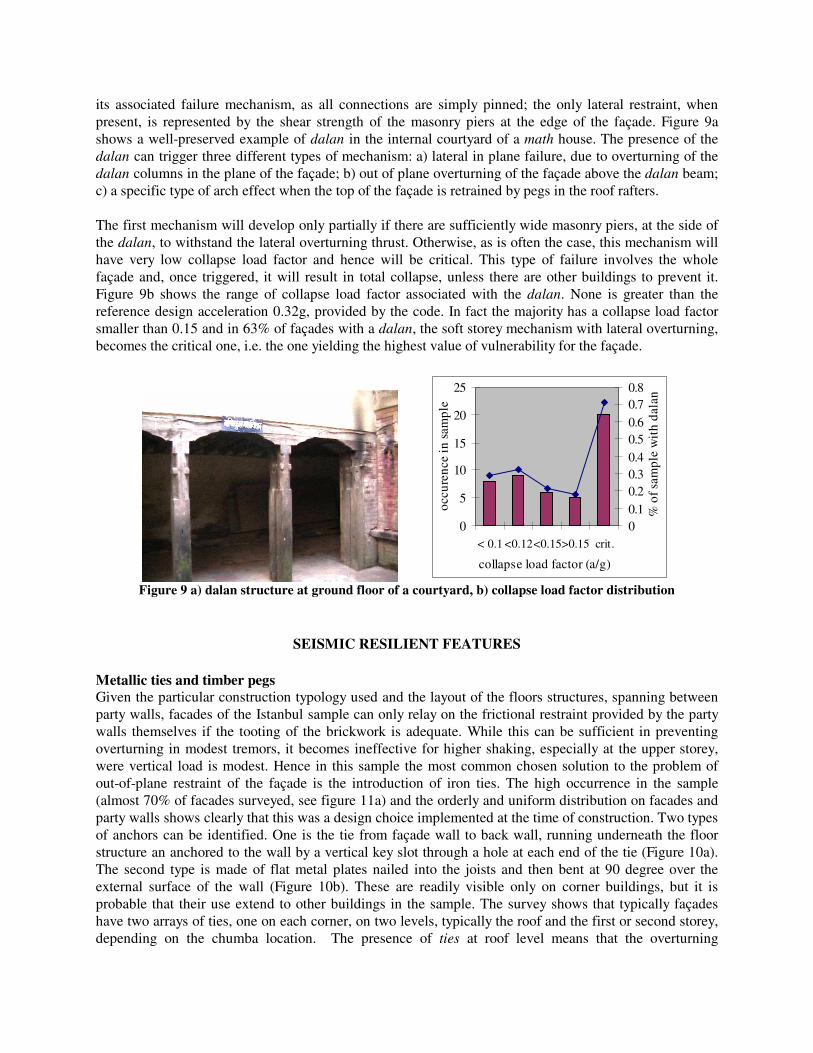
its associated failure mechanism, as all connections are simply pinned; the only lateral restraint, when present, is represented by the shear strength of the masonry piers at the edge of the façade. Figure 9a shows a well-preserved example of dalan in the internal courtyard of a math house. The presence of the dalan can trigger three different types of mechanism: a) lateral in plane failure, due to overturning of the dalan columns in the plane of the façade; b) out of plane overturning of the façade above the dalan beam; c) a specific type of arch effect when the top of the façade is retrained by pegs in the roof rafters. The first mechanism will develop only partially if there are sufficiently wide masonry piers, at the side of the dalan, to withstand the lateral overturning thrust. Otherwise, as is often the case, this mechanism will have very low collapse load factor and hence will be critical. This type of failure involves the whole façade and, once triggered, it will result in total collapse, unless there are other buildings to prevent it. Figure 9b shows the range of collapse load factor associated with the dalan. None is greater than the reference design acceleration 0.32g, provided by the code. In fact the majority has a collapse load factor smaller than 0.15 and in 63% of façades with a dalan, the soft storey mechanism with lateral overturning, becomes the critical one, i.e. the one yielding the highest value of vulnerability for the façade.
0
5
10
15
20
25
< 0.1 <0.12<0.15>0.15 crit.
collapse load factor (a/g)
occu
renc
e in
sam
ple
00.10.20.30.40.50.60.70.8
% o
f sam
ple
wit
h da
lan
Figure 9 a) dalan structure at ground floor of a courtyard, b) collapse load factor distribution
SEISMIC RESILIENT FEATURES Metallic ties and timber pegs Given the particular construction typology used and the layout of the floors structures, spanning between party walls, facades of the Istanbul sample can only relay on the frictional restraint provided by the party walls themselves if the tooting of the brickwork is adequate. While this can be sufficient in preventing overturning in modest tremors, it becomes ineffective for higher shaking, especially at the upper storey, were vertical load is modest. Hence in this sample the most common chosen solution to the problem of out-of-plane restraint of the façade is the introduction of iron ties. The high occurrence in the sample (almost 70% of facades surveyed, see figure 11a) and the orderly and uniform distribution on facades and party walls shows clearly that this was a design choice implemented at the time of construction. Two types of anchors can be identified. One is the tie from façade wall to back wall, running underneath the floor structure an anchored to the wall by a vertical key slot through a hole at each end of the tie (Figure 10a). The second type is made of flat metal plates nailed into the joists and then bent at 90 degree over the external surface of the wall (Figure 10b). These are readily visible only on corner buildings, but it is probable that their use extend to other buildings in the sample. The survey shows that typically façades have two arrays of ties, one on each corner, on two levels, typically the roof and the first or second storey, depending on the chumba location. The presence of ties at roof level means that the overturning
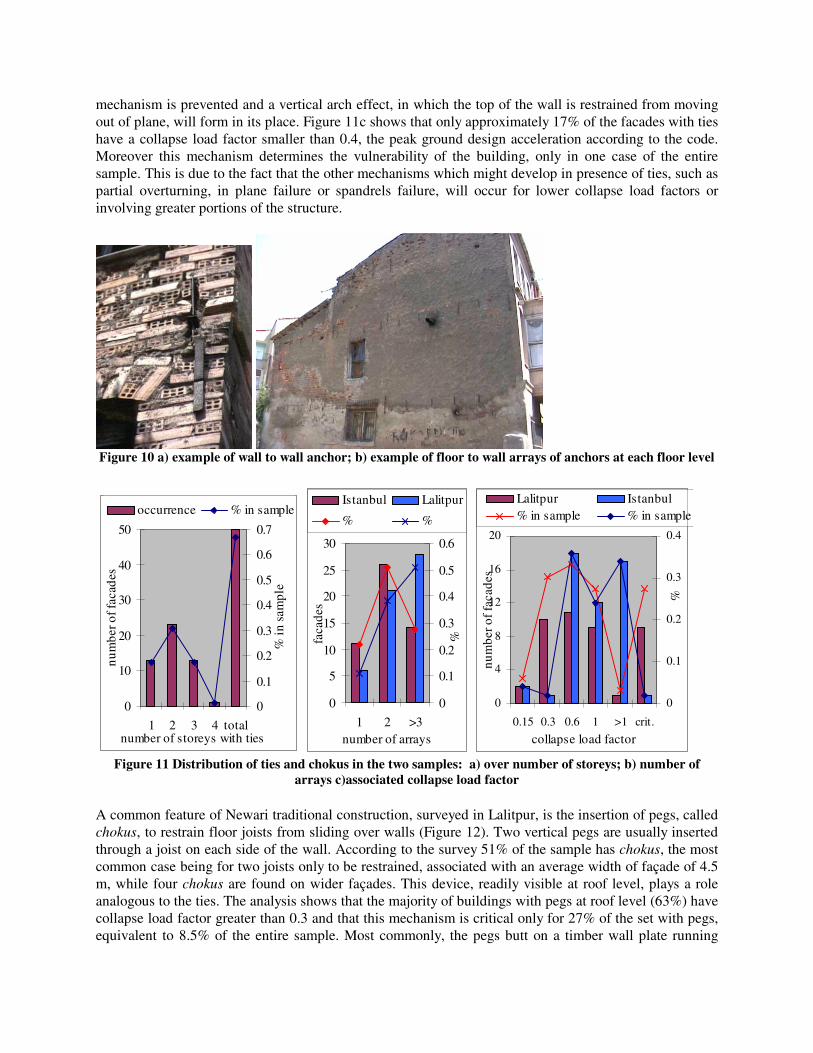
mechanism is prevented and a vertical arch effect, in which the top of the wall is restrained from moving out of plane, will form in its place. Figure 11c shows that only approximately 17% of the facades with ties have a collapse load factor smaller than 0.4, the peak ground design acceleration according to the code. Moreover this mechanism determines the vulnerability of the building, only in one case of the entire sample. This is due to the fact that the other mechanisms which might develop in presence of ties, such as partial overturning, in plane failure or spandrels failure, will occur for lower collapse load factors or involving greater portions of the structure.
Figure 10 a) example of wall to wall anchor; b) example of floor to wall arrays of anchors at each floor level
0
10
20
30
40
50
1 2 3 4 totalnumber of storeys with ties
num
ber o
f fac
ades
0
0.1
0.2
0.3
0.4
0.5
0.6
0.7
% in
sam
ple
occurrence % in sample
0
5
10
15
20
25
30
1 2 >3number of arrays
faca
des
0
0.1
0.2
0.3
0.4
0.5
0.6
%
Istanbul Lalitpur
% %
0
4
8
12
16
20
0.15 0.3 0.6 1 >1 crit.
collapse load factor
num
ber o
f fac
ades
0
0.1
0.2
0.3
0.4
%
Lalitpur Istanbul% in sample % in sample
Figure 11 Distribution of ties and chokus in the two samples: a) over number of storeys; b) number of
arrays c)associated collapse load factor
A common feature of Newari traditional construction, surveyed in Lalitpur, is the insertion of pegs, called chokus, to restrain floor joists from sliding over walls (Figure 12). Two vertical pegs are usually inserted through a joist on each side of the wall. According to the survey 51% of the sample has chokus, the most common case being for two joists only to be restrained, associated with an average width of façade of 4.5 m, while four chokus are found on wider façades. This device, readily visible at roof level, plays a role analogous to the ties. The analysis shows that the majority of buildings with pegs at roof level (63%) have collapse load factor greater than 0.3 and that this mechanism is critical only for 27% of the set with pegs, equivalent to 8.5% of the entire sample. Most commonly, the pegs butt on a timber wall plate running
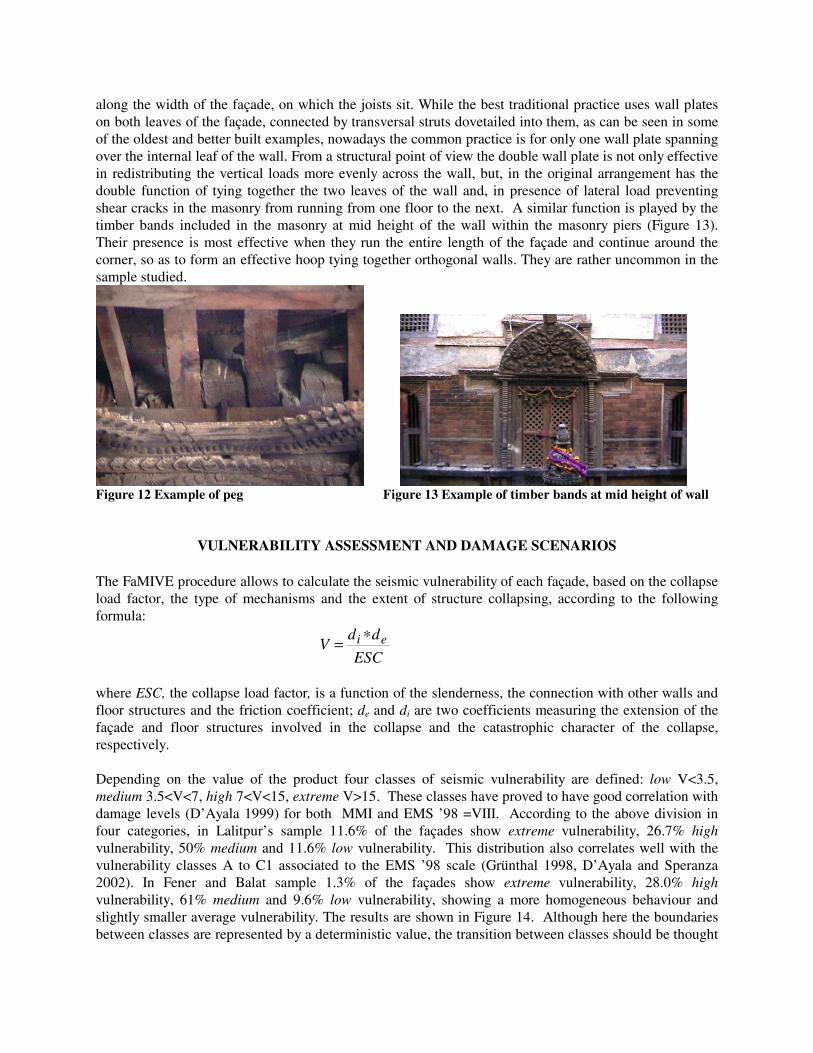
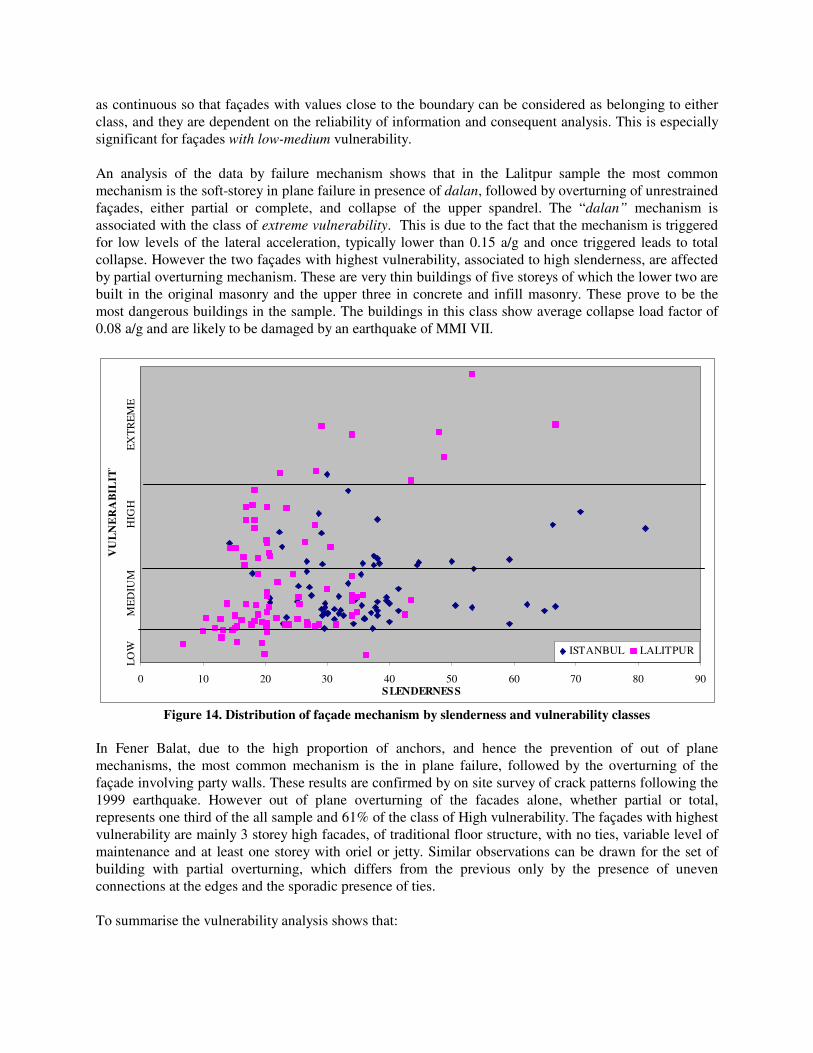
along the width of the façade, on which the joists sit. While the best traditional practice uses wall plates on both leaves of the façade, connected by transversal struts dovetailed into them, as can be seen in some of the oldest and better built examples, nowadays the common practice is for only one wall plate spanning over the internal leaf of the wall. From a structural point of view the double wall plate is not only effective in redistributing the vertical loads more evenly across the wall, but, in the original arrangement has the double function of tying together the two leaves of the wall and, in presence of lateral load preventing shear cracks in the masonry from running from one floor to the next. A similar function is played by the timber bands included in the masonry at mid height of the wall within the masonry piers (Figure 13). Their presence is most effective when they run the entire length of the façade and continue around the corner, so as to form an effective hoop tying together orthogonal walls. They are rather uncommon in the sample studied.
Figure 12 Example of peg Figure 13 Example of timber bands at mid height of wall
VULNERABILITY ASSESSMENT AND DAMAGE SCENARIOS The FaMIVE procedure allows to calculate the seismic vulnerability of each façade, based on the collapse load factor, the type of mechanisms and the extent of structure collapsing, according to the following formula:
ESC
ddV ei ∗=
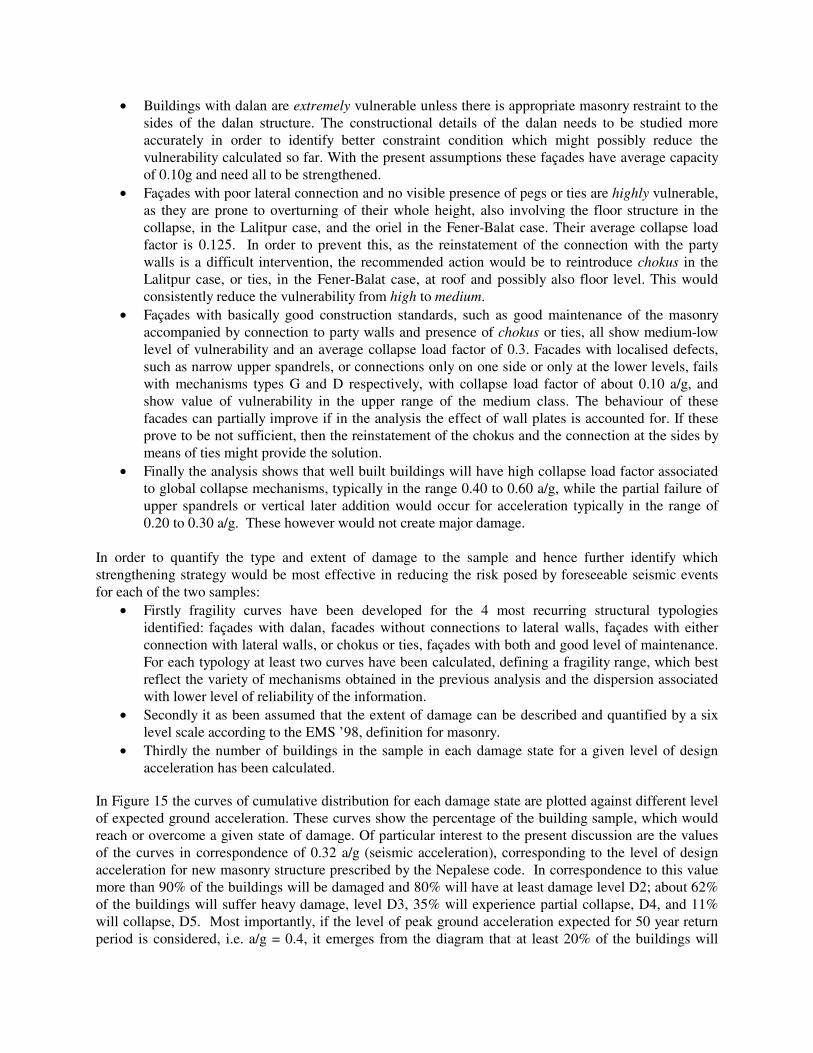
where ESC, the collapse load factor, is a function of the slenderness, the connection with other walls and floor structures and the friction coefficient; de and di are two coefficients measuring the extension of the façade and floor structures involved in the collapse and the catastrophic character of the collapse, respectively. Depending on the value of the product four classes of seismic vulnerability are defined: low V<3.5, medium 3.5<V<7, high 7<V<15, extreme V>15. These classes have proved to have good correlation with damage levels (D’Ayala 1999) for both MMI and EMS ’98 =VIII. According to the above division in four categories, in Lalitpur’s sample 11.6% of the façades show extreme vulnerability, 26.7% high vulnerability, 50% medium and 11.6% low vulnerability. This distribution also correlates well with the vulnerability classes A to C1 associated to the EMS ’98 scale (Grünthal 1998, D’Ayala and Speranza 2002). In Fener and Balat sample 1.3% of the façades show extreme vulnerability, 28.0% high vulnerability, 61% medium and 9.6% low vulnerability, showing a more homogeneous behaviour and slightly smaller average vulnerability. The results are shown in Figure 14. Although here the boundaries between classes are represented by a deterministic value, the transition between classes should be thought
as continuous so that façades with values close to the boundary can be considered as belonging to either class, and they are dependent on the reliability of information and consequent analysis. This is especially significant for façades with low-medium vulnerability. An analysis of the data by failure mechanism shows that in the Lalitpur sample the most common mechanism is the soft-storey in plane failure in presence of dalan, followed by overturning of unrestrained façades, either partial or complete, and collapse of the upper spandrel. The “dalan” mechanism is associated with the class of extreme vulnerability. This is due to the fact that the mechanism is triggered for low levels of the lateral acceleration, typically lower than 0.15 a/g and once triggered leads to total collapse. However the two façades with highest vulnerability, associated to high slenderness, are affected by partial overturning mechanism. These are very thin buildings of five storeys of which the lower two are built in the original masonry and the upper three in concrete and infill masonry. These prove to be the most dangerous buildings in the sample. The buildings in this class show average collapse load factor of 0.08 a/g and are likely to be damaged by an earthquake of MMI VII.
0 10 20 30 40 50 60 70 80 90SLENDERNESS
VU
LN
ER
AB
ILIT
Y
ISTANBUL LALITPUR
LO
W
ME
DIU
M
HIG
H
E
XT
RE
ME
Figure 14. Distribution of façade mechanism by slenderness and vulnerability classes
In Fener Balat, due to the high proportion of anchors, and hence the prevention of out of plane mechanisms, the most common mechanism is the in plane failure, followed by the overturning of the façade involving party walls. These results are confirmed by on site survey of crack patterns following the 1999 earthquake. However out of plane overturning of the facades alone, whether partial or total, represents one third of the all sample and 61% of the class of High vulnerability. The façades with highest vulnerability are mainly 3 storey high facades, of traditional floor structure, with no ties, variable level of maintenance and at least one storey with oriel or jetty. Similar observations can be drawn for the set of building with partial overturning, which differs from the previous only by the presence of uneven connections at the edges and the sporadic presence of ties. To summarise the vulnerability analysis shows that:
• Buildings with dalan are extremely vulnerable unless there is appropriate masonry restraint to the sides of the dalan structure. The constructional details of the dalan needs to be studied more accurately in order to identify better constraint condition which might possibly reduce the vulnerability calculated so far. With the present assumptions these façades have average capacity of 0.10g and need all to be strengthened.
• Façades with poor lateral connection and no visible presence of pegs or ties are highly vulnerable, as they are prone to overturning of their whole height, also involving the floor structure in the collapse, in the Lalitpur case, and the oriel in the Fener-Balat case. Their average collapse load factor is 0.125. In order to prevent this, as the reinstatement of the connection with the party walls is a difficult intervention, the recommended action would be to reintroduce chokus in the Lalitpur case, or ties, in the Fener-Balat case, at roof and possibly also floor level. This would consistently reduce the vulnerability from high to medium.
• Façades with basically good construction standards, such as good maintenance of the masonry accompanied by connection to party walls and presence of chokus or ties, all show medium-low level of vulnerability and an average collapse load factor of 0.3. Facades with localised defects, such as narrow upper spandrels, or connections only on one side or only at the lower levels, fails with mechanisms types G and D respectively, with collapse load factor of about 0.10 a/g, and show value of vulnerability in the upper range of the medium class. The behaviour of these facades can partially improve if in the analysis the effect of wall plates is accounted for. If these prove to be not sufficient, then the reinstatement of the chokus and the connection at the sides by means of ties might provide the solution.
• Finally the analysis shows that well built buildings will have high collapse load factor associated to global collapse mechanisms, typically in the range 0.40 to 0.60 a/g, while the partial failure of upper spandrels or vertical later addition would occur for acceleration typically in the range of 0.20 to 0.30 a/g. These however would not create major damage.
In order to quantify the type and extent of damage to the sample and hence further identify which strengthening strategy would be most effective in reducing the risk posed by foreseeable seismic events for each of the two samples:
• Firstly fragility curves have been developed for the 4 most recurring structural typologies identified: façades with dalan, facades without connections to lateral walls, façades with either connection with lateral walls, or chokus or ties, façades with both and good level of maintenance. For each typology at least two curves have been calculated, defining a fragility range, which best reflect the variety of mechanisms obtained in the previous analysis and the dispersion associated with lower level of reliability of the information.
• Secondly it as been assumed that the extent of damage can be described and quantified by a six level scale according to the EMS ’98, definition for masonry.
• Thirdly the number of buildings in the sample in each damage state for a given level of design acceleration has been calculated.
In Figure 15 the curves of cumulative distribution for each damage state are plotted against different level of expected ground acceleration. These curves show the percentage of the building sample, which would reach or overcome a given state of damage. Of particular interest to the present discussion are the values of the curves in correspondence of 0.32 a/g (seismic acceleration), corresponding to the level of design acceleration for new masonry structure prescribed by the Nepalese code. In correspondence to this value more than 90% of the buildings will be damaged and 80% will have at least damage level D2; about 62% of the buildings will suffer heavy damage, level D3, 35% will experience partial collapse, D4, and 11% will collapse, D5. Most importantly, if the level of peak ground acceleration expected for 50 year return period is considered, i.e. a/g = 0.4, it emerges from the diagram that at least 20% of the buildings will
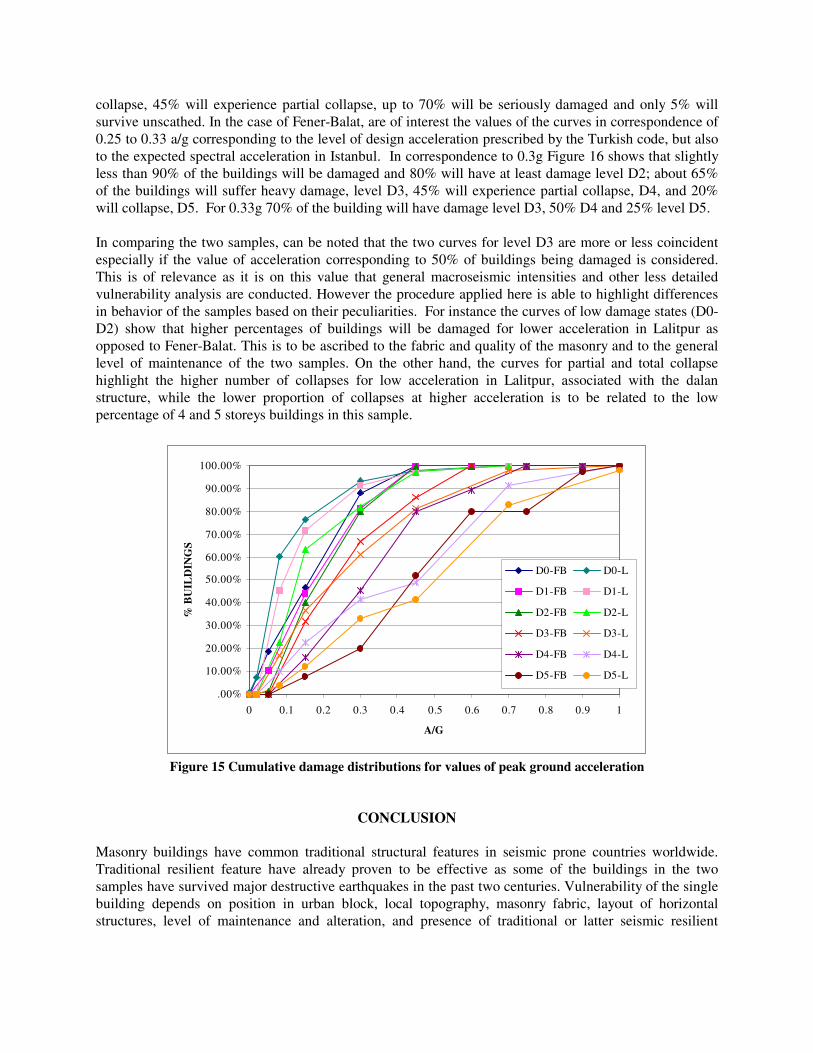
collapse, 45% will experience partial collapse, up to 70% will be seriously damaged and only 5% will survive unscathed. In the case of Fener-Balat, are of interest the values of the curves in correspondence of 0.25 to 0.33 a/g corresponding to the level of design acceleration prescribed by the Turkish code, but also to the expected spectral acceleration in Istanbul. In correspondence to 0.3g Figure 16 shows that slightly less than 90% of the buildings will be damaged and 80% will have at least damage level D2; about 65% of the buildings will suffer heavy damage, level D3, 45% will experience partial collapse, D4, and 20% will collapse, D5. For 0.33g 70% of the building will have damage level D3, 50% D4 and 25% level D5. In comparing the two samples, can be noted that the two curves for level D3 are more or less coincident especially if the value of acceleration corresponding to 50% of buildings being damaged is considered. This is of relevance as it is on this value that general macroseismic intensities and other less detailed vulnerability analysis are conducted. However the procedure applied here is able to highlight differences in behavior of the samples based on their peculiarities. For instance the curves of low damage states (D0-D2) show that higher percentages of buildings will be damaged for lower acceleration in Lalitpur as opposed to Fener-Balat. This is to be ascribed to the fabric and quality of the masonry and to the general level of maintenance of the two samples. On the other hand, the curves for partial and total collapse highlight the higher number of collapses for low acceleration in Lalitpur, associated with the dalan structure, while the lower proportion of collapses at higher acceleration is to be related to the low percentage of 4 and 5 storeys buildings in this sample.
.00%
10.00%
20.00%
30.00%
40.00%
50.00%
60.00%
70.00%
80.00%
90.00%
100.00%
0 0.1 0.2 0.3 0.4 0.5 0.6 0.7 0.8 0.9 1
A/G
% B
UIL
DIN
GS
D0-FB D0-L
D1-FB D1-L
D2-FB D2-L
D3-FB D3-L
D4-FB D4-L
D5-FB D5-L
Figure 15 Cumulative damage distributions for values of peak ground acceleration
CONCLUSION
Masonry buildings have common traditional structural features in seismic prone countries worldwide. Traditional resilient feature have already proven to be effective as some of the buildings in the two samples have survived major destructive earthquakes in the past two centuries. Vulnerability of the single building depends on position in urban block, local topography, masonry fabric, layout of horizontal structures, level of maintenance and alteration, and presence of traditional or latter seismic resilient
features. Historic urban masonry buildings are generally classified as class B of the EMS98 with subset in class A when structural deficiencies are present, and subset in class C when strengthening is effective. A collapse mechanism analysis over two different samples in Lalitpur, Nepal and in Fener Balat, Istanbul, Turkey, identifies for this class of buildings a seismic capacity ranging from 0.12 to 0.28 a/g when there is no connection with party walls, increasing to 0.18 to 0.4 if the connection is present. This correlates to seismic vulnerability to intensity VIII for the first class of buildings and to intensity IX for the second class. A third class, characterised by the presence of a soft storey at ground floor, can result vulnerable to intensity VII. The presence of ties or equivalent devices such as timber pegs is particularly efficient in reducing risk especially in the more slender facades. Vertical additions, alteration of window lay out and improper introduction of reinforced concrete floor structures can seriously impair seismic capacity. The effectiveness of modern strengthening techniques depends upon accurate detailing both in design and construction and on accurate assessment of the structural integrity of the building. For both samples seismic vulnerability to Intensity VIII was identified when there is poor connection with party walls and floors, increasing to intensity IX when the connection is ensured by timber pegs or internal walls.
REFERENCES
Ambraseys N.N., Finkel, C.F., 1991, Long-term seismicity of Istanbul and the Marmara sea Region, Terra
Nova, 3 Brett W.B., A report on the Bihar Earthquake and on the measures taken in consequence thereof up to the
31st December 1934. Relief Commissioner, Bihar and Orissa. Superintendent, Government Printing, Bihar and Orissa, Patna, 1935
Brahma Sumsher, J.B., Rana Major General, Nepalko Maha Bhukampa (the Great Earthquake of Nepal), published b the author in Kathmandu, second ed. 1935.
Building Bylaws for Kathmandu & Lalitpur Municipal Areas as well as Within the Town extension area of Kathmandu Valley, HMG of Nepal, Kathmandu Valley Town Development Committee, 1993
D’Ayala D., Speranza E., (2003) Definition of collapse mechanisms and seismic vulnerability of masonry structures, Earthquake Spectra vol. 19 n. 3 pp. 479-509.
D’Ayala, D. 1999, Correlation of seismic vulnerability and damage between classes of buildings: Churches and houses, Measures of Seismic Damage to Masonry Buildings, pp. 41-58. Balkema.
D'Ayala, D. and Speranza, E. (2002) An integrated procedure for the assessment of seismic vulnerability of historic buildings, In: 12th European Conference on Earthquake Engineering, paper no. 561.
D’Ayala D. Yeomans, D., Rehabilitation guidelines for vernacular buildings in Istanbul, in International Seminar of Structural Analysis of Historical Construction, Padova 2004 (accepted for publication)
Grünthal G., ed., 1998, European macroseismic Scale 1998, Conseil de L’Europe, Luxembourg. Korn W., 1976. The traditional architecture of the Kathmandu Valley, Bibliotheca Himalayica, series 3,
vol.2 (Kathmandu) Nepal National Building Code NBC 203: 1994 Guidelines for earthquake resistant building construction:
low strength masonry, HMG of Nepal Ministry of Housing and Physical Planning, Department of Buildings, 1995
NSET-Nepal, GeoHazard International, Kathmandu Valley Earthquake Scenario, 1999 NSET-Nepal, Report of Building Inventory Survey, Study on Earthquake disaster mitigation in the
Kathmandu valley, Kingdom of Nepal, JICA Technical Team, OYO Corporation, Tokyo Japan Pandey M. R., Molnar P., The distribution of intensity of the Bihar-Nepal Earthquake 15 January 1934
and bounds on the extent of the rupture zone, Journal of Nepal Geological Society, Vol.5, 1988 Stoquart R., Caglar N., (ed.) 1998, Rehabilitation des quartiers de Balat and de Fener, Diagnostic et
proposition d’amenagement. Union Europeenne, UNESCO.


![Development of fragility curves for existing residential ...scientiairanica.sharif.edu/article_21498_1b4140b0a40ae864af4f4741123bf662.pdfthree-dimensionally in OpenSees [18]. E ort](https://static.fdocuments.net/doc/165x107/6049a4e6007677277e1f9238/development-of-fragility-curves-for-existing-residential-three-dimensionally.jpg)