Applying Lean, Six Sigma, BPM, and SOA to Drive Business Results
76
Front cover Applying Lean, Six Sigma, BPM, and SOA to Drive Business Results Hans Skalle Bill Hahn Gain a clear understanding of the benefits of BPM and SOA technologies Learn how BPM and SOA enable Lean and Six Sigma Learn what others are doing to get started now Redguides for Business Leaders
-
Upload
truongngoc -
Category
Documents
-
view
218 -
download
0
Transcript of Applying Lean, Six Sigma, BPM, and SOA to Drive Business Results
Front cover
Applying Lean, Six Sigma, BPM, and SOA to Drive Business Results
Hans SkalleBill Hahn
Gain a clear understanding of the benefits of BPM and SOA technologies
Learn how BPM and SOA enable Lean and Six Sigma
Learn what others are doing to get started now
Redguidesfor Business Leaders

Executive overview
Lean Six Sigma unites tools and techniques from Lean and Six Sigma methodologies to produce real results. It uncovers process waste, reduces non-value adding activity, and increases organizational capability. The benefits might even be felt in IT where waste is being removed from application development processes, significantly reducing costs and freeing resources and budgets for needed investments and backlogged projects.
Business process management (BPM) technologies and service-oriented architectures (SOAs) combine with Lean Six Sigma to accelerate improvements and results. At the same time, they increase organizational agility and technology-enabled responsiveness. Early adopters who have worked their way past cultural and organizational barriers are seeing impressive performance and financial results such as the following examples:
� Improved responsiveness to market challenges, opportunities, and changes in regulatory requirements through more tightly coupled yet more flexible business and technical architectures
� Improved ability to innovate and achieve strategic differentiation by driving change into the market and tuning processes to meet the specific needs of key market and customer segments
� Reduced process costs through automation and an improved ability to monitor, detect, and respond to problems and events by using real-time data, automated alerts, and planned escalation
� Lower technical implementation costs through shared services and higher levels of component reuse; changing and improving processes becomes easier and more cost effective
� Lower analysis costs through collaborative online process modeling tools, access to real-time process data, and advanced process simulation capabilities
As the world moves faster, the ability to change becomes a key differentiator. Rapid, technology-driven process improvement and transformation become critical to success and to survival. The rewards can be great, especially for companies that take action now to bring these disciplines, techniques, and technologies together.
This IBM® Redguide™ publication is intended to help companies that are leaders in their markets or are looking for new ways to differentiate themselves from their competitors. This edition describes the key BPM, SOA, and Lean Six Sigma components, summarizes the linkages between them, and highlights recent results that leading firms have achieved. This
© Copyright IBM Corp. 2013. All rights reserved. 1
guide outlines the “think big, start now” steps that are needed to move your own initiative forward. This guide also suggests ways to successfully avoid some of the barriers that have hampered others on their Lean or Lean Six Sigma or BPM journeys.
Key concepts
Lean, Six Sigma, and today’s BPM have much in common. Each of these improvement methodologies uses iterative techniques to deliver financial and performance benefits through better managed and optimized processes. By combining key concepts from Lean, Six Sigma or Lean Six Sigma with the capabilities of BPM, a company can ensure that its people are focused on the most meaningful work that adds value. Such BPM capabilities include process modeling and analysis, rules-driven automation and decision-making, automated workflow, and executive dashboards that deliver real-time performance metrics to process consumers. SOAs add increased flexibility so that processes can be quickly assembled from reusable building blocks of technical functions. Companies that successfully combine Lean Six Sigma, BPM, and SOA initiatives will realize a competitive advantage.
To fully understand the linkages between BPM, SOA, and Lean Six Sigma, and to fully realize the benefits of these linkages, it is important to establish definitions and highlight key concepts for each initiative.
Business process management
At the highest level, BPM is a management discipline and way of thinking that focuses on the following areas:
� Aligning internal and external business process performance and results with the core competencies, strategic objectives, and business goals of the organization
� Understanding and documenting business processes so that they can be consistently run
� Measuring, monitoring, and controlling process performance, including key inputs, outputs, and early warning event triggers
� Actively designing and improving business processes to meet or exceed the expectations of customers while achieving organizational goals, such as cost, revenue, and cycle time
BPM enables companies to shift their focus from cumbersome hierarchical structures to flexible and efficient horizontal value streams that capture and retain customers in the face of increasing competition and marketplace change. Within the BPM discipline, business
Lessons learned: At any company, bringing together Lean, Six Sigma, BPM, and SOA changes the nature of the business and IT partnership. Each organization plays a larger role in what was the domain of the other. For example, enabling process owners to change business rules directly, and therefore the business process itself, on their own with minimal IT involvement, requires technical capability and trust. For Lean Six Sigma practitioners, it often means embracing the use of technology throughout the improvement and design cycle, rather than keeping it at arm’s length as so many companies do.
The rate of transformation is influenced by culture, skills, past experiences, organizational structure, strength of leadership, and timing. The transformation rate is also influenced by external factors, such as the rate of improvement of the nearest competitors, changing customer expectations and the dynamic nature of the industry itself. The result of this shift, however, is a more agile, efficient, and competitive organization. Studies are showing that the effort is worth it.
2 Applying Lean, Six Sigma, BPM, and SOA to Drive Business Results
processes are normally considered corporate assets that are the source of differentiation and a value to customers and shareholders. Viewing processes as assets is an important perspective. Those people who lack this perspective often spend unnecessary time chasing and dealing with process-related problems. Time that is spent on reacting to and resolving problems (fire fighting) limits the time that is available to focus on growth and innovation. It also affects customer satisfaction, retention, and wallet share. A more disciplined approach, especially one that takes advantage of BPM technology, is proving to be worth the investment.
The role of technology, then and nowFor years, technology-enabled BPM referred to application customization and the creation of large, sophisticated systems that were the source of competitive advantage and business stability. Companies that invested in these systems often came to dominate their industries.
Over time, however, business process logic became more deeply embedded in these customized applications. It was locked away in millions of lines of often undocumented code and proprietary data structures that were slow, risky, and expensive to change. To make matters worse, as change became more difficult, the frequently chosen alternative was to duplicate the needed functionality, which meant creating even more specialized code. System users would be forced to create manual workarounds, often retyping the same data into multiple applications with checks and rechecks for errors. Worse yet, they became conditioned to think in terms of system limitations. When asked why an activity was performed, the answer was often because the system required it, which stifled innovative improvement.
The overall result was higher business and IT costs, decreasing productivity, growing IT project backlogs, and an inability to respond quickly to new or changing market opportunities. According to IBM Research, over 70 percent of the typical IT budget is spent on overcoming the limitations of existing systems. And, less than 30 percent is spent on acquiring new capabilities that can provide a competitive edge to the business. When you add to this budget business costs that are associated with manual workarounds and the effect of bad or stale data on decision making and customer service, the picture becomes bleaker still.
Many of today’s business processes are still loosely structured and held together with email, spreadsheets, and phone calls. In fact, some improvement teams have newly designed processes that were based on sending and receiving emails. An email-based process, by its nature, is unstructured and invisible to process owners, unless they are copied on each email, which further increases the email overload. Today’s BPM technology provides structure and visibility through managed worklists and process monitors that track transactions in near real time. This technology automates processes that otherwise might use email to trigger action and reveals bottlenecks that are invisible in an email-based process before larger problems occur.
Today the pressure is on the CIO and the IT organization to identify, enable, and create business opportunities, while dramatically reducing operating costs. In virtually every industry, aggressive, more technologically agile competitors are now offering new products and services faster or are running processes more efficiently to win customers, market share, and profit.
Thankfully, with advances in technology and technical standards, IT budgets can be reclaimed, and the organization can be repositioned as a partner that truly adds value to the business. New technical tools and capabilities complement traditional BPM methods and even unlock existing application functions to greatly accelerate process improvement and innovation.
IBM Business Process ManagerVirtually all of us encounter inefficient processes because they add time, cost, workarounds, rework, and frustration to our days and interactions with the companies we buy from. With the impact often hidden, they relentlessly chip away at profits, limit growth and innovation potential,
3
sour customer satisfaction, and decrease employee morale. Nonprofits, government agencies, and educational institutions are not immune from these stifling time wasters.
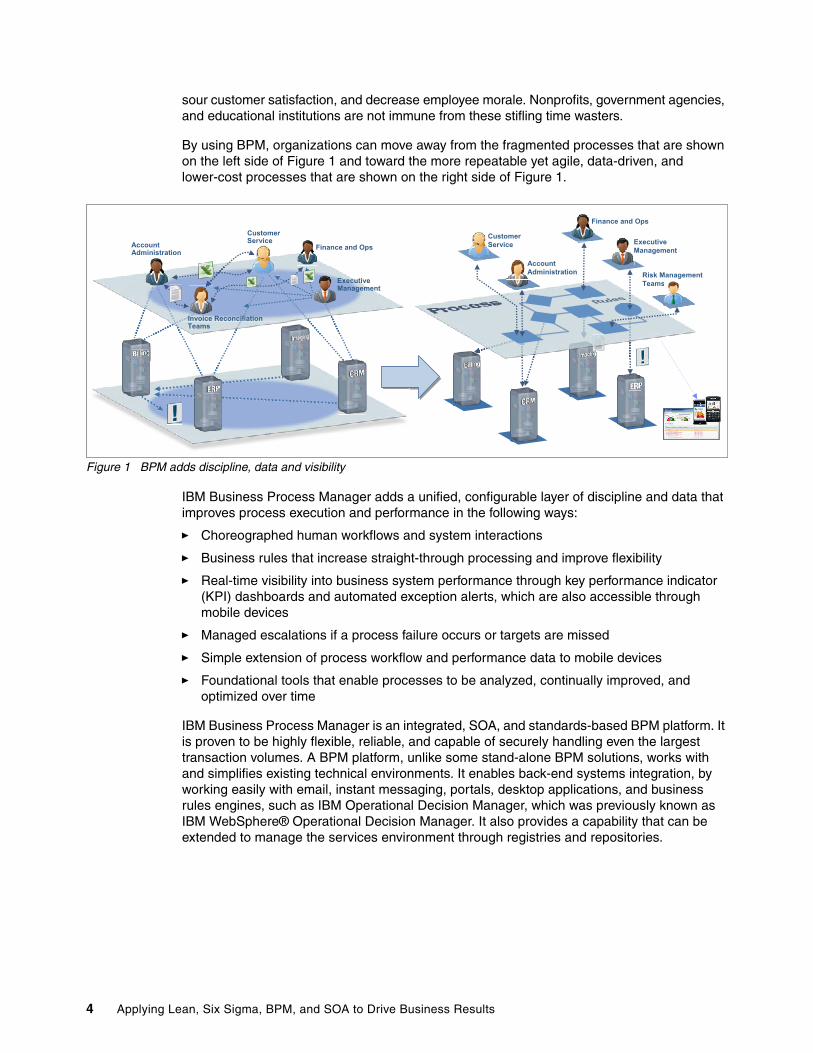
By using BPM, organizations can move away from the fragmented processes that are shown on the left side of Figure 1 and toward the more repeatable yet agile, data-driven, and lower-cost processes that are shown on the right side of Figure 1.
Figure 1 BPM adds discipline, data and visibility
IBM Business Process Manager adds a unified, configurable layer of discipline and data that improves process execution and performance in the following ways:
� Choreographed human workflows and system interactions
� Business rules that increase straight-through processing and improve flexibility
� Real-time visibility into business system performance through key performance indicator (KPI) dashboards and automated exception alerts, which are also accessible through mobile devices
� Managed escalations if a process failure occurs or targets are missed
� Simple extension of process workflow and performance data to mobile devices
� Foundational tools that enable processes to be analyzed, continually improved, and optimized over time
IBM Business Process Manager is an integrated, SOA, and standards-based BPM platform. It is proven to be highly flexible, reliable, and capable of securely handling even the largest transaction volumes. A BPM platform, unlike some stand-alone BPM solutions, works with and simplifies existing technical environments. It enables back-end systems integration, by working easily with email, instant messaging, portals, desktop applications, and business rules engines, such as IBM Operational Decision Manager, which was previously known as IBM WebSphere® Operational Decision Manager. It also provides a capability that can be extended to manage the services environment through registries and repositories.
ExecutiveManagement
CustomerService
Invoice ReconciliationTeams
Finance and OpsAccountAdministration
FExecutiveManagement
CustomerService
Risk Management Teams
Finance and Ops
Account Administration
s
EM
4 Applying Lean, Six Sigma, BPM, and SOA to Drive Business Results
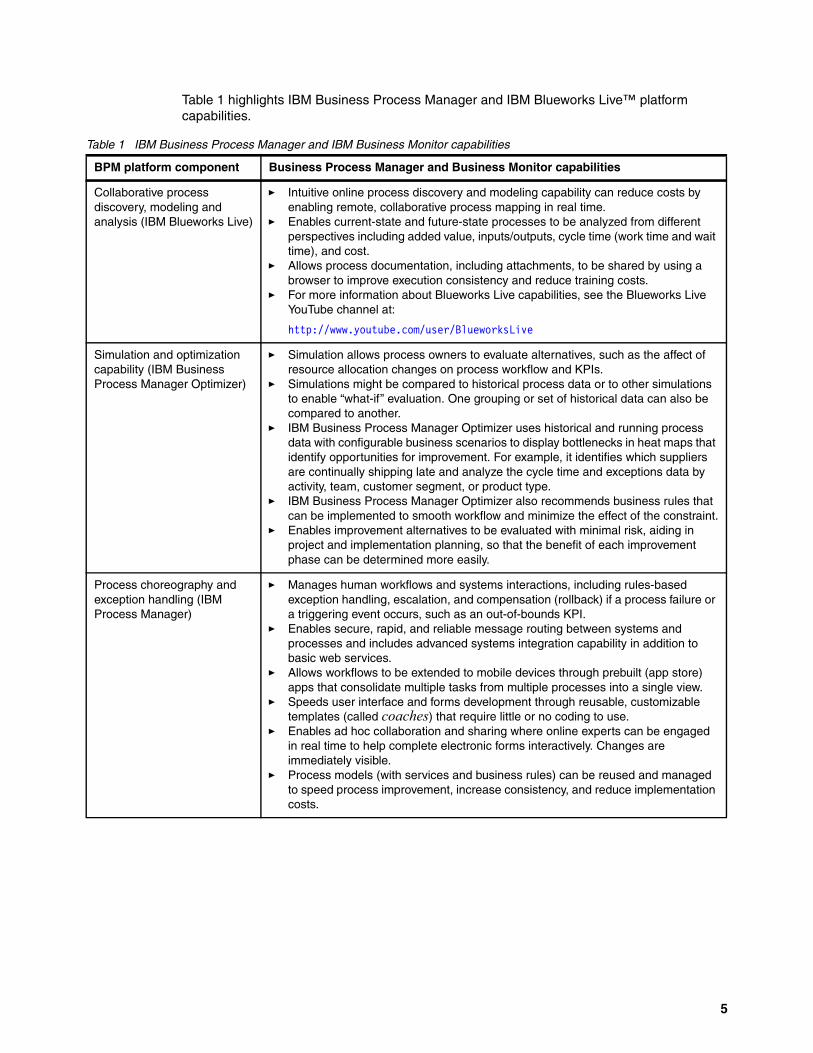
Table 1 highlights IBM Business Process Manager and IBM Blueworks Live™ platform capabilities.
Table 1 IBM Business Process Manager and IBM Business Monitor capabilities
BPM platform component Business Process Manager and Business Monitor capabilities
Collaborative process discovery, modeling and analysis (IBM Blueworks Live)
� Intuitive online process discovery and modeling capability can reduce costs by enabling remote, collaborative process mapping in real time.
� Enables current-state and future-state processes to be analyzed from different perspectives including added value, inputs/outputs, cycle time (work time and wait time), and cost.
� Allows process documentation, including attachments, to be shared by using a browser to improve execution consistency and reduce training costs.
� For more information about Blueworks Live capabilities, see the Blueworks Live YouTube channel at:
http://www.youtube.com/user/BlueworksLive
Simulation and optimization capability (IBM Business Process Manager Optimizer)
� Simulation allows process owners to evaluate alternatives, such as the affect of resource allocation changes on process workflow and KPIs.
� Simulations might be compared to historical process data or to other simulations to enable “what-if” evaluation. One grouping or set of historical data can also be compared to another.
� IBM Business Process Manager Optimizer uses historical and running process data with configurable business scenarios to display bottlenecks in heat maps that identify opportunities for improvement. For example, it identifies which suppliers are continually shipping late and analyze the cycle time and exceptions data by activity, team, customer segment, or product type.
� IBM Business Process Manager Optimizer also recommends business rules that can be implemented to smooth workflow and minimize the effect of the constraint.
� Enables improvement alternatives to be evaluated with minimal risk, aiding in project and implementation planning, so that the benefit of each improvement phase can be determined more easily.
Process choreography and exception handling (IBM Process Manager)
� Manages human workflows and systems interactions, including rules-based exception handling, escalation, and compensation (rollback) if a process failure or a triggering event occurs, such as an out-of-bounds KPI.
� Enables secure, rapid, and reliable message routing between systems and processes and includes advanced systems integration capability in addition to basic web services.
� Allows workflows to be extended to mobile devices through prebuilt (app store) apps that consolidate multiple tasks from multiple processes into a single view.
� Speeds user interface and forms development through reusable, customizable templates (called coaches) that require little or no coding to use.
� Enables ad hoc collaboration and sharing where online experts can be engaged in real time to help complete electronic forms interactively. Changes are immediately visible.
� Process models (with services and business rules) can be reused and managed to speed process improvement, increase consistency, and reduce implementation costs.
5
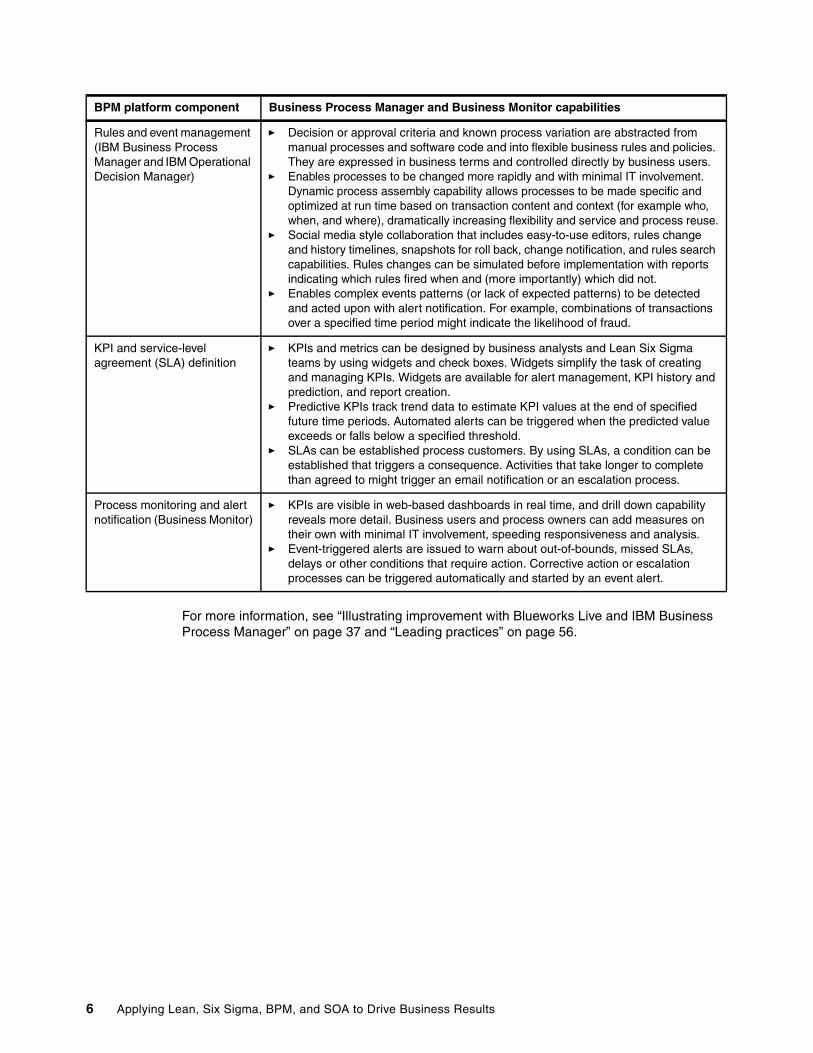
For more information, see “Illustrating improvement with Blueworks Live and IBM Business Process Manager” on page 37 and “Leading practices” on page 56.
Rules and event management (IBM Business Process Manager and IBM Operational Decision Manager)
� Decision or approval criteria and known process variation are abstracted from manual processes and software code and into flexible business rules and policies. They are expressed in business terms and controlled directly by business users.
� Enables processes to be changed more rapidly and with minimal IT involvement. Dynamic process assembly capability allows processes to be made specific and optimized at run time based on transaction content and context (for example who, when, and where), dramatically increasing flexibility and service and process reuse.
� Social media style collaboration that includes easy-to-use editors, rules change and history timelines, snapshots for roll back, change notification, and rules search capabilities. Rules changes can be simulated before implementation with reports indicating which rules fired when and (more importantly) which did not.
� Enables complex events patterns (or lack of expected patterns) to be detected and acted upon with alert notification. For example, combinations of transactions over a specified time period might indicate the likelihood of fraud.
KPI and service-level agreement (SLA) definition
� KPIs and metrics can be designed by business analysts and Lean Six Sigma teams by using widgets and check boxes. Widgets simplify the task of creating and managing KPIs. Widgets are available for alert management, KPI history and prediction, and report creation.
� Predictive KPIs track trend data to estimate KPI values at the end of specified future time periods. Automated alerts can be triggered when the predicted value exceeds or falls below a specified threshold.
� SLAs can be established process customers. By using SLAs, a condition can be established that triggers a consequence. Activities that take longer to complete than agreed to might trigger an email notification or an escalation process.
Process monitoring and alert notification (Business Monitor)
� KPIs are visible in web-based dashboards in real time, and drill down capability reveals more detail. Business users and process owners can add measures on their own with minimal IT involvement, speeding responsiveness and analysis.
� Event-triggered alerts are issued to warn about out-of-bounds, missed SLAs, delays or other conditions that require action. Corrective action or escalation processes can be triggered automatically and started by an event alert.
BPM platform component Business Process Manager and Business Monitor capabilities
6 Applying Lean, Six Sigma, BPM, and SOA to Drive Business Results
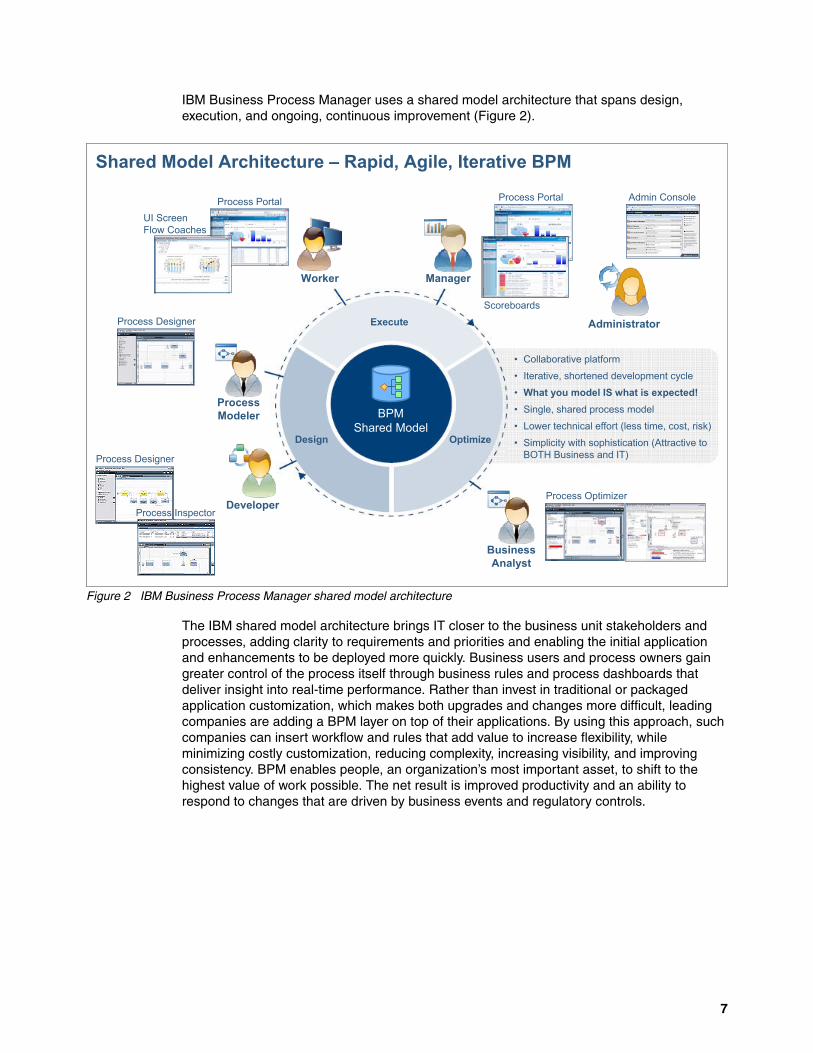
IBM Business Process Manager uses a shared model architecture that spans design, execution, and ongoing, continuous improvement (Figure 2).
Figure 2 IBM Business Process Manager shared model architecture
The IBM shared model architecture brings IT closer to the business unit stakeholders and processes, adding clarity to requirements and priorities and enabling the initial application and enhancements to be deployed more quickly. Business users and process owners gain greater control of the process itself through business rules and process dashboards that deliver insight into real-time performance. Rather than invest in traditional or packaged application customization, which makes both upgrades and changes more difficult, leading companies are adding a BPM layer on top of their applications. By using this approach, such companies can insert workflow and rules that add value to increase flexibility, while minimizing costly customization, reducing complexity, increasing visibility, and improving consistency. BPM enables people, an organization’s most important asset, to shift to the highest value of work possible. The net result is improved productivity and an ability to respond to changes that are driven by business events and regulatory controls.
BPMShared Model
Design Optimize
Execute
Process Designer
Process InspectorDeveloper
ProcessModeler
BusinessAnalyst
Worker Manager
AdministratorProcess Designer
UI ScreenFlow Coaches
Process Portal Process Portal
Scoreboards
Admin Console
Process Optimizer
� Collaborative platform
� Iterative, shortened development cycle
� What you model IS what is expected!� Single, shared process model
� Lower technical effort (less time, cost, risk)
� Simplicity with sophistication (Attractive to BOTH Business and IT)
Shared Model Architecture � Rapid, Agile, Iterative BPM
7
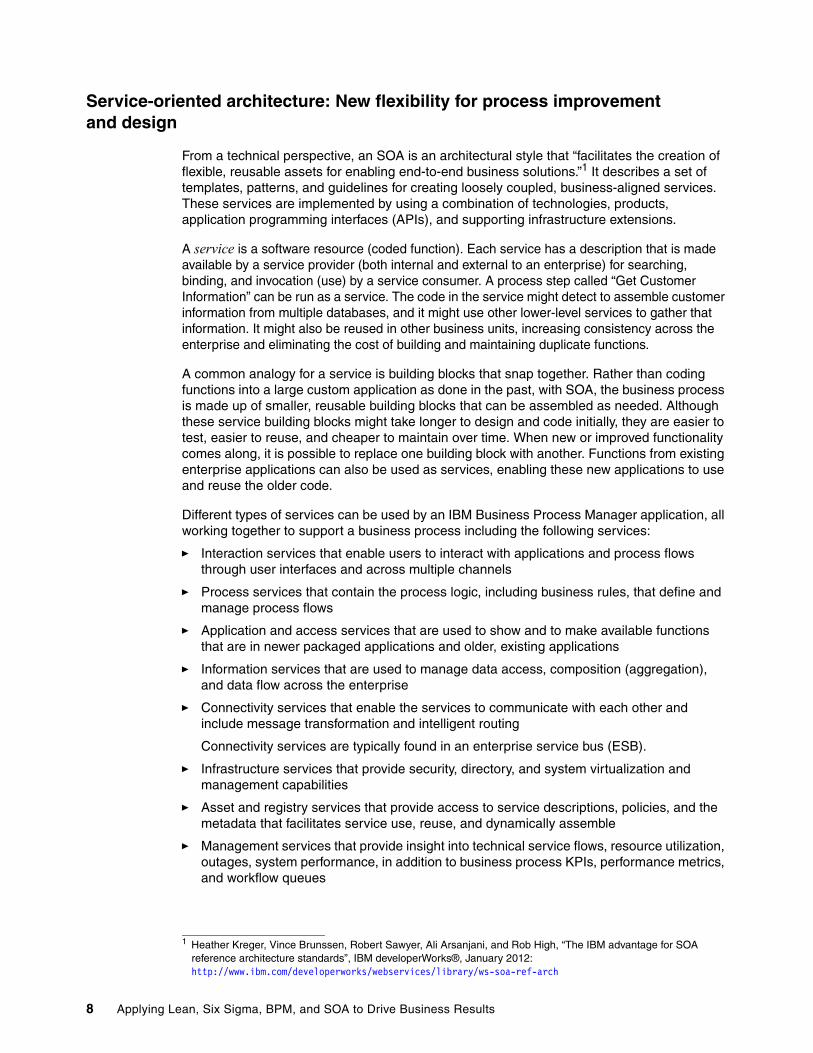
Service-oriented architecture: New flexibility for process improvement and design
From a technical perspective, an SOA is an architectural style that “facilitates the creation of flexible, reusable assets for enabling end-to-end business solutions.”1 It describes a set of templates, patterns, and guidelines for creating loosely coupled, business-aligned services. These services are implemented by using a combination of technologies, products, application programming interfaces (APIs), and supporting infrastructure extensions.
A service is a software resource (coded function). Each service has a description that is made available by a service provider (both internal and external to an enterprise) for searching, binding, and invocation (use) by a service consumer. A process step called “Get Customer Information” can be run as a service. The code in the service might detect to assemble customer information from multiple databases, and it might use other lower-level services to gather that information. It might also be reused in other business units, increasing consistency across the enterprise and eliminating the cost of building and maintaining duplicate functions.
A common analogy for a service is building blocks that snap together. Rather than coding functions into a large custom application as done in the past, with SOA, the business process is made up of smaller, reusable building blocks that can be assembled as needed. Although these service building blocks might take longer to design and code initially, they are easier to test, easier to reuse, and cheaper to maintain over time. When new or improved functionality comes along, it is possible to replace one building block with another. Functions from existing enterprise applications can also be used as services, enabling these new applications to use and reuse the older code.
Different types of services can be used by an IBM Business Process Manager application, all working together to support a business process including the following services:
� Interaction services that enable users to interact with applications and process flows through user interfaces and across multiple channels
� Process services that contain the process logic, including business rules, that define and manage process flows
� Application and access services that are used to show and to make available functions that are in newer packaged applications and older, existing applications
� Information services that are used to manage data access, composition (aggregation), and data flow across the enterprise
� Connectivity services that enable the services to communicate with each other and include message transformation and intelligent routing
Connectivity services are typically found in an enterprise service bus (ESB).
� Infrastructure services that provide security, directory, and system virtualization and management capabilities
� Asset and registry services that provide access to service descriptions, policies, and the metadata that facilitates service use, reuse, and dynamically assemble
� Management services that provide insight into technical service flows, resource utilization, outages, system performance, in addition to business process KPIs, performance metrics, and workflow queues
1 Heather Kreger, Vince Brunssen, Robert Sawyer, Ali Arsanjani, and Rob High, “The IBM advantage for SOA reference architecture standards”, IBM developerWorks®, January 2012: http://www.ibm.com/developerworks/webservices/library/ws-soa-ref-arch
8 Applying Lean, Six Sigma, BPM, and SOA to Drive Business Results
Today, many companies already deploy services to support their internal and external processes and increase business and technical flexibility. An Order to Cash process, for example, might include some or all of the following types of services:
� Get customer information from multiple sources� Verify credit worthiness and risk (even from a third-party provider) � Check availability� Determine pricing� Open new accounts� Create orders� Reserve inventory� Schedule delivery� Generate shipment notifications and invoices
These same services might also be called by web or mobile applications (through interaction services) that customers can use to keep close tabs on their orders as they move end-to-end through the process.
From a business perspective, an SOA represents new opportunity that enables business processes to use increased technical flexibility and speed of change. Business rules combined with a service repository, such as IBM WebSphere Registry and Repository, enable the dynamic selection of service endpoints at run time. The same basic process is involved, but it is self-configuring to meet individual requirements based on a set of rules. For example, you might want to run a series of process steps for one customer type (such as gold-level customers in a loyalty program). Then, you might want to run a different, but overlapping set of steps for another customer type. Perhaps you want to test a new product or service offering but only to those online customers who are based in one geographical area and only for a limited time. IBM Business Process Manager or IBM Operational Decision Manager business rules, combined with the repository, make this capability possible.
Perhaps you want to outsource a noncore business process. In many cases, a business partner provides the functions as plug-and-play services (for example, credit checks) or as Software-as-a-Service (SaaS) processes such as from cloud-based providers. This capability opens up creative new alternatives to improvement teams that are looking for innovative ways to solve process problems or when designing, testing and deploying new processes.
Service-oriented architectures include the following benefits:
� Reduced application development costs through higher levels of service and component reuse, elimination of duplicate code and redundant functions, and reduced code maintenance and change costs
� Reduced maintenance costs that result from the discontinuing complex traditional applications and their interdependencies over time
� Faster application development cycles that enable project business benefits to be realized more quickly (within one or two months), more user productivity, or revenue benefit that might otherwise be lost
� Improved ability to respond to changing business conditions that are driven by new regulatory requirements, competitive pressures, or fast-moving market opportunities
Such companies that are most successful used SOA and BPM to build deeper relationships between the IT and business communities. Those companies have enabled communities to deliver measurable results more quickly through modular components that are quick to deploy and reuse.
The Open Group SOA Reference Architecture is a rich, multilayered architecture that many firms use as a starting point for their own architectures. Each layer is described in detail,
9
including the flow, capabilities, architectural building blocks (ABBs), usage, and points of intersection with the other layers. The architecture is extensible to the cloud. For more information about the Open Group Reference Architecture, see the Open Group website at:
http://www.opengroup.org/projects/soa-ref-arch
For information about extending the reference architecture to the cloud, see the IBM developerWorks article “The IBM advantage for SOA reference architecture standards” at:
http://www.ibm.com/developerworks/webservices/library/ws-soa-ref-arch
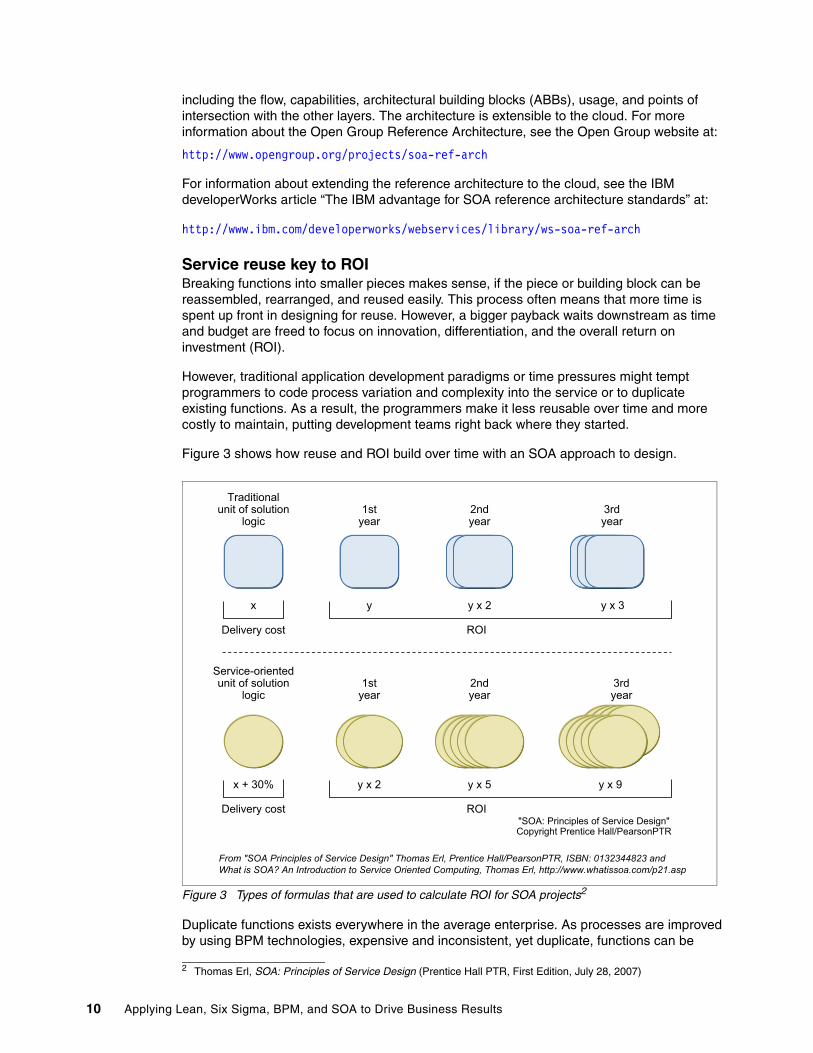
Service reuse key to ROIBreaking functions into smaller pieces makes sense, if the piece or building block can be reassembled, rearranged, and reused easily. This process often means that more time is spent up front in designing for reuse. However, a bigger payback waits downstream as time and budget are freed to focus on innovation, differentiation, and the overall return on investment (ROI).
However, traditional application development paradigms or time pressures might tempt programmers to code process variation and complexity into the service or to duplicate existing functions. As a result, the programmers make it less reusable over time and more costly to maintain, putting development teams right back where they started.
Figure 3 shows how reuse and ROI build over time with an SOA approach to design.
Figure 3 Types of formulas that are used to calculate ROI for SOA projects2
Duplicate functions exists everywhere in the average enterprise. As processes are improved by using BPM technologies, expensive and inconsistent, yet duplicate, functions can be
2 Thomas Erl, SOA: Principles of Service Design (Prentice Hall PTR, First Edition, July 28, 2007)
Traditionalunit of solution
logic1st
year2ndyear
3rdyear
Delivery cost
Service-orientedunit of solution
logic
"SOA: Principles of Service Design"Copyright Prentice Hall/PearsonPTR
Delivery cost
x
x + 30%
ROI
y y x 2 y x 3
y x 2 y x 5 y x 9
1styear
2ndyear
3rdyear
ROI
From "SOA Principles of Service Design" Thomas Erl, Prentice Hall/PearsonPTR, ISBN: 0132344823 and What is SOA? An Introduction to Service Oriented Computing, Thomas Erl, http://www.whatissoa.com/p21.asp
10 Applying Lean, Six Sigma, BPM, and SOA to Drive Business Results
replaced with reusable services. Service registries and repositories, which are used to manage and govern service reuse, can be queried to determine whether an existing service is an appropriate candidate to save time and money and to speed implementation. Lean Six Sigma teams are perfectly positioned to influence service creation and reuse as they work their improvement and design projects.
As companies move more toward SOA, business process logic will no longer be deeply embedded in application code, where it is locked away and expensive to change. Instead, process logic will exist in the form of high value business and technical services that are reusable. Processes that use these services will be much more flexible (agile) and cheaper to maintain over time. They will allow businesses to achieve dramatic results in responsiveness, cost effectiveness, profitability, and innovation through new combinations of internal and external services.
The growing impact of cloud computing and mobile apps
Cloud computing and the transformational growth of interconnected mobile devices, such as tablets and smartphones, are enabling truly innovative and global process improvement and design.
Cloud computing provides IT resources that can be used on demand, as needed by the business. The National Institute of Standards and Technology3 defines cloud computing in the following way: “a model for enabling ubiquitous, convenient, on-demand network access to a shared pool of configurable computing resources (for example, networks, servers, storage, applications, and services) that can be rapidly provisioned and released with minimal management effort or service provider interaction.” These computing resources can be internal private clouds, external public clouds, or a hybrid combination of both. The overarching goal of cloud computing is to reduce hardware and software capital expense, converting such expense to an on-demand or as needed expense model.
More cloud-based applications are proving effective. Examples of such applications include sales force automation software from Salesforce.com, Inc. and SugarCRM Inc. and human capital management software from Workday, Inc. These applications give process improvement teams new secure, subscription-based access to business functions that might otherwise be too expensive and time-consuming to build and maintain in-house. Not only do cloud applications open up options to improvement teams, but they have the potential to accelerate benefits realization. Many of these cloud-based applications quickly increase business productivity through differentiating functionality, improved collaboration, and when-needed access to data and information, all through a web browser.
IBM Blueworks Live is a rich, secure, cloud-based application and repository. By using Blueworks Live, improvement teams can work collaboratively to map, document, and analyze business processes in real time. This easy-to-use application with its intuitive interface has enabled companies to effectively hold virtual Kaizen or Lean events and process improvement team meetings with some participants gathered locally in a more traditional setting and others attending remotely. Changes that are made to the process in one location are immediately visible to all others through their web browsers. When time and funding are scarce, this capability has enabled effective participation and cost reduction while minimizing the disruption to team member’s “real jobs.” Improved future-state process maps can then be exported to IBM Business Process Manager for more detailed simulation and eventual automation and implementation.
3 The NIST Definition of Cloud Computing (NIST Special Publication 800-145): http://csrc.nist.gov/publications/nistpubs/800-145/SP800-145.pdf
11
For more information about IBM Blueworks Live, go to this web address:
https://www.blueworkslive.com
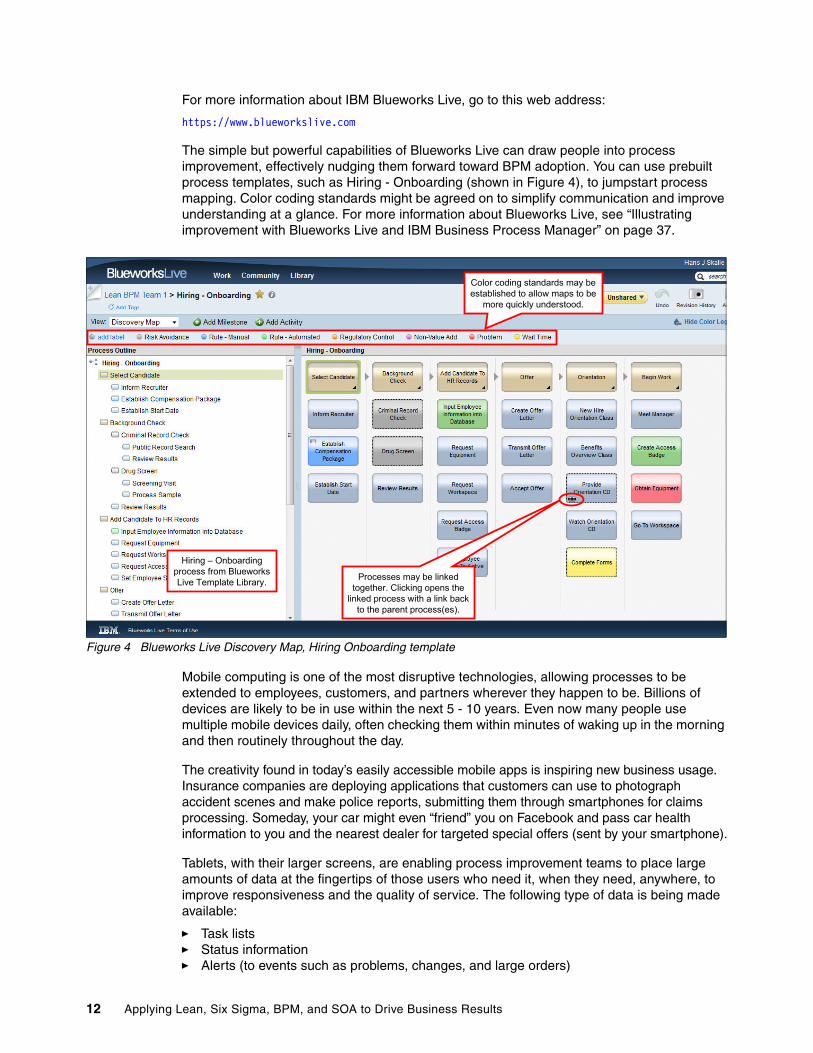
The simple but powerful capabilities of Blueworks Live can draw people into process improvement, effectively nudging them forward toward BPM adoption. You can use prebuilt process templates, such as Hiring - Onboarding (shown in Figure 4), to jumpstart process mapping. Color coding standards might be agreed on to simplify communication and improve understanding at a glance. For more information about Blueworks Live, see “Illustrating improvement with Blueworks Live and IBM Business Process Manager” on page 37.
Figure 4 Blueworks Live Discovery Map, Hiring Onboarding template
Mobile computing is one of the most disruptive technologies, allowing processes to be extended to employees, customers, and partners wherever they happen to be. Billions of devices are likely to be in use within the next 5 - 10 years. Even now many people use multiple mobile devices daily, often checking them within minutes of waking up in the morning and then routinely throughout the day.
The creativity found in today’s easily accessible mobile apps is inspiring new business usage. Insurance companies are deploying applications that customers can use to photograph accident scenes and make police reports, submitting them through smartphones for claims processing. Someday, your car might even “friend” you on Facebook and pass car health information to you and the nearest dealer for targeted special offers (sent by your smartphone).
Tablets, with their larger screens, are enabling process improvement teams to place large amounts of data at the fingertips of those users who need it, when they need, anywhere, to improve responsiveness and the quality of service. The following type of data is being made available:
� Task lists� Status information� Alerts (to events such as problems, changes, and large orders)
Hiring � Onboarding process from Blueworks Live Template Library. Processes may be linked
together. Clicking opens the linked process with a link back
to the parent process(es).
Color coding standards may be established to allow maps to be
more quickly understood.
12 Applying Lean, Six Sigma, BPM, and SOA to Drive Business Results
� KPIs� Other critical information
The small size of tablets and smartphones make them easier to carry and manage than a laptop. Tables and smartphones also have a longer lasting battery so that you do not need to stop to recharge them in the middle of a work shift. These devices typically start more quickly than a traditional laptop, making access to applications and information faster and easier. All of these things encourage adoption of the device and of the improved or new business process, which in turn, simplifies change management.
Obviously, retailers are investing heavily in mobile apps, which is driven by competition and the need to keep electronic storefronts nearby, easily accessible to their customers for product research, feedback, reviews, customer service, and orders. But mobile is being used successfully in other industries to including logistics, hospitality, travel, and healthcare.
Employee productivity is also being dramatically improved by extending business processes and data to mobile workers, eliminating the delays, frustration, and rework that result from not having immediate access to a personal computer. Think about the amount of time that you spend hunting for data or on the phone trying to close gaps in a process on an average day. Or consider how you might work more effectively if you had what you access to needed data and simple process workflows on a mobile device. Even email on a smartphone makes most of us more productive.
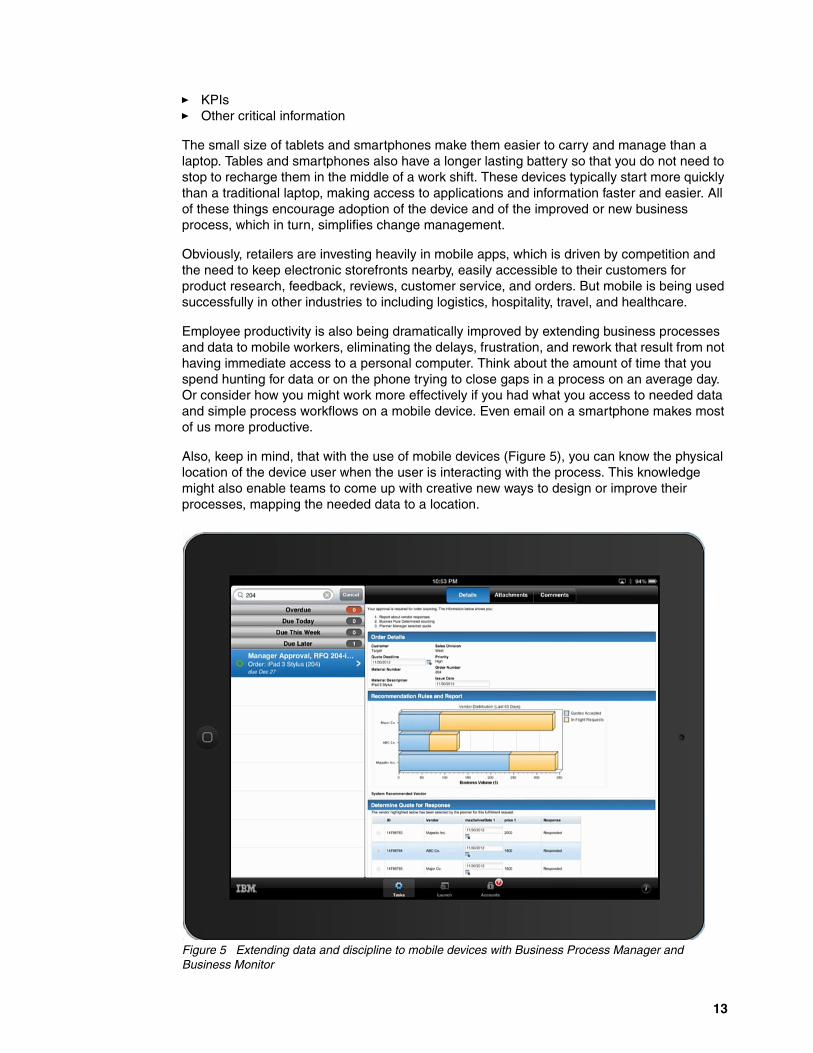
Also, keep in mind, that with the use of mobile devices (Figure 5), you can know the physical location of the device user when the user is interacting with the process. This knowledge might also enable teams to come up with creative new ways to design or improve their processes, mapping the needed data to a location.
Figure 5 Extending data and discipline to mobile devices with Business Process Manager and Business Monitor
13
Many leading organizations are establishing cloud and mobile computing strategies, architectures, and standards to accelerate IT delivery and increase efficiency. More often, the functionality that is needed to improve, transform, or create business processes will be available in the cloud or through a mobile device. Innovative improvement teams, who work closely with IT, can play a key role in creating a business that is focused on an implementation plan that delivers measurable results, minimizes risks, and maximizes ROI.
Lean and Six Sigma
Lean, which is a term that is coined by James Womack,4 in the broadest sense, is a business transformation methodology that derived from the Toyota Production System (TPS). Within the Lean methodology is a relentless focus on understanding and increasing customer value, by reducing the cycle time of product or service delivery. Reducing the cycle time occurs by eliminating all forms of muda, which is a Japanes term for “waste,” muri, which is a Japanese term for the “overburdening of people and machines,” and mura, which is a Japanese term for “unevenness in the workflow or unevenness in demand.”
Within the enterprise, these three concepts are linked in a circular fashion, that is waste causes unevenness, which causes overburdening that causes waste, and so on. Therefore, it is important to deal with all three concepts to improve the performance of the system. You cannot just optimize the performance of individual departments or vertical silos, which can create waste or unevenness elsewhere.
Although the elimination of muda, muri, and mura is critical to Lean thinking, equally critical is a clear understanding of value as defined by the ultimate customer of a product, service, or both. Will this customer be willing to pay for an activity if given the chance? If so, it adds value. According to Womack and Jones, Lean thinking “provides a way to specify value, line up value-creating actions in the best sequence (the value stream), conduct these activities without interruption whenever someone requests them, and perform them more and more effectively.”5 Simplified processes that can deliver (unique) value to the customer just when they need it is what BPM is really all about.
Taiichi Ohno, the father of the Toyota Production System, identified seven forms of waste:
� Over production (making more than is immediately needed)� Waiting or wait time� Unnecessary motion� Transporting� Inappropriate processing (using a process that is not capable of needed quality)� Excess inventory� Defects
Others, including Womack, Bicheno, and Holweg, have added more forms of waste, such as the following examples:
� Waste associated with efficiently making the wrong product� Waste of untapped human potential� Waste of excessive communication or information� Waste of natural resources� Waste of time (reactive) where most of the work day is spent urgently solving major problems6
Waste is any activity that uses resources but produces no value.7
4 James P. Womack, Daniel T. Jones, and Daniel Roos, The Machine That Changed the World: The Story of Lean Production – Toyota's Secret Weapon in the Global Car Wars That Is Now Revolutionizing World Industry (Free Press, March 13, 2007)
5 James P. Womack and Daniel T. Jones, Lean Thinking (Free Press, Second Edition, November 2010)6 John Bicheno and Matthias Holweg, The Lean Toolbox (PICSIE Books, Fourth Edition, January, 2009)
14 Applying Lean, Six Sigma, BPM, and SOA to Drive Business Results

Companies that work to improve their software delivery value streams are successfully applying Lean concepts to IT. The primary emphasis is placed on learning to see and then eliminate waste from IT processes, with iterative, agile development cycles that deliver the highest, measurable value to customers as rapidly as possible. According to Tom and Mary Poppendiek, waste in software development includes the following areas:
� Partially done work, which ties up resources without yielding results� Extra features, which result in (potentially complex) code that must be maintained� Task switching, which interrupts the efficient flow of both thought and work� Waiting, which “keeps the customer from realizing value as quickly as possible.”8
Changes in requirements during development are also a source of waste as is red tape, excessive documentation, and code defects, which result in rework while delaying benefits delivery. The Poppendieks suggest carefully looking at extra processes that generate paperwork that is not used by others for coding, testing, or the writing of training manuals.9
In their book, the Poppendieks state that “A minor defect not discovered for weeks is a much bigger waste (than a major defect discovered immediately)...the way to reduce the impact of defects is to test immediately, integrate often, and release to production as soon as possible.”10
IBM Business Process Manager lends itself well to an iterative, agile style of process improvement. This process begins with Discover, moves through Plan, Implement, and Deploy, and on to Manage and Optimize, which brings feedback to the next improvement cycle. For more information about this method, see the IBM Redbooks® publication, Scaling BPM Adoption: From Project to Program with IBM Business Process Manager, SG24-7973.
Six Sigma was a concept that was developed in 1985 by Bill Smith of Motorola. He is known as “the Father of Six Sigma.” This concept contributed directly to Motorola’s winning of the US Malcolm Baldrige National Quality Award in 1988. Six Sigma is a business transformation methodology that maximizes profits and delivers value to customers. It focuses on the reduction of variation and elimination of defects by using various statistical and data-based tools and techniques.
Six Sigma relies on a group of trained persons with Green Belts, Black Belts, and Master Black Belts to work projects and drive improvement initiatives forward by using an iterative five-phase problem-solving method to improve existing processes. This method is known as Define, Measure, Analyze, Improve, Control (DMAIC) and normally underpins Lean Six Sigma. For more information about the linkage with BPM and SOA, see “Supporting DMAIC with BPM and SOA” on page 31.
Both methodologies focus on business processes and process metrics, and strive to increase customer satisfaction by providing quality and on-time products and services. Lean takes a more holistic or systemic view (where supply chains compete, not companies). It uses such tools as value stream mapping or value analysis, balancing of workflow, and kanban pull signaling systems to trigger work, streamline and improve the efficiency of processes, and increase the speed of delivery. Six Sigma is a powerful problem-solving methodology that takes a more data-based and analytical approach by using tools to eliminate variation and deliver error-free products and services, such as the following examples:
� Voice of the customer (VOC)� Measurement systems analysis (MSA) � Statistical hypothesis testing
7 James P. Womack and Daniel T. Jones, Lean Thinking (Free Press, Second Edition, November 2010)8 Tom and Mary Poppendiek, Lean Software Development, an Agile Toolkit (Addison Wesley, 2003)9 Ibid10 Ibid
15
� Design of experiments (DOE)� Failure modes and effects analysis (FMEA)
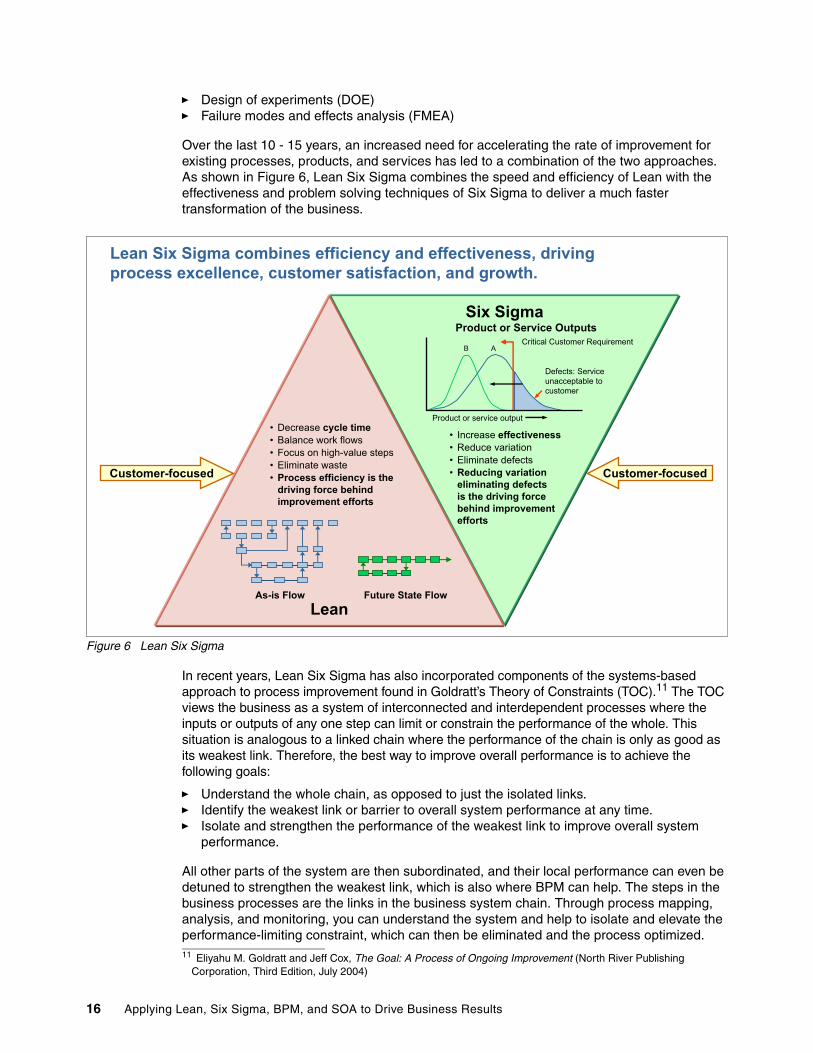
Over the last 10 - 15 years, an increased need for accelerating the rate of improvement for existing processes, products, and services has led to a combination of the two approaches. As shown in Figure 6, Lean Six Sigma combines the speed and efficiency of Lean with the effectiveness and problem solving techniques of Six Sigma to deliver a much faster transformation of the business.
Figure 6 Lean Six Sigma
In recent years, Lean Six Sigma has also incorporated components of the systems-based approach to process improvement found in Goldratt’s Theory of Constraints (TOC).11 The TOC views the business as a system of interconnected and interdependent processes where the inputs or outputs of any one step can limit or constrain the performance of the whole. This situation is analogous to a linked chain where the performance of the chain is only as good as its weakest link. Therefore, the best way to improve overall performance is to achieve the following goals:
� Understand the whole chain, as opposed to just the isolated links.� Identify the weakest link or barrier to overall system performance at any time.� Isolate and strengthen the performance of the weakest link to improve overall system
performance.
All other parts of the system are then subordinated, and their local performance can even be detuned to strengthen the weakest link, which is also where BPM can help. The steps in the business processes are the links in the business system chain. Through process mapping, analysis, and monitoring, you can understand the system and help to isolate and elevate the performance-limiting constraint, which can then be eliminated and the process optimized.
Six SigmaProduct or Service Outputs
� Increase effectiveness� Reduce variation� Eliminate defects� Reducing variation
eliminating defects is the driving force behind improvement efforts
Customer-focused
� Decrease cycle time� Balance work flows� Focus on high-value steps� Eliminate waste� Process efficiency is the
driving force behind improvement efforts
Customer-focused
Future State FlowAs-is FlowLean
Lean Six Sigma combines efficiency and effectiveness, drivingprocess excellence, customer satisfaction, and growth.
Defects: Serviceunacceptable to customer
Critical Customer Requirement
Product or service output
B A
11 Eliyahu M. Goldratt and Jeff Cox, The Goal: A Process of Ongoing Improvement (North River Publishing Corporation, Third Edition, July 2004)
16 Applying Lean, Six Sigma, BPM, and SOA to Drive Business Results
Designing new processes, products, and servicesSuch companies as General Electric developed the Define, Measure, Analyze, Develop, Verify (DMADV) roadmap to design and implement new products or services. Other companies, such as the PricewaterhouseCoopers consultant group (now part of IBM Global Business Services®), developed the Define, Measure, Explore, Develop, Implement (DMEDI) roadmap. Still, other companies use the Conceive, Develop, Optimize, and Verify (CDOV) roadmap for new product development. Most companies integrate these Design for Six Sigma (DFSS) approaches with their existing new product development stage gate processes.
Toyota also pioneered an improved system to develop new cars, which lead to the successful development of the Toyota Prius. This little known Lean Product and Process Development is a revolutionary but proven system.12 It can help reduce development time and resource consumption by as much as four times and reduce the risk of cost and schedule overruns and quality issues by as much as 10 times. It can help to increase innovation by as much as 10 times and can help to reduce capital costs. It uses such concepts as set-based concurrent engineering, cadence, pull and flow. It was also adopted for the development of products and software.
Combining technology, tools, and technique
Lean Six Sigma achieves business transformation through the coordinated execution of multiple process improvement and design projects. This transformation on the following keys to success:
� Selection of the right projects for improvement or design� Execution of the projects by using the methodologies that are embodied in Lean Six
Sigma� Continual management of processes (including the ongoing elimination of waste and
nonvalue adding activities) to achieve business strategies and goals
The first and third components are strategic in nature, where the second component is tactical. BPM capabilities, including modeling, simulation, and real-time control over processes, can play a significant role in enabling all three areas. Project selection by using a BPM framework provides sustainable improvement and results in the achievement of short-term and long-term strategic objectives and business goals.
IBM Business Process Manager and Blueworks Live usage patterns
Although you can use BPM and SOA components and capabilities in various ways in new process design and continuous process improvement, three higher-level usage patterns stand out:
� Deploy Business Monitor to provide visibility into process performance, system-level KPIs, and constraints.
The old saying “You cannot improve what you do not measure” it still holds true today. Through meaningful real-time and historical data, process owners can see the flow of work as it crosses departmental boundaries so that they can respond to bottlenecks and opportunities more quickly. Workers often improve their own performance-given feedback in the form of measures and dashboard data. This insight also enables improvement efforts to be targeted more effectively, with data that is used to prioritize projects that improve the business system versus individual departments or subprocesses. For some companies, improved visibility is step one. This step can sometimes be accomplished
12 Allen C. Ward, Lean Product and Process Development (Lean Enterprise Institute, Inc., 2007)
17
quickly by monitoring the events that are emitted by the flow of data between systems and presenting the results in business dashboards.
� Model an improved future-state process, and then, automate it as step one by using IBM Business Process Manager.
This pattern has the potential to deliver the fastest results, and it can be used to jump-start a wider improvement effort by delivering a showcase project that generates momentum and success that can be further used. Interestingly, some teams deliver great performance results by deliberately avoiding detailed mapping and analysis of the current state, essentially avoiding constrained thinking through future-looking brainstorming. They challenge the status quo and look for process breakthroughs by asking themselves: What would we want this process to do if it could do we want it to?
This approach can take some work because team members often do not realize that their thinking is limited by current process and application capabilities (or constraints). “We have to do it this way because the system forces us” is often heard during brainstorming sessions. A strong facilitator can force the team to recognize and get past this limitation. Obviously this area is also where a strong, collaborative, business and results-focused IT or business partnership is needed. Creativity helps too.
The key is selecting the right limited-scope process or subprocess that has the following characteristics:
– Adds measurable business benefit
– Can be transformed in three-month to six-month cycles
– Will not suboptimize the performance of upstream or downstream processes (or subprocesses) when improved
Look for forms-based or rules-driven processes that can be automated such as the following examples:
– Processes with multiple paths or decisions, or those processes that might benefit from rapid change or reconfiguration
– Processes that include data rekeying or rework (and might benefit from integration)
– Processes that directly impact customer satisfaction (or dissatisfaction) such as returns or repairs
– Processes with exceptions that can be managed more efficiently (and eliminated)
– Processes that run repeatedly, require manual effort, might benefit from simplification or might yield downstream benefit (for example, faster time to productivity), such as vendor, employee, or customer onboarding
– Processes that can be extended to mobile workers or whose participants are not tied to a desk or PC
– Processes that can be used to create unique customer experiences or result in customer delight
With this approach, less emphasis is placed on a detailed analysis of the current state and more emphasis is placed on using process experts to design the improved future-state based on collective best practices. When implemented, the analysis and simulation capabilities of IBM Business Process Manager Optimizer with real-time and historical data are used to guide and prioritize ongoing improvements.
To jumpstart a stalled BPM initiative, select a quick-win project that has clear functional improvements and financial benefit that can be easily calculated. Use this project to demonstrate and sell basic BPM capabilities to others in the organization, increasing their awareness, interest, and demand. Pay close attention to the look and feel of the user interface to increase appeal, to the simplified process flow, and to the reduced work effort.
18 Applying Lean, Six Sigma, BPM, and SOA to Drive Business Results
This pattern is also ideal for designing new processes that might differentiate or improve existing processes where the current state is too far gone (from the perspective of the customer) or too fragmented to cost effectively reuse or repair.
� Use Blueworks Live to map and analyze current-state processes, design future-state alternatives, and then automate appropriately by using IBM Business Process Manager.
This approach is a more traditional usage pattern and is well within the comfort zone of most Lean Six Sigma teams. Many companies use Blueworks Live to support their Kaizen or Lean events and begin their process improvements. Blueworks Live enables processes to be analyzed from multiple perspectives, including added value, work and wait time, problems, risk, and cost. After opportunities for improvement are identified, alternative future-state maps can be created, socialized, and selected. The preferred alternative can be imported into IBM Business Process Manager for implementation where Optimizer is again used to prioritize continuous improvement. This usage pattern also works well when the stated objective is to document existing processes or when meaningful improvements can be made without system integration or workflow and rules automation.
Some companies begin by mapping all of their high-value core and enabling processes first before beginning improvement efforts. Blueworks Live simplifies this process through its online collaboration capability. After processes are analyzed and the right (most constraining) projects are selected, future-state alternatives can be modeled and brought into IBM Business Process Manager for full implementation.
Obviously these usage patterns can be and often are used in combination. Many companies use a BPM Center of Excellence (COE) to coordinate project team activities, enforce standards, manage reuse, quantify benefit, and accelerate implementation to maximize results. Momentum can be accelerated by using reusable components including services, process models, KPIs, and the best practices that are embedded in them and in the experiences of the deployment teams.
Using a strategy-driven deployment frameworkGeorge Eckes, in The Six Sigma Revolution: How General Electric and Others Turned Process into Profits,13 describes how BPM can play a significant and strategic role in enabling Six Sigma. He proposes a BPM framework that addresses the strategic first and third components.
13 George Eckes, The Six Sigma Revolution: How General Electric and Others Turned Process into Profits (John Wiley, First Edition, November 10, 2000)
19
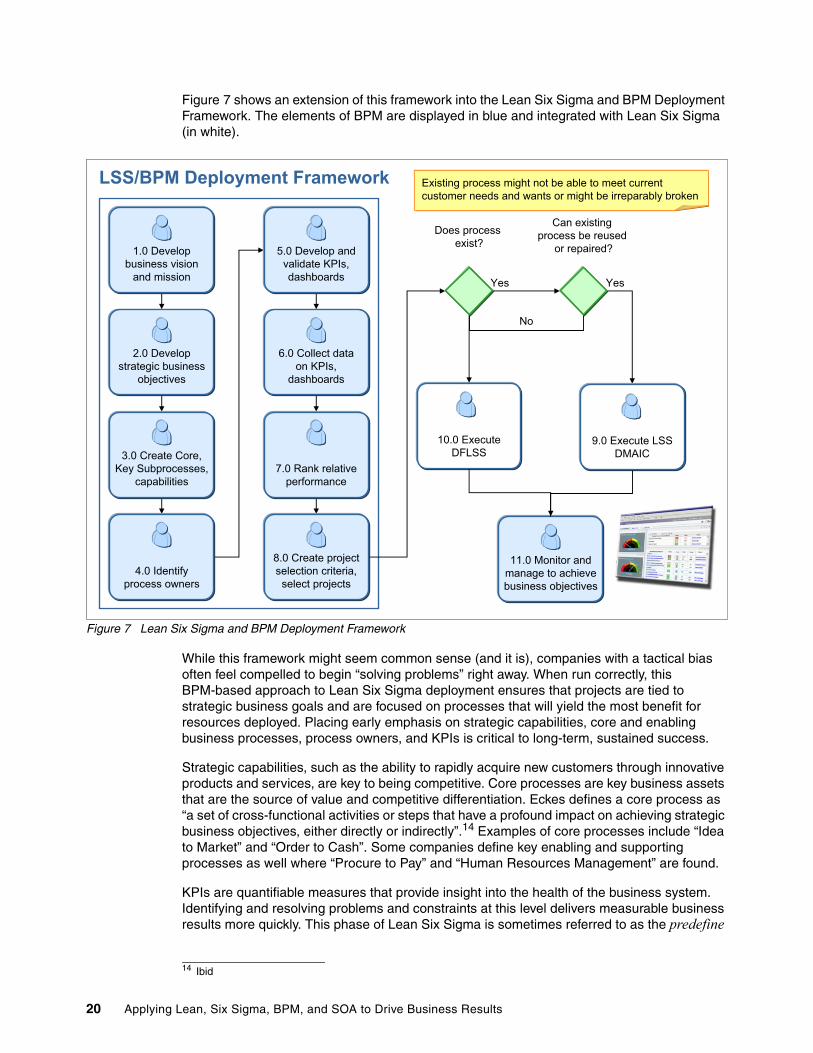
Figure 7 shows an extension of this framework into the Lean Six Sigma and BPM Deployment Framework. The elements of BPM are displayed in blue and integrated with Lean Six Sigma (in white).
Figure 7 Lean Six Sigma and BPM Deployment Framework
While this framework might seem common sense (and it is), companies with a tactical bias often feel compelled to begin “solving problems” right away. When run correctly, this BPM-based approach to Lean Six Sigma deployment ensures that projects are tied to strategic business goals and are focused on processes that will yield the most benefit for resources deployed. Placing early emphasis on strategic capabilities, core and enabling business processes, process owners, and KPIs is critical to long-term, sustained success.
Strategic capabilities, such as the ability to rapidly acquire new customers through innovative products and services, are key to being competitive. Core processes are key business assets that are the source of value and competitive differentiation. Eckes defines a core process as “a set of cross-functional activities or steps that have a profound impact on achieving strategic business objectives, either directly or indirectly”.14 Examples of core processes include “Idea to Market” and “Order to Cash”. Some companies define key enabling and supporting processes as well where “Procure to Pay” and “Human Resources Management” are found.
KPIs are quantifiable measures that provide insight into the health of the business system. Identifying and resolving problems and constraints at this level delivers measurable business results more quickly. This phase of Lean Six Sigma is sometimes referred to as the predefine
Existing process might not be able to meet current customer needs and wants or might be irreparably broken
10.0 ExecuteDFLSS
11.0 Monitor andmanage to achievebusiness objectives
Does process exist?
Yes
No
Can existing process be reused
or repaired?
Yes
LSS/BPM Deployment Framework
1.0 Developbusiness vision
and mission
5.0 Develop andvalidate KPIs,dashboards
2.0 Developstrategic business
objectives
6.0 Collect dataon KPIs,
dashboards
3.0 Create Core,Key Subprocesses,
capabilities7.0 Rank relative
performance
4.0 Identifyprocess owners
8.0 Create projectselection criteria,select projects
9.0 Execute LSSDMAIC
14 Ibid
20 Applying Lean, Six Sigma, BPM, and SOA to Drive Business Results
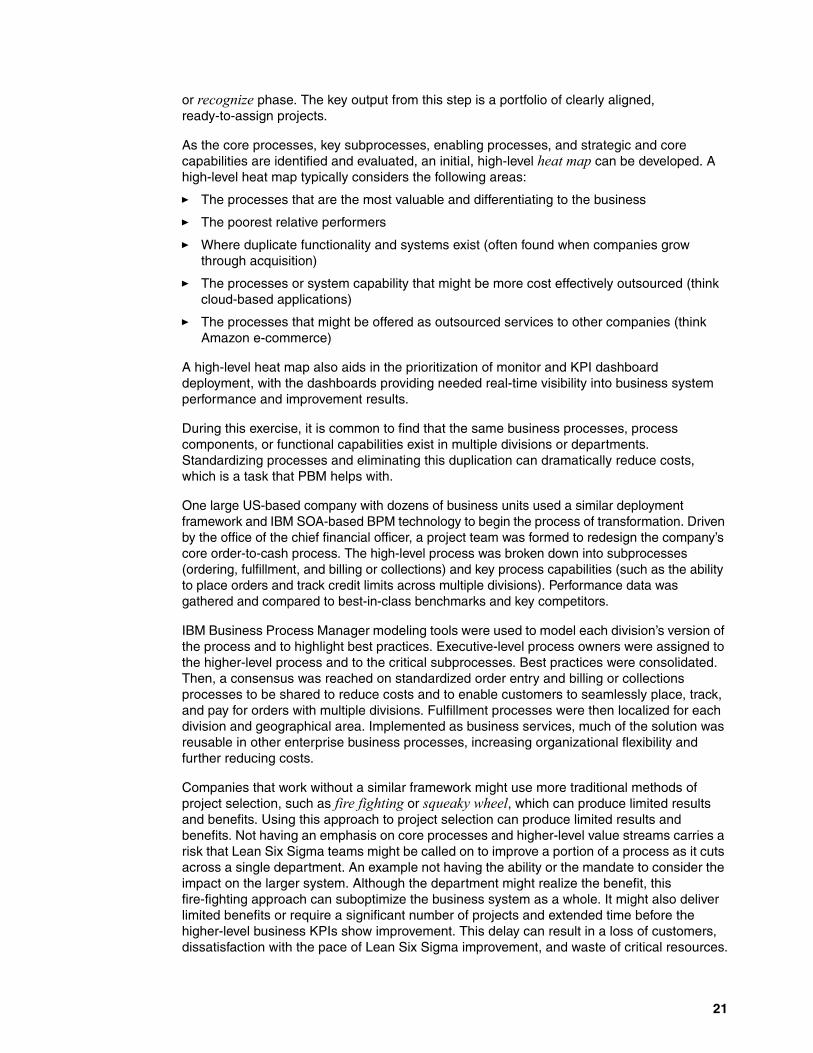
or recognize phase. The key output from this step is a portfolio of clearly aligned, ready-to-assign projects.
As the core processes, key subprocesses, enabling processes, and strategic and core capabilities are identified and evaluated, an initial, high-level heat map can be developed. A high-level heat map typically considers the following areas:
� The processes that are the most valuable and differentiating to the business
� The poorest relative performers
� Where duplicate functionality and systems exist (often found when companies grow through acquisition)
� The processes or system capability that might be more cost effectively outsourced (think cloud-based applications)
� The processes that might be offered as outsourced services to other companies (think Amazon e-commerce)
A high-level heat map also aids in the prioritization of monitor and KPI dashboard deployment, with the dashboards providing needed real-time visibility into business system performance and improvement results.
During this exercise, it is common to find that the same business processes, process components, or functional capabilities exist in multiple divisions or departments. Standardizing processes and eliminating this duplication can dramatically reduce costs, which is a task that PBM helps with.
One large US-based company with dozens of business units used a similar deployment framework and IBM SOA-based BPM technology to begin the process of transformation. Driven by the office of the chief financial officer, a project team was formed to redesign the company’s core order-to-cash process. The high-level process was broken down into subprocesses (ordering, fulfillment, and billing or collections) and key process capabilities (such as the ability to place orders and track credit limits across multiple divisions). Performance data was gathered and compared to best-in-class benchmarks and key competitors.
IBM Business Process Manager modeling tools were used to model each division’s version of the process and to highlight best practices. Executive-level process owners were assigned to the higher-level process and to the critical subprocesses. Best practices were consolidated. Then, a consensus was reached on standardized order entry and billing or collections processes to be shared to reduce costs and to enable customers to seamlessly place, track, and pay for orders with multiple divisions. Fulfillment processes were then localized for each division and geographical area. Implemented as business services, much of the solution was reusable in other enterprise business processes, increasing organizational flexibility and further reducing costs.
Companies that work without a similar framework might use more traditional methods of project selection, such as fire fighting or squeaky wheel, which can produce limited results and benefits. Using this approach to project selection can produce limited results and benefits. Not having an emphasis on core processes and higher-level value streams carries a risk that Lean Six Sigma teams might be called on to improve a portion of a process as it cuts across a single department. An example not having the ability or the mandate to consider the impact on the larger system. Although the department might realize the benefit, this fire-fighting approach can suboptimize the business system as a whole. It might also deliver limited benefits or require a significant number of projects and extended time before the higher-level business KPIs show improvement. This delay can result in a loss of customers, dissatisfaction with the pace of Lean Six Sigma improvement, and waste of critical resources.
21

By focusing on KPIs and gathering data across the business system first, improvements can be targeted with almost surgical precision. Results become immediately visible in the KPI dashboards and are immediately felt by customers.
Selecting the right project
Project selection criteria should have a clear and direct linkage to stated executive management objectives such as the following examples:
� Increasing revenue by US$50 million� Increasing revenue from new products and services by US$10 million� Decreasing cost of sales by US$10 million� Improving customer satisfaction or retention by 2 percent
Additional selection criteria is based on the value of the process to the business and its relative health. Alternatively, the criteria might guide selection toward the source of dissatisfaction or across functional boundaries. Even when armed with a set of criteria and guiding principles, choosing the right project can be difficult.
Businesses most frequently organize and measure themselves by function, such as purchasing, sales, marketing, fulfillment, billing, and collections. Improvement projects have often focused on increasing the effectiveness or efficiency of these functions, with teams working under the assumption that, if the functional area is improved, the whole process will be too. Processes were assumed to be independent.
Early on, the primary goal of improvement efforts might be cost reduction. Although this approach can be successful, customers rarely interact with just one function. Most customers frequently move cross functionally. For example, they place an order, pay for it, receive it, and then interact with the company during use, all through (ideally) a smooth flowing process that is focused on their satisfaction and requirements.
As companies shift their focus to these end-to-end processes, attempting to reduce overall cycle times or increase overall throughput, project selection becomes more critical and more challenging. Unless project selection focuses on eliminating a key system constraint, the immediate result is not visible, nor felt by the customer or the business system as a whole, as measured by increased revenue, growth, retention, or profit. Today corporate executives expect to see results in these areas and to see them quickly.
For this reason, Lean Six Sigma practitioners are incorporating Goldratt’s Theory of Constraints into their own methodologies to aid in project selection and performance improvement. The Theory of Constraints postulates that all systems are like chains or networks of chains and that, at any time, only one constraint can limit the overall performance of that system.15 Everything else, then, is viewed as a non-constraint. Eliminating the constraint then measurably improves the performance of the entire system.
We illustrate how this works by using a simple lease approval process (a core process for a leasing company). In this example, the process is illustrated as a chain, with each subprocess or step represented as a link. Although most business systems are much more complex, the concept of having only one constraint limiting system performance at any time is still applicable. In this example, the current market demand for leases is 15 per hour. We have a stated goal of increasing the throughput capacity of our process to 20 leases per hour, which is just above the market in anticipation of growth. Although our example includes only intracompany subprocesses and activities, another example can as easily include a Value Stream that extends up and or down the supply chain.
15 Eliyahu M. Goldratt and Jeff Cox, The Goal: A Process of Ongoing Improvement (North River Publishing Corporation, Third Edition, July 2004)
22 Applying Lean, Six Sigma, BPM, and SOA to Drive Business Results
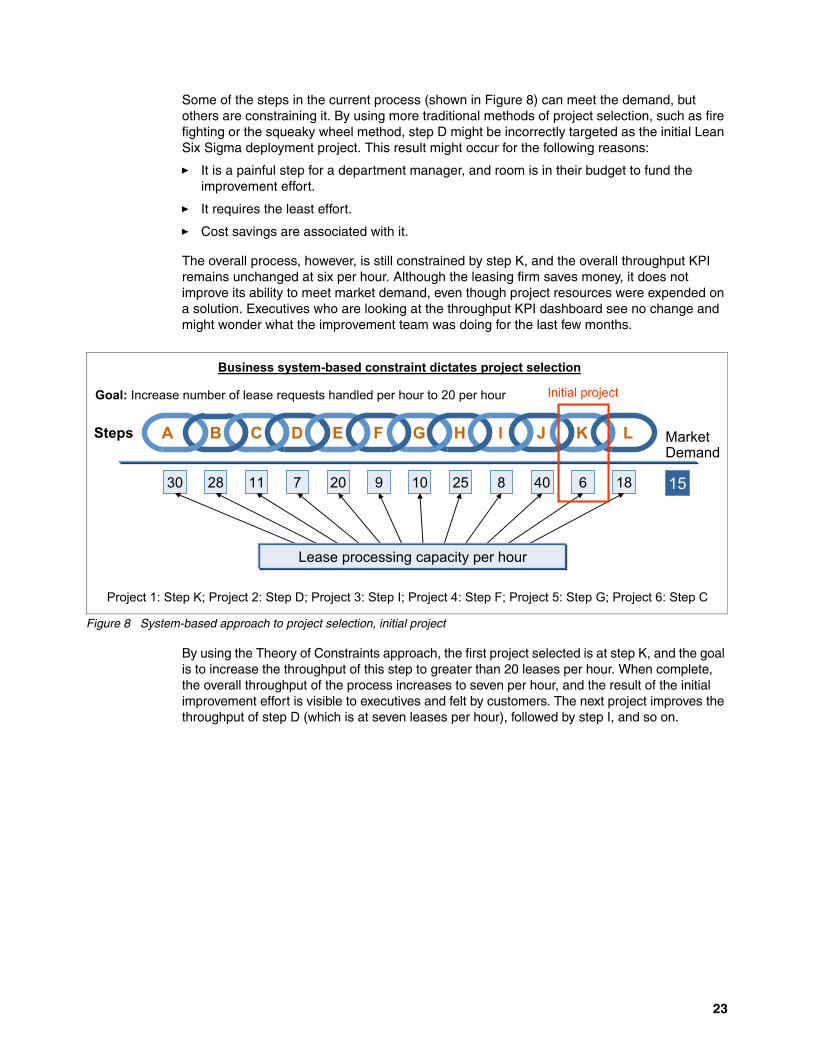
Some of the steps in the current process (shown in Figure 8) can meet the demand, but others are constraining it. By using more traditional methods of project selection, such as fire fighting or the squeaky wheel method, step D might be incorrectly targeted as the initial Lean Six Sigma deployment project. This result might occur for the following reasons:
� It is a painful step for a department manager, and room is in their budget to fund the improvement effort.
� It requires the least effort.
� Cost savings are associated with it.
The overall process, however, is still constrained by step K, and the overall throughput KPI remains unchanged at six per hour. Although the leasing firm saves money, it does not improve its ability to meet market demand, even though project resources were expended on a solution. Executives who are looking at the throughput KPI dashboard see no change and might wonder what the improvement team was doing for the last few months.
Figure 8 System-based approach to project selection, initial project
By using the Theory of Constraints approach, the first project selected is at step K, and the goal is to increase the throughput of this step to greater than 20 leases per hour. When complete, the overall throughput of the process increases to seven per hour, and the result of the initial improvement effort is visible to executives and felt by customers. The next project improves the throughput of step D (which is at seven leases per hour), followed by step I, and so on.
A B C D E F G H I J K L
30 28 11 7 20 9 10 25 8 40 6 18 15
Steps MarketDemand
Lease processing capacity per hour
Project 1: Step K; Project 2: Step D; Project 3: Step I; Project 4: Step F; Project 5: Step G; Project 6: Step C
Goal: Increase number of lease requests handled per hour to 20 per hour
Business system-based constraint dictates project selection
Initial project
23
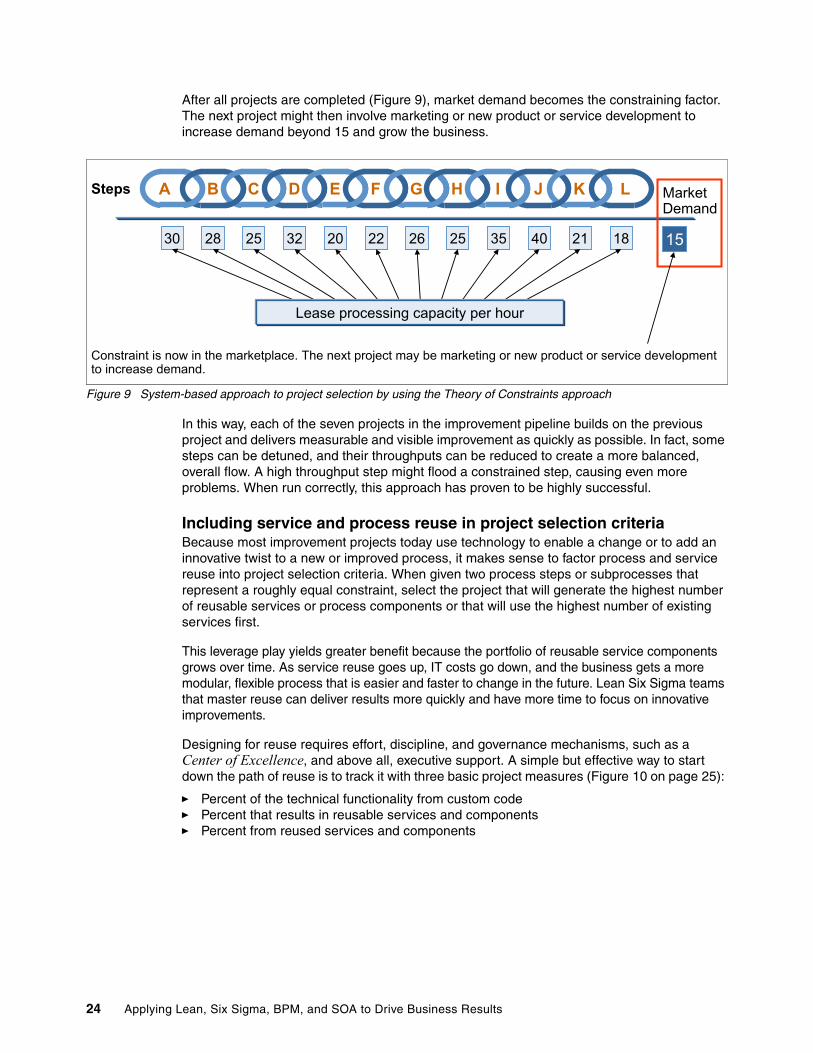
After all projects are completed (Figure 9), market demand becomes the constraining factor. The next project might then involve marketing or new product or service development to increase demand beyond 15 and grow the business.
Figure 9 System-based approach to project selection by using the Theory of Constraints approach
In this way, each of the seven projects in the improvement pipeline builds on the previous project and delivers measurable and visible improvement as quickly as possible. In fact, some steps can be detuned, and their throughputs can be reduced to create a more balanced, overall flow. A high throughput step might flood a constrained step, causing even more problems. When run correctly, this approach has proven to be highly successful.
Including service and process reuse in project selection criteriaBecause most improvement projects today use technology to enable a change or to add an innovative twist to a new or improved process, it makes sense to factor process and service reuse into project selection criteria. When given two process steps or subprocesses that represent a roughly equal constraint, select the project that will generate the highest number of reusable services or process components or that will use the highest number of existing services first.
This leverage play yields greater benefit because the portfolio of reusable service components grows over time. As service reuse goes up, IT costs go down, and the business gets a more modular, flexible process that is easier and faster to change in the future. Lean Six Sigma teams that master reuse can deliver results more quickly and have more time to focus on innovative improvements.
Designing for reuse requires effort, discipline, and governance mechanisms, such as a Center of Excellence, and above all, executive support. A simple but effective way to start down the path of reuse is to track it with three basic project measures (Figure 10 on page 25):
� Percent of the technical functionality from custom code� Percent that results in reusable services and components� Percent from reused services and components
Constraint is now in the marketplace. The next project may be marketing or new product or service developmentto increase demand.
A B C D E F G H I J K L
30 28 25 32 20 22 26 25 35 40 21 18 15
Steps MarketDemand
Lease processing capacity per hour
24 Applying Lean, Six Sigma, BPM, and SOA to Drive Business Results
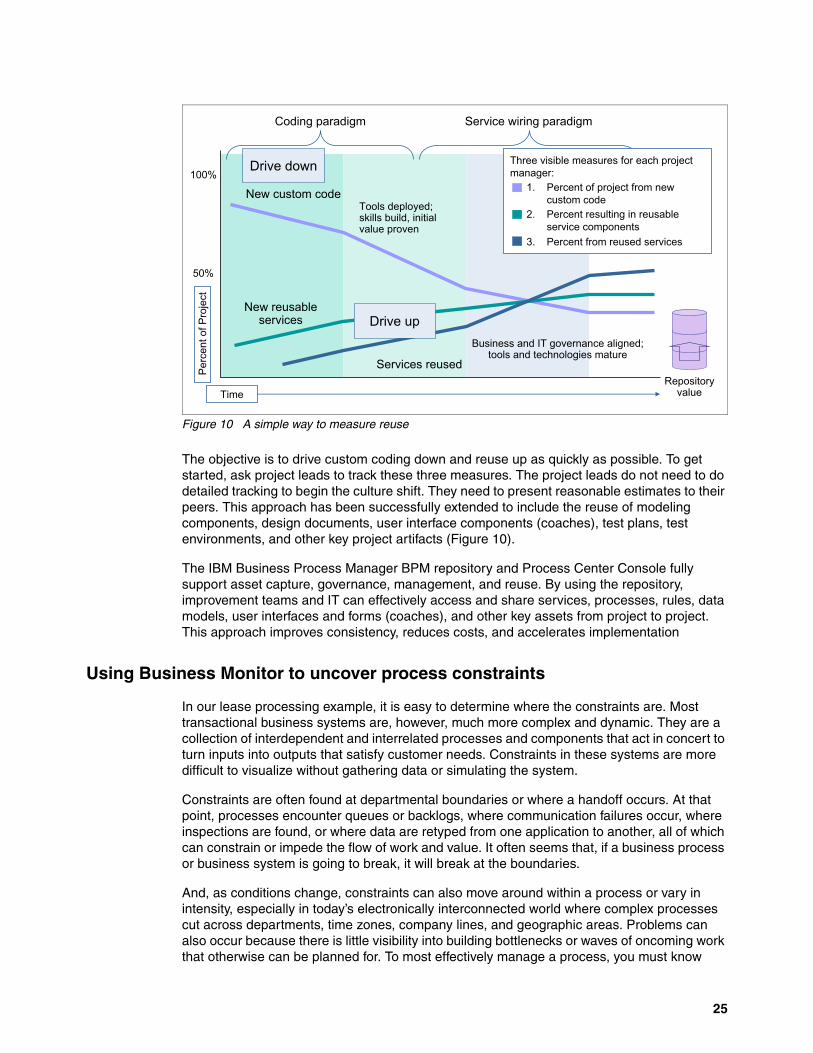
Figure 10 A simple way to measure reuse
The objective is to drive custom coding down and reuse up as quickly as possible. To get started, ask project leads to track these three measures. The project leads do not need to do detailed tracking to begin the culture shift. They need to present reasonable estimates to their peers. This approach has been successfully extended to include the reuse of modeling components, design documents, user interface components (coaches), test plans, test environments, and other key project artifacts (Figure 10).
The IBM Business Process Manager BPM repository and Process Center Console fully support asset capture, governance, management, and reuse. By using the repository, improvement teams and IT can effectively access and share services, processes, rules, data models, user interfaces and forms (coaches), and other key assets from project to project. This approach improves consistency, reduces costs, and accelerates implementation
Using Business Monitor to uncover process constraints
In our lease processing example, it is easy to determine where the constraints are. Most transactional business systems are, however, much more complex and dynamic. They are a collection of interdependent and interrelated processes and components that act in concert to turn inputs into outputs that satisfy customer needs. Constraints in these systems are more difficult to visualize without gathering data or simulating the system.
Constraints are often found at departmental boundaries or where a handoff occurs. At that point, processes encounter queues or backlogs, where communication failures occur, where inspections are found, or where data are retyped from one application to another, all of which can constrain or impede the flow of work and value. It often seems that, if a business process or business system is going to break, it will break at the boundaries.
And, as conditions change, constraints can also move around within a process or vary in intensity, especially in today’s electronically interconnected world where complex processes cut across departments, time zones, company lines, and geographic areas. Problems can also occur because there is little visibility into building bottlenecks or waves of oncoming work that otherwise can be planned for. To most effectively manage a process, you must know
Coding paradigm Service wiring paradigm
Repositoryvalue
Tools deployed;skills build, initial value proven
New custom code
New reusableservices
Services reused
100%
50%
Business and IT governance aligned;tools and technologies mature
Drive down
Drive up
Three visible measures for each projectmanager:
1. Percent of project from new custom code
2. Percent resulting in reusable service components
3. Percent from reused services
Per
cent
of P
roje
ct
Time
25
where the constraints and bottlenecks are at any point. To use a team sport analogy, you must keep an eye on the opposing team’s position. Monitoring electronic events that occur within a process can help uncover these constraints and more accurately gauge their impact.
Today, few processes do not include multiple technology touch points, system interactions, or message flows. Applications are updated by process workers, and data is handed off automatically from one system to another as a process moves along and across boundaries. Events can be captured from these interactions and correlated in monitoring technologies. For example, IBM Business Monitor (with a mapping wizard) can provide end-to-end dashboard views into the KPIs that reveal current and predicted levels of performance and process constraints.
Some companies view the deployment of IBM Business Monitor as step one in their BPM initiatives. They use event data early to provide improved transaction, work flow, and constraint visibility and to gather data that is needed to better target and prioritize their improvement efforts. Event data can be readily available (many IBM products, including device sensors, emit events on demand). Some applications might need to be instrumented to emit events in the needed standards-based format.
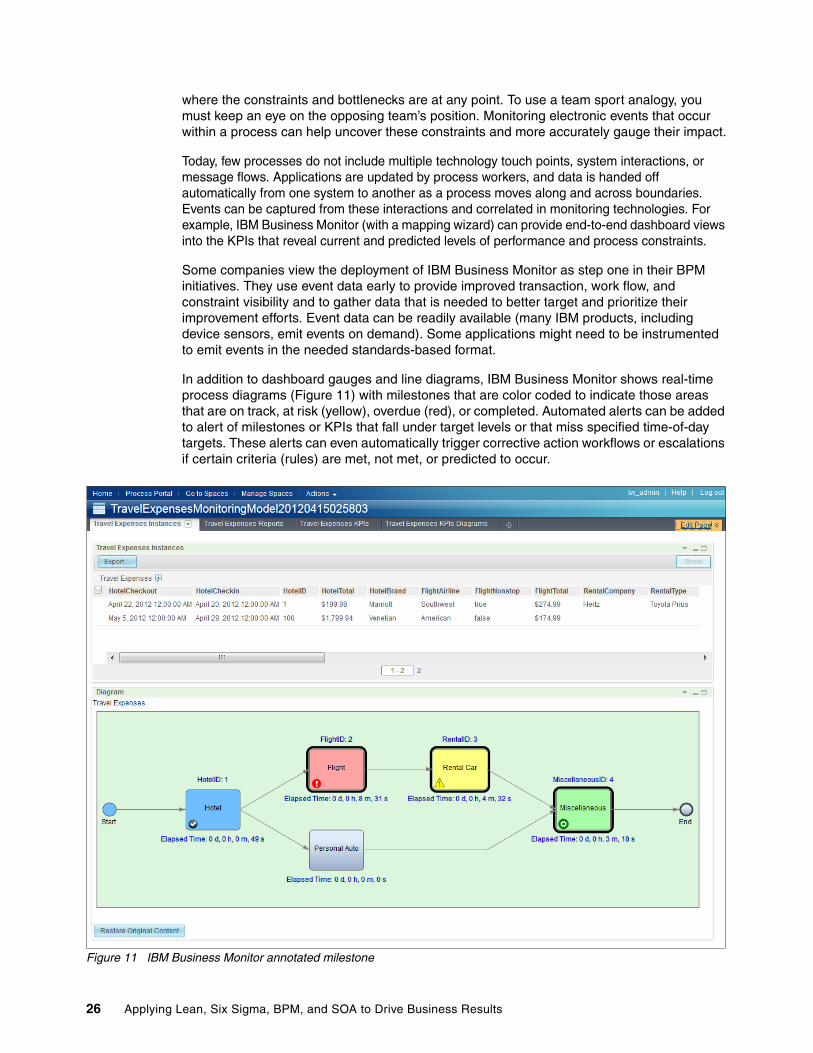
In addition to dashboard gauges and line diagrams, IBM Business Monitor shows real-time process diagrams (Figure 11) with milestones that are color coded to indicate those areas that are on track, at risk (yellow), overdue (red), or completed. Automated alerts can be added to alert of milestones or KPIs that fall under target levels or that miss specified time-of-day targets. These alerts can even automatically trigger corrective action workflows or escalations if certain criteria (rules) are met, not met, or predicted to occur.
Figure 11 IBM Business Monitor annotated milestone
26 Applying Lean, Six Sigma, BPM, and SOA to Drive Business Results
Several SAP customers are also using IBM Business Monitor to provide visibility into their process flows and KPIs. The process steps that are supported by SAP can be documented when applications are initially configured and deployed. However, they might fall out of synch as changes are made to the applications and the documentation is not kept up. Over time process flows become more difficult to see. IBM Business Monitor, by using event data captured with the IBM WebSphere SAP adapter, can provide real-time visibility into process milestones. The rich event data that comes from the adapter can be used to create metrics and KPIs that give new insight into transaction patterns and process constraints. Flexibility is also increased as new KPIs can be easily created or modified to meet specific but short-term and long-term monitoring requirements.
IBM Business Process Manager Optimizer (Figure 12) offers more workflow monitoring capabilities, with simulation and analysis, using real-time, generated, and historical data. You can configure IBM Business Process Manager to automatically store execution time, wait time, cost, and other critical input/output data and to present results in summary views.
Figure 12 IBM Business Process Manager Optimizer
In Analysis mode, process heat maps highlight such things as wait time and bottlenecks. By using this capability, improvement teams and process owners can identify resources that are overused or underused across multiple processes. They can also simulate the effect of adding or reallocating resources to one or more participant groups to balance process flow and improve throughput. IBM Business Process Manager Optimizer recommends business rule changes that can be implemented to further reduce cycle time and to eliminate constraints.
The importance of measures and monitoringOver the years, studies have shown that many of the gains that result from an improvement project can be lost even in the months after implementation. Process change can be similar to stretching a rubberband. As you introduce change, there is always that tendency to snap back into the old ways of doing things. Technology-enabled improvement, such as workflow automation and rules-based straight-through processing, can “lock in” improvement. However, process measures and monitoring provide visibility into real-time process performance and to any degradation that results from the snap-back effect.
27
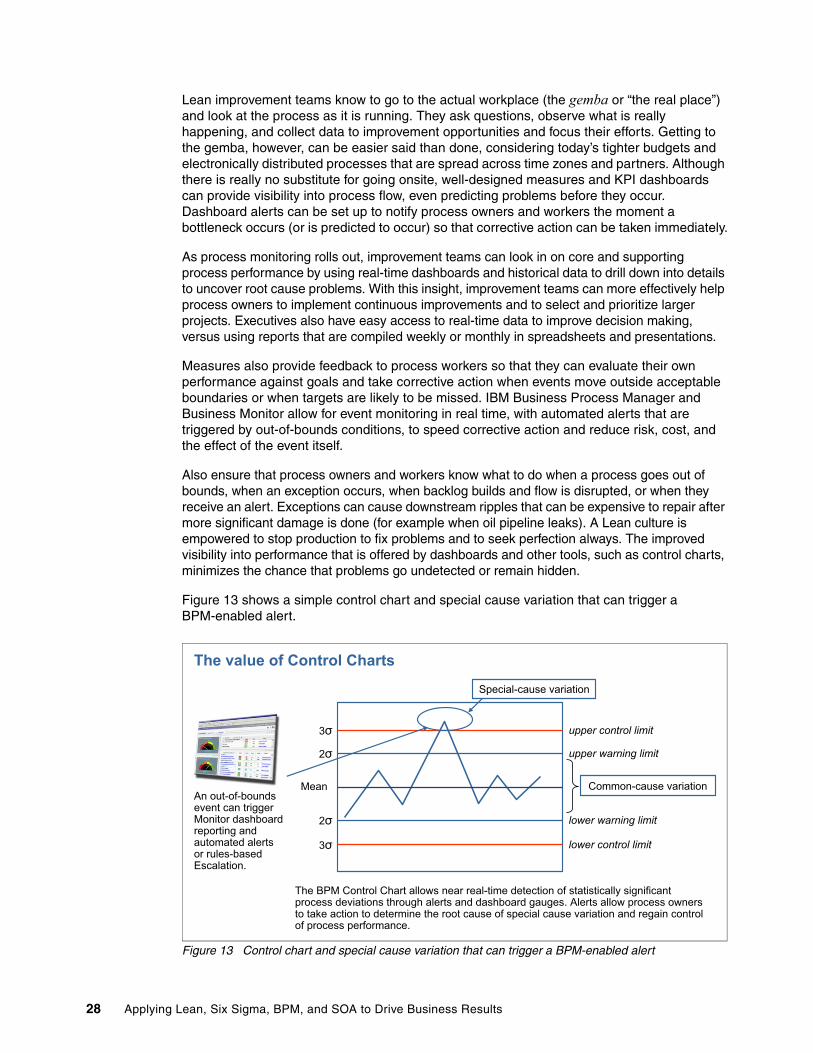
Lean improvement teams know to go to the actual workplace (the gemba or “the real place”) and look at the process as it is running. They ask questions, observe what is really happening, and collect data to improvement opportunities and focus their efforts. Getting to the gemba, however, can be easier said than done, considering today’s tighter budgets and electronically distributed processes that are spread across time zones and partners. Although there is really no substitute for going onsite, well-designed measures and KPI dashboards can provide visibility into process flow, even predicting problems before they occur. Dashboard alerts can be set up to notify process owners and workers the moment a bottleneck occurs (or is predicted to occur) so that corrective action can be taken immediately.
As process monitoring rolls out, improvement teams can look in on core and supporting process performance by using real-time dashboards and historical data to drill down into details to uncover root cause problems. With this insight, improvement teams can more effectively help process owners to implement continuous improvements and to select and prioritize larger projects. Executives also have easy access to real-time data to improve decision making, versus using reports that are compiled weekly or monthly in spreadsheets and presentations.
Measures also provide feedback to process workers so that they can evaluate their own performance against goals and take corrective action when events move outside acceptable boundaries or when targets are likely to be missed. IBM Business Process Manager and Business Monitor allow for event monitoring in real time, with automated alerts that are triggered by out-of-bounds conditions, to speed corrective action and reduce risk, cost, and the effect of the event itself.
Also ensure that process owners and workers know what to do when a process goes out of bounds, when an exception occurs, when backlog builds and flow is disrupted, or when they receive an alert. Exceptions can cause downstream ripples that can be expensive to repair after more significant damage is done (for example when oil pipeline leaks). A Lean culture is empowered to stop production to fix problems and to seek perfection always. The improved visibility into performance that is offered by dashboards and other tools, such as control charts, minimizes the chance that problems go undetected or remain hidden.
Figure 13 shows a simple control chart and special cause variation that can trigger a BPM-enabled alert.
Figure 13 Control chart and special cause variation that can trigger a BPM-enabled alert
upper control limit
upper warning limit
lower control limit
lower warning limit
3�
2�
Mean
2�
3�
Special-cause variation
Common-cause variation
The BPM Control Chart allows near real-time detection of statistically significant process deviations through alerts and dashboard gauges. Alerts allow process owners to take action to determine the root cause of special cause variation and regain control of process performance.
An out-of-boundsevent can triggerMonitor dashboardreporting andautomated alertsor rules-basedEscalation.
The value of Control Charts
28 Applying Lean, Six Sigma, BPM, and SOA to Drive Business Results
In their highly respected book, The Balanced Scorecard: Translating Strategy into Action Robert Kaplan and David Norton outline a strategic framework designed to link business strategy to a coherent set of performance measures. The framework includes leading and lagging indicators in four balanced categories or perspectives: financial, customer, internal/business process, and learning and growth.16
According to Kaplan and Norton, the balanced scorecard goes beyond traditional measures that are often used to control behavior or improve existing processes. Instead, it is used to clearly communicate strategy and align the organization (and its partners) in the short-term and long-term creation of value.17
To implement this approach, a company whose stated strategic objective is growth through innovation and market expansion would establish financial measures, such as the percentage of revenues from new channels, products, or geographical areas. The company would also identify related market share and customer acquisition measures (the customer segment perspective). The processes that are critical to meeting or exceeding the growth objectives are then identified (or designed if they do not exist), and linked measures are established (for example new product design and development cycle times).
Learning and growth measures might include employee productivity by channel, project delivery times for information systems, or IT backlog. The items that are measured might also include service reuse, which indicates speed of channel deployment or change capability. Individual business units would align their scorecards and look for leverage, opportunities, or synergies (for example, cross-selling through another business unit channel or sharing skilled IT resources, services, and investments).
The event data used to drive a balanced scorecard can be captured from applications, messages, and workflows, and then, can be correlated into strategic business dashboards by using IBM Business Monitor. Examples include revenue and orders from new products or channels (innovation), on-time delivery and problem resolution time (customer satisfaction, dissatisfaction, and retention), and process cycle time, cost, and exceptions (performance capacity and capability). Process monitoring can also simplify and reduce the costs of regulatory compliance audits and reporting.
Many companies are beginning to include agility (time to market) or the ability to differentiate themselves to customers through rapid change as a strategic objective. Using automated business rules to abstract complexity from application code and to drive change into processes is one way to achieve increased flexibility. Tying IBM Business Monitor KPIs to business rules provides insight into how well an organization is competitively using change to segment its customers, grow new channels, create right-time personalized offers, or respond quickly to new opportunities and threats.
Start with monitoring customer-facing processes and interactions. Use IBM Business Monitor to determine how the process is performing. As exceptions are identified, deploy BPM-enabled workflows to manage and track corrective action. Use this data and constraint data to then target and prioritize improvements. Eliminate the corrective action workflows as the process is brought under control.
Beginning with Lean
Several experts recommend beginning improvement efforts with Lean and a clear understanding of value and waste from the customer’s perspective. They advocate pulling in
16 Robert S. Kaplan and David P Norton, The Balanced Scorecard: Translating Strategy into Action (Harvard Business Review Press, 1996)
17 Ibid.
29
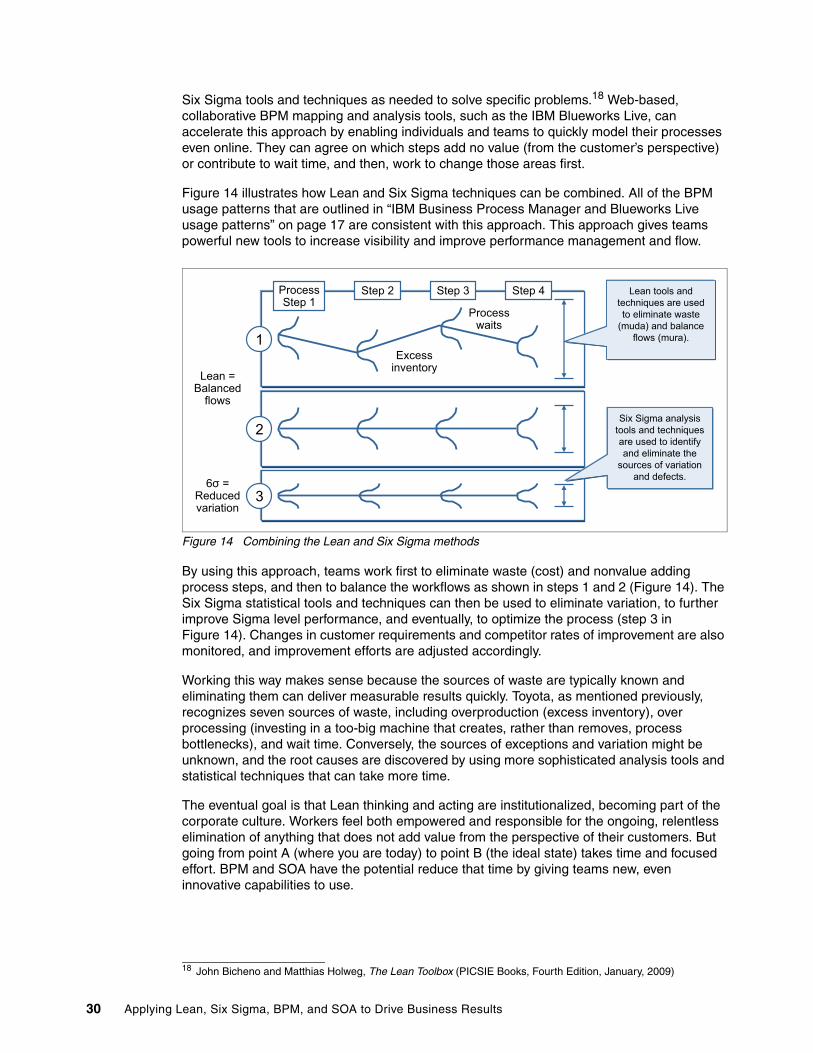
Six Sigma tools and techniques as needed to solve specific problems.18 Web-based, collaborative BPM mapping and analysis tools, such as the IBM Blueworks Live, can accelerate this approach by enabling individuals and teams to quickly model their processes even online. They can agree on which steps add no value (from the customer’s perspective) or contribute to wait time, and then, work to change those areas first.
Figure 14 illustrates how Lean and Six Sigma techniques can be combined. All of the BPM usage patterns that are outlined in “IBM Business Process Manager and Blueworks Live usage patterns” on page 17 are consistent with this approach. This approach gives teams powerful new tools to increase visibility and improve performance management and flow.
Figure 14 Combining the Lean and Six Sigma methods
By using this approach, teams work first to eliminate waste (cost) and nonvalue adding process steps, and then to balance the workflows as shown in steps 1 and 2 (Figure 14). The Six Sigma statistical tools and techniques can then be used to eliminate variation, to further improve Sigma level performance, and eventually, to optimize the process (step 3 in Figure 14). Changes in customer requirements and competitor rates of improvement are also monitored, and improvement efforts are adjusted accordingly.
Working this way makes sense because the sources of waste are typically known and eliminating them can deliver measurable results quickly. Toyota, as mentioned previously, recognizes seven sources of waste, including overproduction (excess inventory), over processing (investing in a too-big machine that creates, rather than removes, process bottlenecks), and wait time. Conversely, the sources of exceptions and variation might be unknown, and the root causes are discovered by using more sophisticated analysis tools and statistical techniques that can take more time.
The eventual goal is that Lean thinking and acting are institutionalized, becoming part of the corporate culture. Workers feel both empowered and responsible for the ongoing, relentless elimination of anything that does not add value from the perspective of their customers. But going from point A (where you are today) to point B (the ideal state) takes time and focused effort. BPM and SOA have the potential reduce that time by giving teams new, even innovative capabilities to use.
18 John Bicheno and Matthias Holweg, The Lean Toolbox (PICSIE Books, Fourth Edition, January, 2009)
Excessinventory
Processwaits
Lean =Balanced
flows
6� =Reducedvariation
ProcessStep 1
Step 2 Step 3 Step 4
1
2
3
Lean tools andtechniques are usedto eliminate waste
(muda) and balanceflows (mura).
Six Sigma analysistools and techniquesare used to identifyand eliminate the
sources of variationand defects.
30 Applying Lean, Six Sigma, BPM, and SOA to Drive Business Results
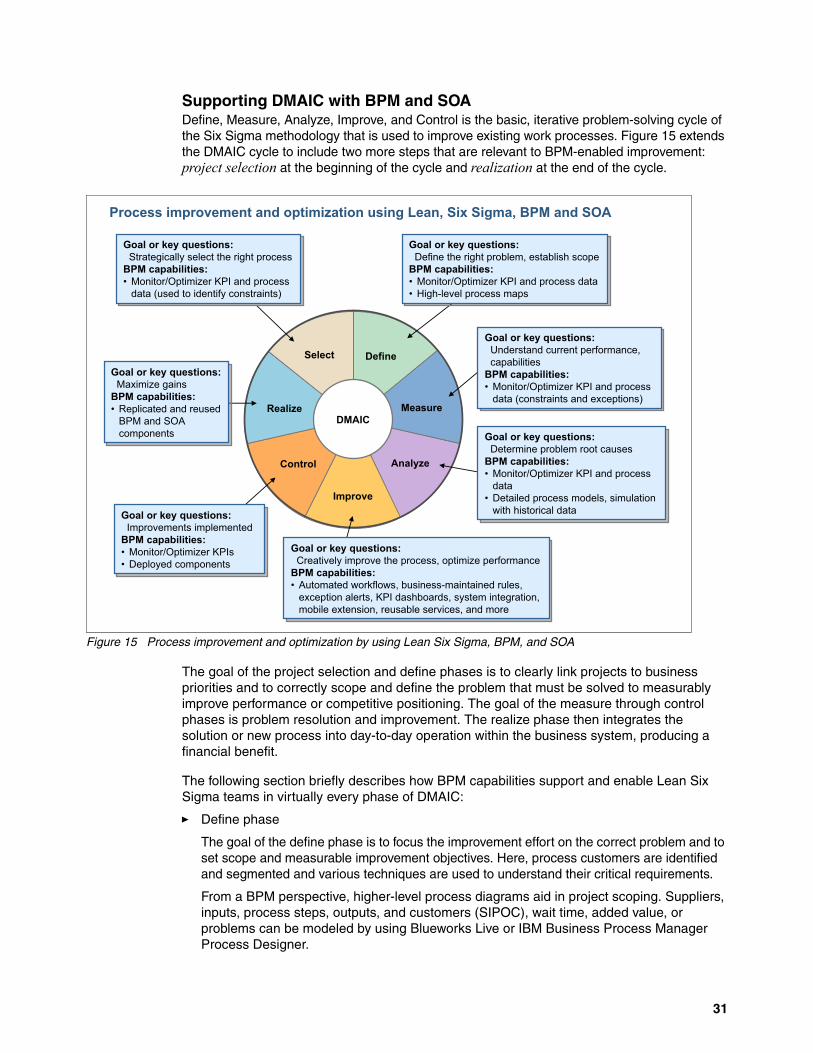
Supporting DMAIC with BPM and SOADefine, Measure, Analyze, Improve, and Control is the basic, iterative problem-solving cycle of the Six Sigma methodology that is used to improve existing work processes. Figure 15 extends the DMAIC cycle to include two more steps that are relevant to BPM-enabled improvement: project selection at the beginning of the cycle and realization at the end of the cycle.
Figure 15 Process improvement and optimization by using Lean Six Sigma, BPM, and SOA
The goal of the project selection and define phases is to clearly link projects to business priorities and to correctly scope and define the problem that must be solved to measurably improve performance or competitive positioning. The goal of the measure through control phases is problem resolution and improvement. The realize phase then integrates the solution or new process into day-to-day operation within the business system, producing a financial benefit.
The following section briefly describes how BPM capabilities support and enable Lean Six Sigma teams in virtually every phase of DMAIC:
� Define phase
The goal of the define phase is to focus the improvement effort on the correct problem and to set scope and measurable improvement objectives. Here, process customers are identified and segmented and various techniques are used to understand their critical requirements.
From a BPM perspective, higher-level process diagrams aid in project scoping. Suppliers, inputs, process steps, outputs, and customers (SIPOC), wait time, added value, or problems can be modeled by using Blueworks Live or IBM Business Process Manager Process Designer.
DMAIC
Goal or key questions:Define the right problem, establish scope
BPM capabilities:• Monitor/Optimizer KPI and process data• High-level process maps
Goal or key questions:Define the right problem, establish scope
BPM capabilities:• Monitor/Optimizer KPI and process data• High-level process maps
Goal or key questions:Define the right problem, establish scope
BPM capabilities:• Monitor/Optimizer KPI and process data• High-level process maps
Goal or key questions:Understand current performance,capabilities
BPM capabilities:• Monitor/Optimizer KPI and process
data (constraints and exceptions)
Goal or key questions:Understand current performance,capabilities
BPM capabilities:• Monitor/Optimizer KPI and process
data (constraints and exceptions)
Goal or key questions:Understand current performance,capabilities
BPM capabilities:• Monitor/Optimizer KPI and process
data (constraints and exceptions)
Goal or key questions:Determine problem root causes
BPM capabilities:• Monitor/Optimizer KPI and process
data• Detailed process models, simulation
with historical data
Goal or key questions:Determine problem root causes
BPM capabilities:• MMono itor/Optimizer KPI and process
data• Detailed process models, simulation
with historical data
Goal or key questions:Determine problem root causes
BPM capabilities:• Monitor/Optimizer KPI and process
data• Detailed process models, simulation
with historical dataGoal or key questions:
Improvements implementedBPM capabilities:• Monitor/Optimizer KPIs• Deployed components
Goal or key questionss::Improvements implemented
BPM capabilities:• Monitor/Optimizer KPIs• Deployed components
Goal or key questions:Improvements implemented
BPM capabilities:• Monitor/Optimizer KPIs• Deployed components
Goal or key questions:Maximize gains
BPM capabilities:• Replicated and reused
BPM and SOAcomponents
Goal or key questions:Maximize gains
BPM capabilities:ies:• Replicated and reused
BPM and SOAcomponents
Goal or key questions:Maximize gains
BPM capabilities:• Replicated and reused
BPM and SOAcomponents
Goal or key questions:Strategically select the right process
BPM capabilities:• Monitor/Optimizer KPI and process
data (used to identify constraints)
Goal or key questions:Strategically select the right process
BPM capabilities:• Monitor/Optimizer KPI and process
data (used to identify constraints)
Goal or key questions:Strategically select the right process
BPM capabilities:• Monitor/Optimizer KPI and process
data (used to identify constraints)
Goal or key questions:Creatively improve the process, optimize performance
BPM capabilities:• Automated workflows, business-maintained rules,
exception alerts, KPI dashboards, system integration,mobile extension, reusable services, and more
Goal or key qey uestions:Creatively improve the procly ess, optimize performance
BPM capabilpa ities:• Automated workflows, business-maintained rules,
exception alerts, KPI dashboards, system integration,mobile extension, reusable services, and more
Goal or key questions:Creatively improve the process, optimize performance
BPM capabilities:• Automated workflows, business-maintained rules,
exception alerts, KPI dashboards, system integration,mobile extension, reusable services, and more
Process improvement and optimization using Lean, Six Sigma, BPM and SOA
DefineSelect
MeasureRealize
Control
Improve
Analyze
31
KPI dashboard data provides visibility and insight into current process performance and constraints. It also serves as the basis for initial comparison or best-in-class benchmarking, which helps bring clarity to the problem to be solved. This initial set of data is used during the define phase to build the high-level business case, opportunity statement, and goal statement.
� Measure phase
The goal of the measure phase is to answer the question: How are we performing today? KPIs and knowledge of process variation are critical to this determination. BPM dashboards provide access to data in near real time. Process or activity durations, delays, escalations, or instances of a specific process that is being called or run can be tracked and used to better understand current performance and capability.
Monitor dashboards work by capturing transaction or process-related events and displaying them individually or in aggregate. Results can be represented as gauges or line graphs that include upper and lower limits (as in a control chart). Exceptions that are tracked by Process Manager can be used in more detailed Pareto analysis. Event data can be mined to uncover more patterns and relationships. Ready access to monitored data accelerates this phase of the improvement cycle.
� Analyze phase
The goal of the analyze phase is to determine what is wrong and what is causing unwanted process variation and exceptions. BPM capabilities aid in the analysis of process wait time, added value or non added value, problems, and risk. Process simulation using historical data is also useful in root cause analysis during this phase, providing insight into the impact of staffing, rules, and alternative paths through the process.
If exception paths are fully mapped, the frequency, time, and cost of corrective actions can also be determined (effectively a weighted Pareto analysis). Process exceptions and performance data from BPM dashboards and simulations can be exported into various statistical analysis tools for further evaluation.
� Improve phase
During the improve phase, solution alternatives are evaluated to determine ROI potential. The best alternative is selected and piloted, and an implementation plan is designed. BPM plays a major role in this phase both in the evaluation of the alternatives and in the design of the solution itself.
Multiple future state models can be designed, evaluated, and compared from different perspectives, including their impact on added value, wait time, risk, reuse, and regulatory controls. Throughput, cycle time, and cost/benefit can be calculated with the help of simulation, without having to run risky or costly experiments in the production environment. Potential bottlenecks and constraints are clearly visible during simulation.
Proposed improvements and process models can be shared with process workers by using a browser to gather feedback before coding and piloting, reducing risk and cost and gaining early buy-in.
BPM and SOA technology gives improvement teams creative new options that might include the following examples:
– Automated workflows and forms routing with built-in escalations and exception alerts if problems occur
– System integration to automatically pass data from one participating application to another, eliminating retyping and any associated errors
– User-maintainable business rules that automate decisions, increase straight-through processing, and drive workflow routing
32 Applying Lean, Six Sigma, BPM, and SOA to Drive Business Results
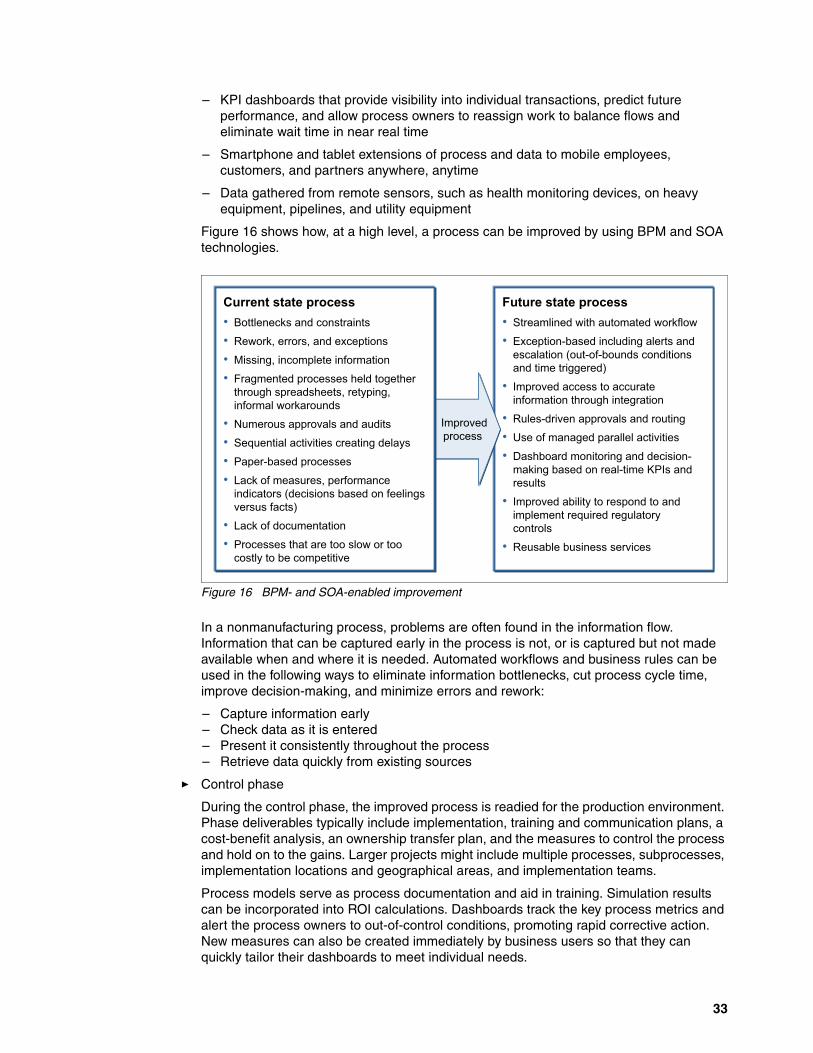
– KPI dashboards that provide visibility into individual transactions, predict future performance, and allow process owners to reassign work to balance flows and eliminate wait time in near real time
– Smartphone and tablet extensions of process and data to mobile employees, customers, and partners anywhere, anytime
– Data gathered from remote sensors, such as health monitoring devices, on heavy equipment, pipelines, and utility equipment
Figure 16 shows how, at a high level, a process can be improved by using BPM and SOA technologies.
Figure 16 BPM- and SOA-enabled improvement
In a nonmanufacturing process, problems are often found in the information flow. Information that can be captured early in the process is not, or is captured but not made available when and where it is needed. Automated workflows and business rules can be used in the following ways to eliminate information bottlenecks, cut process cycle time, improve decision-making, and minimize errors and rework:
– Capture information early– Check data as it is entered– Present it consistently throughout the process– Retrieve data quickly from existing sources
� Control phase
During the control phase, the improved process is readied for the production environment. Phase deliverables typically include implementation, training and communication plans, a cost-benefit analysis, an ownership transfer plan, and the measures to control the process and hold on to the gains. Larger projects might include multiple processes, subprocesses, implementation locations and geographical areas, and implementation teams.
Process models serve as process documentation and aid in training. Simulation results can be incorporated into ROI calculations. Dashboards track the key process metrics and alert the process owners to out-of-control conditions, promoting rapid corrective action. New measures can also be created immediately by business users so that they can quickly tailor their dashboards to meet individual needs.
Future state process• Streamlined with automated workflow
• Exception-based including alerts and escalation (out-of-bounds conditions and time triggered)
• Improved access to accurate information through integration
• Rules-driven approvals and routing
• Use of managed parallel activities
• Dashboard monitoring and decision- making based on real-time KPIs and results
• Improved ability to respond to and implement required regulatory controls
• Reusable business services
Improvedprocess
Current state process• Bottlenecks and constraints
• Rework, errors, and exceptions
• Missing, incomplete information
• Fragmented processes held together through spreadsheets, retyping, informal workarounds
• Numerous approvals and audits
• Sequential activities creating delays
• Paper-based processes
• Lack of measures, performance indicators (decisions based on feelings versus facts)
• Lack of documentation
• Processes that are too slow or too costly to be competitive
33
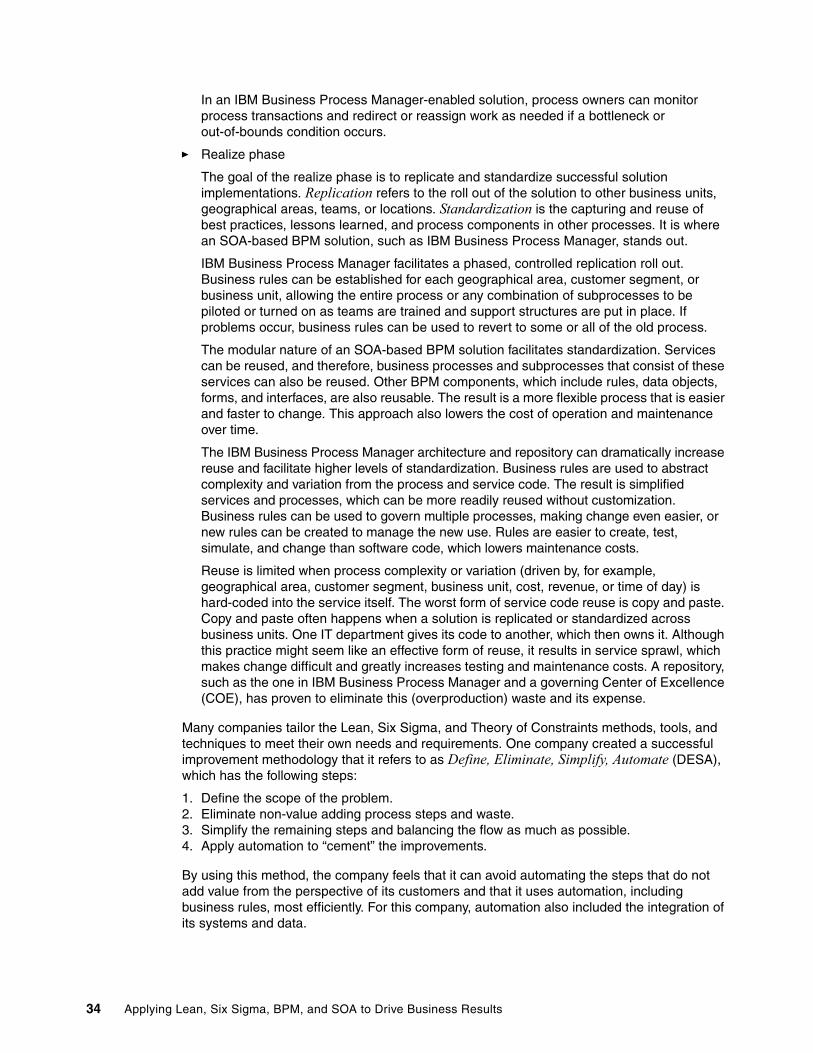
In an IBM Business Process Manager-enabled solution, process owners can monitor process transactions and redirect or reassign work as needed if a bottleneck or out-of-bounds condition occurs.
� Realize phase
The goal of the realize phase is to replicate and standardize successful solution implementations. Replication refers to the roll out of the solution to other business units, geographical areas, teams, or locations. Standardization is the capturing and reuse of best practices, lessons learned, and process components in other processes. It is where an SOA-based BPM solution, such as IBM Business Process Manager, stands out.
IBM Business Process Manager facilitates a phased, controlled replication roll out. Business rules can be established for each geographical area, customer segment, or business unit, allowing the entire process or any combination of subprocesses to be piloted or turned on as teams are trained and support structures are put in place. If problems occur, business rules can be used to revert to some or all of the old process.
The modular nature of an SOA-based BPM solution facilitates standardization. Services can be reused, and therefore, business processes and subprocesses that consist of these services can also be reused. Other BPM components, which include rules, data objects, forms, and interfaces, are also reusable. The result is a more flexible process that is easier and faster to change. This approach also lowers the cost of operation and maintenance over time.
The IBM Business Process Manager architecture and repository can dramatically increase reuse and facilitate higher levels of standardization. Business rules are used to abstract complexity and variation from the process and service code. The result is simplified services and processes, which can be more readily reused without customization. Business rules can be used to govern multiple processes, making change even easier, or new rules can be created to manage the new use. Rules are easier to create, test, simulate, and change than software code, which lowers maintenance costs.
Reuse is limited when process complexity or variation (driven by, for example, geographical area, customer segment, business unit, cost, revenue, or time of day) is hard-coded into the service itself. The worst form of service code reuse is copy and paste. Copy and paste often happens when a solution is replicated or standardized across business units. One IT department gives its code to another, which then owns it. Although this practice might seem like an effective form of reuse, it results in service sprawl, which makes change difficult and greatly increases testing and maintenance costs. A repository, such as the one in IBM Business Process Manager and a governing Center of Excellence (COE), has proven to eliminate this (overproduction) waste and its expense.
Many companies tailor the Lean, Six Sigma, and Theory of Constraints methods, tools, and techniques to meet their own needs and requirements. One company created a successful improvement methodology that it refers to as Define, Eliminate, Simplify, Automate (DESA), which has the following steps:
1. Define the scope of the problem.2. Eliminate non-value adding process steps and waste.3. Simplify the remaining steps and balancing the flow as much as possible.4. Apply automation to “cement” the improvements.
By using this method, the company feels that it can avoid automating the steps that do not add value from the perspective of its customers and that it uses automation, including business rules, most efficiently. For this company, automation also included the integration of its systems and data.
34 Applying Lean, Six Sigma, BPM, and SOA to Drive Business Results
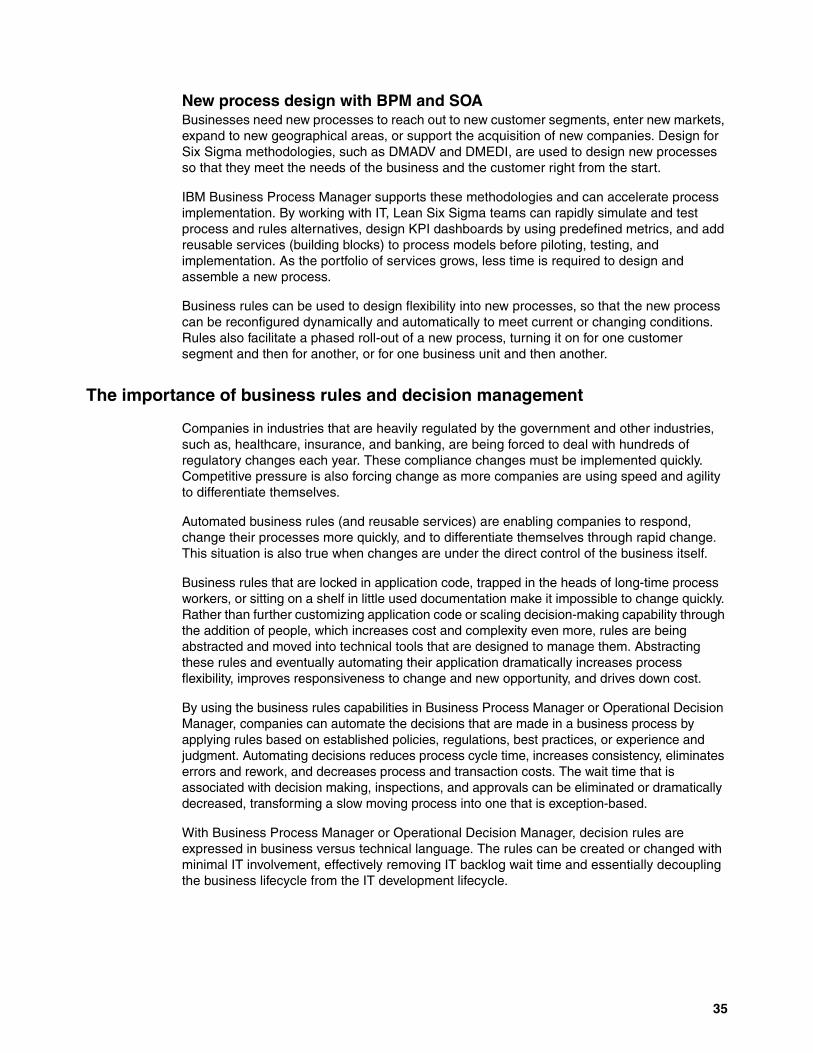
New process design with BPM and SOABusinesses need new processes to reach out to new customer segments, enter new markets, expand to new geographical areas, or support the acquisition of new companies. Design for Six Sigma methodologies, such as DMADV and DMEDI, are used to design new processes so that they meet the needs of the business and the customer right from the start.
IBM Business Process Manager supports these methodologies and can accelerate process implementation. By working with IT, Lean Six Sigma teams can rapidly simulate and test process and rules alternatives, design KPI dashboards by using predefined metrics, and add reusable services (building blocks) to process models before piloting, testing, and implementation. As the portfolio of services grows, less time is required to design and assemble a new process.
Business rules can be used to design flexibility into new processes, so that the new process can be reconfigured dynamically and automatically to meet current or changing conditions. Rules also facilitate a phased roll-out of a new process, turning it on for one customer segment and then for another, or for one business unit and then another.
The importance of business rules and decision management
Companies in industries that are heavily regulated by the government and other industries, such as, healthcare, insurance, and banking, are being forced to deal with hundreds of regulatory changes each year. These compliance changes must be implemented quickly. Competitive pressure is also forcing change as more companies are using speed and agility to differentiate themselves.
Automated business rules (and reusable services) are enabling companies to respond, change their processes more quickly, and to differentiate themselves through rapid change. This situation is also true when changes are under the direct control of the business itself.
Business rules that are locked in application code, trapped in the heads of long-time process workers, or sitting on a shelf in little used documentation make it impossible to change quickly. Rather than further customizing application code or scaling decision-making capability through the addition of people, which increases cost and complexity even more, rules are being abstracted and moved into technical tools that are designed to manage them. Abstracting these rules and eventually automating their application dramatically increases process flexibility, improves responsiveness to change and new opportunity, and drives down cost.
By using the business rules capabilities in Business Process Manager or Operational Decision Manager, companies can automate the decisions that are made in a business process by applying rules based on established policies, regulations, best practices, or experience and judgment. Automating decisions reduces process cycle time, increases consistency, eliminates errors and rework, and decreases process and transaction costs. The wait time that is associated with decision making, inspections, and approvals can be eliminated or dramatically decreased, transforming a slow moving process into one that is exception-based.
With Business Process Manager or Operational Decision Manager, decision rules are expressed in business versus technical language. The rules can be created or changed with minimal IT involvement, effectively removing IT backlog wait time and essentially decoupling the business lifecycle from the IT development lifecycle.
35
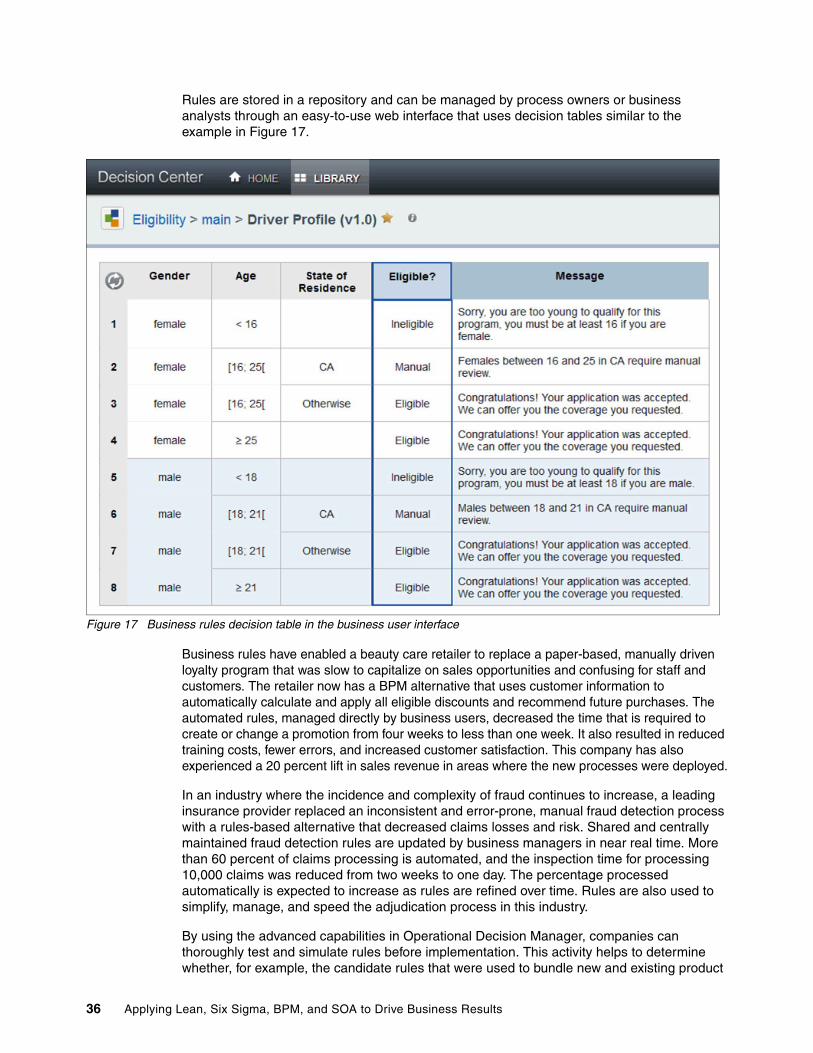
Rules are stored in a repository and can be managed by process owners or business analysts through an easy-to-use web interface that uses decision tables similar to the example in Figure 17.
Figure 17 Business rules decision table in the business user interface
Business rules have enabled a beauty care retailer to replace a paper-based, manually driven loyalty program that was slow to capitalize on sales opportunities and confusing for staff and customers. The retailer now has a BPM alternative that uses customer information to automatically calculate and apply all eligible discounts and recommend future purchases. The automated rules, managed directly by business users, decreased the time that is required to create or change a promotion from four weeks to less than one week. It also resulted in reduced training costs, fewer errors, and increased customer satisfaction. This company has also experienced a 20 percent lift in sales revenue in areas where the new processes were deployed.
In an industry where the incidence and complexity of fraud continues to increase, a leading insurance provider replaced an inconsistent and error-prone, manual fraud detection process with a rules-based alternative that decreased claims losses and risk. Shared and centrally maintained fraud detection rules are updated by business managers in near real time. More than 60 percent of claims processing is automated, and the inspection time for processing 10,000 claims was reduced from two weeks to one day. The percentage processed automatically is expected to increase as rules are refined over time. Rules are also used to simplify, manage, and speed the adjudication process in this industry.
By using the advanced capabilities in Operational Decision Manager, companies can thoroughly test and simulate rules before implementation. This activity helps to determine whether, for example, the candidate rules that were used to bundle new and existing product
36 Applying Lean, Six Sigma, BPM, and SOA to Drive Business Results
offers effectively match the profile of discrete customer segments. Abstracting rules from application code and placing this analysis and simulation capability on sales and marketing teams increases their effectiveness, speeds to market, and significantly reduces risk. Risk is reduced because, by using this approach, they can test the effect of new product combinations before the products are started. This capability is successfully being used in banking, telecommunications, and other highly competitive and regulated industries.
Business rules can dramatically increase built-in process flexibility while placing control of changes in the business. Consider the following high-level rules-related practices:
� Straight-through processing is a term used to describe rules-based automation and transaction flow. When improving a process, look to increase the amount of straight-through processing to reduce the costs of manual handling and average cycle time. Also, establish KPIs for decision making so that the quality of the decisions and their frequency (or infrequency) can be monitored in a dashboard. Use this data to fine-tune performance and increase straight-through processing by adjusting the rules.
� Look for opportunities to drive future change (agility) into processes with business rules. Teams that think about how a process might be changed to account for variation that is driven by the following factors tend to build flexibility and competitive differentiation into their processes:
– New customer segments– Geographical differences– Natural events (such as storms or floods)– New regulations– New products, services, and channels
As team look at processes, train them to ask: How can we use change strategically to benefit both our business and our customers?
� Include a “rules steward” on improvement teams. One IBM customer, a major insurance provider, assigns a three-person core team to its improvement and design projects:
– A black belt facilitator– A process designer from IT– A rules steward from IT
The steward (a designation carefully chosen) looks at each step of the process to determine which rules impact it and how it might be simplified or automated. The rules steward is responsible for identifying, capturing, and ultimately caring for the rules that affect the processes that are targeted for improvement and the rules across all projects. This company discovered by accident that an individual with a rules background looked at things from a different, nontraditional perspective that enabled higher levels of flexibility, innovation, and reuse.
For more information about business rules and technical practices, see the IBM Redbooks publication, Making Better Decisions Using IBM WebSphere Operational Decision Management, REDP-4836.
Illustrating improvement with Blueworks Live and IBM Business Process Manager
The unique capabilities Blueworks Live and IBM Business Process Manager Optimizer have proven to deliver significant value during analysis, design, implementation, and ongoing improvement.
The IBM Blueworks Live is a secure, cloud-based application that enables improvement teams, subject matter experts, and process owners to quickly and collaboratively map and
37
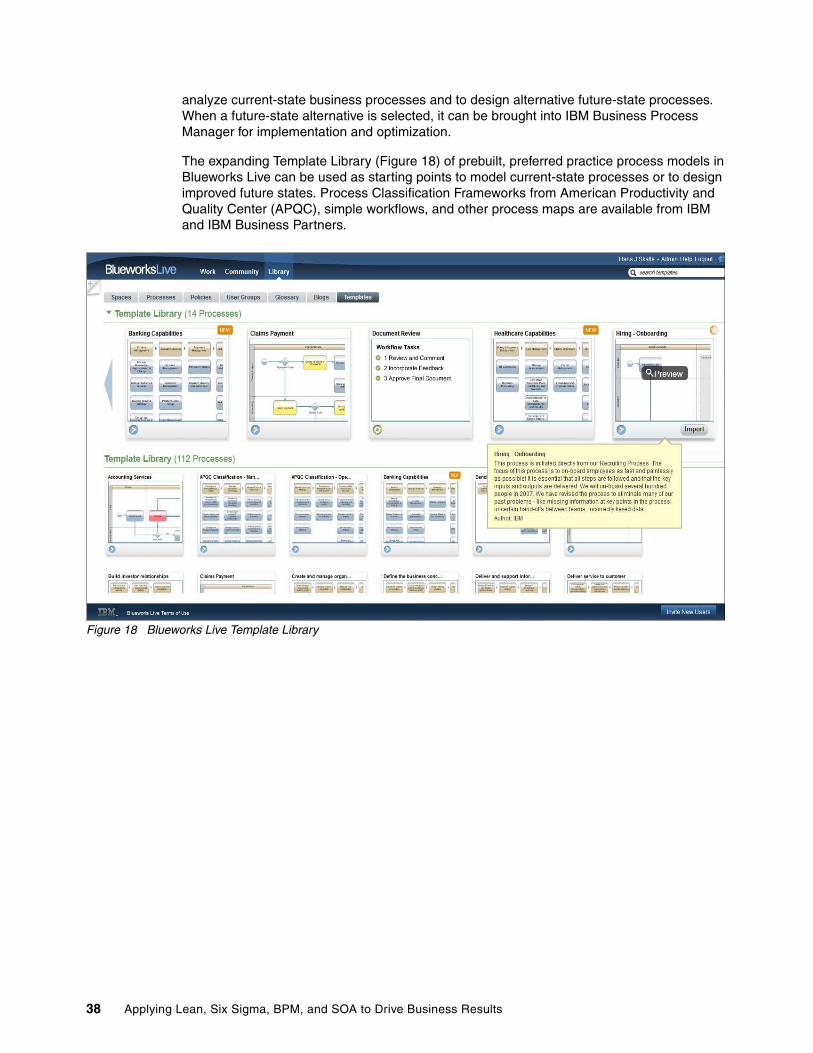
analyze current-state business processes and to design alternative future-state processes. When a future-state alternative is selected, it can be brought into IBM Business Process Manager for implementation and optimization.
The expanding Template Library (Figure 18) of prebuilt, preferred practice process models in Blueworks Live can be used as starting points to model current-state processes or to design improved future states. Process Classification Frameworks from American Productivity and Quality Center (APQC), simple workflows, and other process maps are available from IBM and IBM Business Partners.
Figure 18 Blueworks Live Template Library
38 Applying Lean, Six Sigma, BPM, and SOA to Drive Business Results
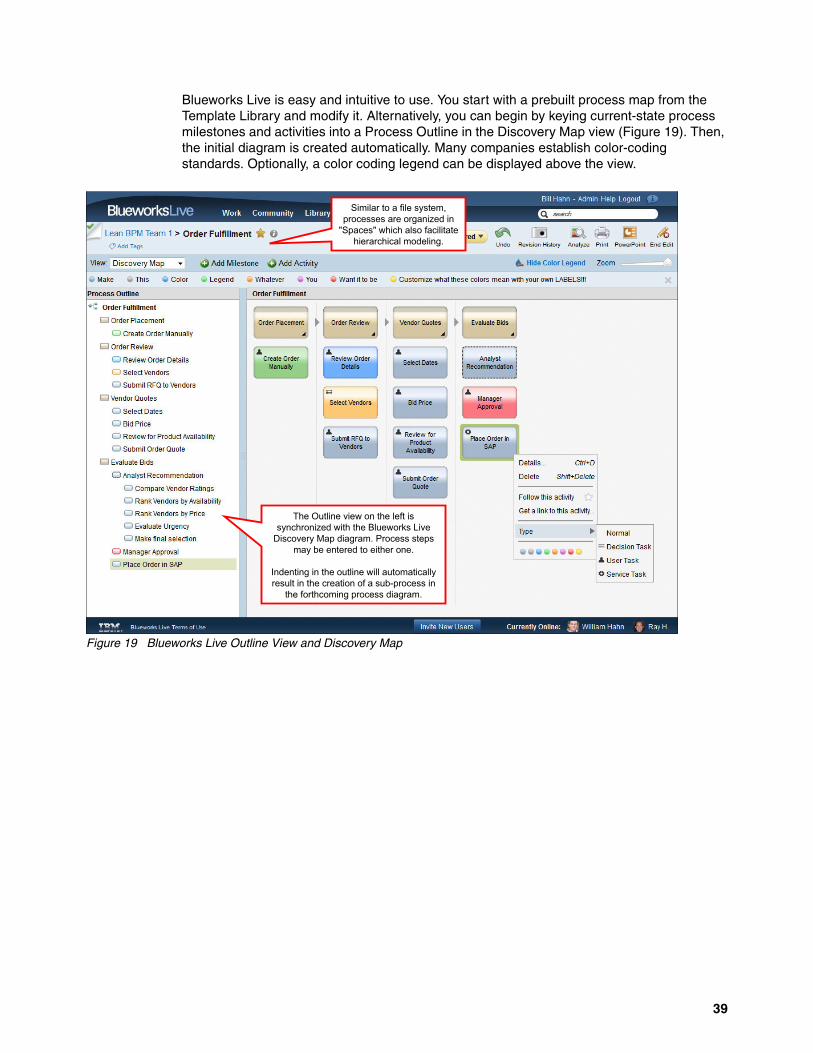
Blueworks Live is easy and intuitive to use. You start with a prebuilt process map from the Template Library and modify it. Alternatively, you can begin by keying current-state process milestones and activities into a Process Outline in the Discovery Map view (Figure 19). Then, the initial diagram is created automatically. Many companies establish color-coding standards. Optionally, a color coding legend can be displayed above the view.
Figure 19 Blueworks Live Outline View and Discovery Map
Similar to a file system, processes are organized in
"Spaces" which also facilitate hierarchical modeling.
The Outline view on the left is synchronized with the Blueworks Live
Discovery Map diagram. Process steps may be entered to either one.
Indenting in the outline will automatically result in the creation of a sub-process in
the forthcoming process diagram.
39
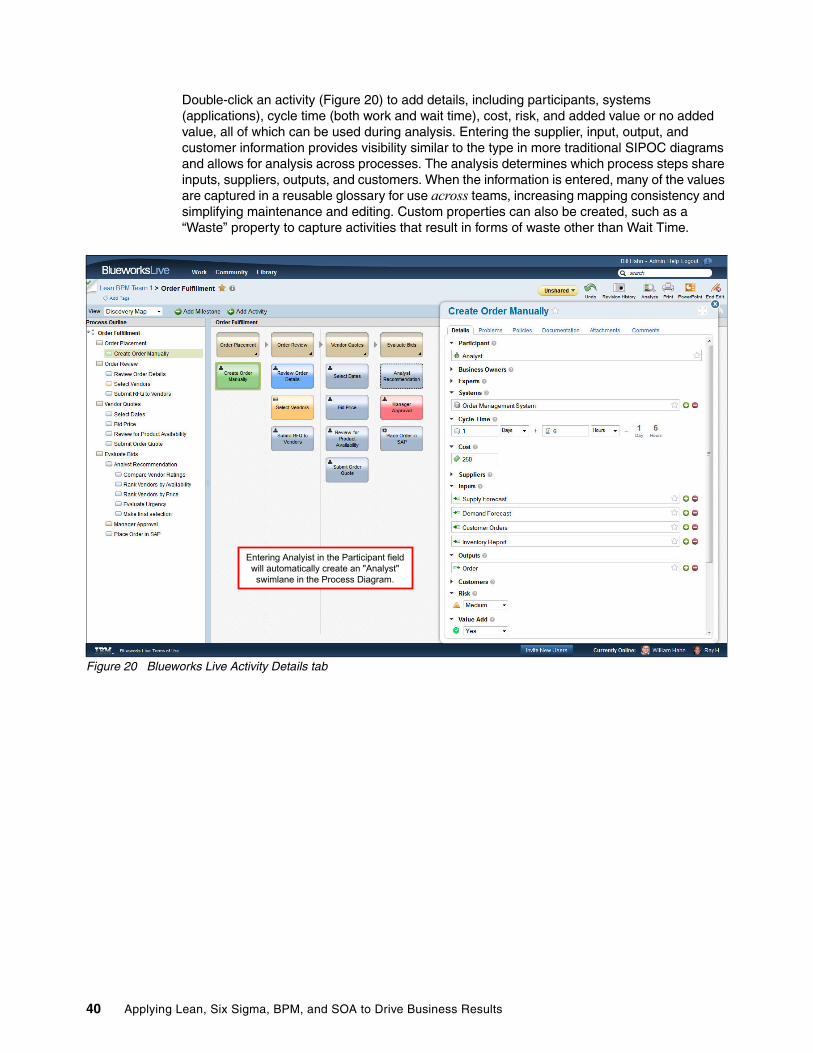
Double-click an activity (Figure 20) to add details, including participants, systems (applications), cycle time (both work and wait time), cost, risk, and added value or no added value, all of which can be used during analysis. Entering the supplier, input, output, and customer information provides visibility similar to the type in more traditional SIPOC diagrams and allows for analysis across processes. The analysis determines which process steps share inputs, suppliers, outputs, and customers. When the information is entered, many of the values are captured in a reusable glossary for use across teams, increasing mapping consistency and simplifying maintenance and editing. Custom properties can also be created, such as a “Waste” property to capture activities that result in forms of waste other than Wait Time.
Figure 20 Blueworks Live Activity Details tab
Entering Analyist in the Participant field will automatically create an "Analyst" swimlane in the Process Diagram.
40 Applying Lean, Six Sigma, BPM, and SOA to Drive Business Results
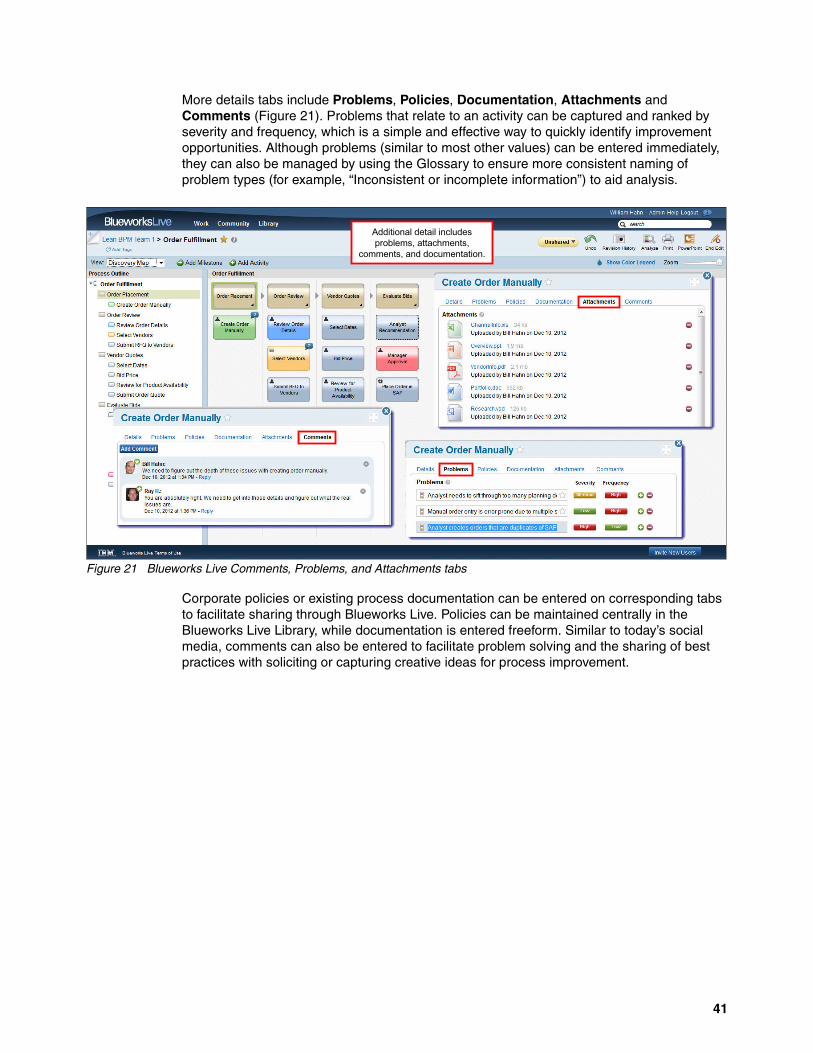
More details tabs include Problems, Policies, Documentation, Attachments and Comments (Figure 21). Problems that relate to an activity can be captured and ranked by severity and frequency, which is a simple and effective way to quickly identify improvement opportunities. Although problems (similar to most other values) can be entered immediately, they can also be managed by using the Glossary to ensure more consistent naming of problem types (for example, “Inconsistent or incomplete information”) to aid analysis.
Figure 21 Blueworks Live Comments, Problems, and Attachments tabs
Corporate policies or existing process documentation can be entered on corresponding tabs to facilitate sharing through Blueworks Live. Policies can be maintained centrally in the Blueworks Live Library, while documentation is entered freeform. Similar to today’s social media, comments can also be entered to facilitate problem solving and the sharing of best practices with soliciting or capturing creative ideas for process improvement.
Additional detail includes problems, attachments,
comments, and documentation.
41
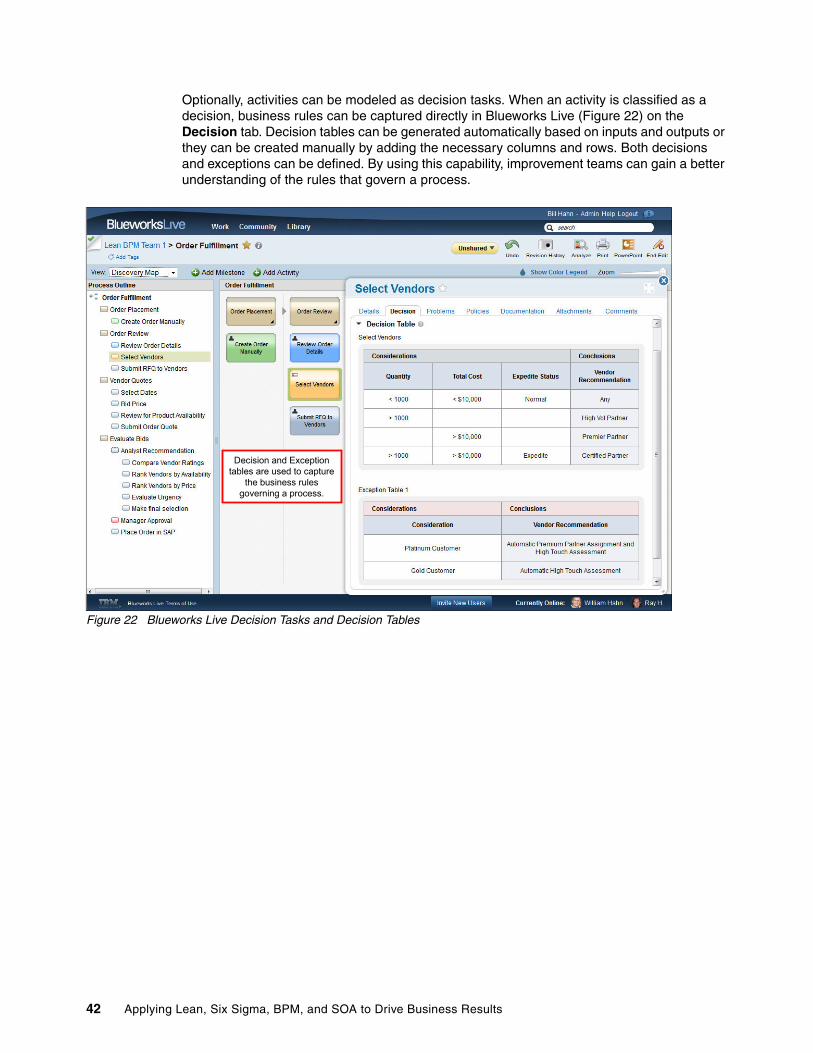
Optionally, activities can be modeled as decision tasks. When an activity is classified as a decision, business rules can be captured directly in Blueworks Live (Figure 22) on the Decision tab. Decision tables can be generated automatically based on inputs and outputs or they can be created manually by adding the necessary columns and rows. Both decisions and exceptions can be defined. By using this capability, improvement teams can gain a better understanding of the rules that govern a process.
Figure 22 Blueworks Live Decision Tasks and Decision Tables
Decision and Exception tables are used to capture
the business rules governing a process.
42 Applying Lean, Six Sigma, BPM, and SOA to Drive Business Results
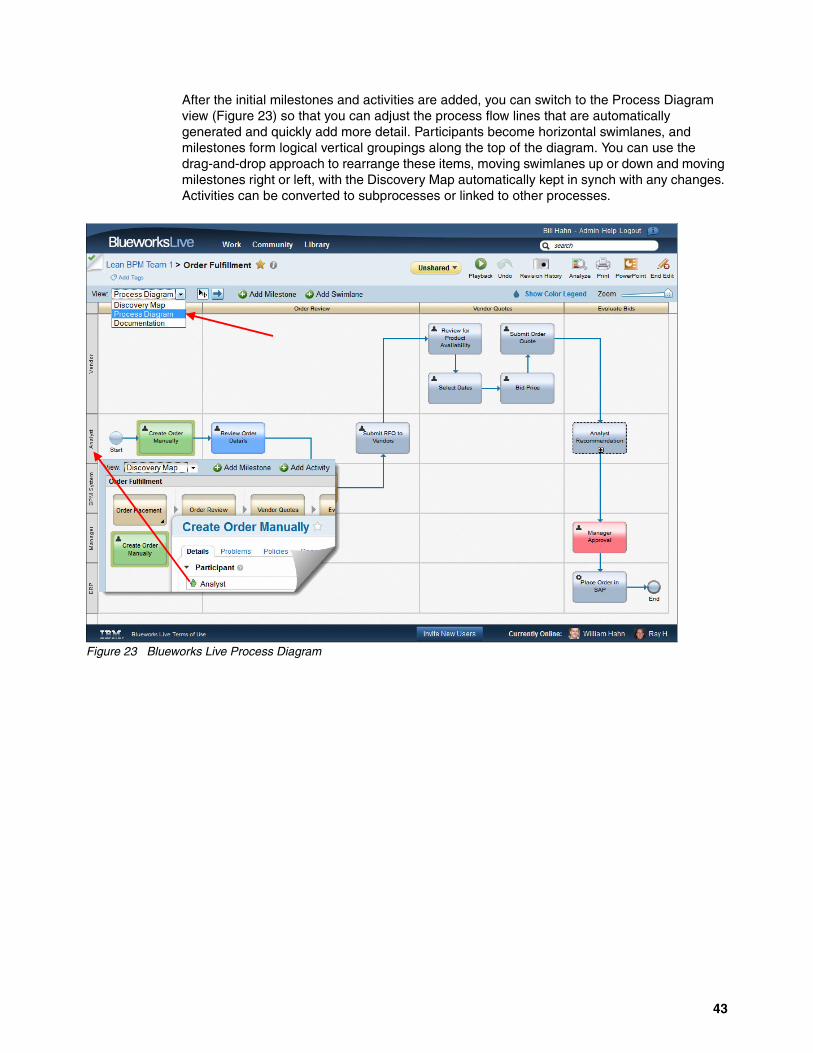
After the initial milestones and activities are added, you can switch to the Process Diagram view (Figure 23) so that you can adjust the process flow lines that are automatically generated and quickly add more detail. Participants become horizontal swimlanes, and milestones form logical vertical groupings along the top of the diagram. You can use the drag-and-drop approach to rearrange these items, moving swimlanes up or down and moving milestones right or left, with the Discovery Map automatically kept in synch with any changes. Activities can be converted to subprocesses or linked to other processes.
Figure 23 Blueworks Live Process Diagram
43
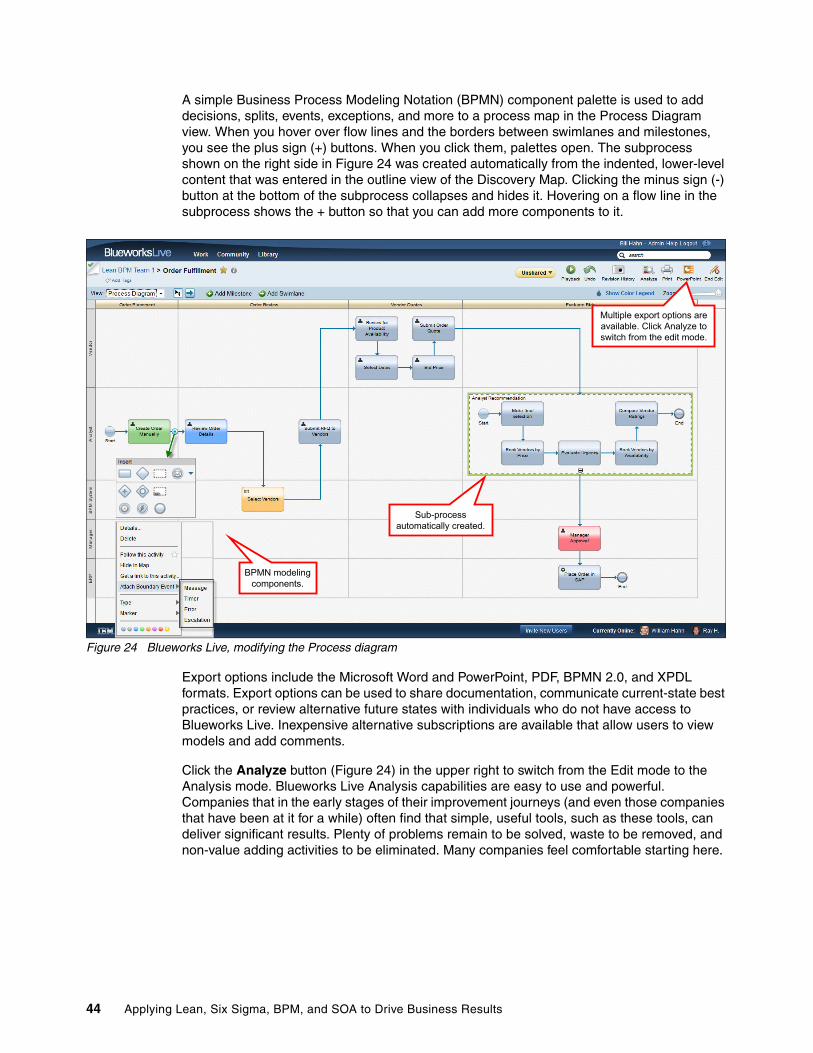
A simple Business Process Modeling Notation (BPMN) component palette is used to add decisions, splits, events, exceptions, and more to a process map in the Process Diagram view. When you hover over flow lines and the borders between swimlanes and milestones, you see the plus sign (+) buttons. When you click them, palettes open. The subprocess shown on the right side in Figure 24 was created automatically from the indented, lower-level content that was entered in the outline view of the Discovery Map. Clicking the minus sign (-) button at the bottom of the subprocess collapses and hides it. Hovering on a flow line in the subprocess shows the + button so that you can add more components to it.
Figure 24 Blueworks Live, modifying the Process diagram
Export options include the Microsoft Word and PowerPoint, PDF, BPMN 2.0, and XPDL formats. Export options can be used to share documentation, communicate current-state best practices, or review alternative future states with individuals who do not have access to Blueworks Live. Inexpensive alternative subscriptions are available that allow users to view models and add comments.
Click the Analyze button (Figure 24) in the upper right to switch from the Edit mode to the Analysis mode. Blueworks Live Analysis capabilities are easy to use and powerful. Companies that in the early stages of their improvement journeys (and even those companies that have been at it for a while) often find that simple, useful tools, such as these tools, can deliver significant results. Plenty of problems remain to be solved, waste to be removed, and non-value adding activities to be eliminated. Many companies feel comfortable starting here.
Multiple export options are available. Click Analyze to switch from the edit mode.
Sub-process automatically created.
BPMN modelingcomponents.
44 Applying Lean, Six Sigma, BPM, and SOA to Drive Business Results
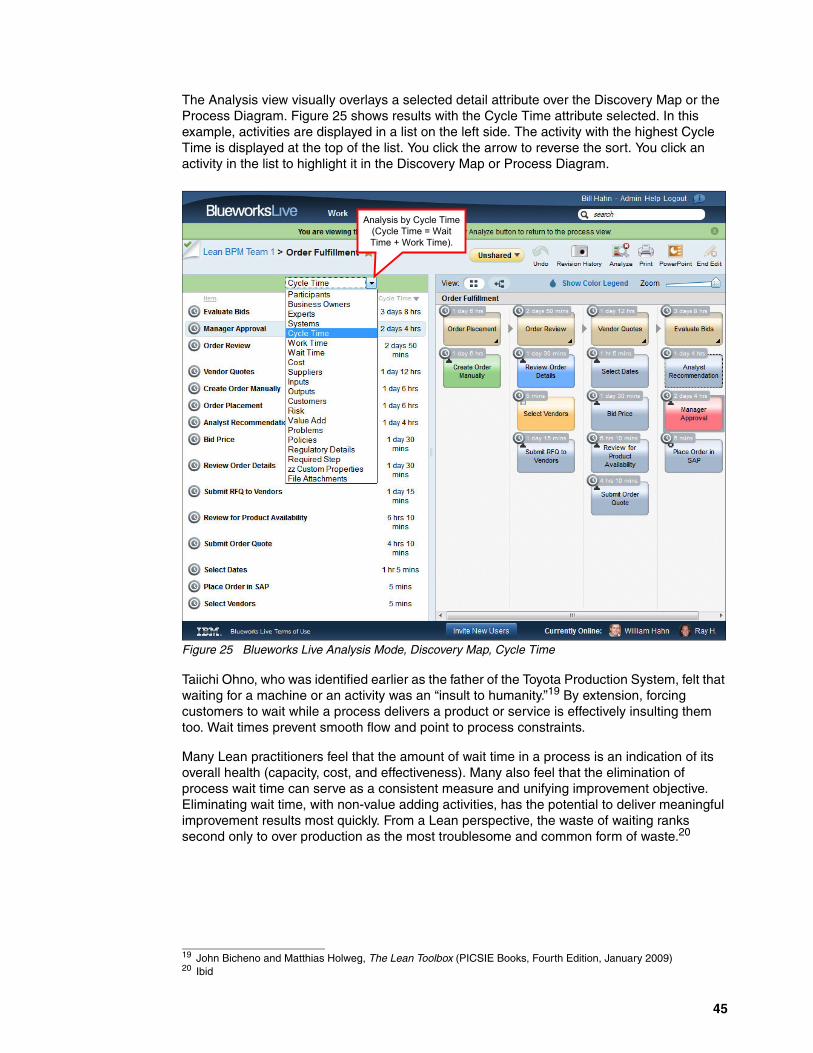
The Analysis view visually overlays a selected detail attribute over the Discovery Map or the Process Diagram. Figure 25 shows results with the Cycle Time attribute selected. In this example, activities are displayed in a list on the left side. The activity with the highest Cycle Time is displayed at the top of the list. You click the arrow to reverse the sort. You click an activity in the list to highlight it in the Discovery Map or Process Diagram.
Figure 25 Blueworks Live Analysis Mode, Discovery Map, Cycle Time
Taiichi Ohno, who was identified earlier as the father of the Toyota Production System, felt that waiting for a machine or an activity was an “insult to humanity.”19 By extension, forcing customers to wait while a process delivers a product or service is effectively insulting them too. Wait times prevent smooth flow and point to process constraints.
Many Lean practitioners feel that the amount of wait time in a process is an indication of its overall health (capacity, cost, and effectiveness). Many also feel that the elimination of process wait time can serve as a consistent measure and unifying improvement objective. Eliminating wait time, with non-value adding activities, has the potential to deliver meaningful improvement results most quickly. From a Lean perspective, the waste of waiting ranks second only to over production as the most troublesome and common form of waste.20
19 John Bicheno and Matthias Holweg, The Lean Toolbox (PICSIE Books, Fourth Edition, January 2009)20 Ibid
Analysis by Cycle Time (Cycle Time = Wait Time + Work Time).
45
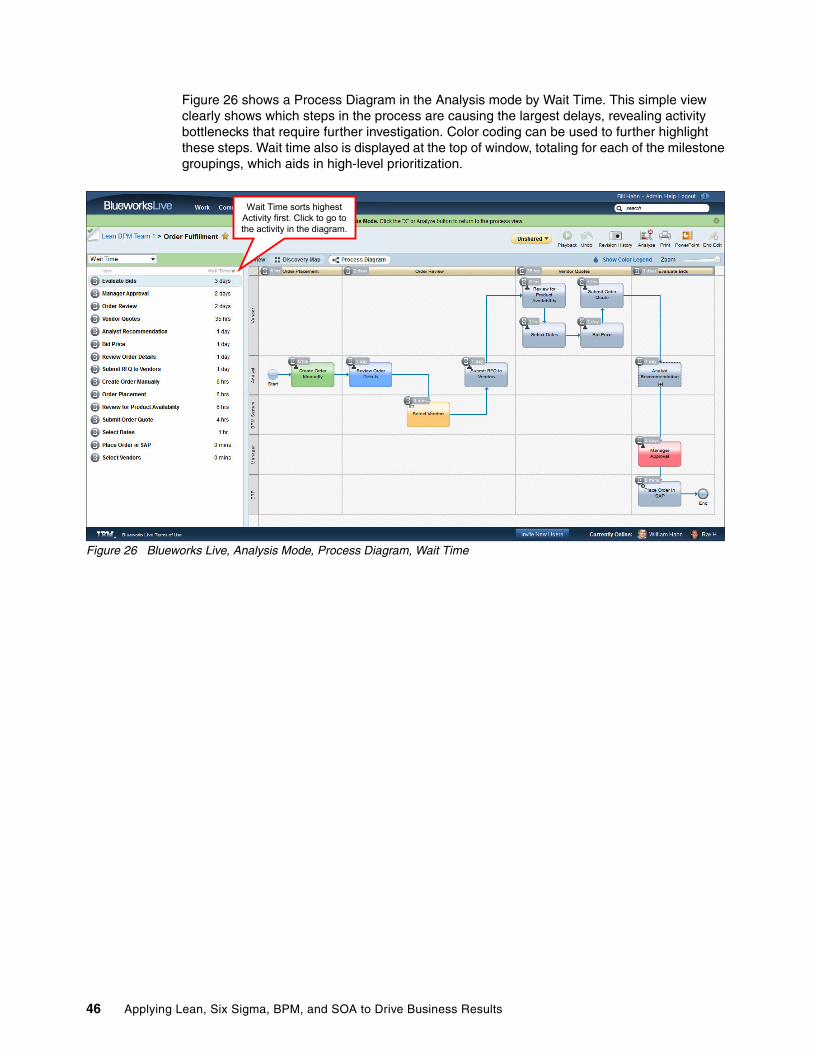
Figure 26 shows a Process Diagram in the Analysis mode by Wait Time. This simple view clearly shows which steps in the process are causing the largest delays, revealing activity bottlenecks that require further investigation. Color coding can be used to further highlight these steps. Wait time also is displayed at the top of window, totaling for each of the milestone groupings, which aids in high-level prioritization.
Figure 26 Blueworks Live, Analysis Mode, Process Diagram, Wait Time
Wait Time sorts highest Activity first. Click to go to the activity in the diagram.
46 Applying Lean, Six Sigma, BPM, and SOA to Drive Business Results
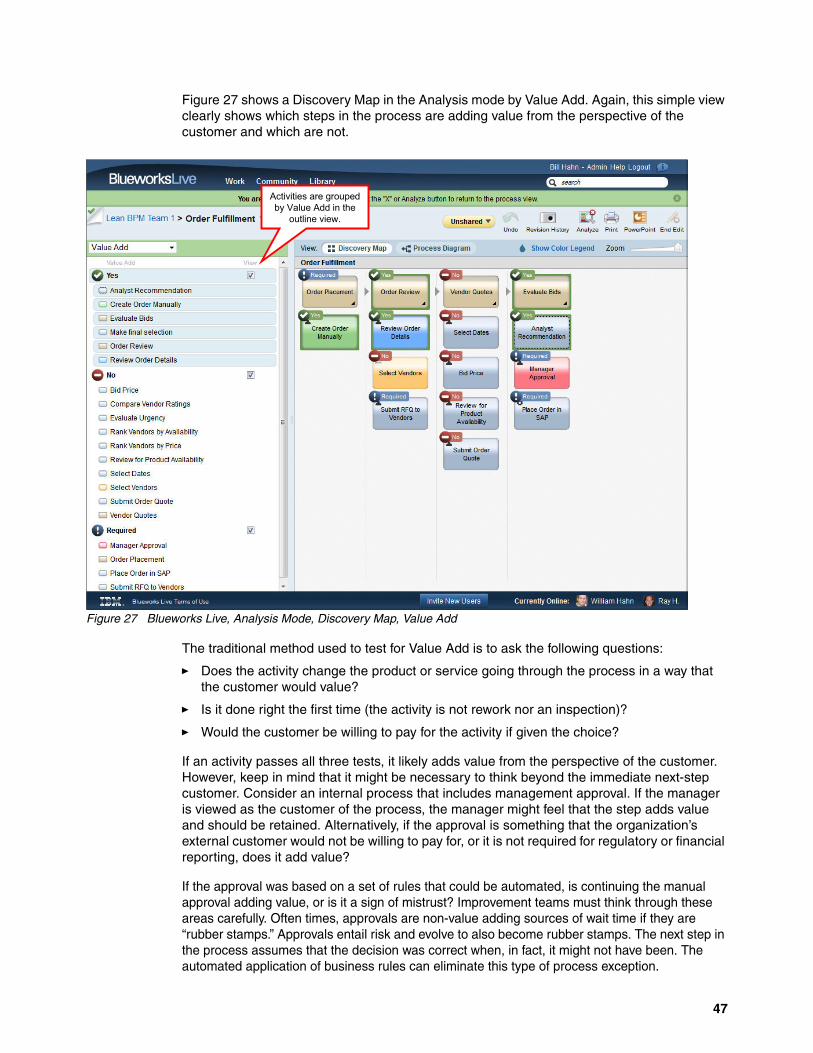
Figure 27 shows a Discovery Map in the Analysis mode by Value Add. Again, this simple view clearly shows which steps in the process are adding value from the perspective of the customer and which are not.
Figure 27 Blueworks Live, Analysis Mode, Discovery Map, Value Add
The traditional method used to test for Value Add is to ask the following questions:
� Does the activity change the product or service going through the process in a way that the customer would value?
� Is it done right the first time (the activity is not rework nor an inspection)?
� Would the customer be willing to pay for the activity if given the choice?
If an activity passes all three tests, it likely adds value from the perspective of the customer. However, keep in mind that it might be necessary to think beyond the immediate next-step customer. Consider an internal process that includes management approval. If the manager is viewed as the customer of the process, the manager might feel that the step adds value and should be retained. Alternatively, if the approval is something that the organization’s external customer would not be willing to pay for, or it is not required for regulatory or financial reporting, does it add value?
If the approval was based on a set of rules that could be automated, is continuing the manual approval adding value, or is it a sign of mistrust? Improvement teams must think through these areas carefully. Often times, approvals are non-value adding sources of wait time if they are “rubber stamps.” Approvals entail risk and evolve to also become rubber stamps. The next step in the process assumes that the decision was correct when, in fact, it might not have been. The automated application of business rules can eliminate this type of process exception.
Activities are grouped by Value Add in the
outline view.
47
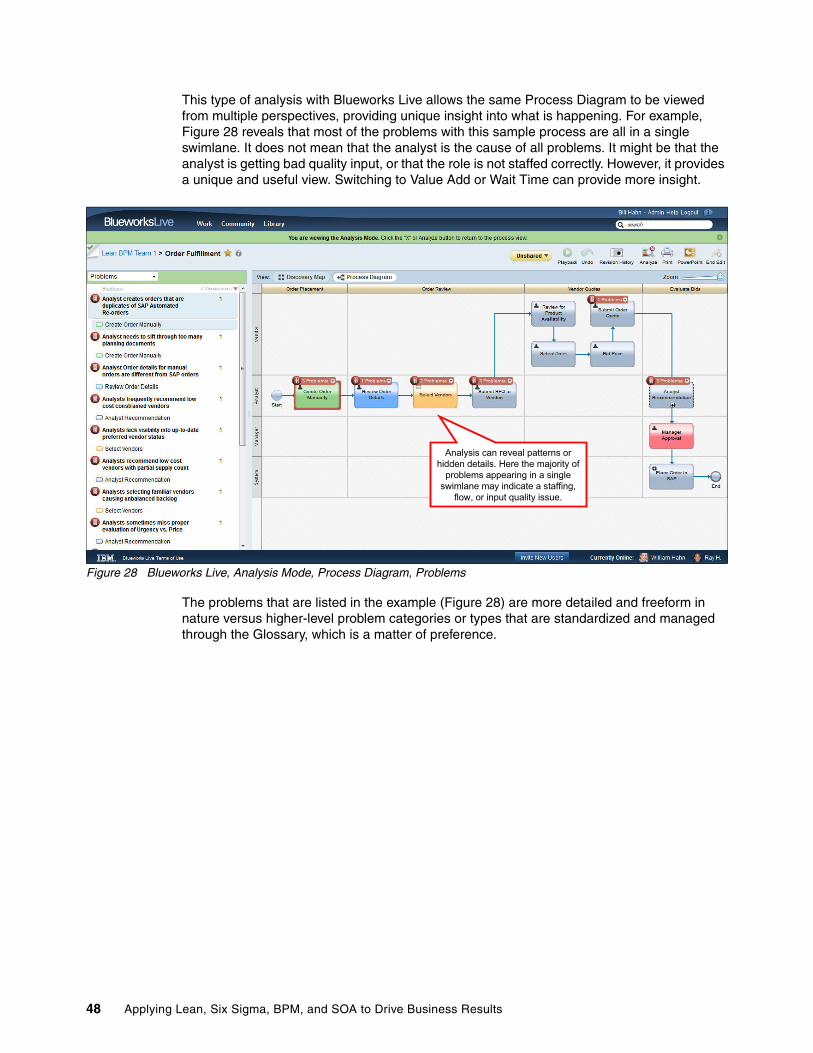
This type of analysis with Blueworks Live allows the same Process Diagram to be viewed from multiple perspectives, providing unique insight into what is happening. For example, Figure 28 reveals that most of the problems with this sample process are all in a single swimlane. It does not mean that the analyst is the cause of all problems. It might be that the analyst is getting bad quality input, or that the role is not staffed correctly. However, it provides a unique and useful view. Switching to Value Add or Wait Time can provide more insight.
Figure 28 Blueworks Live, Analysis Mode, Process Diagram, Problems
The problems that are listed in the example (Figure 28) are more detailed and freeform in nature versus higher-level problem categories or types that are standardized and managed through the Glossary, which is a matter of preference.
Analysis can reveal patterns or hidden details. Here the majority of
problems appearing in a single swimlane may indicate a staffing,
flow, or input quality issue.
48 Applying Lean, Six Sigma, BPM, and SOA to Drive Business Results
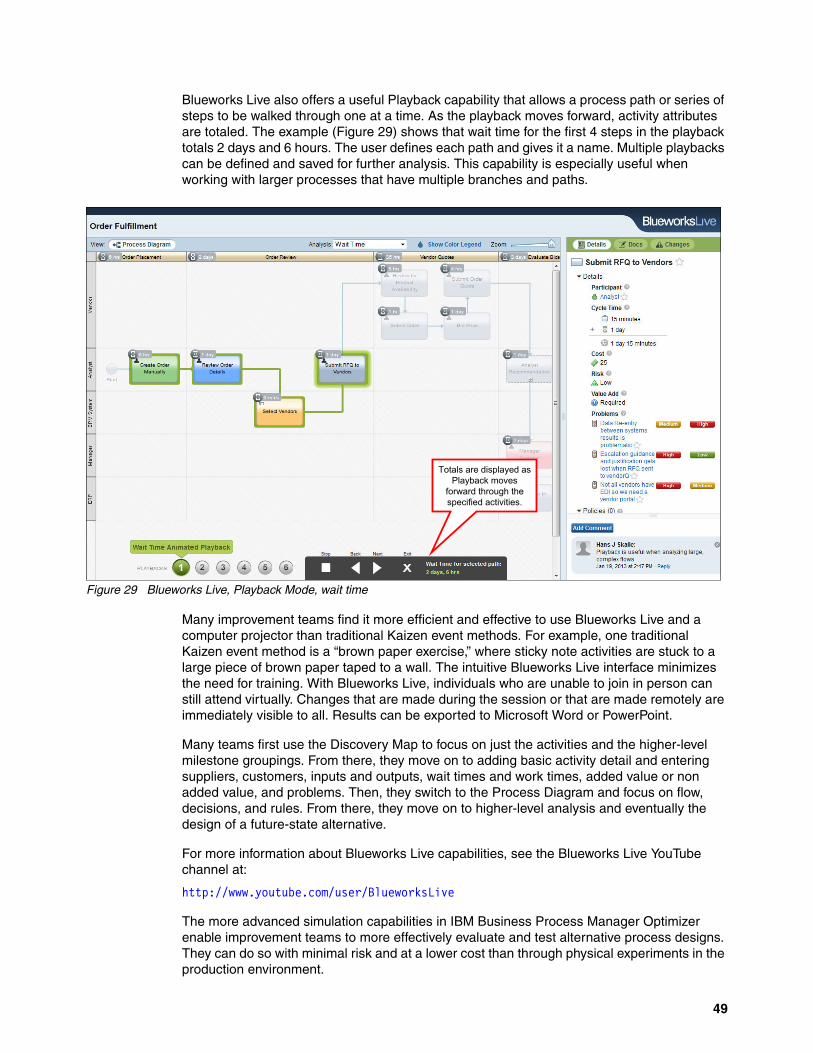
Blueworks Live also offers a useful Playback capability that allows a process path or series of steps to be walked through one at a time. As the playback moves forward, activity attributes are totaled. The example (Figure 29) shows that wait time for the first 4 steps in the playback totals 2 days and 6 hours. The user defines each path and gives it a name. Multiple playbacks can be defined and saved for further analysis. This capability is especially useful when working with larger processes that have multiple branches and paths.
Figure 29 Blueworks Live, Playback Mode, wait time
Many improvement teams find it more efficient and effective to use Blueworks Live and a computer projector than traditional Kaizen event methods. For example, one traditional Kaizen event method is a “brown paper exercise,” where sticky note activities are stuck to a large piece of brown paper taped to a wall. The intuitive Blueworks Live interface minimizes the need for training. With Blueworks Live, individuals who are unable to join in person can still attend virtually. Changes that are made during the session or that are made remotely are immediately visible to all. Results can be exported to Microsoft Word or PowerPoint.
Many teams first use the Discovery Map to focus on just the activities and the higher-level milestone groupings. From there, they move on to adding basic activity detail and entering suppliers, customers, inputs and outputs, wait times and work times, added value or non added value, and problems. Then, they switch to the Process Diagram and focus on flow, decisions, and rules. From there, they move on to higher-level analysis and eventually the design of a future-state alternative.
For more information about Blueworks Live capabilities, see the Blueworks Live YouTube channel at:
http://www.youtube.com/user/BlueworksLive
The more advanced simulation capabilities in IBM Business Process Manager Optimizer enable improvement teams to more effectively evaluate and test alternative process designs. They can do so with minimal risk and at a lower cost than through physical experiments in the production environment.
Totals are displayed as Playback moves
forward through the specified activities.
49
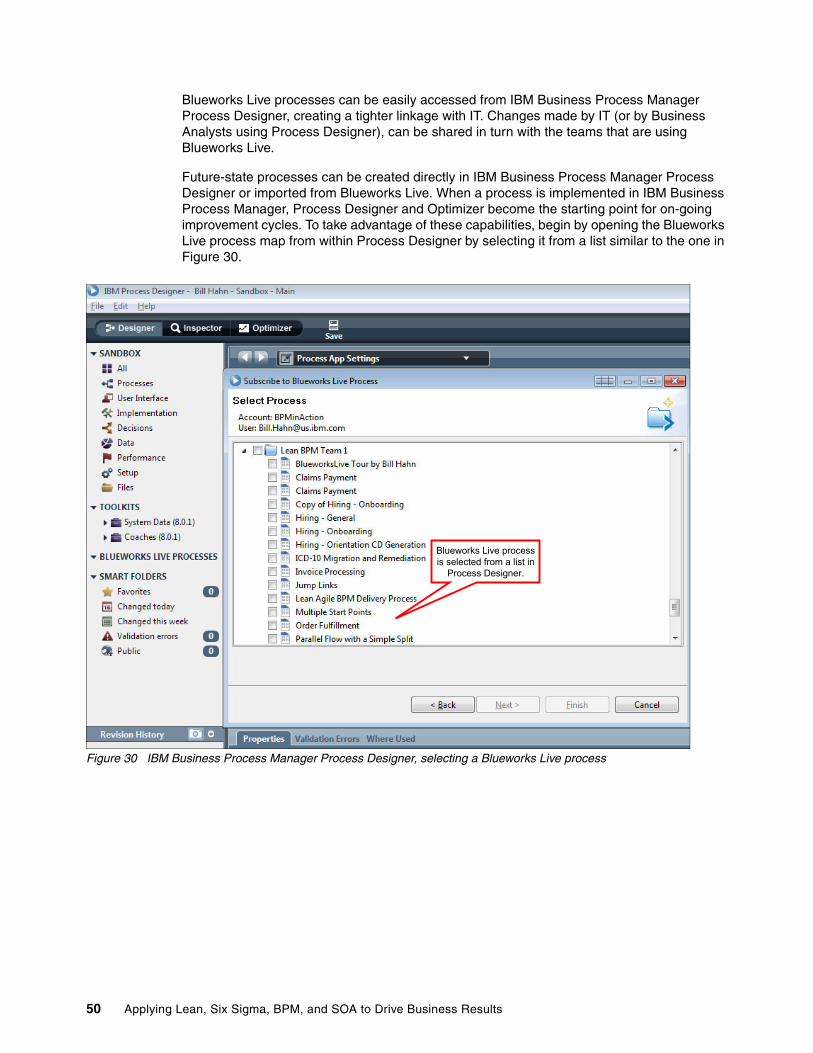
Blueworks Live processes can be easily accessed from IBM Business Process Manager Process Designer, creating a tighter linkage with IT. Changes made by IT (or by Business Analysts using Process Designer), can be shared in turn with the teams that are using Blueworks Live.
Future-state processes can be created directly in IBM Business Process Manager Process Designer or imported from Blueworks Live. When a process is implemented in IBM Business Process Manager, Process Designer and Optimizer become the starting point for on-going improvement cycles. To take advantage of these capabilities, begin by opening the Blueworks Live process map from within Process Designer by selecting it from a list similar to the one in Figure 30.
Figure 30 IBM Business Process Manager Process Designer, selecting a Blueworks Live process
Blueworks Live process is selected from a list in
Process Designer.
50 Applying Lean, Six Sigma, BPM, and SOA to Drive Business Results
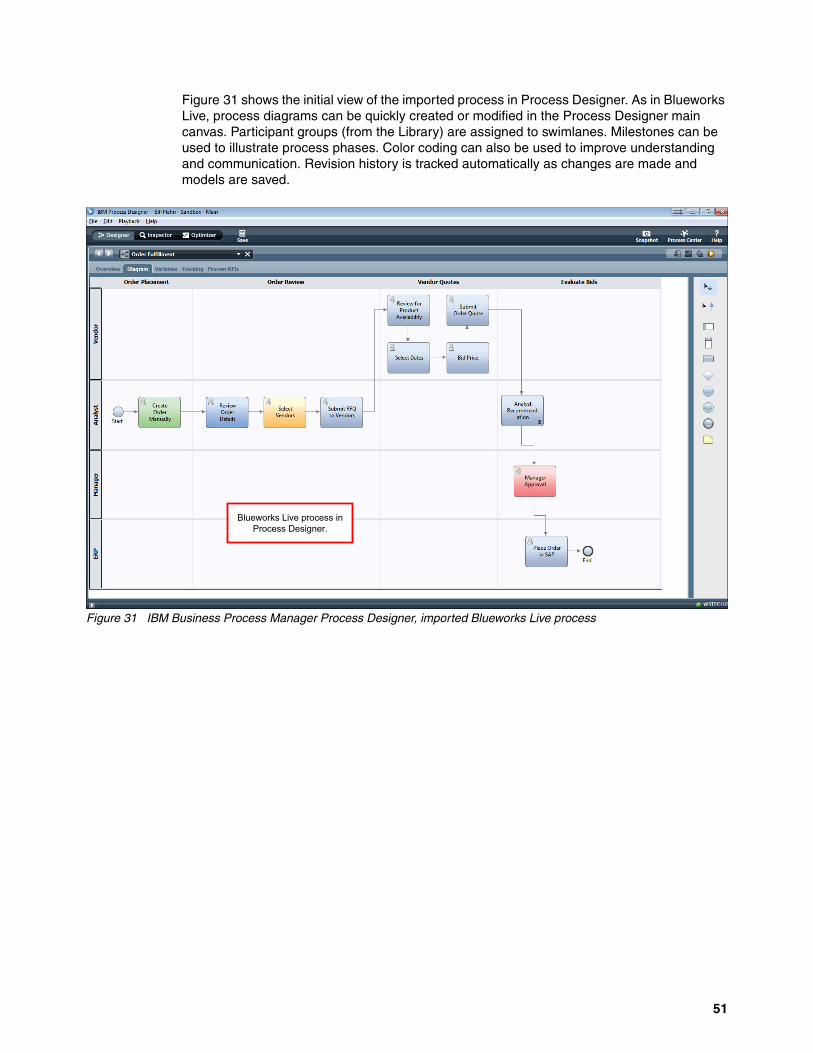
Figure 31 shows the initial view of the imported process in Process Designer. As in Blueworks Live, process diagrams can be quickly created or modified in the Process Designer main canvas. Participant groups (from the Library) are assigned to swimlanes. Milestones can be used to illustrate process phases. Color coding can also be used to improve understanding and communication. Revision history is tracked automatically as changes are made and models are saved.
Figure 31 IBM Business Process Manager Process Designer, imported Blueworks Live process
Blueworks Live process in Process Designer.
51
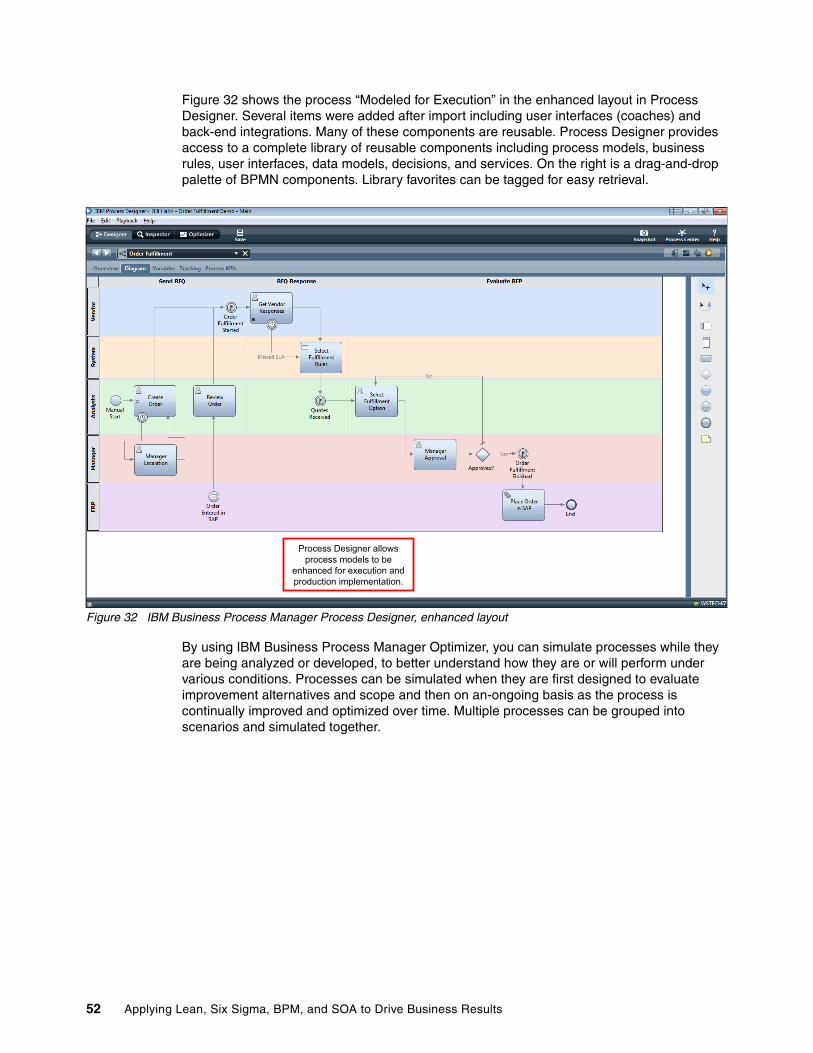
Figure 32 shows the process “Modeled for Execution” in the enhanced layout in Process Designer. Several items were added after import including user interfaces (coaches) and back-end integrations. Many of these components are reusable. Process Designer provides access to a complete library of reusable components including process models, business rules, user interfaces, data models, decisions, and services. On the right is a drag-and-drop palette of BPMN components. Library favorites can be tagged for easy retrieval.
Figure 32 IBM Business Process Manager Process Designer, enhanced layout
By using IBM Business Process Manager Optimizer, you can simulate processes while they are being analyzed or developed, to better understand how they are or will perform under various conditions. Processes can be simulated when they are first designed to evaluate improvement alternatives and scope and then on an-ongoing basis as the process is continually improved and optimized over time. Multiple processes can be grouped into scenarios and simulated together.
Process Designer allows process models to be
enhanced for execution and production implementation.
52 Applying Lean, Six Sigma, BPM, and SOA to Drive Business Results
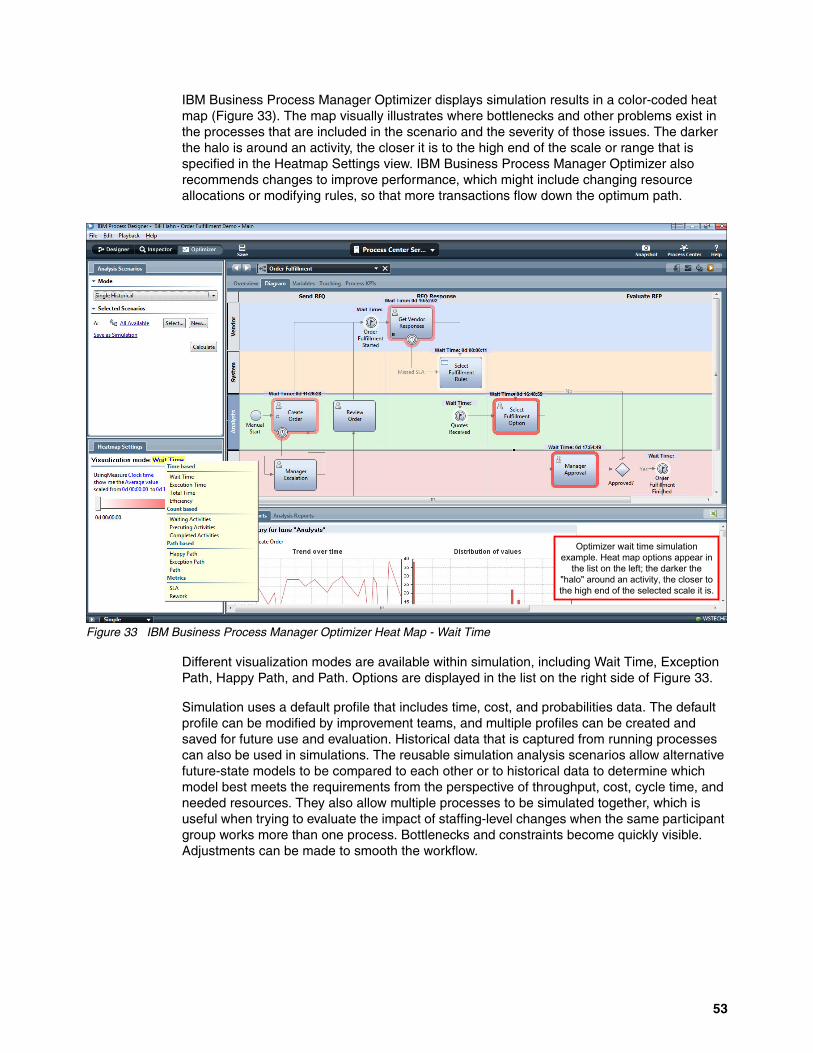
IBM Business Process Manager Optimizer displays simulation results in a color-coded heat map (Figure 33). The map visually illustrates where bottlenecks and other problems exist in the processes that are included in the scenario and the severity of those issues. The darker the halo is around an activity, the closer it is to the high end of the scale or range that is specified in the Heatmap Settings view. IBM Business Process Manager Optimizer also recommends changes to improve performance, which might include changing resource allocations or modifying rules, so that more transactions flow down the optimum path.
Figure 33 IBM Business Process Manager Optimizer Heat Map - Wait Time
Different visualization modes are available within simulation, including Wait Time, Exception Path, Happy Path, and Path. Options are displayed in the list on the right side of Figure 33.
Simulation uses a default profile that includes time, cost, and probabilities data. The default profile can be modified by improvement teams, and multiple profiles can be created and saved for future use and evaluation. Historical data that is captured from running processes can also be used in simulations. The reusable simulation analysis scenarios allow alternative future-state models to be compared to each other or to historical data to determine which model best meets the requirements from the perspective of throughput, cost, cycle time, and needed resources. They also allow multiple processes to be simulated together, which is useful when trying to evaluate the impact of staffing-level changes when the same participant group works more than one process. Bottlenecks and constraints become quickly visible. Adjustments can be made to smooth the workflow.
Optimizer wait time simulation example. Heat map options appear in
the list on the left; the darker the "halo" around an activity, the closer to the high end of the selected scale it is.
53
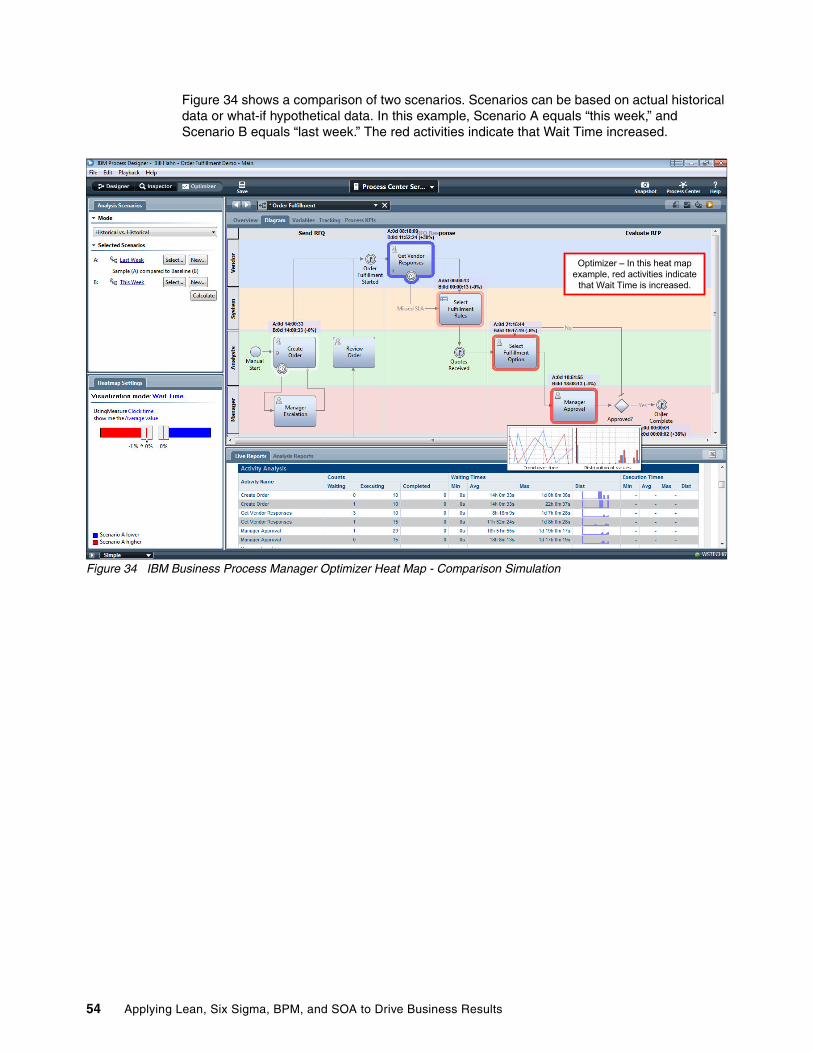
Figure 34 shows a comparison of two scenarios. Scenarios can be based on actual historical data or what-if hypothetical data. In this example, Scenario A equals “this week,” and Scenario B equals “last week.” The red activities indicate that Wait Time increased.
Figure 34 IBM Business Process Manager Optimizer Heat Map - Comparison Simulation
Optimizer � In this heat map example, red activities indicate
that Wait Time is increased.
54 Applying Lean, Six Sigma, BPM, and SOA to Drive Business Results
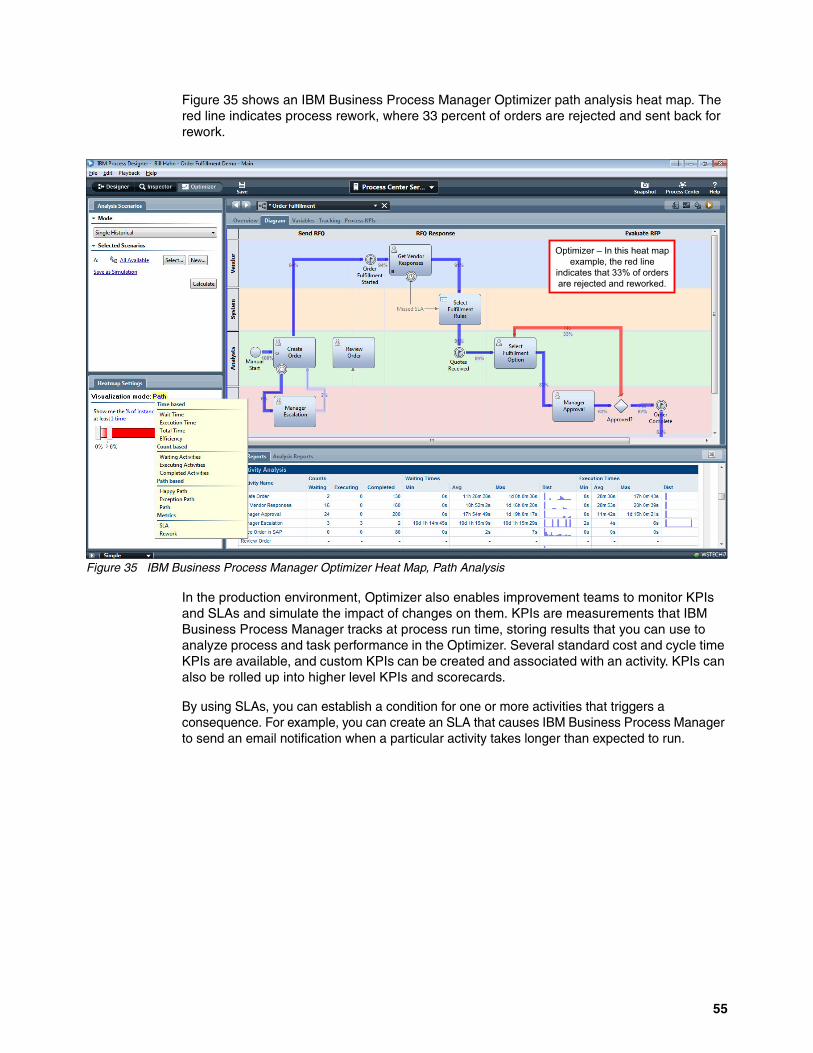
Figure 35 shows an IBM Business Process Manager Optimizer path analysis heat map. The red line indicates process rework, where 33 percent of orders are rejected and sent back for rework.
Figure 35 IBM Business Process Manager Optimizer Heat Map, Path Analysis
In the production environment, Optimizer also enables improvement teams to monitor KPIs and SLAs and simulate the impact of changes on them. KPIs are measurements that IBM Business Process Manager tracks at process run time, storing results that you can use to analyze process and task performance in the Optimizer. Several standard cost and cycle time KPIs are available, and custom KPIs can be created and associated with an activity. KPIs can also be rolled up into higher level KPIs and scorecards.
By using SLAs, you can establish a condition for one or more activities that triggers a consequence. For example, you can create an SLA that causes IBM Business Process Manager to send an email notification when a particular activity takes longer than expected to run.
Optimizer � In this heat map example, the red line
indicates that 33% of orders are rejected and reworked.
55
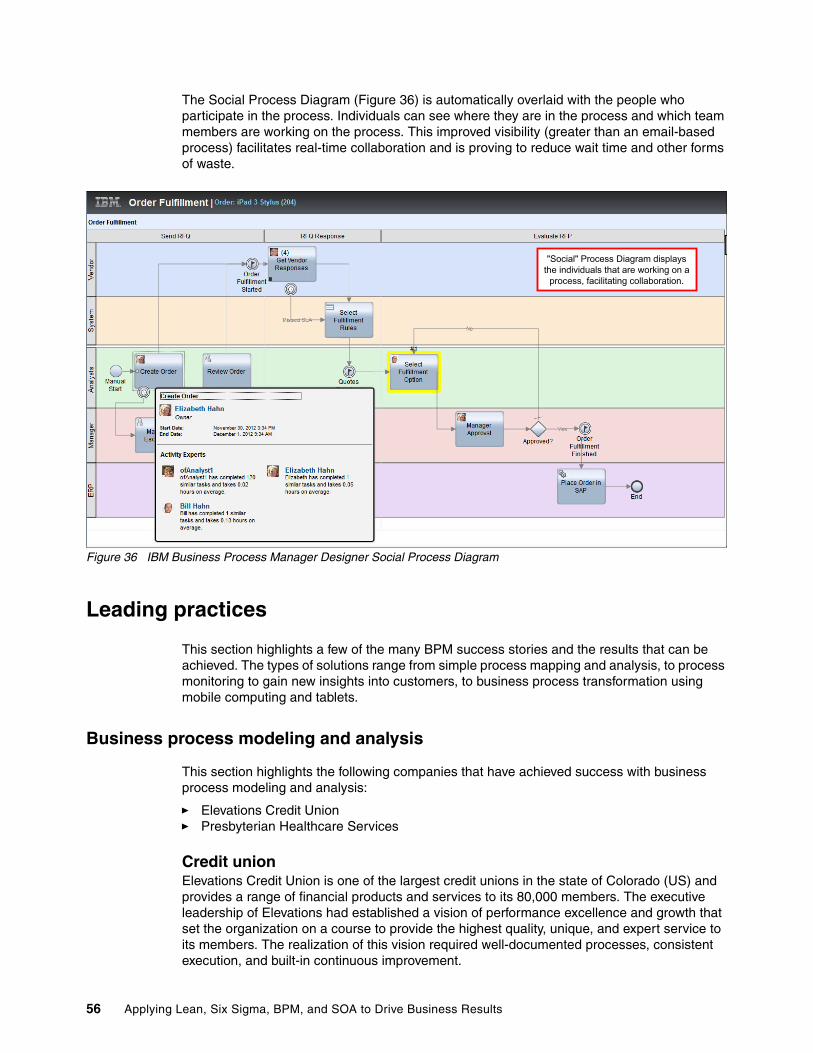
The Social Process Diagram (Figure 36) is automatically overlaid with the people who participate in the process. Individuals can see where they are in the process and which team members are working on the process. This improved visibility (greater than an email-based process) facilitates real-time collaboration and is proving to reduce wait time and other forms of waste.
Figure 36 IBM Business Process Manager Designer Social Process Diagram
Leading practices
This section highlights a few of the many BPM success stories and the results that can be achieved. The types of solutions range from simple process mapping and analysis, to process monitoring to gain new insights into customers, to business process transformation using mobile computing and tablets.
Business process modeling and analysis
This section highlights the following companies that have achieved success with business process modeling and analysis:
� Elevations Credit Union� Presbyterian Healthcare Services
Credit unionElevations Credit Union is one of the largest credit unions in the state of Colorado (US) and provides a range of financial products and services to its 80,000 members. The executive leadership of Elevations had established a vision of performance excellence and growth that set the organization on a course to provide the highest quality, unique, and expert service to its members. The realization of this vision required well-documented processes, consistent execution, and built-in continuous improvement.
"Social" Process Diagram displays the individuals that are working on a
process, facilitating collaboration.
56 Applying Lean, Six Sigma, BPM, and SOA to Drive Business Results
To achieve this, Elevations Credit Union used Blueworks Live to build an overarching enterprise process map with all the organization’s processes divided into categories and to document core, customer-focused and supporting Value Streams. With this information, Elevations Credit Union gained a clearer understanding of the importance of the company’s many processes and how they are linked. Using insight from Blueworks Live, Elevations adjusted its processes to improve member satisfaction levels. The company identified points of redundancy and bottlenecks within the process, resulting in a significant reduction in cycle times and improved member satisfaction ratings.
In 2010, Elevations was one of two recipients of the Rocky Mountain Performance Excellence (RMPEx) Timberline Performance Excellence Award.21 This award is a regional award that is based on the results-driven assessment criteria of the US Malcolm Baldrige National Quality Award.
For more information, see “Elevations Credit Union achieves process excellence” at:
http://www.ibm.com/software/success/cssdb.nsf/CS/CPAR-8N3PFC?OpenDocument&Site=default&cty=en_us
Healthcare systemPresbyterian Healthcare Services is a not-for-profit healthcare system that has served the residents of New Mexico since 1908. It includes hospitals, a health plan, and a growing medical group.
In 2011, Presbyterian would open a new hospital that would include labor and delivery services, intensive care, operating rooms, cardiac services, and emergency care. The hospital was faced with designing all of the processes within the new environment, including performance metrics, and needed a tool that was easy to use and would encourage collaboration among department managers.
Presbyterian Healthcare Services selected Blueworks Live to document their current processes, analyze constraints, and design improved future states of the hospital’s processes. Employees were able to get up and running quickly with Blueworks Live and, in just two months, fully documented approximately 120 process flows.
For more information, see the “Presbyterian Healthcare Services case study” at:
http://www.ibm.com/software/success/cssdb.nsf/CS/CPOR-8L23LM?OpenDocument&Site=corp&cty=en_us
Mobile tablet-based business process transformation
The healthcare industry is plagued by fragmented, complex processes that are difficult to navigate, error prone, and costly. During a hospital stay, cost-effective patient management and high-quality care relies on a “carefully orchestrated confluence of staff, systems, equipment, and supplies to convene at time-critical locations to provide care and treatment.”22
The Ottawa Hospital was formed in 1998 through the merger of five different healthcare institutions. Its four campuses now serve more than 1.2 million people across eastern Ontario. Working with IBM, the hospital has created an innovative care management platform that takes advantage of IBM Business Process Manager capabilities that include business rules and extension to mobile devices. The Apple iPad applications on the BPM platform bring processes closer to the patient and improve their flow and the flow of work through the
21 Rocky Mountain Performance Excellence, Past (Award) Recipients: http://rmpex.org/about-us/award-recipients/past-recipients
22 Discover, Interact, and Optimize for Smarter Healthcare with BPM Powered by Smart SOA, REDP-4691
57
hospital. Supporting their “Back to the Bedside” initiative, the iPads put up-to-the-minute patient and process information at the fingertips of the physicians and support staff who are working face-to-face in real time with the patients and their families.
The time saved through the applications resulted in a break-even point of less than three months. As part of their Journey to Excellence strategy, Blueworks Live was also used to map hospital processes from the perspective of patient.
For more information about this case study, see “The Ottawa Hospital improves patient care and safety” at:
http://www.ibm.com/software/success/cssdb.nsf/CS/CPAR-8TRNSQ?OpenDocument&Site=default&cty=en_us
To view a video on this case study, see the “The Ottawa Hospital client reference video” at:
http://www.ibm.com/software/success/cssdb.nsf/CS/CPAR-8TWRQE?OpenDocument
To access the Technology & Mobility: iPads at Ottawa Hospital, Process Excellence Network podcast on this case study, go to:
http://www.processexcellencenetwork.com/technology-for-process-improvement/podcasts/technology-mobility-ipads-at-ottawa-hospital
Business rules-driven process transformation
This section highlights the following types of organizations that have achieved success with business rules-driven process transformation:
� Government agency� Pharmaceutical company
Government agencyWorkSafe Victoria is an agency of the Australian government that handles claims for work-related accidents. This agency was manually handling invoices totaling up to AU$3 billion a year by using a paper-based process. The agency was looking for ways improve the efficiency and productivity of its agents and to speed payments to its treatment providers.
A set of complex rules was applied manually to each invoice to ensure that proper amounts were paid and that the claim was accurate. Changes to business rules could take 20 days or more to implement, updating documentation and communicating the changes to process workers.
In the automated process, IBM Operational Decision Manager is used to capture and apply the complex rules to each invoice. Business process owners have complete control of the rules and implement changes rapidly with minimal or no IT involvement. Most invoices are processed straight through with no manual intervention. The result is that it speeds up the process and frees process workers to do the higher valued work that they have wanted to do in the past.
For more information, see the “WorkSafe Victoria IBM Client Reference Video” at:
http://www.ibm.com/software/success/cssdb.nsf/CS/CPOR-8HE52J?OpenDocument&Site=corp&cty=en_us
Pharmaceutical companyPharmaceutical and medical device companies doing business in the United States are subjected to a constantly changing set of regulations that can vary down to the state and local levels. The United States Physicians Payments Sunshine Act of 2010, for example, adds hundreds of new business rules for reporting payments to physicians and certain other
58 Applying Lean, Six Sigma, BPM, and SOA to Drive Business Results
healthcare providers. Effectively managing these rules and their changes can be complex and costly because they can exist in multiple applications.
A leading United Kingdom (UK) Pharmaceutical Company that was doing business in the US reduced the costs of compliance reporting and exception handling by using IBM Operational Decision Manager. The company also improved visibility into promotional spend and created rules to better target promotional offers while staying within limits. The company also used rules-driven simulation to evaluate the impact of potential regulatory changes to improve its planning and budgeting processes.
For more information, see “Pharmaceutical Company: Accelerating compliance with Sunshine Act of 2010” at:
http://www.ibm.com/software/success/cssdb.nsf/cs/CPOR-8G946B?OpenDocument&Site=corp&ref=crdb
Process transformation with IBM Business Process Manager
This section highlights the following organizations that have achieved success with process transformation thanks to IBM Business Process Manager:
� Humana S.A. (healthcare insurance and medical services provider)� Versicherungskammer Bayern Group (insurance provider)� International finance institution
Healthcare and medical services providerHumana S.A. in Ecuador is a 26-year old company that provides healthcare insurance and medical services to a wide range of customers. Over time, Humana found that its older systems were preventing the company from responding to the changing needs of its customers, requiring manual workarounds and not providing access to data needed for timely decision making. In addition, the technical skills needed to maintain their systems were more difficult to find in country.
IBM Business Process Manager is a key enabler of the Humana transformation from a silo-based organization to one that is organized around more efficient horizontal processes that are focused on its customers. BPM is providing needed visibility into process performance and work queues, and improved processes have increased customer satisfaction and the rate of growth.
For more information about this case study, see the “Humana S.A. client reference video” at:
http://www.ibm.com/software/success/cssdb.nsf/CS/CPAR-94NMGJ?OpenDocument&Site=corp&cty=en_us
Insurance providerVersicherungskammer Bayern Group (VKB) is a major insurance provider in Germany that offers a full range of life insurance, non-life, and health products to individuals and institutions. Each of the company’s business units had its own set of processes, channels, architectures, and applications, which resulted in duplicate and redundant functionality, high maintenance and change costs, and time-consuming manual workarounds. The disjointed processes also made it difficult to ensure consistent enforcement of corporate and risk guidelines.
Built on top of an SOA, VKB used IBM Business Process Manager and business rules to automate its policy cancellation and notification process. The improved process increases flexibility so that the company can consistently enforce policy renewal and cancellation guidelines. Business rules applied to a policy holder’s history and contractual guidelines
59
automatically route select cancellation requests to a sales representative for follow-up. The solution improved enforcement and control. It also resulted in a significant reduction in manual processing and reduced the time required to implement rules changes from months to days.
For more information about this case study, see “Versicherungskammer Bayern: Builds smarter policy cancellation process” at:
http://www.ibm.com/software/success/cssdb.nsf/CS/CPOR-8HE4DB?OpenDocument&Site=corp&cty=en_us
You can also view a video about this case study at:
http://www.ibm.com/software/success/cssdb.nsf/CS/SJHA-8KMDWS?OpenDocument&Site=corp&cty=en_us
International finance institutionAn international financing institution is using Blueworks Live and IBM Business Process Manager to analyze and improve its core processes. This institution partners with governments, private-sector businesses, and affected communities to put in place unique disease-fighting programs by funding roughly US$4 billion per year. To qualify for funding, health programs must be results-driven and able to offer direct evidence of success.
Grant application and fund disbursement processes hinged on manual steps, with relevant information housed in multiple systems and even random spreadsheets. The high degree of human interaction for each step resulted in long wait times, with the worst cases requiring a full year between application submission and grant payment.
Blueworks Live was used by multiple stakeholders to analyze the current-state process, identify bottlenecks, and define improvements. Automated workflows were then created by using IBM Business Process Manager. The grant award process was streamlined and Visibility into KPIs was increased, enabling key decision makers to identify more opportunities for improvement.
For more information, see “An international institution fights AIDS, tuberculosis and malaria” at:
http://www.ibm.com/software/success/cssdb.nsf/CS/CPAR-8W3M4H?OpenDocument&Site=default&cty=en_us
Delivering business results for Lean Six Sigma enabled by BPM
For years, Lean, Six Sigma, and Lean Six Sigma projects have squeezed waste and variation out of business processes to save time and money. Lean Six Sigma tools and techniques are even being applied to corporate social responsibility issues. For example, in Green-related issues, the conservation efforts of IBM have resulted in 4.6 billion kWh of electricity and US$310 million in savings, and avoided over three million metric tons of CO2 emissions since 1990. The IBM Green Sigma™ consulting offering now helps customers who achieve similar results. It includes a BPM element in the form of a Carbon and Water Management dashboard system that monitors key performance indicators, analyzes performance data, and uses event triggers to initiate processes such as carbon trading.
Flexible, SOA-based BPM platforms that offer integration capability, in addition to process choreography and business policies and rules, replace manual retyping with automated system-to-system hand-offs. At the same time, they allow the process to be monitored as it crosses departmental, application, and workflow boundaries. They use this approach instead of increasing the complexity of the applications with more custom code.
60 Applying Lean, Six Sigma, BPM, and SOA to Drive Business Results

Choosing a BPM platform that is based on SOA is critical to success. It compounds benefits through higher levels of process and service component reuse and by allowing these components to be readily swapped in and out of the business processes. IBM firmly believes that combining Lean Six Sigma with SOA-based BPM can increase the rate of improvement while freeing time and resources to focus on new opportunities, innovation, and growth (Figure 37).
Figure 37 Lean Six Sigma with SOA-based BPM
Combining Lean Six Sigma with SOA-based BPM is accomplished by uniting Lean Six Sigma and IT teams early in the improvement or design projects to collaborate, including the following components:
� The problem-solving and analysis skills of trained Lean Six Sigma professionals� The technical knowledge of IT architects and developers� The powerful new technical functionality in the BPM platform� The portfolio of reusable assets (such as service components, test, and simulation
environments)
Through this combination, greater overall benefits are achieved in a shorter time, with an increased focus on projects that produce clear and measurable business results:
� Proven problem-solving tools and techniques speed analysis and technical requirements definition.
� Process simulation allows alternatives to be more thoroughly evaluated and tested with limited risk and without more costly real-world experiments.
� Reusable process and service components become business focused and, as a result, reuse increases over time, further accelerating improvements and innovation.
� New improvement options, such as business rules, workflow, and process monitoring, result in more innovative and flexible improvement and design alternatives and solutions.
� Process measures are more predictive, results are focused, and included escalations and alerts are designed to head off problems before they grow.
• Processes are more effectively managed through policies, dashboards, predictive measures, and automated alerts.
• Flexibility increases, and time savings allow a shift in focus to innovation, new opportunities, and growth.
• Operations are more consistent with less time spent chasing and fixing problems.
• Faster, more efficient deployment of processes, improved IT productivity, and faster time to value
• SOA and service reuse that improves productivity,increases flexibility, reduces backlog, and drives deployment costs down
Implementation and Operations Costs
Project Costs
BPM investment and key project
-10%
-20%
-30%
Cost
Revenue
SOAs and service reuse compress
timelines
61
The project backlog is likely to go down and not up because priorities are driven by business strategy versus reactive fire fighting. Without this linkage is a risk that valuable and limited IT resources are being channeled to projects with uncertain or limited return. The backlog builds as the next hot project comes along and work is disrupted as priorities shift and churn.
Common success inhibitors
Common BPM and Lean Six Sigma success inhibitors include organizational structure, IT backlogs and budget constraints, and a general lack of awareness and understanding.
Structural inhibitors
Organizational structure can be one of the biggest inhibitors to effective business process management and competitive differentiation. Organizations with vertical silos tend to manage the parts and not the whole. They might duplicate functionality that can be shared or centralized to cut operating costs or investment. According to competitive strategy guru, Michael Porter, “an organizational structure that corresponds to the value chain will improve a firm’s ability to create and sustain competitive advantage.” He also states that “managers of support activities, such as…technology development, often do not have a clear view of how they relate to the firm’s overall competitive position something that a focus on the horizontal value stream changes.”23
Fitting all of the pieces together is no easy task, especially when many large organizations are divided into multiple business units, each with their own sales, delivery, and billing departments, processes, and systems. This duplication can lead to higher than necessary costs and inconsistent customer experiences when interacting across the divisions.
Organizations with rigid department-level boundaries also run risks. Processes that cut across departments can be measured and managed by the department, but not as a whole. Alternatively, they can be stitched together with excessive approvals and data retyping. If an organization is not careful, improvement efforts that focus on a departmental process or subprocess have the potential to suboptimize processes upstream and downstream in other departments.
In practiceKnowing which processes are the sources of differentiation and how they fit into the business system is critical to remaining competitive. Therefore, as explained previously, you must view the enterprise as a value producing whole and recognize where organizational structure gets in the way or adds unnecessary costs. Look closely at business processes as they cross organizational boundaries, and use simulation to test for the impact of improvements upstream and downstream. Establish KPIs that measure the system (versus the department or function alone). Deploy KPI dashboards early on to provide needed system-level visibility, and alert process owners to changing conditions and problems.
IT backlogs and budget constraints
A major healthcare insurance provider with millions of subscribers and a broad portfolio of products and services is required to comply with various healthcare and regulatory requirements, such as Sarbanes Oxley and HIPAA. Executive management feels that it needs to change its products more frequently and introduce new products and surrounding services to maintain the company’s competitive position.
23 Michael Porter, Competitive Advantage: Creating and Sustaining Superior Performance (Simon and Schuster, 2008)
62 Applying Lean, Six Sigma, BPM, and SOA to Drive Business Results
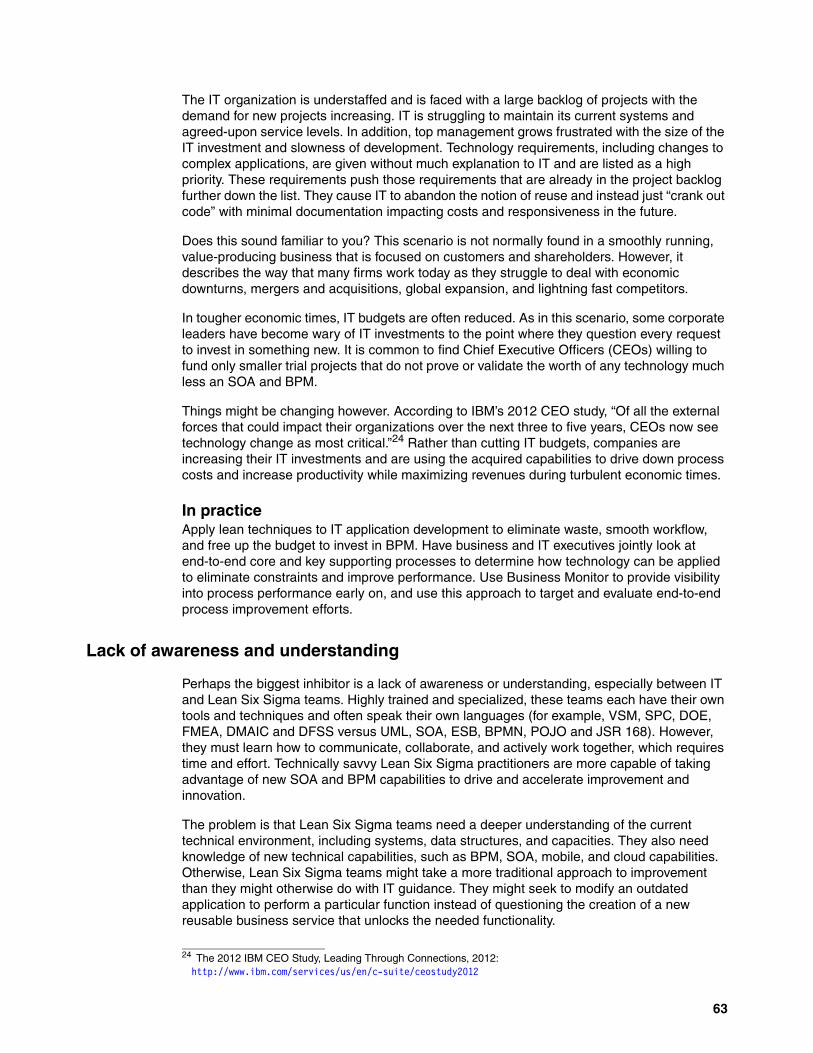
The IT organization is understaffed and is faced with a large backlog of projects with the demand for new projects increasing. IT is struggling to maintain its current systems and agreed-upon service levels. In addition, top management grows frustrated with the size of the IT investment and slowness of development. Technology requirements, including changes to complex applications, are given without much explanation to IT and are listed as a high priority. These requirements push those requirements that are already in the project backlog further down the list. They cause IT to abandon the notion of reuse and instead just “crank out code” with minimal documentation impacting costs and responsiveness in the future.
Does this sound familiar to you? This scenario is not normally found in a smoothly running, value-producing business that is focused on customers and shareholders. However, it describes the way that many firms work today as they struggle to deal with economic downturns, mergers and acquisitions, global expansion, and lightning fast competitors.
In tougher economic times, IT budgets are often reduced. As in this scenario, some corporate leaders have become wary of IT investments to the point where they question every request to invest in something new. It is common to find Chief Executive Officers (CEOs) willing to fund only smaller trial projects that do not prove or validate the worth of any technology much less an SOA and BPM.
Things might be changing however. According to IBM’s 2012 CEO study, “Of all the external forces that could impact their organizations over the next three to five years, CEOs now see technology change as most critical.”24 Rather than cutting IT budgets, companies are increasing their IT investments and are using the acquired capabilities to drive down process costs and increase productivity while maximizing revenues during turbulent economic times.
In practiceApply lean techniques to IT application development to eliminate waste, smooth workflow, and free up the budget to invest in BPM. Have business and IT executives jointly look at end-to-end core and key supporting processes to determine how technology can be applied to eliminate constraints and improve performance. Use Business Monitor to provide visibility into process performance early on, and use this approach to target and evaluate end-to-end process improvement efforts.
Lack of awareness and understanding
Perhaps the biggest inhibitor is a lack of awareness or understanding, especially between IT and Lean Six Sigma teams. Highly trained and specialized, these teams each have their own tools and techniques and often speak their own languages (for example, VSM, SPC, DOE, FMEA, DMAIC and DFSS versus UML, SOA, ESB, BPMN, POJO and JSR 168). However, they must learn how to communicate, collaborate, and actively work together, which requires time and effort. Technically savvy Lean Six Sigma practitioners are more capable of taking advantage of new SOA and BPM capabilities to drive and accelerate improvement and innovation.
The problem is that Lean Six Sigma teams need a deeper understanding of the current technical environment, including systems, data structures, and capacities. They also need knowledge of new technical capabilities, such as BPM, SOA, mobile, and cloud capabilities. Otherwise, Lean Six Sigma teams might take a more traditional approach to improvement than they might otherwise do with IT guidance. They might seek to modify an outdated application to perform a particular function instead of questioning the creation of a new reusable business service that unlocks the needed functionality.
24 The 2012 IBM CEO Study, Leading Through Connections, 2012: http://www.ibm.com/services/us/en/c-suite/ceostudy2012
63
Lean Six Sigma teams frequently do not have the technical knowledge that is required to correctly align the enabling technologies with the new process. This situation means that opportunity is left on the table or gain is minimized. Additionally, something that might seem technically simple on the surface can be costly or time consuming to implement. If the improvement requirements are given, without any explanation, to IT for implementation, the risk of suboptimizing IT performance, disrupting work, and adding to existing backlogs also increases.
IBM recently completed a pilot project at a major retailer. The Lean Six Sigma team designed an improved process (with no IT involvement) that “transformed” a paper-based process into one that relied on email to move the needed information. The process had a cycle-time requirement of two weeks, except during peak holiday periods, when it was required to complete in two days. With email, there is no visibility into the process and no way to measure it in an effort-free way. IBM went back to the team and described a BPM-based workflow that showed each transaction as it moved through the approval queues. IBM helped the retailer to understand the value of reusable services, modeled the process for IT hand-off, and built a simple KPI dashboard to track cycle times and issue alerts when thresholds were neared.
The pilot took less than one month to build. Further testing is needed to get the pilot BPM solution ready for the production environment. However, the Lean Six Sigma team now has a much better understanding of what BPM can do for them and how quickly they can move with IT involvement and help.
In practiceThe business analyst role is typically a liaison between the business and IT organizations. In the past, a business analyst might have specialized in the business or technical domains. This specialization is now changing with business analysts having a combination of skills and experience that enable them to gauge and measure the business benefits that result from a software change. IT architects are also broadening their skills so that they can understand the points of intersection between the technical architecture, the business architecture, business strategy, and competitive market position.
Extend job descriptions to encourage the development of these broader skills, bring IT and business teams together early, and work to select the right project.
Calculating benefits
To gain funding for a BPM investment, clearly estimate and project future benefits and ROI. This section highlights a framework for calculating the benefit of BPM projects and looks at some of the details behind it.
Since 2002, IBM has helped hundreds of customers develop detailed business cases with an engagement called a Business Value Assessment (BVA). Today the BVA uses a proven financial model that compares a customer’s current cost, productivity, and revenue environment to one or more future-state alternatives that are enabled by Lean Six Sigma, BPM, and SOA.
As a result of these engagements, IBM has learned that IT organizations tend to focus on cost comparisons, searching for the lowest total cost of ownership (TCO) or, in some cases, the lowest price. IBM has also learned that business unit executives who more frequently fund today’s BPM investments focus on reducing the costs of their processes and operations and on the extra revenue or profit that can be generated. Although it might be easier to understand and calculate the cost side of the equation, it is also important to consider the direct and indirect benefits of increased business productivity and revenue when calculating the ROI of BPM.
64 Applying Lean, Six Sigma, BPM, and SOA to Drive Business Results
Direct benefits can be directly associated with an improvement, such as a decrease in the number of process exceptions, the corresponding time saved by working corrective actions, or a reduction in the costs of paper and postage. A direct benefit is typically included at 100 percent in the business case. A benefit, such as the benefits that are associated with a reduction in the improvement project backlog, might not be directly observable. In this case, a company can classify that benefit as indirect and count only a portion of its estimated impact, typically 20 - 40 percent. In BPM projects, however, indirect benefits can outweigh direct benefits over time.
IBM has also learned that it can be challenging to quantify the benefits of BPM and SOA, or to justify the investment, without focusing on the improvement of a specific and meaningful business process. And it might require including multiple processes in the scope of the business case and implementation roadmap to accumulate the benefits that are needed to drive ROI and accelerate the break-even point. Look for projects that affect the larger core and key enabling processes and that currently require significant manual effort, have a high percentage of exceptions with minimal straight through processing, or are forced to change more frequently. Some companies have existing KPIs that can be used in goal setting and in the business case.
Figure 38 is a Value Tree or Benefits Framework that highlights the normal starting areas when quantifying the benefits of a BPM project.
Figure 38 Calculating the benefits of BPM
Business value is found in the following areas:
� Strategic change
Multiple BPM and SOA platform capabilities combine to enable strategic change. SOAs improve organizational flexibility and responsiveness. They break functionality into reusable building blocks (services) that can be built and tested independently and then assembled or recombined in a building-block fashion.
Quantify the impact of:• Ability to rapidly change processes in
response to business events and opportunity• Ability to respond to changes in regulatory
requirements and industry standards
• Innovations in products and services andbusiness operations
• New business models and the ability to change these rapidly
• Improved productivity through process automation, workflows, and business rules
• Improved, near real-time responsiveness to out-of-bounds conditions and KPIs
• Elimination of errors, risk, waste, non-value- added activities, and variation
• Ability to dynamically assemble business process components at run time
• Building or buying solution components including labor, software, hardware, training, contract services, and so on
• Component and process reuse
• Costs of ongoing code maintenance, administration, fees, and governance
• Change and increasing process complexity driven by business events
Calculating the benefits of BPM
BusinessValue
TechnicalValue
Cost ofOperations
Cost ofImplementation
ProcessOptimization
BusinessInnovation
StrategicChange
ROI
65
By using business rules that are abstracted from application code or manual procedures and that are managed centrally by business users, an organization can rapidly deal with the following areas:
– Differences in geographical area– New customer segments (driven by improved analytics)– Innovative new products or services– Changes in regulatory requirements
Quick-to-deploy automated workflows, based on reusable patterns, can also be used to respond more effectively to business events that present new opportunity or challenges. Building these capabilities into business processes allows change to become a competitive and first-mover advantage.
The benefits of change can be quantified by reviewing the results of the following areas:
– The expected or desired number of changes per year
– The estimated costs of responding today (both technically and organizationally)
– The estimated (percent) savings resulting from the growing use of business-controlled rules and reusable components
– The potential results of change made in days versus months in terms of improved business productivity and potential revenue
A flexible business and technical architecture based on business rules and reuse can be incorporated into the improvement strategy developed by Lean Six Sigma practitioners. This approach requires the active involvement of IT in the improvement and design projects and in discussions of where best to use change as a differentiator.
The IBM 2012 CEO study reveals that 73 percent of the outperformers, those companies that surpass industry peers in terms of revenue growth and profitability, “excel at managing change.”25
� Business innovation
Similar to strategic change, the ability to innovate rapidly is becoming more critical to business success and survival. Innovation is sometimes forced on even the most resistant industries. Such innovation is driven by smartphone and tablet apps, mobile sensing devices, and creative uses of RFID. According to the IBM 2012 CEO study, more than one-half of all CEOs are partnering extensively to drive innovation in products, services, and business models.26 This type of innovation requires a business and technical architecture that is flexible and extensible, which is one that is based on SOA-enabled BPM capabilities.
The business process or value stream that is selected as the basis of the business case might result in new products or services or innovative operational practices (directly or through a network of partners). Alternatively, it might lay the foundation for innovation in the structure or financial model of the business. In either case, the business attempts to quantify the initial value. Then, it extrapolates this value to the future and typically treats it as an indirect (but real) benefit. Consider the number of new products or services per time period, average cost of new product design, average revenue and margin per product, average revenue per customer, upsell or cross-sell conversion rates.
� Process optimization
BPM technologies contribute to process optimization in the following ways:
– Real-time performance and KPI monitoring– Reusable services that can be combined in different ways– Automated workflow and rules-based dynamic assembly
25 The 2012 IBM CEO Study, Leading Through Connections, 2012: http://www-935.ibm.com/services/us/en/c-suite/ceostudy2012
26 Ibid
66 Applying Lean, Six Sigma, BPM, and SOA to Drive Business Results
– Easy to use analysis and simulation tools– Built-in continuous improvement capabilities
Rules can be used to trigger automated escalation processes or alerts if out-of-bounds conditions and process delays occur. They can also dynamically assemble process components and services based on the context and content of inbound messages or transactions. This capability can lower the costs of corrective action and the costs of manually processing the variation (such as geographical area, customer type, and order type).
To quantify this type of benefit, add up the following areas:
– The number of process exceptions and the average time required for rework and corrective action
– The number of manual and non-value adding steps, the time to perform them, and the average hourly rate of the required resources
– The number of inspections or approvals, on time delivery, and process wait time
Technical value is found in the following areas:
� Implementation costs
Implementation costs for an initial BPM improvement or design project can include hardware, software, training and education, contract services and consulting, and the labor time that is needed to design, build, and test the software code. SOAs can dramatically reduce labor costs over time through component reuse, if the components were designed for reuse and if good governance mechanisms are in place. Equation components include hardware or software investment depreciation, average project costs, resources, implementation time, and the number of rules changes and the time that is required to implement without automated business rules capability.
� Operations costs
From an IT perspective, operations costs include the administration of the technical environment, basic software code maintenance, software and hardware application upgrades, and ongoing training and education. Typically operations costs begin after the roll out of the first improvement phase and continue into the future, until the solution is changed or improved again or discontinued at the end of its lifecycle. If this situation occurs within the scope of the business case, you must show that these cashflows decline or disappear.
Linking the continued benefits of the BPM software investment to additional projects is critical because it is best to view it as an enterprise platform for use downstream. Similar to the investment in Lean Six Sigma, the returns build over time through reuse, improved process visibility, and increased flexibility. Some organizations require justification of a software investment by a single project. Although this justification is possible, it requires a large project. Including more projects in your business case spreads the investment and increases the benefit potential. Often companies have lists of projects in queue, many of which might benefit from workflow automation, system integration, rules-based automation, and improved visibility and management through monitoring.
Enabling Lean Six Sigma with business process management
BPM and SOAs complement and accelerate Lean Six Sigma improvement and results. BPM technologies offer new capabilities that enable Lean Six Sigma teams to be more creative in the design of improved and new processes and to deliver results to the business more quickly.
67
The biggest benefits come from the following sources:
� KPI dashboards that improve near real-time visibility into current performance and improvement results
� Reusable services that allow processes to be modeled and assembled from building blocks, speeding implementation, increasing flexibility, and lowering operating costs
� Automated workflows that rely on powerful process engines to manage human and system interactions and that alert process owners to exceptions as they occur
� Business rules and policies that replace manual decisions with automated selections and allow required business functionality to be dynamically assembled at run time
� Process modeling and simulation capability that minimizes the need to run risky and costly experiments in the production environment, while providing visibility into bottlenecks and constraints
The Lean Six Sigma and BPM Deployment Framework (Figure 7 on page 20) and the DMAIC walkthrough that follows it describe how these technologies and techniques work together in great detail. To help you get started, use the following practices, which are based on projects completed already with IBM Customers:
� Deploy basic Business Monitor KPI dashboards early to provide immediate visibility into the performance of a core process or key subprocess. Use these dashboards to identify constraints, target improvements, and verify results. Focus on customer-facing processes that are the source of satisfaction, dissatisfaction, or problem resolution. (Solving problems quickly builds loyalty.) Also, focus on process measures, not just people measures. Edwards Deming’s 94/6 rule states that 94 percent of problems can be traced to the system or process and our view has always been “hard on process, soft on people.”27
Add human workflow processes and business rules to address exceptions. Measure the time it takes to correct the exceptions. This data can then be used to aid project selection, and the workflows represent quick wins.
� Plan for a quick-win pilot, and assemble the right team. Because you want this project to be the first of many successful projects, select people who have the following attributes:
– Are respected by their peers– Have a natural willingness to share with others– Embody best practices
These people will, by their nature, encourage and enable others to adopt and use Lean Six Sigma methodologies and techniques with BPM and SOA tools and capabilities. Recognize and reward their accomplishments, and other people will duplicate what they do. Assign these individuals to later projects as mentors. Provide early training in BPM, SOA, and Lean Six Sigma to accelerate the learning and adoption curves. Over time, these individuals might go on to staff a BPM Center of Excellence.
� Choose the right process for your first combined BPM, SOA, and Lean Six Sigma project. Select a meaningful customer-facing process or key subprocess that makes a difference to business executives or is the source of customer dissatisfaction. Use simulation or other Lean Six Sigma techniques to uncover the core constraint and focus there to immediately improve the KPIs.
� Do not get trapped by departmental boundaries. Processes usually break at the edges, when data or responsibilities are transferred. Think systemically, and look for measures and KPIs that provide visibility into the larger process, across the boundary, and from the perspective of the customer, not just the department.
27 W. Edwards Deming, Out of the Crisis (First MIT Press, 2000)
68 Applying Lean, Six Sigma, BPM, and SOA to Drive Business Results
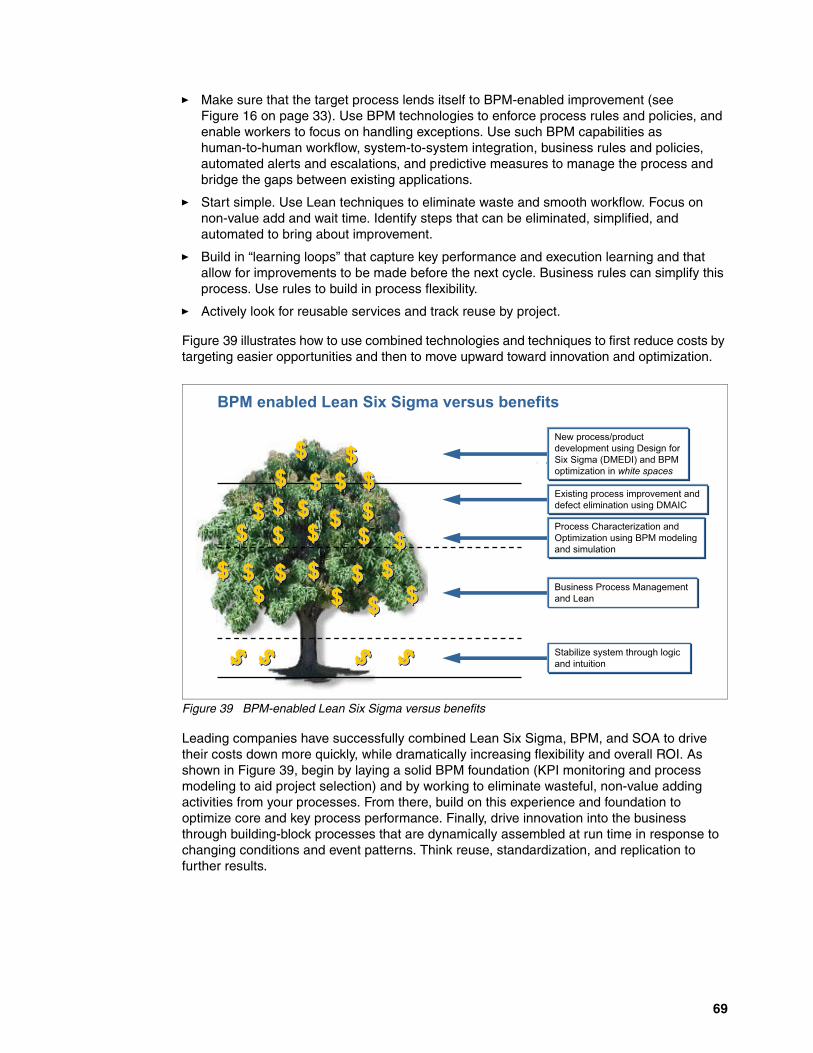
� Make sure that the target process lends itself to BPM-enabled improvement (see Figure 16 on page 33). Use BPM technologies to enforce process rules and policies, and enable workers to focus on handling exceptions. Use such BPM capabilities as human-to-human workflow, system-to-system integration, business rules and policies, automated alerts and escalations, and predictive measures to manage the process and bridge the gaps between existing applications.
� Start simple. Use Lean techniques to eliminate waste and smooth workflow. Focus on non-value add and wait time. Identify steps that can be eliminated, simplified, and automated to bring about improvement.
� Build in “learning loops” that capture key performance and execution learning and that allow for improvements to be made before the next cycle. Business rules can simplify this process. Use rules to build in process flexibility.
� Actively look for reusable services and track reuse by project.
Figure 39 illustrates how to use combined technologies and techniques to first reduce costs by targeting easier opportunities and then to move upward toward innovation and optimization.
Figure 39 BPM-enabled Lean Six Sigma versus benefits
Leading companies have successfully combined Lean Six Sigma, BPM, and SOA to drive their costs down more quickly, while dramatically increasing flexibility and overall ROI. As shown in Figure 39, begin by laying a solid BPM foundation (KPI monitoring and process modeling to aid project selection) and by working to eliminate wasteful, non-value adding activities from your processes. From there, build on this experience and foundation to optimize core and key process performance. Finally, drive innovation into the business through building-block processes that are dynamically assembled at run time in response to changing conditions and event patterns. Think reuse, standardization, and replication to further results.
BPM enabled Lean Six Sigma versus benefits
New process/productdevelopment using Design forSix Sigma (DMEDI) and BPMoptimization in white spaces
Existing process improvement anddefect elimination using DMAIC
Process Characterization andOptimization using BPM modelingand simulation
Business Process Managementand Lean
Stabilize system through logicand intuition
$$$
$$$$$$
$$$
$$$$$$$$$$$$$$$ $$$ $$$ $$$
$$$
$$$ $$$ $$$
$$$ $$$
$$$
$$$
$$$$$$$$$$$$
$$$$$$
$$$ $$$$$$
$$$
69
Other resources for more information
The following IBM Redbooks publications are associated with this Redguide publication:
� Combining Business Process Management and Enterprise Architecture for Better Business Outcomes, SG24-7947
� Discover, Interact, and Optimize for Smarter Healthcare with BPM Powered by Smart SOA, REDP-4691
� IBM Business Process Manager Security: Concepts and Guidance, SG24-8027
� IBM Business Process Manager V7.5 Production Topologies, SG24-7976
� IBM Business Process Manager V8.0 Performance and Tuning Best Practices, REDP-4935
� Implementing an Advanced Application Using Processes, Rules, Events, and Reports, SG24-8065
� Making Better Decisions Using IBM WebSphere Operational Decision Management, REDP-4836
� Scaling BPM Adoption: From Project to Program with IBM Business Process Manager, SG24-7973
� The Process Architect: The Smart Role in Business Process Management, REDP-4567
For more information about the products introduced in this guide, see the following web pages:
� IBM Business Process Manager
http://www.ibm.com/software/integration/business-process-manager
� IBM Business Monitor
http://www.ibm.com/software/integration/business-monitor
� IBM Operational Decision Manager
http://www.ibm.com/software/decision-management/operational-decision-management/websphere-operational-decision-management
� IBM Blueworks Live
https://www.blueworkslive.com/#!gettingStarted:overview
� IBM Operational Decision Manager
http://www.ibm.com/software/decision-management/operational-decision-management/websphere-operational-decision-management
� IBM WebSphere Registry and Repository
http://www.ibm.com/software/integration/wsrr
70 Applying Lean, Six Sigma, BPM, and SOA to Drive Business Results

The team who wrote this guide
This guide was produced by a team of specialists from around the world working with the International Technical Support Organization (ITSO).
Hans Skalle is a Senior BPM Sales Representative based in Minnesota in the US. He specializes in BPM and SOA technology, process improvement and innovation, and the development of financial models to support BPM, integration, mobile, cloud computing, and other advanced hardware and software investments. He has hands on, in-depth knowledge of various performance improvement methodologies including Lean, Six Sigma, Lean Sigma, Theory of Constraints, and other tools and techniques to drive and sustain continuous improvement and competitive advantage through change and innovation. Hans is a past Master Evaluator and Senior Site Team Lead for Minnesota’s Malcolm Baldrige-based Quality Award and has more than 30 years of process improvement design experience. Hans has written extensively on process improvement and technology. He holds a degree in Business Administration from the University of Wisconsin.
Bill Hahn is an IBM Business Process Manager Solution Architect with over 25 years of experience that spans the development labs, consulting services, and technical sales. Bill has worked with clients in Europe, Asia, and North America as a systems engineer, project leader, developer, solution architect and instructor. He is also an Open Group Master Certified/Distinguished IT Specialist.
Thanks to the authors of the original version of this publication Aligning Business Process Management, Service-Oriented Architecture and Lean Six Sigma for Real Business Results:
Hans SkalleSamuel AntounSeshadri RamachandraMarc SchusterVincent Szaloky
Thank you to the following people for their contributions to this project:
LindaMay PattersonIBM ITSO, Rochester, MN
Janine SneedIBM Software Group
71

72 Applying Lean, Six Sigma, BPM, and SOA to Drive Business Results

Notices
This information was developed for products and services offered in the U.S.A.
IBM may not offer the products, services, or features discussed in this document in other countries. Consult your local IBM representative for information on the products and services currently available in your area. Any reference to an IBM product, program, or service is not intended to state or imply that only that IBM product, program, or service may be used. Any functionally equivalent product, program, or service that does not infringe any IBM intellectual property right may be used instead. However, it is the user's responsibility to evaluate and verify the operation of any non-IBM product, program, or service.
IBM may have patents or pending patent applications covering subject matter described in this document. The furnishing of this document does not grant you any license to these patents. You can send license inquiries, in writing, to: IBM Director of Licensing, IBM Corporation, North Castle Drive, Armonk, NY 10504-1785 U.S.A.
The following paragraph does not apply to the United Kingdom or any other country where such provisions are inconsistent with local law: INTERNATIONAL BUSINESS MACHINES CORPORATION PROVIDES THIS PUBLICATION "AS IS" WITHOUT WARRANTY OF ANY KIND, EITHER EXPRESS OR IMPLIED, INCLUDING, BUT NOT LIMITED TO, THE IMPLIED WARRANTIES OF NON-INFRINGEMENT, MERCHANTABILITY OR FITNESS FOR A PARTICULAR PURPOSE. Some states do not allow disclaimer of express or implied warranties in certain transactions, therefore, this statement may not apply to you.
This information could include technical inaccuracies or typographical errors. Changes are periodically made to the information herein; these changes will be incorporated in new editions of the publication. IBM may make improvements and/or changes in the product(s) and/or the program(s) described in this publication at any time without notice.
Any references in this information to non-IBM Web sites are provided for convenience only and do not in any manner serve as an endorsement of those Web sites. The materials at those Web sites are not part of the materials for this IBM product and use of those Web sites is at your own risk.
IBM may use or distribute any of the information you supply in any way it believes appropriate without incurring any obligation to you.
Any performance data contained herein was determined in a controlled environment. Therefore, the results obtained in other operating environments may vary significantly. Some measurements may have been made on development-level systems and there is no guarantee that these measurements will be the same on generally available systems. Furthermore, some measurements may have been estimated through extrapolation. Actual results may vary. Users of this document should verify the applicable data for their specific environment.
Information concerning non-IBM products was obtained from the suppliers of those products, their published announcements or other publicly available sources. IBM has not tested those products and cannot confirm the accuracy of performance, compatibility or any other claims related to non-IBM products. Questions on the capabilities of non-IBM products should be addressed to the suppliers of those products.
This information contains examples of data and reports used in daily business operations. To illustrate them as completely as possible, the examples include the names of individuals, companies, brands, and products. All of these names are fictitious and any similarity to the names and addresses used by an actual business enterprise is entirely coincidental.
COPYRIGHT LICENSE:
This information contains sample application programs in source language, which illustrate programming techniques on various operating platforms. You may copy, modify, and distribute these sample programs in any form without payment to IBM, for the purposes of developing, using, marketing or distributing application programs conforming to the application programming interface for the operating platform for which the sample programs are written. These examples have not been thoroughly tested under all conditions. IBM, therefore, cannot guarantee or imply reliability, serviceability, or function of these programs.
© Copyright IBM Corp. 2013. All rights reserved. 73
This document, REDP-4447-01, was created or updated on April 18, 2013.
Trademarks
IBM, the IBM logo, and ibm.com are trademarks or registered trademarks of International Business Machines Corporation in the United States, other countries, or both. These and other IBM trademarked terms are marked on their first occurrence in this information with the appropriate symbol (® or ™), indicating US registered or common law trademarks owned by IBM at the time this information was published. Such trademarks may also be registered or common law trademarks in other countries. A current list of IBM trademarks is available on the Web at http://www.ibm.com/legal/copytrade.shtml
The following terms are trademarks of the International Business Machines Corporation in the United States, other countries, or both:
Blueworks Live™developerWorks®Global Business Services®Green Sigma™
IBM®Redbooks®Redguide™Redbooks (logo) ®
Smarter Healthcare®WebSphere®
The following terms are trademarks of other companies:
Microsoft, and the Windows logo are trademarks of Microsoft Corporation in the United States, other countries, or both.
Other company, product, or service names may be trademarks or service marks of others.
®
Redbooks®
74 Applying Lean, Six Sigma, BPM, and SOA to Drive Business Results