5logreg Beamer Online
137
Logistic Regression for Dichotomous Response Variables Edpsy/Psych/Soc 589 Carolyn J. Anderson Department of Educational Psychology ILLINOIS university of illinois at urbana-champaign c Board of Trustees, University of Illinois Spring 2014
-
Upload
cesar-lopez-godoy -
Category
Documents
-
view
645 -
download
10
description
Regresión
Transcript of 5logreg Beamer Online
Logistic Regression for Dichotomous ResponseVariables
Edpsy/Psych/Soc 589
Carolyn J. Anderson
Department of Educational Psychology
I L L I N O I Suniversity of illinois at urbana-champaign
c© Board of Trustees, University of Illinois
Spring 2014
Review Interpretation Inference Model checking. GOF Grouping Hosmer-Lemeshow LR ROC Residuals Influence Titanic
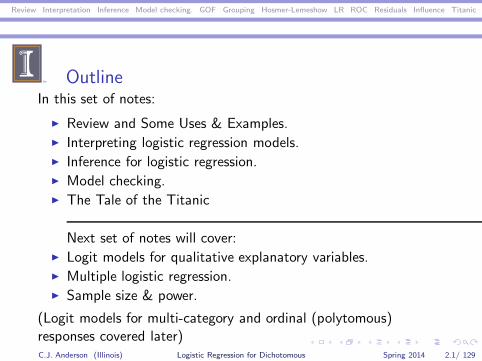
OutlineIn this set of notes:
◮ Review and Some Uses & Examples.◮ Interpreting logistic regression models.◮ Inference for logistic regression.◮ Model checking.◮ The Tale of the Titanic
Next set of notes will cover:◮ Logit models for qualitative explanatory variables.◮ Multiple logistic regression.◮ Sample size & power.
(Logit models for multi-category and ordinal (polytomous)responses covered later)C.J. Anderson (Illinois) Logistic Regression for Dichotomous Spring 2014 2.1/ 129
Review Interpretation Inference Model checking. GOF Grouping Hosmer-Lemeshow LR ROC Residuals Influence Titanic
Additional References & Data
◮ Collett, D. (1991). Analysis of Binary Data.
◮ Hosmer, D.W., & Lemeshow, S. (1989). Applied Logistic
Regression.
◮ McCullagh, P, & Nelder, J.A., (1989). Generalized Linear
Models, 2nd Edition.
◮ SAS Institute (1995). Logistic Regression Examples Using the
SAS System, Version 6.
Example data sets from SAS book are available via
◮ Anonymous ftp to ftp.sas.com.
◮ World wide web — http://www.sas.com
C.J. Anderson (Illinois) Logistic Regression for Dichotomous Spring 2014 3.1/ 129
Review Interpretation Inference Model checking. GOF Grouping Hosmer-Lemeshow LR ROC Residuals Influence Titanic
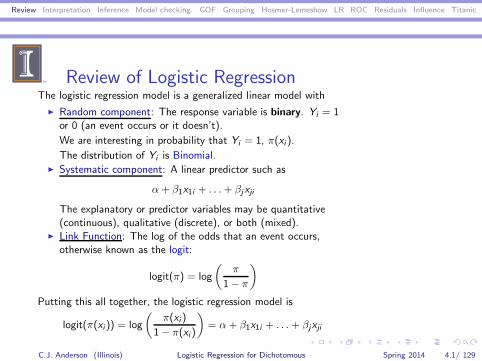
Review of Logistic RegressionThe logistic regression model is a generalized linear model with
◮ Random component: The response variable is binary. Yi = 1or 0 (an event occurs or it doesn’t).
We are interesting in probability that Yi = 1, π(xi ).
The distribution of Yi is Binomial.◮ Systematic component: A linear predictor such as
α+ β1x1i + . . .+ βjxji
The explanatory or predictor variables may be quantitative(continuous), qualitative (discrete), or both (mixed).
◮ Link Function: The log of the odds that an event occurs,otherwise known as the logit:
logit(π) = log
(π
1− π
)
Putting this all together, the logistic regression model is
logit(π(xi )) = log
(π(xi )
1− π(xi )
)= α+ β1x1i + . . . + βjxji
C.J. Anderson (Illinois) Logistic Regression for Dichotomous Spring 2014 4.1/ 129
Review Interpretation Inference Model checking. GOF Grouping Hosmer-Lemeshow LR ROC Residuals Influence Titanic
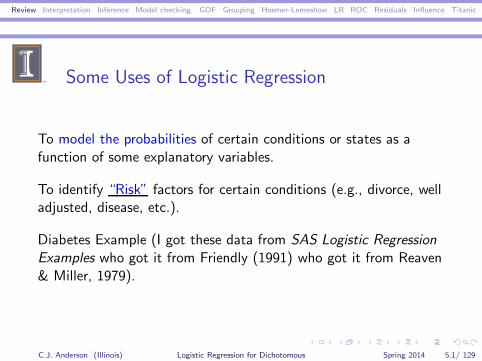
Some Uses of Logistic Regression
To model the probabilities of certain conditions or states as afunction of some explanatory variables.
To identify “Risk” factors for certain conditions (e.g., divorce, welladjusted, disease, etc.).
Diabetes Example (I got these data from SAS Logistic Regression
Examples who got it from Friendly (1991) who got it from Reaven& Miller, 1979).
C.J. Anderson (Illinois) Logistic Regression for Dichotomous Spring 2014 5.1/ 129
Review Interpretation Inference Model checking. GOF Grouping Hosmer-Lemeshow LR ROC Residuals Influence Titanic
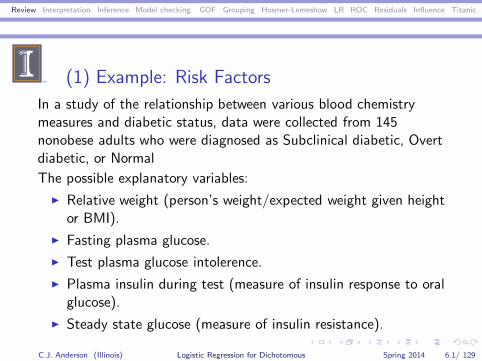
(1) Example: Risk Factors
In a study of the relationship between various blood chemistrymeasures and diabetic status, data were collected from 145nonobese adults who were diagnosed as Subclinical diabetic, Overtdiabetic, or Normal
The possible explanatory variables:
◮ Relative weight (person’s weight/expected weight given heightor BMI).
◮ Fasting plasma glucose.
◮ Test plasma glucose intolerence.
◮ Plasma insulin during test (measure of insulin response to oralglucose).
◮ Steady state glucose (measure of insulin resistance).
C.J. Anderson (Illinois) Logistic Regression for Dichotomous Spring 2014 6.1/ 129
Review Interpretation Inference Model checking. GOF Grouping Hosmer-Lemeshow LR ROC Residuals Influence Titanic
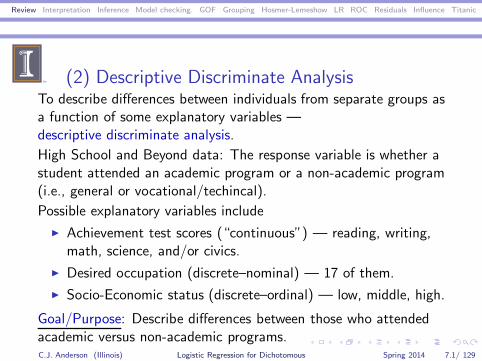
(2) Descriptive Discriminate AnalysisTo describe differences between individuals from separate groups asa function of some explanatory variables —descriptive discriminate analysis.
High School and Beyond data: The response variable is whether astudent attended an academic program or a non-academic program(i.e., general or vocational/techincal).
Possible explanatory variables include
◮ Achievement test scores (“continuous”) — reading, writing,math, science, and/or civics.
◮ Desired occupation (discrete–nominal) — 17 of them.
◮ Socio-Economic status (discrete–ordinal) — low, middle, high.
Goal/Purpose: Describe differences between those who attendedacademic versus non-academic programs.C.J. Anderson (Illinois) Logistic Regression for Dichotomous Spring 2014 7.1/ 129
Review Interpretation Inference Model checking. GOF Grouping Hosmer-Lemeshow LR ROC Residuals Influence Titanic
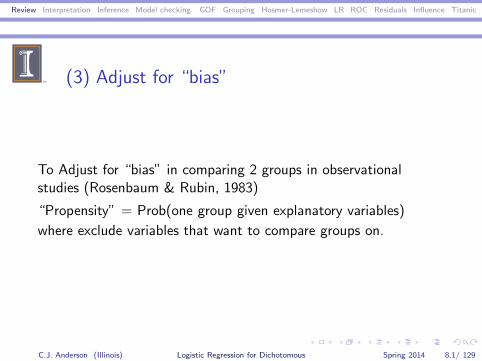
(3) Adjust for “bias”
To Adjust for “bias” in comparing 2 groups in observationalstudies (Rosenbaum & Rubin, 1983)
“Propensity” = Prob(one group given explanatory variables)
where exclude variables that want to compare groups on.
C.J. Anderson (Illinois) Logistic Regression for Dichotomous Spring 2014 8.1/ 129

Review Interpretation Inference Model checking. GOF Grouping Hosmer-Lemeshow LR ROC Residuals Influence Titanic
(4) Predict ProbabilitiesTo predict probabilities that individuals fall into one of 2 categories on adichotomous response variable as a function of some set of explanatoryvariables.
This covers lots of studies (from epidemiological to educationalmeasurement).
C.J. Anderson (Illinois) Logistic Regression for Dichotomous Spring 2014 9.1/ 129
Review Interpretation Inference Model checking. GOF Grouping Hosmer-Lemeshow LR ROC Residuals Influence Titanic
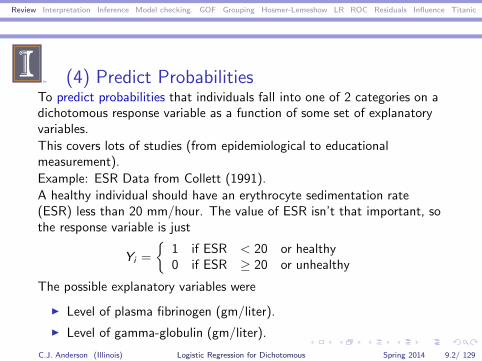
(4) Predict ProbabilitiesTo predict probabilities that individuals fall into one of 2 categories on adichotomous response variable as a function of some set of explanatoryvariables.
This covers lots of studies (from epidemiological to educationalmeasurement).
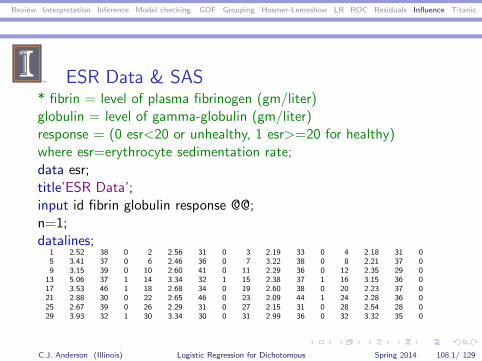
Example: ESR Data from Collett (1991).
A healthy individual should have an erythrocyte sedimentation rate(ESR) less than 20 mm/hour. The value of ESR isn’t that important, sothe response variable is just
Yi =
{1 if ESR < 20 or healthy0 if ESR ≥ 20 or unhealthy
The possible explanatory variables were
◮ Level of plasma fibrinogen (gm/liter).
◮ Level of gamma-globulin (gm/liter).
C.J. Anderson (Illinois) Logistic Regression for Dichotomous Spring 2014 9.2/ 129
Review Interpretation Inference Model checking. GOF Grouping Hosmer-Lemeshow LR ROC Residuals Influence Titanic
(4) Predict Probabilities
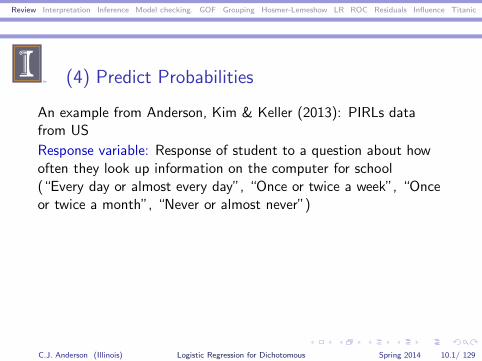
An example from Anderson, Kim & Keller (2013): PIRLs datafrom US
Response variable: Response of student to a question about howoften they look up information on the computer for school(“Every day or almost every day”, “Once or twice a week”, “Onceor twice a month”, “Never or almost never”)
C.J. Anderson (Illinois) Logistic Regression for Dichotomous Spring 2014 10.1/ 129
Review Interpretation Inference Model checking. GOF Grouping Hosmer-Lemeshow LR ROC Residuals Influence Titanic
(4) Predict Probabilities
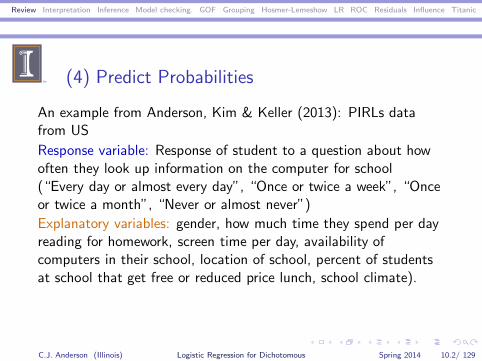
An example from Anderson, Kim & Keller (2013): PIRLs datafrom US
Response variable: Response of student to a question about howoften they look up information on the computer for school(“Every day or almost every day”, “Once or twice a week”, “Onceor twice a month”, “Never or almost never”)
Explanatory variables: gender, how much time they spend per dayreading for homework, screen time per day, availability ofcomputers in their school, location of school, percent of studentsat school that get free or reduced price lunch, school climate).
C.J. Anderson (Illinois) Logistic Regression for Dichotomous Spring 2014 10.2/ 129
Review Interpretation Inference Model checking. GOF Grouping Hosmer-Lemeshow LR ROC Residuals Influence Titanic
(4) Predict Probabilities
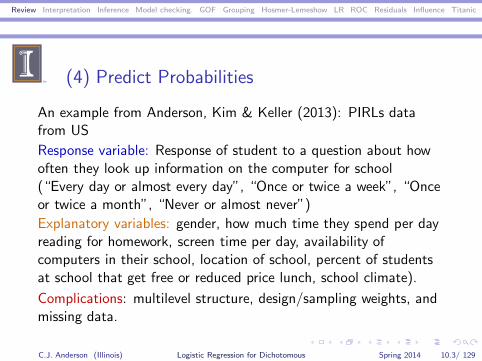
An example from Anderson, Kim & Keller (2013): PIRLs datafrom US
Response variable: Response of student to a question about howoften they look up information on the computer for school(“Every day or almost every day”, “Once or twice a week”, “Onceor twice a month”, “Never or almost never”)
Explanatory variables: gender, how much time they spend per dayreading for homework, screen time per day, availability ofcomputers in their school, location of school, percent of studentsat school that get free or reduced price lunch, school climate).
Complications: multilevel structure, design/sampling weights, andmissing data.
C.J. Anderson (Illinois) Logistic Regression for Dichotomous Spring 2014 10.3/ 129
Review Interpretation Inference Model checking. GOF Grouping Hosmer-Lemeshow LR ROC Residuals Influence Titanic
(5) Classify IndividualsTo classify individuals into one of 2 categories on the basis of theexplanatory variables.
Effron (1975), Press & Wilson (1978), and Amemiy & Powell(1980) compared logistic regression to discriminant analysis (whichassumes the explanatory variables are multivariate normal at eachlevel of the response variable).
Eshan Bokhari (2014): Compared logistic regressions & discriminantanalysis for identifying who will commit violent act. (Bokari &Hubert method seems to be best).
C.J. Anderson (Illinois) Logistic Regression for Dichotomous Spring 2014 11.1/ 129
Review Interpretation Inference Model checking. GOF Grouping Hosmer-Lemeshow LR ROC Residuals Influence Titanic
(6) Discrete ChoiceTo analyze responses from discrete choice studies (estimate choiceprobabilities).
From SAS Logistic Regression Examples (hypothetical).
Chocolate Candy: 10 subjects presented 8 different chocolateschoose which one of the 8 is the one that they like the best. The 8chocolates consisted of 23 combinations of
◮ Type of chocloate (milk or dark).◮ Center (hard or soft).◮ Whether is had nuts or not.
The response is which chocolate most preferred.
C.J. Anderson (Illinois) Logistic Regression for Dichotomous Spring 2014 12.1/ 129
Review Interpretation Inference Model checking. GOF Grouping Hosmer-Lemeshow LR ROC Residuals Influence Titanic
(6) Discrete Choice (continued)
The different names for this particular logit model are
◮ The multinomial logit model.
◮ McFadden’s model.
◮ Conditional logit model.
This model is related to Bradley-Terry-Luce choice model.
This model is used
◮ To analyze choice data and use characteristics of the objectsor attributes of the subject as predictors of choice behavior.
◮ In marketing research to predict consumer behavior.
◮ As an alternative to conjoint analysis.
C.J. Anderson (Illinois) Logistic Regression for Dichotomous Spring 2014 13.1/ 129
Review Interpretation Inference Model checking. GOF Grouping Hosmer-Lemeshow LR ROC Residuals Influence Titanic
(7) Social Network Analysis◮ Data often consist of individuals (people, organizations,
countries, etc.) within a group or network upon which relationsare recorded (e.g., is friends with, talks to, does business with,trades, etc).
◮ The relations can be◮ Undirected (e.g., is biologically related to)◮ Directed (e.g., asks advise from, gives money to)
◮ Example: Data from Parker & Asher (1993). Children in 35different classes were asked who they were friends with (in theclass). Other measures were also taken, including gender, race,a loneliness or “connectedness” measure, and others.
◮ This sort of data is often organized in a “sociomatrix”, whichconsists of a matrix of binary random variables:
Xij =
{1 if i chooses j0 otherwise
C.J. Anderson (Illinois) Logistic Regression for Dichotomous Spring 2014 14.1/ 129
Review Interpretation Inference Model checking. GOF Grouping Hosmer-Lemeshow LR ROC Residuals Influence Titanic
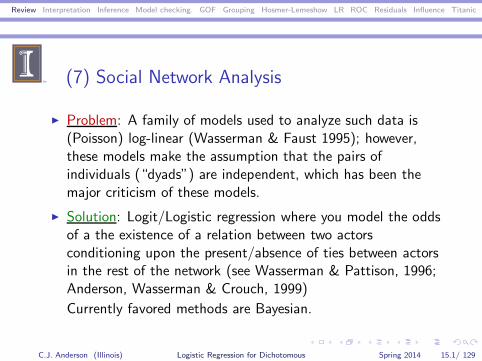
(7) Social Network Analysis
◮ Problem: A family of models used to analyze such data is(Poisson) log-linear (Wasserman & Faust 1995); however,these models make the assumption that the pairs ofindividuals (“dyads”) are independent, which has been themajor criticism of these models.
◮ Solution: Logit/Logistic regression where you model the oddsof a the existence of a relation between two actorsconditioning upon the present/absence of ties between actorsin the rest of the network (see Wasserman & Pattison, 1996;Anderson, Wasserman & Crouch, 1999)
Currently favored methods are Bayesian.
C.J. Anderson (Illinois) Logistic Regression for Dichotomous Spring 2014 15.1/ 129
Review Interpretation Inference Model checking. GOF Grouping Hosmer-Lemeshow LR ROC Residuals Influence Titanic
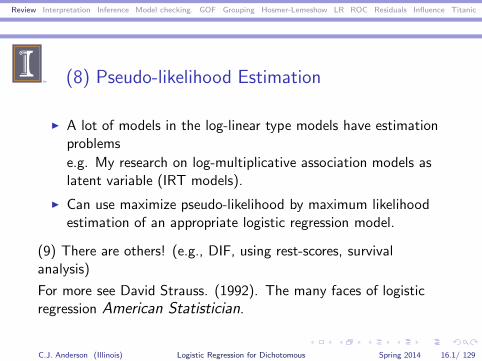
(8) Pseudo-likelihood Estimation
◮ A lot of models in the log-linear type models have estimationproblems
e.g. My research on log-multiplicative association models aslatent variable (IRT models).
◮ Can use maximize pseudo-likelihood by maximum likelihoodestimation of an appropriate logistic regression model.
(9) There are others! (e.g., DIF, using rest-scores, survivalanalysis)
For more see David Strauss. (1992). The many faces of logisticregression American Statistician.
C.J. Anderson (Illinois) Logistic Regression for Dichotomous Spring 2014 16.1/ 129
Review Interpretation Inference Model checking. GOF Grouping Hosmer-Lemeshow LR ROC Residuals Influence Titanic
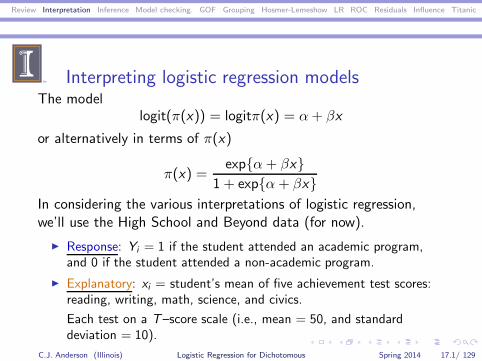
Interpreting logistic regression modelsThe model
logit(π(x)) = logitπ(x) = α+ βx
or alternatively in terms of π(x)
π(x) =exp{α+ βx}
1 + exp{α+ βx}In considering the various interpretations of logistic regression,we’ll use the High School and Beyond data (for now).
◮ Response: Yi = 1 if the student attended an academic program,and 0 if the student attended a non-academic program.
◮ Explanatory: xi = student’s mean of five achievement test scores:reading, writing, math, science, and civics.
Each test on a T–score scale (i.e., mean = 50, and standarddeviation = 10).
C.J. Anderson (Illinois) Logistic Regression for Dichotomous Spring 2014 17.1/ 129
Review Interpretation Inference Model checking. GOF Grouping Hosmer-Lemeshow LR ROC Residuals Influence Titanic
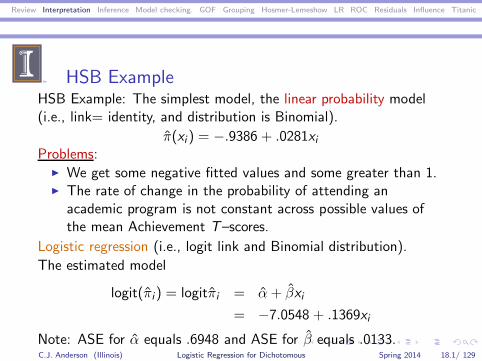
HSB ExampleHSB Example: The simplest model, the linear probability model(i.e., link= identity, and distribution is Binomial).
π(xi ) = −.9386 + .0281xiProblems:
◮ We get some negative fitted values and some greater than 1.◮ The rate of change in the probability of attending an
academic program is not constant across possible values ofthe mean Achievement T–scores.
Logistic regression (i.e., logit link and Binomial distribution).
The estimated model
logit(πi) = logitπi = α+ βxi
= −7.0548 + .1369xi
Note: ASE for α equals .6948 and ASE for β equals .0133.C.J. Anderson (Illinois) Logistic Regression for Dichotomous Spring 2014 18.1/ 129
Review Interpretation Inference Model checking. GOF Grouping Hosmer-Lemeshow LR ROC Residuals Influence Titanic
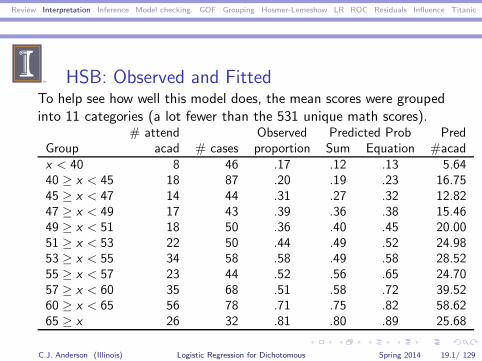
HSB: Observed and FittedTo help see how well this model does, the mean scores were groupedinto 11 categories (a lot fewer than the 531 unique math scores).
# attend Observed Predicted Prob PredGroup acad # cases proportion Sum Equation #acadx < 40 8 46 .17 .12 .13 5.6440 ≥ x < 45 18 87 .20 .19 .23 16.7545 ≥ x < 47 14 44 .31 .27 .32 12.8247 ≥ x < 49 17 43 .39 .36 .38 15.4649 ≥ x < 51 18 50 .36 .40 .45 20.0051 ≥ x < 53 22 50 .44 .49 .52 24.9853 ≥ x < 55 34 58 .58 .49 .58 28.5255 ≥ x < 57 23 44 .52 .56 .65 24.7057 ≥ x < 60 35 68 .51 .58 .72 39.5260 ≥ x < 65 56 78 .71 .75 .82 58.6265 ≥ x 26 32 .81 .80 .89 25.68
C.J. Anderson (Illinois) Logistic Regression for Dichotomous Spring 2014 19.1/ 129
Review Interpretation Inference Model checking. GOF Grouping Hosmer-Lemeshow LR ROC Residuals Influence Titanic
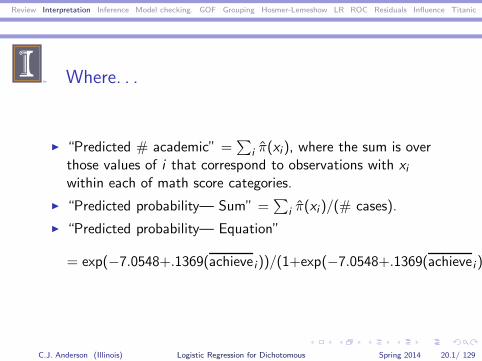
Where. . .
◮ “Predicted # academic” =∑
i π(xi), where the sum is overthose values of i that correspond to observations with xiwithin each of math score categories.
◮ “Predicted probability— Sum” =∑
i π(xi )/(# cases).
◮ “Predicted probability— Equation”
= exp(−7.0548+.1369(achieve i))/(1+exp(−7.0548+.1369(achievei )))
C.J. Anderson (Illinois) Logistic Regression for Dichotomous Spring 2014 20.1/ 129
Review Interpretation Inference Model checking. GOF Grouping Hosmer-Lemeshow LR ROC Residuals Influence Titanic
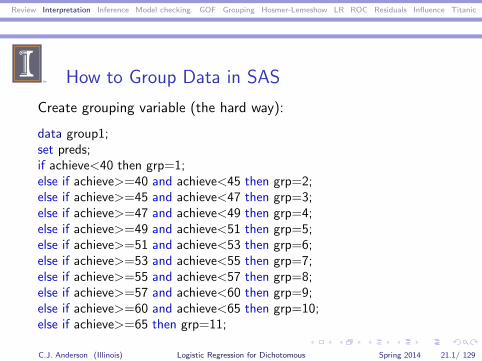
How to Group Data in SAS
Create grouping variable (the hard way):
data group1;set preds;if achieve<40 then grp=1;else if achieve>=40 and achieve<45 then grp=2;else if achieve>=45 and achieve<47 then grp=3;else if achieve>=47 and achieve<49 then grp=4;else if achieve>=49 and achieve<51 then grp=5;else if achieve>=51 and achieve<53 then grp=6;else if achieve>=53 and achieve<55 then grp=7;else if achieve>=55 and achieve<57 then grp=8;else if achieve>=57 and achieve<60 then grp=9;else if achieve>=60 and achieve<65 then grp=10;else if achieve>=65 then grp=11;
C.J. Anderson (Illinois) Logistic Regression for Dichotomous Spring 2014 21.1/ 129
Review Interpretation Inference Model checking. GOF Grouping Hosmer-Lemeshow LR ROC Residuals Influence Titanic
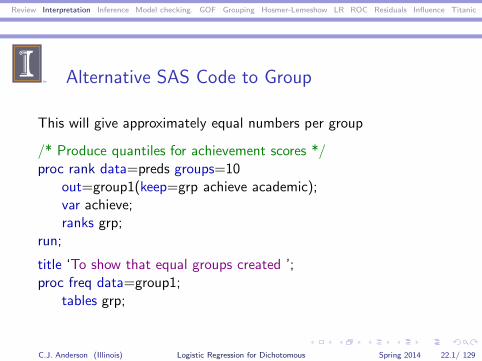
Alternative SAS Code to Group
This will give approximately equal numbers per group
/* Produce quantiles for achievement scores */proc rank data=preds groups=10
out=group1(keep=grp achieve academic);var achieve;ranks grp;
run;
title ‘To show that equal groups created ’;proc freq data=group1;
tables grp;
C.J. Anderson (Illinois) Logistic Regression for Dichotomous Spring 2014 22.1/ 129
Review Interpretation Inference Model checking. GOF Grouping Hosmer-Lemeshow LR ROC Residuals Influence Titanic
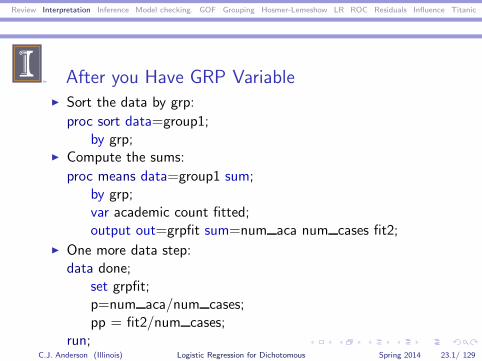
After you Have GRP Variable◮ Sort the data by grp:
proc sort data=group1;by grp;
◮ Compute the sums:
proc means data=group1 sum;by grp;var academic count fitted;output out=grpfit sum=num aca num cases fit2;
◮ One more data step:data done;
set grpfit;p=num aca/num cases;pp = fit2/num cases;
run;C.J. Anderson (Illinois) Logistic Regression for Dichotomous Spring 2014 23.1/ 129
Review Interpretation Inference Model checking. GOF Grouping Hosmer-Lemeshow LR ROC Residuals Influence Titanic
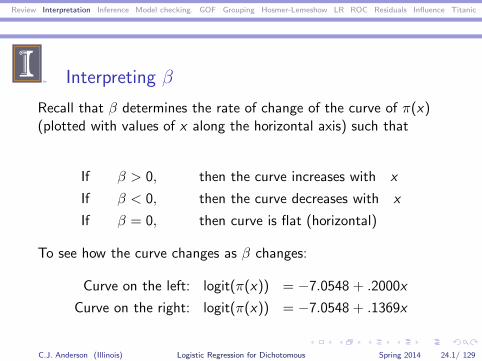
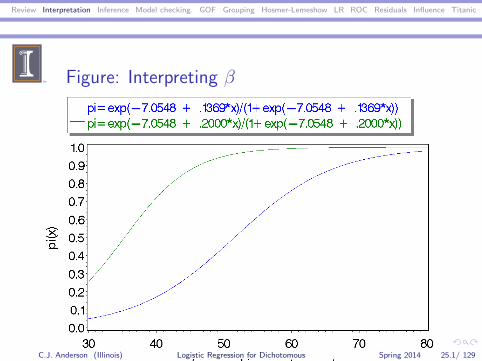
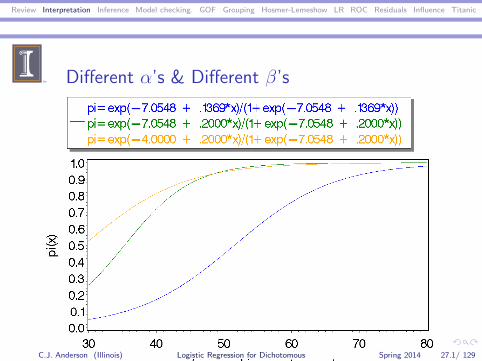
Interpreting β
Recall that β determines the rate of change of the curve of π(x)(plotted with values of x along the horizontal axis) such that
If β > 0, then the curve increases with x
If β < 0, then the curve decreases with x
If β = 0, then curve is flat (horizontal)
To see how the curve changes as β changes:
Curve on the left: logit(π(x)) = −7.0548 + .2000x
Curve on the right: logit(π(x)) = −7.0548 + .1369x
C.J. Anderson (Illinois) Logistic Regression for Dichotomous Spring 2014 24.1/ 129
Review Interpretation Inference Model checking. GOF Grouping Hosmer-Lemeshow LR ROC Residuals Influence Titanic
Figure: Interpreting β
C.J. Anderson (Illinois) Logistic Regression for Dichotomous Spring 2014 25.1/ 129
Review Interpretation Inference Model checking. GOF Grouping Hosmer-Lemeshow LR ROC Residuals Influence Titanic
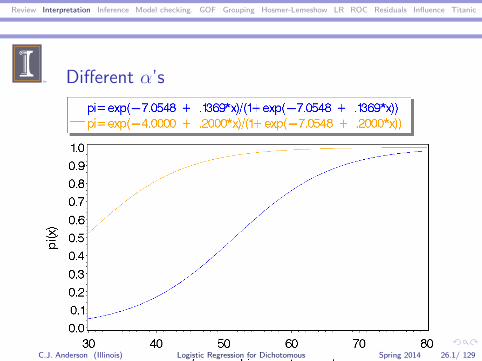
Different α’s
C.J. Anderson (Illinois) Logistic Regression for Dichotomous Spring 2014 26.1/ 129
Review Interpretation Inference Model checking. GOF Grouping Hosmer-Lemeshow LR ROC Residuals Influence Titanic
Different α’s & Different β’s
C.J. Anderson (Illinois) Logistic Regression for Dichotomous Spring 2014 27.1/ 129
Review Interpretation Inference Model checking. GOF Grouping Hosmer-Lemeshow LR ROC Residuals Influence Titanic
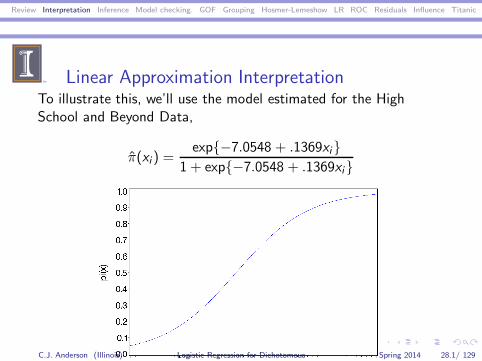
Linear Approximation InterpretationTo illustrate this, we’ll use the model estimated for the HighSchool and Beyond Data,
π(xi ) =exp{−7.0548 + .1369xi}
1 + exp{−7.0548 + .1369xi}
C.J. Anderson (Illinois) Logistic Regression for Dichotomous Spring 2014 28.1/ 129
Review Interpretation Inference Model checking. GOF Grouping Hosmer-Lemeshow LR ROC Residuals Influence Titanic
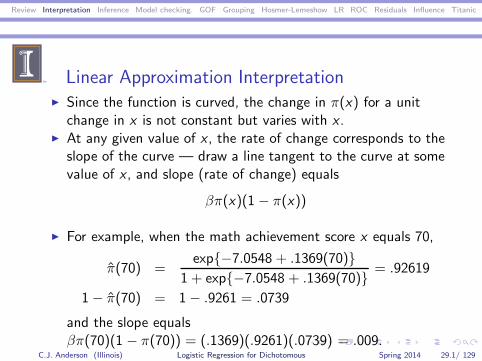
Linear Approximation Interpretation◮ Since the function is curved, the change in π(x) for a unit
change in x is not constant but varies with x .◮ At any given value of x , the rate of change corresponds to the
slope of the curve — draw a line tangent to the curve at somevalue of x , and slope (rate of change) equals
βπ(x)(1 − π(x))
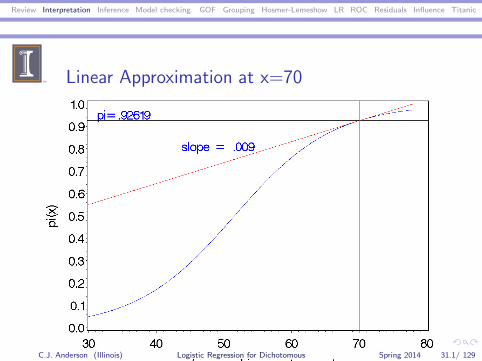
◮ For example, when the math achievement score x equals 70,
π(70) =exp{−7.0548 + .1369(70)}
1 + exp{−7.0548 + .1369(70)} = .92619
1− π(70) = 1− .9261 = .0739
and the slope equalsβπ(70)(1 − π(70)) = (.1369)(.9261)(.0739) = .009.
C.J. Anderson (Illinois) Logistic Regression for Dichotomous Spring 2014 29.1/ 129
Review Interpretation Inference Model checking. GOF Grouping Hosmer-Lemeshow LR ROC Residuals Influence Titanic
Linear Approximation at x=70
C.J. Anderson (Illinois) Logistic Regression for Dichotomous Spring 2014 30.1/ 129
Review Interpretation Inference Model checking. GOF Grouping Hosmer-Lemeshow LR ROC Residuals Influence Titanic
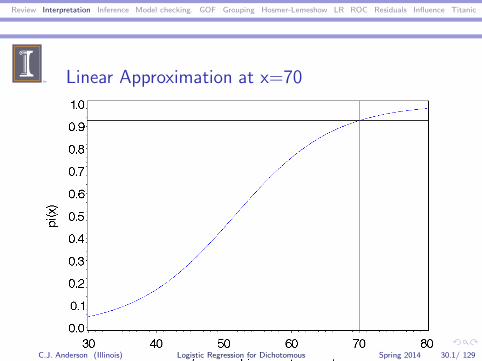
Linear Approximation at x=70
C.J. Anderson (Illinois) Logistic Regression for Dichotomous Spring 2014 31.1/ 129
Review Interpretation Inference Model checking. GOF Grouping Hosmer-Lemeshow LR ROC Residuals Influence Titanic
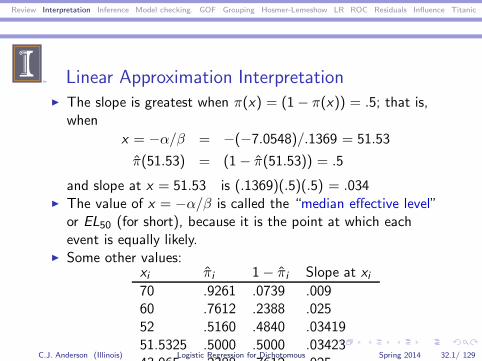
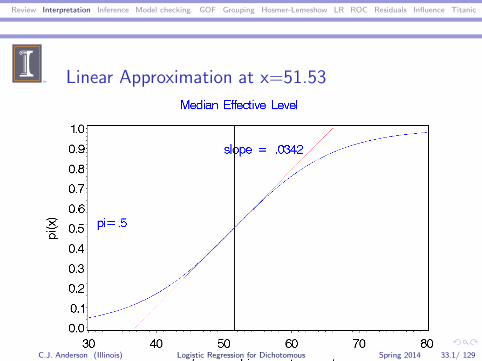
Linear Approximation Interpretation◮ The slope is greatest when π(x) = (1− π(x)) = .5; that is,
when
x = −α/β = −(−7.0548)/.1369 = 51.53
π(51.53) = (1− π(51.53)) = .5
and slope at x = 51.53 is (.1369)(.5)(.5) = .034◮ The value of x = −α/β is called the “median effective level”
or EL50 (for short), because it is the point at which eachevent is equally likely.
◮ Some other values:xi πi 1− πi Slope at xi70 .9261 .0739 .00960 .7612 .2388 .02552 .5160 .4840 .0341951.5325 .5000 .5000 .0342343.065 .2388 .7612 .025
C.J. Anderson (Illinois) Logistic Regression for Dichotomous Spring 2014 32.1/ 129
Review Interpretation Inference Model checking. GOF Grouping Hosmer-Lemeshow LR ROC Residuals Influence Titanic
Linear Approximation at x=51.53
C.J. Anderson (Illinois) Logistic Regression for Dichotomous Spring 2014 33.1/ 129
Review Interpretation Inference Model checking. GOF Grouping Hosmer-Lemeshow LR ROC Residuals Influence Titanic
Odds Ratio InterpretationA somewhat simpler & more natural interpretation of logit/logisticregression models,
logit(π(x)) = logit(π(x)) = α+ βx
◮ Taking the exponential of both sides,
π(x)
1− π(x)= exp{α+ βx} = eαeβx
◮ This is a model for odds; Odds ↑ multiplicatively with x .
◮ A 1 unit increase in x leads to an increase in the odds of eβ .So the odds ratio for a 1 unit increase in x equals
π(x + 1)/(1 − π(x + 1))
π(x)/(1 − π(x))= eβ
C.J. Anderson (Illinois) Logistic Regression for Dichotomous Spring 2014 34.1/ 129
Review Interpretation Inference Model checking. GOF Grouping Hosmer-Lemeshow LR ROC Residuals Influence Titanic
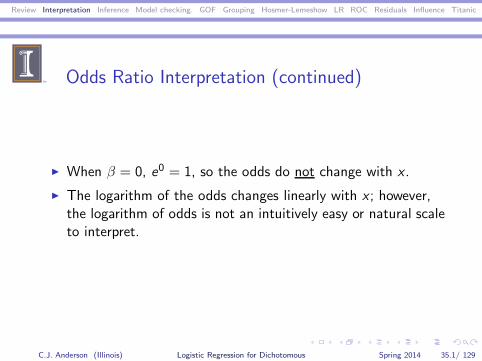
Odds Ratio Interpretation (continued)
◮ When β = 0, e0 = 1, so the odds do not change with x .
◮ The logarithm of the odds changes linearly with x ; however,the logarithm of odds is not an intuitively easy or natural scaleto interpret.
C.J. Anderson (Illinois) Logistic Regression for Dichotomous Spring 2014 35.1/ 129
Review Interpretation Inference Model checking. GOF Grouping Hosmer-Lemeshow LR ROC Residuals Influence Titanic
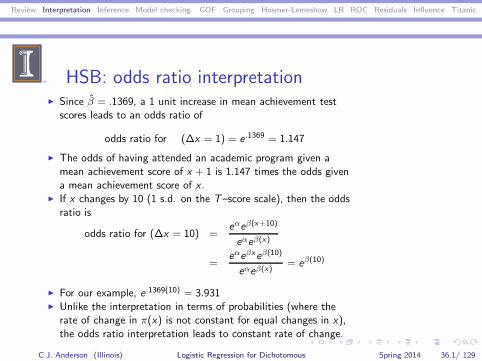
HSB: odds ratio interpretation◮ Since β = .1369, a 1 unit increase in mean achievement test
scores leads to an odds ratio of
odds ratio for (∆x = 1) = e.1369 = 1.147
◮ The odds of having attended an academic program given amean achievement score of x + 1 is 1.147 times the odds givena mean achievement score of x .
◮ If x changes by 10 (1 s.d. on the T–score scale), then the oddsratio is
odds ratio for (∆x = 10) =eαeβ(x+10)
eαeβ(x)
=eαeβxeβ(10)
eαeβ(x)= eβ(10)
◮ For our example, e.1369(10) = 3.931◮ Unlike the interpretation in terms of probabilities (where the
rate of change in π(x) is not constant for equal changes in x),the odds ratio interpretation leads to constant rate of change.
C.J. Anderson (Illinois) Logistic Regression for Dichotomous Spring 2014 36.1/ 129
Review Interpretation Inference Model checking. GOF Grouping Hosmer-Lemeshow LR ROC Residuals Influence Titanic
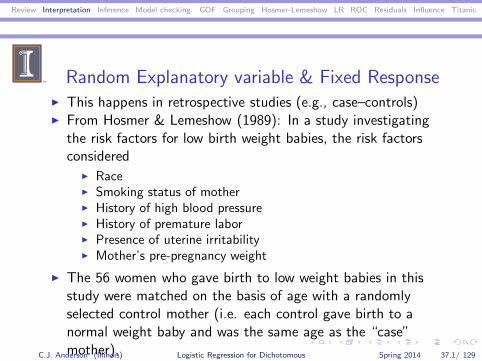
Random Explanatory variable & Fixed Response◮ This happens in retrospective studies (e.g., case–controls)◮ From Hosmer & Lemeshow (1989): In a study investigating
the risk factors for low birth weight babies, the risk factorsconsidered
◮ Race◮ Smoking status of mother◮ History of high blood pressure◮ History of premature labor◮ Presence of uterine irritability◮ Mother’s pre-pregnancy weight
◮ The 56 women who gave birth to low weight babies in thisstudy were matched on the basis of age with a randomlyselected control mother (i.e. each control gave birth to anormal weight baby and was the same age as the “case”mother).C.J. Anderson (Illinois) Logistic Regression for Dichotomous Spring 2014 37.1/ 129
Review Interpretation Inference Model checking. GOF Grouping Hosmer-Lemeshow LR ROC Residuals Influence Titanic
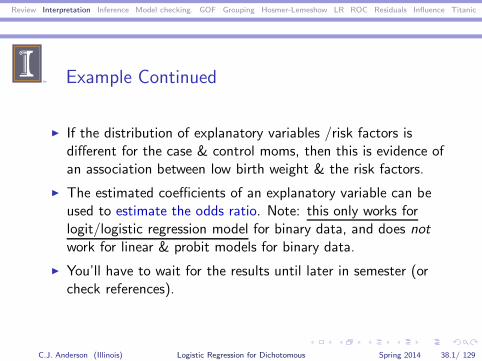
Example Continued
◮ If the distribution of explanatory variables /risk factors isdifferent for the case & control moms, then this is evidence ofan association between low birth weight & the risk factors.
◮ The estimated coefficients of an explanatory variable can beused to estimate the odds ratio. Note: this only works forlogit/logistic regression model for binary data, and does notwork for linear & probit models for binary data.
◮ You’ll have to wait for the results until later in semester (orcheck references).
C.J. Anderson (Illinois) Logistic Regression for Dichotomous Spring 2014 38.1/ 129
Review Interpretation Inference Model checking. GOF Grouping Hosmer-Lemeshow LR ROC Residuals Influence Titanic
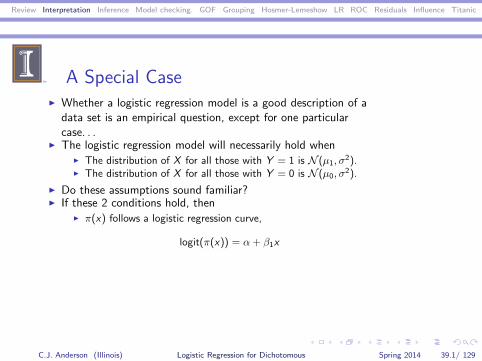
A Special Case◮ Whether a logistic regression model is a good description of a
data set is an empirical question, except for one particularcase. . .
◮ The logistic regression model will necessarily hold when◮ The distribution of X for all those with Y = 1 is N (µ1, σ
2).◮ The distribution of X for all those with Y = 0 is N (µ0, σ
2).
◮ Do these assumptions sound familiar?◮ If these 2 conditions hold, then
◮ π(x) follows a logistic regression curve,
logit(π(x)) = α+ β1x
C.J. Anderson (Illinois) Logistic Regression for Dichotomous Spring 2014 39.1/ 129
Review Interpretation Inference Model checking. GOF Grouping Hosmer-Lemeshow LR ROC Residuals Influence Titanic
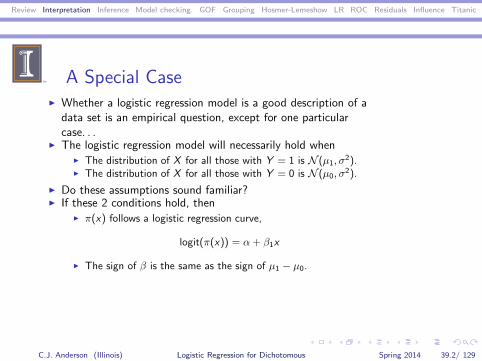
A Special Case◮ Whether a logistic regression model is a good description of a
data set is an empirical question, except for one particularcase. . .
◮ The logistic regression model will necessarily hold when◮ The distribution of X for all those with Y = 1 is N (µ1, σ
2).◮ The distribution of X for all those with Y = 0 is N (µ0, σ
2).
◮ Do these assumptions sound familiar?◮ If these 2 conditions hold, then
◮ π(x) follows a logistic regression curve,
logit(π(x)) = α+ β1x
◮ The sign of β is the same as the sign of µ1 − µ0.
C.J. Anderson (Illinois) Logistic Regression for Dichotomous Spring 2014 39.2/ 129
Review Interpretation Inference Model checking. GOF Grouping Hosmer-Lemeshow LR ROC Residuals Influence Titanic
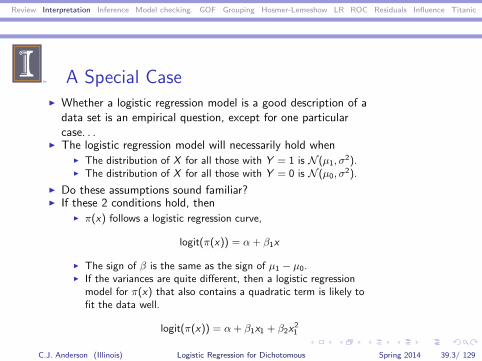
A Special Case◮ Whether a logistic regression model is a good description of a
data set is an empirical question, except for one particularcase. . .
◮ The logistic regression model will necessarily hold when◮ The distribution of X for all those with Y = 1 is N (µ1, σ
2).◮ The distribution of X for all those with Y = 0 is N (µ0, σ
2).
◮ Do these assumptions sound familiar?◮ If these 2 conditions hold, then
◮ π(x) follows a logistic regression curve,
logit(π(x)) = α+ β1x
◮ The sign of β is the same as the sign of µ1 − µ0.◮ If the variances are quite different, then a logistic regression
model for π(x) that also contains a quadratic term is likely tofit the data well.
logit(π(x)) = α+ β1x1 + β2x21
C.J. Anderson (Illinois) Logistic Regression for Dichotomous Spring 2014 39.3/ 129
Review Interpretation Inference Model checking. GOF Grouping Hosmer-Lemeshow LR ROC Residuals Influence Titanic
Inference for logistic regression
Or the significance and size of effects
1. Confidence intervals for parameters.
2. Hypothesis testing.
3. Distribution of probability estimates.
(1) and (2) will follow much like what we did for Poissonregression. (3) will be a bit different.
C.J. Anderson (Illinois) Logistic Regression for Dichotomous Spring 2014 40.1/ 129
Review Interpretation Inference Model checking. GOF Grouping Hosmer-Lemeshow LR ROC Residuals Influence Titanic
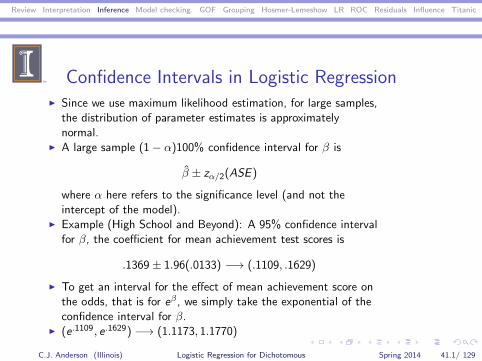
Confidence Intervals in Logistic Regression◮ Since we use maximum likelihood estimation, for large samples,
the distribution of parameter estimates is approximatelynormal.
◮ A large sample (1− α)100% confidence interval for β is
β ± zα/2(ASE )
where α here refers to the significance level (and not theintercept of the model).
◮ Example (High School and Beyond): A 95% confidence intervalfor β, the coefficient for mean achievement test scores is
.1369 ± 1.96(.0133) −→ (.1109, .1629)
◮ To get an interval for the effect of mean achievement score onthe odds, that is for eβ , we simply take the exponential of theconfidence interval for β.
◮ (e.1109, e.1629) −→ (1.1173, 1.1770)
C.J. Anderson (Illinois) Logistic Regression for Dichotomous Spring 2014 41.1/ 129
Review Interpretation Inference Model checking. GOF Grouping Hosmer-Lemeshow LR ROC Residuals Influence Titanic
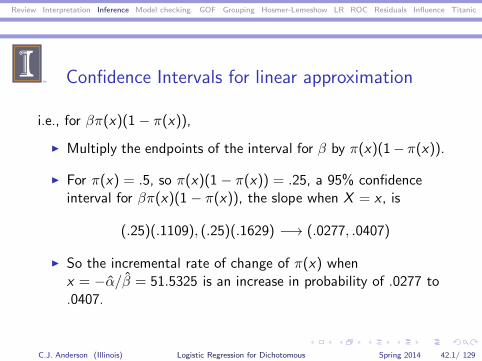
Confidence Intervals for linear approximation
i.e., for βπ(x)(1 − π(x)),
◮ Multiply the endpoints of the interval for β by π(x)(1− π(x)).
◮ For π(x) = .5, so π(x)(1 − π(x)) = .25, a 95% confidenceinterval for βπ(x)(1 − π(x)), the slope when X = x , is
(.25)(.1109), (.25)(.1629) −→ (.0277, .0407)
◮ So the incremental rate of change of π(x) whenx = −α/β = 51.5325 is an increase in probability of .0277 to.0407.
C.J. Anderson (Illinois) Logistic Regression for Dichotomous Spring 2014 42.1/ 129
Review Interpretation Inference Model checking. GOF Grouping Hosmer-Lemeshow LR ROC Residuals Influence Titanic
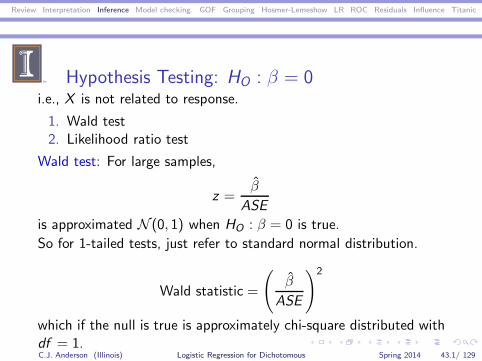
Hypothesis Testing: HO : β = 0i.e., X is not related to response.
1. Wald test2. Likelihood ratio test
Wald test: For large samples,
z =β
ASE
is approximated N (0, 1) when HO : β = 0 is true.
So for 1-tailed tests, just refer to standard normal distribution.
Wald statistic =
(β
ASE
)2
which if the null is true is approximately chi-square distributed withdf = 1.C.J. Anderson (Illinois) Logistic Regression for Dichotomous Spring 2014 43.1/ 129
Review Interpretation Inference Model checking. GOF Grouping Hosmer-Lemeshow LR ROC Residuals Influence Titanic
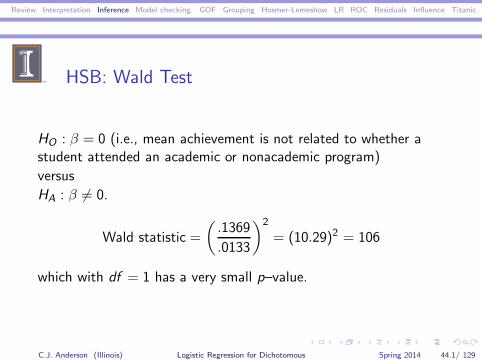
HSB: Wald Test
HO : β = 0 (i.e., mean achievement is not related to whether astudent attended an academic or nonacademic program)
versus
HA : β 6= 0.
Wald statistic =
(.1369
.0133
)2
= (10.29)2 = 106
which with df = 1 has a very small p–value.
C.J. Anderson (Illinois) Logistic Regression for Dichotomous Spring 2014 44.1/ 129
Review Interpretation Inference Model checking. GOF Grouping Hosmer-Lemeshow LR ROC Residuals Influence Titanic
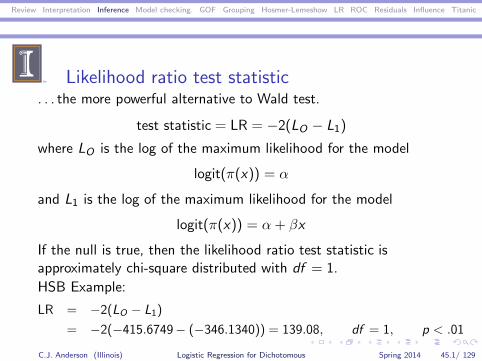
Likelihood ratio test statistic. . . the more powerful alternative to Wald test.
test statistic = LR = −2(LO − L1)
where LO is the log of the maximum likelihood for the model
logit(π(x)) = α
and L1 is the log of the maximum likelihood for the model
logit(π(x)) = α+ βx
If the null is true, then the likelihood ratio test statistic isapproximately chi-square distributed with df = 1.
HSB Example:
LR = −2(LO − L1)
= −2(−415.6749− (−346.1340)) = 139.08, df = 1, p < .01
C.J. Anderson (Illinois) Logistic Regression for Dichotomous Spring 2014 45.1/ 129
Review Interpretation Inference Model checking. GOF Grouping Hosmer-Lemeshow LR ROC Residuals Influence Titanic
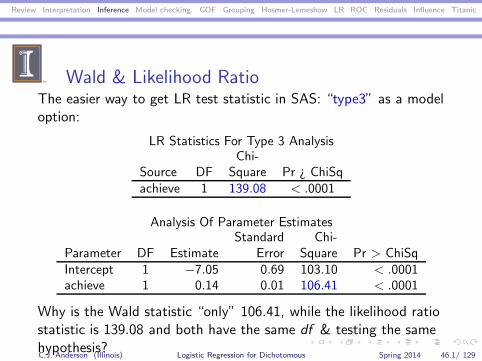
Wald & Likelihood RatioThe easier way to get LR test statistic in SAS: “type3” as a modeloption:
LR Statistics For Type 3 AnalysisChi-
Source DF Square Pr ¿ ChiSqachieve 1 139.08 < .0001
Analysis Of Parameter EstimatesStandard Chi-
Parameter DF Estimate Error Square Pr > ChiSqIntercept 1 −7.05 0.69 103.10 < .0001achieve 1 0.14 0.01 106.41 < .0001
Why is the Wald statistic “only” 106.41, while the likelihood ratiostatistic is 139.08 and both have the same df & testing the samehypothesis?C.J. Anderson (Illinois) Logistic Regression for Dichotomous Spring 2014 46.1/ 129
Review Interpretation Inference Model checking. GOF Grouping Hosmer-Lemeshow LR ROC Residuals Influence Titanic
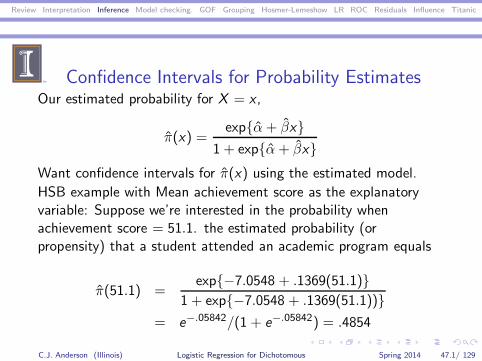
Confidence Intervals for Probability EstimatesOur estimated probability for X = x ,
π(x) =exp{α+ βx}
1 + exp{α+ βx}Want confidence intervals for π(x) using the estimated model.
HSB example with Mean achievement score as the explanatoryvariable: Suppose we’re interested in the probability whenachievement score = 51.1. the estimated probability (orpropensity) that a student attended an academic program equals
π(51.1) =exp{−7.0548 + .1369(51.1)}
1 + exp{−7.0548 + .1369(51.1))}= e−.05842/(1 + e−.05842) = .4854
C.J. Anderson (Illinois) Logistic Regression for Dichotomous Spring 2014 47.1/ 129
Review Interpretation Inference Model checking. GOF Grouping Hosmer-Lemeshow LR ROC Residuals Influence Titanic
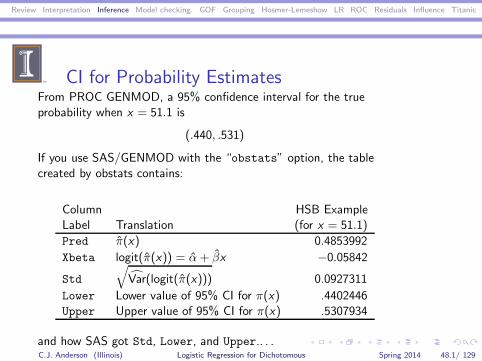
CI for Probability EstimatesFrom PROC GENMOD, a 95% confidence interval for the trueprobability when x = 51.1 is
(.440, .531)
If you use SAS/GENMOD with the “obstats” option, the tablecreated by obstats contains:
Column HSB ExampleLabel Translation (for x = 51.1)
Pred π(x) 0.4853992
Xbeta logit(π(x)) = α+ βx −0.05842
Std
√Var(logit(π(x))) 0.0927311
Lower Lower value of 95% CI for π(x) .4402446Upper Upper value of 95% CI for π(x) .5307934
and how SAS got Std, Lower, and Upper.. . .C.J. Anderson (Illinois) Logistic Regression for Dichotomous Spring 2014 48.1/ 129
Review Interpretation Inference Model checking. GOF Grouping Hosmer-Lemeshow LR ROC Residuals Influence Titanic
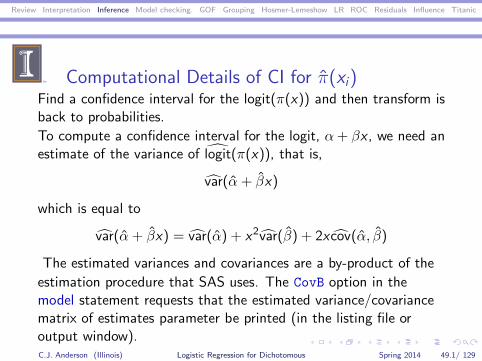
Computational Details of CI for π(xi)Find a confidence interval for the logit(π(x)) and then transform isback to probabilities.
To compute a confidence interval for the logit, α+ βx , we need anestimate of the variance of logit(π(x)), that is,
var(α + βx)
which is equal to
var(α+ βx) = var(α) + x2var(β) + 2x cov(α, β)
The estimated variances and covariances are a by-product of the
estimation procedure that SAS uses. The CovB option in themodel statement requests that the estimated variance/covariancematrix of estimates parameter be printed (in the listing file oroutput window).C.J. Anderson (Illinois) Logistic Regression for Dichotomous Spring 2014 49.1/ 129
Review Interpretation Inference Model checking. GOF Grouping Hosmer-Lemeshow LR ROC Residuals Influence Titanic
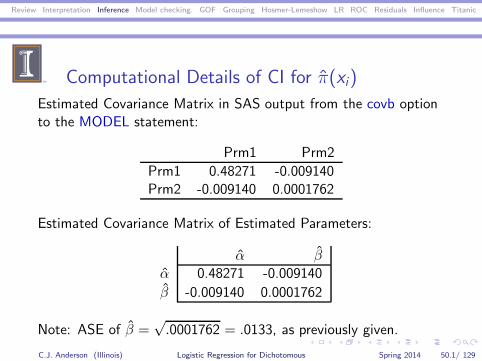
Computational Details of CI for π(xi)
Estimated Covariance Matrix in SAS output from the covb optionto the MODEL statement:
Prm1 Prm2
Prm1 0.48271 -0.009140Prm2 -0.009140 0.0001762
Estimated Covariance Matrix of Estimated Parameters:
α βα 0.48271 -0.009140
β -0.009140 0.0001762
Note: ASE of β =√.0001762 = .0133, as previously given.
C.J. Anderson (Illinois) Logistic Regression for Dichotomous Spring 2014 50.1/ 129
Review Interpretation Inference Model checking. GOF Grouping Hosmer-Lemeshow LR ROC Residuals Influence Titanic
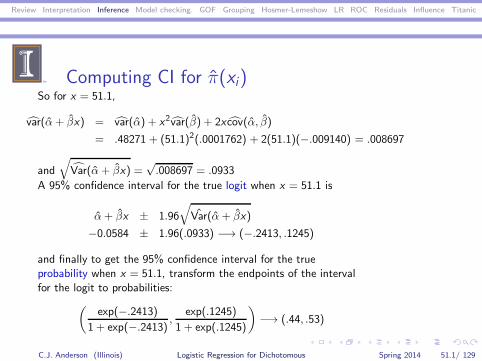
Computing CI for π(xi)So for x = 51.1,
var(α+ βx) = var(α) + x2var(β) + 2x cov(α, β)
= .48271 + (51.1)2(.0001762) + 2(51.1)(−.009140) = .008697
and
√Var(α+ βx) =
√.008697 = .0933
A 95% confidence interval for the true logit when x = 51.1 is
α+ βx ± 1.96
√Var(α+ βx)
−0.0584 ± 1.96(.0933) −→ (−.2413, .1245)
and finally to get the 95% confidence interval for the trueprobability when x = 51.1, transform the endpoints of the intervalfor the logit to probabilities:
(exp(−.2413)
1 + exp(−.2413),
exp(.1245)
1 + exp(.1245)
)−→ (.44, .53)
C.J. Anderson (Illinois) Logistic Regression for Dichotomous Spring 2014 51.1/ 129
Review Interpretation Inference Model checking. GOF Grouping Hosmer-Lemeshow LR ROC Residuals Influence Titanic
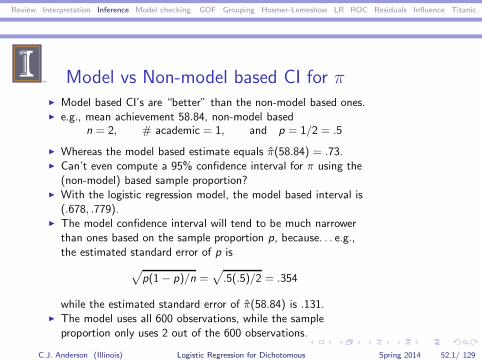
Model vs Non-model based CI for π◮ Model based CI’s are “better” than the non-model based ones.◮ e.g., mean achievement 58.84, non-model based
n = 2, # academic = 1, and p = 1/2 = .5
◮ Whereas the model based estimate equals π(58.84) = .73.◮ Can’t even compute a 95% confidence interval for π using the
(non-model) based sample proportion?◮ With the logistic regression model, the model based interval is
(.678, .779).◮ The model confidence interval will tend to be much narrower
than ones based on the sample proportion p, because. . . e.g.,the estimated standard error of p is
√p(1− p)/n =
√.5(.5)/2 = .354
while the estimated standard error of π(58.84) is .131.◮ The model uses all 600 observations, while the sample
proportion only uses 2 out of the 600 observations.
C.J. Anderson (Illinois) Logistic Regression for Dichotomous Spring 2014 52.1/ 129
Review Interpretation Inference Model checking. GOF Grouping Hosmer-Lemeshow LR ROC Residuals Influence Titanic
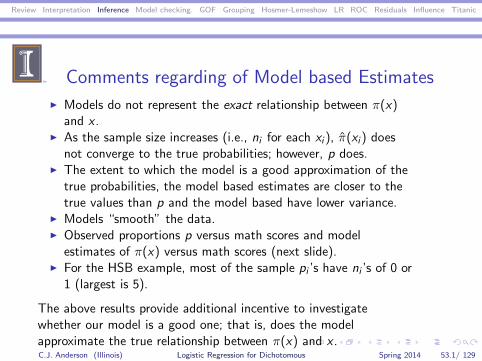
Comments regarding of Model based Estimates
◮ Models do not represent the exact relationship between π(x)and x .
◮ As the sample size increases (i.e., ni for each xi ), π(xi) doesnot converge to the true probabilities; however, p does.
◮ The extent to which the model is a good approximation of thetrue probabilities, the model based estimates are closer to thetrue values than p and the model based have lower variance.
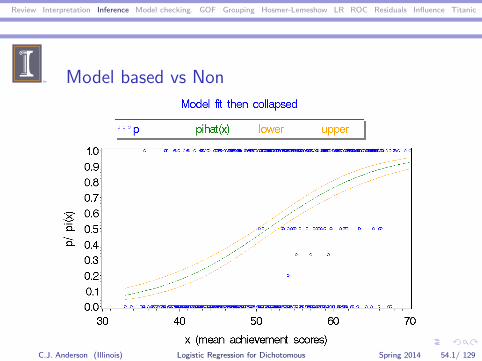
◮ Models “smooth” the data.◮ Observed proportions p versus math scores and model
estimates of π(x) versus math scores (next slide).◮ For the HSB example, most of the sample pi ’s have ni ’s of 0 or
1 (largest is 5).
The above results provide additional incentive to investigatewhether our model is a good one; that is, does the modelapproximate the true relationship between π(x) and x .C.J. Anderson (Illinois) Logistic Regression for Dichotomous Spring 2014 53.1/ 129
Review Interpretation Inference Model checking. GOF Grouping Hosmer-Lemeshow LR ROC Residuals Influence Titanic
Model based vs Non
C.J. Anderson (Illinois) Logistic Regression for Dichotomous Spring 2014 54.1/ 129
Review Interpretation Inference Model checking. GOF Grouping Hosmer-Lemeshow LR ROC Residuals Influence Titanic
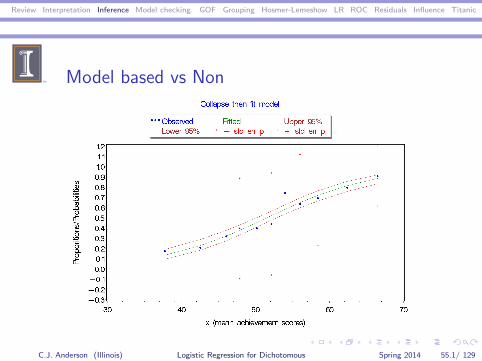
Model based vs Non
C.J. Anderson (Illinois) Logistic Regression for Dichotomous Spring 2014 55.1/ 129
Review Interpretation Inference Model checking. GOF Grouping Hosmer-Lemeshow LR ROC Residuals Influence Titanic
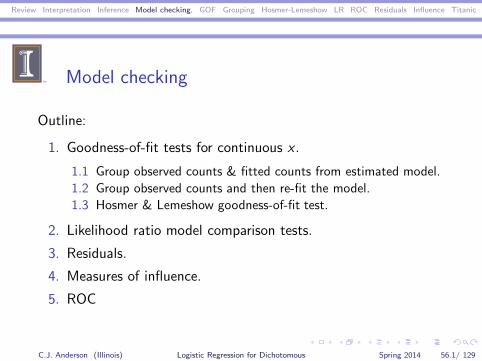
Model checking
Outline:
1. Goodness-of-fit tests for continuous x .
1.1 Group observed counts & fitted counts from estimated model.
1.2 Group observed counts and then re-fit the model.
1.3 Hosmer & Lemeshow goodness-of-fit test.
2. Likelihood ratio model comparison tests.
3. Residuals.
4. Measures of influence.
5. ROC
C.J. Anderson (Illinois) Logistic Regression for Dichotomous Spring 2014 56.1/ 129
Review Interpretation Inference Model checking. GOF Grouping Hosmer-Lemeshow LR ROC Residuals Influence Titanic
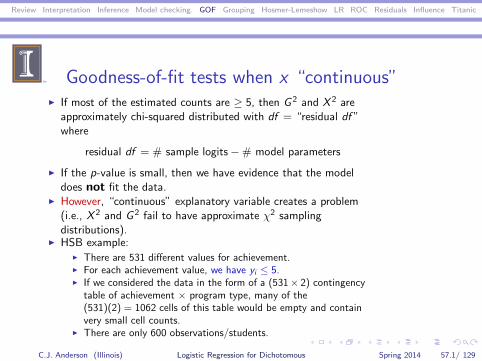
Goodness-of-fit tests when x “continuous”◮ If most of the estimated counts are ≥ 5, then G 2 and X 2 are
approximately chi-squared distributed with df = “residual df ”where
residual df = # sample logits−# model parameters
◮ If the p-value is small, then we have evidence that the modeldoes not fit the data.
◮ However, “continuous” explanatory variable creates a problem(i.e., X 2 and G 2 fail to have approximate χ2 samplingdistributions).
◮ HSB example:◮ There are 531 different values for achievement.◮ For each achievement value, we have yi ≤ 5.◮ If we considered the data in the form of a (531× 2) contingency
table of achievement × program type, many of the(531)(2) = 1062 cells of this table would be empty and containvery small cell counts.
◮ There are only 600 observations/students.
C.J. Anderson (Illinois) Logistic Regression for Dichotomous Spring 2014 57.1/ 129
Review Interpretation Inference Model checking. GOF Grouping Hosmer-Lemeshow LR ROC Residuals Influence Titanic
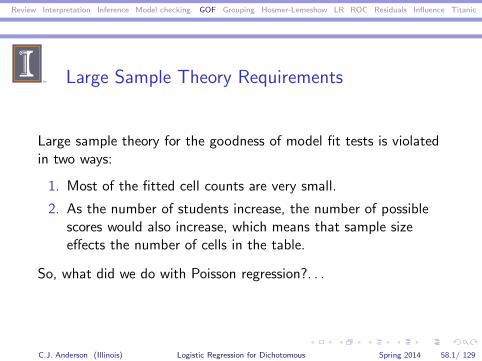
Large Sample Theory Requirements
Large sample theory for the goodness of model fit tests is violatedin two ways:
1. Most of the fitted cell counts are very small.
2. As the number of students increase, the number of possiblescores would also increase, which means that sample sizeeffects the number of cells in the table.
So, what did we do with Poisson regression?. . .
C.J. Anderson (Illinois) Logistic Regression for Dichotomous Spring 2014 58.1/ 129
Review Interpretation Inference Model checking. GOF Grouping Hosmer-Lemeshow LR ROC Residuals Influence Titanic
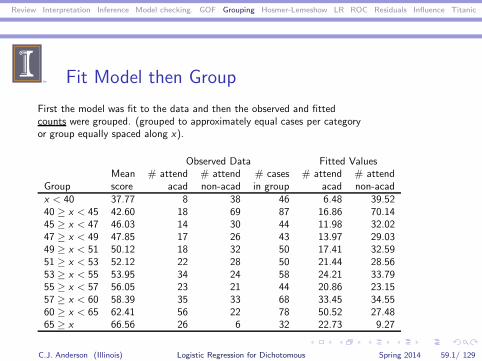
Fit Model then Group
First the model was fit to the data and then the observed and fittedcounts were grouped. (grouped to approximately equal cases per categoryor group equally spaced along x).
Observed Data Fitted ValuesMean # attend # attend # cases # attend # attend
Group score acad non-acad in group acad non-acadx < 40 37.77 8 38 46 6.48 39.5240 ≥ x < 45 42.60 18 69 87 16.86 70.1445 ≥ x < 47 46.03 14 30 44 11.98 32.0247 ≥ x < 49 47.85 17 26 43 13.97 29.0349 ≥ x < 51 50.12 18 32 50 17.41 32.5951 ≥ x < 53 52.12 22 28 50 21.44 28.5653 ≥ x < 55 53.95 34 24 58 24.21 33.7955 ≥ x < 57 56.05 23 21 44 20.86 23.1557 ≥ x < 60 58.39 35 33 68 33.45 34.5560 ≥ x < 65 62.41 56 22 78 50.52 27.4865 ≥ x 66.56 26 6 32 22.73 9.27
C.J. Anderson (Illinois) Logistic Regression for Dichotomous Spring 2014 59.1/ 129
Review Interpretation Inference Model checking. GOF Grouping Hosmer-Lemeshow LR ROC Residuals Influence Titanic
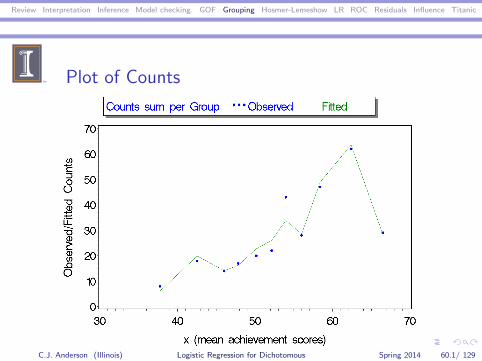
Plot of Counts
C.J. Anderson (Illinois) Logistic Regression for Dichotomous Spring 2014 60.1/ 129
Review Interpretation Inference Model checking. GOF Grouping Hosmer-Lemeshow LR ROC Residuals Influence Titanic
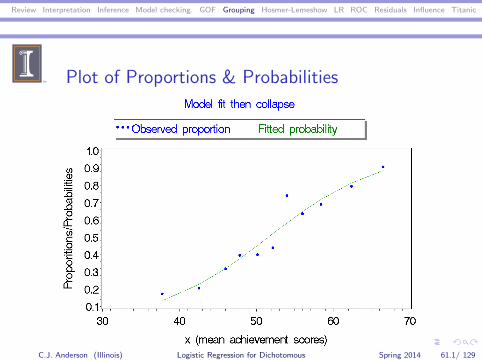
Plot of Proportions & Probabilities
C.J. Anderson (Illinois) Logistic Regression for Dichotomous Spring 2014 61.1/ 129
Review Interpretation Inference Model checking. GOF Grouping Hosmer-Lemeshow LR ROC Residuals Influence Titanic
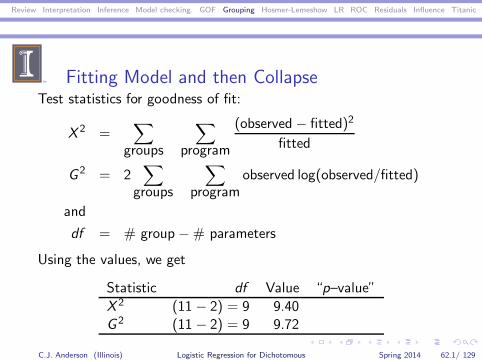
Fitting Model and then CollapseTest statistics for goodness of fit:
X 2 =∑
groups
∑
program
(observed− fitted)2
fitted
G 2 = 2∑
groups
∑
programobserved log(observed/fitted)
and
df = # group−# parameters
Using the values, we get
Statistic df Value “p–value”
X 2 (11 − 2) = 9 9.40G 2 (11 − 2) = 9 9.72
C.J. Anderson (Illinois) Logistic Regression for Dichotomous Spring 2014 62.1/ 129
Review Interpretation Inference Model checking. GOF Grouping Hosmer-Lemeshow LR ROC Residuals Influence Titanic
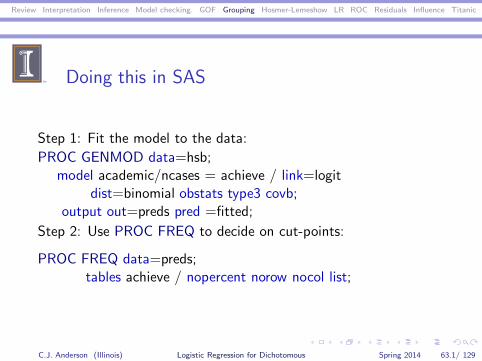
Doing this in SAS
Step 1: Fit the model to the data:
PROC GENMOD data=hsb;model academic/ncases = achieve / link=logit
dist=binomial obstats type3 covb;output out=preds pred =fitted;
Step 2: Use PROC FREQ to decide on cut-points:
PROC FREQ data=preds;tables achieve / nopercent norow nocol list;
C.J. Anderson (Illinois) Logistic Regression for Dichotomous Spring 2014 63.1/ 129
Review Interpretation Inference Model checking. GOF Grouping Hosmer-Lemeshow LR ROC Residuals Influence Titanic
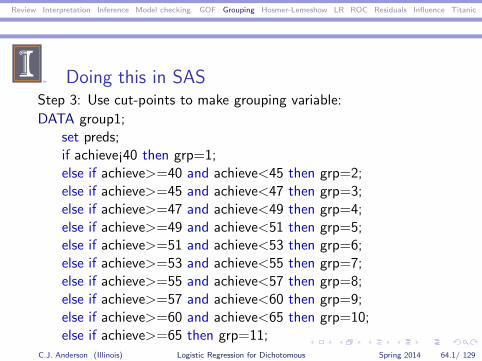
Doing this in SASStep 3: Use cut-points to make grouping variable:
DATA group1;set preds;if achieve¡40 then grp=1;else if achieve>=40 and achieve<45 then grp=2;else if achieve>=45 and achieve<47 then grp=3;else if achieve>=47 and achieve<49 then grp=4;else if achieve>=49 and achieve<51 then grp=5;else if achieve>=51 and achieve<53 then grp=6;else if achieve>=53 and achieve<55 then grp=7;else if achieve>=55 and achieve<57 then grp=8;else if achieve>=57 and achieve<60 then grp=9;else if achieve>=60 and achieve<65 then grp=10;else if achieve>=65 then grp=11;
C.J. Anderson (Illinois) Logistic Regression for Dichotomous Spring 2014 64.1/ 129
Review Interpretation Inference Model checking. GOF Grouping Hosmer-Lemeshow LR ROC Residuals Influence Titanic
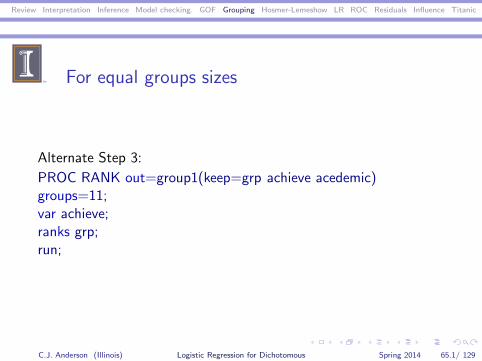
For equal groups sizes
Alternate Step 3:
PROC RANK out=group1(keep=grp achieve acedemic)groups=11;var achieve;ranks grp;run;
C.J. Anderson (Illinois) Logistic Regression for Dichotomous Spring 2014 65.1/ 129
Review Interpretation Inference Model checking. GOF Grouping Hosmer-Lemeshow LR ROC Residuals Influence Titanic
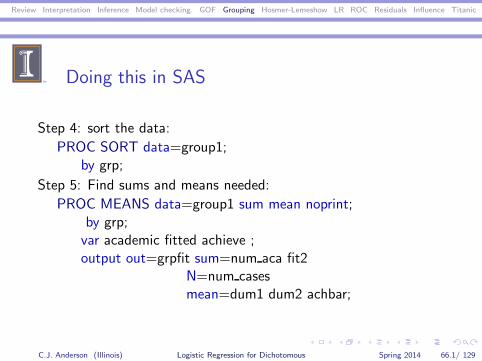
Doing this in SAS
Step 4: sort the data:
PROC SORT data=group1;by grp;
Step 5: Find sums and means needed:
PROC MEANS data=group1 sum mean noprint;by grp;var academic fitted achieve ;output out=grpfit sum=num aca fit2
N=num casesmean=dum1 dum2 achbar;
C.J. Anderson (Illinois) Logistic Regression for Dichotomous Spring 2014 66.1/ 129
Review Interpretation Inference Model checking. GOF Grouping Hosmer-Lemeshow LR ROC Residuals Influence Titanic
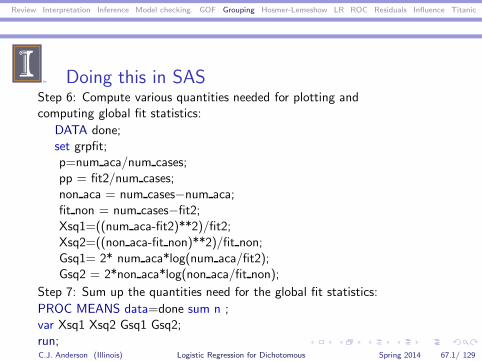
Doing this in SASStep 6: Compute various quantities needed for plotting andcomputing global fit statistics:
DATA done;set grpfit;p=num aca/num cases;pp = fit2/num cases;non aca = num cases−num aca;fit non = num cases−fit2;Xsq1=((num aca-fit2)**2)/fit2;Xsq2=((non aca-fit non)**2)/fit non;Gsq1= 2* num aca*log(num aca/fit2);Gsq2 = 2*non aca*log(non aca/fit non);
Step 7: Sum up the quantities need for the global fit statistics:
PROC MEANS data=done sum n ;var Xsq1 Xsq2 Gsq1 Gsq2;run;C.J. Anderson (Illinois) Logistic Regression for Dichotomous Spring 2014 67.1/ 129

Review Interpretation Inference Model checking. GOF Grouping Hosmer-Lemeshow LR ROC Residuals Influence Titanic
Results of Last Step. . .
The MEANS ProcedureVariable Sum N
Xsq1 4.3269856 11Xsq2 5.0778190 11Gsq1 4.1338700 11Gsq2 5.5853912 11
X 2 = 4.3269856 + 5.0778190 = 9.40
G 2 = 4.1338700 + 5.5853912 = 9.72
df = number of logits− number of parameters
= 11− 2 = 9
C.J. Anderson (Illinois) Logistic Regression for Dichotomous Spring 2014 68.1/ 129
Review Interpretation Inference Model checking. GOF Grouping Hosmer-Lemeshow LR ROC Residuals Influence Titanic
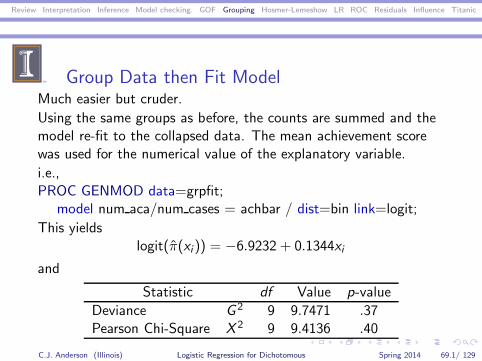
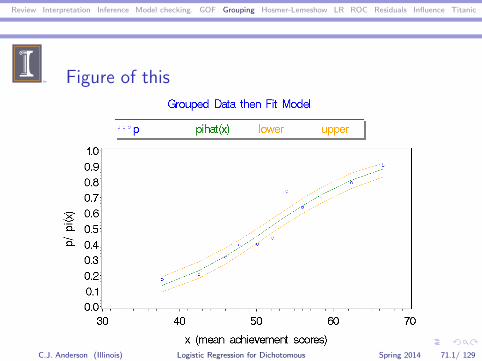
Group Data then Fit ModelMuch easier but cruder.
Using the same groups as before, the counts are summed and themodel re-fit to the collapsed data. The mean achievement scorewas used for the numerical value of the explanatory variable.
i.e.,PROC GENMOD data=grpfit;
model num aca/num cases = achbar / dist=bin link=logit;
This yieldslogit(π(xi )) = −6.9232 + 0.1344xi
and
Statistic df Value p-value
Deviance G 2 9 9.7471 .37Pearson Chi-Square X 2 9 9.4136 .40
C.J. Anderson (Illinois) Logistic Regression for Dichotomous Spring 2014 69.1/ 129
Review Interpretation Inference Model checking. GOF Grouping Hosmer-Lemeshow LR ROC Residuals Influence Titanic
From Grouping and then Fitting Model
C.J. Anderson (Illinois) Logistic Regression for Dichotomous Spring 2014 70.1/ 129
Review Interpretation Inference Model checking. GOF Grouping Hosmer-Lemeshow LR ROC Residuals Influence Titanic
Figure of this
C.J. Anderson (Illinois) Logistic Regression for Dichotomous Spring 2014 71.1/ 129
Review Interpretation Inference Model checking. GOF Grouping Hosmer-Lemeshow LR ROC Residuals Influence Titanic
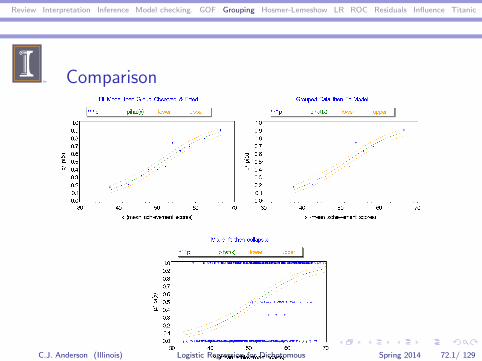
Comparison
C.J. Anderson (Illinois) Logistic Regression for Dichotomous Spring 2014 72.1/ 129
Review Interpretation Inference Model checking. GOF Grouping Hosmer-Lemeshow LR ROC Residuals Influence Titanic
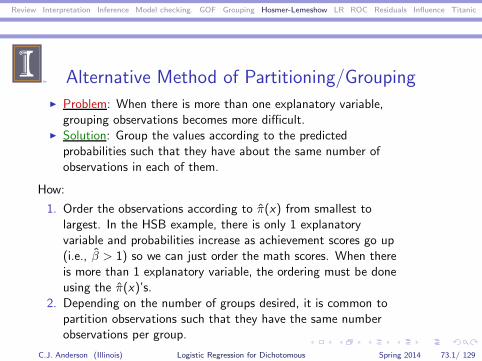
Alternative Method of Partitioning/Grouping◮ Problem: When there is more than one explanatory variable,
grouping observations becomes more difficult.◮ Solution: Group the values according to the predicted
probabilities such that they have about the same number ofobservations in each of them.
How:
1. Order the observations according to π(x) from smallest tolargest. In the HSB example, there is only 1 explanatoryvariable and probabilities increase as achievement scores go up(i.e., β > 1) so we can just order the math scores. When thereis more than 1 explanatory variable, the ordering must be doneusing the π(x)’s.
2. Depending on the number of groups desired, it is common topartition observations such that they have the same numberobservations per group.
C.J. Anderson (Illinois) Logistic Regression for Dichotomous Spring 2014 73.1/ 129
Review Interpretation Inference Model checking. GOF Grouping Hosmer-Lemeshow LR ROC Residuals Influence Titanic
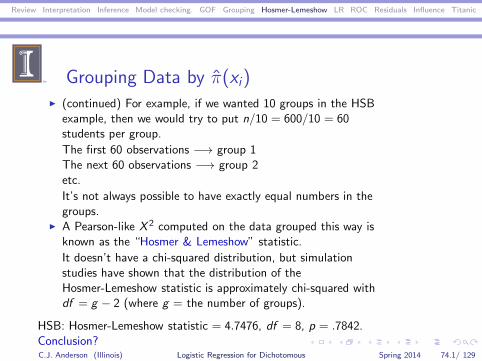
Grouping Data by π(xi)◮ (continued) For example, if we wanted 10 groups in the HSB
example, then we would try to put n/10 = 600/10 = 60students per group.
The first 60 observations −→ group 1The next 60 observations −→ group 2etc.
It’s not always possible to have exactly equal numbers in thegroups.
◮ A Pearson-like X 2 computed on the data grouped this way isknown as the “Hosmer & Lemeshow” statistic.
It doesn’t have a chi-squared distribution, but simulationstudies have shown that the distribution of theHosmer-Lemeshow statistic is approximately chi-squared withdf = g − 2 (where g = the number of groups).
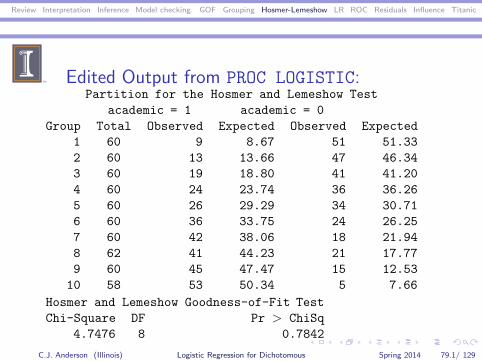
HSB: Hosmer-Lemeshow statistic = 4.7476, df = 8, p = .7842.Conclusion?C.J. Anderson (Illinois) Logistic Regression for Dichotomous Spring 2014 74.1/ 129
Review Interpretation Inference Model checking. GOF Grouping Hosmer-Lemeshow LR ROC Residuals Influence Titanic
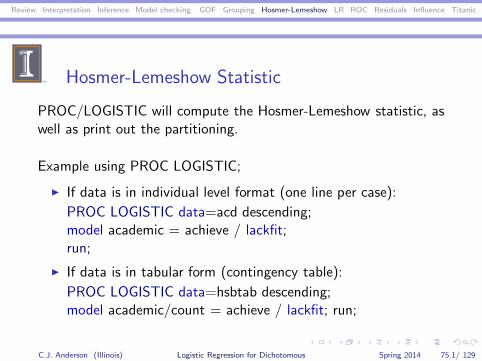
Hosmer-Lemeshow Statistic
PROC/LOGISTIC will compute the Hosmer-Lemeshow statistic, aswell as print out the partitioning.
Example using PROC LOGISTIC;
◮ If data is in individual level format (one line per case):
PROC LOGISTIC data=acd descending;model academic = achieve / lackfit;run;
◮ If data is in tabular form (contingency table):
PROC LOGISTIC data=hsbtab descending;model academic/count = achieve / lackfit; run;
C.J. Anderson (Illinois) Logistic Regression for Dichotomous Spring 2014 75.1/ 129
Review Interpretation Inference Model checking. GOF Grouping Hosmer-Lemeshow LR ROC Residuals Influence Titanic
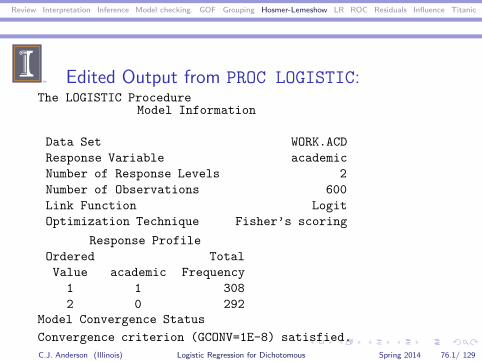
Edited Output from PROC LOGISTIC:The LOGISTIC Procedure
Model Information
Data Set WORK.ACD
Response Variable academic
Number of Response Levels 2
Number of Observations 600
Link Function Logit
Optimization Technique Fisher’s scoring
Response Profile
Ordered Total
Value academic Frequency
1 1 308
2 0 292Model Convergence Status
Convergence criterion (GCONV=1E-8) satisfied.
C.J. Anderson (Illinois) Logistic Regression for Dichotomous Spring 2014 76.1/ 129
Review Interpretation Inference Model checking. GOF Grouping Hosmer-Lemeshow LR ROC Residuals Influence Titanic
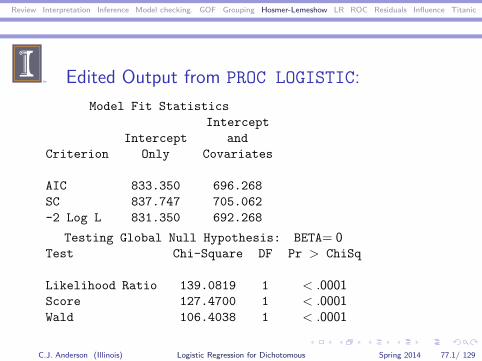
Edited Output from PROC LOGISTIC:
Model Fit Statistics
Intercept
Intercept and
Criterion Only Covariates
AIC 833.350 696.268
SC 837.747 705.062
-2 Log L 831.350 692.268
Testing Global Null Hypothesis: BETA= 0Test Chi-Square DF Pr > ChiSq
Likelihood Ratio 139.0819 1 < .0001Score 127.4700 1 < .0001Wald 106.4038 1 < .0001
C.J. Anderson (Illinois) Logistic Regression for Dichotomous Spring 2014 77.1/ 129
Review Interpretation Inference Model checking. GOF Grouping Hosmer-Lemeshow LR ROC Residuals Influence Titanic
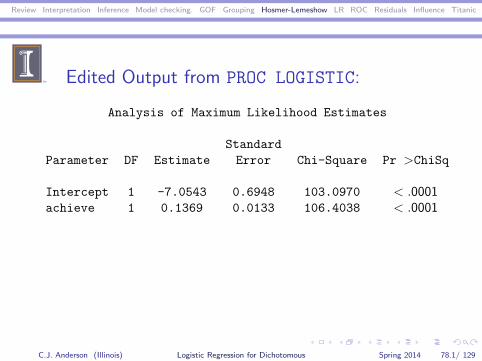
Edited Output from PROC LOGISTIC:
Analysis of Maximum Likelihood Estimates
Standard
Parameter DF Estimate Error Chi-Square Pr >ChiSq
Intercept 1 -7.0543 0.6948 103.0970 < .0001achieve 1 0.1369 0.0133 106.4038 < .0001
C.J. Anderson (Illinois) Logistic Regression for Dichotomous Spring 2014 78.1/ 129
Review Interpretation Inference Model checking. GOF Grouping Hosmer-Lemeshow LR ROC Residuals Influence Titanic
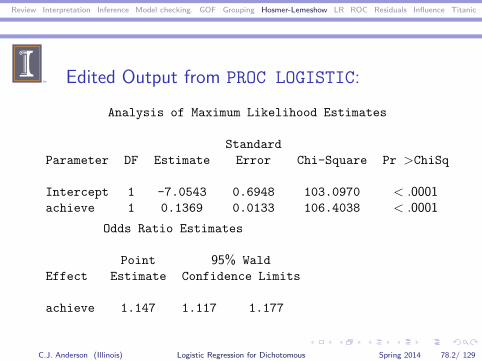
Edited Output from PROC LOGISTIC:
Analysis of Maximum Likelihood Estimates
Standard
Parameter DF Estimate Error Chi-Square Pr >ChiSq
Intercept 1 -7.0543 0.6948 103.0970 < .0001achieve 1 0.1369 0.0133 106.4038 < .0001
Odds Ratio Estimates
Point 95% Wald
Effect Estimate Confidence Limits
achieve 1.147 1.117 1.177
C.J. Anderson (Illinois) Logistic Regression for Dichotomous Spring 2014 78.2/ 129
Review Interpretation Inference Model checking. GOF Grouping Hosmer-Lemeshow LR ROC Residuals Influence Titanic
Edited Output from PROC LOGISTIC:Partition for the Hosmer and Lemeshow Test
academic = 1 academic = 0
Group Total Observed Expected Observed Expected
1 60 9 8.67 51 51.33
2 60 13 13.66 47 46.34
3 60 19 18.80 41 41.20
4 60 24 23.74 36 36.26
5 60 26 29.29 34 30.71
6 60 36 33.75 24 26.25
7 60 42 38.06 18 21.94
8 62 41 44.23 21 17.77
9 60 45 47.47 15 12.53
10 58 53 50.34 5 7.66
Hosmer and Lemeshow Goodness-of-Fit Test
Chi-Square DF Pr > ChiSq
4.7476 8 0.7842
C.J. Anderson (Illinois) Logistic Regression for Dichotomous Spring 2014 79.1/ 129
Review Interpretation Inference Model checking. GOF Grouping Hosmer-Lemeshow LR ROC Residuals Influence Titanic
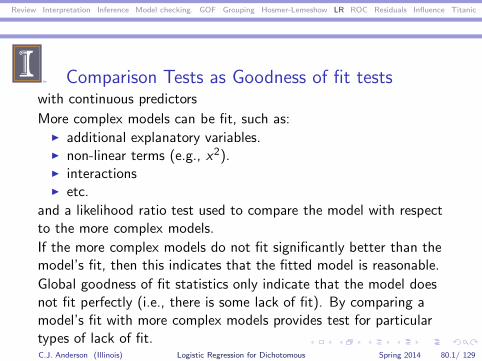
Comparison Tests as Goodness of fit testswith continuous predictors
More complex models can be fit, such as:◮ additional explanatory variables.◮ non-linear terms (e.g., x2).◮ interactions◮ etc.
and a likelihood ratio test used to compare the model with respectto the more complex models.
If the more complex models do not fit significantly better than themodel’s fit, then this indicates that the fitted model is reasonable.
Global goodness of fit statistics only indicate that the model doesnot fit perfectly (i.e., there is some lack of fit). By comparing amodel’s fit with more complex models provides test for particulartypes of lack of fit.C.J. Anderson (Illinois) Logistic Regression for Dichotomous Spring 2014 80.1/ 129
Review Interpretation Inference Model checking. GOF Grouping Hosmer-Lemeshow LR ROC Residuals Influence Titanic
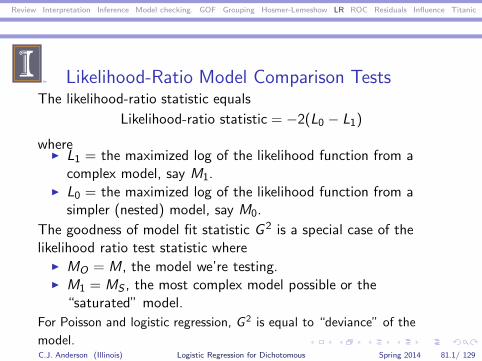
Likelihood-Ratio Model Comparison TestsThe likelihood-ratio statistic equals
Likelihood-ratio statistic = −2(L0 − L1)
where◮ L1 = the maximized log of the likelihood function from a
complex model, say M1.◮ L0 = the maximized log of the likelihood function from a
simpler (nested) model, say M0.
The goodness of model fit statistic G 2 is a special case of thelikelihood ratio test statistic where
◮ MO = M, the model we’re testing.◮ M1 = MS , the most complex model possible or the
“saturated” model.
For Poisson and logistic regression, G 2 is equal to “deviance” of the
model.C.J. Anderson (Illinois) Logistic Regression for Dichotomous Spring 2014 81.1/ 129
Review Interpretation Inference Model checking. GOF Grouping Hosmer-Lemeshow LR ROC Residuals Influence Titanic
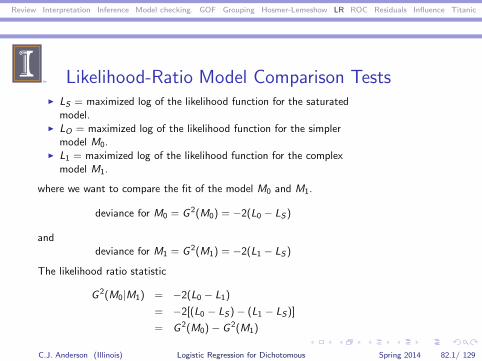
Likelihood-Ratio Model Comparison Tests◮ LS = maximized log of the likelihood function for the saturated
model.◮ LO = maximized log of the likelihood function for the simpler
model M0.◮ L1 = maximized log of the likelihood function for the complex
model M1.
where we want to compare the fit of the model M0 and M1.
deviance for M0 = G 2(M0) = −2(L0 − LS )
anddeviance for M1 = G 2(M1) = −2(L1 − LS )
The likelihood ratio statistic
G 2(M0|M1) = −2(L0 − L1)
= −2[(L0 − LS)− (L1 − LS)]
= G 2(M0)− G 2(M1)
C.J. Anderson (Illinois) Logistic Regression for Dichotomous Spring 2014 82.1/ 129
Review Interpretation Inference Model checking. GOF Grouping Hosmer-Lemeshow LR ROC Residuals Influence Titanic
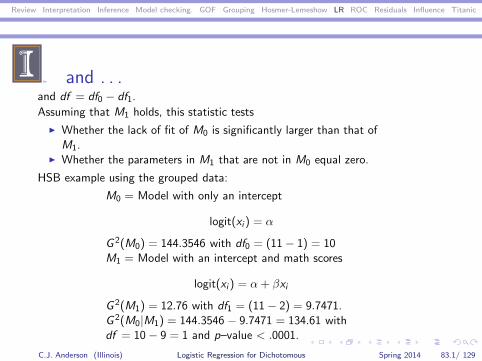
and . . .and df = df0 − df1.
Assuming that M1 holds, this statistic tests
◮ Whether the lack of fit of M0 is significantly larger than that ofM1.
◮ Whether the parameters in M1 that are not in M0 equal zero.
HSB example using the grouped data:
M0 = Model with only an intercept
logit(xi) = α
G 2(M0) = 144.3546 with df0 = (11− 1) = 10M1 = Model with an intercept and math scores
logit(xi ) = α+ βxi
G 2(M1) = 12.76 with df1 = (11− 2) = 9.7471.G 2(M0|M1) = 144.3546 − 9.7471 = 134.61 withdf = 10− 9 = 1 and p–value < .0001.
C.J. Anderson (Illinois) Logistic Regression for Dichotomous Spring 2014 83.1/ 129
Review Interpretation Inference Model checking. GOF Grouping Hosmer-Lemeshow LR ROC Residuals Influence Titanic
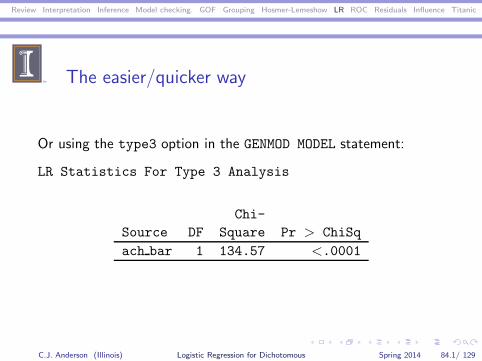
The easier/quicker way
Or using the type3 option in the GENMOD MODEL statement:
LR Statistics For Type 3 Analysis
Chi-
Source DF Square Pr > ChiSq
ach bar 1 134.57 <.0001
C.J. Anderson (Illinois) Logistic Regression for Dichotomous Spring 2014 84.1/ 129
Review Interpretation Inference Model checking. GOF Grouping Hosmer-Lemeshow LR ROC Residuals Influence Titanic
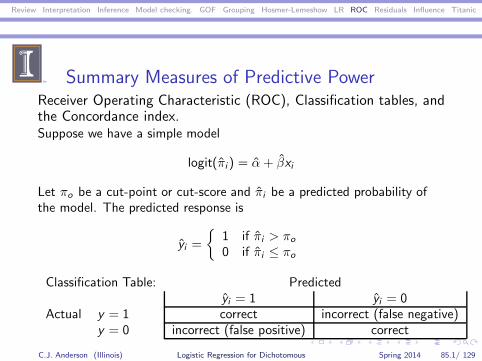
Summary Measures of Predictive PowerReceiver Operating Characteristic (ROC), Classification tables, andthe Concordance index.Suppose we have a simple model
logit(πi ) = α+ βxi
Let πo be a cut-point or cut-score and πi be a predicted probability ofthe model. The predicted response is
yi =
{1 if πi > πo
0 if πi ≤ πo
Classification Table: Predictedyi = 1 yi = 0
Actual y = 1 correct incorrect (false negative)y = 0 incorrect (false positive) correct
C.J. Anderson (Illinois) Logistic Regression for Dichotomous Spring 2014 85.1/ 129

Review Interpretation Inference Model checking. GOF Grouping Hosmer-Lemeshow LR ROC Residuals Influence Titanic
Classification TableWe’re more interested in conditional proportions and probabilities:
Predictedyi = 1 yi = 0
Actual y = 1 n11/n1+ n12/n1+ n1+y = 0 n21/n2+ n22/n2+ n2+
C.J. Anderson (Illinois) Logistic Regression for Dichotomous Spring 2014 86.1/ 129
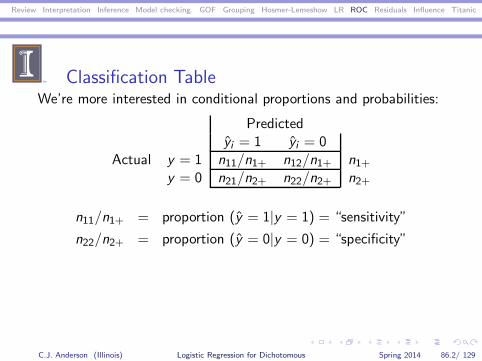
Review Interpretation Inference Model checking. GOF Grouping Hosmer-Lemeshow LR ROC Residuals Influence Titanic
Classification TableWe’re more interested in conditional proportions and probabilities:
Predictedyi = 1 yi = 0
Actual y = 1 n11/n1+ n12/n1+ n1+y = 0 n21/n2+ n22/n2+ n2+
n11/n1+ = proportion (y = 1|y = 1) = “sensitivity”
n22/n2+ = proportion (y = 0|y = 0) = “specificity”
C.J. Anderson (Illinois) Logistic Regression for Dichotomous Spring 2014 86.2/ 129
Review Interpretation Inference Model checking. GOF Grouping Hosmer-Lemeshow LR ROC Residuals Influence Titanic
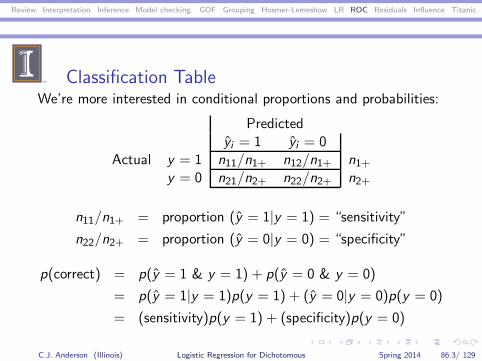
Classification TableWe’re more interested in conditional proportions and probabilities:
Predictedyi = 1 yi = 0
Actual y = 1 n11/n1+ n12/n1+ n1+y = 0 n21/n2+ n22/n2+ n2+
n11/n1+ = proportion (y = 1|y = 1) = “sensitivity”
n22/n2+ = proportion (y = 0|y = 0) = “specificity”
p(correct) = p(y = 1 & y = 1) + p(y = 0 & y = 0)
= p(y = 1|y = 1)p(y = 1) + (y = 0|y = 0)p(y = 0)
= (sensitivity)p(y = 1) + (specificity)p(y = 0)
C.J. Anderson (Illinois) Logistic Regression for Dichotomous Spring 2014 86.3/ 129
Review Interpretation Inference Model checking. GOF Grouping Hosmer-Lemeshow LR ROC Residuals Influence Titanic
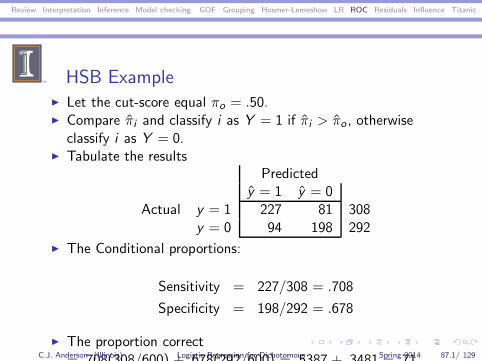
HSB Example◮ Let the cut-score equal πo = .50.◮ Compare πi and classify i as Y = 1 if πi > πo , otherwise
classify i as Y = 0.◮ Tabulate the results
Predictedy = 1 y = 0
Actual y = 1 227 81 308y = 0 94 198 292
◮ The Conditional proportions:
Sensitivity = 227/308 = .708
Specificity = 198/292 = .678
◮ The proportion correct= .708(308/600) + .678(292/600) = .5387 + .3481 = .71C.J. Anderson (Illinois) Logistic Regression for Dichotomous Spring 2014 87.1/ 129
Review Interpretation Inference Model checking. GOF Grouping Hosmer-Lemeshow LR ROC Residuals Influence Titanic
HSB Example with πo = .50
600 students
308 academic227 predicted academic
81 predicted non-academic
292 nonacademic
94 predicted academic
198 predictor non-academic
Specificity= 198/292× 100% = 67.8%
Sensitivity= 227/308× 100% = 73.7%
Percent correct = (227 + 198)/600% = 425/600× 100% = 70.8%
C.J. Anderson (Illinois) Logistic Regression for Dichotomous Spring 2014 88.1/ 129
Review Interpretation Inference Model checking. GOF Grouping Hosmer-Lemeshow LR ROC Residuals Influence Titanic
Sensitivity, Specificity & p(Correct)
◮ For every cut-score you will get a different result.
◮ For HSB, using a cut-score of πo = .70 yieldsPredicted
y = 1 y = 0Actual y = 1 112 180 308
y = 0 30 278 292◮
Sensitivity = 112/308 = .384
Specificity = 278/292 = .903
Correct = (117 + 278)/600 = .650
◮ Do this for lots of possible cut-scores and plot the results −→ROC curve.
C.J. Anderson (Illinois) Logistic Regression for Dichotomous Spring 2014 89.1/ 129
Review Interpretation Inference Model checking. GOF Grouping Hosmer-Lemeshow LR ROC Residuals Influence Titanic
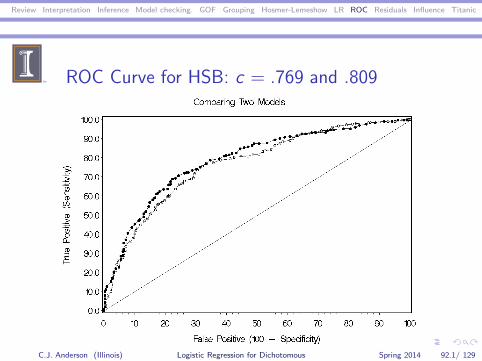
ROC Curve for HSB: c = .769
C.J. Anderson (Illinois) Logistic Regression for Dichotomous Spring 2014 90.1/ 129
Review Interpretation Inference Model checking. GOF Grouping Hosmer-Lemeshow LR ROC Residuals Influence Titanic
Area Under ROC Curve
Concordance: Take two cases i and j where yi = 1 and yj = 0(i 6= j),
If πi > πj , then the pair is concordant
If πi < πj , then the pair is discordant
If πi = πj , then the pair is tie
The area under the ROC curve equals the concordance index. Theconcordance index is an estimate of the probability that predictionsand outcomes are concordant. In PROC LOGISTIC, this index is cin the table of “Association of Predicted Probabilities andObserved Responses”.
This also provides a way to compare models, the solid dots in thenext figure are from a model with more predictors. For example,. . .
C.J. Anderson (Illinois) Logistic Regression for Dichotomous Spring 2014 91.1/ 129
Review Interpretation Inference Model checking. GOF Grouping Hosmer-Lemeshow LR ROC Residuals Influence Titanic
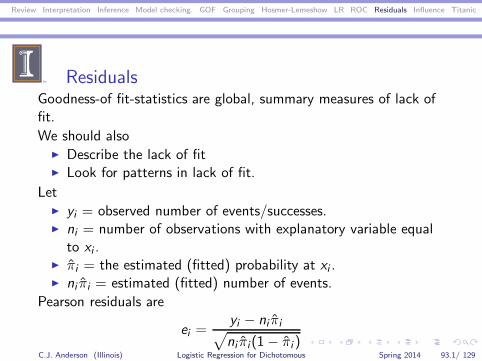
ROC Curve for HSB: c = .769 and .809
C.J. Anderson (Illinois) Logistic Regression for Dichotomous Spring 2014 92.1/ 129
Review Interpretation Inference Model checking. GOF Grouping Hosmer-Lemeshow LR ROC Residuals Influence Titanic
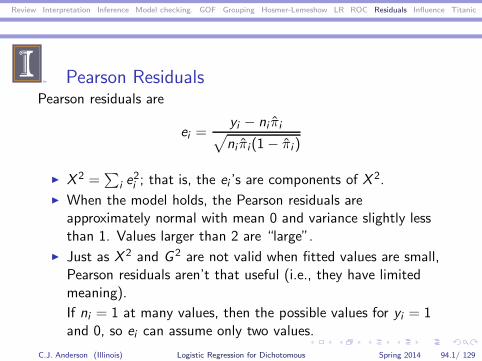
ResidualsGoodness-of fit-statistics are global, summary measures of lack offit.
We should also◮ Describe the lack of fit◮ Look for patterns in lack of fit.
Let◮ yi = observed number of events/successes.◮ ni = number of observations with explanatory variable equal
to xi .◮ πi = the estimated (fitted) probability at xi .◮ ni πi = estimated (fitted) number of events.
Pearson residuals are
ei =yi − ni πi√ni πi(1− πi )
C.J. Anderson (Illinois) Logistic Regression for Dichotomous Spring 2014 93.1/ 129
Review Interpretation Inference Model checking. GOF Grouping Hosmer-Lemeshow LR ROC Residuals Influence Titanic
Pearson ResidualsPearson residuals are
ei =yi − ni πi√ni πi(1− πi )
◮ X 2 =∑
i e2i ; that is, the ei ’s are components of X 2.
◮ When the model holds, the Pearson residuals areapproximately normal with mean 0 and variance slightly lessthan 1. Values larger than 2 are “large”.
◮ Just as X 2 and G 2 are not valid when fitted values are small,Pearson residuals aren’t that useful (i.e., they have limitedmeaning).
If ni = 1 at many values, then the possible values for yi = 1and 0, so ei can assume only two values.
C.J. Anderson (Illinois) Logistic Regression for Dichotomous Spring 2014 94.1/ 129
Review Interpretation Inference Model checking. GOF Grouping Hosmer-Lemeshow LR ROC Residuals Influence Titanic
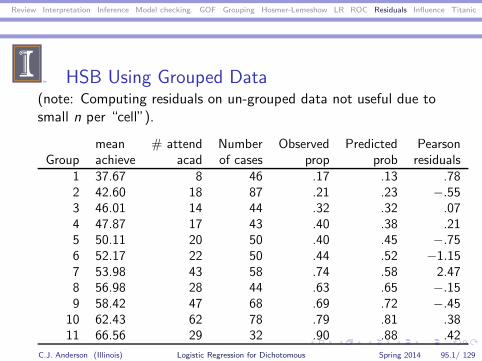
HSB Using Grouped Data(note: Computing residuals on un-grouped data not useful due tosmall n per “cell”).
mean # attend Number Observed Predicted PearsonGroup achieve acad of cases prop prob residuals
1 37.67 8 46 .17 .13 .782 42.60 18 87 .21 .23 −.553 46.01 14 44 .32 .32 .074 47.87 17 43 .40 .38 .215 50.11 20 50 .40 .45 −.756 52.17 22 50 .44 .52 −1.157 53.98 43 58 .74 .58 2.478 56.98 28 44 .63 .65 −.159 58.42 47 68 .69 .72 −.45
10 62.43 62 78 .79 .81 .3811 66.56 29 32 .90 .88 .42
C.J. Anderson (Illinois) Logistic Regression for Dichotomous Spring 2014 95.1/ 129
Review Interpretation Inference Model checking. GOF Grouping Hosmer-Lemeshow LR ROC Residuals Influence Titanic
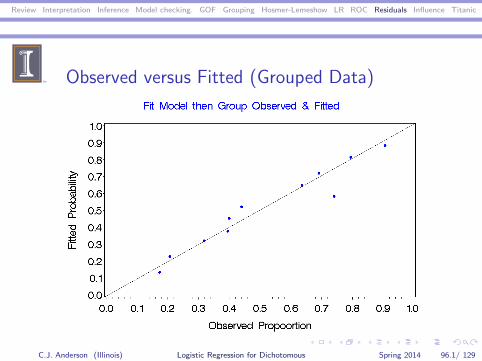
Observed versus Fitted (Grouped Data)
C.J. Anderson (Illinois) Logistic Regression for Dichotomous Spring 2014 96.1/ 129
Review Interpretation Inference Model checking. GOF Grouping Hosmer-Lemeshow LR ROC Residuals Influence Titanic
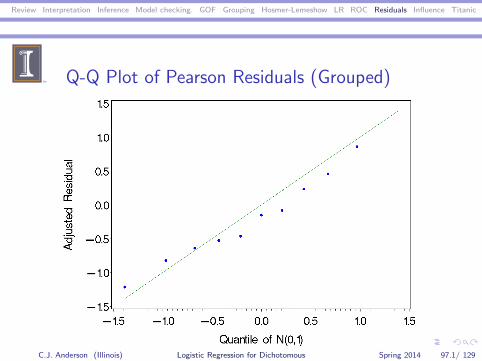
Q-Q Plot of Pearson Residuals (Grouped)
C.J. Anderson (Illinois) Logistic Regression for Dichotomous Spring 2014 97.1/ 129
Review Interpretation Inference Model checking. GOF Grouping Hosmer-Lemeshow LR ROC Residuals Influence Titanic
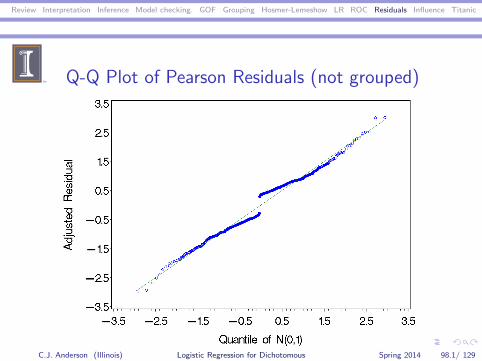
Q-Q Plot of Pearson Residuals (not grouped)
C.J. Anderson (Illinois) Logistic Regression for Dichotomous Spring 2014 98.1/ 129
Review Interpretation Inference Model checking. GOF Grouping Hosmer-Lemeshow LR ROC Residuals Influence Titanic
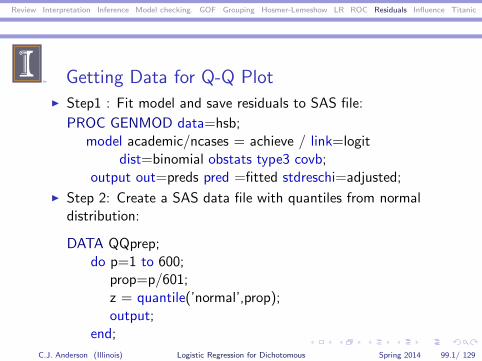
Getting Data for Q-Q Plot◮ Step1 : Fit model and save residuals to SAS file:
PROC GENMOD data=hsb;model academic/ncases = achieve / link=logit
dist=binomial obstats type3 covb;output out=preds pred =fitted stdreschi=adjusted;
◮ Step 2: Create a SAS data file with quantiles from normaldistribution:
DATA QQprep;do p=1 to 600;
prop=p/601;z = quantile(’normal’,prop);output;
end;
C.J. Anderson (Illinois) Logistic Regression for Dichotomous Spring 2014 99.1/ 129
Review Interpretation Inference Model checking. GOF Grouping Hosmer-Lemeshow LR ROC Residuals Influence Titanic
Hard way to Make Q-Q Plot
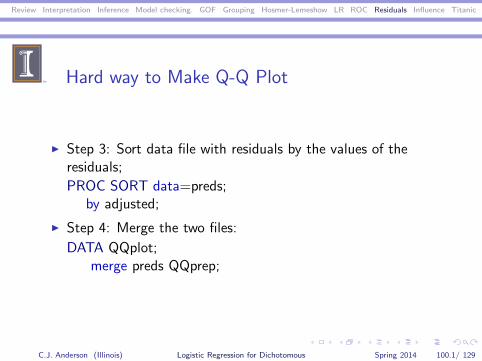
◮ Step 3: Sort data file with residuals by the values of theresiduals;
PROC SORT data=preds;by adjusted;
◮ Step 4: Merge the two files:
DATA QQplot;merge preds QQprep;
C.J. Anderson (Illinois) Logistic Regression for Dichotomous Spring 2014 100.1/ 129
Review Interpretation Inference Model checking. GOF Grouping Hosmer-Lemeshow LR ROC Residuals Influence Titanic
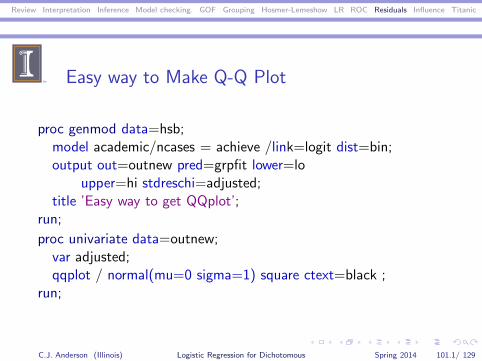
Easy way to Make Q-Q Plot
proc genmod data=hsb;model academic/ncases = achieve /link=logit dist=bin;output out=outnew pred=grpfit lower=lo
upper=hi stdreschi=adjusted;title ’Easy way to get QQplot’;
run;
proc univariate data=outnew;var adjusted;qqplot / normal(mu=0 sigma=1) square ctext=black ;
run;
C.J. Anderson (Illinois) Logistic Regression for Dichotomous Spring 2014 101.1/ 129
Review Interpretation Inference Model checking. GOF Grouping Hosmer-Lemeshow LR ROC Residuals Influence Titanic
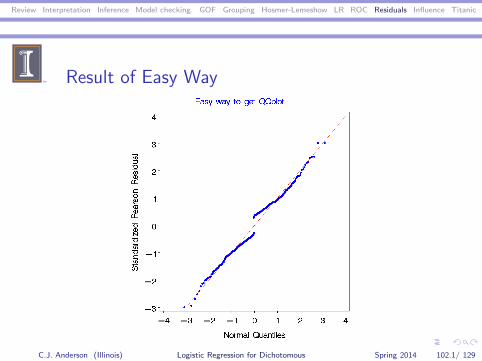
Result of Easy Way
C.J. Anderson (Illinois) Logistic Regression for Dichotomous Spring 2014 102.1/ 129
Review Interpretation Inference Model checking. GOF Grouping Hosmer-Lemeshow LR ROC Residuals Influence Titanic
Influence
Some observations may have too much “influence” on
1. Their effect on parameter estimates — If the observation isdeleted, the values of parameter estimates are considerablydifferent.
2. Their effect on the goodness-of-fit of the model to data — Ifthe observation is deleted, the change in how well the modelfits the data is large.
3. The effect of coding or misclassification error of the binaryresponse variable on statistic(s) of interest. Statistics ofinterest include fit statistics and/or model parameterestimates.
C.J. Anderson (Illinois) Logistic Regression for Dichotomous Spring 2014 103.1/ 129
Review Interpretation Inference Model checking. GOF Grouping Hosmer-Lemeshow LR ROC Residuals Influence Titanic
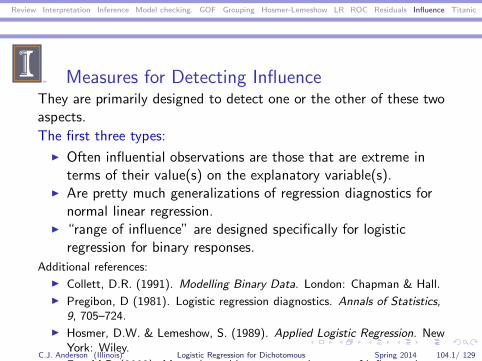
Measures for Detecting InfluenceThey are primarily designed to detect one or the other of these twoaspects.
The first three types:
◮ Often influential observations are those that are extreme interms of their value(s) on the explanatory variable(s).
◮ Are pretty much generalizations of regression diagnostics fornormal linear regression.
◮ “range of influence” are designed specifically for logisticregression for binary responses.
Additional references:
◮ Collett, D.R. (1991). Modelling Binary Data. London: Chapman & Hall.
◮ Pregibon, D (1981). Logistic regression diagnostics. Annals of Statistics,
9, 705–724.
◮ Hosmer, D.W. & Lemeshow, S. (1989). Applied Logistic Regression. NewYork: Wiley.
◮ Fay, M.P. (2002). Measuring a binary response’s range of influence inC.J. Anderson (Illinois) Logistic Regression for Dichotomous Spring 2014 104.1/ 129
Review Interpretation Inference Model checking. GOF Grouping Hosmer-Lemeshow LR ROC Residuals Influence Titanic
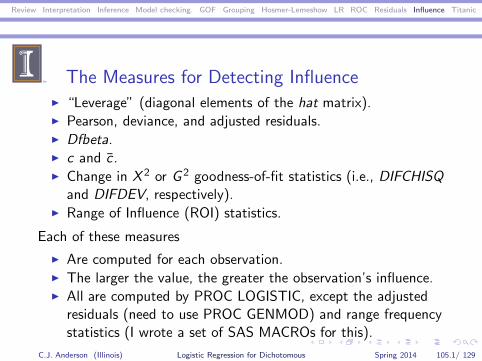
The Measures for Detecting Influence◮ “Leverage” (diagonal elements of the hat matrix).◮ Pearson, deviance, and adjusted residuals.◮ Dfbeta.◮ c and c .◮ Change in X 2 or G 2 goodness-of-fit statistics (i.e., DIFCHISQ
and DIFDEV, respectively).◮ Range of Influence (ROI) statistics.
Each of these measures
◮ Are computed for each observation.◮ The larger the value, the greater the observation’s influence.◮ All are computed by PROC LOGISTIC, except the adjusted
residuals (need to use PROC GENMOD) and range frequencystatistics (I wrote a set of SAS MACROs for this).
C.J. Anderson (Illinois) Logistic Regression for Dichotomous Spring 2014 105.1/ 129
Review Interpretation Inference Model checking. GOF Grouping Hosmer-Lemeshow LR ROC Residuals Influence Titanic
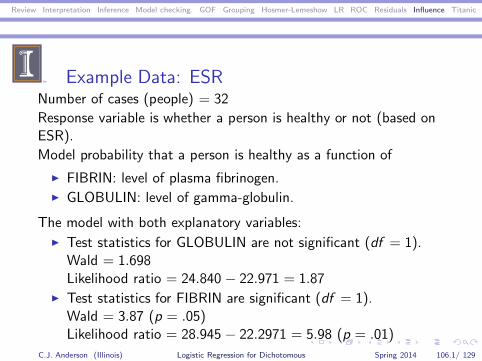
Example Data: ESRNumber of cases (people) = 32
Response variable is whether a person is healthy or not (based onESR).
Model probability that a person is healthy as a function of
◮ FIBRIN: level of plasma fibrinogen.◮ GLOBULIN: level of gamma-globulin.
The model with both explanatory variables:
◮ Test statistics for GLOBULIN are not significant (df = 1).Wald = 1.698Likelihood ratio = 24.840 − 22.971 = 1.87
◮ Test statistics for FIBRIN are significant (df = 1).Wald = 3.87 (p = .05)Likelihood ratio = 28.945 − 22.2971 = 5.98 (p = .01)
C.J. Anderson (Illinois) Logistic Regression for Dichotomous Spring 2014 106.1/ 129
Review Interpretation Inference Model checking. GOF Grouping Hosmer-Lemeshow LR ROC Residuals Influence Titanic
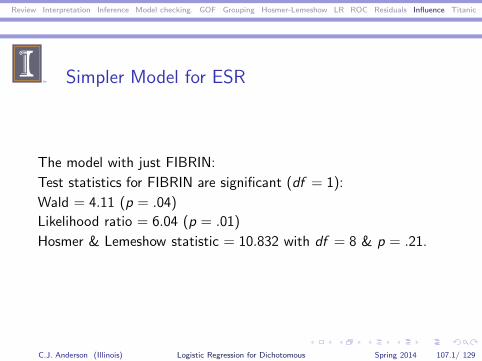
Simpler Model for ESR
The model with just FIBRIN:
Test statistics for FIBRIN are significant (df = 1):
Wald = 4.11 (p = .04)
Likelihood ratio = 6.04 (p = .01)
Hosmer & Lemeshow statistic = 10.832 with df = 8 & p = .21.
C.J. Anderson (Illinois) Logistic Regression for Dichotomous Spring 2014 107.1/ 129
Review Interpretation Inference Model checking. GOF Grouping Hosmer-Lemeshow LR ROC Residuals Influence Titanic
ESR Data & SAS* fibrin = level of plasma fibrinogen (gm/liter)globulin = level of gamma-globulin (gm/liter)response = (0 esr<20 or unhealthy, 1 esr>=20 for healthy)where esr=erythrocyte sedimentation rate;data esr;title’ESR Data’;input id fibrin globulin response @@;n=1;datalines;
1 2.52 38 0 2 2.56 31 0 3 2.19 33 0 4 2.18 31 05 3.41 37 0 6 2.46 36 0 7 3.22 38 0 8 2.21 37 09 3.15 39 0 10 2.60 41 0 11 2.29 36 0 12 2.35 29 0
13 5.06 37 1 14 3.34 32 1 15 2.38 37 1 16 3.15 36 017 3.53 46 1 18 2.68 34 0 19 2.60 38 0 20 2.23 37 021 2.88 30 0 22 2.65 46 0 23 2.09 44 1 24 2.28 36 025 2.67 39 0 26 2.29 31 0 27 2.15 31 0 28 2.54 28 029 3.93 32 1 30 3.34 30 0 31 2.99 36 0 32 3.32 35 0
C.J. Anderson (Illinois) Logistic Regression for Dichotomous Spring 2014 108.1/ 129
Review Interpretation Inference Model checking. GOF Grouping Hosmer-Lemeshow LR ROC Residuals Influence Titanic
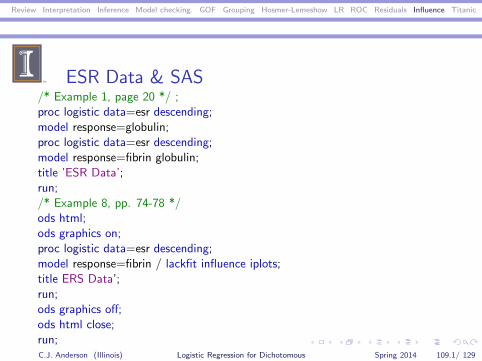
ESR Data & SAS/* Example 1, page 20 */ ;proc logistic data=esr descending;model response=globulin;proc logistic data=esr descending;model response=fibrin globulin;title ’ESR Data’;run;/* Example 8, pp. 74-78 */ods html;ods graphics on;proc logistic data=esr descending;model response=fibrin / lackfit influence iplots;title ERS Data’;run;ods graphics off;ods html close;run;C.J. Anderson (Illinois) Logistic Regression for Dichotomous Spring 2014 109.1/ 129
Review Interpretation Inference Model checking. GOF Grouping Hosmer-Lemeshow LR ROC Residuals Influence Titanic
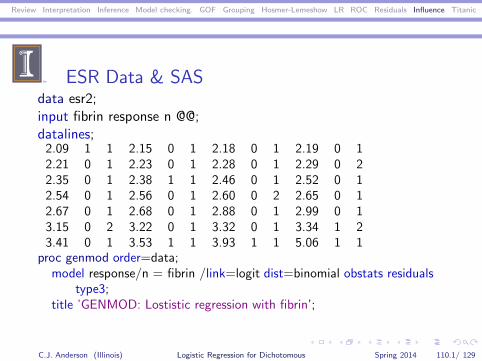
ESR Data & SASdata esr2;input fibrin response n @@;datalines;2.09 1 1 2.15 0 1 2.18 0 1 2.19 0 12.21 0 1 2.23 0 1 2.28 0 1 2.29 0 22.35 0 1 2.38 1 1 2.46 0 1 2.52 0 12.54 0 1 2.56 0 1 2.60 0 2 2.65 0 12.67 0 1 2.68 0 1 2.88 0 1 2.99 0 13.15 0 2 3.22 0 1 3.32 0 1 3.34 1 23.41 0 1 3.53 1 1 3.93 1 1 5.06 1 1
proc genmod order=data;model response/n = fibrin /link=logit dist=binomial obstats residuals
type3;title ’GENMOD: Lostistic regression with fibrin’;
C.J. Anderson (Illinois) Logistic Regression for Dichotomous Spring 2014 110.1/ 129
Review Interpretation Inference Model checking. GOF Grouping Hosmer-Lemeshow LR ROC Residuals Influence Titanic
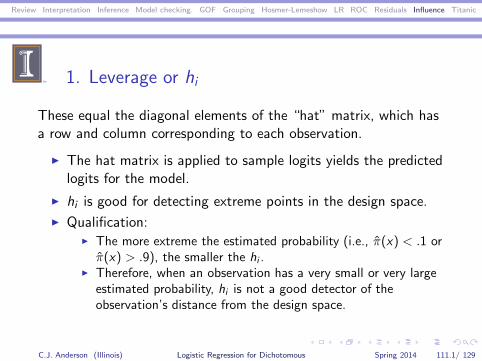
1. Leverage or hi
These equal the diagonal elements of the “hat” matrix, which hasa row and column corresponding to each observation.
◮ The hat matrix is applied to sample logits yields the predictedlogits for the model.
◮ hi is good for detecting extreme points in the design space.
◮ Qualification:◮ The more extreme the estimated probability (i.e., π(x) < .1 or
π(x) > .9), the smaller the hi .◮ Therefore, when an observation has a very small or very large
estimated probability, hi is not a good detector of theobservation’s distance from the design space.
C.J. Anderson (Illinois) Logistic Regression for Dichotomous Spring 2014 111.1/ 129
Review Interpretation Inference Model checking. GOF Grouping Hosmer-Lemeshow LR ROC Residuals Influence Titanic
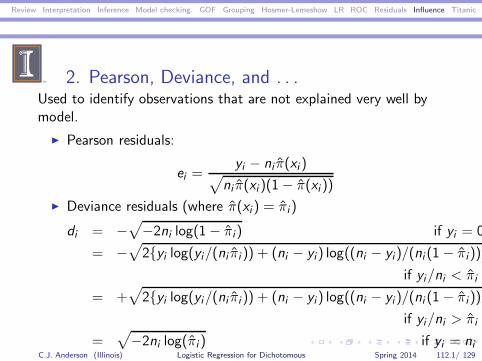
2. Pearson, Deviance, and . . .Used to identify observations that are not explained very well bymodel.
◮ Pearson residuals:
ei =yi − ni π(xi )√
ni π(xi )(1− π(xi ))
◮ Deviance residuals (where π(xi ) = πi)
di = −√
−2ni log(1− πi) if yi = 0
= −√
2{yi log(yi/(ni πi )) + (ni − yi) log((ni − yi)/(ni (1− πi)))
if yi/ni < πi
= +√
2{yi log(yi/(ni πi )) + (ni − yi) log((ni − yi)/(ni (1− πi)))
if yi/ni > πi
=√
−2ni log(πi ) if yi = niC.J. Anderson (Illinois) Logistic Regression for Dichotomous Spring 2014 112.1/ 129
Review Interpretation Inference Model checking. GOF Grouping Hosmer-Lemeshow LR ROC Residuals Influence Titanic
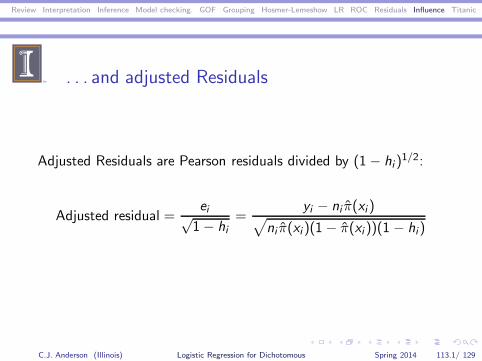
. . . and adjusted Residuals
Adjusted Residuals are Pearson residuals divided by (1− hi )1/2:
Adjusted residual =ei√1− hi
=yi − ni π(xi )√
ni π(xi )(1− π(xi ))(1 − hi)
C.J. Anderson (Illinois) Logistic Regression for Dichotomous Spring 2014 113.1/ 129
Review Interpretation Inference Model checking. GOF Grouping Hosmer-Lemeshow LR ROC Residuals Influence Titanic
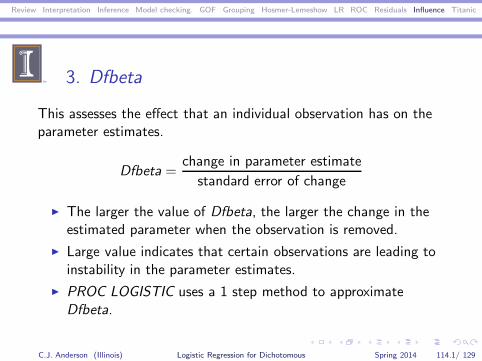
3. Dfbeta
This assesses the effect that an individual observation has on theparameter estimates.
Dfbeta =change in parameter estimate
standard error of change
◮ The larger the value of Dfbeta, the larger the change in theestimated parameter when the observation is removed.
◮ Large value indicates that certain observations are leading toinstability in the parameter estimates.
◮ PROC LOGISTIC uses a 1 step method to approximateDfbeta.
C.J. Anderson (Illinois) Logistic Regression for Dichotomous Spring 2014 114.1/ 129

Review Interpretation Inference Model checking. GOF Grouping Hosmer-Lemeshow LR ROC Residuals Influence Titanic
4. c and cThese measure the change in the joint confidence interval for theparameters produced by deleting an observation.
◮ These use the same idea as “Cook distances” in ordinarylinear regression.
◮ PROC LOGISTIC uses a 1 step method to approximate them
ci =e2i hi
(1− hi)2
and
ci =eihi
(1− hi )
◮ In using these statistics, it is useful to plot them versus someindex (e.g., observation number).
C.J. Anderson (Illinois) Logistic Regression for Dichotomous Spring 2014 115.1/ 129
Review Interpretation Inference Model checking. GOF Grouping Hosmer-Lemeshow LR ROC Residuals Influence Titanic
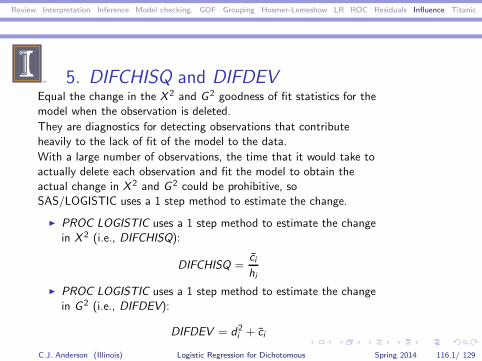
5. DIFCHISQ and DIFDEVEqual the change in the X 2 and G 2 goodness of fit statistics for themodel when the observation is deleted.
They are diagnostics for detecting observations that contributeheavily to the lack of fit of the model to the data.
With a large number of observations, the time that it would take toactually delete each observation and fit the model to obtain theactual change in X 2 and G 2 could be prohibitive, soSAS/LOGISTIC uses a 1 step method to estimate the change.
◮ PROC LOGISTIC uses a 1 step method to estimate the changein X 2 (i.e., DIFCHISQ):
DIFCHISQ =ci
hi
◮ PROC LOGISTIC uses a 1 step method to estimate the changein G 2 (i.e., DIFDEV):
DIFDEV = d2i + ci
C.J. Anderson (Illinois) Logistic Regression for Dichotomous Spring 2014 116.1/ 129
Review Interpretation Inference Model checking. GOF Grouping Hosmer-Lemeshow LR ROC Residuals Influence Titanic
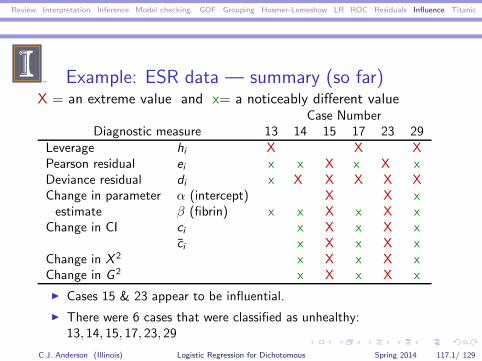
Example: ESR data — summary (so far)X = an extreme value and x= a noticeably different value
Case NumberDiagnostic measure 13 14 15 17 23 29
Leverage hi X X XPearson residual ei x x X x X xDeviance residual di x X X X X XChange in parameter α (intercept) X X xestimate β (fibrin) x x X x X x
Change in CI ci x X x X xci x X x X x
Change in X 2 x X x X xChange in G 2 x X x X x
◮ Cases 15 & 23 appear to be influential.
◮ There were 6 cases that were classified as unhealthy:13, 14, 15, 17, 23, 29
C.J. Anderson (Illinois) Logistic Regression for Dichotomous Spring 2014 117.1/ 129
Review Interpretation Inference Model checking. GOF Grouping Hosmer-Lemeshow LR ROC Residuals Influence Titanic
Range of Influence (ROI) Statistic
Reference: Fay, M.P. (2002). Measuring a binary response’s rangeof influence in logistic regression. American Statistician, 56, 5–9.
◮ Purpose/Problem:◮ There is always the possibility that there was a
misclassification on the response variable or a data entry errorin the response variable.
◮ If it is difficult to check the classification (time consumingand/or expensive), you would like to identify a sub-set of“questionable” cases.
◮ Solution: Range of Influence Statistic.
C.J. Anderson (Illinois) Logistic Regression for Dichotomous Spring 2014 118.1/ 129
Review Interpretation Inference Model checking. GOF Grouping Hosmer-Lemeshow LR ROC Residuals Influence Titanic
Computing ROI Statistic
1. Fit the logistic regression model using data (as is).
2. For each case, change the value of the (binary) responsevariable,
y∗i = 1− yi ,
and re-fit the logistic regression model.
3. Compute the difference between statistics using the changeddata and the un-altered data, which is called the “Range ofInfluence Statistic.”
4. Look for cases that have extreme values.
C.J. Anderson (Illinois) Logistic Regression for Dichotomous Spring 2014 119.1/ 129
Review Interpretation Inference Model checking. GOF Grouping Hosmer-Lemeshow LR ROC Residuals Influence Titanic
ROI Statistic: ESR dataModel that we settled on was
logit(πi ) = α+ β(fibrin)i
= −6.8451 + 1.8271(fibrin)i
Which has ln(likelihood) = −12.4202.
We’ll look at ROI statistics for◮ Intercept:
∆(α)i = α∗
i − α = α∗
i − (−6.8451)
◮ Slope for fibrin:
∆(β)i = β∗
i − β = β∗
i − 1.8271
◮ Goodness-of-fit:
∆(lnlike)i = ln(likelihood)∗i −ln(likelihood) = ln(likelihood)∗i −12.4202)
C.J. Anderson (Illinois) Logistic Regression for Dichotomous Spring 2014 120.1/ 129
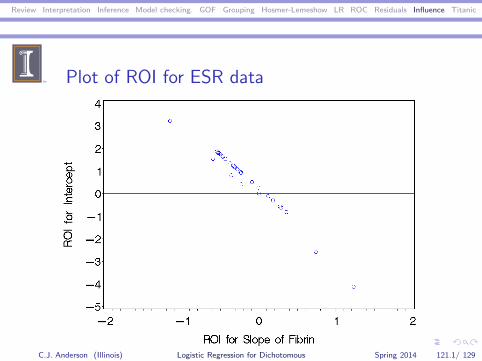
Review Interpretation Inference Model checking. GOF Grouping Hosmer-Lemeshow LR ROC Residuals Influence Titanic
Plot of ROI for ESR data
C.J. Anderson (Illinois) Logistic Regression for Dichotomous Spring 2014 121.1/ 129
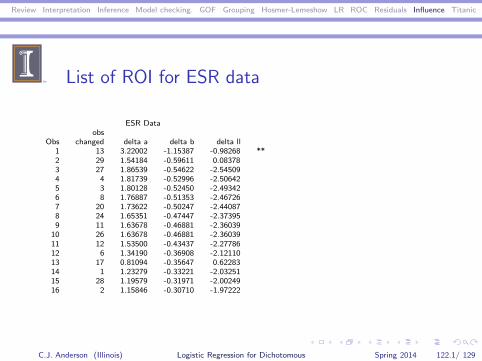
Review Interpretation Inference Model checking. GOF Grouping Hosmer-Lemeshow LR ROC Residuals Influence Titanic
List of ROI for ESR data
ESR Dataobs
Obs changed delta a delta b delta ll1 13 3.22002 -1.15387 -0.98268 **2 29 1.54184 -0.59611 0.083783 27 1.86539 -0.54622 -2.545094 4 1.81739 -0.52996 -2.506425 3 1.80128 -0.52450 -2.493426 8 1.76887 -0.51353 -2.467267 20 1.73622 -0.50247 -2.440878 24 1.65351 -0.47447 -2.373959 11 1.63678 -0.46881 -2.36039
10 26 1.63678 -0.46881 -2.3603911 12 1.53500 -0.43437 -2.2778612 6 1.34190 -0.36908 -2.1211013 17 0.81094 -0.35647 0.6228314 1 1.23279 -0.33221 -2.0325115 28 1.19579 -0.31971 -2.0024916 2 1.15846 -0.30710 -1.97222
C.J. Anderson (Illinois) Logistic Regression for Dichotomous Spring 2014 122.1/ 129
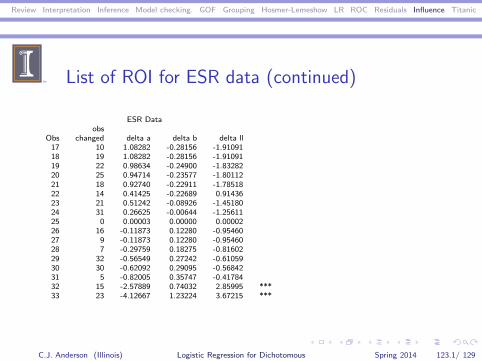
Review Interpretation Inference Model checking. GOF Grouping Hosmer-Lemeshow LR ROC Residuals Influence Titanic
List of ROI for ESR data (continued)
ESR Dataobs
Obs changed delta a delta b delta ll17 10 1.08282 -0.28156 -1.9109118 19 1.08282 -0.28156 -1.9109119 22 0.98634 -0.24900 -1.8328220 25 0.94714 -0.23577 -1.8011221 18 0.92740 -0.22911 -1.7851822 14 0.41425 -0.22689 0.9143623 21 0.51242 -0.08926 -1.4518024 31 0.26625 -0.00644 -1.2561125 0 0.00003 0.00000 0.0000226 16 -0.11873 0.12280 -0.9546027 9 -0.11873 0.12280 -0.9546028 7 -0.29759 0.18275 -0.8160229 32 -0.56549 0.27242 -0.6105930 30 -0.62092 0.29095 -0.5684231 5 -0.82005 0.35747 -0.4178432 15 -2.57889 0.74032 2.85995 ***33 23 -4.12667 1.23224 3.67215 ***
C.J. Anderson (Illinois) Logistic Regression for Dichotomous Spring 2014 123.1/ 129
Review Interpretation Inference Model checking. GOF Grouping Hosmer-Lemeshow LR ROC Residuals Influence Titanic
SAS & Computing ROISAS/MACRO%RangeOfInfluence(indata=esr,rangedata=range,samplesize=32,
obs=response,Y=response,linpred=fibrin,discrete=);where
◮ The response variable should equal 0/1◮ In main macro “%rangeinfluence”
◮ indata= the data set that is being analyzed◮ rangedata= data set that is output that included parameter
estimates and loglike for complete data set (1st line) andchanging the response of each of the lines of data (one at atime).Use this data set to compute desired range of influencestatistics.
◮ samplesize= number of observations◮ obs= name of the identification variable (like an id). Macro
assumes this equals 1 - sample size◮ Y = name of the response variable◮ linpred = list of variables in the linear predictor◮ discrete = list of discrete (nominal) variables in the linear
predictor
C.J. Anderson (Illinois) Logistic Regression for Dichotomous Spring 2014 124.1/ 129
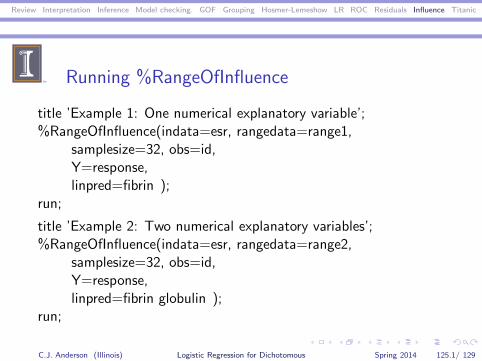
Review Interpretation Inference Model checking. GOF Grouping Hosmer-Lemeshow LR ROC Residuals Influence Titanic
Running %RangeOfInfluence
title ’Example 1: One numerical explanatory variable’;%RangeOfInfluence(indata=esr, rangedata=range1,
samplesize=32, obs=id,Y=response,linpred=fibrin );
run;
title ’Example 2: Two numerical explanatory variables’;%RangeOfInfluence(indata=esr, rangedata=range2,
samplesize=32, obs=id,Y=response,linpred=fibrin globulin );
run;
C.J. Anderson (Illinois) Logistic Regression for Dichotomous Spring 2014 125.1/ 129
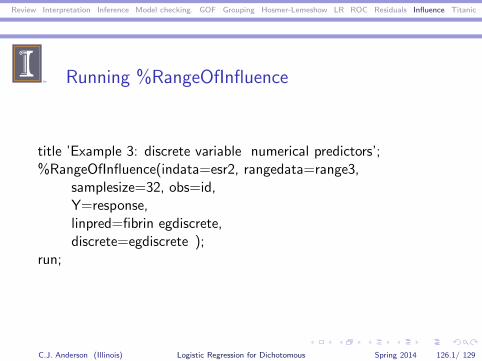
Review Interpretation Inference Model checking. GOF Grouping Hosmer-Lemeshow LR ROC Residuals Influence Titanic
Running %RangeOfInfluence
title ’Example 3: discrete variable numerical predictors’;%RangeOfInfluence(indata=esr2, rangedata=range3,
samplesize=32, obs=id,Y=response,linpred=fibrin egdiscrete,discrete=egdiscrete );
run;
C.J. Anderson (Illinois) Logistic Regression for Dichotomous Spring 2014 126.1/ 129
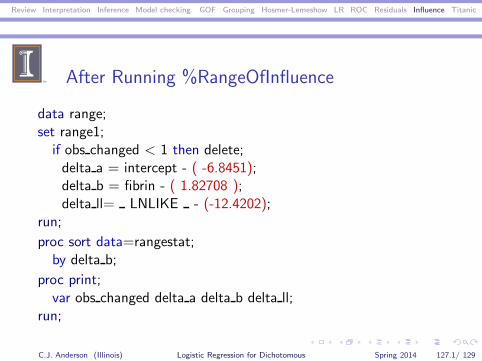
Review Interpretation Inference Model checking. GOF Grouping Hosmer-Lemeshow LR ROC Residuals Influence Titanic
After Running %RangeOfInfluence
data range;set range1;
if obs changed < 1 then delete;delta a = intercept - ( -6.8451);delta b = fibrin - ( 1.82708 );delta ll= LNLIKE - (-12.4202);
run;
proc sort data=rangestat;by delta b;
proc print;var obs changed delta a delta b delta ll;
run;
C.J. Anderson (Illinois) Logistic Regression for Dichotomous Spring 2014 127.1/ 129
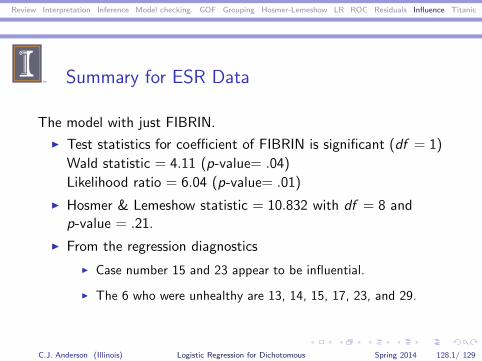
Review Interpretation Inference Model checking. GOF Grouping Hosmer-Lemeshow LR ROC Residuals Influence Titanic
Summary for ESR Data
The model with just FIBRIN.
◮ Test statistics for coefficient of FIBRIN is significant (df = 1)
Wald statistic = 4.11 (p-value= .04)
Likelihood ratio = 6.04 (p-value= .01)
◮ Hosmer & Lemeshow statistic = 10.832 with df = 8 andp-value = .21.
◮ From the regression diagnostics
◮ Case number 15 and 23 appear to be influential.
◮ The 6 who were unhealthy are 13, 14, 15, 17, 23, and 29.
C.J. Anderson (Illinois) Logistic Regression for Dichotomous Spring 2014 128.1/ 129
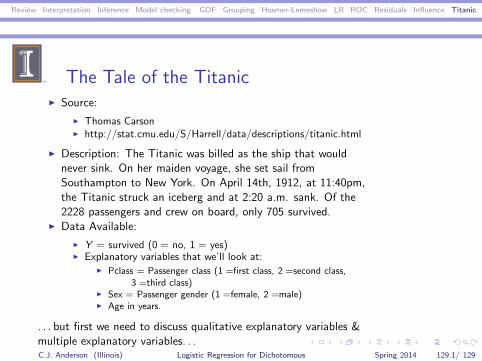
Review Interpretation Inference Model checking. GOF Grouping Hosmer-Lemeshow LR ROC Residuals Influence Titanic
The Tale of the Titanic◮ Source:
◮ Thomas Carson◮ http://stat.cmu.edu/S/Harrell/data/descriptions/titanic.html
◮ Description: The Titanic was billed as the ship that wouldnever sink. On her maiden voyage, she set sail fromSouthampton to New York. On April 14th, 1912, at 11:40pm,the Titanic struck an iceberg and at 2:20 a.m. sank. Of the2228 passengers and crew on board, only 705 survived.
◮ Data Available:
◮ Y = survived (0 = no, 1 = yes)◮ Explanatory variables that we’ll look at:
◮ Pclass = Passenger class (1 =first class, 2 =second class,3 =third class)
◮ Sex = Passenger gender (1 =female, 2 =male)◮ Age in years.
. . . but first we need to discuss qualitative explanatory variables &multiple explanatory variables. . .C.J. Anderson (Illinois) Logistic Regression for Dichotomous Spring 2014 129.1/ 129