


Languages
Pages
Legal

January 2015
Full Glass Research
The Economic Impact of the
Wine and Wine Grape Industries
on the Oregon Economy
Copyright ©2015 by Full Glass Research
Economic Impact of Oregon State Wine
Full Glass Research - 2 -
Executive Summary Economic Value
The sum of all economic activity in Oregon related directly or indirectly
to wine is over $3.35 billion. The net economic contribution, a measure
of value added, is $1.4 billion. Other notable statistics:
In 2013, estimated wine-related jobs in Oregon totaled 17,099; related
wages topped $527 million.
Over 950 Oregon wine grape growers produced a crop whose total
value in 2013 was $128 million.
605 Oregon wineries or wine companies bottled 2,780,237 nine-liter
cases of wine and had revenues of over $363 million in 2013 from the
sale of packaged wine. Oregon wines shipped to other states/countries
brought in over $127 million in revenue, while direct-to-consumer
shipments added another $52 million.
Retail sales of wine in Oregon from all sources were $816.6 million in
2013.
In 2013 wine-related tourism contributed $207.5 million in revenues
to the Oregon economy.
Wine-related activities contributed over $63 million in tax and
licensing revenues to the state government in 2013, as well as
supporting $64.9 million in local property taxes.
The Oregon wine and wine grape industries contribute an estimated
$11.3 million annually to charities.
The post-recession years of 2011-2014 have seen renewed optimism
and investment in the Oregon wine industry, with planted acres
increasing 18%, the number of wineries increasing by 45% and wine
sales volume up 39%, resulting in vineyard and winery spending of
between $63 and 110 million to increase production capacity.

Economic Impact of Oregon State Wine
Full Glass Research - 3 -
Growth
After a weak period during the 2008-2009 recession, growth in the Oregon
wine industry rebounded strongly and once again outpaced that of the
economy. Since the last report (released in 2011) wine grape acreage
increased 18%, tons crushed by 83%, the number of Oregon wineries
increased by 45%, and case sales of Oregon wine increased by 39%. Within
the state of Oregon, volume sales of wine from all regions grew by 18%,
producing revenues of $816.6 million and 4,797 jobs for the retailers and
restaurants selling them. From 2010 to 2013, Oregon winery revenues
increased 49% and their net economic impact on the state grew by 28%.
Quality over Quantity
Oregon winegrowers have maintained their focus on the higher-priced,
higher-quality segment of the wine market, turning the state’s low yields and
tricky climate into an asset. Of the wine producing states, Oregon growers
continue to achieve the highest average price per ton while Oregon wineries
realize the highest average revenues per case. Nonetheless, the increased
size and sophistication of the industry in Oregon, combined with their
reputation for quality, is enabling Oregon wineries to expand distribution in
many states and penetrate the higher volume upper-middle price segment.
Oregon’s reputation for high quality, natural beauty, and intimate, small-
scale production considerably boosts its appeal for wine tourism.
Outlook
The outlook for the Oregon wine industry is positive. The demographic and
cultural trends that favor high quality and distinctive fine wines remain
intact. Demand for Pinot Noir, Oregon’s leading grape, continues to grow at
a faster rate than most other varieties. Oregon has managed to maintain a
price premium for its leading white grape, Pinot Gris, despite substantial
competition from California and Italy. Oregon wineries have continued to
make progress in expanding their market outside the state, through wine
tourism, direct-to-consumer shipments, and sales to distributors in the rest of
the U.S. Investors and wine companies outside the state are clearly
optimistic on Oregon’s future. During 2012-2014, four of the top twenty
Economic Impact of Oregon State Wine
Full Glass Research - 4 -
largest wine companies in the U.S., as well as three of the most prestigious
and successful wine producers from Burgundy in France, purchased or
expanded holdings in Oregon. However, the industry cannot become
complacent; competition from other wine regions continues to be fierce and
small family wineries in Oregon have a harder time navigating the
concentrated wholesale tier in many states, compared to larger California
and Washington competitors.

Economic Impact of Oregon State Wine
Full Glass Research - 5 -
Table of Contents
Contents
Executive Summary ........................................................................................................... 2
Introduction ........................................................................................................................ 7
Wine in the Economy ...................................................................................................... 7
Outside Investment .......................................................................................................... 9
Economic Impact vs. Revenues vs. Profitability ............................................................. 9
Wine in Oregon ............................................................................................................. 10
Outlook .......................................................................................................................... 11
The Wine Market in the U.S. & Oregon ......................................................................... 14
Growth in American Wine Consumption ...................................................................... 14
Wine Sales ........................................................................................................................ 18
Grape & Wine Production ............................................................................................... 21
Winegrowing Regions in Oregon .................................................................................. 21
Vineyard Maintenance, Management & Equipment ..................................................... 34
Wineries ........................................................................................................................ 34
Winery Maintenance and Equipment Investment ......................................................... 35
Environmental Impacts and Investment ........................................................................ 36
Industry Employment ....................................................................................................... 38
Allied Industries ............................................................................................................... 40
Distribution (Wholesalers, brokers, importers) ............................................................ 40
Tourism ......................................................................................................................... 41
Grapevine Nurseries ..................................................................................................... 42
Equipment and Supplies ................................................................................................ 42
Corks & Closures & Other Packaging ......................................................................... 42
Glass ............................................................................................................................. 43
Bottling & Filtration Services, Custom Crush .............................................................. 44
Trucking, Transportation & Warehousing ................................................................... 45
Stainless Steel Tanks & Related Equipment ................................................................. 45
Wine Labels and Other Printing ................................................................................... 46
Cooperage & Barrel-related services ........................................................................... 47
Economic Impact of Oregon State Wine
Full Glass Research - 6 -
Industry Associations .................................................................................................... 48
Services – Banking, Consulting, Accounting, Insurance, etc. ...................................... 49
Other Economic Effects ................................................................................................... 49
Taxes & Regulation ...................................................................................................... 49
Tax Type ........................................................................................................................... 50
Oregon State Liquor Control Commission ................................................................... 50
Charitable Contributions .............................................................................................. 51
Direct, Indirect and Induced Effects ............................................................................... 52
IMPLAN Modeling ........................................................................................................ 52
Measuring Net Economic Effects .................................................................................. 53
Health Effects of Wine in the Economy ........................................................................ 54
Total Oregon State Economic Impact ............................................................................. 55
Appendix 1 – Review of Changes since 2004 .................................................................. 57
Appendix 2 – Impact of Oregon Wineries & Vineyards ................................................. 59
Appendix 3 – Note on Vineyard & Winery Wages .......................................................... 60
Appendix 4 – Regional & County Impact ....................................................................... 61
Wine Industry Economic Impact by County 2013............................................................. 63
Sources ............................................................................................................................. 64
About Full Glass Research ........................................................................................... 65
About the Oregon Wine Board and Oregon Winegrowers Association ....................... 65

Economic Impact of Oregon State Wine
Full Glass Research - 7 -
Introduction
The Oregon wine industry continues to expand while maintaining its roots in family
winemaking and artisanal quality products. Since the first economic impact study (2005),
there has been dramatic growth in production, revenues and jobs. The industry has
reinvested and attracted outside investment, and rebounded from the recession to become
one of Oregon’s leading agricultural products.
Wine in the Economy
Wine is more than just an agricultural commodity. Wine is a consumer product, produced
in a capital-intensive manner, and requires a wide variety of labor and services to reach
the consumer. This impact is reflected in wages, revenues, taxes and spending on
agricultural and production technology and supplies. Associated industries such as
distribution, tourism, and retailing greatly benefit from the Oregon wine business. There
is also the multiplier effect created by purchases by the industry from suppliers and
service firms as well as the spending of wages paid by the industry within the Oregon
economy.
As a finished consumer product, wine typically adds more value and keeps more of its
profit margin inside the state economy than many other agricultural products. Most
agricultural products are exported from their production region or sold to processors in
their raw form. Many of the processors in turn sell their products on international bulk
markets, which tend to be highly competitive with low margins. The final products may
pass through numerous out-of-state entities and markups before reaching the consumer.
As a result, a relatively small amount of the profits are retained in the local economy.
Oregon wine producers retain more of their revenue stream locally. They crush grapes
and produce wine, but also do the packaging, marketing and selling to wholesalers or
foreign importers. In addition, wine maintains higher margins in the distribution system
than most other foods and beverages. Some of the distribution channels (fine wine shops,
restaurants, wholesale on-premise specialists) are labor intensive. It should be noted that
wine consumed in the state of Oregon (not just wine produced in-state) provides revenues
from which restaurant and retail store owners and their employees are paid. Distribution
of wines from producer tier through the wholesale tier to the retail/restaurant tier provides
additional wages and employment. Each tier also contributes taxes.
The romance and appeal of wineries and vineyards make wine regions a strong attraction
for tourists. The upscale demographics of wine consumption ensure that many wine
tourists spend more than the average visitor, boosting restaurant and hotel revenues in
wine regions.
All of these effects are estimated explicitly or in IMPLAN modeling in the following
report. (See page 51 for an explanation of IMPLAN modeling)

Economic Impact of Oregon State Wine
Full Glass Research - 8 -
This report outlines the various sectors of the Oregon wine industry. The areas examined
include: wine production and sales, grape cultivation, allied industries, wine sales, and
various other economic benefits such as taxes and charitable contributions. Where
possible, sales and employment figures have been provided within each of these areas.
Data for this report was collected from June 2014 through November 2014. Unless
otherwise noted, calculations are based on 2013 data.
This is the third assessment of the industry’s economic impact, previous reports having
been published in 2006 and 2011, based on 2004-5 and 2010 data respectively. The
increase in the economic impact of the Oregon wine industry has been substantial, due to
steady growth in sales and two spurts of industry investment. The first period of growth
occurred from 2005 to 2008, with a tremendous surge in vineyard plantings plus
increases in the number of wineries, and industry employment. After a two year pause,
renewed growth occurring from 2011 to the current date has brought in outside investors,
more new wineries, and a major investment in new capacity. The Oregon wine industry’s
original focus on quality has paid off, with increased revenues and a broadening of
markets.
Outside Investment
Oregon’s success and fundamental qualities have not gone unnoticed, and a number of
important wine industry firms have invested or boosted their holdings in Oregon in the
past several years. The following are the most prominent examples:
Kendall Jackson: purchased Gran Moraine, Zena Crown vineyards in January
2013;
Kendall Jackson purchased Solena winery in May 2013;
Precept Wines purchased Yamhela vineyard in May 2013;
Kendall Jackson purchased Maple Grove vineyard in May 2013;
Louis Jadot purchased Resonance vineyard in August 2013;
Domaine Drouhin purchased Roserock vineyard in December 2013;
Foley Family Wines purchased the Four Graces brand & vineyards in March
2014;
Ch. Ste. Michelle purchased the Willakia vineyard in March 2014; and
Méo-Camuzet purchased the Bishop Creek vineyard in September 2014.
Positive effects of this trend may include: additional investment in winemaking
equipment; renewals or upgrades of facilities and equipment; additional hiring of winery
and vineyard personnel; expanded distribution of Oregon wines outside Oregon as the
newcomers leverage their distribution networks and sales forces; and possible

Economic Impact of Oregon State Wine
Full Glass Research - 9 -
reinvestment of proceeds of the sale by local or in-state owners. All of this is captured for
2013 in this report, but not 2014.
The potential negative effects of purchases include the repatriation of profits to out-of-
state owners that were formerly reinvested in the state, and possible transfer of some
administrative and sales/marketing and management positions elsewhere. So far there has
been little sign of economic benefits transferring out of state. The money being invested
in the vineyards will not be producing profitable wines for a couple of years due to
production lead time. The vineyard purchases by domestic companies were largely made
with intent to furnish Oregon wineries with additional grapes, while the Burgundians
(Meo-Camuzet, Jadot, Drouhin) are all developing distinct Oregon brands.
When reviewing the changes from the 2005 & 2011 reports (based on 2004 & 2010 data),
readers should bear in mind the following.
The difference between the 2010 and 2013 harvest conditions. It was something
of a useful coincidence for comparative analysis that both 2004 and 2010 (data
years for previous reports) were short crops. However, 2013 was a larger harvest
with higher yields than in 2004 or 2010. Combined with increased acreage, this
significantly boosted the results for the vineyard sector of this report.
There have been some revisions to data and methodology in the 2014 report, to
improve accuracy and completeness. These include: a change in the calculation of
on-premise revenues and markups; more accurate pricing of Direct-to-Consumer
sales and exported wine in the winery revenue model; and the addition of job and
revenue data for certain retail channels beyond food and wine shops. See page 56
for complete details and comparison of the 2014 report with 2011.
Economic Impact vs. Revenues vs. Profitability
Although the profitability and investment returns of vineyards and wineries are outside
the scope of this analysis, the differences between them and economic impact should be
clarified. The long lead times and capital-intensive nature of the wine industry gives it
significant economic impact relative to its sales revenues. However, these factors also can
constrain profitability and return on investment. Analyses by Tony Correia (The Correia
Company) and Nat DiBuduo (Allied Grape Growers) have found that many wineries and
vineyards do not earn a reasonable risk-adjusted operating return at typical real estate or
asset transaction prices.1 The track record for publicly held companies in the wine sector
is generally poor and these companies often end up returning to private hands. Although
returns have risen recently, Tony Correia has pointed out that this is in large part due to
low interest rates allowing leverage for equity investors, but that rates of return on the
overall enterprise are still low.1 Some of the factors to bear in mind when assessing
profitability and revenues in the wine business include:
1 Tony Correia presentation Vineyard Economics 2009; Nat DiBuduo presentation Unified Grape & Wine
Symposium 2011; Stockton Record June 24, 2012; Tony Correia interview November 2014

Economic Impact of Oregon State Wine
Full Glass Research - 10 -
The difference between economic impact (which is a sum of all spending and
investment) and profits (which are the differences between costs and revenues). It
is possible for an industry with high and increasing economic impact (typically a
growth industry) to have fairly low, current profitability and net cash flow as
investment in production and capacity move ahead of revenue.
There is a weak relationship between bottle price and profitability. In addition to
higher production costs, high bottle prices imply lower volume and hence less
total revenue to support fixed costs. High priced wines compete in a very
fragmented market where no winery achieves high market share.
The economic impact accumulates as wine travels through the distribution
system. However, different industry tiers have profitability that tends to vary
independently of each other. Low grape prices may be bad for growers but boost
winery margins. An excess supply of wine from other states or countries may
boost wholesaler and importer sales and margins but weaken Oregon winery
sales. In the last recession, sales and profits increased for many off-premise
retailers while restaurants suffered major drops in traffic and from trading down
in wine sales.
The wine industry contends with a very long supply chain – it takes five years for
a vineyard to achieve mature yields and wine typically spends 1-3 years aging in
inventory. Thus wineries have very high inventory costs compared to many
agricultural products. In addition, the grape industry and wine production have
their own cycles somewhat independent of the economic and business cycles, as
supply and demand shift their balance.
Wineries are capital intensive, in part because much of their specialized
equipment gets only one usage or just a few turns per year, unlike breweries,
distilleries, or most food companies. Similarly, vineyards give only one crop per
year, in contrast to rotating market or table crops.
Readers should also keep in mind that the economic impact totaled at the end of the
report includes revenues from all tiers of the supply chain. In some cases, one tier’s
revenue is wholly or partly the next tier’s costs. Those interested in the net impact should
refer to page 53.
Wine in Oregon
The Oregon wine industry originated with small-scale producers aiming to produce very
high quality wines. This is unique and has set a different pattern and structure for the
Oregon industry than the other major wine-producing states. The California industry
originated in supplying inexpensive wines for local use by the missions and immigrants
and has gone through several boom and bust periods. It is now the dominant source of
domestic wine volume overall in the United States, competing in all price categories. The
state of Washington’s industry was established primarily by supplying competitive mid-
priced wine and was boosted significantly by both corporate investment and conversion
of large-scale agribusiness. California, New York and Washington all have substantial

Economic Impact of Oregon State Wine
Full Glass Research - 11 -
non-wine grape industries, unlike Oregon. States such as Virginia and Missouri, although
they tend towards small-scale wine production, are almost entirely dependent on the local
market.
Despite the dramatic growth in Oregon’s wine production and value, the industry is still
primarily in the hands of small to medium size producers, based primarily in Oregon. The
largest three wine producers in Oregon would rank 52nd
, 53rd
and 76th
in California. The
dominance of small-scale production and ownership, plus high production costs, means
Oregon cannot provide the majority of the wine consumed by the state.
Oregon’s unique positioning has been successful, spurring growth in both acreage and the
number of wineries. In 1970 there were just five bonded wineries and 35 recorded acres.
This had grown to 34 wineries and 1,100 acres by 1980. By 2005, the number of wineries
had increased to 247 and plantings reached 13,700 acres. The winery count by 2013 had
risen to 605 (including using custom-crush facilities), and there were nearly 24,000 acres
planted in wine grapes2. Sales of Oregon wine rose from 1.29 million and $157 million in
winery revenues cases in 2004, to 2.68 million cases and $362 million in revenues in
2013.3
Outlook
The outlook for the next decade of wine business in Oregon is positive. Familiarity with
Oregon wines has increased among American wine consumers. Among core wine
consumers, recent purchase of Oregon wines climbed from 19% in 2005 to 25% in 2012
(WMC).4 A tracking study using the Wine Opinions national consumer panel showed
regular purchasing of Oregon wines among high end wine consumers to increase from
22% (2008) to 36% (2010) to 41% (2013).5 Value and quality perceptions increased
significantly among the panelists during the same period. Nearly as important, visibility
and distribution for Oregon wines has increased. The proportion of consumers saying
Oregon wines “aren’t easy to find on the shelves” declined from 32% in 2009 to 24% in
2014. The percent agreeing that their preferred stores “carry many wines from this region
(Oregon) and can recommend them” rose from 33% in 2009 to 52% in 2014.6
While the macroeconomic recovery from the 2008-2009 recession has been sluggish,
wine sales have recovered faster than most industries. Scan data from retail chains,
commerce department data, the Silicon Valley Bank’s ultra-premium winery survey and
other data sources all confirm a strong rebound in both volume and revenue since 2010.
Demographically, wine consumers skew towards white collar occupations, lower
unemployment rates, higher than average educational attainment and higher than average
2 OASS, SOURCE
3 OASS, Full Glass Research
4 Wine Market Council total U.S. tracking studies 2005, 2012
5 Wine Opinions 2008, 2010, 2013 (high end consumers = those purchasing wine $20+/bottle monthly or
more often.) For more details on the Wine Opinions panels, see www.wine opinions.com 6 Wine Opinions 2009, 2014
Economic Impact of Oregon State Wine
Full Glass Research - 12 -
income. These demographic factors make wine consumers less vulnerable to the
recession’s impact.
Pinot noir, Oregon’s leading grape, continues to be one of the fastest growing varieties in
the wine trade. Driven by a combination of its upscale image, publicity from the movie
Sideways and a general rise in red wine consumption, annual growth in sales of Pinot
noir has averaged 12% from 2005 to 2013.7 Furthermore, Oregon can still achieve
significant growth for its Pinot noir through increased trial and distribution, whereas
California is closer to saturation on both of these measures among core wine consumers.
New regions within Oregon are expanding and diversifying Oregon’s wine industry.
Southern Oregon and the Columbia Valley have grown from 24% of acreage in 2010 to
28% now. In Southern Oregon, the Umpqua, Applegate and Rogue River Valleys are
featuring varieties that don’t ripen as easily in the Willamette Valley. On the other hand,
their favorable growing conditions and lower costs enable them to play a crucial role as
part of the blend for highly competitive wines bearing the basic Oregon designation. Such
high-value wines are important for expanding Oregon’s distribution outside the
Northwest and gaining consumer trial for Oregon wine. The Columbia River region is
developing vineyards both to feed Oregon demand and as spillover from Washington’s
burgeoning Walla Walla region.
Despite substantial numbers of tourists and a thriving, high-quality wine industry, the
percentage of Oregon visitors who visit wineries is still lower than even some of the less
well-known California wine regions. Wine tourists spend considerable sums of money on
hotels, restaurants and shopping. They also boost direct-to-consumer sales of wine, i.e.
wine purchased directly from the winery by consumers at the winery, or via its website,
catalog or club membership. Direct-to-consumer is the sales channel with the revenue
source with the highest margins for wineries. Although growth has accelerated (see
Tourism impact pages 40), there is still much potential.
Maintaining leadership in sustainable and organic viticulture is an important challenge
for Oregon for both civic and economic reasons, but also as a potential competitive
advantage in a crowded wine market. Market research shows Oregon as a state has a
“greener” image, but this hasn’t been translated as well into wine.8 However, this is
starting to shift – a 2014 study of the national Wine Opinions panel showed Oregon had
higher association with organic wines and Oregon grape growers with sustainable
agriculture, and a lower association with mass production, large scale mechanized
agriculture than Napa, Sonoma or Washington.9
Oregon is home to some important organizations in the field such as Food Alliance,
Oregon Tilth, Salmon-Safe and LIVE, which provide additional employment and in some
cases bring in revenue from outside the state as well.
7 Full Glass Research and Gomberg-Fredrikson
8 Full Glass Research Oregon Green Study 2007
9 Wine Opinions Consumer Omnibus January 2014

Economic Impact of Oregon State Wine
Full Glass Research - 13 -
Economic Impact of Oregon State Wine
Full Glass Research - 14 -
The Wine Market in the U.S. & Oregon
Growth in American Wine Consumption
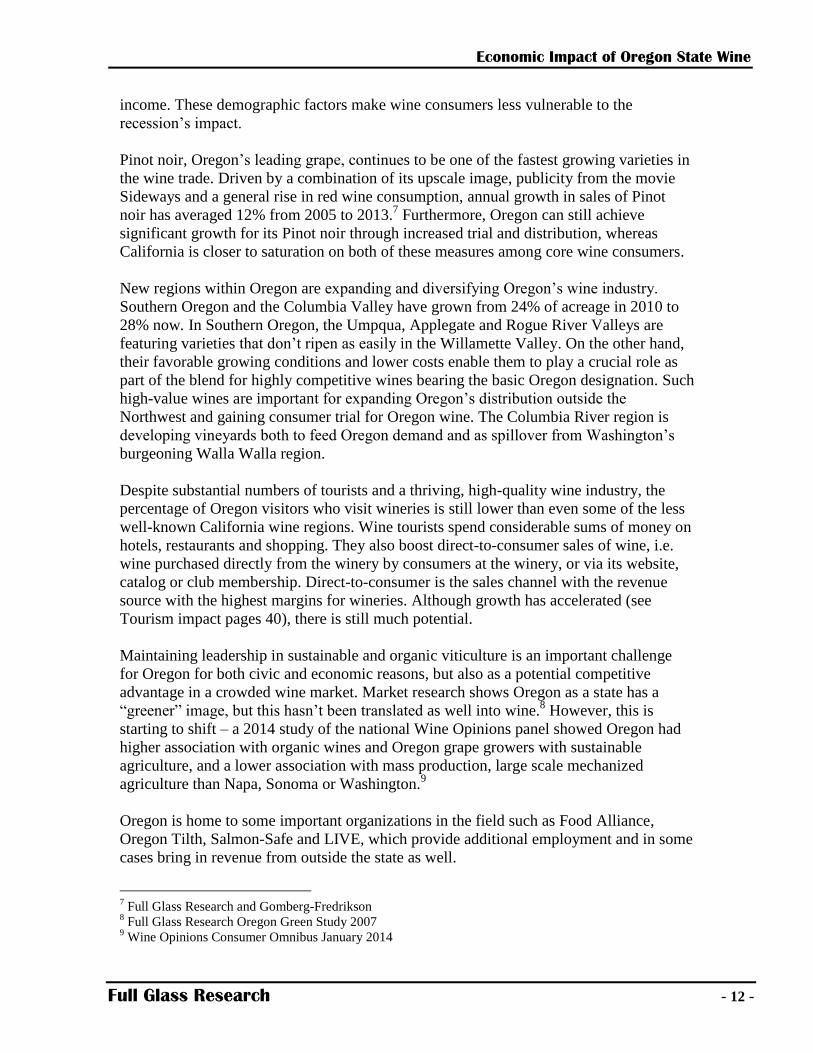
While the adult population of the United States has grown steadily since 1970, the per
capita adult consumption of table wine has also grown strongly since 1990.
U.S. Population and Per Capita Table Wine Consumption 1970-2013
Source: Wine Market Council
The wine boom that began in the mid-1990s has both demographic and cultural origins.
Demographically, the baby boomers (born 1946-1964), the largest generation to date in
the U.S. population and its most important wine consumers, adopted wine to a much
greater extent than their parents. In the 1990s, they began to enter their peak earning
years, sparking much greater spending on wine and trading up in price and quality. The
Millennial or Echo Boom generation (essentially the children of boomers) began entering
adulthood around 1999 and is adopting wine earlier and at a greater rate than its
predecessors. In addition, wine consumption correlates strongly and positively with
education level and certain professions. The population of college-educated and white
collar/professional workers and its share of national income has increased substantially
since 1990.
134147
154164
173184
194
211
224 230
1.05
1.78
2.582.29
1.962.13
2.462.81
3.04 3.11
0
1
2
3
4
5
6
0
50
100
150
200
250
1970 1975 1980 1985 1990 1995 2000 2005 2010 2013
Adult Pop (m)
Gallons per Adult
Economic Impact of Oregon State Wine
Full Glass Research - 15 -
Changes in popular culture have substantially increased the demand for higher quality
and more diverse wines. The scope, variety and prices of all high-end consumer goods
have expanded dramatically since the 1990s. The gourmet trend in foods has been a key
factor. The variety and intensity of flavor of most foods and beverages have increased
exponentially in the last two decades, as has the willingness of many consumers to pay
more for these attributes. Smaller production and higher-priced wines have benefited
from this cultural shift.
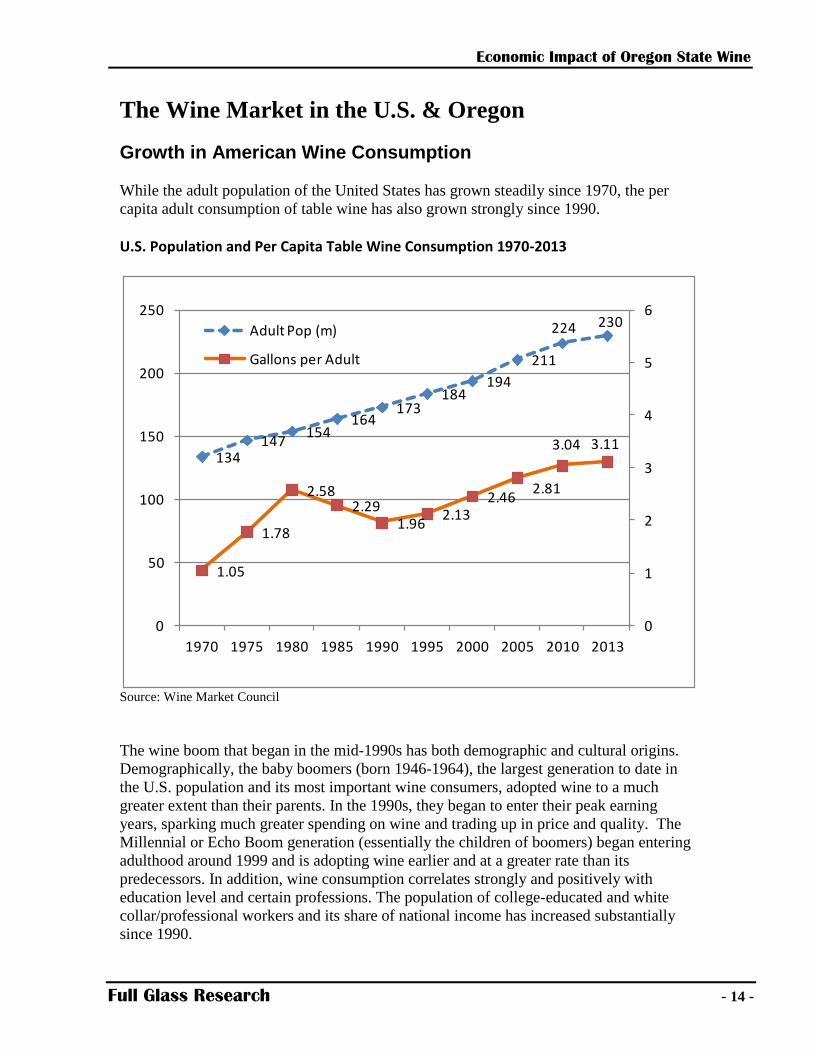
U.S. Wine Consumption 2000-2013
Source: Wine Market Council, Gomberg-Fredrikson
From 2000 to 2013, table wine shipments of wine in the U.S. market10
grew from 205
million 9L cases to 297 million cases. In the same period, sparkling wine sales grew from
11.6 million cases to 18.4 million. It is notable that, after periods of little or no growth in
2000-2002 and 2005-2008, sparkling wine sales have averaged 6.6% growth since 2009.
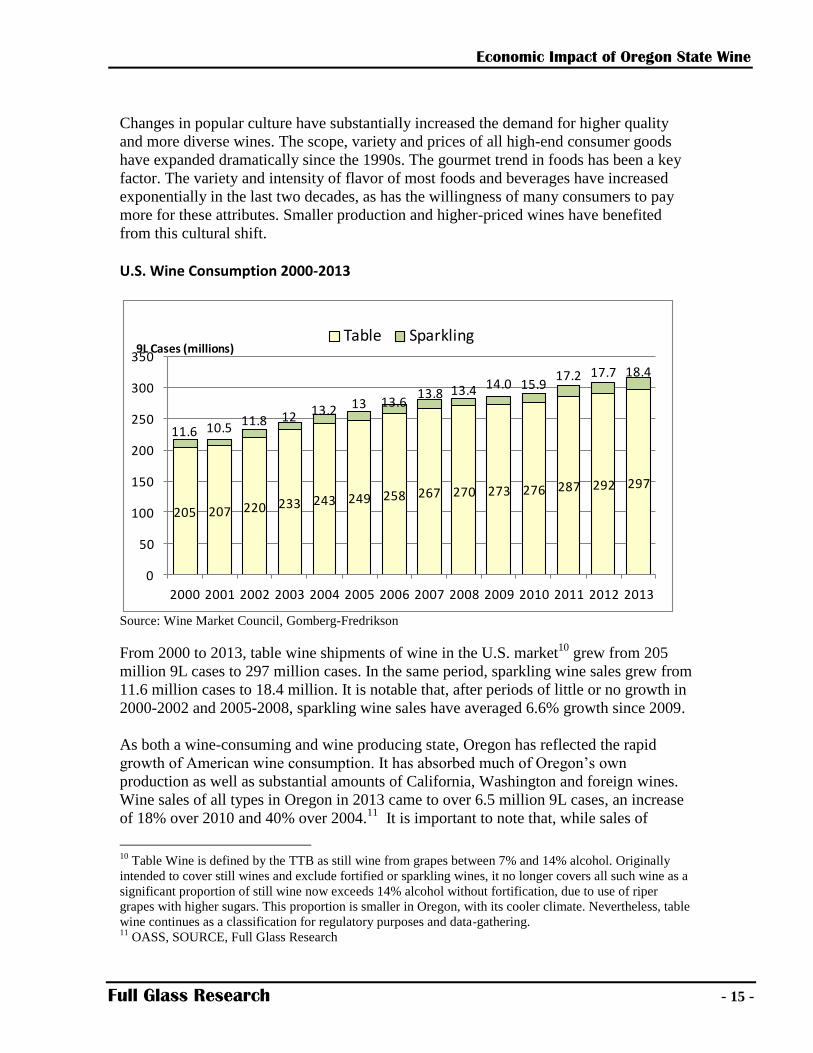
As both a wine-consuming and wine producing state, Oregon has reflected the rapid
growth of American wine consumption. It has absorbed much of Oregon’s own
production as well as substantial amounts of California, Washington and foreign wines.
Wine sales of all types in Oregon in 2013 came to over 6.5 million 9L cases, an increase
of 18% over 2010 and 40% over 2004.11
It is important to note that, while sales of
10
Table Wine is defined by the TTB as still wine from grapes between 7% and 14% alcohol. Originally
intended to cover still wines and exclude fortified or sparkling wines, it no longer covers all such wine as a
significant proportion of still wine now exceeds 14% alcohol without fortification, due to use of riper
grapes with higher sugars. This proportion is smaller in Oregon, with its cooler climate. Nevertheless, table
wine continues as a classification for regulatory purposes and data-gathering. 11
OASS, SOURCE, Full Glass Research
205 207 220 233 243 249 258 267 270 273 276 287 292 297
11.6 10.511.8 12 13.2 13 13.6
13.8 13.4 14.0 15.917.2 17.7 18.4
0
50
100
150
200
250
300
350
2000 2001 2002 2003 2004 2005 2006 2007 2008 2009 2010 2011 2012 2013
9L Cases (millions)Table Sparkling
Economic Impact of Oregon State Wine
Full Glass Research - 16 -
Oregon-made wine make the broadest contribution to the Oregon economy, sales of other
wines do create jobs and value at wholesale and retail levels.
Source: FGR, OLCC
Critically, for the Oregon wine industry, the growth in volume of wine consumed was
accompanied by steady “premiumization” of the wine industry. Consumers not only
bought more wine, but spent more per bottle. Sales of inexpensive generic wine declined
steadily from the mid-1990s to the present day, whereas sales of mid-priced (retail price
of $8-15 per 750ml bottle or equivalent) and high-priced ($15+) wines increased
dramatically.
From 2000 to 2013, the proportion of regular wine consumers who purchased wine priced
$20 or more a bottle increased from 52% to 63%. More impressive, the proportion who
reported frequent or occasional purchasing of wines priced $20 or more increased from
20% to 41% (WMC). During that same period, dollar sales of wine in the United States
increased approximately 89%.12
The steady upward movement in dollar spending on wine and average prices since 2000
was temporarily halted in 2008 by the severe recession, with total dollar sales of wine
declining approximately 1% in 2008 and 4% in 2009. Estimates of the sales declines for
wines over $20 range from -5% to -15% during the 2008-2009 period.13
Yet by 2010,
sales of higher priced wines were again rising. Since 2010, the sales of wines under $6
12
Full Glass Research, Wine Institute, Wine Market Council 13
Full Glass Research, Wine Institute, Gomberg-Fredrikson
2,973 3,358 3,465
3,807 4,276
4,678 4,962
5,553
6,560
-
1,000
2,000
3,000
4,000
5,000
6,000
7,000
1989 1992 1995 1998 2001 2004 2007 2010 2013
9L
cases (
tho
usan
ds)
Year
Total Wine Sales in Oregon 1989-2013
Economic Impact of Oregon State Wine
Full Glass Research - 17 -
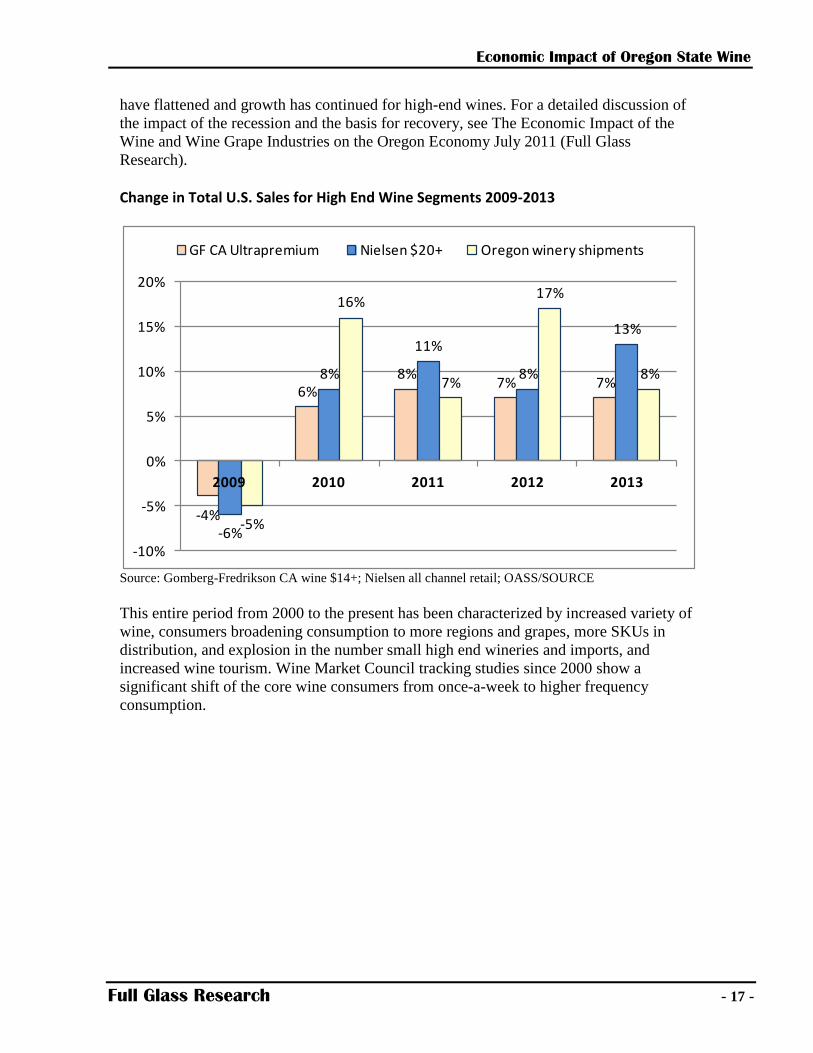
have flattened and growth has continued for high-end wines. For a detailed discussion of
the impact of the recession and the basis for recovery, see The Economic Impact of the
Wine and Wine Grape Industries on the Oregon Economy July 2011 (Full Glass
Research).
Change in Total U.S. Sales for High End Wine Segments 2009-2013
Source: Gomberg-Fredrikson CA wine $14+; Nielsen all channel retail; OASS/SOURCE
This entire period from 2000 to the present has been characterized by increased variety of
wine, consumers broadening consumption to more regions and grapes, more SKUs in
distribution, and explosion in the number small high end wineries and imports, and
increased wine tourism. Wine Market Council tracking studies since 2000 show a
significant shift of the core wine consumers from once-a-week to higher frequency
consumption.
-4%
6%8%
7% 7%
-6%
8%
11%
8%
13%
-5%
16%
7%
17%
8%
-10%
-5%
0%
5%
10%
15%
20%
2009 2010 2011 2012 2013
GF CA Ultrapremium Nielsen $20+ Oregon winery shipments

Economic Impact of Oregon State Wine
Full Glass Research - 18 -
Wine Sales
Total Retail Level Wine Sales in Oregon: $ 816,663,504* Total Revenues for Oregon Wineries: $ 363,479,079**
*does not include direct-to-consumer sales from winery
**does not include sale of bulk wine to other wineries or bottlers, estimated at $12.6 million in 2013. It was
not possible to distinguish sales of bulk wine to other Oregon wineries (revenue for one winery but a cost
for the other) from bulk sales to outside entities where only the revenue impacts Oregon)
The impact of wine sales was analyzed from two different perspectives: (1) total sales of
wine from all sources within the state of Oregon; (2) sales of wine made by Oregon
wineries both within and outside the state of Oregon. Sales of wine in Oregon, regardless
of the wine’s origin, impacts importers and wholesale and retail tiers that sell wine within
the state, plus industries that support them. The revenue from sales of wine made in
Oregon impacts Oregon wineries and vineyards, as well as the industries that supply and
service them.
Oregon is the country’s 19th
largest wine market in terms of consumption, although it’s
the 27th largest state in terms of total population.14
In 2013, Oregon consumers and visitors purchased approximately 7 million cases of
wine, including tasting room sales and direct to consumer shipments within Oregon. Of
these cases, about 975,000 were produced by wineries in Oregon, and a little over 6
million were produced outside of Oregon.15
Tax-Declared Wine Shipments in Oregon 2013, in Gallons
14% alcohol & under
Over 14% alcohol
Total
Gallons declared to OLCC
Wine Produced outside OR 13,518,700 879,739 14,398,440
Wine Produced in OR 4,966,074 738,899 5,704,973
Less wine credited to out of state shipments by Oregon wineries
-3,597,803
TOTAL wine in Oregon market 16,505,610
Source: OLCC; understates Oregon winery volume due to reporting exemptions for certain wineries Note: Standard 9L case = 2.38 gallons
Total consumer purchases of wine within Oregon in the retail tier (stores, restaurants,
etc.) are estimated to be $816.6 million, not including direct-to-consumer sales from
Oregon wineries. On-premise sales (restaurants, hotels, etc.) of wine in Oregon are
14
Source: Full Glass Research, U.S. Census 15
SOURCE, OLCC, Full Glass Research

Economic Impact of Oregon State Wine
Full Glass Research - 19 -
estimated to be $387 million on sales of nearly 1.2 million cases. Off-premise sales
(grocery stores, etc.) totaled $429 million on sales of 5.4 million cases.
Based on the Oregon Wine Board/Full Glass Research (OWB-FGR) winery survey, in
the retail tier approximately 35% of Oregon wine volume that is distributed in-state is
sold to restaurants or other locations where it is consumed on-premise. The remaining
65% of wine produced in Oregon is sold to retail stores (off-premise), an increase from
2010 (61%). This is still a much higher proportion on-premise compared to wines from
other states or countries, which sell roughly 15% on-premise based on distributor
interviews.
Oregon wineries sold 24% of their bottled wine direct to consumers, via tasting rooms,
wine clubs, events, catalog/mail or website sales. Direct sales provide higher margins to
the wineries, and thus account for half of total revenue from wine sales at Oregon
wineries.16
Oregon wineries sold 19% of their bottled wine through in-state distributors and retail,
whereas 55% of it was distributed into other states, 2% was exported to other countries
and the remainder was sold directly to consumers via tasting rooms, wine clubs, websites
and the like. Oregon’s larger wineries (40,000 cases+) distribute a higher proportion of
their volume off-premise (estimated 75% of distributed sales), and less via direct-to-
consumer routes such as wine clubs or the tasting room (12% of total sales). Smaller
wineries tend to sell a higher proportion of their wine on-premise (47% of distributed
sales) and direct to the consumers via tasting rooms, mailing lists, wine clubs, etc. (51%
of total sales).17
When tasting room sales, sales to Oregon distributors and retailers, and sales direct to
Oregon consumers are added together, Oregon consumes 36 percent of its own wine
production, and exports 64%, an increase from 59% in 2010. (It should be noted that a
substantial portion of tasting room sales are to tourists from outside Oregon.) Based on
SOURCE figures, in 2013 it exported 1,475,191 cases of wine, to other states, resulting
in revenues of approximately $130 million.18
16
SOURCE, FGR winery revenue model 17
OWB-FGR winery survey 2014, SOURCE, FGR 18
Full Glass Research
Economic Impact of Oregon State Wine
Full Glass Research - 20 -
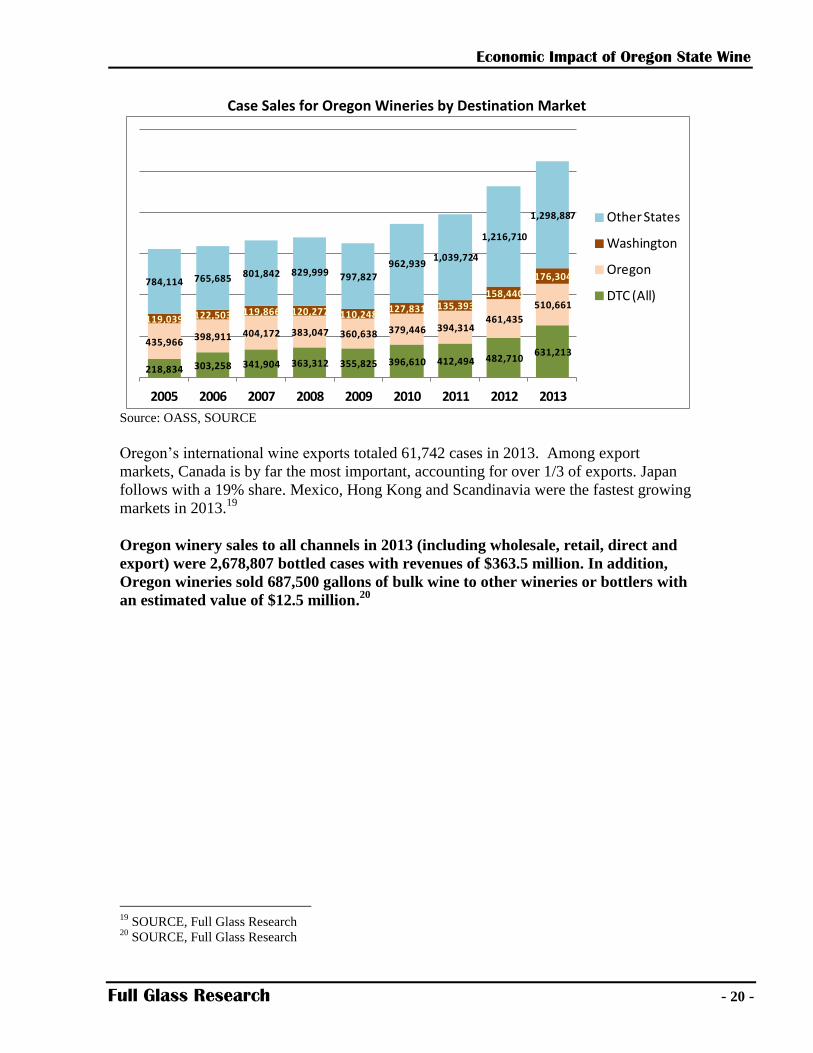
Case Sales for Oregon Wineries by Destination Market
Source: OASS, SOURCE
Oregon’s international wine exports totaled 61,742 cases in 2013. Among export
markets, Canada is by far the most important, accounting for over 1/3 of exports. Japan
follows with a 19% share. Mexico, Hong Kong and Scandinavia were the fastest growing
markets in 2013.19
Oregon winery sales to all channels in 2013 (including wholesale, retail, direct and
export) were 2,678,807 bottled cases with revenues of $363.5 million. In addition,
Oregon wineries sold 687,500 gallons of bulk wine to other wineries or bottlers with
an estimated value of $12.5 million.20
19
SOURCE, Full Glass Research 20
SOURCE, Full Glass Research
218,834 303,258 341,904 363,312 355,825 396,610 412,494 482,710631,213
435,966398,911 404,172 383,047 360,638 379,446 394,314
461,435
510,661
119,039 122,503 119,866 120,277 110,248127,831 135,393
158,440
176,304784,114 765,685 801,842 829,999 797,827962,939
1,039,724
1,216,710
1,298,887
2005 2006 2007 2008 2009 2010 2011 2012 2013
Other States
Washington
Oregon
DTC (All)

Economic Impact of Oregon State Wine
Full Glass Research - 21 -
Grape & Wine Production
In terms of total grape quantity, Oregon is not a leading producer, with less than 1% of
(0.65% in 2013 and 0.66 % in 2012 per NASS) the total tonnage of grapes in the U.S.
However, for wine grapes it is important, ranking fourth among the states for overall
production and third for premium wine grapes ($1,000+ a ton) after Washington and
California.
Oregon’s 2013 wine grape harvest was 56,246 tons, an increase over 2012, and an
enormous increase since the last economic impact study in 2010. This is in part because
of increased acreage, but mainly due to the fact that 2010 was a low-yielding harvest
whereas 2013 gave one of the highest-yielding crops in past twenty years.
Yields in 2012 and 2011 were also above average for the recent decade, whereas 2010
was a short crop. The 2012 vintage is the one most prevalent in current distribution,
although one can find substantial numbers of 2011 and 2013 vintage wines as well.
Winegrowing Regions in Oregon
Oregon contains several distinct regions for winegrowing, which differ in climate, soils
and topography. Distinctive wine growing regions often register appellations with the
TTB (Alcohol & Tobacco Tax and Trade Bureau), which give wineries the right to put
the appellation name on the label of wines that qualify by being produced from grapes in
a specified geographic region. Registered and approved regions are known as AVAs
(American Viticultural Areas). The following descriptions of Oregon viticultural regions
were based primarily on information from Wines Northwest publications and the Oregon
Wine Board.
The northwest portion of Oregon is best known for its cool-climate grape varieties,
including Pinot Gris, Riesling, Chardonnay and especially Pinot Noir. Willamette Valley
is the major appellation there, although there are a number of sub-appellations within the
Willamette Valley.
The Southern Oregon appellation includes the Umpqua Valley AVA, the Applegate
Valley AVA and the Rogue Valley AVA, all located in the southwestern portion of the
state. These regions, along with the vineyards of the Columbia Gorge AVA, are
generally warmer and significantly drier than those appellations in the northwestern
quadrant of Oregon including the Willamette Valley AVA. In early 2005, the Southern
Oregon appellation was federally authorized as a larger viticultural area encompassing
the regions of the Umpqua, the Applegate and the Rogue Valleys as well as an
incremental tract of land connecting the Umpqua to the Rogue.
Willamette Valley Located south of Portland, and bordered by hills to the south and west and mountains to
the east, the Willamette River is the central feature of this 100-mile long, 60-mile wide

Economic Impact of Oregon State Wine
Full Glass Research - 22 -
valley. The majority of Oregon’s wineries can be found here, capitalizing on both the
international fame of its Pinot noir and the easy access to Portland. In temperature the
coolest of Oregon's wine regions, the Willamette Valley's climate is perfectly suited to
certain grape varieties that don’t require strong sun and heat to ripen, typically varieties
originating in Northern Europe such as Pinot Noir and Chardonnay (of French Burgundy
fame); Riesling and Gewurztraminer (from Germany and Alsace) and Pinot Blanc and
Pinot Gris (prominent in Alsace and Alpine Italy). Willamette Valley is also a beacon for
wine tourism in Oregon, due to its easy access to the urban population and travel
destination of Portland, Oregon.
As Willamette Valley producers further explore and differentiate their region, a number
of sub-AVAs have been demarcated: Chehalem Mountains, Yamhill-Carlton, Ribbon
Ridge, Dundee Hills, McMinville, and Eola-Amity Hills. Many wineries produce single-
vineyard bottlings as well.
Umpqua Valley Region This appellation consists of a series of valleys and undulating hills. The Umpqua River is
the largest and most notable of the rivers in the region. Drier and warmer than the
Willamette Valley wine region to the north, and cooler than the Rogue and Applegate
wine regions to the south, the Umpqua Valley has some features of both those regions.
The Umpqua wine region is cool enough to produce classic Oregon varieties like Pinot
noir and Pinot Gris, the leading varieties. However it is also warm enough to grow
Bordeaux varieties such as Cabernet Sauvignon and Merlot. It also has substantial
amounts of Riesling and Chardonnay. Some wineries have pioneered the cultivation of
Southern French and Spanish varieties such as Tempranillo, Malbec, Syrah, Albarino and
Viognier, with extremely promising results. The recently created Elkton AVA, located in
the north end of the region, benefits from a cool coastal climate, and is gaining notice for
its distinctive style of Pinot Noir, Gewürztraminer and Riesling.
Rogue Valley and Applegate Valley Originally the two appellations were defined as a single Rogue Valley AVA. In 2001 the
Applegate Valley gained federal authorization as an individual AVA, distinct from the
Rogue Valley appellation. The overall region is warmer and dryer than the Willamette
Valley, particularly in the east. This climate has encouraged plantings of Cabernet,
Merlot, Syrah and Viognier, but it is still an important source of Pinot noir and Pinot
Gris. The area is notable for a diversity of wine varieties and styles, ranging from unique
red and white blends to wines inspired by Bordeaux, the Rhone and Spain. Due to the
higher yields and reliable ripening, this area is also a critical source for Pinot Noir and
Pinot Gris used in blends representing the overall Oregon appellation. This southern
region also benefits from tourist influx to the Medford and Ashland areas and regional
parks.
Economic Impact of Oregon State Wine
Full Glass Research - 23 -
Columbia Gorge The Columbia river valley has an increasingly warm climate as one goes upriver and
some vineyards benefit from the "Banana Belt" effect of west-facing valleys protected
from cold winds. The Columbia Gorge appellation, located on both the Oregon and
Washington sides of the Columbia River, was authorized as an official American
Viticultural Area (AVA) for both states in June 2004. Pinot noir, Pinot Gris, and
Chardonnay are important in the Columbia Gorge, but the influence of Washington also
means Cabernet and Syrah. Another promising feature has been the recent critical success
of the Walla Walla appellation for Bordeaux and red Rhone varieties, which though
based in Washington, extends across the border into Oregon.
An atypical but important winery in the region is the Quenett winery, with facilities in
The Dalles and Hood River. Quennet is the owner of the Copa di Vino brand. Copa di
Vino is moderately priced wine packaged in its own drinking glass, was featured in the
national television series “Shark Tank”, and is now one of the largest wineries in Oregon.
Although it uses both bulk wine from other regions as well as Oregon, it has made a
substantial investment in production and tourist facilities in the region.
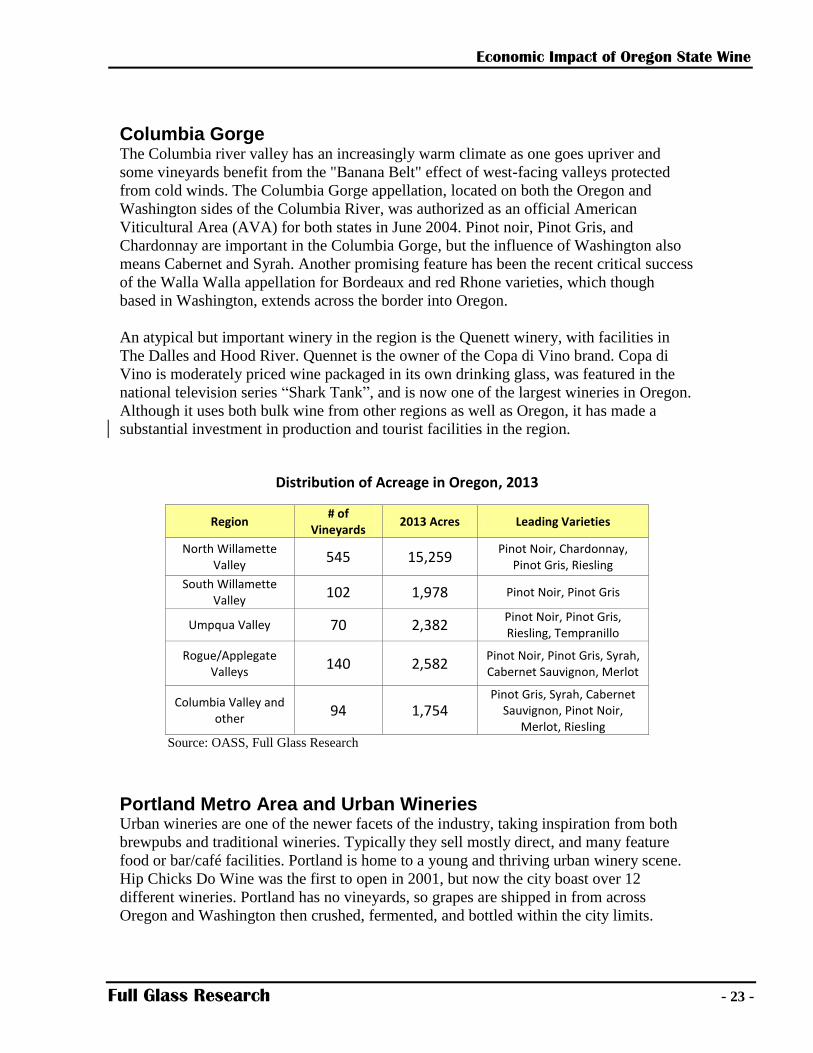
Distribution of Acreage in Oregon, 2013
Region # of
Vineyards 2013 Acres Leading Varieties
North Willamette Valley
545 15,259 Pinot Noir, Chardonnay,
Pinot Gris, Riesling
South Willamette Valley
102 1,978 Pinot Noir, Pinot Gris
Umpqua Valley 70 2,382 Pinot Noir, Pinot Gris, Riesling, Tempranillo
Rogue/Applegate Valleys
140 2,582 Pinot Noir, Pinot Gris, Syrah, Cabernet Sauvignon, Merlot
Columbia Valley and other
94 1,754 Pinot Gris, Syrah, Cabernet
Sauvignon, Pinot Noir, Merlot, Riesling
Source: OASS, Full Glass Research
Portland Metro Area and Urban Wineries Urban wineries are one of the newer facets of the industry, taking inspiration from both
brewpubs and traditional wineries. Typically they sell mostly direct, and many feature
food or bar/café facilities. Portland is home to a young and thriving urban winery scene.
Hip Chicks Do Wine was the first to open in 2001, but now the city boast over 12
different wineries. Portland has no vineyards, so grapes are shipped in from across
Oregon and Washington then crushed, fermented, and bottled within the city limits.

Economic Impact of Oregon State Wine
Full Glass Research - 24 -
One of the largest facilities located in Portland is the Southeast Wine Collective, a co-op
of 8 different wineries that all produce their wine with shared equipment. The Southeast
Wine Collective also features a tasting room and pub. Economic impacts of the urban
wineries are included in the winery data of the report, and under Multnomah county in
Appendix 4.
Wine Grape Cultivation
In 2013, Oregon wine grapes became the state’s most valuable fruit crop, with a market
value of nearly $128 million. While the growth in acreage and the bountiful 2013 harvest
contributed to 2013’s impressive returns, the average price per ton for wine grapes rose
from $1,552 in 2004 to $2,249 in 2013.21
The value of the wine grape crop has roughly
quadrupled since 2004. (Note that the above valuation includes tonnage from vineyards
owned by wineries where the grapes are not sold, but used by the wineries. It is imputed
from average price per ton for grapes sold multiplied by total crushed tons).
The following chart illustrates the wine grape crop value compared to those of other crop
values over the last three economic impact reports.
Oregon Dollar Value by Commodity, 2004 vs. 2010 vs. 2013
Commodity 2004 2010 2013
Apples $26,057,000 $29,254,000 $49,829,000
Cherries $49,819,000 $77,256,000 $91,272,000
Cranberries $17,977,000 $10,950,000 $11,934,000
Hazelnuts $52,992,000 $59,670,000 $120,600,000
Peaches* $2,774,000 $3,785,000 $3,717,000
Pears $76,703,000 $76,347,000 $111,117,000
Wine Grapes $32,200,000 $62,321,000 $127,990,000
Source: OASS, OAIN *2009/2012 instead of 2010/2013 data for Peaches
21
OASS, SOURCE

Economic Impact of Oregon State Wine
Full Glass Research - 25 -
Oregon Dollar Value Trends for Leading Fruit/Nut Crops, 2004-2013
Source: OASS, SOURCE
When total crop values are observed over time, wine grapes are more stable in value than
most other major Oregon fruit and nut crops, and show a clear upward trend.
The value of Oregon’s wine grape crop has increased steadily since 2004. This is partly
due to greater volume but also due to increased prices per ton, as the following chart
makes clear.
Oregon Wine Grapes Price Per Ton and Total Value 1994-2013
Source: OASS, SOURCE
$0
$20,000,000
$40,000,000
$60,000,000
$80,000,000
$100,000,000
$120,000,000
$140,000,000
$160,000,000
2004 2005 2006 2007 2008 2009 2010 2011 2012 2013
Pears
Wine Grapes
Apples
Cherries
Cranberries
Hazelnuts
Peaches
$-
$500
$1,000
$1,500
$2,000
$2,500
$-
$20,000,000
$40,000,000
$60,000,000
$80,000,000
$100,000,000
$120,000,000
$140,000,000 Total Value Wtd Avg Price/ton
Economic Impact of Oregon State Wine
Full Glass Research - 26 -
Although wine grape prices have been less volatile over the long term than many other
commodities, the total crop value is not immune to substantial swings. Average grape
prices increased in 2010, but a low-yielding harvest reduced the total value of the crop
substantially from 2009. In contrast, a bumper crop in 2013 increased the total value, but
high yields resulted in pressure on the spot market for grapes and slightly lower average
prices per ton.
Wine Grape Varieties
Pinot Noir continues to be the leading grape variety in Oregon vineyards. Sales of Pinot
Noir wines have boomed in the U.S. for over a decade, fueled by a combination of its
prestige, unique flavor, favorable trade support, substantial press and finally the Sideways
boost.22
Pinot Noir was the variety that first gained Oregon national and international attention as
a wine region, and Western Oregon’s climate and soils are conducive to the production of
high quality Pinot Noir. The tonnage of Pinot Noir crushed in Oregon increased 245%
percent between 2004 and 2013, while its value more than tripled.23
The combination of
highest tonnage and the highest average price per ton means that the value of the Pinot
Noir crop is more than four times that of any other grape variety in Oregon, and
constitutes 67% of the total wine grape crop value.24
Pinot Gris is the next most important variety by total value and its value has more than
doubled since 2010, to 12.6%. Together Pinot noir and Pinot Gris represent over 3/4 of
the tonnage and value of Oregon wine grapes. Chardonnay, Syrah and Riesling are the
next most valuable grapes, but collectively they accounted for a bit over 9% of value in
2013. 25
There has been substantial growth in plantings, harvests and value for several varieties in
Oregon, whereas others have receded in importance. In particular, Pinot Blanc, Syrah,
Tempranillo and Viognier have increased their share of the crop since 2000, while
Chardonnay, Sauvignon Blanc, Merlot and Riesling have decreased. These changes have
a variety of causes, ranging from the search for quality and distinctiveness by regions and
wineries, to consumer and trade acceptance, to severity of competition from other states.
22
Pinot noir was prominently and positively featured in the popular movie Sideways, which accelerated the
variety’s already strong growth rate. 23
SOURCE 24
OASS, Full Glass Research 25
SOURCE

Economic Impact of Oregon State Wine
Full Glass Research - 27 -
Oregon Wine Grapes by Variety, Tons and Average Price: 2000, 2005, 2010 & 2013
Variety Tons Harvested Average Price per Ton
2000 2005 2010 2013 2000 2005 2010 2013
Cabernet Franc 103 220 193 444 $1,560 $1,710 $1,780 $2,124
Cabernet Sauvignon 977 945 1,138 1,407 $1,420 $1,610 $1,830 $2,124
Chardonnay 2,846 1,545 1,499 2,605 $1,000 $1,200 $1,780 $2,236
Gewurztraminer 314 426 312 430 $910 $1,040 $1,370 $1,610
Merlot 1,047 1,019 710 1,308 $1,460 $1,440 $1,570 $1,874
Muller Thurgau 338 339 207 443 $740 $950 $980 $1,278
Pinot Blanc 224 433 427 680 $1,470 $1,190 $1,610 $1,628
Pinot Gris 3,109 4,296 5,131 7,423 $1,300 $1,300 $1,390 $1,562
Pinot Noir 6,812 12,193 16,391 28,565 $1,820 $2,100 $2,470 $2,651
Sauvignon Blanc 160 91 116 155 $1,000 $1,160 $1,580 $1,782
Syrah 189 744 937 2,097 $1,760 $2,000 $2,020 $2,154
Tempranillo na 135 234 631 na $1,890 $2,060 $2,106
Viognier na 177 236 598 na $1,650 $1,830 $1,943
White Riesling 1,529 1,600 1,857 1,812 $750 $740 $1,090 $1,507
Zinfandel 211 127 73 191 $1,570 $1,890 $1,740 $1,959
Source: OASS, SOURCE

Economic Impact of Oregon State Wine
Full Glass Research - 28 -
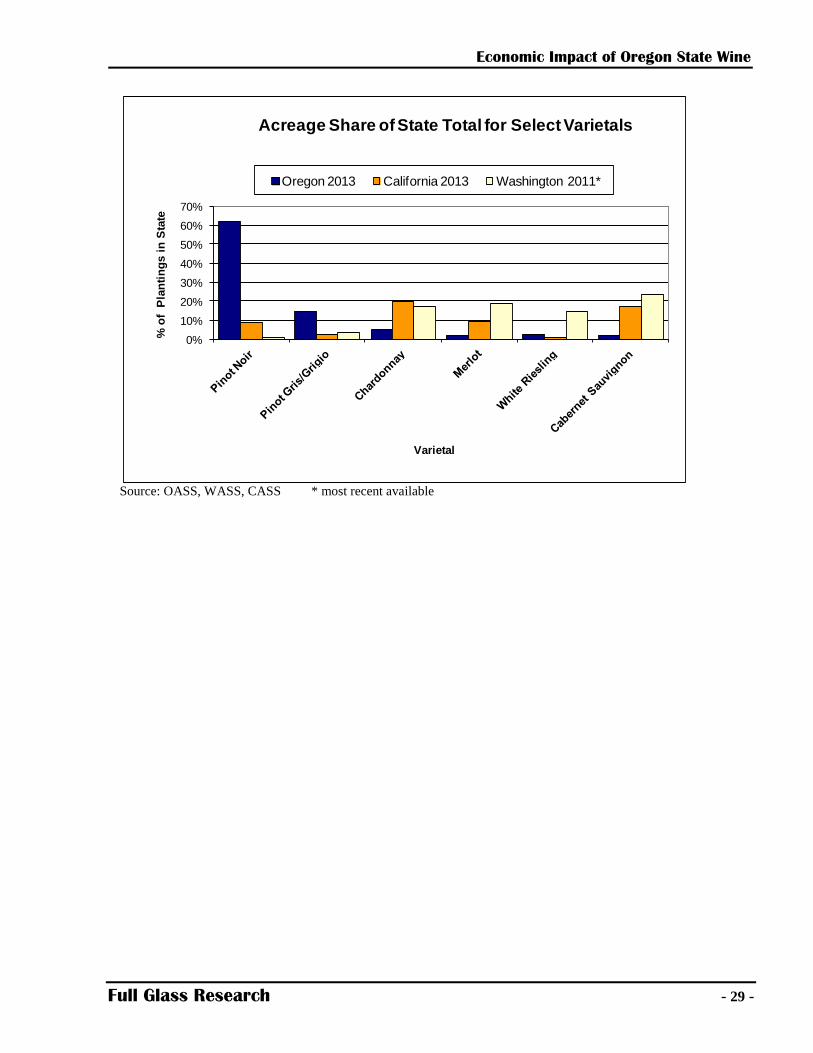
Comparing Oregon to the other leading western grape growing states, the differences
become clear. Oregon is a significant supplier of Pinot Noir (26% of all West Coast
plantings), Pinot Gris (18%), Tempranillo (26%) and Pinot Blanc (35%). Oregon is a
very small factor in the markets for Chardonnay (dominated by California), Riesling (led
by Washington) and Cabernet or Merlot.
Oregon vs. California vs. Washington Acreage
ACRES Oregon
2013 California
2013 Washington
2011*
Pinot Noir 14,808 41,301 307
Pinot Gris/Grigio 3,445 13,752 1,576
Chardonnay 1,164 97,970 7,654
Merlot 425 45,296 8,235
White Riesling 653 4,294 6,320
Cabernet Sauvignon 528 86,258 10,293
Syrah 570 19,019 3,103
Viognier 241 3,039 390
Tempranillo 350 884 94
Pinot Blanc 227 421 na
*most recent available figures
Source: OASS, CASS, WASS/WSWC
Acreage alone does not fully describe the substantial differences between Oregon,
California and Washington. Pinot Gris is the most extreme illustration of this. Over 2/3 of
California Pinot Gris sourced from the hot Central Valley, cropped at very high yields
(typically 7-10 tons/acre and sometimes higher), sold at an average price per ton of
$531/ton and marketed under $10 a bottle as Pinot Grigio. In contrast, average Oregon
yields are 2.6 tons per acre (5-year average), the average price per ton for Pinot Gris in
2013 was $1,562 and the vast majority of Oregon Pinot Gris is sold for over $10 a
bottle.26
26
CASS, SOURCE
Economic Impact of Oregon State Wine
Full Glass Research - 29 -
Source: OASS, WASS, CASS * most recent available
0%
10%
20%
30%
40%
50%
60%
70%
% o
f P
lan
tin
gs i
n S
tate
Varietal
Acreage Share of State Total for Select Varietals
Oregon 2013 California 2013 Washington 2011*

Economic Impact of Oregon State Wine
Full Glass Research - 30 -
Wine Grape Sales Revenue Wine Grape Grower Revenues: $80 million
In 2013, Oregon grape growers harvested and sold 35,596 tons of grapes for revenues of
$80,055,404. Note that this counts only independent sales of wine grapes – 37% of all
Oregon grapes are grown in winery-owned vineyards and thus are not covered by
independent sales transactions. If you ascribe the market value of the grapes sold to all
Oregon wine grapes, the total value of the 2013 harvest was $128 million.
The $2,249 average per ton that Oregon grape growers received in 2013 is much higher
than the $713 per ton average that California growers received in 2013. This price
discrepancy is due to the large volume of lower-quality California Central Valley grapes
that substantially reduces the California average (plus sales for distillation, concentrate
and other low value uses that are rare in Oregon).
As the following chart indicates, prices for Oregon grapes are comparable to those for
some of California’s best regions, although not yet at the level of Napa Valley.
Average Wine Grape Growers’ Returns per Ton, by Region, 2004 vs 2013
Region or State 2004 average
grower returns per ton
2013 average grower returns
per ton
% change 2004-2013
Napa County $2,941 $3,683 25%
California Central Coast $1,030 $1,304 27%
Oregon State Average $1,660 $2,249 35%
California State Average $570 $712 25%
Washington $925 $1,110 20% Source: OASS, SOURCE, CASS and WASS
Economic Impact of Oregon State Wine
Full Glass Research - 31 -
Wine Grape Vineyard Development
Vineyard Development, 1st year plantings in 2013: $ 6,670,427 Vineyard Development, 2nd year plantings from 2012: $ 3,699,828 Vineyard Removals: $ 73,920 Total Development Spending, 2010: $10,444,175 When developing a vineyard, the site must be prepared to plant vines – land must be
cleared, drainage improved, the soil amended, erosion controlled, etc. Once the vines are
planted they must be trellised and trained. It can take between two and four years before
the vine bears a commercial crop. Generally speaking, costs during the first two years
after planting are considered development costs, while costs in the third year tend to
follow normal vineyard maintenance (often slightly lower). This process is very capital
and labor intensive, with development costs ranging widely from $15,000 to $30,000 an
acre, depending on the specific location of the vineyard and planting layout. The most
important cost factor in planting a vineyard is the vine spacing. Different vineyards use
different vine spacing depending upon the site, desired grape flavors, and cost
considerations.
Based upon new plantings declared in the SOURCE vineyard census, and cost estimates
from interviews with vineyard managers, developers and accountants, approximately $6.7
million was invested in developing 462 acres during 2013. An additional $3.7 million
was spent in second year development of 596 acres planted in 2012. Some acreage
removal also occurs every year, as growers pull vineyards due to disease, age and
declining yields, financial conditions, or preference for a different variety. Just 56 acres
were declared removed in 2013, resulting in an estimated $73,920 in spending.27
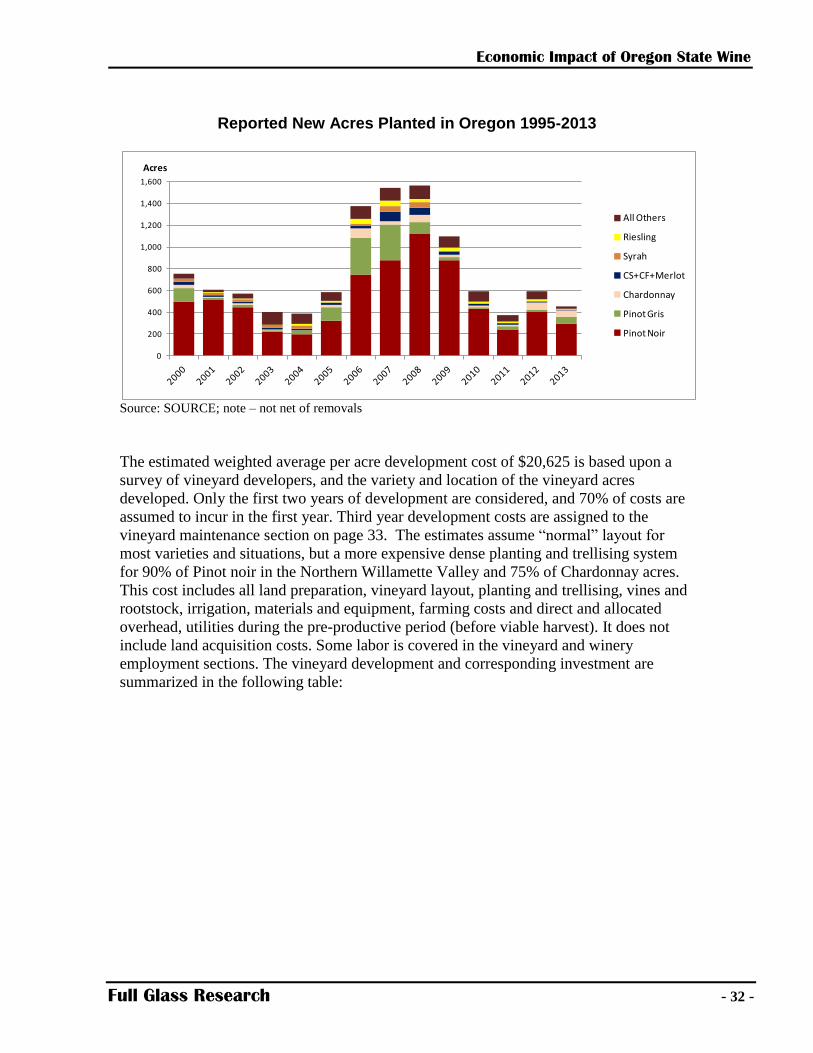
The following chart shows the pattern of reported new plantings from 2000 to 2013.28
A
total of 1,422 new acres were planted during the years since the 2010 report. Averaging
per acre spending from the 2010 and 2014 reports, it can be roughly estimated the recent
trend of new vineyard development represents a total investment of $27 million directly
into the Oregon economy during 2010-2013.
It is important to note that, if one estimates unreported acres based on changes in total
acreage, the total new plantings rise to 3,927 acres, an investment of $75.5 million.
27
SOURCE, Full Glass Research 28
SOURCE
Economic Impact of Oregon State Wine
Full Glass Research - 32 -
Reported New Acres Planted in Oregon 1995-2013
Source: SOURCE; note – not net of removals
The estimated weighted average per acre development cost of $20,625 is based upon a
survey of vineyard developers, and the variety and location of the vineyard acres
developed. Only the first two years of development are considered, and 70% of costs are
assumed to incur in the first year. Third year development costs are assigned to the
vineyard maintenance section on page 33. The estimates assume “normal” layout for
most varieties and situations, but a more expensive dense planting and trellising system
for 90% of Pinot noir in the Northern Willamette Valley and 75% of Chardonnay acres.
This cost includes all land preparation, vineyard layout, planting and trellising, vines and
rootstock, irrigation, materials and equipment, farming costs and direct and allocated
overhead, utilities during the pre-productive period (before viable harvest). It does not
include land acquisition costs. Some labor is covered in the vineyard and winery
employment sections. The vineyard development and corresponding investment are
summarized in the following table:
0
200
400
600
800
1,000
1,200
1,400
1,600
All Others
Riesling
Syrah
CS+CF+Merlot
Chardonnay
Pinot Gris
Pinot Noir
Acres

Economic Impact of Oregon State Wine
Full Glass Research - 33 -
Vineyard Development and Corresponding Investment by Variety, 2012-13
Variety 2013 Acres
In
2013 Acres Out
2012 Acres
In
Total Investment in 2013 planting
Spending on 2013
removals
Total Investment in 2012 planting
Spending on 2012
removals
Cab Franc 1 1 1 $18,800 $1,320 $18,800 $2,640
Cab Sauv 5 5 3 $139,725 $4,800 $248,400 $7,200
Chardonnay 54 0 66 $188,513 $3,600 $359,888 $16,800
Gewztraminer 2 0 4 $46,575 $- $170,775 $1,200
Merlot 2 1 0 $93,150 $8,400 $77,625 $4,800
Muller-Thurgau
0 0 19 $- $- $- $-
Pinot Blanc 11 2 23 $186,300 $- $124,200 $2,400
Pinot Gris 67 9 26 $279,450 $28,800 $465,750 $8,400
Pinot Noir 295 31 401 $7,905,398 $76,800 $16,253,055 $84,000
Sauv Blanc 3 0 0 $77,625 $1,200 $62,100 $1,200
Syrah 3 2 5 $124,200 $7,200 $186,300 $9,600
Tempranillo 10 2 8 $108,675 $1,200 $263,925 $12,000
Viognier 5 2 3 $93,150 $1,200 $15,525 $-
Riesling 3 1 17 $294,975 $3,600 $372,600 $9,600
Zinfandel 1 0 0 $139,725 $- $186,300 $-
All others 0 0 20 $791,775 $4,800 $807,300 $7,200
Oregon Total 462 56 596 $10,484,760 $141,600 $19,640,318 $166,800
SOURCE 2013 winery-vineyard census
After a lull in planting during the recession of 2008-09, another burst of vineyard
investment occurred in Oregon between 2011 and 2014. The increase in declared new
plantings was modest; much of the acreage purchased by entities outside Oregon was
already existing.
New acres reported planted in 2013 totaled 462, whereas 596 new acres were reported in
2012. However there may be under-reporting based on changes in harvested acreage: the
change in reported total acres planted in 2013 was 1,075 additional acres; in 2012, 2,480
additional acres were reported.29
29
Source: SOURCE vineyard census
Economic Impact of Oregon State Wine
Full Glass Research - 34 -
Vineyard Maintenance, Management & Equipment
Bearing Vineyard Maintenance Spending: $ 69,438,899* Vineyard Management Company Employment: 108 jobs Vineyard Management Company Wages: $2,913,213 Vineyard Employment: 749 jobs** Vineyard Wages: $17,398,521** *not including sprays, fertilizers and other vineyard inputs covered on page 47 **see also page 37 for direct employment
Annual vineyard maintenance costs, such as cultivation, tying and training, weed control
and pruning typically range from $3,500 to $8,000 per acre, depending on the variety,
trellising, spacing and maintenance regimes. We estimate a total of more than $69 million
to maintain the 21,681 bearing acres in Oregon. Spending on acres planted in 2012-2013
is covered in vineyard development section on page 30. Spending on locally-sourced
inputs such as such as fertilizer, fungicide, etc. has also been removed from this total, as
these are covered in the Supplier Industries. The estimated investment in vehicles and
heavy equipment such as tractors and tillers has been included, based on average costs
from the OWB-FGR survey of vineyard owners. A number of vineyard management
experts commented on rising labor costs, which have also been factored into the spending
on vineyard maintenance at a 10% increase.
Spending on much of the labor involved in vineyard maintenance is covered in the
vineyard and winery employment section (see page 37). A substantial proportion of
vineyards in Oregon are maintained by independent, vineyard management companies.
There was insufficient data to precisely measure total impact of vineyard management.
However, based on the data gathered, vineyard management companies farm or advise
15-27% of Oregon vineyards and support an additional 108 jobs and $2.9 million in
wages.
Wineries
According to the Oregon Liquor Control Commission, Oregon had 729 licensed wineries
in 2014 (includes both WYNC and WY type.) Some of these are “virtual” wineries and
some manufacture sake or cider or beer but hold winery licenses too. Some are
essentially offices, warehouses or outlets for growers or businesses currently producing
the wine at other facilities. The SOURCE winery census estimates there were 605
wineries in Oregon, with 370 of them actively crushing grapes and making wine in the
2013 harvest.
Economic Impact of Oregon State Wine
Full Glass Research - 35 -
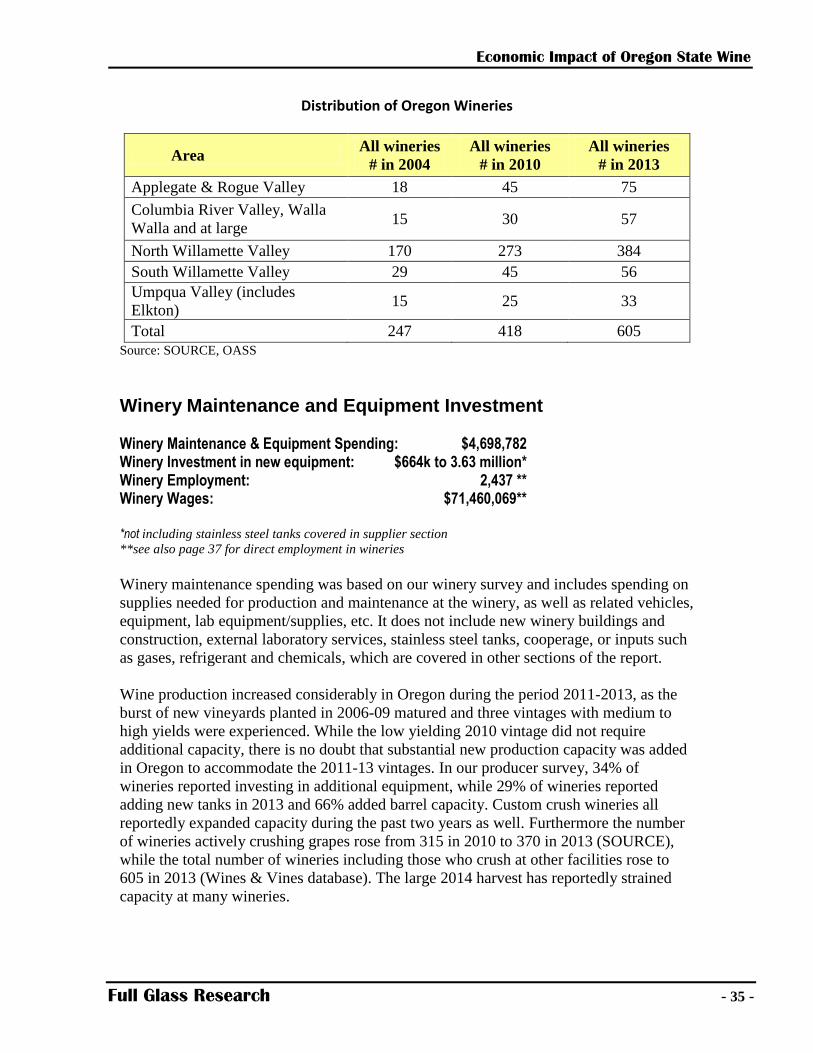
Distribution of Oregon Wineries
Area All wineries
# in 2004
All wineries
# in 2010
All wineries
# in 2013
Applegate & Rogue Valley 18 45 75
Columbia River Valley, Walla
Walla and at large 15 30 57
North Willamette Valley 170 273 384
South Willamette Valley 29 45 56
Umpqua Valley (includes
Elkton) 15 25 33
Total 247 418 605
Source: SOURCE, OASS
Winery Maintenance and Equipment Investment
Winery Maintenance & Equipment Spending: $4,698,782 Winery Investment in new equipment: $664k to 3.63 million* Winery Employment: 2,437 ** Winery Wages: $71,460,069** *not including stainless steel tanks covered in supplier section
**see also page 37 for direct employment in wineries
Winery maintenance spending was based on our winery survey and includes spending on
supplies needed for production and maintenance at the winery, as well as related vehicles,
equipment, lab equipment/supplies, etc. It does not include new winery buildings and
construction, external laboratory services, stainless steel tanks, cooperage, or inputs such
as gases, refrigerant and chemicals, which are covered in other sections of the report.
Wine production increased considerably in Oregon during the period 2011-2013, as the
burst of new vineyards planted in 2006-09 matured and three vintages with medium to
high yields were experienced. While the low yielding 2010 vintage did not require
additional capacity, there is no doubt that substantial new production capacity was added
in Oregon to accommodate the 2011-13 vintages. In our producer survey, 34% of
wineries reported investing in additional equipment, while 29% of wineries reported
adding new tanks in 2013 and 66% added barrel capacity. Custom crush wineries all
reportedly expanded capacity during the past two years as well. Furthermore the number
of wineries actively crushing grapes rose from 315 in 2010 to 370 in 2013 (SOURCE),
while the total number of wineries including those who crush at other facilities rose to
605 in 2013 (Wines & Vines database). The large 2014 harvest has reportedly strained
capacity at many wineries.

Economic Impact of Oregon State Wine
Full Glass Research - 36 -
While there is no precise data publicly available on winery investment in new equipment,
barrels and capacity, the amount spent can be estimated based on the increase in tonnage
crushed, fermented and aged in comparison to previous years, and typical industry costs
for equipment, tanks, and barrels. Based on the NW winery cost modeler33
and interviews
with experts, and the increase in tons crushed, FGR estimates that a minimum of $2.4
million was spent on new winery equipment by Oregon wineries in 2013. This may
significantly underestimate the investment, because this estimate is based on the modest
additional capacity required to handle the 2013 crush versus the very large 2012 harvest.
While the capacity investments that occurred during 2011-2013 cannot be readily
ascertained, it is likely that at least $35.3 million was spent on winery equipment and
vehicle investments during 2011-13. If allocated evenly by year, this would boost 2013
investment to $11.7 million.
However, unlike stainless steel tank production, a substantial proportion of heavy winery
equipment (such as pumps, bottling lines, presses, crusher/de-stemmers,vehicles) is
produced in other states or countries. In such cases, the economic impact within the state
of purchases by Oregon wineries is confined to the dollars retained by local brokers and
suppliers of the equipment. Based on the OWB-FGR survey, only 31% of this investment
is spent on firms within Oregon, and in some cases only the sales margin and
installation/service fees impact the Oregon economy.
Environmental Impacts and Investment
The combination of concerns over food safety, environmental and wildlife conservation
and global warming has caused substantial rethinking of growing and production
practices by many producers and consumers. A variety of new methods and products
have emerged to address these issues. The Oregon wine industry has been at the forefront
of this movement for wine grape growing and winery practices. Substantial acreage is
now farmed with various forms of sustainable or organic methods, wineries have adopted
carbon footprint reduction schemes, and a number of certification organizations for such
methods are headquartered in Oregon. While a detailed report on these developments is
outside the scope of this report, they represent a substantial investment by the industry.
Sustainable farming and wine production generally includes a reduction in carbon
footprint, increased use of renewable resources, and a decrease in inputs that require non-
renewable energy or have injurious side effects on the environment. Organic grape
production eliminates certain inputs such as artificial fertilizers, pesticides and
fungicides. Organic wine production is less common, requiring both use of organic
grapes and elimination of certain inputs such as SO2, whether naturally derived or not.
Biodynamicism is a specialized form of organic grape growing.
The following table lists the acreage certified by the leading certification authorities in
Oregon. The economic impact of these agencies is estimated in the Industry Associations
section of the report.
Economic Impact of Oregon State Wine
Full Glass Research - 37 -
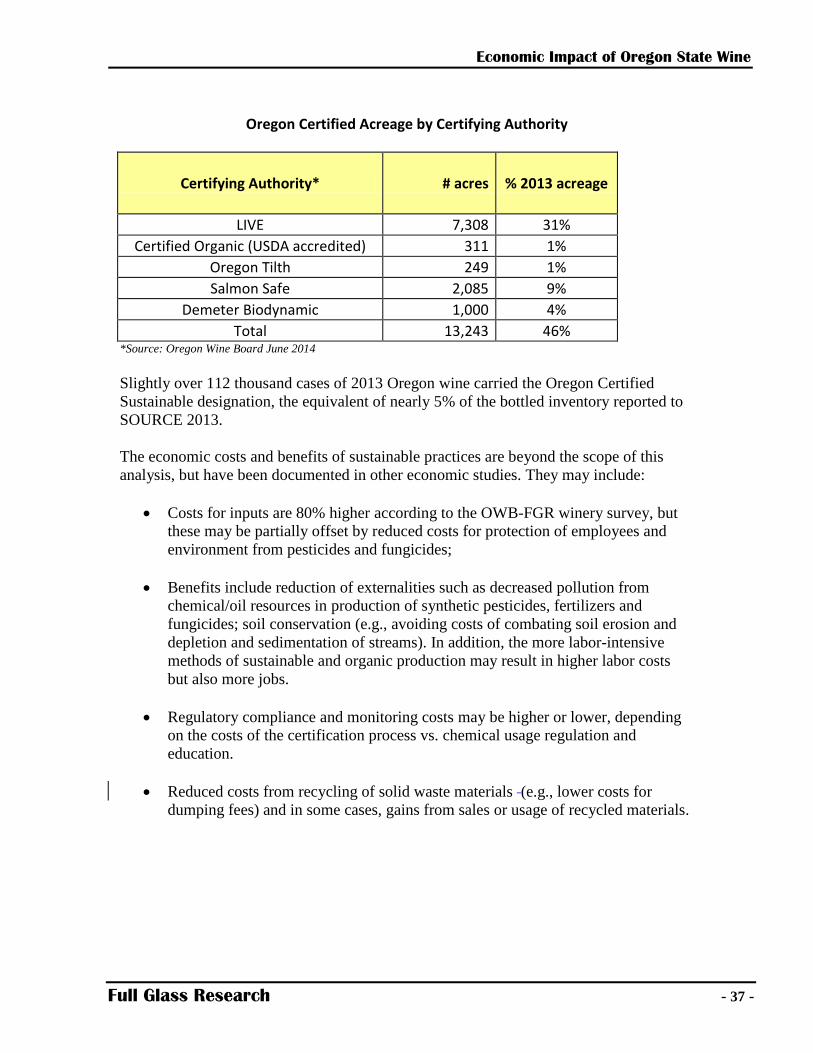
Oregon Certified Acreage by Certifying Authority
Certifying Authority* # acres % 2013 acreage
LIVE 7,308 31%
Certified Organic (USDA accredited) 311 1%
Oregon Tilth 249 1%
Salmon Safe 2,085 9%
Demeter Biodynamic 1,000 4%
Total 13,243 46% *Source: Oregon Wine Board June 2014
Slightly over 112 thousand cases of 2013 Oregon wine carried the Oregon Certified
Sustainable designation, the equivalent of nearly 5% of the bottled inventory reported to
SOURCE 2013.
The economic costs and benefits of sustainable practices are beyond the scope of this
analysis, but have been documented in other economic studies. They may include:
Costs for inputs are 80% higher according to the OWB-FGR winery survey, but
these may be partially offset by reduced costs for protection of employees and
environment from pesticides and fungicides;
Benefits include reduction of externalities such as decreased pollution from
chemical/oil resources in production of synthetic pesticides, fertilizers and
fungicides; soil conservation (e.g., avoiding costs of combating soil erosion and
depletion and sedimentation of streams). In addition, the more labor-intensive
methods of sustainable and organic production may result in higher labor costs
but also more jobs.
Regulatory compliance and monitoring costs may be higher or lower, depending
on the costs of the certification process vs. chemical usage regulation and
education.
Reduced costs from recycling of solid waste materials (e.g., lower costs for
dumping fees) and in some cases, gains from sales or usage of recycled materials.
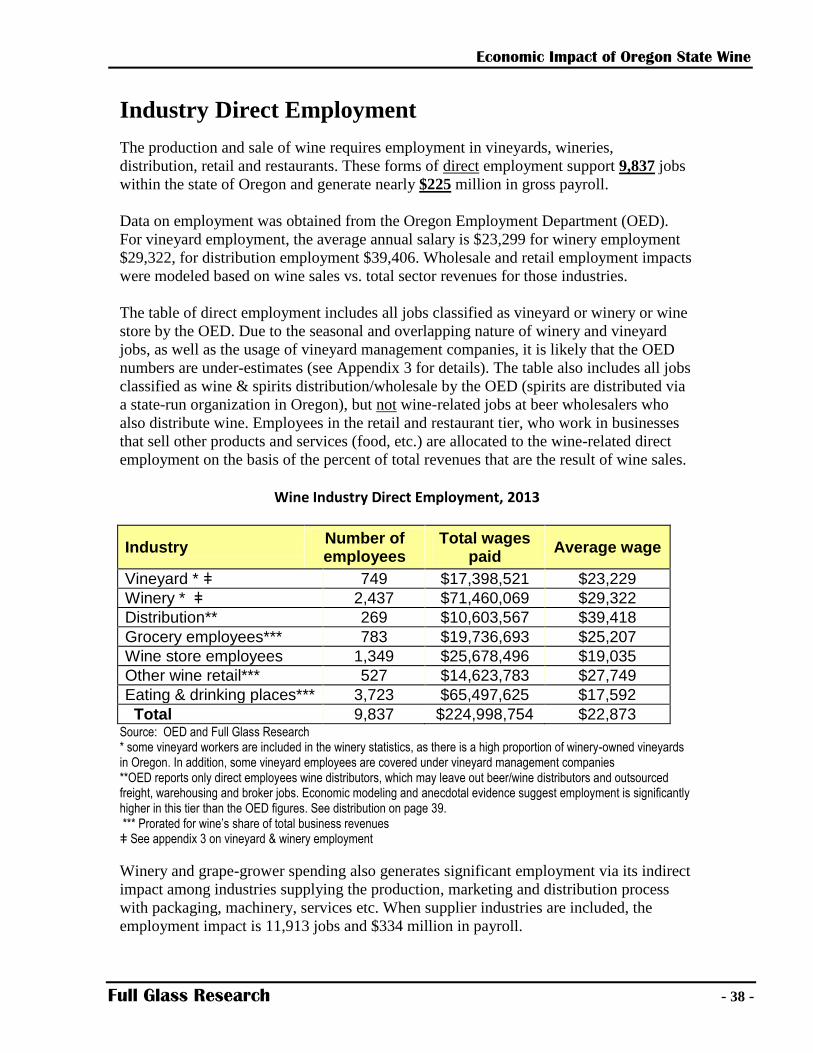
Economic Impact of Oregon State Wine
Full Glass Research - 38 -
Industry Direct Employment
The production and sale of wine requires employment in vineyards, wineries,
distribution, retail and restaurants. These forms of direct employment support 9,837 jobs
within the state of Oregon and generate nearly $225 million in gross payroll.
Data on employment was obtained from the Oregon Employment Department (OED).
For vineyard employment, the average annual salary is $23,299 for winery employment
$29,322, for distribution employment $39,406. Wholesale and retail employment impacts
were modeled based on wine sales vs. total sector revenues for those industries.
The table of direct employment includes all jobs classified as vineyard or winery or wine
store by the OED. Due to the seasonal and overlapping nature of winery and vineyard
jobs, as well as the usage of vineyard management companies, it is likely that the OED
numbers are under-estimates (see Appendix 3 for details). The table also includes all jobs
classified as wine & spirits distribution/wholesale by the OED (spirits are distributed via
a state-run organization in Oregon), but not wine-related jobs at beer wholesalers who
also distribute wine. Employees in the retail and restaurant tier, who work in businesses
that sell other products and services (food, etc.) are allocated to the wine-related direct
employment on the basis of the percent of total revenues that are the result of wine sales.
Wine Industry Direct Employment, 2013
Industry Number of employees
Total wages paid
Average wage
Vineyard * ǂ 749 $17,398,521 $23,229
Winery * ǂ 2,437 $71,460,069 $29,322
Distribution** 269 $10,603,567 $39,418
Grocery employees*** 783 $19,736,693 $25,207
Wine store employees 1,349 $25,678,496 $19,035
Other wine retail*** 527 $14,623,783 $27,749
Eating & drinking places*** 3,723 $65,497,625 $17,592
Total 9,837 $224,998,754 $22,873 Source: OED and Full Glass Research * some vineyard workers are included in the winery statistics, as there is a high proportion of winery-owned vineyards in Oregon. In addition, some vineyard employees are covered under vineyard management companies **OED reports only direct employees wine distributors, which may leave out beer/wine distributors and outsourced freight, warehousing and broker jobs. Economic modeling and anecdotal evidence suggest employment is significantly higher in this tier than the OED figures. See distribution on page 39. *** Prorated for wine’s share of total business revenues ǂ See appendix 3 on vineyard & winery employment
Winery and grape-grower spending also generates significant employment via its indirect
impact among industries supplying the production, marketing and distribution process
with packaging, machinery, services etc. When supplier industries are included, the
employment impact is 11,913 jobs and $334 million in payroll.

Economic Impact of Oregon State Wine
Full Glass Research - 39 -
Note that the OED statistics do not include owners of businesses not on the payroll, nor
other non-compensated family members. For certain agricultural businesses these can be
a significant number of individuals and dollars, especially in Oregon with its many small
family-owned wineries and vineyards.
Where possible, we have calculated or estimated employment effects in each of the
supplier industries in the following sections.

Economic Impact of Oregon State Wine
Full Glass Research - 40 -
Allied Industries
We have analyzed separately a number of the industries that benefit from wine
production and distribution such as wholesalers, tourism, equipment and supplies and
trucking/warehousing. Some related industries – for example winery construction - have
not been separately enumerated in this study due to limited availability of data. However,
the indirect economic impact of these industries has been captured under IMPLAN
analysis, further discussed under other economic benefits.
Distribution (Wholesalers, brokers, importers)
Direct Employment: 269 (OED*)/344 (estimated**) Total Wages: $10,603,567 (OED*)/$15,009,343 (estimated**) Total Revenue: $436,420,656 *jobs classified by OED under wine-only wholesalers
**estimated jobs including brokers and beer/wine combined wholesalers
Oregon wineries can sell their wine to consumers directly, either at the winery itself or
via mail order or Internet purchases. They may also sell directly to retail accounts, acting
as their own wholesaler/distributor. Wineries from other states may sell directly to
Oregon consumers or have their wines imported into Oregon and distributed by an
Oregon wholesaler. For various legal, management and economic reasons, the vast
majority of wines from other states, and many Oregon wineries, are sold through the
“three-tier system,” from winery to distributor-wholesaler to retail & restaurant. For wine
produced outside the United States, importers may add another tier of distribution.
Importers, wholesalers and brokers can add value to wine distribution through delivery,
bill collection, warehousing and sales and promotion efforts.
Distribution of wine in Oregon has some features not found in most other states. Wineries
may act as their own wholesalers. In addition, spirits and liquor are sold through state
stores, with revenues going to the state government. Therefore wine distributors are much
more dependent on wine in terms of income, although for some distributors beer makes
up a substantial portion of their business.
In general, wineries substantially discount their wines when selling them to wholesalers.
This transfers margin and revenues from the winery to the wholesale tier, where the
distributor’s sales and margins support employment for the distributor. It supports the
investment in fixed assets such as buildings, equipment, delivery vehicles. The major
distributors in Oregon are privately held, so there is little specific public information
available about the distribution tier. Distributor revenues have been estimated based the
FGR distribution revenue model that incorporates surveys of distributors and wineries,
scan data, SOURCE sales data and OLCC tax data. The employment and revenue
estimates above are based on distribution and sales of all wines in Oregon, not just those
produced by Oregon wineries.

Economic Impact of Oregon State Wine
Full Glass Research - 41 -
In Oregon there are some distributors with substantial beer and wine business, whereas
others specialize only in beer or only in wine. While the OED records 269 jobs in
wholesale distribution of wine only (beer wholesalers removed), economic modeling
based on wholesale revenues estimates total employment in this tier at 344 jobs,
including jobs at beer/wine distributors and brokers. Estimates of impact using both
methods are given above, with direct referring to only the OED-NAICS definition and
extended referring to estimates based on economic modeling, which may also include
brokers.
Tourism
Direct Employment: 2,623 employees Total Wages: $67,785,997 Total Revenue: $279,559,842* *$207.5 million when restaurant revenues removed
Tourism related to the wine industry results in estimated expenditures of $279.6 million
throughout the state. This does not include tasting room revenues at the wineries; this
estimate covers hotel, food, entertainment, transportation, retail and other business
generated in Oregon by visitors to wineries. Note that in the summary tables on page 54-
55, tourist spending in restaurants (estimated at $72 million) has been backed out to avoid
double counting with the restaurant/retail revenues.
According to TravelOregon, between 9 and 12% of Oregon overnight leisure trips by
adults and 5-6% of leisure day trips include winery visits and/or wine tasting. The total
number of wine-oriented trips is estimated at 1,800,764. Approximately 743,000 or 41%
are estimated to come from out-of-state tourists.
The IMPLAN model estimates that tourism directly related to the wine industry employs
2,623 people and generates nearly $68 million in wages. This does not include employees
of winery tasting rooms or other winery hospitality, who are covered under winery
spending and employment.30
It must be noted that these figures are likely to be an underestimate, because they are
based on spending of the average tourist in Oregon. Given the demographics and
spending tendencies of regular wine consumers, a large proportion of the overnight
winery visitors are more likely to stay in hotels and spend far more money on meals than
the average Oregon tourist.
The impact of winery tourism has increased since the last report. The proportion of
overnight visitors going to wineries has increased from 8% to somewhere between 9 and
12%; average expenditure per trip has increased significantly. However, this is lower than
30
FGR Tourism model, Dean Runyan, Travel Oregon
Economic Impact of Oregon State Wine
Full Glass Research - 42 -
historical percentages for other wine-country destinations such as Mendocino, San Luis
Obispo and Amador counties in California, which range from 10 to 25 percent.31
There are a number of wine-related events that draw considerable numbers of wine-
related visitors to Oregon wine country. Two of the most prominent are the International
Pinot noir Celebration (IPNC) and Oregon Pinot Camp. These events draw hundreds of
trade visitors and tourists, and have a total impact that probably attains over $1 million.
Grapevine Nurseries
Direct Employment: 64 employees Total Wages: $ 1,673,928 Total Revenue: $ 4,858,000 The development of new vineyards of course requires new vines. In addition, vines in
existing vineyards are replaced periodically due to losses from disease or pests, changes
in market demand or declining production in old age. Most vineyards are planted with
purchased vines and/or rootstock. Vines planted on their own roots are typically less
expensive than vines grafted onto specialized rootstock. The value of grapevines and
rootstock planted in Oregon was over $3.5 million with between 716,000 and 995,000
vines purchased, and a significant portion of these dollars were spent at nurseries within
the state of Oregon.32
The OED does not separate grapevine or fruit nursery data from other types of nurseries
(flower, tree, etc.) and a number of the Oregon grapevine nurseries also function as
vineyards and wineries. Based on supplier databases and our vineyard survey, there are at
least 8 grapevine nurseries in Oregon, six of whom are headquartered in the state. In
addition, some Oregon vineyards sell grapevines to other Oregon vineyards and wineries,
and some of the Oregon nurseries sell vines to vineyards and wineries outside Oregon.
Based on our supplier survey and OED wage figures, Oregon grapevine nurseries are
responsible for at least 64 jobs and $1.67 million in wages, and generate $4.86 million in
revenues.
Equipment and Supplies
Corks & Closures & Other Packaging
Total Revenue: $262,102
Wine is sealed with a variety of closure devices. Historically, corks have been used to
seal wine bottles, although metal screw tops are popular and synthetic corks emerged in
the late 1990s. Most natural corks are imported, predominately from Spain and Portugal,
31
Travel Oregon, MKF Research 32
Full Glass Research

Economic Impact of Oregon State Wine
Full Glass Research - 43 -
and synthetic corks are primarily produced in Europe, North Carolina and Australia. Each
closure type has a distinctive set of costs, benefits and technical issues.
Corks are the dominant closure – the prices for the type typically used in Oregon range
from $0.25/cork to $0.50/cork, depending on the quality and length, with an estimated
average of $0.40/cork. Screw caps are increasingly popular, with roughly 16-23% of
Oregon wines being bottled with this closure. Screw caps and synthetic closures are
generally less expensive per unit than corks, typically 10-15 cents, although they may
have higher equipment and bottling costs. Most wine bottles sealed with natural or
synthetic corks are also sealed with some sort of capsule. (Screw caps do not require
capsules.) Capsule costs range from $0.05 to $0.30, but most range 5-10 cents.
There are no capsule, cork, or other closure manufacturers in Oregon. The majority of
revenue for corks and closures goes to out-of-state producers. Only the margins retained
by wholesalers, brokers and salespeople for the out-of-state cork producers remain in
Oregon. Oregon wineries spent $11.5 million on corks and closures in 2013, however
only about $262 thousand of this revenue goes to firms within the state of Oregon. Since
packaging salespeople may cover additional territories outside Oregon and brokers often
support other products, it is not possible to estimate related employment separately.
One Oregon company, the Quenett Winery, has based its very successful Copa di Vino
brand on a novel package where the wine is contained in a ready-to-use glass. Another
Oregon wine company, Union Wine, is pioneering Pinot Noir and Pinot Gris in cans. As
these are individual private companies with trademarked packaging, no data was
available on cost or economic impact of these innovations.
Some Oregon wineries are now packaging wine in kegs that are distributed to restaurants
and bars and returned for refilling, similar to beer. However, currently this relatively new
packaging and service is provided by out-of-state suppliers, so there is no unique instate
economic impact.
In April 2013, the Oregon government began to permit wine to be sold in “growler”
format, an option previously available only for beer. “Growler” bottles are simply
containers returned by the consumer for refilling by either a retailer, restaurant or winery.
Because of the decentralized nature of the growler business, and some confusion in
implementation of the law, it is not currently feasible to estimate its economic impact.
Glass
Total Revenue: $ 1,380,221
Glass is the most common container for wine, and increasingly, the bottle shape and color
are becoming important marketing devices as well. Since they compete in the high
premium sectors, the vast majority of Oregon wines are bottled in glass. However,

Economic Impact of Oregon State Wine
Full Glass Research - 44 -
Oregon has no glass producer that supplies the wine industry. All of the wine bottles used
by Oregon wineries come from elsewhere in the U.S. or foreign countries.
Based on an average glass cost per case of $7.88, Oregon wineries spent $21.9 million on
glass in 2013. Only a small proportion of this impacts the Oregon economy, via brokers
and sales representatives for glass companies. We estimate $2.38 million in retained
margins from glass revenues and related packaging within Oregon itself. Since
salespeople, warehouses and brokers may cover additional territories outside Oregon and
brokers often support other products, it is not possible to estimate related employment
separately.
From an environmental perspective, wine bottles have one of the highest probabilities of
being recycled for all beverage containers (regardless of materials or redemption value), a
benefit not quantified above.
Bottling & Filtration Services, Custom Crush
Total Jobs: 14 (bottling)* Total Wages: $410,507 (bottling)* Total Revenue: $28,749,108 (bottling+custom crush)
*custom crush facility jobs and wages are included under winery employment, page 37
A bottling line is a substantial capital investment that, in most wineries, is used less
frequently than pumps, tanks, filters or many other types of equipment. Unlike crushing
and pressing equipment, it is not required until the end of the production process. Many
wineries elect to contract with mobile bottling services, or have their wine bottled at
custom crush facilities or bonded warehouses that offer this service, rather than invest in
their own bottling line. The OWB-FGR survey indicates that as much as 39% of Oregon
wine (over 1 million cases) may be bottled by these independent services. At $2 to $4
charged per case, bottling revenues would range from $2.17 to $4.34 million.
Two companies in Oregon offer mobile bottling or filtration or other processing services,
wherein a team with equipment will come to a winery or storage facility and bottle or
otherwise process a company’s wine. Bottling and related services are also offered by
some custom crush and storage facilities. Supplier databases and industry interviews
indicate that independent or contracting lines employ at least 14 persons at approximately
$410,507 in wages. Bottling-related employment at custom crush and storage facilities
are covered in the winery statistics.
In addition to bottling services, there exist wineries that do most or all of their business as
“custom crush” facilities, i.e. making wine for other wineries and brands without winery
homes. Custom crush services are also offered by wineries with excess capacity on an
irregular basis. Employment at custom crush facilities is covered in the Winery
employment statistics (page 37), but revenues are not, although custom crush revenues
Economic Impact of Oregon State Wine
Full Glass Research - 45 -
become part of the cost structure for wines later sold in or out of state. According to the
SOURCE winery census, 8,782 tons of grapes were custom-crushed in 2013, roughly
equivalent to 553 thousand cases or 17% of the total wine production in the vintage. The
amount of grapes custom-crushed in 2010 was 3,849 tons, approximately 13% of the total
harvest.
The revenues for custom-crushing vary widely by not only the quantity of grapes crushed
but also the various methods of producing and maturing the wine. Based on a survey of
wineries who custom-crush and conservative assumptions, we use $35 per case for
unoaked whites and $55 per case for reds & oaked whites to arrive at total custom crush
revenues of $26,579,108.
Trucking, Transportation & Warehousing
Direct Employment: 81 (freight)* 84 (whse)** Total Wages: $4,529,812 (freight)* $2,463,048 (whse)** Total Revenue: $8,268,350 (freight)* $3,564,790 (whse)** *Implan **estimated from supplier survey
Trucks are used to transport grapes, bulk wine, empty glass, barrels, supplies and
equipment to wineries. Trucks also move full cases of bottled wine and bulk wine to
warehouses, distributors and export staging. Oregon wineries spend an estimated $4.5
million annually on transport. This estimate does not include proprietary trucking by
distributors, but does include independent trucking costs for wineries that handle their
own distribution and brokers that outsource delivery.
There are at least four warehouses that store wine for wineries, stage shipments,
coordinate freight, and may offer additional services such as compliance, direct to
consumer shipping or bottling. Many wineries use warehouses for bottled wine storage at
some point in its journey from production facility to consumer, whether because space is
short at the winery or for freight consolidation and efficiencies. There are no public
figures available for warehouse usage and spending, but a high proportion of Oregon
wineries use them of at least some of their wine. With storage charges ranging from 10-
20 cents per case per month and additional revenue from other services, warehouse
revenues are presumably well over $3 million.
Stainless Steel Tanks & Related Equipment
Direct Employment: 70 employees* Total Wages: $3,966,805* Estimated Revenue: $10.5 million
*tank firms typically also sell other equipment and infrastructure, thus the employment estimate
here may also reflect their sales
Economic Impact of Oregon State Wine
Full Glass Research - 46 -
Durable and easy to clean, stainless steel is the most frequently used material for
fermentation and storage in the wine industry. Stainless steel tanks are made in Oregon,
in a few other states, and in Europe. Oregon has several large firms involved in the
design and manufacture of stainless steel tanks. There are a variety of types, ranging
from basic containers to temperature-controlled tanks with automated features and
computer monitoring. Tanks have a useful life of approximately 25 years, so they are not
purchased frequently; business tends to follow major expansions in winery volume and
capacity and then level off. The business among wineries tends to be extremely cyclical,
as capacity expansion is affected by new plantings (with a lag effect), the rate of new
winery starts, ease of credit and other variables.
Based on the reported capacity issues and the increase in wine production from 2010 to
2013, there is no doubt that there has been substantial investment in stainless steel tanks
by the wine industry during that period. Using the NW Winery production cost model33
,
winemaker interviews, and the industry’s ability to process the large 2013 and 2014
harvests, FGR estimates that at least $8.4 million was invested in stainless steel tanks in
2013. (If the increased capacity required for growth during 2011-2013 is allocated evenly
by year, the amount invested would have been $13.3 million in 2013.) In addition, we
estimate $2.1 million dollars spent by new, bonded, “bricks and mortar” wineries in
2013.
There are a number of stainless steel tank producers in Oregon, although not all produce
tanks for the wine industry. Since they are private companies, only limited data was
available. Trade interviews indicate that 2013 was a strong year for the tank industry,
with at least two firms stating it was their best year ever for winery business.
Oregon-based firms doing business with wineries employed at least 70 people in wine-
related business. However, since the firms typically produce or sell other types of
equipment and infrastructure, there may be some overlap in employment impact with the
winery equipment section. The average annual wage in the heavy gauge steel-
manufacturing sector in Oregon was $56,669 in 2013.
Wine Labels and Other Printing
Direct Employment: 85 Total Wages: $3,531,736 Total Revenue: $11,003,908 Wine labels are required by Federal (TTB) regulation. Labels are also the key element in
wine package design, as wineries attempt to create an image, communicate with
consumers and gain notice on the shelves. In fact, for many small wineries, labels are the
most important part of winery marketing. A certain number of labels are affixed to the
33
http://www.nwwinerycalculators.org/index.php
Economic Impact of Oregon State Wine
Full Glass Research - 47 -
outside of cases of wine to identify the product. Additional labels are often printed for
marketing purposes, for press kits and to hand out at events.
We estimate that in 2013 the Oregon wine industry purchased approximately 37 million
labels with a value of roughly $10.4 million, with $8.4 million in value coming from
Oregon printers. In addition, Oregon printers sold labels to wineries outside Oregon, but
there was insufficient data to estimate this revenue effect. The employment impact from
wine labels is difficult to quantify because label printers have other winery and non-
winery printing business, but prorating from IMPLAN revenue/wage ratios, we estimate
85 jobs supported by spending on wine labels and other printing.
In addition to labels, wineries generate substantial demand for other printed materials,
such as brochures, posters, sales presentations, cards, and so on. This spending is
extremely variable by winery and some of it is done in-house, some by local copy and
printing services and some by commercial printers. Based on the same ratios of non-label
printing to label printing, an extra $2.6 million is estimated spent at printing companies.
The total number of jobs related to printing services for wineries is 85, with related wages
of $3.5 million.
Cooperage & Barrel-related services
Direct Employment: 3-5 employees Total Wages: $ na Revenue: $ na
Oregon wineries probably spend $5-7 million on new barrels annually (FGR estimate)
but only a small portion goes to firms within Oregon. The two categories of Oregon
revenue would include in-state sales of Oregon Barrel Works’ products and sales or
broker fees for representatives or resellers based in Oregon. However, there is
insufficient information to estimate this revenue, which could easily range from $100,000
to $600,000 a year.
Barrels typically have a useful life of four to eight years, as opposed to stainless steel
tanks that have a useful life of 25+ years. Most red wines over $20/bottle are aged at
least partially in oak barrels. Red wines between $10 and $20 per bottle may have a
portion of their blend aged in barrels, but also use short term exposure to oak staves or
chips for flavor. Certain white wines (most typically Chardonnay) are also aged in
barrels. Some white wines are fermented in barrel. Thus most wineries producing those
wines buy a certain percentage of new barrels every year. For such wineries, barrels may
be the second most expensive item in their budget after grapes.
Wine is stored in barrels for a number of reasons. Wine develops and matures in barrels,
while barrels can impart a favorable taste and texture and are a natural way to clarify
wine. Wine barrels are made predominately from French or American oak, and are
Economic Impact of Oregon State Wine
Full Glass Research - 48 -
assembled in France, the United States and Eastern Europe. Oak from Oregon forests has
some strong supporters among barrel-makers.
Oregon Barrel Works, the Pacific Northwest’s only cooperage, is based in McMinnville
and produces and sells barrels made from French and Oregon Oak. Oregon Barrel Works
produces Oregon oak barrels starting with the sourcing of the trees and working to
finished barrels. They also purchase wood from France which is seasoned and then
coopered into barrels, and provide barrel repair and maintenance. They also produce
barrels for beer companies. As a privately held firm, their employment and revenue
numbers are not available.
Winery and Vineyard Miscellaneous Supplies & Inputs (Chemicals, Gases, Sprays, Fertilizers, Filter & Fermentation Aids, etc.)
Direct Employment: 178 employees Total Wages: $ 5,370,310 Total Revenue: $ 7,623,774 Winery Spending: $ 3,070,764 Vineyard Spending: $ 4,553,010
Oregon wineries spend approximately $3.6 million annually on chemicals, gases and
various supplies, of which roughly $3.1 million goes to companies in Oregon.
Oregon vineyards also spend on various growing inputs ranging from trellising materials
to fertilizer to machine oil. In 2013 Oregon vineyards spent $6.5 million on mature (3+
year old) vineyards in this sector, of which $4.6 million was spent with Oregon
companies. (Spending on inputs for new vineyards is in development section, page 30.)
Average spending per acre was $301.34
Industry Associations
Direct Employment: 15 Annual Spending: $2,718,466* *Net of excise taxes redirected to Oregon Wine Board (covered in taxation section)
The Oregon Wine Board is a semi-independent, state agency that replaced the Oregon
Wine Advisory Board when Governor Ted Kulongoski signed the House Bill 3442 into
law on September 23, 2003. The Board is charged with supporting enological,
viticultural, economic research, and the promotion of grape growing and winemaking in
Oregon. Funds to support this work come from mandatory taxes on the production of
34
FGR-OWB survey
Economic Impact of Oregon State Wine
Full Glass Research - 49 -
Oregon wine grapes ($25/ton) and on certain wines sold in Oregon ($.02/gallon), as well
as revenue from symposia, workshops and various events. In addition, the Oregon
Winegrowers Association shares an office, staff and Board with the Oregon Wine Board.
The 2013 budget for OWB was $1,724,040 while that for the OWA was $357,732. The
combined budgets support nine employees.
Other grower and winery associations include: Columbia Gorge Winegrowers, Southern
Oregon Winery Association, Umpqua Valley Winegrowers Association, the Walla Walla
Valley Wine Alliance, The Wineries of Lane County, Willamette Valley Grape Growers,
the Willamette Valley Winery Association, Chehalem Mountains Winegrowers, Dundee
Hills Winegrowers Association, McMinville AVA, Eola-Amity Hills, Heart of
Willamette, Yamhill-Carlton AVA, the South Willamette Wineries Association, PDX
Urban Wineries Association and several more. Many of these organizations rely on the
volunteer work of their members. However, they do account for at least 6 fulltime jobs
and over $713,000 of annual spending.
Services – Banking, Consulting, Accounting, Insurance, etc.
Direct Employment: 85 Total Wages: $4,568,274 Total Revenue: $19,529,689 Wineries and vineyards require a wide variety of supporting services, ranging from
typical business support such as accounting, advertising and marketing and insurance to
specialized services such as waste water engineering, enological and environmental
consulting, and regulatory compliance. In addition, as a capital intensive, long term
business, wineries and vineyards use a wide variety of financing methods. All of these
generate business for local service industries. The surge of vineyard and winery
investments and acquisitions by outside companies undoubtedly boosted revenues in this
sector during 2013.
Other Economic Effects
Taxes & Regulation
The wine industry generates significant tax dollars, benefiting federal, state, and local
governments. In Oregon, tax dollars are raised through excise taxes, income taxes, estate
and gift taxes, payroll taxes, property taxes, and other business taxes and fees, such as
occupational taxes, licenses, and import duties.
An excise tax is a type of sales tax on a specific commodity, in this context assessed on
wine sales. Industry employers also pay payroll taxes to federal and state governments for
their employees along with a percentage of their net income in the form of income taxes,
which is paid at the corporate level or passed through to individuals, depending on the
ownership structure. We have not included estate or county taxes in the tax revenue

Economic Impact of Oregon State Wine
Full Glass Research - 50 -
summary below. Oregon has no state sales tax. Property tax is a tax on the ownership of
property by local government. Property taxes are covered in Appendix 3 – Regional and
County Impact, since they are primarily used for local government. Commercial property
taxes generated directly by the wine industry and indirectly by its supplier and allied
industries totaled $70,714,914 according to IMPLAN.
Oregon State Taxes, Licenses and Other Fees Directly Related to Wine*
Tax Type Total 2013
Excise taxes on wine $ 9,734,929
Direct Payroll $ 2,244,307
Licenses and fees - wineries $ 232,500
Licenses and fees – wholesale/retail $ 2,791,175
State Corporate Taxes $ 2,142,391
State Income Taxes $ 20,658,793
Indirect and induced tax effects $ 25,249,259
Total $ 63,053,354
Source: Oregon Department of Revenue, OLCC, FGR *Does not include commercial or residential property tax impacts; see appendix 4 for property tax estimates
The majority of licensed Oregon wineries are excise tax-exempt due to their small
production. Most of the Oregon excise tax dollars come from larger wineries and wines
imported into the state. The tax rate for non-exempt wine is 67 cents per gallon for wine
under 14 percent alcohol and 77 cents per gallon for wine over 14 percent alcohol. Only 2
of the 67 cents accrue to the Oregon Wine Board.
Oregon State Liquor Control Commission
Employment*: 5 employees Total Spending*: $1,155,000 *attributable to wine
As of 2014, Oregon had granted 12,696 licenses for the sale of wine, including 930
winery licenses, 7,029 on-premise licenses, 165 wholesale distributor licenses, and 4,572
off-premise licenses.
The licensed wineries renew their licenses during one of the four renewal periods during
the year. When they renew depends on where they are located in the state. The annual fee
is $250 per year, so the OLCC collected an estimated $232,500 in revenue from these
licensees. Note that the number of winery licenses granted differs from the winery count
in the SOURCE winery census data, which measures only “bricks & mortar” wineries

Economic Impact of Oregon State Wine
Full Glass Research - 51 -
and excludes fruit, cider, brandy and beer producers that may also produce what is
technically defined as wine.
The OLCC employs 227 people, with an operating budget of $72,800,000 (based on the
OLCC 2013-14 annual report). However, 96 percent of their budget comes from sales of
liquor through the state store system. If you assign half of the remaining 4 percent based
on wine’s percentage of sales and licensing fees to wine, the wine industry supports
$1,155,000 of OLCC activities, and 5 employees.
Charitable Contributions Total Spending: $11.32 million
According to the OWB-FGR winery survey, responding wineries contributed $2.91 to
charity for every case of wine sold, in the form of time and events, wine donations, and
cash contributions. Projected to the entire industry, Oregon wineries and wine grape
growers contributed an estimated $7.82 million to charitable organizations in 2013.
According to the OWB-FGR vineyard survey, vineyard companies and owners donated
$146 per acre, projecting to an estimated $3,499,327 in charity for 2013.

Economic Impact of Oregon State Wine
Full Glass Research - 52 -
Direct, Indirect, Induced and Net Effects
IMPLAN Modeling
IMPLAN is derived from the phrase “IMpact analysis for PLANing.” IMPLAN is an
economic model that uses input-output tables for over 400 industries. Initially developed
by the U.S. Forest Service, it is currently used hundreds of universities, government
agencies, corporations and economic consulting firms doing research to estimate regional
and industry-specific economic impacts. Full Glass Research supplemented its figures for
employment, wages, and revenue with IMPLAN estimates for those areas not specifically
covered in our analysis. For example, we developed our own estimates for the wages and
employment within the wine and grape growing industry. However, we used IMPLAN
for estimates of the impact of these wages being spent within the Oregon economy on
housing, food, entertainment, etc. In some cases, such as spending on chemicals and
related supplies or trucking, Full Glass used IMPLAN to calculate part or all of the effect
on revenues, employment and wages. The IMPLAN analysis for this report was
conducted by Professor Robert Eyler PhD. Professor Eyler is Professor of Economics and
Director of the Center for Regional Economic Analysis at Sonoma State University and
proprietor of Economic Forensics & Analytics, and has extensive experience analyzing
wine industry impacts. In the IMPLAN model, these effects are categorized as follows:
Direct effects are changes in the industries associated directly with final demand. For
example, in this study, winery revenue is the direct effect of all wine sold by Oregon
wineries. Direct jobs and wage (income) effects represent the employees hired by, or
income derived directly from, the production and sale of wine – from vineyard down
through retail sales. Direct effects were estimated based on extensive primary research by
Full Glass Research. IMPLAN was not used for these calculations.
Indirect effects are the changes in industry sectors that supply goods and services to
industries directly affected by the changes in demand for wine or grapes. Examples of
indirect effects are the purchase of bottles, corks, utilities, and goods and services by the
wine industry. Some indirect effects were estimated based on primary research, but where
this research was insufficient they were supplemented or replaced by IMPLAN.
Additional indirect revenues calculated with IMPLAN were $276,070,988.
Additional indirect employment is estimated at 1,677 jobs and $92,189,822 in wages.
Induced effects are changes in economic activity resulting from households spending of
income earned from direct or indirect sales. For instance, employees of wineries and
printers spend their wages and salaries in Oregon, resulting in additional output, income,
and jobs in Oregon. These effects were entirely estimated using IMPLAN. Induced
effects included revenues of $388,999,800; employment of 3,162 jobs at $134,832,111
in wages.
Total economic effects are the sum of direct, indirect, and induced effects.

Economic Impact of Oregon State Wine
Full Glass Research - 53 -
Measuring Net Economic Effects
This study was intended to give as wide and comprehensive a view of the economic
impact of wine in Oregon as possible. Thus, for nearly every sector that is impacted by
production or sales of wine, we calculated the total revenues and wages resulting from
that activity. This is essentially a summary or catalogue of the impact of wine on the
Oregon state economy. It enables those making decisions affecting the production or sale
of wine to get a better idea of the scope and potential impact of those decisions, by
economic sector and activity. In addition, it provides a valuation of each sector’s wine
related activity as it would be felt or seen by that sector.
Economists evaluating investments or policies with economic impact have another way
of comparing choices among those alternative investments or policies. This is to measure
the net economic effect of the choice. This changes the analysis when applied to a
vertical analysis of a production or distribution process, for example when raw materials
are purchased and transformed by one entity, sold to another entity, and then sold to the
final consumer. With this type of analysis, costs for one participant that are revenue for
another participant are removed from the valuation, so that only the net value added by
the processor or distributor contributes to the measurement. In addition, wages are treated
separately in this analysis, since: (a) some large portion of the wages is actually spent on
products or services in the revenue stream; (b) the wages paid in one tier are costs for that
tier, thus reducing the net economic impact of revenues.
Which method should be applied depends on the intent of the user. If the policy-maker
wants to assess the scope of revenue, wages and employment that would be affected by a
policy impacting a particular sector or tier of the industry, the summary approach is more
useful. If the policy-maker is comparing alternative investments or policies that affect
multiple tiers of the industry, or assessing the comparative economic contribution of
unrelated industries, then the net economic impact might be preferred – provided that all
of the alternatives are valued using the same basis and methodology.
Full Glass Research consulted with Professor Robert Eyler in synthesizing our primary
research and the IMPLAN model output to arrive at the following valuation of net
economic benefit for the Oregon wine industry:
Revenue Category Net Impact
Grape grower revenues $79,830,504
Net Winery Direct Impact $283,648,575
Net Wholesale Tier Direct Impact $326,215,379
Net Retail Tier Direct Impact $382,796,944
$1,072,491,402
Indirect & Induced Net Impact (IMPLAN) $327,350,036
Total Net Effect $1,399,741,438

Economic Impact of Oregon State Wine
Full Glass Research - 54 -
Health Effects of Wine in the Economy As an alcoholic beverage, wine has some impact on the health of those consuming it and
this effect has economic consequences. In the case of wine, the effect is both positive and
negative.
Over the past two decades, a considerable amount of new research has supported the
notion that moderate consumption of wine over a period of time appears to increase
longevity and reduce incidence of cardiovascular disease, and may have other positive
health effects. This has economic implications such as reduced medical costs, improved
long term productivity, etc. On the other hand, excess consumption of any alcoholic
beverage clearly has negative economic implications ranging from absenteeism to car
accidents to poor health outcomes.
As the alcoholic beverage generally associated with moderate consumption and least
likely to be abused, wine would probably fare well in an assessment of its health-related
costs and benefits. However, due to the emerging nature of the research and the special
expertise required for studies of this sort, Full Glass Research has not attempted to
determine economic effects related to health in this study.

Economic Impact of Oregon State Wine
Full Glass Research - 55 -
Total Oregon State Economic Impact
Revenue Total Oregon 2013
Winery Sales $363,479,079
Retailers and Restaurant Wine Sales (in Oregon) $816,663,398
Distributors' Sales (in Oregon) $433,866,454
Wine Grape Sales* $80,055,404
Tourism** $207,538,468
Glass, corks, closures, packaging $1,642,323
Tax Revenues $63,054,354
Professional Services - banking, insurance, accounting,
consulting, etc. $19,529,689
Vineyard Development $10,444,175
Vineyard Maintenance and equipment $69,438,899
Winery Maintenance, equipment, tanks, infrastructure $18,848,782
Printing (including wine labels) $11,003,908
Grapevine Nurseries $4,858,000
Trucking, Shipping, Warehousing $11,833,140
Charitable Contributions $11,320,000
Bottling & Custom Crush Services $28,749,108
Chemicals, Gases, Fertilizers, etc. $7,623,774
Oregon Liquor Control Commission $1,155,000
Other Indirect effects - IMPLAN $276,070,988
Wine Industry Induced Revenues - IMPLAN $388,999,800
Total Revenue $2,826,174,743
* does NOT include winery-owned grapes valued at market prices; value with them = $127,990,000
** removed restaurant spending by tourists to avoid double-counting with restaurant/retail wine sales
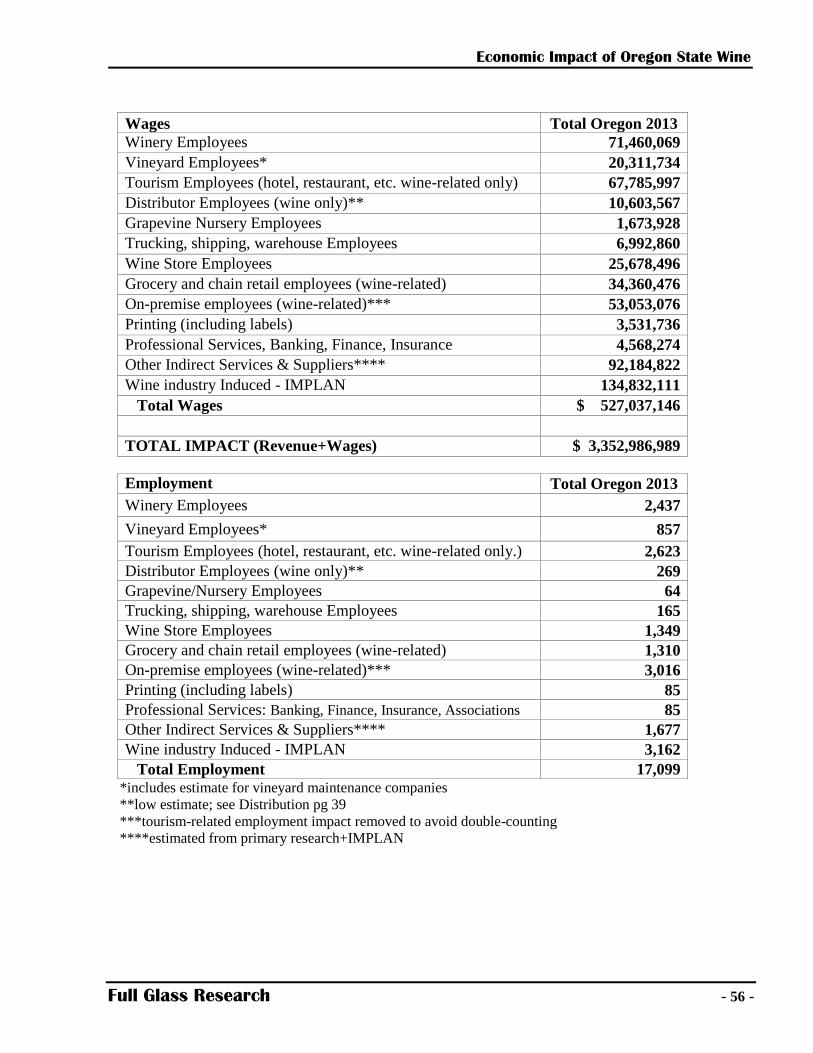
Economic Impact of Oregon State Wine
Full Glass Research - 56 -
Wages Total Oregon 2013
Winery Employees 71,460,069
Vineyard Employees* 20,311,734
Tourism Employees (hotel, restaurant, etc. wine-related only) 67,785,997
Distributor Employees (wine only)** 10,603,567
Grapevine Nursery Employees 1,673,928
Trucking, shipping, warehouse Employees 6,992,860
Wine Store Employees 25,678,496
Grocery and chain retail employees (wine-related) 34,360,476
On-premise employees (wine-related)*** 53,053,076
Printing (including labels) 3,531,736
Professional Services, Banking, Finance, Insurance 4,568,274
Other Indirect Services & Suppliers**** 92,184,822
Wine industry Induced - IMPLAN 134,832,111
Total Wages $ 527,037,146
TOTAL IMPACT (Revenue+Wages) $ 3,352,986,989
Employment Total Oregon 2013
Winery Employees 2,437
Vineyard Employees* 857
Tourism Employees (hotel, restaurant, etc. wine-related only.) 2,623
Distributor Employees (wine only)** 269
Grapevine/Nursery Employees 64
Trucking, shipping, warehouse Employees 165
Wine Store Employees 1,349
Grocery and chain retail employees (wine-related) 1,310
On-premise employees (wine-related)*** 3,016
Printing (including labels) 85
Professional Services: Banking, Finance, Insurance, Associations 85
Other Indirect Services & Suppliers**** 1,677
Wine industry Induced - IMPLAN 3,162
Total Employment 17,099
*includes estimate for vineyard maintenance companies
**low estimate; see Distribution pg 39
***tourism-related employment impact removed to avoid double-counting
****estimated from primary research+IMPLAN
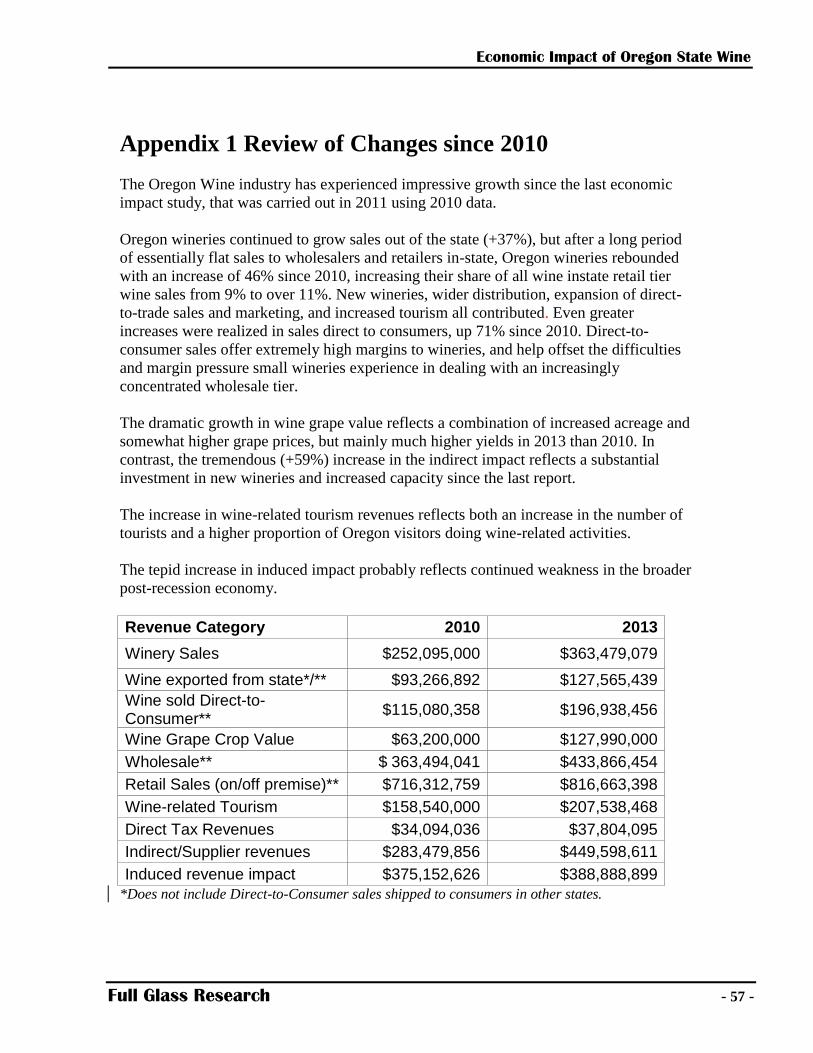
Economic Impact of Oregon State Wine
Full Glass Research - 57 -
Appendix 1 Review of Changes since 2010
The Oregon Wine industry has experienced impressive growth since the last economic
impact study, that was carried out in 2011 using 2010 data.
Oregon wineries continued to grow sales out of the state (+37%), but after a long period
of essentially flat sales to wholesalers and retailers in-state, Oregon wineries rebounded
with an increase of 46% since 2010, increasing their share of all wine instate retail tier
wine sales from 9% to over 11%. New wineries, wider distribution, expansion of direct-
to-trade sales and marketing, and increased tourism all contributed. Even greater
increases were realized in sales direct to consumers, up 71% since 2010. Direct-to-
consumer sales offer extremely high margins to wineries, and help offset the difficulties
and margin pressure small wineries experience in dealing with an increasingly
concentrated wholesale tier.
The dramatic growth in wine grape value reflects a combination of increased acreage and
somewhat higher grape prices, but mainly much higher yields in 2013 than 2010. In
contrast, the tremendous (+59%) increase in the indirect impact reflects a substantial
investment in new wineries and increased capacity since the last report.
The increase in wine-related tourism revenues reflects both an increase in the number of
tourists and a higher proportion of Oregon visitors doing wine-related activities.
The tepid increase in induced impact probably reflects continued weakness in the broader
post-recession economy.
Revenue Category 2010 2013
Winery Sales $252,095,000 $363,479,079
Wine exported from state*/** $93,266,892 $127,565,439
Wine sold Direct-to-Consumer**
$115,080,358 $196,938,456
Wine Grape Crop Value $63,200,000 $127,990,000
Wholesale** $ 363,494,041 $433,866,454
Retail Sales (on/off premise)** $716,312,759 $816,663,398
Wine-related Tourism $158,540,000 $207,538,468
Direct Tax Revenues $34,094,036 $37,804,095
Indirect/Supplier revenues $283,479,856 $449,598,611
Induced revenue impact $375,152,626 $388,888,899
*Does not include Direct-to-Consumer sales shipped to consumers in other states.

Economic Impact of Oregon State Wine
Full Glass Research - 58 -
** The following 2010 numbers have been restated for either greater accuracy or to put
them on the same methodology as 2013 for comparison:
1) Direct-to-consumer winery revenues - 2010 assumed same product mix for clubs
as FOB, whereas 2013 uses prices modeled using FGR-OWB survey and the
W&V/ShipCompliant database;
2) Wine exported from state – the 2010 price was restated based on Nielsen retail
data, as is 2013;
3) Wholesale revenues and restaurant revenues- 2013 reflects a more realistic
allocation of on-premise margins; 2010 numbers are restated using the same
method.
The restated numbers above eliminate the effects of the change in methodology when
comparing 2013 to 2010.
.

Economic Impact of Oregon State Wine
Full Glass Research - 59 -
Appendix 2 – Impact of Oregon Wineries & Vineyards
The complete report describes the effects of wine production and sales throughout the
economy, from input and service suppliers to retail sales, for all types of wine. A
substantial portion of the retail and wholesale revenue and wage effects are related to the
sales of wine imported into Oregon, whether from other states or countries. This
appendix isolates the economic impact of just Oregon-produced wine and grapes on the
state economy.
The following table enumerates revenue, wages and jobs that are derived solely from
Oregon wine grapes and wine, without the impact of wine imported into the state.
Sector Revenue Wages Jobs
Grapegrowing $164,571,578 19,072,449 813
Winery $363,479,079 71,460,069 2,437
Tourism 207,538,468 67,785,997 2,623
Supplier $149,139,934 36,697,480 813
Wholesale $ 60,666,527 $1,482,672 38
Retail tier $ 114,119,804 $13,954,081 703
Induced $54,358,480 $18,841,317 442
Total 2013 $1,113,873,869 $229,294,065 7,868
Despite only having a 11% share of all retail sales, Oregon’s home industry is directly
responsible for 39% of the in-state revenue, 43% of the wages and 46% of the jobs that
are related to wine in-state. Thus even removing the effects of retail and wholesale of
wines from other states and countries in Oregon state, the total economic impact for just
Oregon wine within state is over $1.3 billion.

Economic Impact of Oregon State Wine
Full Glass Research - 60 -
Appendix 3 – Note on Vineyard & Winery Wages
The jobs and wages of those employed directly by vineyards and wineries are based on
data from the Oregon Employment Department. Where sufficient additional data was
available, Full Glass Research has augmented the numbers. However, they are almost
certainly an underestimate, due to the following factors:
Reporting of wages and jobs to the OED is based on participation in the
unemployment insurance program. Vineyards that are too small to meet the
required payroll threshold, use mostly contracted labor or mainly family members
generally do not report to the OED.
Discrepancies between OED and the SOURCE, TTB and the FGR-OWB survey
data. As recently as 2012, the OED vineyard data is based on just 77 vineyards,
whereas SOURCE estimates 951 total vineyards in Oregon in 2013. Similarly, in
2012 OED had data for 224 wineries on file, whereas SOURCE estimated 605
wineries in 2013 and the TTB had 529 permits on file.
The prevalence of seasonal and part-time work in the industry may cause
problems in estimating the number of full-time equivalent jobs when reporting to
the OED.
Many wineries crush or bottle at other facilities; to the extent these are reporting
wineries or custom-crush facilities, the production jobs are reflected in the OED
data, but administration, sales and marketing may not be
Wineries that own vineyards may register employees under the winery rather than
the vineyard.
Wineries may outsource sales and marketing to independent brokers and
consultants.
Readers interested in more detail on the issues of estimating direct employment by
vineyards and wineries are referred to “Fruit of the Vine: Oregon’s Grape and Wine
Industry” by Annette Shelton-Tiderman, February 10, 2014; State of Oregon
Employment Department.

Economic Impact of Oregon State Wine
Full Glass Research - 61 -
Appendix 4 – Regional & County Impact
For the 2014 report, the economic impact of the wine industry was also allocated by
wine-growing region and, where feasible, by county. The following tables provide
estimates of wine-related revenues, wages and employment by region and county. The
method used to allocate these impacts by region and county varies, depending on what is
being measured. In some cases (e.g. winery employment) the data is directly available at
county level from the Oregon Employment Department. In others, the state-level data has
been allocated based on winery production, vineyard acreage or other relevant data that
exists at the county level. In still others, IMPLAN economic modeling software was used
to allocate the effects.
Property taxes have been included because they are a primary fund-raising method for
local government. They were not included in the State level report for that same reason.
When looking at the numbers, readers should bear in mind that the Willamette Valley
region extends into Multnomah county, which includes the city of Portland. This
accounts for the very high distribution and retail numbers there.
Note that revenues from primary research on packaging, bottling & custom crush
services, nurseries and some other suppliers were either not included in the regional and
county-level figures, or allocated by winery-related activity. This is because these service
and product providers typically cover multiple counties and regions and are in some cases
represented by brokers or agents. In some cases their impact overlaps winery or vineyard
impacts. It was therefore not feasible to devise an accurate allocation of their impact by
county. For the same reasons, the employment impact of distributors and some
professional services has been omitted from the county data. Because of the above
differences in methodology, the regional and county numbers do not add up to exactly the
same as the corresponding total state numbers. They are intended to be used
independently.

Economic Impact of Oregon State Wine
Full Glass Research - 62 -
Wine Industry Economic Impact by Region 2013
Region Willamette
Valley* Southern Oregon
Columbia Valley
Winery/Grower Revenues $ 386,532,541 $ 45,757,349 $ 16,388,758
Wholesale & Retail Revenues**
$ 916,404,186 $ 113,459,617 $ 38,592,817
Wine-related Tourism Revenues
$ 173,232,885 $ 22,204,002 $ 9,757,847
Indirect & Induced Revenues $ 746,669,578 $ 94,370,465 $ 27,400,618
Wages $ 419,936,293 $ 51,003,985 $ 14,941,693
Employment 13,177 1,756 499
*includes Multnomah county & Portland
**Wholesale & Retail revenues from all wine of all types/sources

Economic Impact of Oregon State Wine
Full Glass Research - 63 -
Wine Industry Economic Impact by County 2013
Counties Wine-Related
Revenue ($)* Wages ($) Jobs
Indirect & Induced
Revenues
Property Taxes
BAKER 6,163,888 936,672 40 $ 1,861,308 $ 193,376
BENTON 31,013,243 5,578,642 254 $ 8,382,882 $ 972,874
CLACKAMAS 124,180,933 21,647,630 781 $ 43,708,028 $ 3,968,012
CLATSOP 9,621,343 4,322,001 174 $ 9,621,343 $ 800,097
COLUMBIA 10,079,741 2,298,136 118 $ 5,234,893 $ 616,976
COOS 10,474,648 2,759,890 122 $ 6,145,748 $ 367,989
CROOK 3,719,643 529,120 24 $ 986,497 $ 109,560
CURRY 6,516,512 1,068,361 46 $ 2,104,365 $ 218,084
DESCHUTES 63,499,165 14,433,594 498 $ 31,642,329 $ 2,237,853
DOUGLAS 44,004,813 9,823,154 389 $ 19,804,636 $ 1,370,626
GILLIAM 1,291,841 163,983 7 $ 322,317 $ 32,754
GRANT 1,670,543 226,769 10 $ 472,304 $ 59,953
HARNEY 1,038,947 127,706 15 $ 301,975 $ 33,233
HOOD RIVER 20,368,430 3,974,725 145 $ 7,129,872 $ 515,716
JACKSON 103,415,389 27,714,767 897 $ 59,089,561 $ 3,424,781
JEFFERSON 4,455,702 556,117 25 $ 968,450 $ 138,808
JOSEPHINE 34,000,766 13,466,063 470 $ 15,476,268 $ 1,689,757
KLAMATH 4,316,774 2,567,473 95 $ 2,285,968 $ 510,962
LAKE 1,062,359 190,250 9 $ 328,195 $ 35,910
LANE 193,177,930 57,421,894 1,802 $ 109,849,448 $ 6,481,156
LINCOLN 3,025,966 5,842,928 234 $ 11,156,579 $ 1,043,642
LINN 23,086,631 3,933,258 162 $ 7,485,056 $ 763,711
MALHEUR 8,343,990 1,107,001 52 $ 2,381,814 $ 252,019
MARION 139,670,351 39,879,284 1,184 $ 70,791,495 $ 4,702,739
MORROW 608,487 100,726 5 $ 239,852 $ 18,137
MULTNOMAH 306,263,233 106,999,098 2,879 $ 209,078,688 $ 11,082,480
POLK 100,612,849 25,217,467 982 $ 41,347,642 $ 3,524,268
SHERMAN 1,052,371 138,056 7 $ 266,293 $ 31,659
TILLAMOOK 8,113,657 1,372,518 61 $ 2,887,256 $ 286,661
UMATILLA 20,457,509 8,529,694 256 $ 15,594,216 $ 671,154
UNION 3,268,678 887,238 41 $ 1,263,345 $ 207,289
WALLOWA 1,998,555 228,975 10 $ 657,800 $ 62,082
WASCO 11,780,385 2,034,509 79 $ 3,848,068 $ 314,141
WASHINGTON 230,684,242 51,361,104 1,556 $ 97,868,026 $ 6,696,630
WHEELER 403,170 35,617 2 $ 78,203 $ 13,557
YAMHILL 327,480,199 107,897,916 3,578 $ 158,158,313 $ 11,433,500
*includes wholesale & retail revenues from all wine of all types/sources
Economic Impact of Oregon State Wine
Full Glass Research - 64 -
Sources Oregon Wine Board (including winery & vineyard survey jointly administered by OWB
and Full Glass Research)
SOURCE (Southern Oregon University Research Center vineyard & winery census)
Oregon Agricultural Statistics Service
California Agricultural Statistics Service
Washington Agricultural Statistics Service
National Agricultural Statistics Service
Oregon State Department of Agriculture
Oregon Department of Revenue
Oregon Employment Department
Oregon Liquor Control Commission
Oregon Tourism Commission
Gomberg-Fredrikson
AC Nielsen
Wine Opinions
Wine Market Council
U.S. Alcohol and Tobacco Tax and Trade Bureau
U.S. Census
Dean Runyan Associates, TravelOregon
The Tax Foundation
The Wine Institute
Economic Forensics and Analytics
Numerous confidential interviews with industry personnel by Full Glass Research
Special acknowledgements for help with this report are due Professor Robert Eyler, Liesa
Morrow-Bratcher, Zachary Reutlinger, David Stevens, Professor Greg Jones, Rikki
Pritzlaff, Eugenia Keegan, Hugh Tietjen, Lynne Skinner, Kevin Chambers, Allen
Holstein, Matt Novak, Evan Bellingar, Dan Ewer, Pat O’Connell, Chris Sarles, Steve
Thomson, Ken Johnston, Gretchen Boock, Jesse Lyon, Steve Thomson, Phil Durrett,
Laurent Montalieu, David Millman, Peggy Gsell, Linea Gagliano, Scott Warren and of
the staff of the Oregon Wine Board.
Economic Impact of Oregon State Wine
Full Glass Research - 65 -
About Full Glass Research
Full Glass Research, founded by Christian Miller in January 2005, is dedicated to
consumer, market and economic research in the wine and food industries. In addition to
consulting and research for private and government clients, Full Glass Research also
designs experiments and surveys and analyzes data for the Wine Opinions national trade
and consumer panels. Christian Miller has worked in wine and food industries since
1983. He earned his undergraduate degree in Economics from Franklin & Marshall
College in 1980 and an M.B.A. from Cornell University in 1985, followed by successive
research and management positions at Kendall-Jackson and Sebastiani Vineyards. His
experience includes work with both small and large companies, as a negociant, brand
manager, in operations analysis and market research. Before starting Full Glass Research,
he was Director of Research at MKF, a leading CPA/Consultant firm in the wine
industry. He is a founding member of the Wine Market Council’s Research Committee,
and co-manager of the OIV Wine Marketing Program at the University of California,
Davis.
Full Glass Research can be reached at www.fullglassresearch.com or 510-847-5160.
About the Oregon Wine Board and Oregon Winegrowers Association
The Oregon Wine Board is a semi-independent state agency that replaced the Oregon
Wine Advisory Board when Governor Ted Kulongoski signed the House Bill 3442 into
law on September 23, 2003. The Board is charged with supporting enological,
viticultural, and economic research and the promotion of grape growing and winemaking
in Oregon. The intent of the legislation is to give the state’s wine industry greater
autonomy, authority, and ability to develop, market, and promote Oregon wine.
The Oregon Winegrowers Association is the non-profit membership association for
Oregon wineries and vineyards. OWA conducts legal and lobbying advocacy work on
behalf of the industry to ensure a positive business, social and economic environment for
the production and sale of Oregon wines. OWA represents the industry before state and
federal government agencies and legislative bodies and related industry associations on
such issues as direct shipment, land-use, and taxation. Funds to support OWA come from
voluntary membership fees.
The Oregon Wine Board and Oregon Winegrowers Association can be reached at
www.oregonwine.org or (503) 228-8336.
Top Related