


Languages
Pages
Legal

THE JOURNAL OF FINANCE • VOL. LXV, NO. 6 • DECEMBER 2010
Who Blows the Whistle on Corporate Fraud?
ALEXANDER DYCK, ADAIR MORSE, and LUIGI ZINGALES∗
ABSTRACT
To identify the most effective mechanisms for detecting corporate fraud, we study allreported fraud cases in large U.S. companies between 1996 and 2004. We find thatfraud detection does not rely on standard corporate governance actors (investors, SEC,and auditors), but rather takes a village, including several nontraditional players(employees, media, and industry regulators). Differences in access to information,as well as monetary and reputational incentives, help to explain this pattern. In-depth analyses suggest that reputational incentives in general are weak, except forjournalists in large cases. By contrast, monetary incentives help explain employeewhistleblowing.
THE LARGE AND NUMEROUS corporate frauds that emerged in the United Statesat the onset of the new millennium provoked an immediate legislative responsein the Sarbanes-Oxley Act (SOX). This law was predicated upon the idea thatthe existing institutions designed to uncover fraud had failed, and that theirincentives as well as their monitoring should be increased. The political imper-ative to act quickly prevented any empirical analysis to substantiate the law’spremises. Which actors bring corporate fraud to light? What motivates them?Did reforms target the right actors and change the situation? Can detection beimproved in a more cost-effective way?
To answer these questions, we gather data on a comprehensive sample ofalleged corporate frauds that took place in U.S. companies with more than750 million dollars in assets between 1996 and 2004. After screening forfrivolous suits, we end up with a sample of 216 cases of alleged corporatefrauds, which include all of the high-profile cases such as Enron, HealthSouth,and WorldCom.
∗Dyck is at the University of Toronto; Morse is at the University of Chicago and NBER; andZingales is at the University of Chicago, NBER, and CEPR. Alexander Dyck thanks the ConnaughtFund of the University of Toronto and Luigi Zingales the Center for Research on Security Prices,the Stigler Center, and the Initiative on Global Financial Markets at the University of Chicago forfinancial support. We would like to thank Alexander Phung, Denrick Bayot, and Victor Xin for trulyoutstanding research assistantship. We thank John Donohue, Jay Hartzell, Jonathan Karpoff,Andrew Metrick, Shiva Rajgopal, Adriano Rampini, two anonymous referees, Editor, CampbellHarvey, and seminar participants at Harvard Business School, Harvard Law School, MichiganLaw School, the University of Pennsylvania, the Duke-UNC Corporate Finance Conference, theNBER Summer Institute, the University of Texas Conference on Empirical Legal Studies, and theAmerican Finance Association Meetings (2007) for helpful comments. We thank Nittai Bergmanfor sharing his data on employees’ stock options.
2213
2214 The Journal of Finance R©
Through an extensive reading of each fraud’s history, we identify who isinvolved in the revelation of the fraud. To understand better why these frauddetectors are active, we study the sources of information detectors use andthe incentives they face in bringing the fraud to light. To identify the roleplayed by short sellers, we look for unusual levels of short positions before afraud emerges. These data allow us to test the dominant views. While, thelegal view claims fraud detection belongs to auditors and securities regulators,the private litigation view (Coffee (1986)) attributes it to law firms. Finally,the finance view (Fama (1990)) predicts that monitoring will be done by thosewith residual claims (equity and debt holders) and their agents (analysts andauditors).
We find no support for the legal view, since the SEC accounts for only 7% of thecases and auditors for 10%, nor for the private litigation view, which accountsfor only 3% of the cases. We also find very weak support for the finance view.Debt holders are absent, and equity holders play only a trivial role, detectingjust 3% of the cases. Equity holders’ agents (auditors and analysts) collectivelyaccount for 24% of the cases revealed. Even using the most comprehensiveand generous interpretation of this view, which might include short sellers, thefinance view accounts for only 38% of the cases.
More surprising, we find that actors, who do not own any residual claimin the firms involved and are often not considered important players in thecorporate governance arena, play a key role in fraud detection: employees (17%of the cases), non-financial-market regulators (13%), and the media (13%).These results remain true if we value-weight the cases by the sum of finesand settlements associated with the impropriety. Value-weighting creates onlyone change in the distribution: the media become much more important (24%),suggesting they mainly get involved in the biggest cases. These players do notappear in traditional discussions of corporate governance, but the data suggestthey should.
What accounts for the differences between the traditional views and ourfindings? In the traditional views, two dimensions are missing. First, the tra-ditional discussions focus on incentives arising from residual claims but ignoredifferences in the costs of identifying and gathering fraud-relevant information.Employees, industry regulators, and analysts gather a lot of relevant informa-tion as a byproduct of their normal work—as suggested by Hayek (1945)—andare in a much better position to identify fraud than short sellers, security reg-ulators, or lawyers, for whom detecting fraud is like looking for a needle in ahaystack. Thus, while an employee might gain much less than a short sellerfrom revealing a fraud, he also faces a much lower cost (in fact, often no cost)in discovering it.
Second, there are incentives to uncover fraud that do not arise from a resid-ual claim or a legal obligation. One such incentive is reputation. A journalistwho uncovers a fraud receives national attention, which increases his careeropportunities. A similar incentive is a monetary reward directly linked to thesize of the fraud uncovered. Thanks to the Federal Civil False Claims Act(also known as the qui tam statute), when a fraud is committed against the
Who Blows the Whistle on Corporate Fraud? 2215
government (e.g., Medicare fraud), individuals who bring relevant informationforward are entitled to between 15% and 30% of the money recovered by thegovernment.
We find that all these aspects matter. When we distinguish actors on the ba-sis of their information sources (inside information, regulatory discovery, andpublic information), we find that access to information is important. Havingaccess to inside information rather than relying solely on public informationincreases an actor’s probability of detecting fraud by 15 percentage points.However, this effect becomes statistically indistinguishable from zero when wevalue-weight the cases. This evidence suggests that the cost of gathering infor-mation is an important barrier only in smaller cases and becomes irrelevantwhen the stakes are higher.
Reputational incentives also appear to be important, especially if we weightthe cases by the magnitude of their settlement. This is reasonable, since a jour-nalist or an analyst will not become famous by uncovering a minor accountingirregularity in a small unknown company.
Monetary incentives for fraud revelation appear to play a role regardless ofthe severity of the fraud. In particular, we find that in health care (an industrywhere suits are more likely to provide a financial reward for whistleblowersbecause government’s procurements account for a significant percentage ofrevenues) 41% of frauds are brought to light by employees. This contrasts withonly 14% of cases being detected by employees in all other industries. Thisdifference is statistically significant at the 1% level, and the effect is robust tocontrols for differences in industry characteristics. Hence, a strong monetaryincentive to blow the whistle does motivate people with information to comeforward.
To shed some light on these incentives not coming from residual claims, weundertake an in-depth analysis of the cost-benefit trade-offs faced by actualwhistleblowers. Any analysis of these whistleblowers’ incentives will overstatethe benefits and/or understate the costs, since these are people who, afterassessing their respective costs and benefits, chose to come forward. In spite ofthis bias, we find a clear cost for auditors that blow the whistle. The auditor ofa company involved with fraud is more likely to lose the client if it blows thewhistle than if it does not, while there is no significance evidence that bringingthe fraud to light pays off in terms of a greater number of accounts.
Career incentives work a bit better for analysts. While analysts who blow thewhistle are no more likely to be promoted than similar analysts following thesame company who do not blow the whistle, we find that they are less likely tobe demoted. The picture is even more encouraging for journalists. Journalistswho break a story about a company’s fraud are more likely to find a better jobthan a comparable journalist writing for the same newspaper/magazine at thesame time.
The story for employee whistleblowers is more mixed. On the one hand,on occasion, employees can gain from whistleblowing. When employees canbring a qui tam suit that the company has defrauded the government, whistle-blowers stand to win big time: on average our sample of successful qui tam
2216 The Journal of Finance R©
whistleblowers collect $46.7 million. For many employee whistleblowers themore important benefit is avoiding the potential legal liability that arises frombeing involved in a fraud. On the other hand, employee whistleblowers facesignificant costs. In 45% of the cases, the employee blowing the whistle doesnot identify him or herself individually to avoid the penalties associated withbringing bad news to light. In 82% of cases with named employees, the in-dividual alleges that they were fired, quit under duress, or had significantlyaltered responsibilities as a result of bringing the fraud to light. Many of theindividuals are quoted as saying, “If I had to do it over again, I wouldn’t.”
Overall, this web of monitors, so critical to fraud detection, seems to workwith relatively low monetary and reputational incentives. To gain insight onwhat regulatory or market-based initiative can improve these incentives, wesplit the sample period and exploit the changes in the regulatory environmentthat occurred after the Enron and WorldCom scandals. Consistent with the en-hanced responsibility attributed to accountants by the Statement on AuditingStandards (SAS) No. 99 (approved in October 2002), we find that the percent-age of frauds brought to light by auditors jumps from 6% to 24%. On a smallerscale, the SEC also becomes more active, moving from 5% to 10%. By contrast,we do not find any evidence that the protection offered to employees by Section303 of SOX has any effect.
Our work is related to a large literature in accounting and finance thatlooks at the characteristics of firms involved in fraud (e.g., Richardson, Tuna,and Wu (2002), Burns and Kedia (2006), Efendi, Srivastava, and Swan-son (2007)), the impact of fraudulent financial reporting on firm value (e.g.,Palmrose and Scholz (2004)), and the role of specific whistleblower types in-cluding the press (Miller (2006)) and employee whistleblowers (Bowen, Call,and Rajgopal (2007)). We differ in our focus on comparing the relative im-portance of different sources of detection. We also differ in the broadness ofour sample, as it includes both accounting-related and non-accounting-relatedfrauds.
Our work is also related to a significant literature in law and economics. Asin Choi (2007), Griffin, Grundfest, and Perino (2001), and Thompson and Sale(2003), we use federal securities class actions to construct the sample of frauds.The focus of these papers, however, is on the frequency and the cost imposed byfraud, not on the alternative mechanisms of detection. In this respect, our workis closer to Black (2001) and Coffee (2001), who discuss the best mechanisms toprotect investors from fraud and raise questions about whether specific actorsare reputation intermediaries or whether they simply attend to the concerns oftheir clients. Our paper provides data that shed light on these questions. Ourwork is also complementary to two recent papers by Karpoff, Lee, and Martin(2008a, 2008b). Whereas they focus on the costs borne by firms and managerswhen fraud is revealed, we analyze the mechanism that leads to the detectionof fraud and the cost and benefits of whistleblowing.
Finally, our work is related to the debate started by La Porta, Lopez-de-Silanes, and Shleifer (2006) on what works in securities regulation. They focuson the importance of private enforcement as opposed to public enforcement.
Who Blows the Whistle on Corporate Fraud? 2217
As our analysis illustrates, both private and public enforcement function inthe context of a broader web of actors. The involvement of these actors, theircomparative advantage in terms of access to information, and their incentivesneed to be considered when considering governance reforms in the UnitedStates and abroad.
The remainder of the paper proceeds as follows. Section I of the paper de-scribes the data and presents the distribution of fraud detectors. In Section II,we compare competing theories of fraud detection. Section III concludes.
I. Data and Distribution of Whistleblowers
A. Data: Sample of Frauds
Our sample of corporate frauds consists of U.S. firms against which a secu-rities class action lawsuit has been filed under the provisions of the Federal1933/1934 Exchange Acts for the period 1996 to 2004. We use the StanfordSecurities Class Action Clearinghouse (SSCAC) collection of all such suits. Be-cause class action law firms have automated the filing of class action suitsby reacting to any negative shock to share prices, it is highly unlikely that avalue-relevant fraud could emerge without a subsequent class action suit beingfiled (Coffee (1986), Choi, Nelson, and Pritchard (2008)).1
The biggest potential problem with using class action data is not that wemight miss important frauds, but that we include frivolous cases.2 To addressthis concern we apply six filters. First, we restrict our attention to alleged fraudsthat ended after the enactment of the Private Securities Litigation Reform Actof 1995 (PSLRA), which sought to reduce frivolous suits by making discoveryrights contingent on evidence (Johnson, Nelson, and Pritchard (2007)). Thisyields a sample of 2,171 suits provided by the SSCAC from 1996 to 2004.Second, we restrict our attention to large domestic firms, as these firms havesufficient assets and insurance to motivate law firms to initiate suits and do nothave the complications of cross-border jurisdictional concerns. Operationally,we restrict our attention to firms with at least $750 million in assets in the yearprior to the end of the class period (as firms may reduce dramatically in sizesurrounding the revelation of fraud). The domestic filter reduces our sample to501 cases.
Third, we exclude all cases in which the judicial review process leads to thecase’s dismissal.3 Fourth, for those class actions that settled, we only includethose cases where the settlement is at least $3 million, a payment level that
1 Furthermore, the suit will be filed in federal court rather than a state court because very fewstate cases (outside of change of control lawsuits) lead to financial settlement, especially withoutalso involving a federal class action suit (Thompson and Sale (2003)).
2 Our procedure did not lead us to include the backdating cases brought into focus by theacademic work of Lie (2005) and Heron and Lie (2007), as suits launched on this basis wereinitiated after construction of our sample.
3 We do retain cases voluntarily dismissed when the reason for dropping the suit is bankruptcy.These cases could still have had merit, but as a result of the bankruptcy status, plaintiff lawyersno longer have a strong incentive to pursue them.
2218 The Journal of Finance R©
previous studies suggest divides frivolous suits from meritorious ones.4 Fifth,we exclude from our analysis IPO underwriter allocation cases, mutual fundtiming and late trading cases, analyst cases involving false provision of fa-vorable coverage, and cases in which the SSCAC identifies agents other thanmanagement as initiating the fraud. The third through fifth screens removemore than half the number of cases from 501 to 230.
The final filter removes a handful of firms that settle for amounts of$3 million or greater, but that, upon our reading, seem likely to have set-tled to avoid the negative publicity. The rule we apply is to eliminate cases inwhich the firm’s poor ex post realization could not have been known to the firmat the time when the firm or its executives issued a positive outlook statementfor which they are later sued. This filter removes 14 cases, producing our finalsample of 216 cases.
In the rest of the paper, we refer to these 216 cases as frauds. Strictly speak-ing, these are only alleged frauds. Directors and officers’ insurance does notcover firm management if the courts find the firm guilty of securities fraud.Thus, all of the cases settle before reaching a court verdict, and settlementsalmost always involve no admission of wrongdoing. As a result, it is impos-sible for us to establish whether there was real fraud (which in legal termsimplies the intent to deceive), gross negligence, or perhaps even just mistakes.For the purpose of this paper, however, this difference is not critical. We areinterested in understanding the mechanisms that bring extreme bad executionof governance to light, not in establishing intent.
B. Data: Identifying the Detector of a Fraud
Our key variable is the identity of the actor who brings each fraud to light.To uncover the fraud detectors for each of our 216 cases, we search Factivafor news wires and articles over the period from 3 months prior to the classaction period (defined as the period over which the suit claims misbehavior)to the settlement date or the current date, if the case is still pending. Oursearches return approximately 800 articles per case. The point to readingso many articles for each case is to understand, as much as possible, thecircumstances of the alleged fraud and the detector who reveals the infor-mation. Table I provides definitions of the variables we collect from the casestudies.
In a number of cases, we find that the whistleblower is not the person la-beled by the media as such. A chain of events initiated by another party mayalready be forcing the scandal to light when an individual expedites the pro-cess by disclosing internal information. For instance, Enron’s whistleblower byour classification is the Texas edition of the Wall Street Journal, not SherronWatkins, who is labeled the Enron whistleblower. Of course, we do not wish toundercredit the importance of individuals who contribute details as the fraud
4 Grundfest (1995), Choi (2007), and Choi, Nelson, and Pritchard (2008) suggest a dollar valuefor settlement as an indicator of whether a suit is frivolous or has merit.
Who Blows the Whistle on Corporate Fraud? 2219
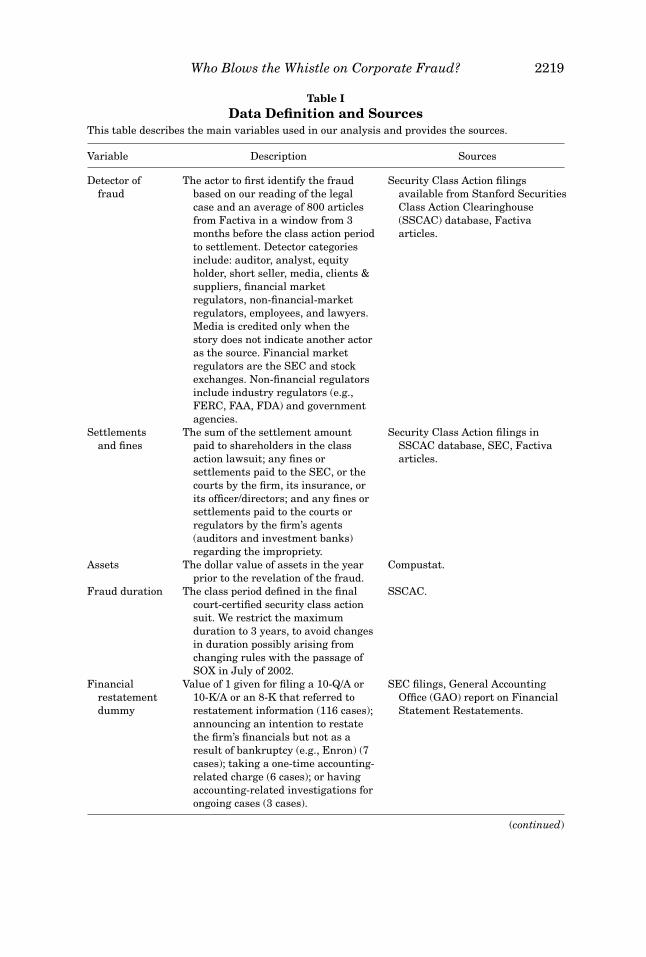
Table IData Definition and Sources
This table describes the main variables used in our analysis and provides the sources.
Variable Description Sources
Detector offraud
The actor to first identify the fraudbased on our reading of the legalcase and an average of 800 articlesfrom Factiva in a window from 3months before the class action periodto settlement. Detector categoriesinclude: auditor, analyst, equityholder, short seller, media, clients &suppliers, financial marketregulators, non-financial-marketregulators, employees, and lawyers.Media is credited only when thestory does not indicate another actoras the source. Financial marketregulators are the SEC and stockexchanges. Non-financial regulatorsinclude industry regulators (e.g.,FERC, FAA, FDA) and governmentagencies.
Security Class Action filingsavailable from Stanford SecuritiesClass Action Clearinghouse(SSCAC) database, Factivaarticles.
Settlementsand fines
The sum of the settlement amountpaid to shareholders in the classaction lawsuit; any fines orsettlements paid to the SEC, or thecourts by the firm, its insurance, orits officer/directors; and any fines orsettlements paid to the courts orregulators by the firm’s agents(auditors and investment banks)regarding the impropriety.
Security Class Action filings inSSCAC database, SEC, Factivaarticles.
Assets The dollar value of assets in the yearprior to the revelation of the fraud.
Compustat.
Fraud duration The class period defined in the finalcourt-certified security class actionsuit. We restrict the maximumduration to 3 years, to avoid changesin duration possibly arising fromchanging rules with the passage ofSOX in July of 2002.
SSCAC.
Financialrestatementdummy
Value of 1 given for filing a 10-Q/A or10-K/A or an 8-K that referred torestatement information (116 cases);announcing an intention to restatethe firm’s financials but not as aresult of bankruptcy (e.g., Enron) (7cases); taking a one-time accounting-related charge (6 cases); or havingaccounting-related investigations forongoing cases (3 cases).
SEC filings, General AccountingOffice (GAO) report on FinancialStatement Restatements.
(continued)
2220 The Journal of Finance R©
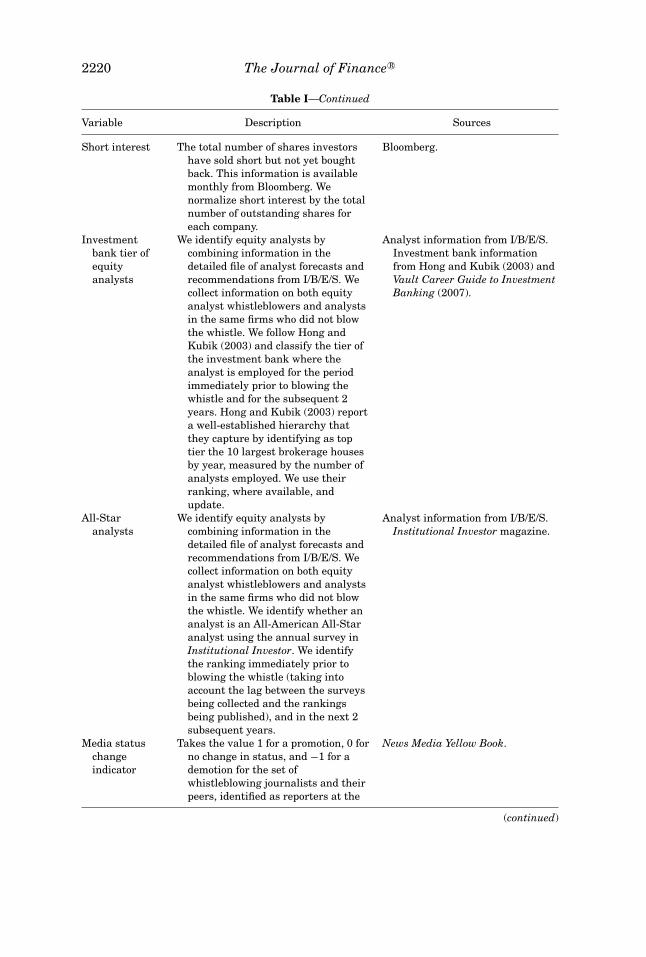
Table I—Continued
Variable Description Sources
Short interest The total number of shares investorshave sold short but not yet boughtback. This information is availablemonthly from Bloomberg. Wenormalize short interest by the totalnumber of outstanding shares foreach company.
Bloomberg.
Investmentbank tier ofequityanalysts
We identify equity analysts bycombining information in thedetailed file of analyst forecasts andrecommendations from I/B/E/S. Wecollect information on both equityanalyst whistleblowers and analystsin the same firms who did not blowthe whistle. We follow Hong andKubik (2003) and classify the tier ofthe investment bank where theanalyst is employed for the periodimmediately prior to blowing thewhistle and for the subsequent 2years. Hong and Kubik (2003) reporta well-established hierarchy thatthey capture by identifying as toptier the 10 largest brokerage housesby year, measured by the number ofanalysts employed. We use theirranking, where available, andupdate.
Analyst information from I/B/E/S.Investment bank informationfrom Hong and Kubik (2003) andVault Career Guide to InvestmentBanking (2007).
All-Staranalysts
We identify equity analysts bycombining information in thedetailed file of analyst forecasts andrecommendations from I/B/E/S. Wecollect information on both equityanalyst whistleblowers and analystsin the same firms who did not blowthe whistle. We identify whether ananalyst is an All-American All-Staranalyst using the annual survey inInstitutional Investor. We identifythe ranking immediately prior toblowing the whistle (taking intoaccount the lag between the surveysbeing collected and the rankingsbeing published), and in the next 2subsequent years.
Analyst information from I/B/E/S.Institutional Investor magazine.
Media statuschangeindicator
Takes the value 1 for a promotion, 0 forno change in status, and −1 for ademotion for the set ofwhistleblowing journalists and theirpeers, identified as reporters at the
News Media Yellow Book.
(continued)
Who Blows the Whistle on Corporate Fraud? 2221
Table I—Continued
Variable Description Sources
same news outlet with a similarstatus at the time. For example, anAccounting Reporter in the BusinessDay Desk is considered a peer to aWall Street Reporter in the BusinessDay Desk for the New York Times. Insome cases, the reporter has aunique position in the desk she/hebelongs in. A peer in this case issomeone who holds the same titlebut belongs in a different desk.Change in status is defined both 1and 3 years after publication of thearticle. The original classification ofjournalists with a similar status, andsubsequent changes, is based on anindependent classification by anestablished journalist.
Health caredummy
Includes drug, drug proprietaries, anddruggists’ sundries (SIC 5122),health care providers (8000-8099),and health care-related firms inBusiness Services.
Industries identified in Winston(1998) and others.
Regulated firms Includes health care (above) plusfinancials (SIC 6000-6999);transportation equipment (SIC3700-3799); transportation,communications, electric, gas, andsanitary services (SIC 4000-4999).
Industries identified in Winston(1998) and others.
Organizationdepth
Captures organizational depth byindustry.
Rajan and Wulf (2006).
emerges. However, our aim is to identify the initial force that causes a scandalto come to light.
To mitigate potential concerns about subjectivity in identifying the first ac-tor to bring each fraud to light, we implement a meticulous procedure. Theinitial coding of each case was done by a research assistant (a law student)and, independently, by at least one of the authors. Where judgment was re-quired, all three authors analyzed the case until a consensus was reached. Ayear after the initial coding we divided the cases into thirds and each of theauthors recoded cases without referencing the prior coding. Again, when thecoding was at all unclear, all three authors read the case to ensure consistencyin interpretation. In the process of verifying our coding, we went back to oursources and created a list of the news article(s) that were most informativein pointing to which player was the whistleblower (this list is available onour websites and in an internet Appendix on the Journal of Finance websiteat http://www.afajof.org/supplements.asp.) We sent this document to academic
2222 The Journal of Finance R©
colleagues who work in corporate governance and to the NBER corporate gov-ernance list soliciting comments regarding the details of particular cases.
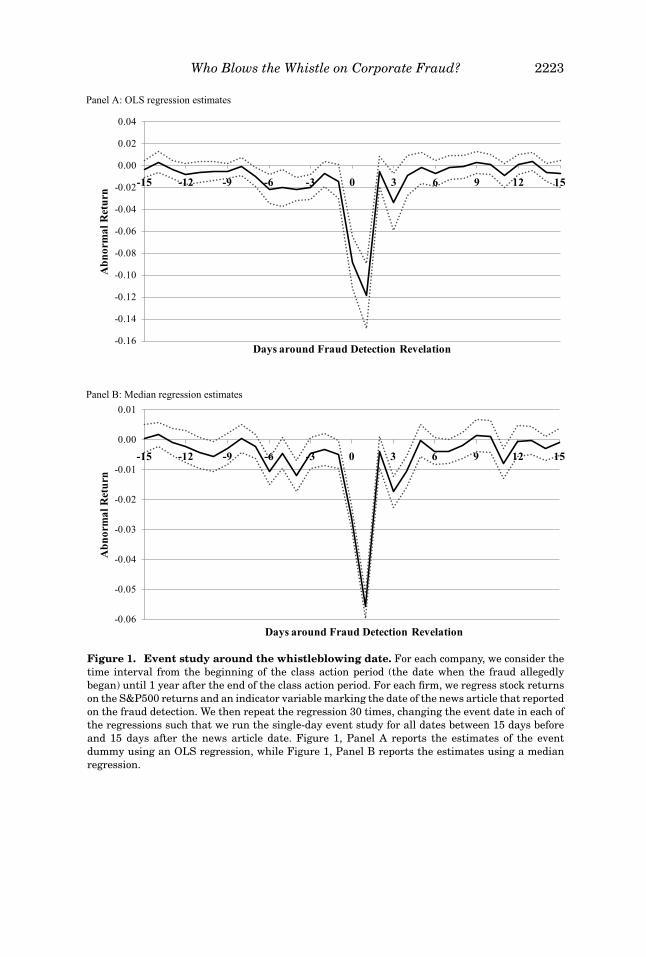
The document above includes a “smoking gun” indicator that identifies thosecases where we have the most confidence in the classification.5 Our results arerobust to using only the sample of smoking gun cases.6 As a further check, weverify our identification of a given whistleblower is plausible by conducting anevent study to see whether it corresponds to a major movement in the stockprice. For each company, we consider the time interval from the beginning ofthe class action period (the date when the fraud allegedly began) until 1 yearafter the end of the class action period. For each firm we regress stock returnson the S&P500 returns and an indicator variable marking the date of the newsarticle that we associate with a whistleblower bringing a fraud to light. Wethen repeat the regression 30 times, changing the event date in each of theregressions such that we run the single-day event study for all dates from thenews article date minus 15 days to the news article date plus 15 days. Theaverage of the estimated coefficients of these dummy variables is plotted inFigure 1A. Since it is possible that a few large stock price declines could bedriving our results, we rerun the event study using median regressions ratherthan OLS (Figure 1B). While there are few negative abnormal returns in datesbefore the whistleblowing event, on average there is a 20% negative return inthe 2 days around the time the whistle was blown, providing support for ourclassification and for the materiality of the cases.
Notwithstanding, our coding may still be problematic when the whistleblow-ers are short sellers. Short sellers have a strong incentive to identify and dis-seminate bad news (Diamond and Verrecchia (1987)), but no incentive to revealthemselves as the source. A fraud-revealing short seller might be cut off fromfuture information from firms and might face suits or investigations for spread-ing false information (e.g., Lamont (2003)). We investigate the possibility thatshort sellers hide their revealing of corporate fraud by testing whether eachfirm’s average short interest position (from Bloomberg) during the 3 monthsprior to the fraud revelation date is more than three standard deviations higherthan that during the year prior. If we find this to be the case, we reclassify thewhistleblower as a short seller. We choose the three-standard deviation rulebecause the volatility in the series is high for firms after accusations. In theInternet Appendix, we present the graphs of the short interest positions foreach of the cases that we reclassify. Our findings are similar using alternativeapproaches to identify hidden short sellers, as we show in a previous version
5 To illustrate the importance of this final step, consider cases in which we pinpoint the frauddetector to be the media. We only attribute the media as the identifier of the fraud if the news storydoes not give credit for the information to any specific source, named or unnamed (e.g., anonymousemployee). However, the media will only get a smoking gun designation if the article reveals thatthe media directly discovered the fraud.
6 Even with these procedures, we cannot be completely certain that the whistleblower we identifywas not secretly tipped by an employee. This biases us against finding a role for employees andmakes it more likely to find a role for actors emphasized in the legal and financial views of frauddetection.
Who Blows the Whistle on Corporate Fraud? 2223
Figure 1. Event study around the whistleblowing date. For each company, we consider thetime interval from the beginning of the class action period (the date when the fraud allegedlybegan) until 1 year after the end of the class action period. For each firm, we regress stock returnson the S&P500 returns and an indicator variable marking the date of the news article that reportedon the fraud detection. We then repeat the regression 30 times, changing the event date in each ofthe regressions such that we run the single-day event study for all dates between 15 days beforeand 15 days after the news article date. Figure 1, Panel A reports the estimates of the eventdummy using an OLS regression, while Figure 1, Panel B reports the estimates using a medianregression.
2224 The Journal of Finance R©
of the paper where we include additional control variables such as those thatcapture aggregate movements in short interest. Karpoff and Lou (2008) alsoinvestigate this issue in their sample of SEC enforcement actions.
Not all frauds are equally important. Some, like Enron, destroy companiesand billions of dollars of value, while others are less severe. To capture thesedifferences we weight each fraud, where the weight captures the severity offraud. We compute these weights by summing any class action lawsuit settle-ment; any fines or settlement paid by the firm, its insurance, or its officer anddirectors; and any fines or settlements paid to the courts or regulators by thefirm’s agents (auditors and investment banks).7
C. Selection Bias of Data—Frauds Not in the Public Domain
By focusing on discovered frauds, we introduce two selection biases: we donot observe frauds that are never caught and we do not observe frauds caughtso early that they never enter the public domain. In addition, we cannot sayanything about the importance of specific mechanisms in preventing fraud thatdoes not occur.
Monitoring by the board of directors might be very effective in deterringfraud and in stopping frauds early on. In our sample, we attribute 34% ofthe fraud detections to internal governance, but this is undoubtedly a vastunderestimate of how many frauds are prevented and corrected by internalcorporate governance.8 Since we cannot draw any specific conclusion about theeffectiveness of internal control systems, we exclude the internal governancerevelation cases from the majority of our analysis and refer the interestedreader to Bowen, Call, and Rajgopal (2007). What our data do allow us to askis: which are the most effective external mechanisms that help detect corporatefraud when there is a failure of internal mechanisms. This is an importantaspect of governance that has received little attention.
D. Distribution of Whistleblowers
Table II presents the distribution of whistleblowers. Column 1 reports theraw data while column 2 reports the distribution after adjusting for hiddenshort seller activity. We focus on the latter distribution since it is more cred-ible. The distribution reveals a clear picture of fraud detection: no single de-tector type dominates. The United States apparently relies upon a village ofwhistleblowers. Six players account for at least 10% of detections, while none
7 These estimates do not include the market value losses due to reputational effects. As Karpoff,Lee, and Martin (2008a, 2008b) show, these losses can be substantive. Nevertheless, to the extentthat they are proportional to the settlement and fines, they should not affect our conclusions.
8 The vast majority of the internal governance cases are associated with either a managerialturnover or an economic or financial crisis that requires some major restructuring. These casesdo not appear to be precipitated by an imminent whistleblower. There are, however, some caseswhere the firm’s decision to come clean could have been triggered or even forced by the threat of animminent revelation by a whistleblower. Our extensive reading of the cases allows us to identifythese instances and where we credit the fraud detection to the whistleblower.
Who Blows the Whistle on Corporate Fraud? 2225
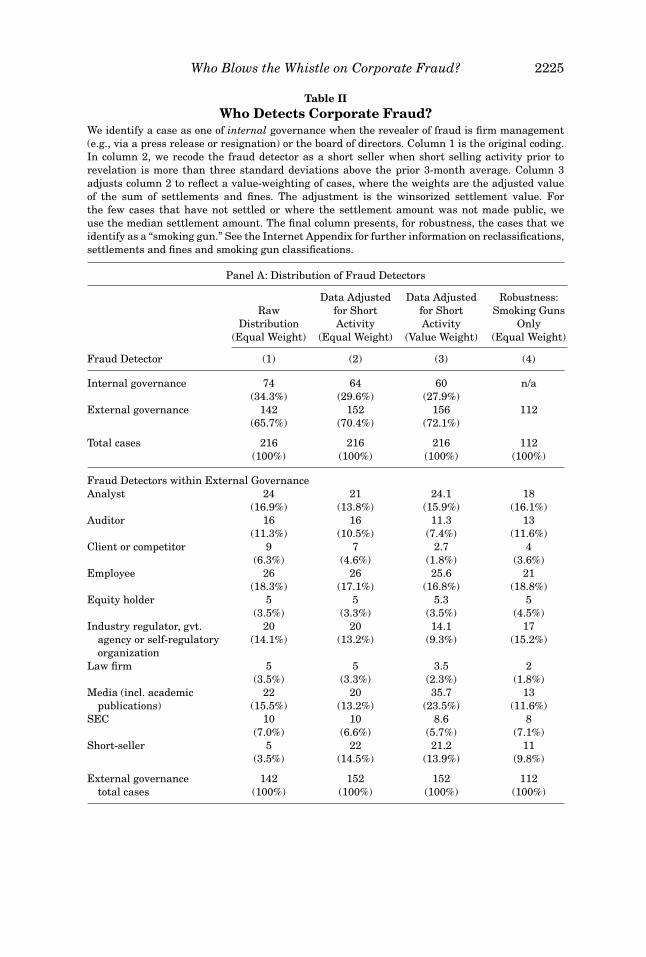
Table IIWho Detects Corporate Fraud?
We identify a case as one of internal governance when the revealer of fraud is firm management(e.g., via a press release or resignation) or the board of directors. Column 1 is the original coding.In column 2, we recode the fraud detector as a short seller when short selling activity prior torevelation is more than three standard deviations above the prior 3-month average. Column 3adjusts column 2 to reflect a value-weighting of cases, where the weights are the adjusted valueof the sum of settlements and fines. The adjustment is the winsorized settlement value. Forthe few cases that have not settled or where the settlement amount was not made public, weuse the median settlement amount. The final column presents, for robustness, the cases that weidentify as a “smoking gun.” See the Internet Appendix for further information on reclassifications,settlements and fines and smoking gun classifications.
Panel A: Distribution of Fraud Detectors
Data Adjusted Data Adjusted Robustness:Raw for Short for Short Smoking Guns
Distribution Activity Activity Only(Equal Weight) (Equal Weight) (Value Weight) (Equal Weight)
Fraud Detector (1) (2) (3) (4)
Internal governance 74 64 60 n/a(34.3%) (29.6%) (27.9%)
External governance 142 152 156 112(65.7%) (70.4%) (72.1%)
Total cases 216 216 216 112(100%) (100%) (100%) (100%)
Fraud Detectors within External GovernanceAnalyst 24 21 24.1 18
(16.9%) (13.8%) (15.9%) (16.1%)Auditor 16 16 11.3 13
(11.3%) (10.5%) (7.4%) (11.6%)Client or competitor 9 7 2.7 4
(6.3%) (4.6%) (1.8%) (3.6%)Employee 26 26 25.6 21
(18.3%) (17.1%) (16.8%) (18.8%)Equity holder 5 5 5.3 5
(3.5%) (3.3%) (3.5%) (4.5%)Industry regulator, gvt. 20 20 14.1 17
agency or self-regulatory (14.1%) (13.2%) (9.3%) (15.2%)organization
Law firm 5 5 3.5 2(3.5%) (3.3%) (2.3%) (1.8%)
Media (incl. academic 22 20 35.7 13publications) (15.5%) (13.2%) (23.5%) (11.6%)
SEC 10 10 8.6 8(7.0%) (6.6%) (5.7%) (7.1%)
Short-seller 5 22 21.2 11(3.5%) (14.5%) (13.9%) (9.8%)
External governance 142 152 152 112total cases (100%) (100%) (100%) (100%)
2226 The Journal of Finance R©
is responsible for more than 17%. Together, these six players account for 82%of all cases.
What is more surprising are some of the key players: employees (the mostimportant external governance group with 17% of the cases), media (13%),and industry regulators (13%). These players do not appear in the traditionaldiscussions of corporate governance, but the data suggest that they should.By contrast, auditors account for only 10.5% of detections and short sellers,who should have the strongest incentive to see fraud come to light, account for14.5%, even under the more generous attribution mechanism.
A third fact emerging from Table II is the relative unimportance of manymechanisms emphasized in the literature. Completely missing are investmentbanks, commercial banks, and stock exchanges. The absence of banks or in-vestment banks in fraud detection is consistent with Coffee’s (2001) hypothesisthat these actors have “neither the obligation nor the right to make disclosurewhen any reasonable doubt exists concerning the client’s obligation of disclo-sure.” (Coffee (2003, p. 1295)). This result does not preclude the possibility thatthese actors played a more indirect role, for example, not accepting jobs fromcompanies whenever a concern of fraud emerged. The SEC, plaintiff lawyers,and equity holders do a little better than the banks, but together only accountfor 13% of all cases.
In column 3, we investigate whether the results are an artifact of treat-ing all frauds equally by introducing a value-weighted distribution, wherevalue is the value of settlements and fines related to the fraud. The medianfraud punishment is $34 million, with a mean of $198 million. This differenceis due to a couple of outlying cases (e.g., Enron ($7.4 billion) and Cendant($9.7 billion)) whose damages completely swamp the distribution. For this rea-son, we winsorize the settlements and fines at the upper 10th percentile and usethe winsorized punishments as the fraud size weights.9 Column 3 shows thatvalue-weighting does not change our results much. If anything, it makes thetraditional monitors look even less important, with the auditors dropping from10% to 7% and the SEC from 7% to 6%. The only category of whistleblowersthat dramatically increases in importance when we value-weight is the media,which account for almost one-quarter of the detections. This asymmetry likelyreflects the particular incentives journalists face: the importance of a scoop isdirectly related to both the size of the company involved and the magnitude ofthe fraud. We return to this point in Section II.C.3.
Differences in our ability to identify the fraud detector also do not change thedistribution. In column 4, we restrict our attention to those cases that we havethe most confidence in, that is, cases that we classify as having a smoking gun(112 of the 152 cases of external whistleblowing). The distribution is almostidentical to that in column 2, relieving the concern that our results are drivenby subjective calls.
9 The punishment amounts by whistleblower type are provided in the Internet Appendix.
Who Blows the Whistle on Corporate Fraud? 2227
II. Making Sense of the Distribution: Theory and Results
While these descriptive statistics are interesting, they cannot be evaluatedoutside of a theoretical framework, which we provide below.
A. Theory: Who Should Blow the Whistle?
Which external control mechanisms should intervene when the board, man-agement, and internal control systems fail to identify and resolve governanceshortfalls? The legal and economic literatures offer three main views.
(i) Legal view: Corporate fraud should be revealed by those mandated to doso, namely, auditors and securities regulatorsThe legal view of the firm emphasizes the roles of external auditors andthe SEC. The Securities Act of 1933 requires all firms subject to the Act tohave an annual audit of financial statements, and the Securities ExchangeAct of 1934 underscores the roles of the audit committee and independentauditors in their financial monitoring role. The second pillar of the legalview is the SEC. According to its web page, the SEC’s primary goals are“promoting the disclosure of important market-related information, main-taining fair dealing, and protecting against fraud.”
(ii) Private litigation view: Corporate fraud should be exposed by private liti-gation lawyersCoffee (1986) states that contingent fee payments in security class actioncases create large incentives for lawyers to bring cases against companiescommitting value-relevant fraud. This view has been recently supportedby La Porta et al. (2006), who show in an international comparison thatprivate enforcement (which they identify with security class action suits)is more effective than public enforcement in dealing with security lawviolations.
(iii) Financial risk view: Fraud should be revealed by parties with the mostpayoff at risk, namely, investors and their delegatesAccording to Fama (1990), building on the previous work of Fama andJensen (1983a, 1983b), it is efficient to insulate most firm stakeholdersfrom risk by providing them with a fixed payoff. As a result, the incentivesto monitor and the role for monitoring are left to equity holders, debt hold-ers, and their delegates (auditors, analysts, rating agencies, and bankers).According to this view, no role for monitoring is expected from stakeholderswith fixed-payoff contracts, such as employees, suppliers, and customers.If employees have significant stock option stakes (Bergman and Jenter(2007)), however, their incentives may be aligned with those of equityholders and thus they might have incentives to monitor.
While these three theories dominate the current corporate governance dis-cussion, we think that they lack several factors important to explaining thedetection of fraud. First, there are monetary incentives to reveal fraud that donot arise from stock ownership. The most obvious actors fitting this depiction
2228 The Journal of Finance R©
are short sellers, whose positions benefit from the arrival of negative news. Amore subtle but equally important case is employees in industries dealing withthe government. Thanks to the Federal Civil False Claims Act (also knownas the qui tam statute), when the fraud involves a false claim against thegovernment, individuals who bring forward relevant information are entitledto between 15% and 30% of the money recovered by the government. This isparticularly relevant in the health care and defense industries, where a largeportion of revenues are derived from governmental billings.10
A second important factor is career concerns. Several potential fraud detec-tors may derive reputational benefits from blowing the whistle, mostly in theform of better career opportunities. Journalists, analysts, auditors, regulators,and law firms are in this category. However, only for law firms is the careerbenefit of blowing the whistle unequivocal. For all the others, besides the po-tential career benefits, there might be some costs too. For example, a journalistcan be denied access to information if he develops a reputation for exposingcorporate scandals.
A third missing factor is the cost of accessing information, for clearly thereare differences in the cost that different actors bear to access information aboutfraud. As Hayek (1945) says, information is diffuse. As a result, certain actors(employees, industry regulators, and analysts) gather a lot of relevant informa-tion as a byproduct of their normal work. An industry regulator, for example,may uncover securities fraud while using its regulatory discovery privilegeunrelated to financial matters (e.g., Schein Pharmaceutical), or an employeemight be confronted with management misbehavior while trying to maintainoperational safety standards (e.g., Northeast Utilities). By contrast, an analystor a short seller has to delve through details of financial reports and industrytrends to uncover misrepresentations (e.g., CVS and CHS Electronics).
B. Results of Testing Competing Theories of Whistleblowing
Which of these views best explains fraud detection? A concern in testingthe theories is the question of how we can credit one theory or another withthe motivation for whistleblowing. Our identification of the effectiveness of thecompeting motivations comes from our ability to bundle predicted whistleblow-ers together and then see which bundles have explanatory power in explainingthe distribution.
In Table III, the dependent variable is a categorical variable identifying thefraud detector for each of the 152 cases. Each case has 10 observations, one foreach potential type of whistle blower, and the dependent variable identifies theactor responsible for the case in question. We use a conditional logit estimationto control for the unobserved difficulty in discovering and revealing each casevia a fraud-case fixed effect. The independent variables are indicators bundlingpotential whistleblowers together as predicted by theory. In particular, Legal
10 Another possibility is to pursue a suit under the tax laws, but this provision only came intoeffect in December 2006 and was not in effect during our sample period.
Who Blows the Whistle on Corporate Fraud? 2229
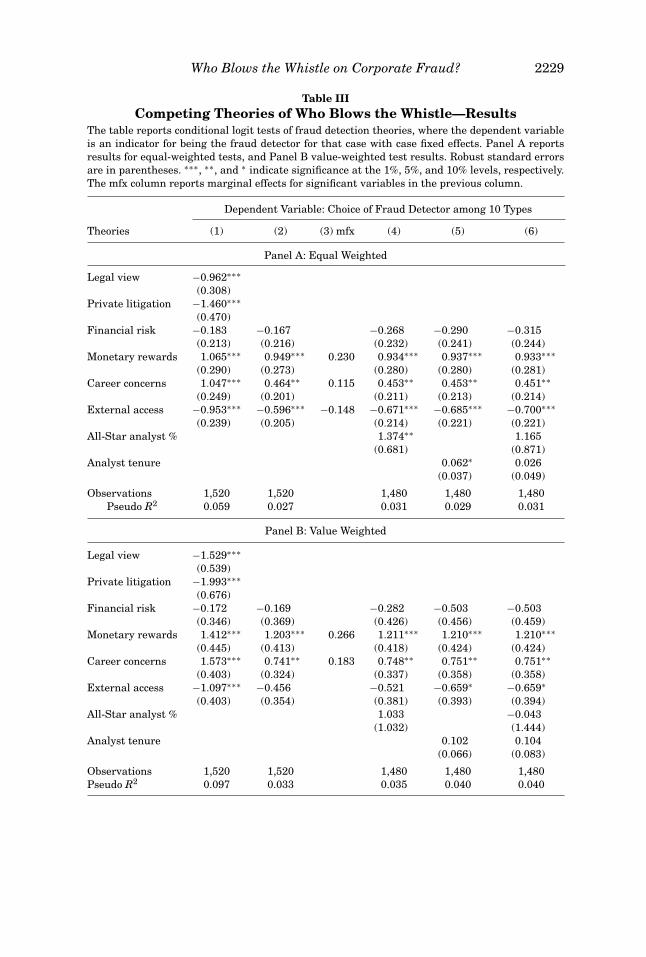
Table IIICompeting Theories of Who Blows the Whistle—Results
The table reports conditional logit tests of fraud detection theories, where the dependent variableis an indicator for being the fraud detector for that case with case fixed effects. Panel A reportsresults for equal-weighted tests, and Panel B value-weighted test results. Robust standard errorsare in parentheses. ∗∗∗, ∗∗, and ∗ indicate significance at the 1%, 5%, and 10% levels, respectively.The mfx column reports marginal effects for significant variables in the previous column.
Dependent Variable: Choice of Fraud Detector among 10 Types
Theories (1) (2) (3) mfx (4) (5) (6)
Panel A: Equal Weighted
Legal view −0.962∗∗∗(0.308)
Private litigation −1.460∗∗∗(0.470)
Financial risk −0.183 −0.167 −0.268 −0.290 −0.315(0.213) (0.216) (0.232) (0.241) (0.244)
Monetary rewards 1.065∗∗∗ 0.949∗∗∗ 0.230 0.934∗∗∗ 0.937∗∗∗ 0.933∗∗∗(0.290) (0.273) (0.280) (0.280) (0.281)
Career concerns 1.047∗∗∗ 0.464∗∗ 0.115 0.453∗∗ 0.453∗∗ 0.451∗∗(0.249) (0.201) (0.211) (0.213) (0.214)
External access −0.953∗∗∗ −0.596∗∗∗ −0.148 −0.671∗∗∗ −0.685∗∗∗ −0.700∗∗∗(0.239) (0.205) (0.214) (0.221) (0.221)
All-Star analyst % 1.374∗∗ 1.165(0.681) (0.871)
Analyst tenure 0.062∗ 0.026(0.037) (0.049)
Observations 1,520 1,520 1,480 1,480 1,480Pseudo R2 0.059 0.027 0.031 0.029 0.031
Panel B: Value Weighted
Legal view −1.529∗∗∗(0.539)
Private litigation −1.993∗∗∗(0.676)
Financial risk −0.172 −0.169 −0.282 −0.503 −0.503(0.346) (0.369) (0.426) (0.456) (0.459)
Monetary rewards 1.412∗∗∗ 1.203∗∗∗ 0.266 1.211∗∗∗ 1.210∗∗∗ 1.210∗∗∗(0.445) (0.413) (0.418) (0.424) (0.424)
Career concerns 1.573∗∗∗ 0.741∗∗ 0.183 0.748∗∗ 0.751∗∗ 0.751∗∗(0.403) (0.324) (0.337) (0.358) (0.358)
External access −1.097∗∗∗ −0.456 −0.521 −0.659∗ −0.659∗(0.403) (0.354) (0.381) (0.393) (0.394)
All-Star analyst % 1.033 −0.043(1.032) (1.444)
Analyst tenure 0.102 0.104(0.066) (0.083)
Observations 1,520 1,520 1,480 1,480 1,480Pseudo R2 0.097 0.033 0.035 0.040 0.040
2230 The Journal of Finance R©
view variable equals unity if the potential whistleblower left-hand-side vari-able is either an auditor or the SEC; Private litigation equals unity for lawfirms; Financial risk equals unity for analysts, auditors, and equity holders;Monetary rewards equals unity for short sellers or employees in the health careindustry; and Career concerns equals unity for analysts, auditors, industry reg-ulators, law firms, media, and the SEC. To create a “cost of access” variable,we went back to all the cases and identified the source of the whistleblower’sinformation—private information inside the firm, regulatory privilege informa-tion, or public information. For only two categories, auditors and employees,does the majority of information come from private internal access. For thisreason, we set the cost of access for these two categories to zero, and that of allothers to one.
Table III presents the conditional logit estimates for the equal-weighted(Panel A) and value-weighted (Panel B) distributions. The results in column 1provide little support for the legal and private litigation views, as the associateddummies are not positive as predicted but rather negative (and significant).This is not very surprising since in Table II we saw that auditors catch a mere10.5% of the cases, while litigation lawyers catch 3%.
One explanation for the relative paucity of auditor detections is that auditorsdo not see this as their responsibility. As the CEO of one of the four largeaccounting firms stated in an interview, “investors seem to expect that anaudit is an assurance of a company’s financial health. In fact, an audit isan attestation of the accuracy of a company’s financial statements, based oninformation that the company itself provides” (Taub, 2005). Concern over thisgap between perception and reality induced the Auditing Standards Board toissue two rulings (SAS 53 in 1988; SAS 82 in 1997) to address shortcomingsin the role of auditors in the detection of misstatements (Jakubowski et al.(2002)).
Turning to the weak performance of plaintiffs’ lawyers, the fact that theyonly reveal 3% of the cases does not mean that private litigation is uselessin preventing fraud. First, it can play an important role in punishing thosewho have committed fraud. Second, it can help publicize and make crediblethe claims made by other whistleblowers. At the very minimum, however, ourfinding suggests that private litigation alone is not sufficient to stop fraud. Itcan only work when a web of other mechanisms help bring fraud to light.
Similarly, in column 1, we find no significant effects for the financial riskvariable for either the equally weighted or the value-weighted distributions.11
By contrast, we find strong support for the importance of the other threefactors. As expected, detectors with monetary or career incentives are morelikely to blow the whistle, as are detectors with better access to information. Toconservatively assess the economic magnitude of these effects, in column 2 we
11 This result is robust to excluding the legal and private litigation variables, as we do in column2 of Panels A and B. To account for the possibility that employees might be motivated to blow thewhistle by their stock ownership, we also include in the finance view the employees in companieswhere the average stock option holding per employee is above $6,699 (75th percentile). The resultsdo not change.
Who Blows the Whistle on Corporate Fraud? 2231
drop the legal and private litigation dummies, which had significant coefficientsin the wrong direction, and focus on the marginal effects, reported in column3. A potential detector with a monetary incentive is 23 percentage points morelikely to blow the whistle. Similarly, career incentives increase the probabilityof blowing the whistle by 11.5 percentage points. Potential whistleblowers whodo not have direct access to information are 15 percentage points less likely toblow the whistle. These effects are robust to value-weighting the observations,except the effect of access cost (Panel B).
However, not all analysts have the same incentives and access to information.An All-Star analyst could have better access to information than other analystswhile a new analyst has more to gain (and less to lose) than an All-Star ana-lyst.12 To explore this hypothesis, in column 4, we insert a variable equal to thepercentage of analysts following a firm who belong to the Institutional InvestorAll American Analyst ranking (All-Star). The variable has a positive effect,suggesting that an analyst is more likely to blow the whistle when the percent-age of All-Star analysts is higher, but this effect is not statistically significant.The same can be said for the average tenure of the analysts (column 5). If weinsert both variables in the regression at the same time (column 6), the resultsdo not change.
This multinomial analysis confirms the descriptive results. The traditionalviews of fraud detection appear to be unable to explain the results. To under-stand who blows the whistle we need to look at the incentives, both monetaryand reputational, for doing so, as well as at the cost of gathering the informa-tion. These costs seem to represent an important barrier to uncovering ordinaryfraud, but not very large cases.13
C. Incentive Payoffs within Whistleblower Type—Results
Our distributional tests find that reputational and monetary benefits areboth associated with the detection of fraud, but that reputational benefits onlymatter for big-impact cases. In this section, we build on these results andvalidate them by verifying the existence of these benefits. An advantage ofour data set is that we can delve into the details of cases and into the careersof individuals revealing fraud. Of the six main classes of fraud detectors, wewere able to trace the career effects for auditors, analysts, journalists, andemployees. We could not do the same, however, for short sellers, since we do notknow their identities, or for industry regulators, for whom it proved impossibleto trace their careers.
Before undertaking this analysis a word of caution is in order. Since we do notobserve the “dog that did not bark,” we only have data for those whistleblowerswho chose to speak up. Assuming they behave rationally, these are people
12 We thank an anonymous referee for this suggestion.13 Again, we found similar qualitative results and levels of significance when we repeated these
tests restricting our attention only to the cases that we classified as most reliable, that is, thathave a “smoking gun” classification.
2232 The Journal of Finance R©
for whom the expected benefits of blowing the whistle exceeded the expectedcosts. Hence, the benefits we observe overestimate the average benefit and thecosts we observe underestimate the average cost. Nevertheless, this exerciseis valuable as it documents the existence of these benefits and costs and isable to highlight incentives that are not generally discussed in the traditionalcorporate governance literature.
C.1. Auditors
Almost all of the theories suggest a significant role for auditors: not onlyare they agents of the board with an oversight mandate, but they also havedirect access to internal and external information. An auditor has an incentiveto report a fraud if he is more likely to retain an account and to gain a newaccount after blowing the whistle.
While these incentives are very powerful in theory, they might not be aspowerful in practice. Until SOX, auditors were appointed by management andthus were more likely to care about being friendly to management than beingloyal to shareholders. For example, the Arthur Andersen partner suspendedby the SEC for improper professional conduct in the Waste Management casewas subsequently promoted by Arthur Andersen (Brickey (2004)). Academicevidence also supports the weak (if not perverse) incentives for auditors to re-veal fraud. Chen and Zhou (2007) show that poorly governed firms choose lowerquality auditors. Similarly, Brickey (2004) and Fuerman (2006) document thatit was known that the quality of Arthur Andersen’s auditing had deterioratedprior to Enron, yet they did not experience a loss of market share.
To test the role played by incentives in an auditor’s whistleblowing, Table IVreports evidence on auditor turnover and new account acquisitions aroundwhistleblowing. We identify auditor turnover from annual report data compiledby Compustat. We also manually code auditor turnover for our fraud cases byconducting Factiva searches for auditor turnover events 3 months subsequentto the revelation.
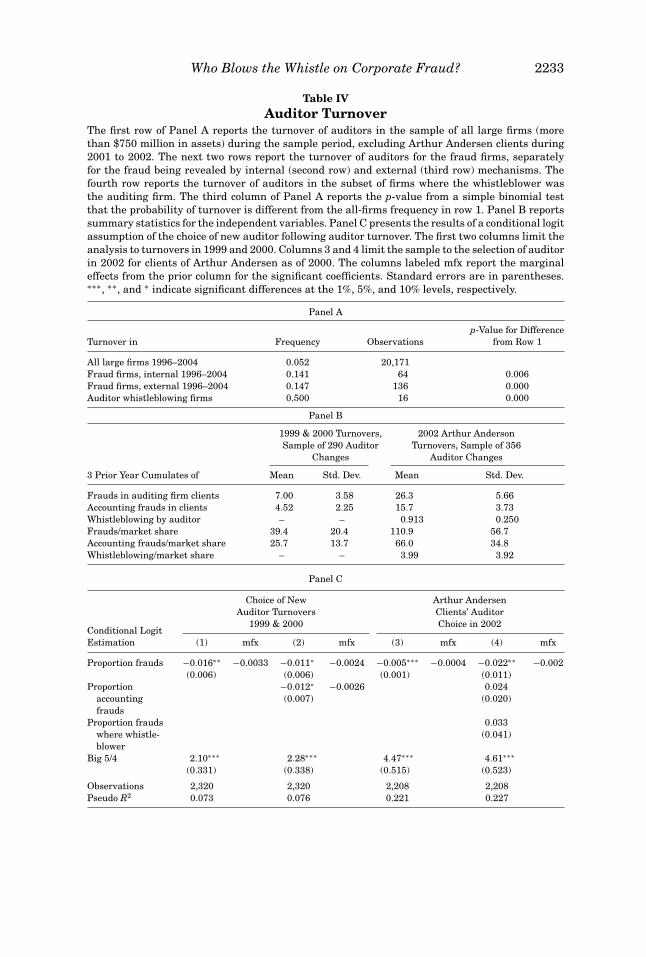
As Panel A of Table IV reports, auditors that blow the whistle are more likelyto lose accounts: 50% of whistleblowing auditors lose the account of the fraud-committing firm in the year of the fraud revelation (or 3 months subsequent tothe revelation, if the fraud occurs in the last quarter). This is very statisticallydifferent (at the 1% level) from auditors in the overall 1996 to 2004 sampleof Compustat firms with assets greater than $750 million, who—excludingArthur Andersen forced turnovers—experience on average a 5% turnover. Thisis also very statistically different from the 14% to 15% turnover of auditorspresiding over a fraud-committing firm but not uncovering or revealing thefraud. Therefore, an auditor of a fraud-committing firm is more likely to bereplaced after the fraud comes to light, but this likelihood is much higher if theauditor himself blew the whistle.
Often in the labor literature, it is difficult to separate firings from volun-tary resignations. However, in the case of auditors, the SEC requires all filingfirms to disclose the cause of the turnover within 5 business days in a form
Who Blows the Whistle on Corporate Fraud? 2233
Table IVAuditor Turnover
The first row of Panel A reports the turnover of auditors in the sample of all large firms (morethan $750 million in assets) during the sample period, excluding Arthur Andersen clients during2001 to 2002. The next two rows report the turnover of auditors for the fraud firms, separatelyfor the fraud being revealed by internal (second row) and external (third row) mechanisms. Thefourth row reports the turnover of auditors in the subset of firms where the whistleblower wasthe auditing firm. The third column of Panel A reports the p-value from a simple binomial testthat the probability of turnover is different from the all-firms frequency in row 1. Panel B reportssummary statistics for the independent variables. Panel C presents the results of a conditional logitassumption of the choice of new auditor following auditor turnover. The first two columns limit theanalysis to turnovers in 1999 and 2000. Columns 3 and 4 limit the sample to the selection of auditorin 2002 for clients of Arthur Andersen as of 2000. The columns labeled mfx report the marginaleffects from the prior column for the significant coefficients. Standard errors are in parentheses.∗∗∗, ∗∗, and ∗ indicate significant differences at the 1%, 5%, and 10% levels, respectively.
Panel A
p-Value for DifferenceTurnover in Frequency Observations from Row 1
All large firms 1996–2004 0.052 20,171Fraud firms, internal 1996–2004 0.141 64 0.006Fraud firms, external 1996–2004 0.147 136 0.000Auditor whistleblowing firms 0.500 16 0.000
Panel B
1999 & 2000 Turnovers, 2002 Arthur AndersonSample of 290 Auditor Turnovers, Sample of 356
Changes Auditor Changes
3 Prior Year Cumulates of Mean Std. Dev. Mean Std. Dev.
Frauds in auditing firm clients 7.00 3.58 26.3 5.66Accounting frauds in clients 4.52 2.25 15.7 3.73Whistleblowing by auditor – – 0.913 0.250Frauds/market share 39.4 20.4 110.9 56.7Accounting frauds/market share 25.7 13.7 66.0 34.8Whistleblowing/market share – – 3.99 3.92
Panel C
Choice of New Arthur AndersenAuditor Turnovers Clients’ Auditor
1999 & 2000 Choice in 2002Conditional LogitEstimation (1) mfx (2) mfx (3) mfx (4) mfx
Proportion frauds −0.016∗∗ −0.0033 −0.011∗ −0.0024 −0.005∗∗∗ −0.0004 −0.022∗∗ −0.002(0.006) (0.006) (0.001) (0.011)
Proportion −0.012∗ −0.0026 0.024accountingfrauds
(0.007) (0.020)
Proportion frauds 0.033where whistle-blower
(0.041)
Big 5/4 2.10∗∗∗ 2.28∗∗∗ 4.47∗∗∗ 4.61∗∗∗
(0.331) (0.338) (0.515) (0.523)
Observations 2,320 2,320 2,208 2,208Pseudo R2 0.073 0.076 0.221 0.227
2234 The Journal of Finance R©
8-K.14 The firm initiates the replacement in the vast majority of our cases.In particular, the firm terminates the auditors’ contracts in 91% of the caseswhen an auditor is the whistleblower, in 83% of the cases when there is a non-auditor external whistleblower, and in 91% of the cases when the firm is thewhistleblower.
This result does not necessarily prove that auditors lose out by whistleblow-ing since they could gain on the extensive margin by attracting new clients,thanks to their enhanced reputation. To test this hypothesis, in Panel C ofTable IV, we examine whether a company’s historical association with fraud-committing firms affects its ability to attract new accounts. Because the demiseof Arthur Andersen may have structurally changed the reputational incentivesof auditors, we break the sample into two periods (1999 to 2000, and 2001 to2003).15
We estimate a conditional logit choice model, where the dependent vari-able is the choice of a new auditing firm among a set of eight and theindependent variables are the proportion of prior accounts with frauds(the cumulative number of frauds that took place in auditor client accountsfor the 3 years prior to the turnover divided by the firms’ market share), theproportion of prior accounts that required restatements (not all frauds resultedin financial restatements), the proportion of prior accounts in which the auditoritself did the whistleblowing, as well as a dummy indicating where an auditoris a Big Five/Big Four firm.16
Both before (columns 1 and 2) and after (columns 3 and 4) the demise ofArthur Andersen, we find that auditors overseeing firms where a fraud comesto light suffer in terms of reputation. Specifically, we find that a one standarddeviation increase in the normalized number of large firm frauds (equivalentto 3.6 more frauds over 3 years) results in a 4.8% lower likelihood of attractinga new turnover client (0.048 = 20.3 ∗ 0.0024). Firms where the frauds requirerestatements fare even worse, with one standard deviation more accountingfrauds producing an additional 3.5 percentage point decline in the likelihoodof attracting a new client.17
Columns 3 and 4 repeat the analysis for the 368 accounts that have becomeavailable as a result of the demise of Arthur Andersen, finding that a one stan-dard deviation increase in the count of prior frauds results in an 8.5% lowerlikelihood of attracting an Arthur Andersen client. In this sample period, wehave enough observations with whistleblowing auditors to be able to add the
14 We thank an anonymous referee for suggesting this test.15 By focusing on these years, we take advantage of having a rolling 3-year prior window to
measure fraud detection reputation for our data starting in 1996. Of the roughly 2,400 largecompanies in both 1999 and 2000, we observe a total of 290 auditor turnovers.
16 Arthur Andersen; Deloitte & Touche; Ernst & Young; Grant Thornton; McGladrey & Pullen;Peat, Marwick, Main; PriceWaterhouseCoopers; and others.
17 We also investigated whether our finding of a negative reputation effect from frauds could bedriven by a change in the composition of clients by interacting the cumulative number of fraudsvariable with proxies for the quality of clients. The interactions are not significant and we continueto find a negative and significant coefficient on frauds, suggesting that our results are not drivenby a change in the type of clients.
Who Blows the Whistle on Corporate Fraud? 2235
proportion of companies in which an auditor blew the whistle. Consistent withpositive reputation effects, whistleblowing has a positive effect on the proba-bility of gaining new accounts, but this effect is not statistically significant.
To summarize, we find very weak evidence of auditors’ incentives to blow thewhistle. Auditing a fraudulent company is bad for the auditor’s reputation, butconditional on doing so, bringing this information to light does not benefit theauditor: doing so is likely to cost the auditor the account and does not lead toan increase in new accounts.
C.2. Financial Analysts
The finance and career concern views suggest a significant role for ana-lysts in fraud detection. As agents of investors holding residual claims (forboth equity and debt), they specialize in interpreting company information andgenerating insightful analysis. While analysts do not receive direct monetarycompensation for revealing fraud, they can benefit indirectly through enhancedreputation and career prospects (e.g., Fama (1980), Hong and Kubik (2003)).18
At the same time, analysts’ incentives to reveal fraud may be reduced by thepotential conflict of interest between the analysis they do and the investmentbanking services their companies offer (e.g., Michaely and Womack (1999)).Their incentives to reveal fraud may also be significantly reduced or elimi-nated by their tendency to herd.19 Finally, before Regulation FD analysts mighthave had incentives to develop a good reputation vis-a-vis the companies theyfollowed to gain privileged access to soft information.
To test the benefits of whistleblowing on analysts’ careers, we focus on twoobservable indicators of their career prospects used by Hong and Kubik (2003).The first measure is the Institutional Investor All American Analyst ranking.Every year the magazine Institutional Investor ranks analysts whom buy-sidemoney managers see as the best in their industry. The top ranked in eachcategory (All-Stars) are actively sought by investment banks and receive thehighest salaries (Hong and Kubik (2003)). Our second measure of career ad-vancement is the ranking of the investment bank where an analyst works.Hong and Kubik (2003) document a “well-defined hierarchy of prestige” amonginvestment banks. If whistleblowing advances careers, we would expect thatanalysts who blow the whistle are more likely to become All-Star analysts andmore likely to move to a higher-tier investment bank (as measured by Hong andKubik’s hierarchy variable, and updated to cover our extended sample period).
To properly compare the whistleblowing analysts, we benchmark against allthe other analysts from I/B/E/S covering the same firm at the time the fraudwas revealed. We then trace where these analysts worked and their All-Star
18 Consistent with such career concerns in the analyst industry, Hong and Kubik (2000), forexample, report that good forecast records are rewarded by upward mobility to higher-tieredbrokerage houses, or by the retention of jobs in top-tier brokerage houses.
19 Scharfstein and Stein (1990), for example, identify a “share the blame” effect, whereby thepenalty for being incorrect is lower if one is not the sole incorrect voice. This herding-based bias isgreater when analysts are young and there is uncertainty about their ability.
2236 The Journal of Finance R©
status both before and 2 years after a fraud was revealed. We exclude fromthe analysis those analysts who leave the industry because such movementscould indicate either a promotion (e.g., to join a hedge fund) or a demotion (e.g.,to spend “more time with their families,” Hong and Kubik (2003)) from theprofession.
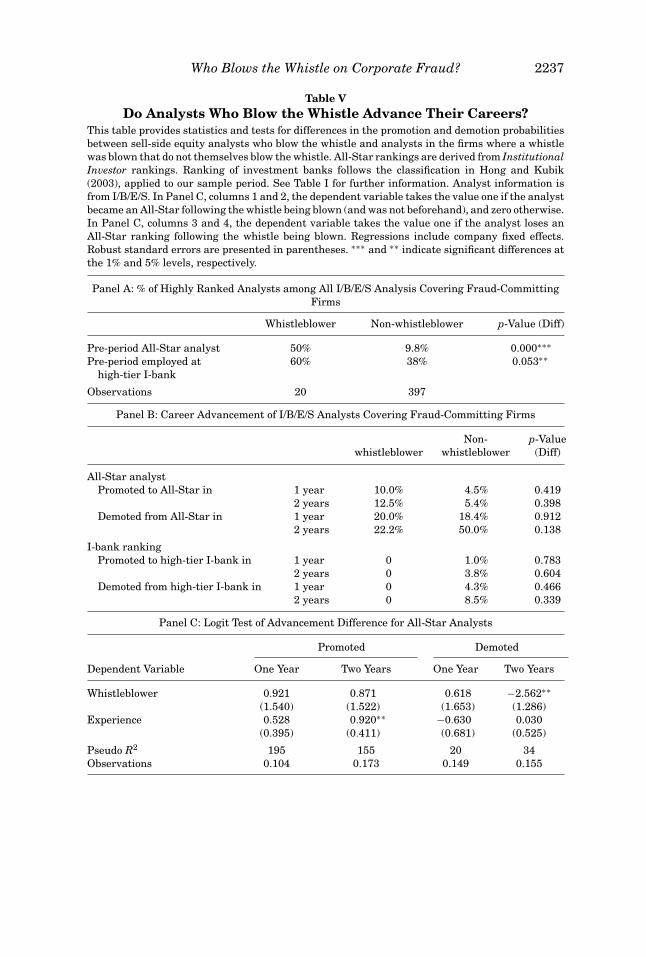
Table V presents our results. Panel A shows that whistleblowers are sig-nificantly more likely to be All-Stars (50% vs. 9.8%) and work in high-tierinvestment banks (60% vs. 38%) at the time they blow the whistle. The dif-ferences are strikingly large, suggesting perhaps that whistleblowing is onlycredible when a person has first achieved credibility.
The raw promotion and demotion probabilities reported in Panel B showthat analysts who blow the whistle are more likely to be promoted and lesslikely to be demoted than non-whistleblowers, but neither of these differencesis statistically significant. The lack of impact could be due to the univariatetests ignoring other variables that affect promotion and demotion.
For this reason, Panel C presents a multivariate setting where we estimatea logit with company fixed effects, controlling for analysts’ experience in theregression. We can perform this analysis only for the All-Star measure since nowhistleblowers move in investment bank ranking, which by itself is an indica-tion of lack of positive career effects. Panel C reinforces the univariate resultthat whistleblowing analysts are no more likely to be promoted. However, overthe 2 years following the fraud revelation, the probability that a whistleblowinganalyst is demoted is 45% less likely than that for non-whistleblowing analystsfollowing the same firms. (This is the economic effect of the logit coefficient,−2.562.) Although this is a small sample result, we feel that the inference isfairly intuitive: whistleblowing is done by successful analysts who do not worryabout consequences from companies of bringing bad news to light.
C.3. Media
Journalists are similar to analysts in the sense that they collect and analyzeinformation for their clients (the readers). Furthermore, they also have anincentive to build a reputation of being nice vis-a-vis companies in order tocultivate their sources (Dyck and Zingales (2003)), and they may also face aconflict arising from the fact that the companies in their stories often makedirect payments to their employers (e.g., advertising).
The main difference between journalists and analysts is that journalists aremuch less specialized than analysts and thus potentially have access to lesscompany- and industry-specific information. On the upside, however, journal-ists might benefit more from revelation of fraud, because a scoop might helpestablish a journalist’s career and reputation.
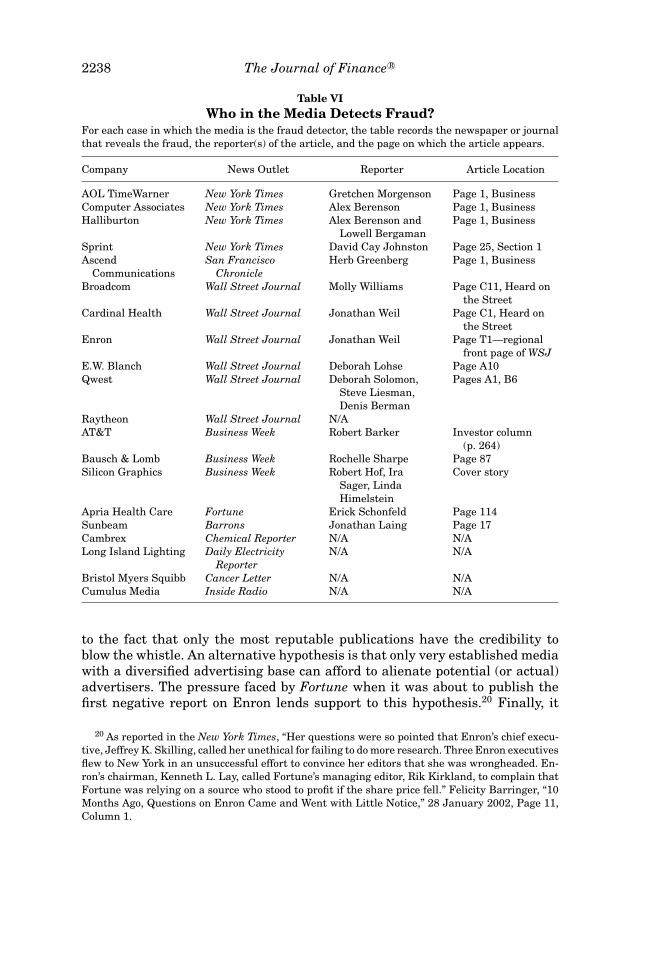
As Table VI, Panel A shows, 10 of the 11 cases reported by daily news outletsare published in the Wall Street Journal or the New York Times. Similarly, Busi-ness Week and Fortune account for five of the six cases identified by magazines.As is the case for analysts, whistleblowing by journalists takes place primarilyat the most prestigious media outlets. As for analysts, this result may be due
Who Blows the Whistle on Corporate Fraud? 2237
Table VDo Analysts Who Blow the Whistle Advance Their Careers?
This table provides statistics and tests for differences in the promotion and demotion probabilitiesbetween sell-side equity analysts who blow the whistle and analysts in the firms where a whistlewas blown that do not themselves blow the whistle. All-Star rankings are derived from InstitutionalInvestor rankings. Ranking of investment banks follows the classification in Hong and Kubik(2003), applied to our sample period. See Table I for further information. Analyst information isfrom I/B/E/S. In Panel C, columns 1 and 2, the dependent variable takes the value one if the analystbecame an All-Star following the whistle being blown (and was not beforehand), and zero otherwise.In Panel C, columns 3 and 4, the dependent variable takes the value one if the analyst loses anAll-Star ranking following the whistle being blown. Regressions include company fixed effects.Robust standard errors are presented in parentheses. ∗∗∗ and ∗∗ indicate significant differences atthe 1% and 5% levels, respectively.
Panel A: % of Highly Ranked Analysts among All I/B/E/S Analysis Covering Fraud-CommittingFirms
Whistleblower Non-whistleblower p-Value (Diff)
Pre-period All-Star analyst 50% 9.8% 0.000∗∗∗Pre-period employed at
high-tier I-bank60% 38% 0.053∗∗
Observations 20 397
Panel B: Career Advancement of I/B/E/S Analysts Covering Fraud-Committing Firms
Non- p-Valuewhistleblower whistleblower (Diff)
All-Star analystPromoted to All-Star in 1 year 10.0% 4.5% 0.419
2 years 12.5% 5.4% 0.398Demoted from All-Star in 1 year 20.0% 18.4% 0.912
2 years 22.2% 50.0% 0.138
I-bank rankingPromoted to high-tier I-bank in 1 year 0 1.0% 0.783
2 years 0 3.8% 0.604Demoted from high-tier I-bank in 1 year 0 4.3% 0.466
2 years 0 8.5% 0.339
Panel C: Logit Test of Advancement Difference for All-Star Analysts
Promoted Demoted
Dependent Variable One Year Two Years One Year Two Years
Whistleblower 0.921 0.871 0.618 −2.562∗∗(1.540) (1.522) (1.653) (1.286)
Experience 0.528 0.920∗∗ −0.630 0.030(0.395) (0.411) (0.681) (0.525)
Pseudo R2 195 155 20 34Observations 0.104 0.173 0.149 0.155
2238 The Journal of Finance R©
Table VIWho in the Media Detects Fraud?
For each case in which the media is the fraud detector, the table records the newspaper or journalthat reveals the fraud, the reporter(s) of the article, and the page on which the article appears.
Company News Outlet Reporter Article Location
AOL TimeWarner New York Times Gretchen Morgenson Page 1, BusinessComputer Associates New York Times Alex Berenson Page 1, BusinessHalliburton New York Times Alex Berenson and
Lowell BergamanPage 1, Business
Sprint New York Times David Cay Johnston Page 25, Section 1Ascend
CommunicationsSan Francisco
ChronicleHerb Greenberg Page 1, Business
Broadcom Wall Street Journal Molly Williams Page C11, Heard onthe Street
Cardinal Health Wall Street Journal Jonathan Weil Page C1, Heard onthe Street
Enron Wall Street Journal Jonathan Weil Page T1—regionalfront page of WSJ
E.W. Blanch Wall Street Journal Deborah Lohse Page A10Qwest Wall Street Journal Deborah Solomon,
Steve Liesman,Denis Berman
Pages A1, B6
Raytheon Wall Street Journal N/AAT&T Business Week Robert Barker Investor column
(p. 264)Bausch & Lomb Business Week Rochelle Sharpe Page 87Silicon Graphics Business Week Robert Hof, Ira
Sager, LindaHimelstein
Cover story
Apria Health Care Fortune Erick Schonfeld Page 114Sunbeam Barrons Jonathan Laing Page 17Cambrex Chemical Reporter N/A N/ALong Island Lighting Daily Electricity
ReporterN/A N/A
Bristol Myers Squibb Cancer Letter N/A N/ACumulus Media Inside Radio N/A N/A
to the fact that only the most reputable publications have the credibility toblow the whistle. An alternative hypothesis is that only very established mediawith a diversified advertising base can afford to alienate potential (or actual)advertisers. The pressure faced by Fortune when it was about to publish thefirst negative report on Enron lends support to this hypothesis.20 Finally, it
20 As reported in the New York Times, “Her questions were so pointed that Enron’s chief execu-tive, Jeffrey K. Skilling, called her unethical for failing to do more research. Three Enron executivesflew to New York in an unsuccessful effort to convince her editors that she was wrongheaded. En-ron’s chairman, Kenneth L. Lay, called Fortune’s managing editor, Rik Kirkland, to complain thatFortune was relying on a source who stood to profit if the share price fell.” Felicity Barringer, “10Months Ago, Questions on Enron Came and Went with Little Notice,” 28 January 2002, Page 11,Column 1.
Who Blows the Whistle on Corporate Fraud? 2239
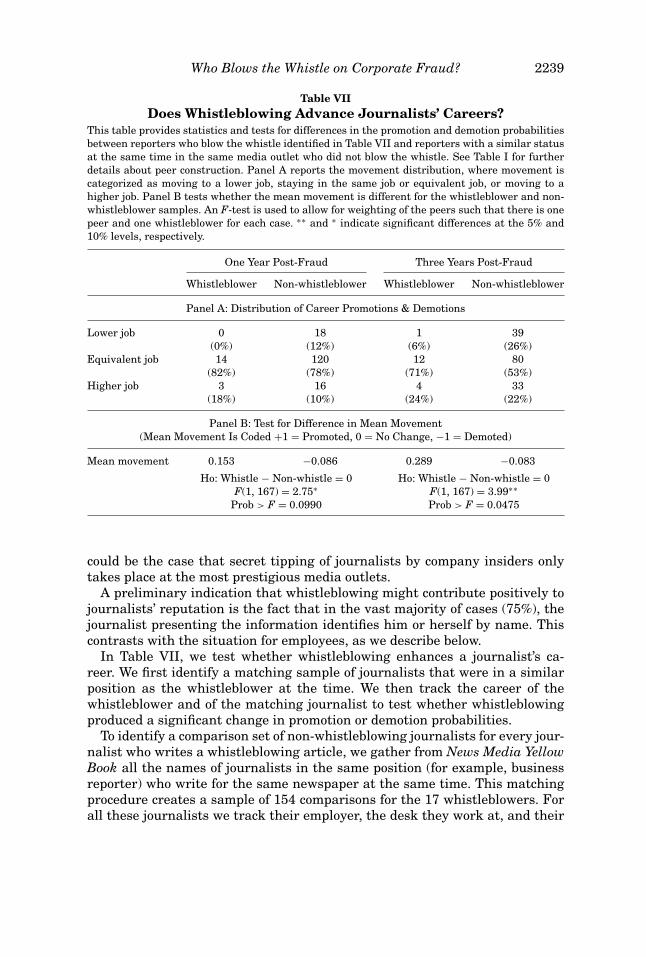
Table VIIDoes Whistleblowing Advance Journalists’ Careers?
This table provides statistics and tests for differences in the promotion and demotion probabilitiesbetween reporters who blow the whistle identified in Table VII and reporters with a similar statusat the same time in the same media outlet who did not blow the whistle. See Table I for furtherdetails about peer construction. Panel A reports the movement distribution, where movement iscategorized as moving to a lower job, staying in the same job or equivalent job, or moving to ahigher job. Panel B tests whether the mean movement is different for the whistleblower and non-whistleblower samples. An F-test is used to allow for weighting of the peers such that there is onepeer and one whistleblower for each case. ∗∗ and ∗ indicate significant differences at the 5% and10% levels, respectively.
One Year Post-Fraud Three Years Post-Fraud
Whistleblower Non-whistleblower Whistleblower Non-whistleblower
Panel A: Distribution of Career Promotions & Demotions
Lower job 0 18 1 39(0%) (12%) (6%) (26%)
Equivalent job 14 120 12 80(82%) (78%) (71%) (53%)
Higher job 3 16 4 33(18%) (10%) (24%) (22%)
Panel B: Test for Difference in Mean Movement(Mean Movement Is Coded +1 = Promoted, 0 = No Change, −1 = Demoted)
Mean movement 0.153 −0.086 0.289 −0.083
Ho: Whistle − Non-whistle = 0 Ho: Whistle − Non-whistle = 0F(1, 167) = 2.75∗ F(1, 167) = 3.99∗∗
Prob > F = 0.0990 Prob > F = 0.0475
could be the case that secret tipping of journalists by company insiders onlytakes place at the most prestigious media outlets.
A preliminary indication that whistleblowing might contribute positively tojournalists’ reputation is the fact that in the vast majority of cases (75%), thejournalist presenting the information identifies him or herself by name. Thiscontrasts with the situation for employees, as we describe below.
In Table VII, we test whether whistleblowing enhances a journalist’s ca-reer. We first identify a matching sample of journalists that were in a similarposition as the whistleblower at the time. We then track the career of thewhistleblower and of the matching journalist to test whether whistleblowingproduced a significant change in promotion or demotion probabilities.
To identify a comparison set of non-whistleblowing journalists for every jour-nalist who writes a whistleblowing article, we gather from News Media YellowBook all the names of journalists in the same position (for example, businessreporter) who write for the same newspaper at the same time. This matchingprocedure creates a sample of 154 comparisons for the 17 whistleblowers. Forall these journalists we track their employer, the desk they work at, and their
2240 The Journal of Finance R©
job title 1 year and 3 years after the quarter the journalist wrote the article.We then provided all of this information to a third party with expertise in jour-nalism who classified the career changes using a three-point scale to identifypromotions (+1), no change or change to an equivalent job (0), or demotion(−1).21
Panel A reports the distribution of career advancement for journalists whoblew the whistle and for the comparison set. Whistleblowing journalists arenever demoted within 1 year (6% are demoted within 3 years) of bringing thefraud to light, whereas non-whistleblowers face a demotion in contrast with aprobability of 12% (26%). Whistleblowers are promoted 18% (24%) of the timein contrast to the 10% (22%) promotion probability for non-whistleblowers.To summarize these different career paths, in Panel B, we average the −1(demotion), 0 (no change), and +1 (promotion) scoring. We find a positive meanmovement for whistleblowers that is significantly different from the negativemean movement for non-whistleblowers, both at the 1-year and the 3-yearhorizons.22 While we do not want to overstate these results given the limiteddata and rough career advancement coding, the results are consistent withpositive incentives for media bringing fraud to light.
C.4. Employees
Employees clearly have the best access to information. Few, if any, fraudscan be committed without the knowledge and often the support of severalemployees. Some might be accomplices, enjoying some of the benefits of thefraud, but most are not. To examine the incentives and disincentives thatemployees face in exposing the fraud, we focus on the 27 cases of employeewhistleblowing in our sample.23
Table VIII provides a summary. In 37% of the cases, the whistleblower con-ceals his identity. This is a clear sign that the expected reputational costsexceed the expected reputational benefits of whistleblowing. This impressionis confirmed by the data on the cases in which the identity of the whistleblowerwas revealed. In spite of these cases being those for which the expected benefitof revealing should exceed the expected cost, we find that in 82% of the cases,the whistleblower was fired, quit under duress, or had significantly alteredresponsibilities. In addition, many employee whistleblowers report having to
21 Discussions with journalists suggested that this procedure that incorporates three dimensionsof status (outlet, desk, position) and allows an experienced journalist to weight these dimensionswas superior to a simpler procedure focusing just on one dimension or a fixed weighting on dimen-sions.
22 The result gives the same result as an ordered logit test or a distribution transition matrixtest.
23 Bowen, Call, and Rajgopal (2007) provide further examination of employee incentives sur-rounding whistleblowing. They first collect whistleblower allegations arising from OSHA collectionof such allegations following the passage of SOX. This part of the sample is likely to include morefrivolous complaints as the sample is not subject to the same judicial scrutiny as class action lawsuits. The second part of their sample arises from any press allegations that connected a financialfraud with employee whistleblowing, a procedure different from our own.
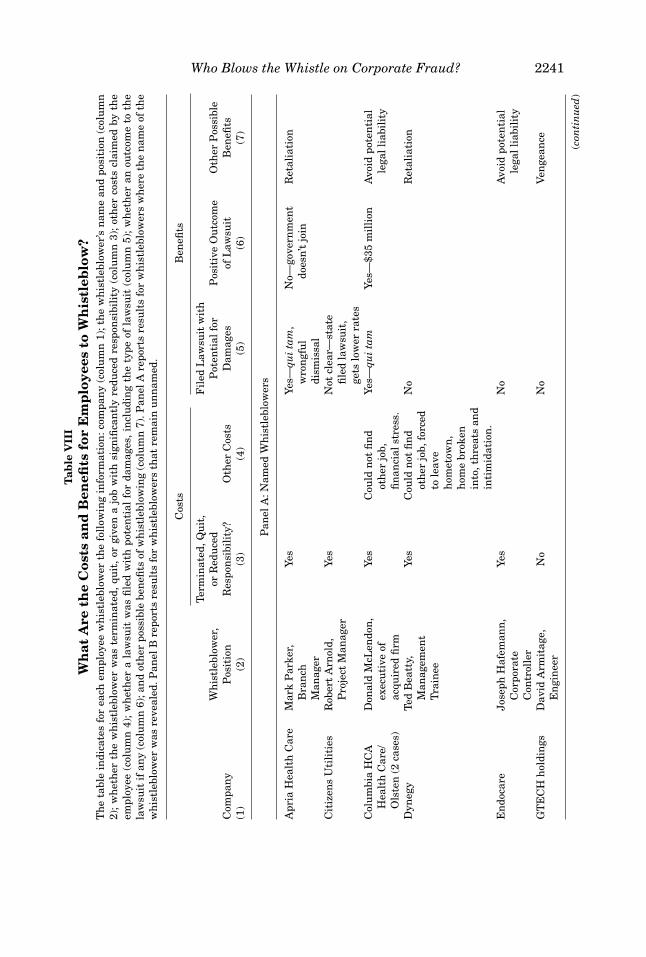
Who Blows the Whistle on Corporate Fraud? 2241T
able
VII
IW
hat
Are
the
Cos
tsan
dB
enefi
tsfo
rE
mp
loye
esto
Wh
istl
eblo
w?
Th
eta
ble
indi
cate
sfo
rea
chem
ploy
eew
his
tleb
low
erth
efo
llow
ing
info
rmat
ion
:com
pan
y(c
olu
mn
1);t
he
wh
istl
eblo
wer
’sn
ame
and
posi
tion
(col
um
n2)
;w
het
her
the
wh
istl
eblo
wer
was
term
inat
ed,
quit
,or
give
na
job
wit
hsi
gnifi
can
tly
redu
ced
resp
onsi
bili
ty(c
olu
mn
3);
oth
erco
sts
clai
med
byth
eem
ploy
ee(c
olu
mn
4);
wh
eth
era
law
suit
was
file
dw
ith
pote
nti
alfo
rda
mag
es,
incl
udi
ng
the
type
ofla
wsu
it(c
olu
mn
5);
wh
eth
eran
outc
ome
toth
ela
wsu
itif
any
(col
um
n6)
;an
dot
her
poss
ible
ben
efits
ofw
his
tleb
low
ing
(col
um
n7)
.Pan
elA
repo
rts
resu
lts
for
wh
istl
eblo
wer
sw
her
eth
en
ame
ofth
ew
his
tleb
low
erw
asre
veal
ed.P
anel
Bre
port
sre
sult
sfo
rw
his
tleb
low
ers
that
rem
ain
un
nam
ed.
Cos
tsB
enefi
ts
Term
inat
ed,Q
uit
,F
iled
Law
suit
wit
hW
his
tleb
low
er,
orR
edu
ced
Pot
enti
alfo
rP
osit
ive
Ou
tcom
eO
ther
Pos
sibl
eC
ompa
ny
Pos
itio
nR
espo
nsi
bili
ty?
Oth
erC
osts
Dam
ages
ofL
awsu
itB
enefi
ts(1
)(2
)(3
)(4
)(5
)(6
)(7
)
Pan
elA
:Nam
edW
his
tleb
low
ers
Apr
iaH
ealt
hC
are
Mar
kP
arke
r,B
ran
chM
anag
er
Yes
Yes—
qui
tam
,w
ron
gfu
ldi
smis
sal
No—
gove
rnm
ent
does
n’t
join
Ret
alia
tion
Cit
izen
sU
tili
ties
Rob
ert
Arn
old,
Pro
ject
Man
ager
Yes
Not
clea
r—st
ate
file
dla
wsu
it,
gets
low
erra
tes
Col
um
bia
HC
AH
ealt
hC
are/
Ols
ten
(2ca
ses)
Don
ald
McL
endo
n,
exec
uti
veof
acqu
ired
firm
Yes
Cou
ldn
otfi
nd
oth
erjo
b,fi
nan
cial
stre
ss.
Yes—
qui
tam
Yes—
$35
mil
lion
Avo
idpo
ten
tial
lega
llia
bili
ty
Dyn
egy
Ted
Bea
tty,
Man
agem
ent
Tra
inee
Yes
Cou
ldn
otfi
nd
oth
erjo
b,fo
rced
tole
ave
hom
etow
n,
hom
ebr
oken
into
,th
reat
san
din
tim
idat
ion
.
No
Ret
alia
tion
En
doca
reJo
seph
Haf
eman
n,
Cor
pora
teC
ontr
olle
r
Yes
No
Avo
idpo
ten
tial
lega
llia
bili
ty
GT
EC
Hh
oldi
ngs
Dav
idA
rmit
age,
En
gin
eer
No
No
Ven
gean
ce
(con
tin
ued
)
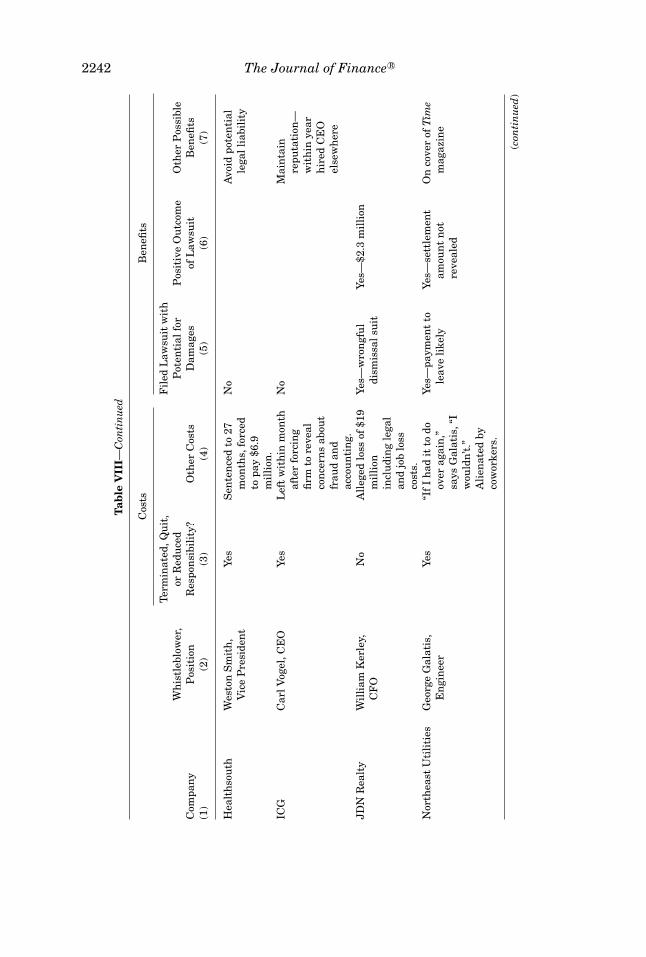
2242 The Journal of Finance R©
Tab
leV
III—
Con
tin
ued
Cos
tsB
enefi
ts
Term
inat
ed,Q
uit
,F
iled
Law
suit
wit
hW
his
tleb
low
er,
orR
edu
ced
Pot
enti
alfo
rP
osit
ive
Ou
tcom
eO
ther
Pos
sibl
eC
ompa
ny
Pos
itio
nR
espo
nsi
bili
ty?
Oth
erC
osts
Dam
ages
ofL
awsu
itB
enefi
ts(1
)(2
)(3
)(4
)(5
)(6
)(7
)
Hea
lth
sou
thW
esto
nS
mit
h,
Vic
eP
resi
den
tYe
sS
ente
nce
dto
27m
onth
s,fo
rced
topa
y$6
.9m
illi
on.
No
Avo
idpo
ten
tial
lega
llia
bili
ty
ICG
Car
lVog
el,C
EO
Yes
Lef
tw
ith
inm
onth
afte
rfo
rcin
gfi
rmto
reve
alco
nce
rns
abou
tfr
aud
and
acco
un
tin
g.
No
Mai
nta
inre
puta
tion
—w
ith
inye
arh
ired
CE
Oel
sew
her
e
JDN
Rea
lty
Wil
liam
Ker
ley,
CF
ON
oA
lleg
edlo
ssof
$19
mil
lion
incl
udi
ng
lega
lan
djo
blo
ssco
sts.
Yes—
wro
ngf
ul
dism
issa
lsu
itYe
s—$2
.3m
illi
on
Nor
thea
stU
tili
ties
Geo
rge
Gal
atis
,E
ngi
nee
rYe
s“I
fI
had
itto
doov
erag
ain
,”sa
ysG
alat
is,“
Iw
ould
n’t.
”A
lien
ated
byco
wor
kers
.
Yes—
paym
ent
tole
ave
like
lyYe
s—se
ttle
men
tam
oun
tn
otre
veal
ed
On
cove
rof
Tim
em
agaz
ine
(con
tin
ued
)
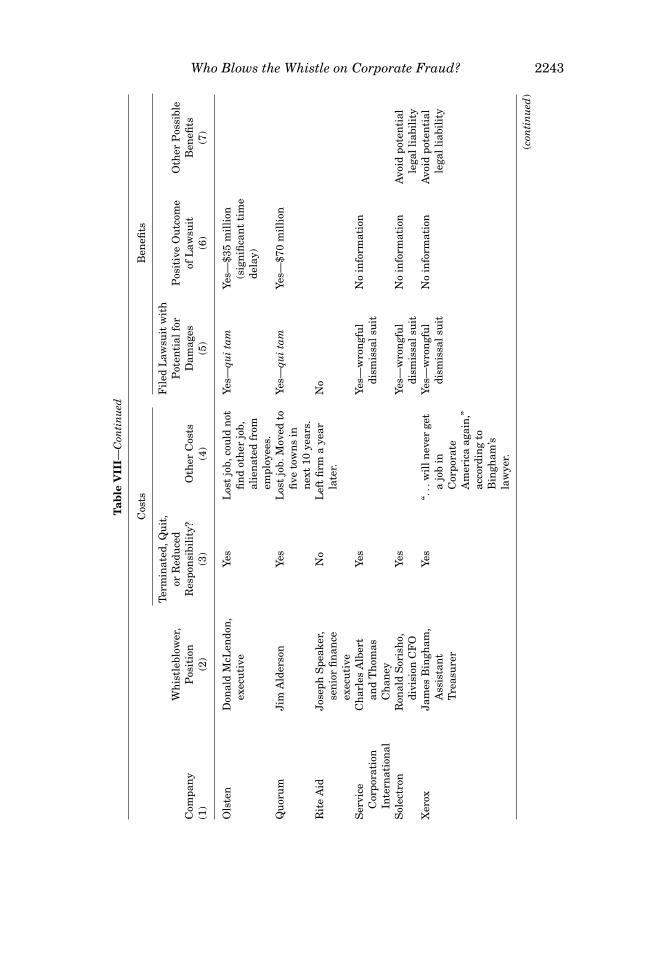
Who Blows the Whistle on Corporate Fraud? 2243
Tab
leV
III—
Con
tin
ued
Cos
tsB
enefi
ts
Term
inat
ed,Q
uit
,F
iled
Law
suit
wit
hW
his
tleb
low
er,
orR
edu
ced
Pot
enti
alfo
rP
osit
ive
Ou
tcom
eO
ther
Pos
sibl
eC
ompa
ny
Pos
itio
nR
espo
nsi
bili
ty?
Oth
erC
osts
Dam
ages
ofL
awsu
itB
enefi
ts(1
)(2
)(3
)(4
)(5
)(6
)(7
)
Ols
ten
Don
ald
McL
endo
n,
exec
uti
veYe
sL
ost
job,
cou
ldn
otfi
nd
oth
erjo
b,al
ien
ated
from
empl
oyee
s.
Yes—
qui
tam
Yes—
$35
mil
lion
(sig
nifi
can
tti
me
dela
y)
Qu
oru
mJi
mA
lder
son
Yes
Los
tjo
b.M
oved
tofi
veto
wn
sin
nex
t10
year
s.
Yes—
qui
tam
Yes—
$70
mil
lion
Rit
eA
idJo
seph
Spe
aker
,se
nio
rfi
nan
ceex
ecu
tive
No
Lef
tfi
rma
year
late
r.N
o
Ser
vice
Cor
pora
tion
Inte
rnat
ion
al
Ch
arle
sA
lber
tan
dT
hom
asC
han
ey
Yes
Yes—
wro
ngf
ul
dism
issa
lsu
itN
oin
form
atio
n
Sol
ectr
onR
onal
dS
oris
ho,
divi
sion
CF
OYe
sYe
s—w
ron
gfu
ldi
smis
sals
uit
No
info
rmat
ion
Avo
idpo
ten
tial
lega
llia
bili
tyX
erox
Jam
esB
ingh
am,
Ass
ista
nt
Tre
asu
rer
Yes
“...
wil
lnev
erge
ta
job
inC
orpo
rate
Am
eric
aag
ain
,”ac
cord
ing
toB
ingh
am’s
law
yer.
Yes—
wro
ngf
ul
dism
issa
lsu
itN
oin
form
atio
nA
void
pote
nti
alle
gall
iabi
lity
(con
tin
ued
)

2244 The Journal of Finance R©T
able
VII
I—C
onti
nu
ed
Cos
tsB
enefi
ts
Term
inat
ed,Q
uit
,F
iled
Law
suit
wit
hW
his
tleb
low
er,
orR
edu
ced
Pot
enti
alfo
rP
osit
ive
Ou
tcom
eO
ther
Pos
sibl
eC
ompa
ny
Pos
itio
nR
espo
nsi
bili
ty?
Oth
erC
osts
Dam
ages
ofL
awsu
itB
enefi
ts(1
)(2
)(3
)(4
)(5
)(6
)(7
)
Pan
elB
:Un
nam
edW
his
tleb
low
ers
All
egh
eny
En
ergy
Un
nam
edex
ecu
tive
sU
nkn
own
Am
eric
aW
est
Un
ion
ized
mai
nte
nan
cew
orke
rs
Un
know
nIm
prov
eem
ploy
men
tco
ndi
tion
sC
enda
nt
Acc
oun
tin
gst
aff
inte
grat
ing
new
lyac
quir
edfi
rm
Un
know
nA
void
pote
nti
alle
gall
iabi
lity
En
tera
sys
Net
wor
ksU
nn
amed
fin
ance
exec
uti
veU
nkn
own
Foo
tsta
rC
orpo
rate
Acc
oun
tin
ggr
oup
Un
know
nA
void
pote
nti
alle
gall
iabi
lity
Nic
orA
non
ymou
sle
tter
Un
know
nP
hyC
orD
octo
rsw
ho
are
empl
oyee
sU
nkn
own
Impr
ove
empl
oym
ent
con
diti
ons
Sym
bol
Tech
nol
ogie
sU
nkn
own
lett
erto
SE
CU
nkn
own
Ten
eth
ealt
hca
reU
nn
amed
empl
oyee
Un
know
n
Un
ion
Pac
ific
Un
ion
acti
onU
nkn
own
Impr
ove
empl
oym
ent
con
diti
ons
Who Blows the Whistle on Corporate Fraud? 2245
move to another industry and often to another town to escape personal harass-ment. The lawyer of James Bingham, a whistleblower in the Xerox case, sumsup Jim’s situation as follows: “Jim had a great career, but he’ll never get a job inCorporate America again.” Even according to a law firm seeking to sell its ser-vices to potential whistleblowers, the consequences to being the whistleblowerinclude distancing and retaliation from fellow workers and friends, personal at-tacks on one’s character during the course of a protracted dispute, and the needto change one’s career.24 This is an aspect rarely emphasized in the literature.Not only is the honest behavior not rewarded by the market, but it is penalized.Why employers prefer loyal employees to honest ones is an interesting questionthat deserves separate study.
Given these costs, the surprising part is not that most employees do not talk,but that some talk at all. Table VII tries to give a sense of what motivatesthem. In 29% of the cases in which the identity of the whistleblower is known,we observe a qui tam lawsuit. Such suits arise from the Federal Civil FalseClaims Act, revised in 1986, whereby individuals revealing fraud committedagainst the U.S. government can collect 15% to 30% of the money recovered bythe government. In our sample, three qui tam cases that have already settledrendered whistleblowers rewards of $35 million, $35 million, and $70 million.While the outcome of qui tam suits can be highly uncertain and delayed in time(5 and 10 years in these cases), the expectation is that these rewards mighthave been an important factor in leading the employee to talk. Other potentialmonetary incentives are hard to find.25
Another motivation for whistleblowing could be the desire to avoid a potentialliability. This seems to be relevant in 35% of the cases. A similar, but distinct,case involves ICG, where the newly appointed CEO resigned a few monthsafter beginning his job, while forcing the firm to reveal its misdoings. This isa clear example of whistleblowing aimed at preserving reputation. Yet we donot observe any evidence of this behavior among subordinates. As the case ofSharon Watkins at Enron suggests, the best way to avoid the reputational lossis to change jobs as soon as possible, without whistleblowing.
Finally, the revelation of information by employees is highly associated withwrongful dismissal suits (29% of the identified cases). It is unclear whetherthese are cases where the employee is fired for blowing the whistle internallyor whether whistleblowing is a form of revenge for a dismissal that is (or isperceived to be) unjust.
24 See the statements on the website quitam.com, which is organized by the Bauman and RasorGroup.
25 This point is illustrated by the case of Ted Beatty, as outlined in the Wall Street Journal, whotried but failed to profit by selling short the stock (only stopping when he realized he was violatinginsider-trading rules), by giving information to a short seller (failing to elicit a payment), by givinginformation to a plaintiff attorney (receiving only a small consulting contract), by giving informa-tion to a newspaper in exchange for payment (the paper refused to pay), and giving informationto the government (which would not hire him as consultant). “ Informer’s Odyssey: The ComplexGoals and Unseen Costs of Whistle-Blowing—Dynegy Ex-Trainee Encounters Short-Sellers andLawyers, Fears Being Blackballed—Seeking Justice and a Payday,” by Jathon Sapsford and PaulBeckett, The Wall Street Journal, 25 November 2002.
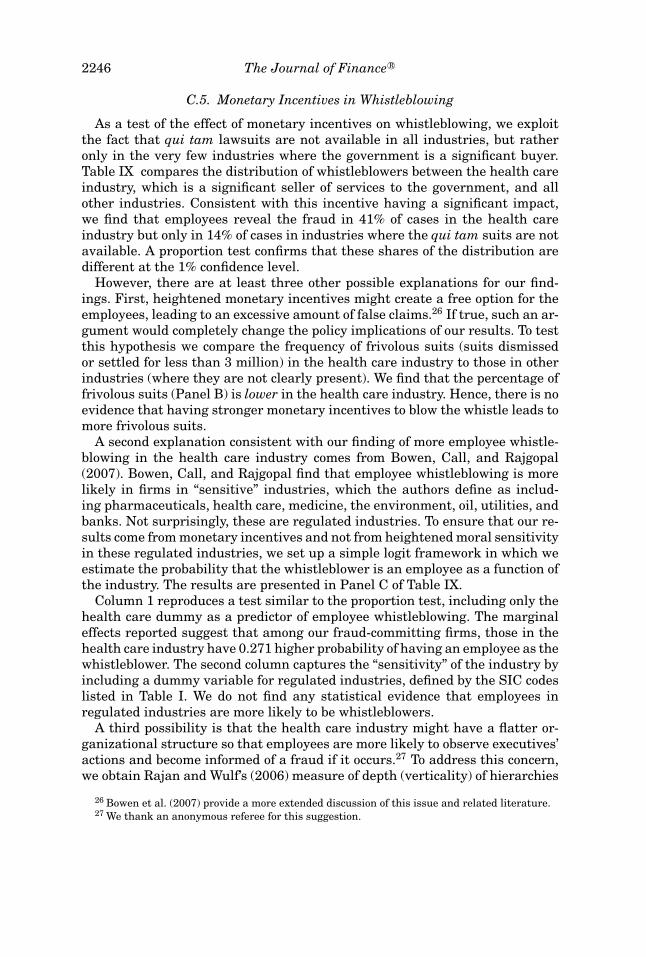
2246 The Journal of Finance R©
C.5. Monetary Incentives in Whistleblowing
As a test of the effect of monetary incentives on whistleblowing, we exploitthe fact that qui tam lawsuits are not available in all industries, but ratheronly in the very few industries where the government is a significant buyer.Table IX compares the distribution of whistleblowers between the health careindustry, which is a significant seller of services to the government, and allother industries. Consistent with this incentive having a significant impact,we find that employees reveal the fraud in 41% of cases in the health careindustry but only in 14% of cases in industries where the qui tam suits are notavailable. A proportion test confirms that these shares of the distribution aredifferent at the 1% confidence level.
However, there are at least three other possible explanations for our find-ings. First, heightened monetary incentives might create a free option for theemployees, leading to an excessive amount of false claims.26 If true, such an ar-gument would completely change the policy implications of our results. To testthis hypothesis we compare the frequency of frivolous suits (suits dismissedor settled for less than 3 million) in the health care industry to those in otherindustries (where they are not clearly present). We find that the percentage offrivolous suits (Panel B) is lower in the health care industry. Hence, there is noevidence that having stronger monetary incentives to blow the whistle leads tomore frivolous suits.
A second explanation consistent with our finding of more employee whistle-blowing in the health care industry comes from Bowen, Call, and Rajgopal(2007). Bowen, Call, and Rajgopal find that employee whistleblowing is morelikely in firms in “sensitive” industries, which the authors define as includ-ing pharmaceuticals, health care, medicine, the environment, oil, utilities, andbanks. Not surprisingly, these are regulated industries. To ensure that our re-sults come from monetary incentives and not from heightened moral sensitivityin these regulated industries, we set up a simple logit framework in which weestimate the probability that the whistleblower is an employee as a function ofthe industry. The results are presented in Panel C of Table IX.
Column 1 reproduces a test similar to the proportion test, including only thehealth care dummy as a predictor of employee whistleblowing. The marginaleffects reported suggest that among our fraud-committing firms, those in thehealth care industry have 0.271 higher probability of having an employee as thewhistleblower. The second column captures the “sensitivity” of the industry byincluding a dummy variable for regulated industries, defined by the SIC codeslisted in Table I. We do not find any statistical evidence that employees inregulated industries are more likely to be whistleblowers.
A third possibility is that the health care industry might have a flatter or-ganizational structure so that employees are more likely to observe executives’actions and become informed of a fraud if it occurs.27 To address this concern,we obtain Rajan and Wulf’s (2006) measure of depth (verticality) of hierarchies
26 Bowen et al. (2007) provide a more extended discussion of this issue and related literature.27 We thank an anonymous referee for this suggestion.
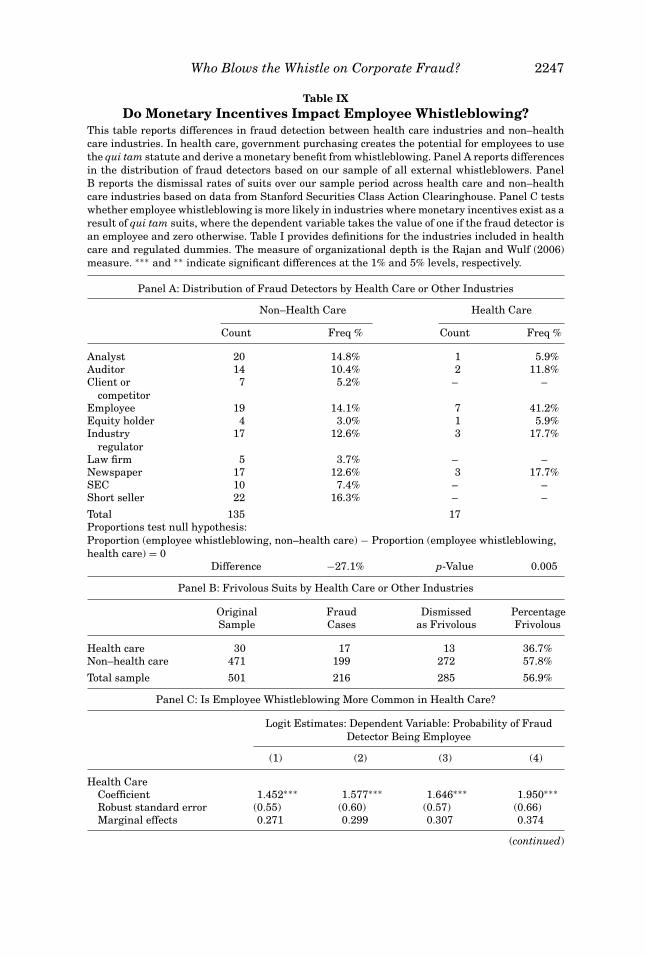
Who Blows the Whistle on Corporate Fraud? 2247
Table IXDo Monetary Incentives Impact Employee Whistleblowing?
This table reports differences in fraud detection between health care industries and non–healthcare industries. In health care, government purchasing creates the potential for employees to usethe qui tam statute and derive a monetary benefit from whistleblowing. Panel A reports differencesin the distribution of fraud detectors based on our sample of all external whistleblowers. PanelB reports the dismissal rates of suits over our sample period across health care and non–healthcare industries based on data from Stanford Securities Class Action Clearinghouse. Panel C testswhether employee whistleblowing is more likely in industries where monetary incentives exist as aresult of qui tam suits, where the dependent variable takes the value of one if the fraud detector isan employee and zero otherwise. Table I provides definitions for the industries included in healthcare and regulated dummies. The measure of organizational depth is the Rajan and Wulf (2006)measure. ∗∗∗ and ∗∗ indicate significant differences at the 1% and 5% levels, respectively.
Panel A: Distribution of Fraud Detectors by Health Care or Other Industries
Non–Health Care Health Care
Count Freq % Count Freq %
Analyst 20 14.8% 1 5.9%Auditor 14 10.4% 2 11.8%Client or
competitor7 5.2% – –
Employee 19 14.1% 7 41.2%Equity holder 4 3.0% 1 5.9%Industry
regulator17 12.6% 3 17.7%
Law firm 5 3.7% – –Newspaper 17 12.6% 3 17.7%SEC 10 7.4% – –Short seller 22 16.3% – –
Total 135 17Proportions test null hypothesis:Proportion (employee whistleblowing, non–health care) − Proportion (employee whistleblowing,health care) = 0
Difference −27.1% p-Value 0.005
Panel B: Frivolous Suits by Health Care or Other Industries
Original Fraud Dismissed PercentageSample Cases as Frivolous Frivolous
Health care 30 17 13 36.7%Non–health care 471 199 272 57.8%
Total sample 501 216 285 56.9%
Panel C: Is Employee Whistleblowing More Common in Health Care?
Logit Estimates: Dependent Variable: Probability of FraudDetector Being Employee
(1) (2) (3) (4)
Health CareCoefficient 1.452∗∗∗ 1.577∗∗∗ 1.646∗∗∗ 1.950∗∗∗Robust standard error (0.55) (0.60) (0.57) (0.66)Marginal effects 0.271 0.299 0.307 0.374
(continued)
2248 The Journal of Finance R©
Table IX—Continued
Panel C: Is Employee Whistleblowing More Common in Health Care?
Logit Estimates: Dependent Variable: Probability of FraudDetector Being Employee
(1) (2) (3) (4)
RegulatedCoefficient −0.269 −0.591Robust standard error (0.482) (0.53)Marginal effects n/sig n/sig
Industry Organizational DepthCoefficient −1.210∗∗ −1.467∗∗∗Robust standard error (0.52) (0.56)Marginal effects −0.157 −0.187
Observations 152 152 152 152Pseudo R2 0.046 0.048 0.071 0.080
by industry. When we insert this measure in the regression (column 3), we findthat, indeed, more vertical hierarchies are less likely to have employees blowingthe whistle. But this effect does not change the magnitude and significance ofthe health care dummy, increasing our confidence that the monetary incentivesavailable in health care drive this result. Finally, in column 4 we include boththe regulated and the industry organization depth measures, again finding asignificant effect for health care.28
C.6. Summary
Overall, our analysis of whistleblowers’ incentives suggests that positivereputational and career incentives tend to be weak, except for journalists. Forthis category, however, the incentives exist only for very large frauds in well-known companies. We cannot expect the media to act as an effective monitorin smaller companies and for smaller and more technical violations. Monetaryincentives seem to work well, without the negative side effects often attributedto them, but they are limited to a very specific set of cases. By contrast, weidentify significant costs of whistleblowing for employees. Before drawing anyconclusions on what could be done to improve fraud detection, it is interestingto examine how the pattern of whistleblowing has responded to the variousregulatory changes to incentives that followed the Enron scandal.
D. Impact of Regulatory Changes on Incentives
Thus far we have considered the whole period 1996 to 2004 as homogenous.But there have been a number of regulatory changes leading up to and followingthe Enron and WorldCom scandals. In 2000, Regulation Fair Disclosure was
28 These findings are also robust to the use of various controls for characteristics of the fraud.
Who Blows the Whistle on Corporate Fraud? 2249
approved, making it impossible for analysts to have private conversations withthe top executives of the firms they follow. According to the proponents of thismeasure, this change should have increased analysts’ independence, makingthem more likely to reveal fraud. Opponents, in contrast, argued that thischange could reduce analysts’ incentives to search for information, makingthem less likely to reveal fraud. In late 2001 and early 2002, the Enron scandaland the collapse of Arthur Andersen increased the risk faced by auditors andthus their incentives to speak up.
In July 2002, the Sarbanes-Oxley Act was passed, introducing a vast array ofchanges. SOX made SEC involvement more politically appealing by providingthat SEC civil penalties be used to compensate investors who were victims ofsecurities fraud. It also made SEC involvement more feasible by significantlyincreasing its budget. SOX dramatically changed auditors’ incentives by intro-ducing a ban on consulting work done by audit firms; by requiring that thehiring and firing of auditors be a decision of the audit committee, which isnow required to be composed only of independent directors; and by introducingSection 404, which enhances the monitoring of internal control systems.
SOX also altered the cost of whistleblowing for employees. Section 301 re-quires audit committees of publicly traded companies to establish proceduresfor “the confidential anonymous submission by employees of the issuer of con-cerns regarding questionable accounting or auditing matters.” It also enhancesprotections for employees against being fired for coming forward with suchinformation. Finally, in April 2003, the New York Attorney General reached asettlement with 10 of the nation’s top investment firms aimed at promoting theindependence of equity research. If this Global Research Settlement achievedits goal, the analysts should have become more independent and thus active inrevealing fraud.
Since all of these changes took place almost simultaneously, it is impossi-ble to separate the effect of each of them. However, it is possible to examinewhether the relative frequency of the different types of whistleblowers changedaccording to the net changes in their relative incentives.
Table X reports the frequency of the different types of whistleblowers beforeand after SOX (which we take as the middle point of all these changes). Thebiggest change is for auditors. Prior to SOX, auditors accounted for just 6% ofthe cases detected by external actors, and they focused exclusively on fraudsrequiring financial restatements. Post-SOX, they account for 24% of cases, andtheir activity is spread across not only financial restatement cases, but alsothose not involving restatements. One possible explanation for this broaderscope is auditors’ increased exposure to liability for a firm’s fraudulent activity.Another is that auditors have become more aware of fraudulent activity as aresult of their responsibility in evaluating internal controls per SOX Section404. A third explanation is that auditors have become more sensitive to share-holders’ needs because independent directors on the audit committee appointedthem. Our data do not allow us to distinguish among these interpretations.
We do not observe much change in the role of analysts, while there is a surgein SEC interventions, which go from a mere 5% of the cases to 10%, although
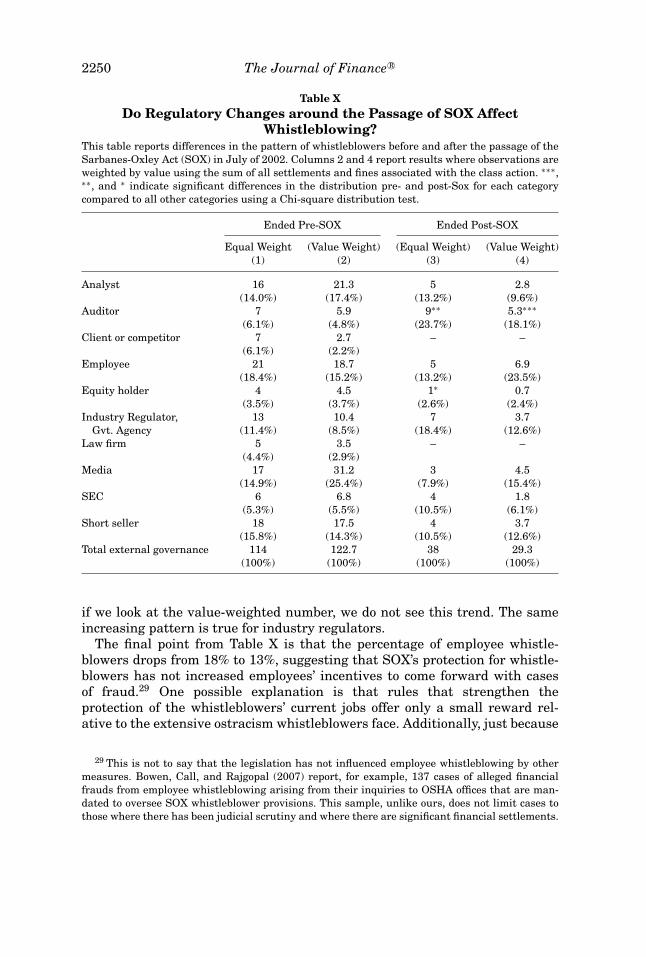
2250 The Journal of Finance R©
Table XDo Regulatory Changes around the Passage of SOX Affect
Whistleblowing?This table reports differences in the pattern of whistleblowers before and after the passage of theSarbanes-Oxley Act (SOX) in July of 2002. Columns 2 and 4 report results where observations areweighted by value using the sum of all settlements and fines associated with the class action. ∗∗∗,∗∗, and ∗ indicate significant differences in the distribution pre- and post-Sox for each categorycompared to all other categories using a Chi-square distribution test.
Ended Pre-SOX Ended Post-SOX
Equal Weight (Value Weight) (Equal Weight) (Value Weight)(1) (2) (3) (4)
Analyst 16 21.3 5 2.8(14.0%) (17.4%) (13.2%) (9.6%)
Auditor 7 5.9 9∗∗ 5.3∗∗∗(6.1%) (4.8%) (23.7%) (18.1%)
Client or competitor 7 2.7 – –(6.1%) (2.2%)
Employee 21 18.7 5 6.9(18.4%) (15.2%) (13.2%) (23.5%)
Equity holder 4 4.5 1∗ 0.7(3.5%) (3.7%) (2.6%) (2.4%)
Industry Regulator, 13 10.4 7 3.7Gvt. Agency (11.4%) (8.5%) (18.4%) (12.6%)
Law firm 5 3.5 – –(4.4%) (2.9%)
Media 17 31.2 3 4.5(14.9%) (25.4%) (7.9%) (15.4%)
SEC 6 6.8 4 1.8(5.3%) (5.5%) (10.5%) (6.1%)
Short seller 18 17.5 4 3.7(15.8%) (14.3%) (10.5%) (12.6%)
Total external governance 114 122.7 38 29.3(100%) (100%) (100%) (100%)
if we look at the value-weighted number, we do not see this trend. The sameincreasing pattern is true for industry regulators.
The final point from Table X is that the percentage of employee whistle-blowers drops from 18% to 13%, suggesting that SOX’s protection for whistle-blowers has not increased employees’ incentives to come forward with casesof fraud.29 One possible explanation is that rules that strengthen theprotection of the whistleblowers’ current jobs offer only a small reward rel-ative to the extensive ostracism whistleblowers face. Additionally, just because
29 This is not to say that the legislation has not influenced employee whistleblowing by othermeasures. Bowen, Call, and Rajgopal (2007) report, for example, 137 cases of alleged financialfrauds from employee whistleblowing arising from their inquiries to OSHA offices that are man-dated to oversee SOX whistleblower provisions. This sample, unlike ours, does not limit cases tothose where there has been judicial scrutiny and where there are significant financial settlements.
Who Blows the Whistle on Corporate Fraud? 2251
jobs are protected does not mean that career advancements in the firm are notimpacted by whistleblowing. Another explanation could be that job protectionis of no use if the firm goes bankrupt after the revelation of fraud. Given thelimited amount of time since the regulatory changes in our sample, we cannottell whether these changes in the patterns of whistleblowing are permanent orhave temporarily crowded out the oversight of other actors.
III. Conclusions
The main result emerging from our analysis is that in the United States,fraud detection relies on a wide range of (often improbable) actors. No singleone of them accounts for more than 20% of the cases detected. These findingssuggest that to improve corporate governance abroad one needs to adopt abroader view than that implied by the legal or private litigation approaches tocorporate governance, that is, it is insufficient to replicate U.S. institutions ofprivate enforcement such as class action suits or of public enforcement suchas the SEC (together they account for only 10% of the frauds detected byexternal actors). Rather, the United States relies on a complex web of marketactors that complement each other. Unfortunately, reproducing such a complexsystem abroad is much more difficult than copying a single legal institution.
The second main result is that the incentives for the existing network ofwhistleblowers are weak. Auditors, analysts, and employees do not seem to gainmuch and, in the cases of employees, seem to lose outright from whistleblowing.The two notable exceptions regarding who benefits from whistleblowing arejournalists involved in large cases and employees who have access to a qui tamsuit.
A natural implication of our findings is that the role of monetary incentivesshould be expanded. We find that the use of monetary rewards provides posi-tive incentives for whistleblowing. As the evidence in the health care industryshows, such a system appears to be able to be fashioned in a way that does notlead to an excessive amount of frivolous suits. The idea of extending the qui tamstatute to corporate frauds (i.e., providing a financial award to those who bringforward information about a corporate fraud) is very much in the Hayekianspirit of sharpening the incentives of those who are endowed with information.This proposal is consistent with a recent IRS move, which instituted a form ofqui tam statute for whistleblowers in tax evasion cases.
REFERENCESBergman, Nittai, and Dirk Jenter, 2007, Employee sentiment and stock option compensation,
Journal of Financial Economics 84, 667–712.Black, Bernard, 2001, The legal and institutional preconditions for strong securities markets,
UCLA Law Review 48, 781–855.Bowen, Robert, Andrew Call, and Shiva Rajgopal, 2007, Whistle-blowing: Target firm characteris-
tics and economic consequences, Working Paper, University of Washington.Brickey, Kathleen F., 2004, Anderson’s fall from grace, Washington University Law Quarterly, 81,
917–960.
2252 The Journal of Finance R©
Burns, Natasha, and Simi Kedia, 2006, The impact of performance-based compensation on misre-porting, Journal of Financial Economics 79, 35–67.
Chen, Ken Y., and Jian Zhou, 2007, Audit committee, board characteristics and auditor switchdecisions by Andersen’s clients, Contemporary Accounting Research 24, 1085–1117.
Choi, Stephen J., 2007, Do the merits matter less after the Private Securities Litigation ReformAct? Journal of Law, Economics and Organization 23, 598–626.
Choi, Stephen J., Karen K. Nelson, and Adam C. Pritchard, 2008, The screening effect of theSecurities Litigation Reform Act, Journal of Empirical Legal Studies 6, 35–68.
Coffee, John C., 1986, Understanding the plaintiff’s attorney: The implications of economic theoryfor private enforcement of law through class and derivative actions, Columbia Law Review 86,669–727.
Coffee, John C., 2001, The acquiescent gatekeeper: Reputational intermediaries, auditor indepen-dence and the governance of accounting, Columbia Law and Economics Working paper No.191.
Coffee, John C., 2003, The attorney as gatekeeper: An agenda for the SEC, Columbia Law andEconomics Working Paper No. 221.
Diamond, Douglas, and Robert Verrecchia, 1987, Constraints on short-selling and asset priceadjustment to private information, Journal of Financial Economics 18, 277–311.
Dyck, Alexander, and Luigi Zingales, 2003, Media and asset prices, Working paper Chicago Booth.Efendi, Jap, Anup Srivastava, and Edward Swanson, 2007, Why do corporate managers misstate
financial statements? The role of in-the-money options and other incentives, Journal of Finan-cial Economics 85, 667–708.
Fama, Eugene, 1980, Agency problems and the theory of the firm, Journal of Political Economy88, 288–307.
Fama, Eugene, 1990, Contract costs and financing decisions, Journal of Business 63, S71–S91.Fama, Eugene, and Michael Jensen, 1983a, Separation of ownership and control, Journal of Law
and Economics 26, 301–325.Fama, Eugene, and Michael Jensen, 1983b, Agency problems and residual claims, Journal of Law
and Economics 26, 327–349.Fuerman, Ross D., 2006, Comparing the auditor quality of Arthur Andersen to that of the “Big 4,”
Accounting and the Public Interest 6, 135–161.Griffin, Paula, Joseph Grundfest, and Michael Perino, 2001, Stock price response to news of secu-
rities fraud litigation: Market efficiency and the slow diffusion of costly information, StanfordLaw and Economics Olin Working paper No. 208.
Grundfest, Joseph A., 1995, Why disimply? Harvard Law Review 108, 740–741.Hayek, Friedrich, 1945, The use of knowledge in society, American Economic Review 34, 519–530.Heron, Randall A., and Erik Lie, 2007, Does backdating explain the stock price pattern around
executive stock option grants? Journal of Financial Economics 83, 271–295.Hong, Harrison, and Jeffrey D. Kubik, 2003, Analyzing the analysts: Career concerns and biased
earnings forecasts, Journal of Finance 58, 313–351.Jakubowski, Stephen T., Patricia Broce, Joseph Stone, and Carolyn Conner, 2002, S 82’s effects on
fraud discovery, CPA Journal 72, 42–47.Johnson, Marilyn F., Karen K. Nelson, and Adam C. Pritchard, 2007, Do the merits matter more?
Class actions under the Private Securities Litigation Reform Act, Journal of Law, Economics,and Organization 23, 627–652.
Karpoff, Jonathan, D. Scott Lee, and Gerald S. Martin, 2008a, The costs to firms of cooking thebooks, Journal of Financial and Quantitative Analysis 43, 581–612.
Karpoff, Jonathan, D. Scott Lee, and Gerald S. Martin, 2008b, The consequences to managers forcooking the books, Journal of Financial Economics 88, 193–215.
Karpoff, Jonathan, and Xiaoxia Lou, 2008, Do short sellers detect overpriced firms? Evidence fromSEC enforcement actions, Working Paper, University of Washington.
La Porta, Rafael, Florencio Lopez-de-Silanes, and Andrei Shleifer, 2006, What works in securitieslaws? Journal of Finance 61, 1–33.
Lamont, Owen, 2003, Go down fighting: Short sellers versus firms, NBER Working Paper #10659.Lie, Erik, 2005, On the timing of CEO stock option awards, Management Science 51, 802–810.
Who Blows the Whistle on Corporate Fraud? 2253
Lott, Derek Loosvelt, William Jarvis, and the staff of Vault, 2007, Vault Career Guide to InvestmentBanking (Vault, Inc., New York).
Michaely, Roni, and Kent L. Womack, 1999, Conflict of interest and the credibility of underwriteranalyst recommendations, Review of Financial Studies 12, 653–686.
Miller, Gregory S., 2006, The press as a watchdog for accounting fraud, Journal of AccountingResearch 44, 1001–1033.
Palmrose, Zoe-Vonna, and Susan W. Scholz, 2004, The circumstances and legal consequences ofnon-GAAP reporting: Evidence from restatements, Contemporary Accounting Research 21,139–180.
Rajan, Raghuram, and Julie Wulf, 2006, The flattening firm: Evidence from panel data on thechanging nature of corporate hierarchies, Review of Economics and Statistics 88, 759–773.
Richardson, Scott, A. Irem Tuna, and Min Wu, 2002, Predicting earnings management: The caseof earnings restatements, SSRN Working Paper #338681.
Scharfstein, David, and Jeremy Stein, 1990, Herd behavior and investment, American EconomicReview 80, 465–480.
Taub, Stephen, 2005, The auditor-investor expectation gap, CFO.com, October 17, 2005.Thompson, Robert, and Hillary Sale, 2003, Securities fraud as corporate governance: Reflections
upon federalism, Vanderbilt Law Review 56, 859–910.Winston, Clifford, 1998, U.S. industry adjustment to economic deregulation, Journal of Economic
Perspectives 12, 89–110.
Top Related