


Languages
Pages
Legal


1
WHITEWAVE FOODS REPORTS FOURTH QUARTER AND FULL YEAR 2016 RESULTS
Reported Net Sales Increased 3% & Adjusted Constant Currency Net Sales Increased 4% in Q4 2016
Reported Net Sales & Adjusted Constant Currency Net Sales Both Increased 9% in Full Year 2016
Reported Diluted Earnings Per Share Increased 30% to $0.34 in Q4 2016; Adjusted Constant Currency Diluted Earnings
per Share Increased 13% to $0.40, Excluding China Joint Venture Investments in Q4 2016
Reported Diluted Earnings Per Share Increased 26% to $1.18 in Full Year 2016; Adjusted Constant Currency Diluted
Earnings per Share Increased 19% to $1.42, Excluding China Joint Venture Investments in Full Year 2016
DENVER, Colo. – February 16, 2017 – The WhiteWave Foods Company (NYSE: WWAV) today reported financial
results for the fourth quarter and year ended December 31, 2016.
Financial Summary: Three Months Ended December 31, Year Ended December 31,
In millions, except EPS 2016 2015 % Change* 2016 2015 % Change*
Total Net Sales
Reported $1,055 $1,028 +3% $4,198 $3,866 +9%
Adjusted $1,055 $1,028 +3% $4,198 $3,867 +9%
Adjusted Constant Currency $1,066 $1,028 +4% $4,228 $3,867 +9%
Adjusted Organic Constant Currency $1,062 $1,028 +3% $4,071 $3,867 +5%
Total Operating Income
Reported $108 $92 +17% $402 $332 +21%
Adjusted $112 $114 -1% $423 $375 +13%
Adjusted Constant Currency $118 $114 +4% $440 $375 +17%
Net Income
Reported $62 $48 +30% $215 $168 +27%
Adjusted $66 $62 +7% $234 $201 +16%
Adjusted, excluding China J.V. $69 $65 +7% $245 $214 +14%
Diluted Earnings per Share (EPS)
Reported $0.34 $0.26 +30% $1.18 $0.94 +26%
Adjusted $0.36 $0.34 +6% $1.29 $1.12 +16%
Adjusted, excluding China J.V. $0.38 $0.36 +6% $1.35 $1.19 +14%
Adj. Constant Currency, excluding China J.V. $0.40 $0.36 +13% $1.42 $1.19 +19%
EBITDA
Adjusted $150 $149 +1% $582 $508 +15%
Adjusted, excluding China J.V. $154 $152 +1% $594 $522 +14%
Adj. Constant Currency, excluding China J.V. $160 $152 +5% $611 $522 +17%
*Certain change percentages may not recalculate using the rounded dollar amounts provided
WhiteWave’s fourth quarter 2016 reported diluted earnings per share was $0.34 and adjusted diluted earnings per
share was $0.38, excluding investments in its China joint venture. Including joint venture investments, WhiteWave
reported fourth quarter 2016 adjusted diluted earnings per share of $0.36. Full year 2016 reported diluted earnings per
share was $1.18 and adjusted diluted earnings per share was $1.35, excluding investments in its China joint venture.
Including joint venture investments, WhiteWave reported full year 2016 adjusted diluted earnings per share of $1.29.
Fourth quarter 2016 net sales were $1.1 billion, a 3 percent increase from net sales of $1.0 billion in fourth quarter 2015.
On a constant currency basis, net sales increased 4 percent in fourth quarter 2016 from fourth quarter 2015, with

2
acquisitions contributing approximately 1 percentage point of the increase. Excluding Fresh Foods platform sales,
fourth quarter 2016 constant currency net sales increased 5 percent from fourth quarter 2015, with acquisitions
contributing approximately 1 percentage point of the increase.
Full year 2016 net sales were $4.2 billion, a 9 percent increase from net sales of $3.9 billion in full year 2015. On a
constant currency basis, net sales increased 9 percent in full year 2016 from adjusted net sales in full year 2015, with
acquisitions contributing approximately 4 percentage points of the increase. Excluding Fresh Foods platform sales, full
year 2016 constant currency net sales increased 12 percent from full year 2015, with acquisitions contributing
approximately 5 percentage points of the increase. Net sales in 2016 were driven by organic growth and contributions
from acquisitions and partially offset by unfavorable currency translations and lower sales in the Fresh Foods
platform.
Reported operating income in fourth quarter 2016 increased 17 percent to $108 million and decreased 1 percent on an
adjusted basis to $112 million, compared to fourth quarter 2015. Full year 2016 reported operating income increased 21
percent to $402 million and increased 13 percent on an adjusted basis to $423 million, compared to full year 2015. On a
constant currency basis, adjusted operating income increased 4 percent in fourth quarter 2016 and increased 17 percent
in full year 2016, over the same periods in 2015.
Financial results reflect operating difficulties experienced in the Fresh Foods platform that totaled approximately $25
million of additional costs during fourth quarter 2016. The cost increase was driven by elevated supply chain costs and
lower than planned sales volumes that led to excess supply of organic leafy greens and produce. This resulted in lower
realized net sales and higher costs, since the majority of organic supply is procured externally under fixed
arrangements during the winter season.
“We are pleased with the overall financial results our broad portfolio delivered in 2016, with continued strong growth
in our coffee creamers and beverages and diversified plant-based product portfolios in the Americas and Europe. Our
Fresh Foods platform, however, continues to struggle with the after effects of our fourth quarter 2015 SAP
implementation, and improving Fresh Foods performance is a key focus area,” said Gregg Engles, chairman and chief
executive officer. “Our teams are focused on delivering even stronger results in 2017, while we continue to work
toward closing our pending merger with Danone. We remain confident in the underlying strength of our market-
leading brands positioned in on-trend and growing categories, and continue to believe our pending merger with
Danone will create the perfect strategic alliance to maximize the long-term global growth of our brands and optimize
the profit potential of WhiteWave’s businesses.”

3
AMERICAS FOODS & BEVERAGES SEGMENT
WhiteWave’s Americas Foods & Beverages segment consists of four platforms: Plant-based Foods and Beverages,
Fresh Foods, Premium Dairy, and Coffee Creamers and Beverages. Fourth quarter 2016 net sales for Americas Foods &
Beverages were $917 million, an increase of 3 percent compared to fourth quarter 2015. On a constant currency basis,
segment net sales increased 3 percent in fourth quarter 2016 from fourth quarter 2015, with acquisitions contributing
approximately 1 percentage point of the increase. Excluding Fresh Foods platform sales, fourth quarter 2016 constant
currency segment net sales increased 3 percent from fourth quarter 2015.
Full year 2016 segment net sales were $3.6 billion, an increase of 9 percent compared to full year 2015. On a constant
currency basis, segment net sales increased 9 percent in full year 2016 from full year 2015 adjusted net sales, with
acquisitions contributing approximately 5 percentage points of the increase. Excluding Fresh Foods platform sales,
constant currency segment net sales increased 11 percent in full year 2016 from full year 2015, with acquisitions
contributing approximately 6 percentage points of the increase.
Reported segment operating income increased 24 percent in fourth quarter 2016 and increased 22 percent in full year
2016, over the same periods in 2015. On an adjusted basis, segment operating income decreased 1 percent in fourth
quarter 2016 and increased 14 percent in full year 2016, over the same periods in 2015. Segment operating results were
impacted by operational challenges in the Fresh Foods platform that resulted in approximately $25 million of higher
costs during fourth quarter 2016 related to elevated supply chain and other higher costs due to an excess supply of
organic leafy greens and produce.
Americas Foods & Beverages Segment Summary
In millions Three Months Ended December 31, Year Ended December 31,
2016 2015 % Change* 2016 2015 % Change*
Reported Net Sales $917 $893 +3% $3,620 $3,334 +9%
Adjusted Net Sales $917 $893 +3% $3,620 $3,334 +9%
Adjusted Constant Currency Net Sales $917 $893 +3% $3,623 $3,334 +9%
Adj. Organic Constant Currency Net Sales $913 $833 +2% $3,467 $3,133 +4%
Reported Segment Operating Income $117 $94 +24% $438 $359 +22%
Adj. Segment Operating Income $113 $114 -1% $439 $387 +14%
Adj. Constant Currency Segment Op. Inc. $113 $114 -1% $440 $387 +14% *Certain change percentages may not recalculate using the rounded dollar amounts provided
Plant-based Foods and Beverages
The Americas Plant-based Foods and Beverages platform includes Silk® beverages and yogurts, So Delicious®
beverages, frozen desserts and yogurts, and Vega® nutritional products. Platform net sales increased 3 percent in
fourth quarter 2016 and increased 16 percent in full year 2016, over the same periods in 2015.
Platform net sales in fourth quarter 2016 were driven by continued robust growth in plant-based yogurts and
nutritional products. Plant-based beverages sales and market share performance were pressured in fourth quarter due

4
to the continued effects from a third quarter 2016 Silk packaging design change that impacted shelf presence and
brand shoppability, and reduced levels of marketing investments. New Silk packaging began shipping in late fourth
quarter 2016, with a complete shelf set transition expected by the end of first quarter 2017. WhiteWave launched new
Silk brand marketing in early 2017 supporting its new beverage packaging, recent beverage innovations and plant-
based yogurts.
Growth in WhiteWave’s collective plant-based categories remained robust, increasing 11 percent in fourth quarter
2016. Nut-based beverages grew 9 percent, frozen desserts and novelties increased 48 percent, yogurts grew 60 percent
and nutritionals were up over 90 percent in fourth quarter 2016. WhiteWave continues to be the leader across all plant-
based categories in which it participates.
WhiteWave recently introduced new plant-based innovations including Silk protein-enhanced nut-based milks and
large size bottles, almond-based yogurts and Vega ready-to-drink nutritional shakes and protein bars. WhiteWave’s
2017 innovation plans include additional frozen dessert items, as well as entry into new plant-based categories.
Fresh Foods
The Fresh Foods platform consists of the Earthbound Farm® brand, which includes organic salads, fruits and
vegetables. Platform net sales declined 1 percent in fourth quarter 2016 from fourth quarter 2015 and declined 4
percent in full year 2016 from full year 2015 net sales. Sales declines in 2016 were primarily the result of lower
distribution levels following shipping, customer service and other business disruptions experienced since fourth
quarter 2015 related to an initial installation of SAP. The organic packaged salad category continued to grow in fourth
quarter 2016, increasing 7 percent excluding the Earthbound Farm brand.
Premium Dairy
The Premium Dairy platform includes Horizon Organic® milk and dairy products, macaroni and cheese, and snacks,
and Wallaby® organic yogurts and kefir beverages. Platform net sales decreased 1 percent in fourth quarter 2016 and
increased 7 percent in full year 2016, over the same periods in 2015. Sales of organic fluid milk were essentially flat in
fourth quarter 2016, compared to fourth quarter 2015, and in line with management expectations. The organic milk
category continues to experience excess supply and historically high price gaps to conventional milk. The balance of
platform sales performance in fourth quarter 2016 was impacted by difficult distribution overlaps in organic yogurts
from prior year and a significant increase in the number of products and participants in the organic and better-for-you
meals and snack categories from the prior year.

5
WhiteWave continues to build distribution of Sir BananasTM bananamilks including the launch of new single-serve
products, and plans to roll-out new innovations in value-added milks, yogurts and snacks over the balance of 2017.
Coffee Creamers and Beverages
The Coffee Creamers and Beverages platform includes coffee creamers and ready-to-drink beverages under the
International Delight®, Dunkin Donuts®, Silk and So Delicious brands, as well as half-and-half dairy creamers under
the LAND O LAKES® and Horizon Organic brands. Platform net sales increased 7 percent in fourth quarter 2016 and
10 percent in full year 2016, over the same periods in 2015.
Robust topline growth was driven by volume increases and strong sales performance across WhiteWave’s broad
portfolio of flavored creamers, plant-based creamers, half-and-half dairy creamers, and iced coffee beverages.
Continued distribution expansion and velocity increases drove strong market share performance in WhiteWave’s
coffee creamers in fourth quarter 2016.
Platform innovations continue to perform well, including Simply Pure® all-natural creamers, StōkTM cold-brew iced
coffee beverages and International Delight larger-size package offerings. WhiteWave recently launched International
Delight One Touch Latte, a self-frothing creamer that turns a cup of coffee into a delicious latte within seconds with
the press of a button.
EUROPE FOODS & BEVERAGES SEGMENT
The Europe Foods & Beverages segment consists of plant-based foods and beverages that are sold primarily under the
Alpro® brand. Segment net sales increased 3 percent on a reported basis and 11 percent on a constant currency basis in
fourth quarter 2016, compared to fourth quarter 2015. Full year 2016 segment net sales increased 9 percent on a
reported basis and 13 percent on a constant currency basis, compared to full year 2015. Increased segment net sales
were driven by strong growth across the portfolio of beverages, plant-based yogurts and culinary products, including
recent innovations. Growth in the segment continues to be primarily volume based. The Europe plant-based category
continued to grow at double-digit rates in 2016.
Reported segment operating income decreased 7 percent in fourth quarter 2016 and increased 2 percent in full year
2016, compared to prior year periods due to currency translation. On a constant currency basis, segment operating
income increased 27 percent in fourth quarter 2016 and increased 25 percent for full year 2016, over the same periods
in 2015. Constant currency segment operating margin increased over 130 basis points in full year 2016, driven by
continued scale leverage, favorable sales mix, increased internal production levels and other operating efficiencies

6
after increased depreciation levels and additional supply chain transition costs related to ongoing capacity expansion
projects.
Europe Foods & Beverages Segment Summary
In millions Three Months Ended December 31, Year Ended December 31,
2016 2015 % Change* 2016 2015 % Change*
Reported Net Sales $138 $134 +3% $578 $532 +9%
Constant Currency Net Sales $149 $134 +11% $604 $532 +13%
Reported Segment Operating Income $16 $17 -7% $69 $68 +2%
Adjusted Segment Operating Income $16 $18 -8% $69 $68 +2%
Adj. Constant Currency Segment Op. Inc. $22 $18 +27% $85 $68 +25% *Certain change percentages may not recalculate using the rounded dollar amounts provided
“We were able to deliver solid operating performance in 2016, despite the operational issues we faced in our Fresh
Foods platform, executional challenges with our Silk beverages, and lower than planned levels of marketing
investments during the year,” said Blaine McPeak, executive vice president and chief operating officer. “We are
applying the appropriate resources and taking the right actions to improve the performance of our businesses and
brands throughout 2017. The issues we began experiencing in our Americas plant-based beverages after the packaging
change last year are showing signs of stabilization, and we are executing plans to build on that positive momentum.
This includes rolling out revised Silk packaging and launching new marketing campaigns, along with exciting new
category innovations. We look forward to completing our upcoming partnership with Danone and leveraging the
global resources and capabilities this combination will provide to further accelerate all our growth plans and
initiatives.”
FORWARD OUTLOOK
WhiteWave is not providing operating or financial guidance for 2017 due to its pending merger with Danone S.A.
OTHER ITEMS
Danone Merger
Danone S.A. and WhiteWave entered into a definitive merger agreement on July 6, 2016, under which Danone will
acquire WhiteWave for $56.25 per share in an all-cash transaction, representing a total enterprise value of
approximately $12.5 billion, including debt and other WhiteWave liabilities. The closing of the merger is subject to the
satisfaction of customary conditions, including the expiration or termination of all applicable waiting periods under
the Hart-Scott-Rodino Antitrust Improvements Act (“HSR Act”). The United States Department of Justice (“DOJ”)
continues to review the merger under the HSR Act. As we previously announced and in accordance with the merger
agreement, WhiteWave and Danone elected on January 6, 2017 to extend the long stop date by 90 days to facilitate the
completion of the DOJ’s review. We are targeting completion of the merger in first quarter 2017, although there can be
no assurance regarding timing of completion of regulatory processes.

7
CONFERENCE CALL
WhiteWave is not hosting a fourth quarter and full year 2016 management conference call or webcast due to its
pending merger with Danone S.A.
ABOUT THE WHITEWAVE FOODS COMPANY
The WhiteWave Foods Company is a leading consumer packaged food and beverage company that manufactures,
markets and sells branded plant-based foods and beverages, coffee creamers and beverages, premium dairy products
and organic produce. It sells products primarily in North America, Europe and through a joint venture in China.
WhiteWave is focused on providing consumers with innovative, great-tasting food and beverage choices that meet
their increasing desires for nutritious, flavorful, convenient, and responsibly-produced products. The Company's
widely-recognized, leading brands distributed in North America include Silk®, So Delicious® and Vega® plant-based
foods and beverages, International Delight® and LAND O LAKES®* coffee creamers and beverages, Horizon
Organic® and Wallaby Organic® premium dairy products and Earthbound Farm® organic salads, fruits and
vegetables. Its popular plant-based foods and beverages brands in Europe include Alpro® and Provamel®. To learn
more about WhiteWave, visit www.whitewave.com.
*The LAND O LAKES brand is owned by Land O’Lakes, Inc. and is used by license.
FORWARD-LOOKING STATEMENTS
Some of the statements in this press release are “forward-looking” and are made pursuant to the safe harbor provision
of the Private Securities Litigation Reform Act of 1995. These “forward-looking” statements include statements
relating to, among other things, projections of net sales, the expected timeline for the completion of our merger with
Danone S.A., our innovation and marketing plans, the success of our cost improvement and margin expansion
initiatives, anticipated profit growth and margin expansion, the expected growth and financial impact of IPP, Vega,
Wallaby and other business acquisitions, the expected financial impact of our investments in our joint venture in
China, and other statements that begin with words such as “believe,” “expect,” “estimates,” “intend,” “forecasts,”
“projects” or “anticipate.” These statements involve risks and uncertainties that may cause results to differ materially
from the statements set forth in this press release. Completion of our contemplated merger with Danone S.A. is subject
to the satisfaction of certain closing conditions, including receipt of required regulatory approvals, and we cannot be
certain that we will be able to satisfy or obtain a waiver of the conditions. The company’s operating results depend on
a variety of economic, competitive, and governmental factors, including raw material availability and costs, the
demand for the company’s products, the success and timing of actions to strengthen our Fresh Foods and Plant-based
Foods and Beverages platforms after challenges in the second half of 2016, the company’s ability to access capital
under its credit facilities or otherwise, the timing of the completion of our contemplated merger with Danone S.A., the
disruption to our business caused by the contemplated merger and the risk of stockholder litigation relating to the

8
contemplated merger, many of which are beyond the company’s control and which are described in the company’s
2015 Annual Report on Form 10-K filed with the Securities and Exchange Commission on February 29, 2016 and in our
quarterly reports on Form 10-Q. The company’s ability to profit from its branding initiatives depends on a number of
factors, including consumer acceptance of the company’s products and successful packaging redesign plans. Our
growth plans depend, in part, on our ability to innovate successfully and on a cost-effective basis. Any forward-
looking statements in this press release speak only as of the date of this release. The company expressly disclaims any
obligation or undertaking to release publicly any updates or revisions to such statements to reflect any change in its
expectations with regard thereto or any changes in the events, conditions or circumstances on which any such
statement is based.
EXPLANATION OF NON-GAAP FINANCIAL MEASURES
In addition to the results prepared in accordance with GAAP, we have presented certain non-GAAP financial
measures, including adjusted financial information for the periods presented, such as net sales, operating income,
EBITDA, net income and diluted earnings per share. We present these non-GAAP measures in order to facilitate
meaningful evaluation of our operating performance across periods. These adjustments eliminate certain costs and
benefits, including corporate costs associated with equity awards granted to certain of our executive officers,
employees and directors in conjunction with the company’s initial public offering in October 2012 (the “IPO Grants”);
non-recurring transaction, transition and integration planning costs related to acquisitions, mergers, and other
investments; SAP transition costs; non-cash income or expense related to mark-to-market adjustments on interest rate
and commodity hedges and amortization related to foreign exchange contracts; costs incurred to manage, and losses
incurred on our investment in the China joint venture; and with respect solely to the adjusted EBITDA calculation,
other non-cash charges related to stock-based compensation expense. These adjustments are intended to provide
greater transparency of underlying profit trends and to allow investors to evaluate our business on the same basis as
our management, which uses these non-GAAP measures in making financial and operating decisions and evaluating
the company’s performance. These adjustments are not necessarily indicative of what our actual financial performance
would have been during the periods presented and should be viewed in addition to, and not as an alternative to, the
company’s results prepared in accordance with GAAP. Further details regarding these adjustments are included in the
tables below.
Basis of Presentation
Certain financial measures in this release are presented on an organic basis, as well as non-GAAP measures that
include results provided on a constant currency basis and adjusted basis.

9
Organic Results
Results presented on an organic basis for three months ended December 31, 2016 exclude the operating results of
Innovation Packaging and Process, S.A. de C.V. ("IPP"). Results presented on an organic basis for twelve months
ended December 31, 2016 exclude the operating results of IPP since the June 2, 2016 date of acquisition, the operating
results of Wallaby through August 31, 2016, the operating results of Vega through July 31, 2016, and the operating
results of EIEIO through May 31, 2016.
Constant Currency Results
The company determines its constant currency results by dividing or multiplying, as appropriate, the current period
local currency results by the currency exchange rates used to translate the company’s financial results in the prior
period to determine what the current period U.S. dollar operating results would have been if the currency exchange
rate had not changed from the comparable prior period.
Adjusted Results
Segment financial results for the three and twelve months ended December 31, 2015 and 2016 in the Americas Foods &
Beverages segment are adjusted to exclude the expense related to the mark-to-market adjustment on commodity
hedges, acquisition related non-recurring transaction and integration planning costs, and SAP transition costs; and for
the three and twelve months ended December 31, 2015 in the Europe Foods & Beverages segment are adjusted to
exclude non-recurring acquisition transaction costs related to intercompany activities. All other adjustments relate to
corporate and other items. See reconciliations at the end of this release for further details and for reconciliations of the
non-GAAP measures to GAAP.
CONTACTS
Investor Relations: Media:
Dave Oldani Molly Keveney
+1 (303) 635-4747 +1 (303) 635-4529
10
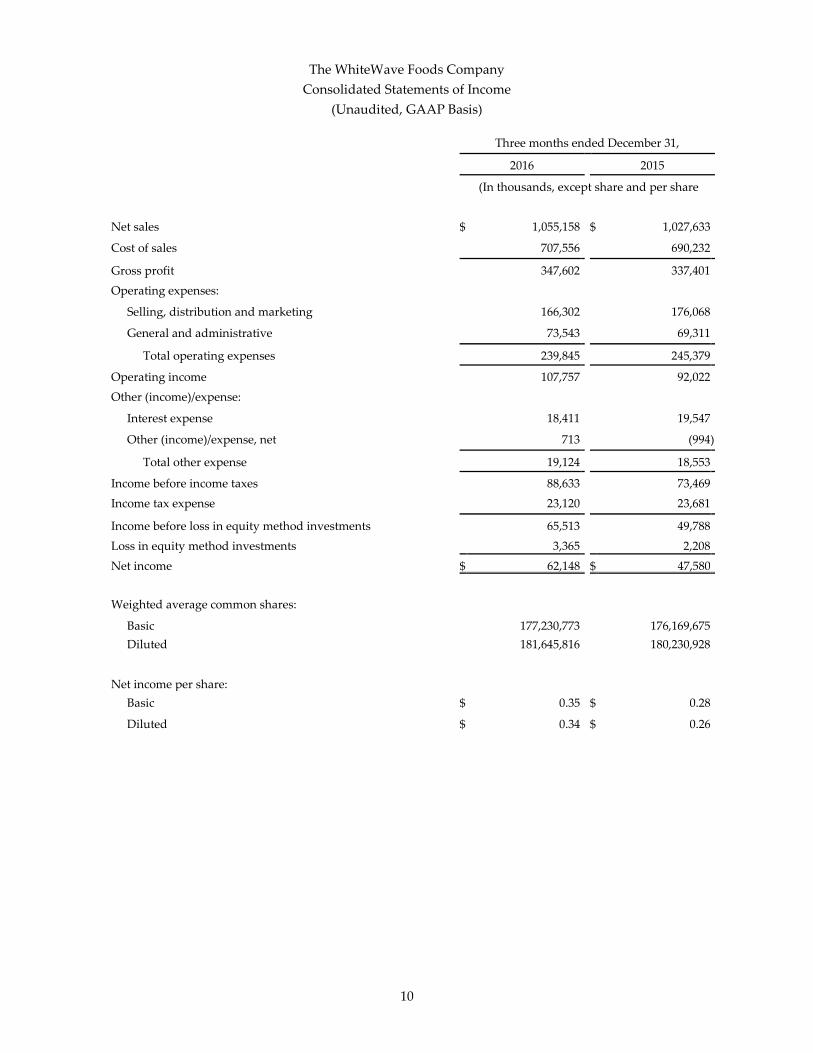
The WhiteWave Foods Company
Consolidated Statements of Income
(Unaudited, GAAP Basis)
Three months ended December 31,
2016 2015
(In thousands, except share and per share
data)
Net sales $ 1,055,158 $ 1,027,633
Cost of sales 707,556 690,232
Gross profit 347,602 337,401
Operating expenses:
Selling, distribution and marketing 166,302 176,068
General and administrative 73,543 69,311
Total operating expenses 239,845 245,379
Operating income 107,757 92,022
Other (income)/expense:
Interest expense 18,411 19,547
Other (income)/expense, net 713 (994 )
Total other expense 19,124 18,553
Income before income taxes 88,633 73,469
Income tax expense 23,120 23,681
Income before loss in equity method investments 65,513 49,788
Loss in equity method investments 3,365 2,208
Net income $ 62,148 $ 47,580
Weighted average common shares:
Basic 177,230,773 176,169,675
Diluted 181,645,816 180,230,928
Net income per share:
Basic $ 0.35 $ 0.28
Diluted $ 0.34 $ 0.26

11
The WhiteWave Foods Company
Consolidated Statements of Income
(Unaudited, GAAP Basis)
Year ended December 31,
2016 2015
(In thousands, except share and per share
data)
Net sales $ 4,198,099 $ 3,866,295
Cost of sales 2,745,203 2,543,030
Gross profit 1,452,896 1,323,265
Operating expenses:
Selling, distribution and marketing 729,520 705,924
General and administrative 321,627 285,135
Total operating expenses 1,051,147 991,059
Operating income 401,749 332,206
Other expense:
Interest expense 69,183 58,127
Other expense, net 5,381 6,343
Total other expense 74,564 64,470
Income before income taxes 327,185 267,736
Income tax expense 102,410 87,908
Income before loss in equity method investments 224,775 179,828
Loss in equity method investments 10,221 11,435
Net income $ 214,554 $ 168,393
Weighted average common shares:
Basic 176,984,906 175,511,811
Diluted 181,174,379 180,084,949
Net income per share:
Basic $ 1.21 $ 0.96
Diluted $ 1.18 $ 0.94

12
The WhiteWave Foods Company
Consolidated Balance Sheets
(Unaudited, GAAP Basis)
December 31, 2016 December 31, 2015
(In thousands)
ASSETS
Cash and cash equivalents $ 45,828 $ 38,610
Trade receivables, net of allowance of $2,639 and $2,127 283,698 257,548
Inventories 296,360 270,737
Prepaid expenses and other current assets 78,055 39,782
Total current assets 703,941 606,677
Equity method investments 19,277 30,772
Property, plant, and equipment, net 1,294,710 1,137,521
Identifiable intangible and other assets, net 1,034,893 1,038,577
Goodwill 1,416,067 1,415,322
Total Assets $ 4,468,888 $ 4,228,869
LIABILITIES AND SHAREHOLDERS' EQUITY
Accounts payable and accrued expenses $ 539,083 $ 549,713
Current portion of debt and capital lease obligations 58,585 51,449
Income taxes payable 2,973 3,043
Total current liabilities 600,641 604,205
Long-term debt and capital lease obligations, net of debt issuance
costs
2,081,756 2,078,940
Deferred income taxes 304,347 293,326
Other long-term liabilities 51,448 41,490
Total liabilities 3,038,192 3,017,961
Common stock 1,773 1,762
Additional paid-in capital 950,273 914,975
Retained earnings 640,259 425,705
Accumulated other comprehensive loss (161,609 ) (131,534 )
Total shareholders' equity 1,430,696 1,210,908
Total Liabilities and Shareholders' Equity $ 4,468,888 $ 4,228,869

13
The WhiteWave Foods Company
Condensed Consolidated Statements of Cash Flows
(Unaudited, GAAP Basis)
Year ended December 31,
2016 2015
(In thousands)
Operating Activities
Net income $ 214,554 $ 168,393
Adjustments to reconcile net income to net cash provided by operating activities:
Depreciation and amortization 138,814 120,019
Share-based compensation expense 30,411 32,489
Amortization of debt issuance costs 4,242 4,192
Unrealized (gain) loss on derivative instruments (9,422 ) 8,277
Loss in equity method investments 10,221 11,435
Other 14,508 (17,156 )
Net change in operating assets and liabilities, net of acquisitions (86,847 ) (12,343 )
Net cash provided by operating activities 316,481 315,306
Investing Activities
Investment in equity method investments — (701 )
Payments for acquisitions, net of cash acquired of $833 and $8,521 (17,263 ) (707,605 )
Proceeds from acquisition adjustments — 346
Payments for property, plant, and equipment (290,808 ) (258,488 )
Proceeds from sale of fixed assets 310 8,962
Net cash used in investing activities (307,761 ) (957,486 )
Financing Activities
Debt related activities 5,508 632,179
Other financing activities 5,151 3,732
Net cash provided by financing activities 10,659 635,911
Effect of exchange rate changes on cash and cash equivalents (12,161 ) (5,361 )
Increase/(decrease) in cash and cash equivalents 7,218 (11,630 )
Cash and cash equivalents, beginning of period 38,610 50,240
Cash and cash equivalents, end of period $ 45,828 $ 38,610

14
The WhiteWave Foods Company
GAAP to Non-GAAP Reconciliation
(Unaudited) Three months ended December 31, 2016 Three months ended December 31, 2015
GAAP Adjustment
s Adjusted GAAP Adjustment
s Adjusted
(In thousands, except share and per share data)
Net sales $ 1,055,158 $ — $ 1,055,158 $ 1,027,633 $ — $ 1,027,633
Cost of sales 707,556 879 (b) 708,435 690,232 (14,098 ) (a)(b) 676,134
Gross profit 347,602 (879 ) 346,723 337,401 14,098 351,499
Operating expenses:
Selling, distribution and marketing 166,302 3,455 (b) 169,757 176,068 (2,732 ) (b) 173,336
General and administrative 73,543 (8,511 ) (a) 65,032 69,311 (4,734 ) (a) 64,577
Total operating expenses 239,845 (5,056 ) 234,789 245,379 (7,466 ) 237,913
Operating income 107,757 4,177 111,934 92,022 21,564 113,586
Other expense:
Interest expense 18,411 — 18,411 19,547 (1,521 ) (g) 18,026
Other (income) expense, net 713 (733 ) (c) (20 ) (994 ) 994 (c) —
Total other expense 19,124 (733 ) 18,391 18,553 (527 ) 18,026
Income before income taxes 88,633 4,910 93,543 73,469 22,091 95,560
Income tax expense 23,120 1,931 (d) 25,051 23,681 7,854 (d) 31,535
Income before loss in equity method
investments
65,513 2,979 68,492 49,788 14,237 64,025
Loss in equity method investments 3,365 (830 ) (c) 2,535 2,208 — 2,208
Net income $ 62,148 $ 3,809 $ 65,957 $ 47,580 $ 14,237 $ 61,817
Earnings per Share:
Basic $ 0.37 $ 0.35
Diluted $ 0.36 $ 0.34
Weighted Average Common Shares:
Basic 177,230,773 176,169,675
Diluted 181,645,816 180,230,928
Adjusted net income excluding China joint venture activities:
Adjusted net income $ 65,957 $ 61,817
Corporate related joint venture expenses, net of tax 828 (e) 672 (e)
Loss in China joint venture equity method investment 2,373 (f) 2,065 (f)
Adjusted net income excluding China joint venture activities $ 69,158 $ 64,554
Adjusted earnings per share excluding China joint venture activities:
Basic $ 0.39 $ 0.37
Diluted $ 0.38 $ 0.36

15
The WhiteWave Foods Company
GAAP to Non-GAAP Reconciliation
(Unaudited)
Three months ended December 31, 2016 Three months ended December 31, 2015
GAAP Adjustment
s Adjusted GAAP Adjustment
s Adjusted
(In thousands)
Income statement amounts by segment: Total net sales:
Americas Foods & Beverages $ 917,085 $ — $ 917,085 $ 893,268 $ — $ 893,268
Europe Foods & Beverages 138,073 — 138,073 134,365 — 134,365
Total net sales $ 1,055,158 $ — $ 1,055,158 $ 1,027,633 $ — $ 1,027,633
Operating income:
Americas Foods & Beverages 116,511 (3,538 ) (a)(b) $ 112,973 93,799 20,028 (a)(b) $ 113,827 Europe Foods & Beverages 16,144 — 16,144 17,440 194 (a) 17,634
Total reportable segment operating income 132,655 (3,538 ) 129,117 111,239 20,222 131,461 Corporate and other (24,898 ) 7,715 (a) (17,183 ) (19,217 ) 1,342 (a) (17,875 )
Total operating income $ 107,757 $ 4,177 $ 111,934 $ 92,022 $ 21,564 $ 113,586
The WhiteWave Foods Company
Reconciliation of GAAP Net Income to EBITDA and Adjusted EBITDA
(Unaudited)
Three months ended December 31,
2016 2015
(In thousands) Net income $ 62,148 $ 47,580 Interest expense, net 18,411 19,547 Income tax expense 23,120 23,681 Depreciation and amortization 35,407 33,343
EBITDA 139,086 124,151 Transaction, integration & transition costs 8,457 (a) 16,477 (a)
Mark-to-market on hedging transactions & other adjustments (2,771 ) (b)(c) 2,798 (b)(c)
IPO grants & non-cash stock-based compensation 5,346 (a)(h) 5,190 (a)(h)
Adjusted EBITDA 150,118 148,616 Corporate related joint venture expenses 1,141 (e) 1,002 (e)
Loss in China joint venture equity method investment 2,373 (f) 2,065 (f)
Adjusted EBITDA excluding China joint venture activities $ 153,632 $ 151,684

16
The WhiteWave Foods Company
GAAP to Non-GAAP Reconciliation
(Unaudited) Year ended December 31, 2016 Year ended December 31, 2015
GAAP Adjustment
s Adjusted GAAP Adjustment
s Adjusted
(In thousands, except share and per share data)
Net sales $ 4,198,099 $ — $ 4,198,099 $ 3,866,295 $ 750 (a) $ 3,867,045
Cost of sales 2,745,203 (5,498 ) (a)(b) 2,739,705 2,543,030 (15,038 ) (a)(b) 2,527,992
Gross profit 1,452,896 5,498 1,458,394 1,323,265 15,788 1,339,053
Operating expenses:
Selling, distribution and marketing 729,520 10,798 (b) 740,318 705,924 (2,005 ) (b) 703,919
General and administrative 321,627 (26,573 ) (a) 295,054 285,135 (25,482 ) (a) 259,653
Total operating expenses 1,051,147 (15,775 ) 1,035,372 991,059 (27,487 ) 963,572
Operating income 401,749 21,273 423,022 332,206 43,275 375,481
Other expense:
Interest expense 69,183 — 69,183 58,127 (1,521 ) (g) 56,606
Other expense, net 5,381 (5,390 ) (c) (9 ) 6,343 (6,348 ) (c) (5 )
Total other expense 74,564 (5,390 ) 69,174 64,470 (7,869 ) 56,601
Income before income taxes 327,185 26,663 353,848 267,736 51,144 318,880
Income tax expense 102,410 8,174 (d) 110,584 87,908 18,439 (d) 106,347
Income before loss in equity method
investments
224,775 18,489 243,264 179,828 32,705 212,533
Loss in equity method investments 10,221 (830 ) (c) 9,391 11,435 — 11,435
Net income $ 214,554 $ 19,319 $ 233,873 $ 168,393 $ 32,705 $ 201,098
Earnings per Share:
Basic $ 1.32 $ 1.15
Diluted $ 1.29 $ 1.12
Weighted Average Common Shares:
Basic 176,984,906 175,511,811
Diluted 181,174,379 180,084,949
Adjusted net income excluding China joint venture activities:
Adjusted net income $ 233,873 $ 201,098
Corporate related joint venture expenses, net of tax 2,652 (e) 2,450 (e)
Loss in China joint venture equity method investment 8,501 (f) 10,717 (f)
Adjusted net income excluding China joint venture activities $ 245,026 $ 214,265
Adjusted earnings per share excluding China joint venture activities:
Basic $ 1.38 $ 1.22
Diluted $ 1.35 $ 1.19

17
The WhiteWave Foods Company
GAAP to Non-GAAP Reconciliation
(Unaudited)
Year ended December 31, 2016 Year ended December 31, 2015
GAAP Adjustment
s Adjusted GAAP Adjustment
s Adjusted
(In thousands)
Income statement amounts by segment: Total net sales:
Americas Foods & Beverages $ 3,619,753 $ — $ 3,619,753 $ 3,333,732 $ 750 (a) $ 3,334,482 Europe Foods & Beverages 578,346 — 578,346 532,563 — 532,563
Total net sales $ 4,198,099 $ — $ 4,198,099 $ 3,866,295 $ 750 $ 3,867,045
Operating income:
Americas Foods & Beverages 438,496 948 (a)(b) $ 439,444 359,311 27,816 (a)(b) $ 387,127
Europe Foods & Beverages 69,153 — 69,153 67,506 274 (a) 67,780
Total reportable segment operating income 507,649 948 508,597 426,817 28,090 454,907 Corporate and other (105,900 ) 20,325 (a) (85,575 ) (94,611 ) 15,185 (a) (79,426 )
Total operating income $ 401,749 $ 21,273 $ 423,022 $ 332,206 $ 43,275 $ 375,481
The WhiteWave Foods Company
Reconciliation of GAAP Net Income to EBITDA and Adjusted EBITDA
(Unaudited)
Year ended December 31,
2016 2015
(In thousands) Net income $ 214,554 $ 168,393 Interest expense, net 69,183 58,127 Income tax expense 102,410 87,908 Depreciation and amortization 138,814 120,019
EBITDA 524,961 434,447 Transaction, integration & transition costs 35,071 (a) 26,605 (a)
Mark-to-market on hedging transactions & other adjustments (8,592 ) (b)(c) 9,107 (b)(c)
IPO grants & non-cash stock-based compensation 30,376 (a)(h) 37,658 (a)(h)
Adjusted EBITDA 581,816 507,817 Corporate related joint venture expenses 3,857 (e) 3,676 (e)
Loss in China joint venture equity method investment 8,501 (f) 10,717 (f)
Adjusted EBITDA excluding China joint venture activities $ 594,174 $ 522,210

18
The adjusted results differ from WhiteWave’s results under GAAP due to the following (Note: numbers herein may not recalculate
to tables due to rounding):
(a) The adjustment reflects:
i. Elimination of stock compensation expense for IPO grants.
• $0.1 million for the three months ended December 31, 2016
• $1.3 million for the three months ended December 31, 2015
• $1.0 million for the twelve months ended December 31, 2016
• $13.2 million for the twelve months ended December 31, 2015
ii. Elimination of non-recurring purchase accounting adjustments, transaction and integration planning costs or income
related to merger and acquisition activities and other investments, which includes costs related to the planned merger with
Danone.
Americas Foods & Beverages
• $0.8 million of transaction and integration costs related to acquisitions for the three months ended December 31,
2016
• $13.9 million in SAP implementation related costs and $2.3 million of other transaction and integration costs related
to acquisitions for the three months ended December 31, 2015
• $12.1 million in SAP implementation related costs and $3.7 million of other transaction and integration costs related
to acquisitions for the twelve months ended December 31, 2016
• $16.5 million in SAP implementation related costs, $7.8 million of other transaction and integration costs related to
acquisitions and $0.7 million of purchase accounting adjustments for the twelve months ended December 31, 2015
Europe Foods & Beverages
• $0.2 million in transaction costs related to acquisitions for the three months ended December 31, 2015
• $0.3 million in transaction costs related to acquisitions for the twelve months ended December 31, 2015
Corporate
• $7.6 million in transaction costs related to merger and acquisition, and integration planning activities for the three
months ended December 31, 2016
• $0.2 million in transaction income related to acquisitions for the three months ended December 31, 2015
• $19.3 million in transaction costs related to merger and acquisition, and integration planning activities for the
twelve months ended December 31, 2016
• $10.0 million in transaction costs related to acquisitions and a $(7.9) million reversal of income related to purchase
accounting adjustments for the twelve months ended December 31, 2015
(b) The adjustment reflects elimination of the (income)/expense related to the mark-to-market adjustment on commodity hedges.
• $(4.3) million for the twelve months ended December 31, 2016
• $3.8 million for the three months ended December 31, 2015
• $(14.8) million for the twelve months ended December 31, 2016
• $2.8 million for the twelve months ended December 31, 2015
(c) The adjustment reflects elimination of the (income)/expense related to the mark-to-market adjustment on interest rate hedges,
amortization of forward points on foreign exchange contracts and other non-cash adjustments.
• $1.5 million for the three months ended December 31, 2016
• $(1.0) million for the three months ended December 31, 2015
• $6.2 million for the twelve months ended December 31, 2016
• $6.3 million for the twelve months ended December 31, 2015
(d) Income tax in the adjustments columns represent the adjustment to income tax expense required to arrive at an adjusted
effective tax rate on adjusted income before taxes.

19
(e) The adjustment reflects the elimination of costs incurred to manage our China Joint Venture investment.
• $1.1 million ($0.8 million, net of tax) for the three months ended December 31, 2016
• $1.0 million ($0.7 million, net of tax) for the three months ended December 31, 2015
• $3.9 million ($2.7 million, net of tax) for the twelve months ended December 31, 2016
• $3.7 million ($2.5 million, net of tax) for the twelve months ended December 31, 2015
(f) The adjustment reflects the elimination of the loss incurred on the investment in the China Joint Venture.
• $2.4 million for the three months ended December 31, 2016
• $2.1 million for the three months ended December 31, 2015
• $8.5 million for the twelve months ended December 31, 2016
• $10.7 million for the twelve months ended December 31, 2015
(g) The adjustment reflects elimination of expense related to debt issuance costs written off as a result of the debt modification.
• $1.5 million for the three months ended December 31, 2015
• $1.5 million for the twelve months ended December 31, 2015
(h) The adjustment reflects non-cash related stock-based compensation expense, excluding amounts already included in IPO
grants.
• $5.3 million for the three months ended December 31, 2016
• $3.9 million for the three months ended December 31, 2015
• $29.4 million for the twelve months ended December 31, 2016
• $24.4 million for the twelve months ended December 31, 2015
Top Related