


Languages
Pages
Legal


Where is the Money
in Payments?
EPCA conference presentation
March 25th 2013
Brussels
CONFIDENTIAL AND PROPRIETARY
Any use of this material without specific permission of McKinsey & Company is strictly prohibited

McKinsey & Company | 1
Contents
Real challenges to profitability
Levers for improvement
The importance of being
payments!

McKinsey & Company | 2
Globally, payments represent close to 1 trillion EUR in revenues,
out of which 25% are generated in Europe Global banking revenues, %, 2011
100% = EUR 3,100 billion
70
Other banking
revenues
Payments
& accounts
30
Retail accounts
Corporate accounts
Credit card issuing
Card acquiring
E-purse/prepaid
34
35
25
5 1
North
America
Europe
APAC
LatAm
Other
25
25
33
15
2
100% = EUR 930 billion
Pre-tax profits margin 20-25% (equivalent to
EUR 180-230 billion operating result)

McKinsey & Company | 3
Despite a drop during the crisis, European payments revenues have
proven resilient and importance for banks should increase
128
11495
106 99 101 106112
120
14
237
13
227
126
12
131 124
11
234
+5%
223
-5%
2016
267
146
15
250
137 129
10
217
122
09
237
123
2008
270
142
35%
Share of
banking
revenue
30%
Retail payments Corporate payments
33%
European1 payments revenues, EUR billions

McKinsey & Company | 4
79.6
234.4
26.0
25.715.2
Profits Cash/
Check
-40.6
CT/DD
-9.7
Debit
-6.8
Credit
cards
-23.8
Maint.
-64.7
Risk
-9.2
Reve-
nue
Inter-
est
119.8
Fees Credit
cards
35.4
Debit
12.2
CT/DD Cash/
Check
Key contributors
Europe generates 80 bn EUR in payment profits,
mostly through interest revenues on accounts Europe, EUR billions, 2011
Revenues Costs
Transactions Accounts Credit
cards
Accounts Credit
cards
Transactions

McKinsey & Company | 5
UK
TU
CH SE
ES
PT
PL
NO
NL
IT
IE
HU
EL
DE
FR
FI
ET
DK CZ
BU BE
AT
Ch
eq
ue
Ele
ctr
on
ic
Card transaction per capita 39 Finland Norway 42 Sweden 50 France 50 Denmark 51 Netherlands 52 Belgium 54 UK 57 Austria 64 Estonia 65 Switzerland 66 Germany 69 Ireland 75 Portugal 78 Spain 80 Hungary 88 Czech Rep. 88 Italy 89 Poland 90 Turkey 94 Greece 97 Bulgaria 98
Cash’s share of total transactions
Percent
Electronic share of non-cash transactions
Percent, transactions per capita
Users display very different payment behavior…
Card & cheque
Full
electronic
Cash & paper
Cash & electronic

McKinsey & Company | 6
France United Kingdom
Total
revenues 27.6
Cash &
Cheque 0.9
Electronic
payments 2.9
Overdraft 3.9
Card 3.7
Current account
Retail 9.1
Current account
Corporate 7.2
3.0
7.8
10.1
5.7
30.8
1.3
2.8
30.0
1.2
2.2
4.5
13.3
3.3
5.4
… resulting in country differences in source of payments revenue
Key contributor
Germany
Payment revenues 2011, € Billions

McKinsey & Company | 7
Users are also being charged in different ways
8
2
10
8
12
13
13
11
14
12
28
64
4
4
12
3
2
1
2
1
1
1
1
1
0
0
0
74 12
27
Poland 58 16 ~22
Italy 68 20
UK 68 7
Switzerland 70 21 ~8
Sweden 71 15
Austria 71 16
Belgium 72 20
France 75 12
Netherlands 75 23
Russia
Denmark
6
Spain 31 39
Norway 55
30
~25
Portugal 56 31
Germany 58
18
Net interest income
Maintenance fees
Transactional fees
Incident fees
Retail payments revenue, percent, 2011

McKinsey & Company | 8
Level of profitability is also highly differentiated
100 150 200 250 300 350 400 450 500 550 600 650 700
Price per transaction EUR
1,4
1,2
1,0
0,8
0,6
0,4
0,2
0
Total payments revenue per capita EUR
UK
Switzerland
Sweden
Spain
Portugal
Norway
Netherlands
Italy
Ireland
Germany
France
Finland Denmark Belgium
Austria Slovakia
Poland
Hungary
Czech Rep.

McKinsey & Company | 9
Contents
The importance of being payments
Levers for improvement
Real challenges to
profitability
McKinsey & Company | 10
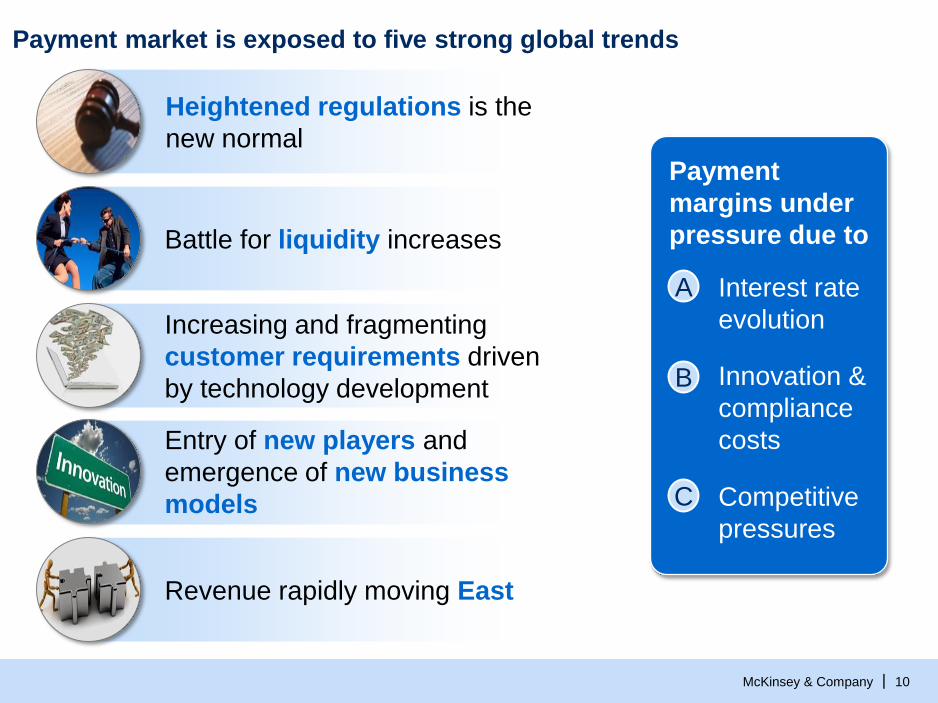
Payment market is exposed to five strong global trends
Battle for liquidity increases
Increasing and fragmenting
customer requirements driven
by technology development
Entry of new players and
emergence of new business
models
Heightened regulations is the
new normal
Revenue rapidly moving East
Payment
margins under
pressure due to
A Interest rate
evolution
B Innovation &
compliance
costs
C Competitive
pressures

McKinsey & Company | 11
Impact of a 1% decrease in reference rates
on payments revenues
Percentage of
total payments
revenues EUR billions
5
North
America 10
EMEA 40
APAC 90
World 145
LatAm
28
13
5
3
… while payments revenues remain hea-
vily exposed to interest rate fluctuations
14
A
Excess Deposits
“Battle for Deposits”
Liquidity imbalances remain….
US: banks cannot
profitably invest
their excess
liquidity
APAC: Central
banks controlling
liquidity with high
reserve
requirements
LatAm: increasing
demand for credit
creating greater
need for deposits
Europe: Still
looking for sources
of much-needed
deposit funding
Payments industry remains extremely vulnerable to interest
rate fluctuations

McKinsey & Company | 12
Banks
Advanced industries
Pharma/ Healthcare
Telecom
Transport/ Logistics
Energy
Resources
Regulation is limiting earnings potential and increasing
compliance investments
45–55
35–45
30–40
50–60
25–30
40–50
Estimated share of EBITDA at stake
Percent
B
Level playing field
Customer protec-
tion and antitrust
Efficiency
promotion
Financial stability
Crime protection
5 major areas
50–60

McKinsey & Company | 13
B Customers increased service and convenience expectation drives
need for new product investment
6 themes gaining traction
Better money management
More social, more fun
Immediate & secure access
Ultra convenient
Personalized and customizable
Consumer-centric pricing

McKinsey & Company | 14
15
11 53
100
Net Interest
income
Non card
maintenance
fee
Non card
transactional
income
Card
Issuing
17
Merchant
services
4
Total
revenues
New entrants first target
merchant services
Traditional card issuing
revenue desinter-
mediated by new
merchant services
solutions
Other fee-related income
targeted by new entrants
(e-invoicing solutions, P2P,
B2B payments)
Payments revenue, Indexed
C Attackers are targeting sweet spots
Net interest income remains
relatively safe for now, but
pressured by interest levels

McKinsey & Company | 15
Contents
The importance of being payments
Levers for improvement
Real challenges to profitability

McKinsey & Company | 16
What to do to recapture the payment margin
Formulate
innovation
around value
creation
A
Review cost
and service
models
B
▪ Innovation beyond technology
▪ Alternative business models create new
types of revenues
▪ Define innovation objectives and focus
on value creation
▪ Match cost base and focus on efficiency
of attackers
▪ Reduce differences in efficiency between
providers
▪ Explore learning from other industries

McKinsey & Company | 17
Objectives
▪ Increase wallet
share and
stickiness
▪ Increase scope
of customer
mandates
▪ Access new
markets and
customer
segments
▪ Increase
profitability
Innovation should focus on increasing profitability and provide access
to new markets, using more than technology as a driver!
Primary areas of innovation
A
E
B
C
D
Products and features
Technology
Channels/platforms
Coverage and pricing
Processes and organization
A

McKinsey & Company | 18
Mobile POS
payments &
acceptance
Information-
based busi-
ness models
B2B
payments &
e-invoicing
Remote pay-
ments & new
currencies
Examples Description
▪ Pay or be paid … anywhere, anytime
▪ Phone or tablet as the merchant terminal
▪ Privileged information to improve decision journey
▪ Targeted marketing based on history and location
▪ Integration of loyalty, shopping service, and
payment
▪ Electronify the “round trip” of B2B invoices
▪ Improves efficiency of AR/AP operations
▪ Opens up new services to offer corporates (e.g.,
transaction level financing, receivables mgmt.)
▪ Social media becoming social payments
▪ Alternative currencies for specific commerce
▪ Cloud-based apps enabling new remote
payments
A New payment players apply new revenue models to enter
the market

McKinsey & Company | 19
Location
based
marketing
Transactional
based
marketing
Digital
Marketing
NFC
E-wallet
Digital
Payments
Transfer
based
+
Coupons /
Rewards
Budgeting
applications
Digital
Banking
+
New
Application
New
combined
application
=
A New payment solutions will need to combine banking, payments and
commerce functionalities

McKinsey & Company | 20
Payment operations have already done
substantial efforts … Still…
… over 50 % of all expenses are still
people related and important differences in
performance exist
Payments is a largely automated
business line with straight-through
processing (STP)
1
… payment platforms are most often not
optimally harmonized Payments is a scale game 2
… no systematic purchasing
management in place and incomplete
outsourcing strategies
Payment operations are grouped
at European levels 3
… cost of IT applications differs by factor
2-3 between best and worse in class Large, standardized IT systems
form major fixed cost component 4
… payments are not designed around
customer needs but around system
capabilities
Payment products are already
highly ‘commoditized’ 5
B Efficiency of payment operations is often overestimated by banks
and processors

McKinsey & Company | 21
Accounts/FTE
20.922.223.4
GM Worst
(Nissan)
-11%
Best
(Honda)
-67% 2,340
779
Worst Best
12,5
Average Worst
17,8 -47%
9,4
Best
Issuer processing
Cost per transaction, Eurocent
Variability in banking and payments
is very high…
Labor hours/vehicle
… while sectors as automotive
show low variability
If worst performing banks increase productivity to equal automotive
difference, banking industry productivity would grow by 50% and sector
ROE by 2-3%
B Comparison with other industries shows that banks overall have
a significant productivity variability in payments

McKinsey & Company | 22
Critical enablers
New levels of
cross-functional
collaboration
1
Bold industry
moves 2
Standard
industry metrics 3
New capabilities
and culture 5
Addressing HR
barriers 4
Examples from other industries
▪ Automotive uses cross-functional and supplier
collaboration to design products to target cost
structure
▪ Telecom has aggressively outsourced network
operations to reduce costs
▪ Automotive uses standard hours per vehicle
benchmark to compare productivity
▪ IKEA practices cost consciousness at all levels
▪ Postal players renegotiated delivery staff wage
agreements after liberalization of market
B What will it take to make things different this time?
Lessons from other industries

McKinsey & Company | 23
Where will be the money in payments?
Payments are a major part of
financial services revenues
Economics remain complex due to
major differences in revenue
models
Future earnings negatively
impacted by external pressures
Need to investigate new models of
revenue and review operating
models for cost
Top Related