


Languages
Pages
Legal

What’s an Apology Worth?
Decomposing the effect of apologies on medical malpractice payments using state apology laws
Benjamin Ho, Cornell University*
Elaine Liu, University of Houston
Abstract
Past studies find that apologies affect the outcomes of medical malpractice litigation, but
such studies have largely been limited to laboratory surveys or case studies. Following Ho and
Liu (2010), we use the passage of state-level apology laws that exclude apologies from being
used as evidence in medical malpractice cases, and estimate that apologizing to a patient in cases
of medical malpractice litigation reduces the average payout by $32,000. This paper seeks to
unpack the mechanism of apologies by examining the differential impact of apologies laws by
various sub-samples. We find that apologies are most valuable for cases involving obstetrics and
anesthesia, for cases involving infants, and for cases involving improper management by the
physician and failures to diagnose.
* The authors wish to thank Ori Heffetz, Ren Mu, Christine Durrance and Emily Owens as well as seminar
participants at Stanford University, Cornell University, University of Houston Center for Public Policy, Hong Kong
University, Brigham Young, National Taiwan University, the American Law and Economic Association, the
American Economic Association Annual meetings and American Society of Health Economists for helpful
comments. Direct correspondence to Benjamin Ho 322 Sage Hall Cornell University Ithaca, NY, 14853.E-mail:
I. Introduction
What is an apology worth? Are they just words, or do they have economic value? Past
studies on apologies and medical malpractice have used surveys and case studies to establish the
importance of apologies in swaying jury and judge opinions.1 Doctors are often culturally
conditioned to avoid apologies to avoid admitting fault (Lamb et al., 2003; Novack et al., 1989;
Pinkus, 2000) and thus avoid litigation, yet surveys of patients often reveal a main reason
patients decide to litigate is due to the lack of an apology (Hickson et al., 1992; May & Stengel,
1990; Vincent & Young, 1994). Programs that encouraged apologies and disclosure in individual
hospitals have been shown to yield substantial savings in hospital litigation costs (Liebman &
Hyman, 2004, 2005; Kraman & Hamm, 1999). Ho and Liu (2010) find that apology laws, which
exclude apologies from being used as evidence in medical malpractice litigation, expedite the
speed of resolution. Despite the above claims of the effectiveness of apologies, no study has yet
attempted to quantify how the value of an apology in medical malpractice litigation depends on
the characteristics of the case.
In this study, we adopt a similar difference-in-difference approach as Ho and Liu (2010)
by taking advantage of the propagation of the state-level “apology laws” that have been
implemented in 36 states. These laws state that apologies made by medical practitioners cannot
be used as evidence in medical malpractice litigation. The laws are intended to protect statements
of apology made by physicians in order to increase the likelihood of their use. Ho and Liu (2010)
use this approach to measure the aggregate effect of the apology law, and they find that in states
that have apology laws, cases are settled faster, and claim payout for most severe medical
injuries (i.e. death and quadriplegia) drop by 15-18%. This study builds on Ho and Liu’s (2010)
1 See next section for a review of the literature.

work but seeks to understand how apologies work by looking at where apology laws are most
effective. We do this by decomposing the effect of the law by case characteristics, using
categories such as allegation nature, patient gender and age.
We use the National Practitioner Databank (NPDB) dataset, which contains detailed
information of every malpractice case with positive payment made by medical practitioners in
the United States since 1991.2 This dataset has been frequently used in the field to study various
tort refoms. Unfortunately, our dataset does not identify which physicians apologize. However,
for reasons we discuss in detail in the Discussion, our estimates should provide a lower bound
for the value apologies have both in swaying the actions of potential litigants and as evidence in
malpractice cases.
Overall, the passage of the apology law accounts for a $32,342 (12.8%) decrease in the
size of malpractice payments.3 More interestingly, by repeating the analysis on sub-samples, we
are able to decompose that effect. We find that the effect is concentrated on cases involving
obstetrics and anesthesia, cases involving infants, cases with male patients, and cases involving
improper management by the physician and failures to diagnose.
The next section briefly reviews the background and literature of apologies in medical
malpractice. We then consider the economic mechanisms that underlie the estimates. The
following section describes the data and the empirical methodology. The final section presents
and discusses the results.
2 This dataset however does not contain any claims without payment, any open claim information, or any
claims payout made by an entities. For more discussion on how it might affect the interpretation of our results, see
Data Section. 3 The estimate has been inflated to Year 2010 dollars.

II. Background on Apologies in Medical Malpractice
The existing work on apology in medical malpractice can be divided between studies of
patient attitudes toward litigation, and case studies of individual hospital disclosure programs.
The first set uses hypothetical situations and analyzes whether apologies can reduce the subjects’
likelihood to litigate (Gallagher et al, 2003; Witman et al., 1996; Mazor et al. 2004; Wu, 1999;
Wu et al., 2009). Robbennolt (2003, 2006) provides a comprehensive psychological overview of
why and how apologies could be effective in reducing patient’s likelihood to litigate.
Another set of studies examine apology policies at the hospital level. Studies by
Liebman & Hyman (2004, 2005) and Kraman & Hamm (1999), examine the effectiveness of
apology programs at individual hospitals. Both find that programs that encourage effective
apologies and disclosure of mistakes can dramatically reduce malpractice payments. Boothman
(2009) finds that the apology and disclosure program at the University of Michigan Health
Service reports a dramatic decrease of 47% in compensation payments and a drop in settlement
time from 20 months to 6 months, after its implementation in 2001. While the findings for
hospital-level apology programs are promising, it is not clear whether the impact of State-level
apology laws would be as remarkable. For example, these aforementioned hospitals could be
under the management of reforming administrators, or may have other concurrent programs (e.g.
full information disclosure program at University of Michigan Health Services); therefore, the
reduction in claim frequency or payout could be attributed to factors besides the apology
program. In other words, the true effect of apologies on medical malpractice litigation in these
studies could be overestimated. Alternatively, such studies could underestimate the value of
apologies if a broader change in how the law treats apologies would make them more effective.

Our study takes advantage of a recent medical malpractice reform—the “apology law.”
Most apology laws declare that a statement of apology made by a medical practitioner to a
patient is inadmissible as evidence of liability in court. Most follow a similar template. For
example, the Connecticut law states that:
In any civil action brought by an alleged victim of an unanticipated
outcome of medical care, or in any arbitration proceeding related to such civil
action, any and all statements, affirmations, gestures or conduct expressing
apology, fault, sympathy, commiseration, condolence, compassion or a
general sense of benevolence that are made by a health care provider or an
employee of a health care provider to the alleged victim, a relative of the alleged
victim or a representative of the alleged victim and that relate to the discomfort,
pain, suffering, injury or death of the alleged victim as a result of the
unanticipated outcome of medical care shall be inadmissible as evidence of an
admission of liability or as evidence of an admission against interest. (emphasis
added)
Across states there are some slight variations in the types of statements that are protected but all
generally include a combination of the following: apology, fault, sympathy, commiseration,
condolence, compassion, and admissions of mistakes, errors, and liability.4
As of January 2009, 36 States (including Washington D.C.) have enacted various forms
of apology laws. Table 1 lists all of the State legal codes pertaining to medical apologies.5
[Insert Table 1 About Here]
4 Some studies (McDonnell and Guenther, 2008; Morse, 2009) divide apology laws into laws that exempt
full apologies—apologies admitting guilt—versus laws that only exempt partial apologies—apologies that only offer
sympathy. We do not here, because past authors do not agree on what constitutes a full versus partial apology and
because F-tests find no significant difference in states with full versus partial apologies. 5 California, Massachusetts, Florida, Tennessee, Texas, and Washington have general apology statutes that
apply across all industries while the other 30 States have specific laws that only protect the statements of apology
made by health care providers. The States can be first divided into two types depending on the applicability of these
laws: general versus health practitioners only. Following Ho and Liu (2010), who had perform an F-test checking
whether they can group the general versus health-care only laws together, the F-test fails to reject the null
hypotheses that these two types of apology laws have the same impact. Therefore, for the remainder of the paper, we
are not going to differentiate between general and health-care only apology laws.

Despite this wide-spread adoption, there has been very little empirical economic analysis
examining the laws’ effectiveness. Ho and Liu (2010) are the first to evaluate the effectiveness of
these state-level apology programs. They find that apology laws help to expedite the resolution
process and reduce claim frequencies. Their paper provides a theoretical economic model
examining the effects of apologies, and empirically focuses on the effectiveness of apology laws
at the aggregate (state) level. In contrast, this paper focuses on examining the effectiveness of
apologies at the case-level. In particular, we examine how the effectiveness of apologies may
differ by patient-, physician-, and case characteristics.
III. Conceptual Framework
In this section, we consider the economic mechanisms that drive apologies to establish a
framework for interpreting the estimates. A more mathematically formal representation can be
found in Ho (2010) and Ho and Liu (2010); we focus here on the intuition. We assume that
patients have two main factors that determine whether they seek litigation conditional on the
medical outcome, 1) the monetary incentive and 2) the psychic value of their relationship with
the doctor. Similarly, doctors have two main factors in determining whether to apologize, 1) their
own monetary costs of litigation and 2) the psychic value of their relationship with their patients.
Patients decide to litigate by weighing the monetary benefits from litigation with the psychic
costs of suing their doctor. A physician who has good relationship with patient would therefore
reduce the probability of litigation. In this model, an apology would enhance the relationship
between patients and physicians by signaling the doctor’s good intentions to the patient. Patients
find it more psychically costly to sue their doctor after they have received an apology. Doctors
decide to apologize or not by weighing the monetary costs of the increased costs of litigation
with the psychic benefits of strengthening the relationship with their patients. The third major
player will be the Courts who decide the size of the settlement award in case of litigation.
Apologies serve as a signal to the courts of the guilt of the doctor. If we assume that plaintiffs
use evidence of apologies optimally and that how apologies are viewed are not affected
substantially by the passage of the laws, then the expected settlement award is larger when
plaintiffs have the option to use apologies as evidence, relative to when laws prohibit their usage.
Apology laws work by reducing the expected damage award that doctors face if the case goes to
court. The reduced expected damage award leads to a lower expected settlement payment, which
leads to lower monetary costs faced by doctors if they decide to apologize. Therefore the law
makes it more likely for doctors to apologize.
The frequency and severity of malpractice claims are reduced then through two channels.
Patients are less likely to sue and will demand lower payments both because their likelihood of
winning a lawsuit is reduced, and because the increased likelihood that a doctor improved the
doctor-patient relationship using an apology. The current analysis will not be able to disentangle
the value of the apology as evidence to the Judge from the value of the apology on reducing the
patient’s demand; that question will be pursued in future research.
The law could also have unintended consequences that are evident if imperfect
information is allowed. For example, if doctors are shortsighted in their apologies, then more
apologies by doctors could increase the awareness of mistakes by patients and thus lead to more
lawsuits (Studdert et al, 2007). Similarly if patients become aware that the consequences of an
apology are reduced, then the law would effectively devalue all apologies made by doctors, and
potentially worsen patient-doctor relationships on average (Cohen, 2003; Ho, 2010). Finally, if
apologies are successful at reducing the consequences of malpractice errors, then we may expect

to see an increase in medical errors as well. Past research (Ho and Liu, 2010) find little evidence
for these perverse effects. If such effects do exist, they would attenuate the size of the effects we
are estimating, and further suggest that the effect sizes we observe constitute the lower bound of
value of apology.
The model also suggests where to expect the locus of effect. Since apologies restore
relationships, we expect apologies to occur more in fields where reputation matters more, such as
in obstetrics versus emergency medicine. If male patients put more weight on their relationship
with the doctor we would also expect apologies to have a larger value for men.6 Also, because
we argue that apologies serve as an informational signal, we would expect a larger effect when
there is greater uncertainty about the doctor’s performance. This would also suggest that
apologies should be more important for younger doctors, rather than older, well-established ones.
IV. Data
To assess the impact of these various types of apology laws, we use data drawn from the
NPDB database.7 The NPDB contains all medical malpractice cases with non-zero payments
made by health practitioners, though notably the NPDB does not include cases made by
institutions. For each claim, there is information regarding the year the incident occurred,8 the
nature of the allegation (e.g., diagnosis related, anesthesia related, surgery related, etc.), the
practitioner’s graduation year and age group, the practitioner’s work and licensing state, and
6 While we know of no empirical evidence for which gender should value relationships more, Weisman and
Teitelbaum (1985) and Cooper-Patrick et al. (1999) have identified gender concordance as factors that affect the
patient-physician relationship. 7 Due to the Federal Health Care Quality Improvement Act (HCQIA), all malpractice payments—either as
part of a settlement or as part of a court judgment—made by or on behalf of a licensed health care provider must be
reported within 30 days 8 Since the finest date information we have about the case are years, we cannot use any finer definition of
date (such as months, quarters) to look at the cases that took place right before the law passed and the cases that took
place right after the law passed.
whether the payment was for a court judgment or an out of court settlement. This dataset has
been widely used in many studies related to medical malpractice (see Baicker & Chandra, 2005;
Chandra, Nundy, & Seabury, 2005; Durrance, 2009; Matsa, 2007). We restrict our analysis to
the reports in which adverse events occurred after 1991 due to the incomplete reporting in the
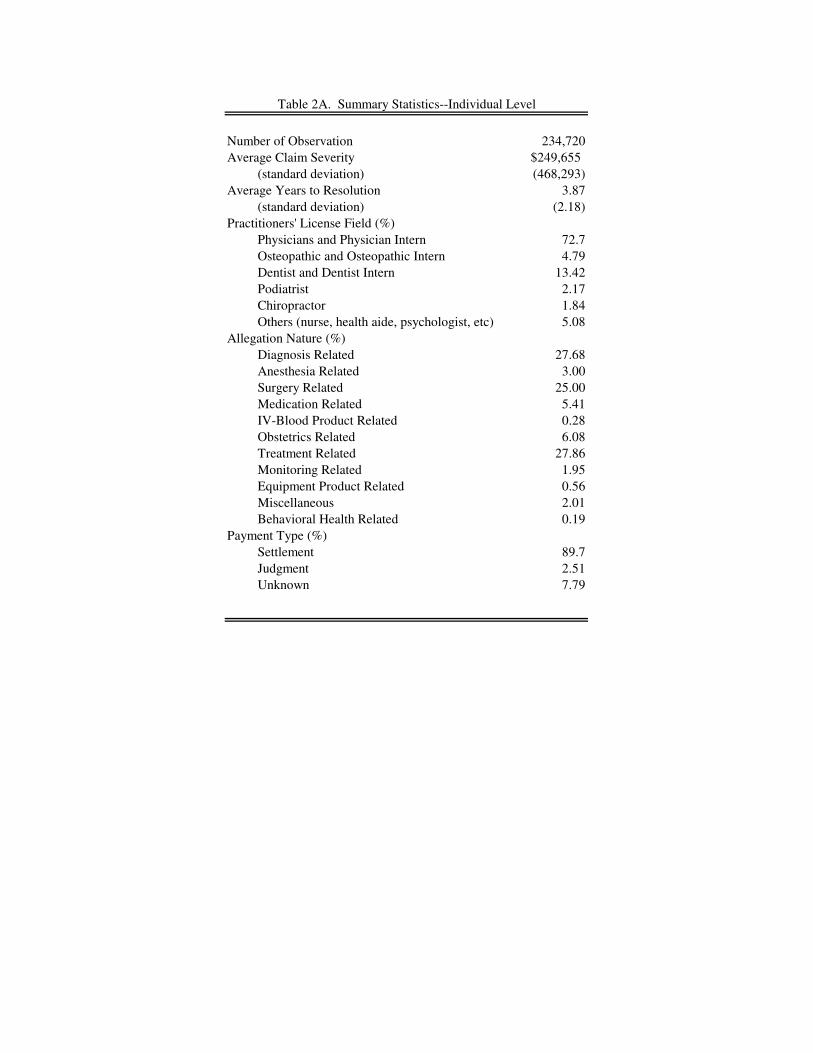
earlier years and include events up until 2009. Table 2A provides summary statistics at the
individual level. There are a total of 234,826 payment reports in our sample.9
It is important to acknowledge that because payments by institutions are not recorded,
there is a “corporate shield” loophole, through which settlement payments made on behalf of a
practitioner by an institution are not recorded in NPDB. Chandra, Nundy, and Seabury (2005)
compare data from the NPDB with other sources of malpractice information from California and
New York and while they find approximately 20% of cases are excluded from the NPDB in this
way, they find that case characteristics do not differ between the NPDB and databases that
included institutional payments. Notably, California passed an apology law in 2000, yet Chandra
et al. (2005) did not observe any time trend or discontinuity in differences between the NPDB
and their California dataset. This at least suggests that the apology laws are not systematically
shifting lawsuits from doctors to institutions and thus should not bias our results. Also since the
focus of our study is on the differences between subgroup, the corporate shield only matters if
the effect differs by sub-population. Otherwise our results should be interpreted with the caveat
that we are finding the effect of apologies on payments made against individuals.
Table 2A shows the average claim payout reported in NPDB to be $249,654 and 3.87
years is the average time to reach a resolution. NPDB includes malpractice cases against all
health practitioners, which expands beyond physicians. Malpractices claims against physicians
9 For state level summary statistics, please see details in Ho and Liu (2010).

are the most frequent being 72.7% of all reported cases in NPDB, and claims against dentists
come second, being 13.42% of the cases. When cases are broken down by allegation nature,
27.7% of cases are diagnosis related, 25% of cases are surgery related, and 27.9% of cases are
treatment related. Most payments in the dataset are a result of a settlement, and only 2.5% of all
reported cases are a result of a judgment. However, we should be cautious that cases that go to
court could take longer to reach resolution and thus have not been included in our dataset, and
the summary statistics could grossly underestimate the number of cases that may one day resolve
in court.
[Insert Table 2A About Here]
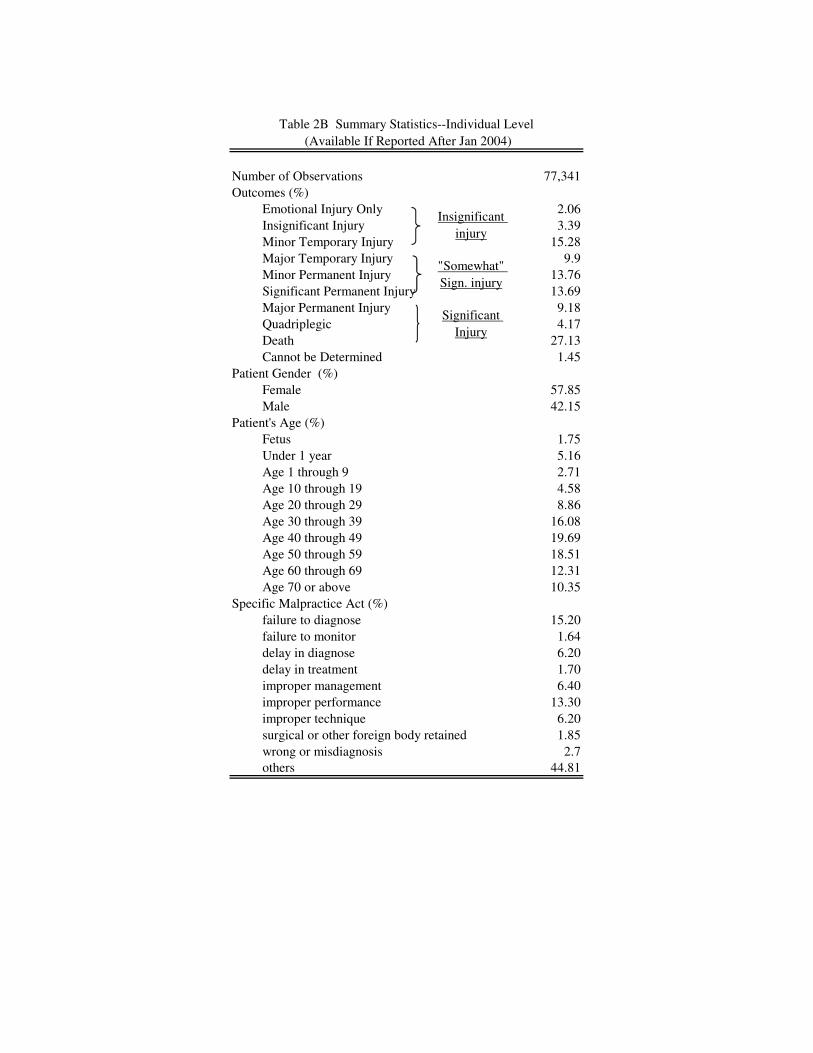
For payments filed after Jan 31, 2004, NPDB requires further information on the outcome
of the incident (e.g., emotional injury, minor temporary injury, major permanent injury, death,
etc.), the specific malpractice act (e.g. failure to diagnose, failure to monitor, delay in treatment,
improper technique, wrong diagnose, etc), and the patient’s age and gender. The summary
statistics of the subsample is presented in Table 2B. The breakdown of medical outcome shows
that 27% of claims involved the death of the patient.10
At the other extreme, 5.4% of cases are
deemed as emotional injury and insignificant injury by the person who files the report. More
women (57.85%) filed malpractice claims than men (42.15%). Patients of age 40 through 49 are
the most frequently age group in the dataset. As for the specific cause of malpractice, NPDB has
listed nearly 100 reason codes, of which up to two can be chosen. We use the first listed reason
code. In Table 2B, we only list reason codes that account for more than 1% of claims. From the
10 With further examination, interestingly most death occur for patients whose age is age 40-49 (19.7%) and
second highest being age 50-59 (18.5%) In contrast to popular belief, less than 7% of cases results in death involved
an infant before age 1.
distribution of reason codes, one can see that most malpractice reasons are diagnosis or treatment
related.
[Insert Table 2B About Here]
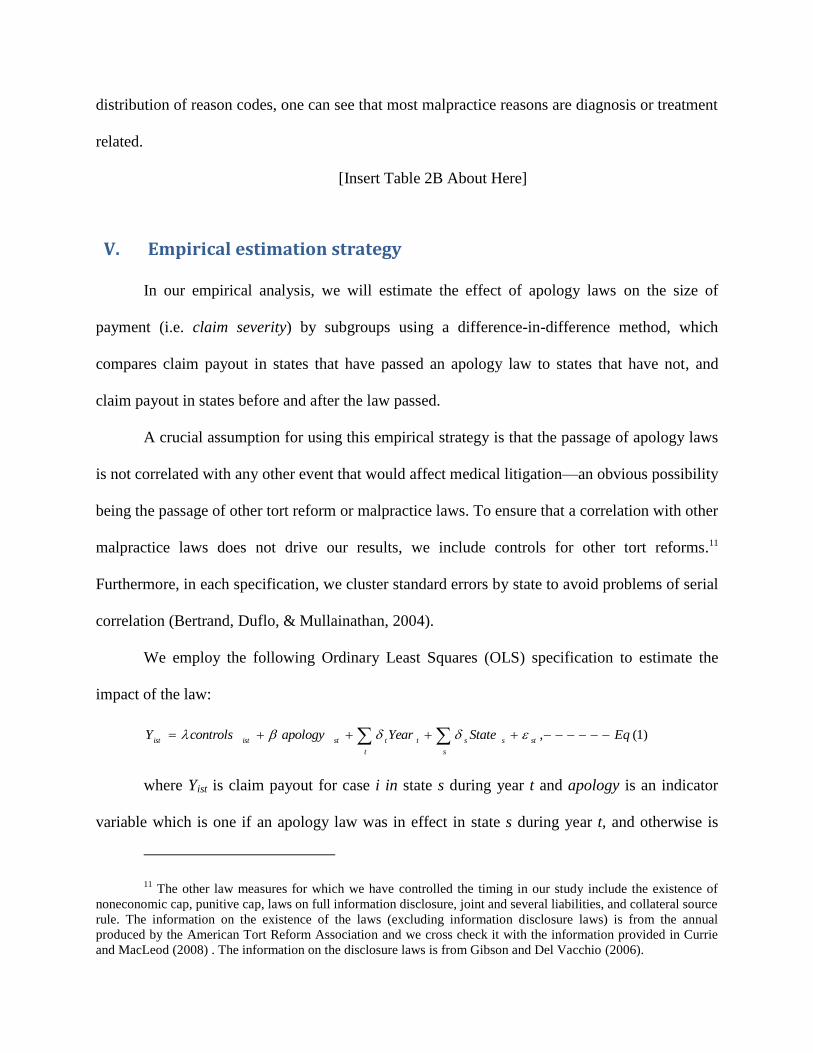
V. Empirical estimation strategy
In our empirical analysis, we will estimate the effect of apology laws on the size of
payment (i.e. claim severity) by subgroups using a difference-in-difference method, which
compares claim payout in states that have passed an apology law to states that have not, and
claim payout in states before and after the law passed.
A crucial assumption for using this empirical strategy is that the passage of apology laws
is not correlated with any other event that would affect medical litigation—an obvious possibility
being the passage of other tort reform or malpractice laws. To ensure that a correlation with other
malpractice laws does not drive our results, we include controls for other tort reforms.11
Furthermore, in each specification, we cluster standard errors by state to avoid problems of serial
correlation (Bertrand, Duflo, & Mullainathan, 2004).
We employ the following Ordinary Least Squares (OLS) specification to estimate the
impact of the law:
)1(, EqStateYearapologycontrolsYsts
s
st
t
tstistist
where Yist is claim payout for case i in state s during year t and apology is an indicator
variable which is one if an apology law was in effect in state s during year t, and otherwise is
11 The other law measures for which we have controlled the timing in our study include the existence of
noneconomic cap, punitive cap, laws on full information disclosure, joint and several liabilities, and collateral source
rule. The information on the existence of the laws (excluding information disclosure laws) is from the annual
produced by the American Tort Reform Association and we cross check it with the information provided in Currie
and MacLeod (2008) . The information on the disclosure laws is from Gibson and Del Vacchio (2006).

zero. Our main coefficients of interest are β. β represent the change in claim payout due to the
adoption of the apology law. The result is presented in Column 1 Table 3. We are interested in
how the value of apology could be different across subgroups (i.e. practitioner’s licensed field,
allegation nature, patient’s age, patient’s gender and specific act of malpractice). Therefore, we
estimate Eq (1) with a set of interaction terms between the subgroup and the indicator for
apology law. For example, if we are interested in how the effectiveness of apology laws could
different across license field (physicians, osteopathic physician, dentists, podiatrists, or
chiropractors), we would estimate:
)2(,
*)()(
EqStateYear
apologyldLicenseFieldLicenseFiecontrolsY
sts
s
st
t
t
stil
l
lil
l
listist
The vector of coefficients δ would inform us which licensed field has higher claim
payout. The α’s represent the change in claim payout for each license field due to the apology
laws. The results by allegation natures are presented in Table 3. The remaining tables consider
other partitions of the data. Table 4 considers the effects of the law by the specific act of
allegation nature, Table 5 by licensing field, Table 6 by the patients’ age group and Table 7 by
the patients’ gender.
VI. Results
Table 3 reports OLS results broken down by the nature of the allegation. Column 1
presents the aggregate effect of the apology law on the size of claim payments and finds that
cases in states with the law have payments that are $32,342 (12.8%) less than cases in states
before the law was passed or where the law was never passed at all. All specifications control for

the implementation of other state-level tort reform laws, the physician’s experience and whether
the payment was a settlement or judgment12
as well as state- and year- fixed effects.
[Insert Table 3 About Here]
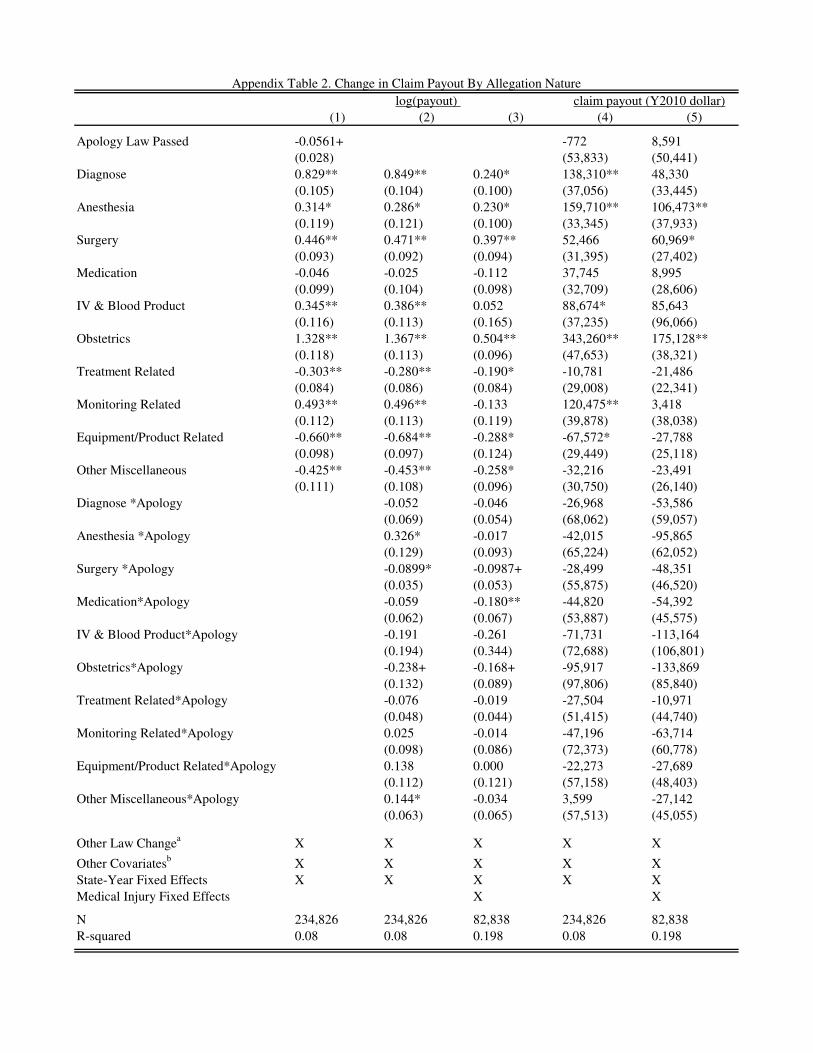
In Column 2, we decompose the effect of apologies by allegation nature (the NPDB
categorizes allegations as Diagnosis, Anesthesia, Surgery, Medication, IV, Obstetrics, Treatment,
Monitoring, Equipment or Other). Column 3 adds controls for medical injury, though we lose
many of our observations since injuries were not reported until 2004. The omitted category is
behaviorial health. We find the effect varies substantially by allegation nature, with apologies
for obstetric related claims having the highest value at $125,000, followed by anesthesia
($87,000), monitoring ($55,000), medication ($46,000) and diagnosis ($45,000). There is a
censoring problem because medical malpractice payments are constrained to be non-negative.
Thus Columns 4 and 5 repeat the analysis using a Tobit specification and find largely similar
results. However, as shown in Ai and Norton (2003) and Norton, Wang and Ai (2004), the
marginal effect of a change in both interacted variables is not equal to the marginal effect of
changing the interaction term, thus the coefficient and the standard errors of interaction terms in
non-linear modesl such as tobit, logit and probit needs to be handled with caution.Therefore, for
the rest of the paper, we focus on the OLS results.
As reported in Column 3,we find that obstetrics cases payout would reduce by $125,000
and anesthesia claim payout would reduce by $45,000 (relative to the default category) if the
states have the apology laws. While it is perhaps unsurprising that the largest effects were found
in cases involving obstetrics and anesthesia since such cases have the highest average base claim
severities, it is notable that the value of apologies for diagnosis and monitoring related claims are
12 We also run specifications where payment type is omitted, or where all cases that were settled in court
were excluded, and find largely the same coefficients.

also high relative.to their base rate. This difference could be attributed to the difference between
mistakes of commission versus mistakes of omission. Table 4 provides considers such
differences in further detail.
[Insert Table 4 About Here]
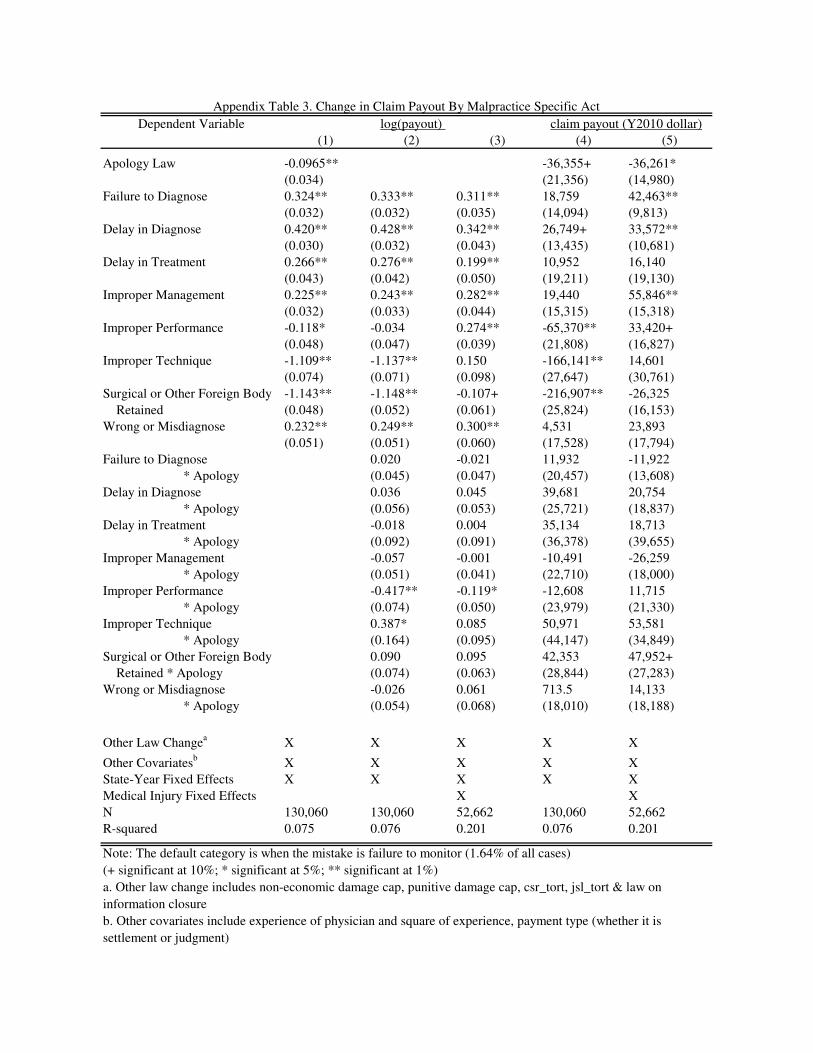
In Table 4, we decompose claim payouts by the specific act of malpractice. In NPDB, all
reports filed after Jan 2004 are required to choose 1 or 2 reason codes out of 100 provided reason
codes. We exclude all reason codes which were chosen less than 1% of the time, and we are
left with 130,060 cases. The regression result is presented in Table 4. The default category is
when the mistake is “Failure to Monitor”. We find that there is huge variance in terms of claim
payout by type of mistake (Column 1). Some mistakes are much more costly compared to
others—the claim payout for “Failure to Diagnose” would be $231,000 more than “Surgical or
Other Foreign Body Retained”, unconditional on malpractice injuries. While the cost of mistakes
vary dramatically, the effectiveness of apology vary less. For certain malpractice reasons, such
as “Improper Management”, “Improper Performance” and “Wrong or Misdiagnosis”,
apologizing could reduce claim sizes by $33,000-$46,000 per case (Column 2). However, this
difference in the value of apology could be due to the difference in medical injury outcomes.
Therefore, in Column 3, we again include a set of indicators controlling for the type of injuries,
and find less variation in payout across reasons for mistakes. We still do observe that some
mistakes would benefit more from apologies, including “Failure to Diagnose” and “Improper
Management”.
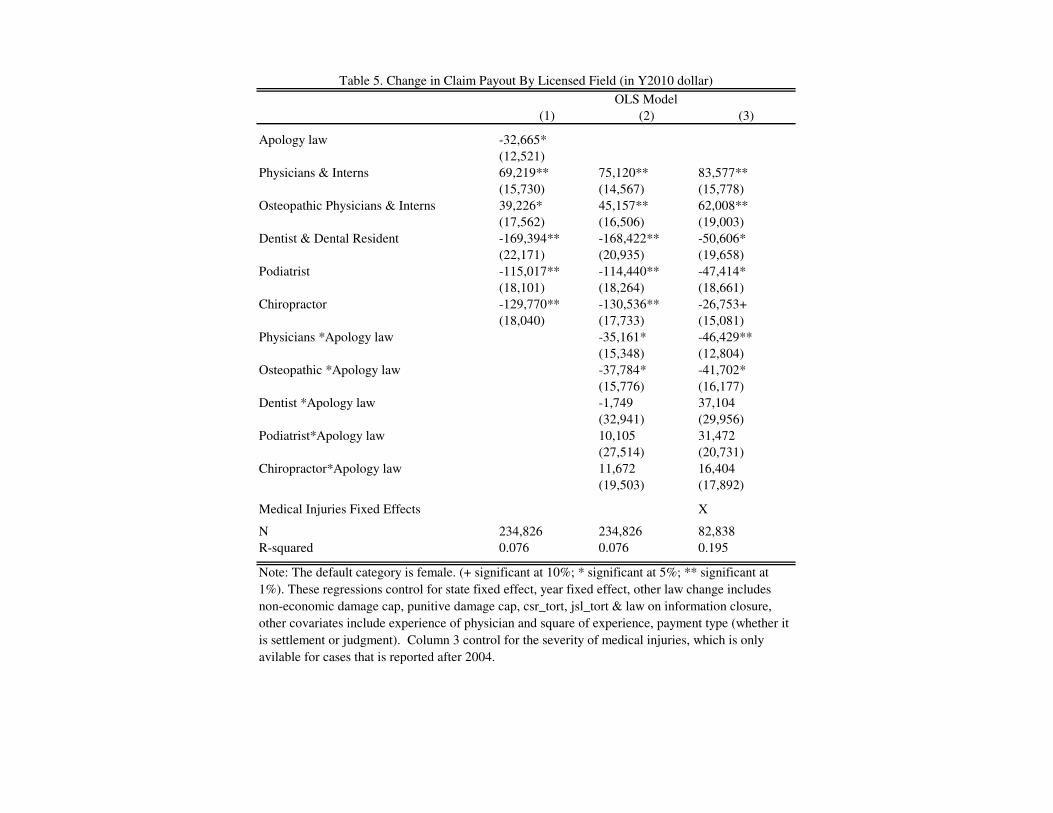
[Insert Table 5 About Here]
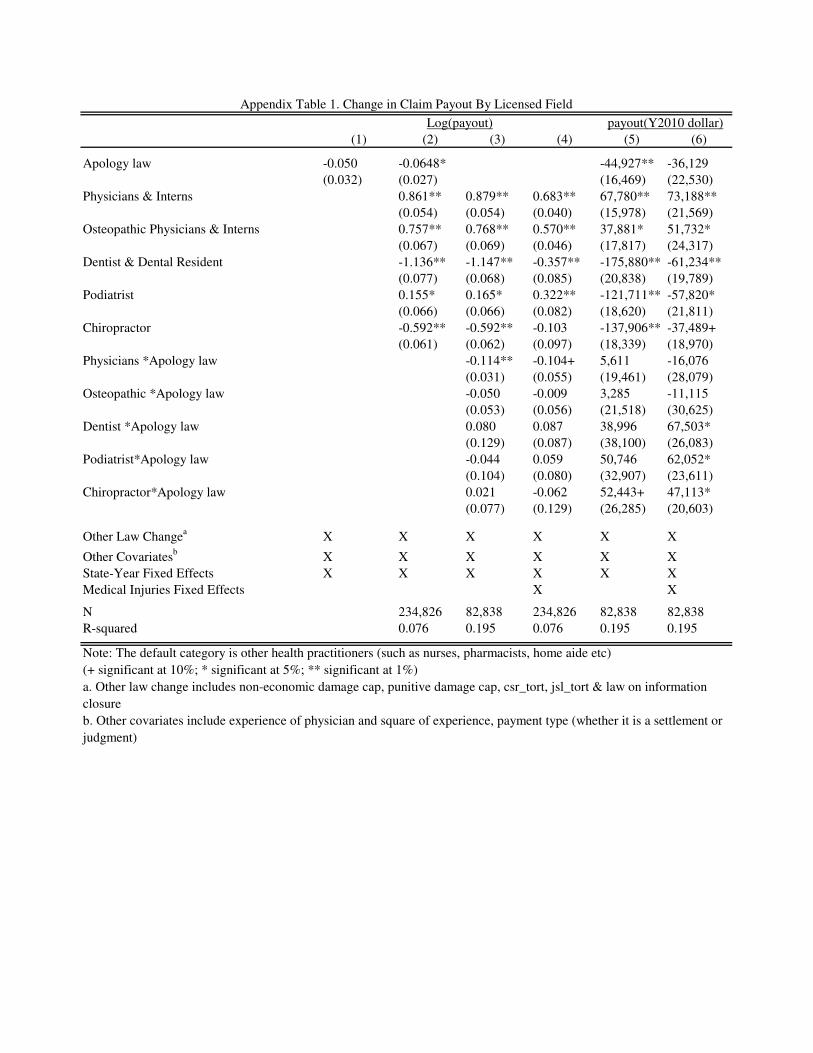
Table 5 decomposes the apology effect by the licensing field of the practitioner. Column
1 finds that cases involving physicians or osteopathic physicians are associated with significantly
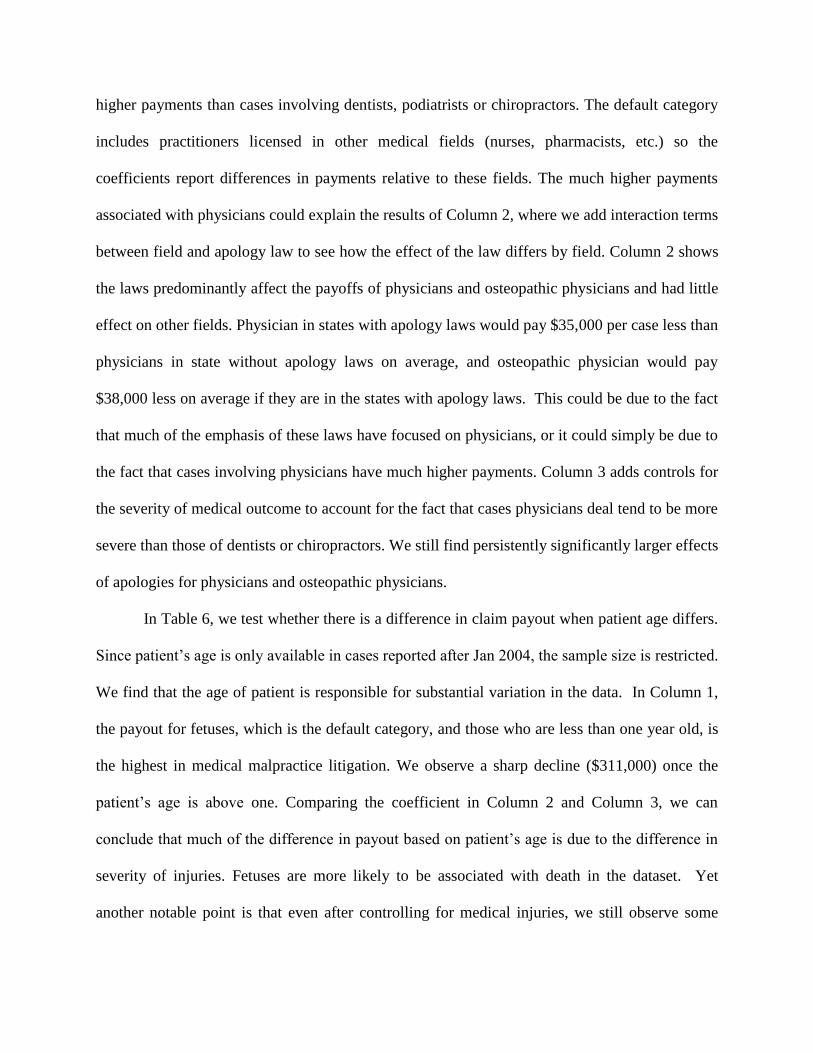
higher payments than cases involving dentists, podiatrists or chiropractors. The default category
includes practitioners licensed in other medical fields (nurses, pharmacists, etc.) so the
coefficients report differences in payments relative to these fields. The much higher payments
associated with physicians could explain the results of Column 2, where we add interaction terms
between field and apology law to see how the effect of the law differs by field. Column 2 shows
the laws predominantly affect the payoffs of physicians and osteopathic physicians and had little
effect on other fields. Physician in states with apology laws would pay $35,000 per case less than
physicians in state without apology laws on average, and osteopathic physician would pay
$38,000 less on average if they are in the states with apology laws. This could be due to the fact
that much of the emphasis of these laws have focused on physicians, or it could simply be due to
the fact that cases involving physicians have much higher payments. Column 3 adds controls for
the severity of medical outcome to account for the fact that cases physicians deal tend to be more
severe than those of dentists or chiropractors. We still find persistently significantly larger effects
of apologies for physicians and osteopathic physicians.
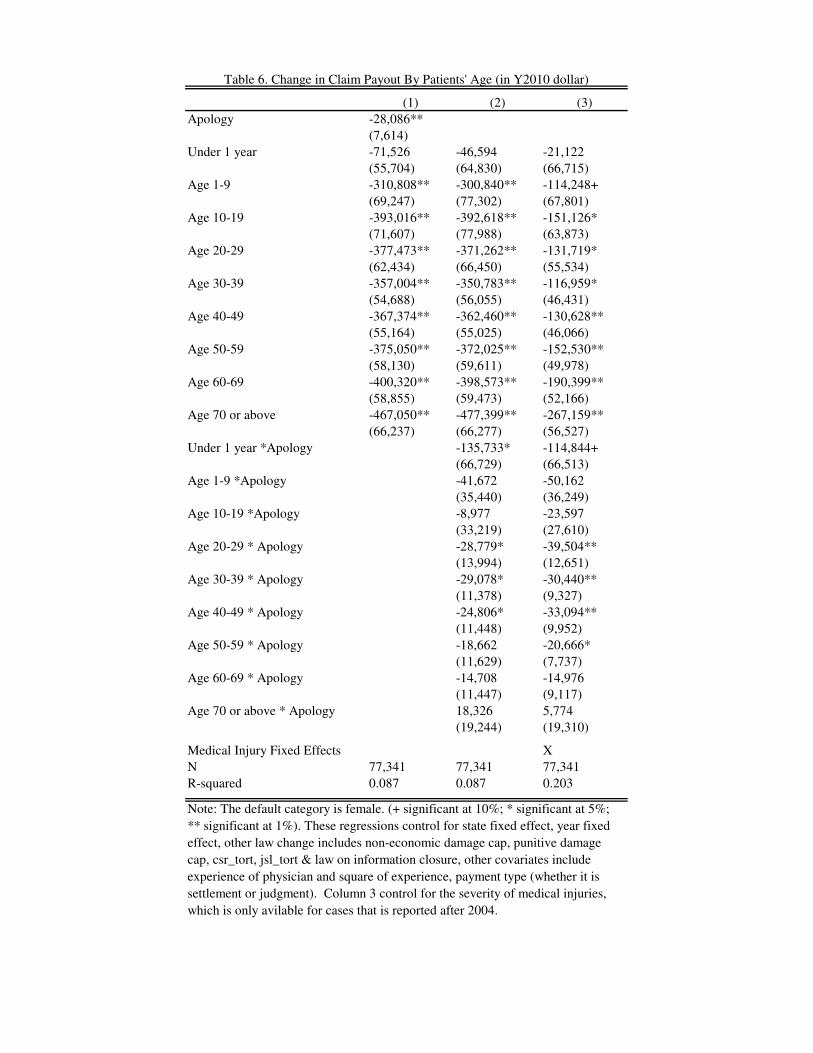
In Table 6, we test whether there is a difference in claim payout when patient age differs.
Since patient’s age is only available in cases reported after Jan 2004, the sample size is restricted.
We find that the age of patient is responsible for substantial variation in the data. In Column 1,
the payout for fetuses, which is the default category, and those who are less than one year old, is
the highest in medical malpractice litigation. We observe a sharp decline ($311,000) once the
patient’s age is above one. Comparing the coefficient in Column 2 and Column 3, we can
conclude that much of the difference in payout based on patient’s age is due to the difference in
severity of injuries. Fetuses are more likely to be associated with death in the dataset. Yet
another notable point is that even after controlling for medical injuries, we still observe some

differences in payouts depending upon patients’ age. Most importantly, apologizing to the family
when the patient is less than 1 year old would significantly reduce the claims by $115,000.
Column 3 suggests that the effect of apologies appears to be declining with the age of the patient.
[Insert Table 6 About Here]
In Table 7, we examine the difference in payouts for male versus female patients, and
whether apologies are more effective on male or female patients. We find that claim payout is
between $17,000 to $57,000 higher when the patient is male depending on specification, even
after controlling for the outcome of the medical injury. This may explain why apologies are
$22,000 to $23,000 more effective at reducing payment sizes when the patient is male than when
the patient is female.
[Insert Table 7 About Here]
VII. Discussion and Threats to Validity
For the purpose of estimating the value of apology, it would be ideal if there are some
estimates of the frequency of apologies before and after the apology law passed. Then we could
back out the value of apology with some assumptions. However, we have not been able to locate
such information. Therefore, given the restriction, it would be helpful to understand whether our
estimates provide an upper bound or a lower bound.
If it were the case that doctors always apologize after the law is passed, and never
apologize before the law is passed, then the estimated effect of the law would equal the full
effect of the apology. However, since it is likely that some apologies would have occurred with
or without the law, the average effect of the law (which is what we have estimated above) would
underestimate the average effect of apologies. As a result, our estimate serves as a lower bound
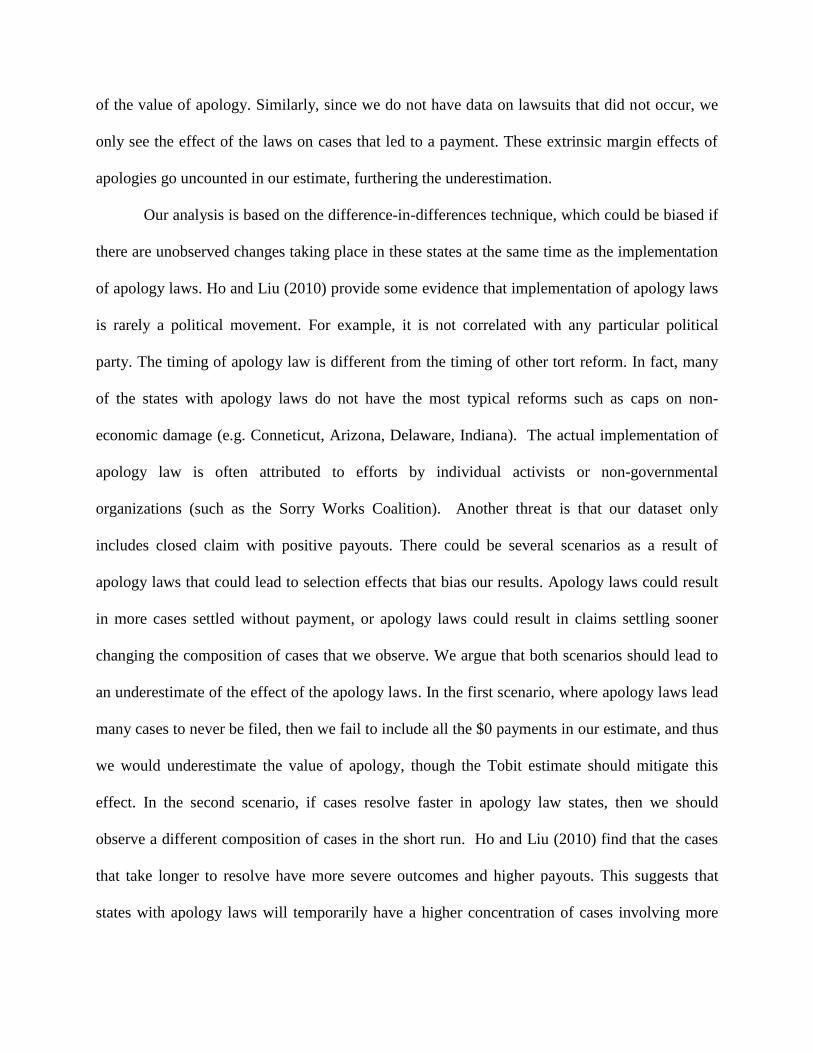
of the value of apology. Similarly, since we do not have data on lawsuits that did not occur, we
only see the effect of the laws on cases that led to a payment. These extrinsic margin effects of
apologies go uncounted in our estimate, furthering the underestimation.
Our analysis is based on the difference-in-differences technique, which could be biased if
there are unobserved changes taking place in these states at the same time as the implementation
of apology laws. Ho and Liu (2010) provide some evidence that implementation of apology laws
is rarely a political movement. For example, it is not correlated with any particular political
party. The timing of apology law is different from the timing of other tort reform. In fact, many
of the states with apology laws do not have the most typical reforms such as caps on non-
economic damage (e.g. Conneticut, Arizona, Delaware, Indiana). The actual implementation of
apology law is often attributed to efforts by individual activists or non-governmental
organizations (such as the Sorry Works Coalition). Another threat is that our dataset only
includes closed claim with positive payouts. There could be several scenarios as a result of
apology laws that could lead to selection effects that bias our results. Apology laws could result
in more cases settled without payment, or apology laws could result in claims settling sooner
changing the composition of cases that we observe. We argue that both scenarios should lead to
an underestimate of the effect of the apology laws. In the first scenario, where apology laws lead
many cases to never be filed, then we fail to include all the $0 payments in our estimate, and thus
we would underestimate the value of apology, though the Tobit estimate should mitigate this
effect. In the second scenario, if cases resolve faster in apology law states, then we should
observe a different composition of cases in the short run. Ho and Liu (2010) find that the cases
that take longer to resolve have more severe outcomes and higher payouts. This suggests that
states with apology laws will temporarily have a higher concentration of cases involving more

severe injuries in the years immediately after the laws are passed. Therefore, even if claim
severity did not change, we would expect a positive coefficient for the effect of apology laws.
Therefore the negative coefficient that we do observe must be driven by the reduction in claim
severity and is an underestimate of the value of apology.
There is a third possibility if doctors’ new penchant to apologize inform patients of
injuries that they had not previously been aware of, then apologies could actually create more
lawsuits. However, Ho and Liu (2010) argue that this possibility is unlikely.
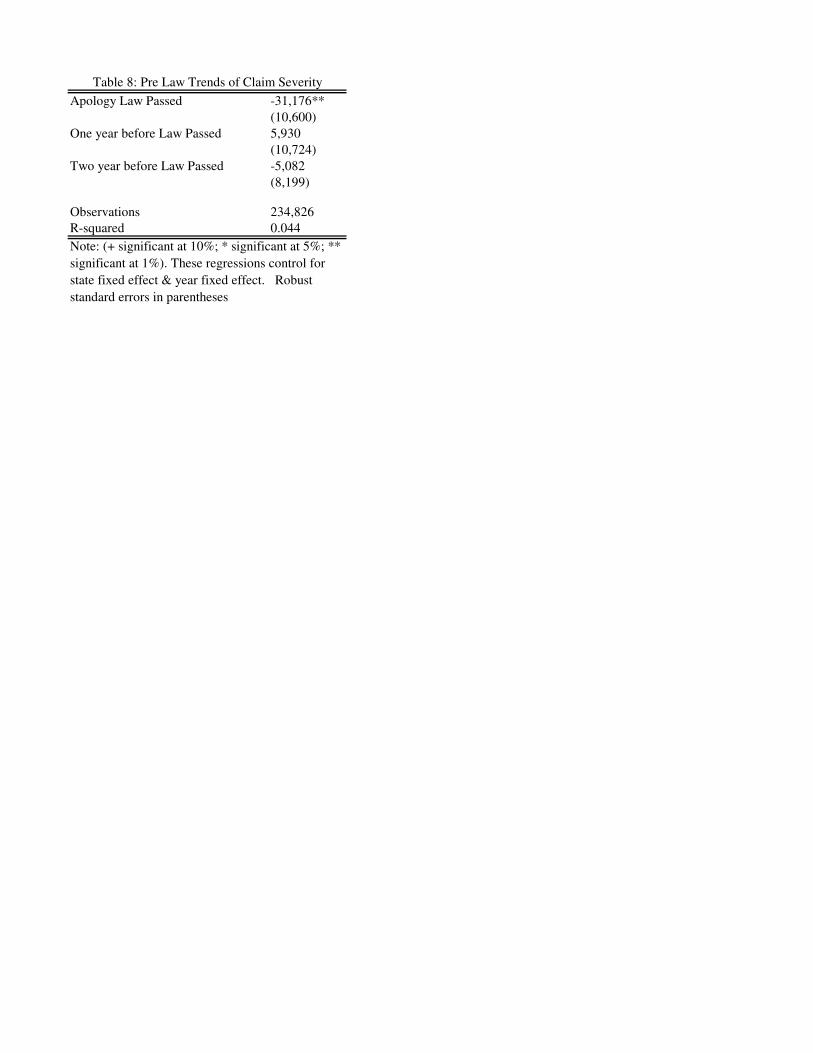
Another concern is that states with apology laws could be intrinsically different or may
have more malpractice claims before the law. To address this concern, Table 8 looks for claim
severity differences in states that passed the law, in the years before the law was passed and finds
no pattern of significance.
[Insert Table 8 About Here]
We now consider several additional specifications to test the robustness of our results.
Columns 1 and 2 of Table 9 consider only cases that were not settled in court by excluding the
3% of cases that were based on court judgment. We find minimal differences with our basic
specification.
[Insert Table 9 About Here]
To address the above issues of selection due to the time truncation problem, columns 3
and columns 4 consider only cases that were initiated before 2004, allowing the cases to have 5
years to resolve, Here again, we obtain largely similar coefficients.
A viable alternate specification is OLS regression on the log of payments, rather than on
the level. We prefer the regression on levels so that we can estimate a dollar value for apologies
in different categories and to facilitate comparisons of the value of apologies between categories

that may have different base rates. However, we include the results of the log specification in the
Appendix.
VIII. Conclusion
Apologies are a common part of everyday experience, yet they also play a significant role
in interactions that have substantial economic consequences such as medical malpractice
litigation. In this study, we take advantage of the implementation of apology laws across the
United States to attempt to quantify the lower bound of the value patients and courts place on
apologies. We also attempt to locate the locus of the effect, and find that apologies are most
effective in cases involving obstetrics and anesthesia, in cases involving improper management
or a failure to diagnose, and in cases involving infants and small children. Apologies have
substantial value either as evidence for the courts, or as a mechanism that helps to alleviate a
patient’s demands for restitution. The identification of the relative importance of each channel
remains open for future work.

IX. References
Ai, C., & Norton, E. C. (2003). Interaction terms in logit and probit models. Economics
Letters, 80(1), 123-129.
Baicker, K., & Chandra, A. (2006). The labor market effects of rising health insurance
premiums. Journal of Labor Economics, 24(3), 609-634.
Boothman, M., Blackwell, A., Campbell, D., Commiskey, E., & Anderson, S. (2009). A better
approach to medical malpractice claims? the university of michigan experience. Journal of
Health Life Science Law, Jan(2), 125-59.
Chandra, A., Nundy, S., & Seabury, S. A. (2005). The growth of physician medical malpractice
payments: Evidence from the national practitioner data bank. Health Affairs, 240
Cohen, J. R. Apology and organizations: Exploring an example from medical practice. Fordham
Urban Law Journal, Vol.27, Pp.1447-1482, 2000,
Cohen, J. R. (2002). Legislating apology: The pros and cons. University of Cincinnati Law
Review, 70, 819-895.
Cooper-Patrick, Lisa, Joseph J. Gallo, Junius J. Gonzales, Hong Thi Vu, Neil R. Powe, Christine
Nelson, Daniel E. Ford (1999) The Patient-Physician Relationship Race, Gender, and
Partnership in the Patient-Physician Relationship. Journal of the American Medical
Association;282(6):583-589.
Currie, J., & MacLeod, W. B. (2008). First do no harm? tort reform and birth
outcomes*. Quarterly Journal of Economics, 123(2), 795-830. Retrieved
fromhttp://dx.doi.org.ezproxy.lib.uh.edu/10.1162/qjec.2008.123.2.795
Division of Practitioner Data Banks, Bureau of Health Professions,Health Resources and
Services Administration. (2004). National practitioner data bank public use data file. DHHS,
Durrance, C. P. (2009). Noneconomic damage caps and medical malpractice claim frequency: A
policy endogeneity approach. J Law Econ Organ, , ewp022. Retrieved from
10.1093/jleo/ewp022; http://jleo.oxfordjournals.org/cgi/content/abstract/ewp022v1
Eisenberg et al. (2006) "Juries, Judges, and Punitive Damages: Empirical Analyses Using the
Civil Justice Survey of State Courts 1992, 1996, and 2001" Journal of Empirical Legal
Studies.
Gallagher, T. H., Waterman, A. D., Ebers, A. G., Fraser, V. J., & Levinson, W. (2003). Patients'
and physicians' attitudes regarding the disclosure of medical errors. JAMA, 289(8), 1001-
1007. Retrieved from 10.1001/jama.289.8.1001; http://jama.ama-
assn.org/cgi/content/abstract/289/8/1001
Hickson, G. B., Clayton, E. W., Githens, P. B., & Sloan, F. A. (11 March, 1992). Factors that
prompted families to file medical malpractice claims following perinatal
injuries. JAMA, 267(10), 1359-1363.

Kraman, S. S., & Hamm, G. (1999). Risk management: Extreme honesty may be the best
policy. Annals of Internal Medicine, 131(12), 963-967. Retrieved
fromhttp://www.annals.org/content/131/12/963.short
Lamb, R. M., Studdert, D. M., Bohmer, R., Berwick, D. M., & Brennan, T. A. Hospital
disclosure practices: Results of a national survey. SSRN eLibrary,
Liebman, C. B., & Hyman, C. S. (2004). A mediation skills model to manage disclosure of errors
and adverse events to patients. Health Aff, 23(4), 22-32. Retrieved from
10.1377/hlthaff.23.4.22;http://content.healthaffairs.org/cgi/content/abstract/23/4/22
Liebman, C. B., & Hyman, C. S. (2005 March). Medical error disclosure, mediation skills, and
malpractice litigation: A demonstration project in project in pennsylvania.
Mastroianni, A. C., Mello, M. M., Sommer, S., Hardy, M., & Gallagher, T. H. (2010). The flaws
in state 'apology' and 'disclosure' laws dilute their intended impact on malpractice
suits. Health Affairs,29(9), 1611-1619.
Matsa, D. A. (2007). Does malpractice liability keep the doctor away? evidence from tort reform
damage caps. Journal of Legal Studies, 36(S2), S143-S182. Retrieved
fromhttp://ideas.repec.org/a/ucp/jlstud/v36y2007is2ps143-s182.html
May, M. L., & Stengel, D. B. (1990). Who sues their doctors? how patients handle medical
grievances. Law & Society Review, 24(1), 105-120. Retrieved
from http://www.jstor.org/stable/3053788
Mazor, K. M., Simon, S. R., Yood, R. A., Martinson, B. C., Gunter, M. J., Reed, G. W., et al.
(2004). Health plan members' views about disclosure of medical errors. Annals of Internal
Medicine, 140(6), 409-418. Retrieved
from http://www.annals.org/content/140/6/409.abstract
McDonnell, W. M., & Guenther, E. (2008). Narrative review: Do state laws make it easier to say
“I'm sorry?”. Annals of Internal Medicine, 149(11), 811-815.
Morse, M. A. (2009). Medical apology laws, mandatory reporting, and adverse event reporting
under the PSQIA. Caesars Palace Las Vegas, NV.
Novack, D. H., Detering, B. J., Arnold, R., Forrow, L., Ladinsky, M., & Pezzullo, J. C. (1989).
Physicians' attitudes toward using deception to resolve difficult ethical
problems. JAMA, 261(20), 2980-2985. Retrieved from
10.1001/jama.1989.03420200070040; http://jama.ama-
assn.org/cgi/content/abstract/261/20/2980
Pinkus, R. (Ed.). (2000). Learning to keep a cautious tongue: The reporting of mistakes in
neurosurgery, 1890 to 1930 (In Zoloth L, ed. ed.). Hagerstown: Md. University Publishing
Group.
Robbennolt, J. K. (2006). Apologies and settlement levers. Journal of Empirical Legal
Studies, 3(2), 333-373.
Robbennolt, J. K. (2003). Apologies and legal settlement: An empirical examination. Michigan
Law Review, 102(3), 460-516. Retrieved from http://www.jstor.org/stable/3595367

Studdert, D. M., Mello, M. M., Gawande, A. A., Brennan, T. A., & Wang, Y. C. (2007).
Disclosure of medical injury to patients: An improbable risk management strategy. Health
Affairs, 26(1), 215-226.
Taft, L. (2000). Apology subverted: The commodification of apology. The Yale Law
Journal, 109(5), 1135-1160. Retrieved from http://www.jstor.org/stable/797485
Vincent, C., Phillips, A., & Young, M. (1994). Why do people sue doctors? A study of patients
and relatives taking legal action. The Lancet, 343(8913), 1609. Retrieved from DOI:
10.1016/S0140-6736(94)93062-7; http://www.sciencedirect.com/science/article/B6T1B-
49KJGGG-H/2/cb181b83929baa48cd490ed386499506
Wei, M. Doctors, apologies, and the law: An analysis and critique of apology laws. Journal of
Health Law, Vol.39, no.4, Fall 2006,
Weisman, C. and, Martha Ann Teitelbaum, (1985) Physician gender and the physician-patient
relationship: Recent evidence and relevant questions, Social Science & Medicine, Volume 20,
Issue 11.
Witman, A. B., Park, D. M., & Hardin, S. B. (1996). How do patients want physicians to handle
mistakes? A survey of internal medicine patients in an academic setting. Archives of
Internal Medicine,156(22), 2565-2569.
Wu, A. W. (1999). Handling hospital errors: Is disclosure the best defense? Annals of Internal
Medicine, 131(12), 970-972. Retrieved
from http://www.annals.org/content/131/12/970.short
Wu, A., Huang, I., Stokes, S., & Pronovost, P. (2009). Disclosing medical errors to patients: It’s
not what you say, It’s what they hear. Journal of General Internal Medicine, 24(9), 1012-
1017. Retrieved from http://dx.doi.org/10.1007/s11606-009-1044-3

State
Year Law
Passed
Full Versus
Partial Statutes
Massachusetts 1986 Partial ALM GL ch. 233, § 23D (1986)
Texas 1999 Partial Tex Civ Prac & Rem Code Ann 18.061 (1999).
California 2000 Partial Cal Evid Code 1160 (2000).
Florida 2001 Partial Fla Stat Ann Ch 90.4026 (2004).
Washington 2002 Partial Rev. Code Wash. §5.66.010(2002)
Tennessee 2003 Partial Tenn. Evid. Rule §409.1
Colorado 2003 Full Colo Rev Stat Sec 13-25-135 (2003)
Oregon 2003 Partial Oreg Rev Stat Sec 677.082 (2003).
Maryland 2004 Partial Md. COURTS AND JUDICIAL PROCEEDINGS Code Ann. § 10-920
North Carolina 2004 Partial N.C. Gen. Stat. § 8C-1, Rule 413 (2004)
Ohio 2004 Partial ORC Ann. 2317.43 (2006)
Oklahoma 2004 Partial (63 Okl. St. § 1-1708.1H
Wyoming 2004 Partial Wyo Stat. § 1-1-130
Connecticut 2005 Full Conn. Gen. Stat. § 52-184d (2005)
Louisiana 2005 Partial La. R.S. 13:3715.5 (2005)
Maine 2005 Partial 24 M.R.S. § 2907 (2005)
Missouri 2005 Partial Mo.Rev.Stat §538.229 (2005)
New Hampshire 2005 Partial N.H.Rev. Stat. Ann. § 507-E:4 (2005)
South Dakota 2005 Partial S.D. Codified Laws § 19-12-14 (2005)
Virginia 2005 Partial Va. Code Ann. §8.01-581.20:1 (2005)
Arizona 2005 Full A.R.S. § 12-2605
Georgia 2005 Full O.C.G.A. § 24-3-37.1
Illinois 2005 Partial 735 ILCS 5/8-1901 (2005)
Montana 2005 Partial Mont. Code Anno., § 26-1-814 (2005)
West Virginia 2005 Partial W. Va. Code § 55-7-11a (2005)
Delaware 2006 Partial Delaware Del. Code Ann. Tit. 10, 4318 (2006)
Idaho 2006 Partial Ida. ALS 204; 2006 Idaho Sess. Laws 204;
Indiana 2006 Partial Ind. HEA 1112
Iowa 2006 Partial Iowa HF 2716 (2006)
South Carolina 2006 Full South Carolina Ch.1, Title19 Code of Laws 1976, 19-1-190 (2006)
Utah 2006 Partial 2006 Ut. SB 41
Vermont 2006 Partial Vermont S 198 Sec. 1. 12 V.S.A. 1912 (2006)
Hawaii 2006 Partial HRS section 626-1, Hawaii Rules of Evidence Rule 409.5
Nebraska 2007 Partial Nebraska Neb. Laws L.B. 373 (2007)
North Dakota 2007 Partial North Dakota ND H.B. 1333 (2007)
District of Columbia 2007 Partial D.C. Code 16-2841 (2007)
Table 1. State with Statutes Pertaining to Apology Law
Number of Observation 234,720
Average Claim Severity $249,655
(standard deviation) (468,293)
Average Years to Resolution 3.87
(standard deviation) (2.18)
Practitioners' License Field (%)
Physicians and Physician Intern 72.7
Osteopathic and Osteopathic Intern 4.79
Dentist and Dentist Intern 13.42
Podiatrist 2.17
Chiropractor 1.84
Others (nurse, health aide, psychologist, etc) 5.08
Allegation Nature (%)
Diagnosis Related 27.68
Anesthesia Related 3.00
Surgery Related 25.00
Medication Related 5.41
IV-Blood Product Related 0.28
Obstetrics Related 6.08
Treatment Related 27.86
Monitoring Related 1.95
Equipment Product Related 0.56
Miscellaneous 2.01
Behavioral Health Related 0.19
Payment Type (%)
Settlement 89.7
Judgment 2.51
Unknown 7.79
Table 2A. Summary Statistics--Individual Level
Number of Observations 77,341
Outcomes (%)
Emotional Injury Only 2.06
Insignificant Injury 3.39
Minor Temporary Injury 15.28
Major Temporary Injury 9.9
Minor Permanent Injury 13.76
Significant Permanent Injury 13.69
Major Permanent Injury 9.18
Quadriplegic 4.17
Death 27.13
Cannot be Determined 1.45
Patient Gender (%)
Female 57.85
Male 42.15
Patient's Age (%)
Fetus 1.75
Under 1 year 5.16
Age 1 through 9 2.71
Age 10 through 19 4.58
Age 20 through 29 8.86
Age 30 through 39 16.08
Age 40 through 49 19.69
Age 50 through 59 18.51
Age 60 through 69 12.31
Age 70 or above 10.35
Specific Malpractice Act (%)
failure to diagnose 15.20
failure to monitor 1.64
delay in diagnose 6.20
delay in treatment 1.70
improper management 6.40
improper performance 13.30
improper technique 6.20
surgical or other foreign body retained 1.85
wrong or misdiagnosis 2.7
others 44.81
Insignificant
injury
"Somewhat"
Sign. injury
Significant
Injury
Table 2B Summary Statistics--Individual Level
(Available If Reported After Jan 2004)

(1) (2) (3) (4) (5)
Apology Law Passed -32,342** -34,593**
(11,343) (4,271)
Diagnosis 127,391** 138,584** 45,305+ 130,272** 142,467**
(31,281) (30,126) (26,994) (21,699) (21,751)
Anesthesia 146,936** 159,985** 103,445** 149,300** 163,438**
(29,003) (28,448) (33,362) (22,283) (22,414)
Surgery 41,395 52,740* 57,942* 45,954* 58,232**
(27,185) (26,063) (22,967) (21,703) (21,756)
Medication 24,494 38,019 5,965 25,962 40,359+
(27,307) (26,680) (24,446) (21,989) (22,087)
IV & Blood Product 71,290* 88,949** 82,622 71,911** 91,140**
(27,736) (28,362) (96,906) (27,888) (28,881)
Obstetrics 325,217** 343,535** 172,106** 329,770** 348,994**
(44,107) (42,337) (28,450) (21,954) (22,035)
Treatment Related -21,653 -10,506 -24,515 -20,965 -9,315
(23,679) (23,193) (19,202) (21,696) (21,746)
Monitoring Related 105,754** 120,749** 393 107,460** 123,631**
(32,727) (32,746) (30,371) (22,613) (22,912)
Equipment/Product Related -76,812** -67,297** -30,817 -75,466** -66,497*
(25,631) (24,736) (23,510) (24,927) (25,892)
Other Miscellaneous -35,160 -31,941 -26,525 -33,908 -30,683
(26,120) (23,712) (21,486) (22,595) (22,932)
Diagnosis *Apology -27,736 -45,128** -31,806**
(24,000) (16,194) (6,635)
Anesthesia *Apology -42,783+ -87,399** -47,220**
(23,434) (28,877) (16,415)
Surgery *Apology -29,267** -39,886** -32,471**
(10,618) (9,288) (6,518)
Medication*Apology -45,588** -45,923* -48,286**
(14,491) (17,574) (12,048)
IV & Blood Product*Apology -72,499* -104,697 -79,827
(32,461) (98,683) (49,585)
Obstetrics*Apology -96,685 -125,416* -99,937**
(68,750) (54,470) (12,930)
Treatment Related*Apology -28,272+ -2,505 -28,323**
(14,641) (13,008) (5,957)
Monitoring Related*Apology -47,964+ -55,253* -51,938**
(26,358) (25,013) (16,594)
Equipment/Product Related*Apology -23,041 -19,218 -19,496
(23,730) (27,045) (29,464)
Other Miscellaneous*Apology 2,830 -18,678 3,971
(19,054) (15,279) (15,637)
Medical Injury Fixed Effects X
N 234,826 234,826 82,838 234,826 234,826
R-squared 0.08 0.08 0.198
Table 3. Change in Claim Payout By Allegation Nature (in Y2010 dollar)
OLS Model Tobit Model

Note: The default category is A33. (+ significant at 10%; * significant at 5%; ** significant at 1%). All regressions
control for state fixed effects, year fixed effects, other law change includes non-economic damage cap, punitive
damage cap, csr_tort, jsl_tort & law on information closure and other covariates include experience of physician
and square of experience, payment type (whether it is settlement or judgment). Column 3 control for the severity of
medical injuries, which is only avilable for cases that is reported after 2004.

(1) (2) (3)
Apology Law -27,257**
(9,581)
Failure to Diagnose 21,360+ 27,039* 52,310**
(11,128) (11,307) (8,277)
Delay in Diagnose 32,554** 35,059** 43,368**
(10,356) (10,468) (8,915)
Delay in Treatment 17,798 19,338 26,113
(16,743) (16,254) (17,323)
Improper Management 19,493+ 27,740* 65,731**
(11,547) (11,909) (14,124)
Improper Performance -67,312** -56,986** 43,338**
(16,539) (19,145) (14,638)
Improper Technique -159,460** -157,846** 24,517
(24,417) (25,165) (29,526)
Surgical or Other Foreign Body -209,787** -208,585** -16,278
Retained (22,610) (23,493) (14,117)
Wrong or Misdiagnose 6,213 12,798 33,817*
(14,094) (15,410) (16,121)
Failure to Diagnose -22,155 -43,132**
* Apology (17,140) (12,246)
Delay in Diagnose 5,530 -10,424
* Apology (19,955) (17,145)
Delay in Treatment 794 -12,604
* Apology (31,426) (36,004)
Improper Management -44,590* -57,268**
* Apology (16,683) (11,993)
Improper Performance -46,789** -19,430
* Apology (10,429) (13,674)
Improper Technique 16,783 22,209
* Apology (38,347) (28,673)
Surgical or Other Foreign Body 8,120 16,420
Retained * Apology (20,619) (22,653)
Wrong or Misdiagnose -33,474** -17,097
* Apology (8,608) (12,651)
Medical Injury Fixed Effects X
N 130,060 130,060 52,662
R-squared 0.075 0.076 0.201
OLS Model
Table 4. Change in Claim Payout By Malpractice Specific Act (in Y2010
dollar)
Note: The default category is female. (+ significant at 10%; * significant at
5%; ** significant at 1%). These regressions control for state fixed effect,
year fixed effect, other law change includes non-economic damage cap,
punitive damage cap, csr_tort, jsl_tort & law on information closure, other
covariates include experience of physician and square of experience,
payment type (whether it is settlement or judgment). Column 3 control for
the severity of medical injuries, which is only avilable for cases that is
reported after 2004.
(1) (2) (3)
Apology law -32,665*
(12,521)
Physicians & Interns 69,219** 75,120** 83,577**
(15,730) (14,567) (15,778)
Osteopathic Physicians & Interns 39,226* 45,157** 62,008**
(17,562) (16,506) (19,003)
Dentist & Dental Resident -169,394** -168,422** -50,606*
(22,171) (20,935) (19,658)
Podiatrist -115,017** -114,440** -47,414*
(18,101) (18,264) (18,661)
Chiropractor -129,770** -130,536** -26,753+
(18,040) (17,733) (15,081)
Physicians *Apology law -35,161* -46,429**
(15,348) (12,804)
Osteopathic *Apology law -37,784* -41,702*
(15,776) (16,177)
Dentist *Apology law -1,749 37,104
(32,941) (29,956)
Podiatrist*Apology law 10,105 31,472
(27,514) (20,731)
Chiropractor*Apology law 11,672 16,404
(19,503) (17,892)
Medical Injuries Fixed Effects X
N 234,826 234,826 82,838
R-squared 0.076 0.076 0.195
Table 5. Change in Claim Payout By Licensed Field (in Y2010 dollar)
OLS Model
Note: The default category is female. (+ significant at 10%; * significant at 5%; ** significant at
1%). These regressions control for state fixed effect, year fixed effect, other law change includes
non-economic damage cap, punitive damage cap, csr_tort, jsl_tort & law on information closure,
other covariates include experience of physician and square of experience, payment type (whether it
is settlement or judgment). Column 3 control for the severity of medical injuries, which is only
avilable for cases that is reported after 2004.
(1) (2) (3)
Apology -28,086**
(7,614)
Under 1 year -71,526 -46,594 -21,122
(55,704) (64,830) (66,715)
Age 1-9 -310,808** -300,840** -114,248+
(69,247) (77,302) (67,801)
Age 10-19 -393,016** -392,618** -151,126*
(71,607) (77,988) (63,873)
Age 20-29 -377,473** -371,262** -131,719*
(62,434) (66,450) (55,534)
Age 30-39 -357,004** -350,783** -116,959*
(54,688) (56,055) (46,431)
Age 40-49 -367,374** -362,460** -130,628**
(55,164) (55,025) (46,066)
Age 50-59 -375,050** -372,025** -152,530**
(58,130) (59,611) (49,978)
Age 60-69 -400,320** -398,573** -190,399**
(58,855) (59,473) (52,166)
Age 70 or above -467,050** -477,399** -267,159**
(66,237) (66,277) (56,527)
Under 1 year *Apology -135,733* -114,844+
(66,729) (66,513)
Age 1-9 *Apology -41,672 -50,162
(35,440) (36,249)
Age 10-19 *Apology -8,977 -23,597
(33,219) (27,610)
Age 20-29 * Apology -28,779* -39,504**
(13,994) (12,651)
Age 30-39 * Apology -29,078* -30,440**
(11,378) (9,327)
Age 40-49 * Apology -24,806* -33,094**
(11,448) (9,952)
Age 50-59 * Apology -18,662 -20,666*
(11,629) (7,737)
Age 60-69 * Apology -14,708 -14,976
(11,447) (9,117)
Age 70 or above * Apology 18,326 5,774
(19,244) (19,310)
Medical Injury Fixed Effects X
N 77,341 77,341 77,341
R-squared 0.087 0.087 0.203
Table 6. Change in Claim Payout By Patients' Age (in Y2010 dollar)
Note: The default category is female. (+ significant at 10%; * significant at 5%;
** significant at 1%). These regressions control for state fixed effect, year fixed
effect, other law change includes non-economic damage cap, punitive damage
cap, csr_tort, jsl_tort & law on information closure, other covariates include
experience of physician and square of experience, payment type (whether it is
settlement or judgment). Column 3 control for the severity of medical injuries,
which is only avilable for cases that is reported after 2004.

(1) (2) (3)
Apology -34,754**
(8,123)
Male Patient 49,765** 56,756** 17,101**
(4,512) (5,679) (6,240)
Male Patient * Apology -23,385** -22,203**
(7,526) (6,614)
Medical Injury Fixed Effects X
N 82,534 82,534 82,534
R-squared 0.057 0.056 0.193
Table 7. Change in Claim Payout By Patients' Gender (in Y2010 dollar)
Note: The default category is female. (+ significant at 10%; * significant at 5%; ** significant
at 1%). These regressions control for state fixed effect, year fixed effect, other law change
includes non-economic damage cap, punitive damage cap, csr_tort, jsl_tort & law on
information closure, other covariates include experience of physician and square of
experience, payment type (whether it is settlement or judgment). Column 3 control for the
severity of medical injuries, which is only avilable for cases that is reported after 2004.
Apology Law Passed -31,176**
(10,600)
One year before Law Passed 5,930
(10,724)
Two year before Law Passed -5,082
(8,199)
Observations 234,826
R-squared 0.044
Table 8: Pre Law Trends of Claim Severity
Note: (+ significant at 10%; * significant at 5%; **
significant at 1%). These regressions control for
state fixed effect & year fixed effect. Robust
standard errors in parentheses

(1) (2) (3) (4)
Apology Law Passed -29,624** -35,035**
(10,330) (12,355)
Diagnosis 127,645** 138,029** 124,732** 132,467**
(32,473) (31,183) (34,578) (34,763)
Anesthesia 144,383** 155,942** 147,613** 154,638**
(30,239) (29,492) (33,001) (33,100)
Surgery 42,487 53,118+ 38,923 47,837
(28,487) (27,535) (32,063) (32,096)
Medication 23,154 34,929 23,233 33,170
(28,706) (28,551) (32,189) (32,000)
IV & Blood Product 69,634* 83,458** 70,533* 81,612*
(29,842) (31,068) (31,078) (31,854)
Obstetrics 313,681** 331,228** 328,438** 339,756**
(46,642) (44,300) (45,510) (45,433)
Treatment Related -19,025 -9,042 -22,850 -14,003
(24,649) (24,377) (29,247) (29,493)
Monitoring Related 110,901** 125,787** 104,389** 113,765**
(34,120) (33,877) (35,767) (36,387)
Equipment/Product Related -74,461** -67,635* -72,214* -67,291*
(26,623) (25,811) (32,497) (32,227)
Other Miscellaneous -32,641 -31,453 -43,566 -36,874
(26,410) (24,419) (30,345) (29,576)
Diagnosis *Apology -26,579 -22,364
(23,251) (25,838)
Anesthesia *Apology -35,464 -11,921
(25,119) (31,221)
Surgery *Apology -28,602** -39,127*
(10,238) (15,393)
Medication*Apology -36,533** -52,180*
(12,655) (23,016)
IV & Blood Product*Apology -51,671 -66,889*
(34,536) (25,845)
Obstetrics*Apology -92,835 -72,339
(57,886) (86,949)
Treatment Related*Apology -24,564+ -37,783+
(13,755) (21,444)
Monitoring Related*Apology -48,124+ -41,713
(28,047) (26,514)
Equipment/Product Related*Apology -14,044 -3,952
(22,404) (36,622)
Other Miscellaneous*Apology 8,195 -21,206
(20,262) (24,489)
N 210,344 210,344 207,326 207,326
R-squared 0.077 0.077 0.079 0.079
Dropped Cases that Occurred After 2004
Table 9. Change in Claim Payout By Allegation Nature (in Y2010 dollar)
Dropped Cases that Went to Trial
Note: The default category is behavioral related cases. (+ significant at 10%; * significant at 5%; ** significant at 1%). These
regressions control for state fixed effect, year fixed effect, other law change includes non-economic damage cap, punitive
damage cap, csr_tort, jsl_tort & law on information closure, other covariates include experience of physician and square of
experience, payment type (whether it is settlement or judgment).
(1) (2) (3) (4) (5) (6)
Apology law -0.050 -0.0648* -44,927** -36,129
(0.032) (0.027) (16,469) (22,530)
Physicians & Interns 0.861** 0.879** 0.683** 67,780** 73,188**
(0.054) (0.054) (0.040) (15,978) (21,569)
Osteopathic Physicians & Interns 0.757** 0.768** 0.570** 37,881* 51,732*
(0.067) (0.069) (0.046) (17,817) (24,317)
Dentist & Dental Resident -1.136** -1.147** -0.357** -175,880** -61,234**
(0.077) (0.068) (0.085) (20,838) (19,789)
Podiatrist 0.155* 0.165* 0.322** -121,711** -57,820*
(0.066) (0.066) (0.082) (18,620) (21,811)
Chiropractor -0.592** -0.592** -0.103 -137,906** -37,489+
(0.061) (0.062) (0.097) (18,339) (18,970)
Physicians *Apology law -0.114** -0.104+ 5,611 -16,076
(0.031) (0.055) (19,461) (28,079)
Osteopathic *Apology law -0.050 -0.009 3,285 -11,115
(0.053) (0.056) (21,518) (30,625)
Dentist *Apology law 0.080 0.087 38,996 67,503*
(0.129) (0.087) (38,100) (26,083)
Podiatrist*Apology law -0.044 0.059 50,746 62,052*
(0.104) (0.080) (32,907) (23,611)
Chiropractor*Apology law 0.021 -0.062 52,443+ 47,113*
(0.077) (0.129) (26,285) (20,603)
Other Law Changea
X X X X X X
Other Covariatesb
X X X X X X
State-Year Fixed Effects X X X X X X
Medical Injuries Fixed Effects X X
N 234,826 82,838 234,826 82,838 82,838
R-squared 0.076 0.195 0.076 0.195 0.195
Appendix Table 1. Change in Claim Payout By Licensed Field
Note: The default category is other health practitioners (such as nurses, pharmacists, home aide etc)
(+ significant at 10%; * significant at 5%; ** significant at 1%)
a. Other law change includes non-economic damage cap, punitive damage cap, csr_tort, jsl_tort & law on information
closure
b. Other covariates include experience of physician and square of experience, payment type (whether it is a settlement or
judgment)
payout(Y2010 dollar)Log(payout)
(1) (2) (3) (4) (5)
Apology Law Passed -0.0561+ -772 8,591
(0.028) (53,833) (50,441)
Diagnose 0.829** 0.849** 0.240* 138,310** 48,330
(0.105) (0.104) (0.100) (37,056) (33,445)
Anesthesia 0.314* 0.286* 0.230* 159,710** 106,473**
(0.119) (0.121) (0.100) (33,345) (37,933)
Surgery 0.446** 0.471** 0.397** 52,466 60,969*
(0.093) (0.092) (0.094) (31,395) (27,402)
Medication -0.046 -0.025 -0.112 37,745 8,995
(0.099) (0.104) (0.098) (32,709) (28,606)
IV & Blood Product 0.345** 0.386** 0.052 88,674* 85,643
(0.116) (0.113) (0.165) (37,235) (96,066)
Obstetrics 1.328** 1.367** 0.504** 343,260** 175,128**
(0.118) (0.113) (0.096) (47,653) (38,321)
Treatment Related -0.303** -0.280** -0.190* -10,781 -21,486
(0.084) (0.086) (0.084) (29,008) (22,341)
Monitoring Related 0.493** 0.496** -0.133 120,475** 3,418
(0.112) (0.113) (0.119) (39,878) (38,038)
Equipment/Product Related -0.660** -0.684** -0.288* -67,572* -27,788
(0.098) (0.097) (0.124) (29,449) (25,118)
Other Miscellaneous -0.425** -0.453** -0.258* -32,216 -23,491
(0.111) (0.108) (0.096) (30,750) (26,140)
Diagnose *Apology -0.052 -0.046 -26,968 -53,586
(0.069) (0.054) (68,062) (59,057)
Anesthesia *Apology 0.326* -0.017 -42,015 -95,865
(0.129) (0.093) (65,224) (62,052)
Surgery *Apology -0.0899* -0.0987+ -28,499 -48,351
(0.035) (0.053) (55,875) (46,520)
Medication*Apology -0.059 -0.180** -44,820 -54,392
(0.062) (0.067) (53,887) (45,575)
IV & Blood Product*Apology -0.191 -0.261 -71,731 -113,164
(0.194) (0.344) (72,688) (106,801)
Obstetrics*Apology -0.238+ -0.168+ -95,917 -133,869
(0.132) (0.089) (97,806) (85,840)
Treatment Related*Apology -0.076 -0.019 -27,504 -10,971
(0.048) (0.044) (51,415) (44,740)
Monitoring Related*Apology 0.025 -0.014 -47,196 -63,714
(0.098) (0.086) (72,373) (60,778)
Equipment/Product Related*Apology 0.138 0.000 -22,273 -27,689
(0.112) (0.121) (57,158) (48,403)
Other Miscellaneous*Apology 0.144* -0.034 3,599 -27,142
(0.063) (0.065) (57,513) (45,055)
Other Law Changea
X X X X X
Other Covariatesb
X X X X X
State-Year Fixed Effects X X X X X
Medical Injury Fixed Effects X X
N 234,826 234,826 82,838 234,826 82,838
R-squared 0.08 0.08 0.198 0.08 0.198
Appendix Table 2. Change in Claim Payout By Allegation Nature
log(payout) claim payout (Y2010 dollar)

Note: The default category is behavioral related cases. (+ significant at 10%; * significant at 5%; ** significant at 1%)
a. Other law change includes non-economic damage cap, punitive damage cap, csr_tort, jsl_tort & law on information
closure
b. Other covariates include experience of physician and square of experience, payment type (whether it is settlement or
judgment)
Dependent Variable
(1) (2) (3) (4) (5)
Apology Law -0.0965** -36,355+ -36,261*
(0.034) (21,356) (14,980)
Failure to Diagnose 0.324** 0.333** 0.311** 18,759 42,463**
(0.032) (0.032) (0.035) (14,094) (9,813)
Delay in Diagnose 0.420** 0.428** 0.342** 26,749+ 33,572**
(0.030) (0.032) (0.043) (13,435) (10,681)
Delay in Treatment 0.266** 0.276** 0.199** 10,952 16,140
(0.043) (0.042) (0.050) (19,211) (19,130)
Improper Management 0.225** 0.243** 0.282** 19,440 55,846**
(0.032) (0.033) (0.044) (15,315) (15,318)
Improper Performance -0.118* -0.034 0.274** -65,370** 33,420+
(0.048) (0.047) (0.039) (21,808) (16,827)
Improper Technique -1.109** -1.137** 0.150 -166,141** 14,601
(0.074) (0.071) (0.098) (27,647) (30,761)
Surgical or Other Foreign Body -1.143** -1.148** -0.107+ -216,907** -26,325
Retained (0.048) (0.052) (0.061) (25,824) (16,153)
Wrong or Misdiagnose 0.232** 0.249** 0.300** 4,531 23,893
(0.051) (0.051) (0.060) (17,528) (17,794)
Failure to Diagnose 0.020 -0.021 11,932 -11,922
* Apology (0.045) (0.047) (20,457) (13,608)
Delay in Diagnose 0.036 0.045 39,681 20,754
* Apology (0.056) (0.053) (25,721) (18,837)
Delay in Treatment -0.018 0.004 35,134 18,713
* Apology (0.092) (0.091) (36,378) (39,655)
Improper Management -0.057 -0.001 -10,491 -26,259
* Apology (0.051) (0.041) (22,710) (18,000)
Improper Performance -0.417** -0.119* -12,608 11,715
* Apology (0.074) (0.050) (23,979) (21,330)
Improper Technique 0.387* 0.085 50,971 53,581
* Apology (0.164) (0.095) (44,147) (34,849)
Surgical or Other Foreign Body 0.090 0.095 42,353 47,952+
Retained * Apology (0.074) (0.063) (28,844) (27,283)
Wrong or Misdiagnose -0.026 0.061 713.5 14,133
* Apology (0.054) (0.068) (18,010) (18,188)
Other Law Changea
X X X X X
Other Covariatesb
X X X X X
State-Year Fixed Effects X X X X X
Medical Injury Fixed Effects X X
N 130,060 130,060 52,662 130,060 52,662
R-squared 0.075 0.076 0.201 0.076 0.201
Appendix Table 3. Change in Claim Payout By Malpractice Specific Act
Note: The default category is when the mistake is failure to monitor (1.64% of all cases)
(+ significant at 10%; * significant at 5%; ** significant at 1%)
a. Other law change includes non-economic damage cap, punitive damage cap, csr_tort, jsl_tort & law on
information closure
b. Other covariates include experience of physician and square of experience, payment type (whether it is
settlement or judgment)
log(payout) claim payout (Y2010 dollar)

Dependent Variable
(1) (2) (3) (4) (5)
Apology -0.055 -144085 -94175
(0.059) (100,314) (113,957)
Under 1 year -0.100 -0.041 -74,733 -39,555
(0.066) (0.075) (67,382) (68,959)
Age 1-9 -0.771** -0.872** -0.266* -329,358** -133,071+
(0.080) (0.117) (0.102) (81,823) (71,685)
Age 10-19 -1.166** -1.295** -0.449** -421,130** -169,965*
(0.114) (0.159) (0.122) (80,858) (66,219)
Age 20-29 -0.997** -1.085** -0.273** -399,839** -150,610**
(0.057) (0.084) (0.065) (67,167) (55,340)
Age 30-39 -0.852** -0.925** -0.155** -379,302** -135,814**
(0.045) (0.070) (0.055) (57,865) (46,880)
Age 40-49 -0.848** -0.941** -0.205** -391,001** -149,509**
(0.052) (0.070) (0.055) (57,023) (46,422)
Age 50-59 -0.848** -0.921** -0.255** -400,612** -171,443**
(0.059) (0.075) (0.057) (61,681) (50,660)
Age 60-69 -0.878** -0.953** -0.368** -427,165** -209,327**
(0.063) (0.069) (0.057) (61,002) (51,919)
Age 70 or above -1.146** -1.276** -0.700** -506,073** -286,150**
(0.063) (0.089) (0.068) (68,714) (57,734)
Under 1 year *Apology -0.156 -0.181+ 2,187 -24,760
(0.139) (0.107) (102,021) (113,295)
Age 1-9 *Apology 0.000 -0.003 97,049 40,521
(0.090) (0.096) (120,610) (133,107)
Age 10-19 *Apology 0.097 -0.011 129,697 67,035
(0.149) (0.122) (112,154) (118,034)
Age 20-29 * Apology -0.046 -0.079 109,892 51,137
(0.079) (0.061) (100,664) (113,860)
Age 30-39 * Apology -0.097 -0.0969* 109,557 60,173
(0.060) (0.046) (96,422) (108,666)
Age 40-49 * Apology -0.031 -0.054 113,925 57,597
(0.054) (0.046) (100,382) (112,998)
Age 50-59 * Apology -0.094 -0.071 120106 70,051
(0.086) (0.054) (100,121) (113,376)
Age 60-69 * Apology -0.086 -0.067 124113 75773
(0.100) (0.061) (100,645) (113,658)
Age 70 or above * Apology 0.075 0.023 157,153 96,522
(0.060) (0.052) (112,583) (124,345)
Other Law Changea
X X X X X
Other Covariatesb
X X X X X
State-Year Fixed Effects X X X X X
Medical Injury Fixed Effects X X
N 77,341 77,341 77,341 77,341 77,341
R-squared 0.087 0.087 0.203 0.087 0.203
Appendix Table 4. Change in Claim Payout By Patients' Age
Note: The default category is fetus. (+ significant at 10%; * significant at 5%; ** significant at 1%)
a. Other law change includes non-economic damage cap, punitive damage cap, csr_tort, jsl_tort & law on
information closure
b. Other covariates include experience of physician and square of experience, payment type (whether it is
settlement or judgment)
log(payout) claim payout (Y2010 dollar)

Dependent Variable
(1) (2) (3) (4) (5)
Apology -0.062 -29,692** -30,685**
(0.060) (10,696) (7,169)
Male Patient 0.226** 0.228** 0.024 53,347** 13,565*
(0.018) (0.018) (0.018) (5,802) (5,661)
Male Patient * Apology -0.004 -0.031 -11,949 -10,383
(0.032) (0.024) (9,491) (7,402)
Other Law Changea
X X X X X
Other Covariatesb
X X X X X
State-Year Fixed Effects X X X X X
Medical Injury Fixed Effects X X
N 82,534 82,534 82,534 82,534 82,534
R-squared 0.111 0.111 0.398 0.057 0.193
Appendix Table 5. Change in Claim Payout By Patients' Gender
log(payout) claim payout (Y2010 dollar)
Note: The default category is female. (+ significant at 10%; * significant at 5%; ** significant at 1%)
a. Other law change includes non-economic damage cap, punitive damage cap, csr_tort, jsl_tort & law on
information closure
b. Other covariates include experience of physician and square of experience, payment type (whether it is
settlement or judgment)
Top Related