


Languages
Pages
Legal


Stock markets were traditionally a venue for companies to raise money to finance growth. But the number of listed companies has collapsed in many parts of the western world, suggesting that markets perform this function less and less. Easier access to alternative sources of financing alongside the increased cost and hassle of a public listing are all partly to blame. Savers and policymakers should all be concerned about the implications. All is not lost, however. Equity markets are thriving in some parts of the world and even where they appear not to be, they continue to serve an economic purpose, albeit one that is different to the original blueprints.
Marketing material for professional investors and advisers only
April 2018
What is the point of the equity market?
Duncan LamontHead of Research and Analytics
We have come a long way since the first financial exchange was established in Antwerp, Belgium, in 1531, although rather than shares, this was a venue where promissory notes, bonds and commodities changed hands. It wasn’t until early the next century, when the Dutch East India Company made the innovation of issuing its backers with paper shares, which investors in turn could trade between each other, that we saw the first signs of something like the modern day stock market. Over the ensuing centuries stock markets have become an integral part of our financial plumbing.
The initial purpose of the stock market from a company’s perspective was to provide it with a means of raising capital to finance its future endeavours. From an investor’s perspective, the market provided liquidity by allowing them to sell their shares to other investors at a transparent price. These primary functions have since expanded and a stock market listing provides many more benefits to companies and investors today (Figure 1). However, it also comes with many more costs for companies and a greater burden than our forbearers could have imagined.
The decision to list or not depends on whether the expected benefits outweigh the costs and for many successful companies, this is no longer a straightforward question to answer. Things have become so bad that in the US, the number of listed companies has declined by almost 50% since 1996. There has also been a collapse in the number of companies choosing to IPO from an average of over 300 a year in the 1980-2000 period to only 108 a year since (Figure 2). The UK market has experienced a similar fall from grace.
This is not just of philosophical interest. A thriving public equity market brings a number of benefits, not least the fact that it is the most accessible and cheapest way for ordinary savers to participate in the growth of the corporate sector. The transparency provided by a public market is also a double-edged sword. While companies may find it burdensome, it enables management and corporate practices to be held to account more readily,
with wider social and economic benefits. Regulators are not blind to these features. The UK Financial Conduct Authority (FCA) has singled out primary markets as playing a “crucial role in supporting prosperity and providing investment opportunities”1. Regulators around the world, including in the US, UK and EU, have all conducted studies aimed at identifying the barriers to effective primary markets.
However, if fewer companies value a stock market listing, this leads to the provocative question which titles this paper: what is the point of the equity market? We focus on the US and UK but also contrast them with elsewhere. Some markets have experienced similar trends to the US and UK but others have been diametrically opposed. We unpick some of the potential explanations why and find that, even in the US and UK, the equity market continues to serve a purpose, albeit not exactly the same as originally envisaged.
Figure 1: The stock market cost/benefit trade-off – the company perspective
Raise public profile
Use shares as currency: incentives/remuneration
Use shares as currency: M&A
Access to capital to repair balance sheet
Provide liquidity/an exit for existing investors
Access to capital to grow
business
Unwanted transparency
IPO costs
Short termism
Litigation risk
Regulatory risk
Ongoing public company costs
Loss ofcontrol
Governance burden
Source: Schroders
1 www.fca.org.uk/publication/corporate/business-plan-2016-17.pdf
1

The pace of de-equitisation has been savageThe number of companies listed on the UK main market has fallen by over 70% since the mid 1960s and both the UK and US markets have witnessed a rough halving in numbers since the mid-1990s (Figure 2). These dramatic declines have been driven by both a slump in companies choosing to IPO (Figure 3) and greater numbers choosing to delist than list (Figure 4).
Furthermore, even those companies that are listing are choosing to hold off for longer before doing so – the average age of companies on IPO in the US has increased from eight years in the 1980-1999 period to 11 years since. A similar pattern of delayed listing can be seen in the UK. They are also much larger than in the past. For example, the average market capitalisation of companies on the UK main market has increased fourfold since the number of companies peaked in 1996. The characteristics of public markets have shifted decidedly towards older, larger businesses.
What makes this more of a riddle is that the pool of IPO candidates has continued to grow. The US has created over 21,000 new companies on average per year since 1996, a figure which more than doubles if the 2008-11 crisis years are excluded. UK new company growth has been even higher, but the headline figures mislead. Net of closures, over two million companies were established in the UK between the start of 2000 and 2017, including annual growth of 131,000. Of those, however, 89% have no employees at all or only a single employee-owner. The number of companies with 50 or more employees has increased by a far more modest 410 a year. Regardless, the decline in the number of listed companies does not indicate a lack of entrepreneurialism. New companies continue to be created at a steady rate. It is however a sign that companies are choosing to finance themselves differently than in the past.
Cheap debt has been winning hands downFor more established businesses, with interest rates so low, debt finance has increased in attractiveness relative to equity. If a company needs capital, it makes sense to raise it where it can be done most cheaply. Debt has been the rational choice, subject to constraints on leverage and long-term affordability.
In more extreme cases where there are no operational financing requirements, companies have been raising debt specifically to buy back (i.e. retire) equity. This has been especially the case in the US. Apple is the best-known example, having raised and spent tens of billions of dollars in this way over recent years, but it is not alone. In total, around a third of US share buybacks announced in the 12 months to November 2017 were financed by new borrowings2.
Less well appreciated is that debt is also significantly cheaper than equity in upfront fundraising cost terms. The average fee payable to an underwriter on IPO in the US is 7% of the amount raised, more than 10 times the underwriting fees on debt3. Although costs are much lower in Europe, typically less than half US levels, the same approximate ten times uplift holds for underwriting fees on equity compared with corporate bonds.
Finally, the tax deductibility of interest payments also counts in its favour. All told, it is not hard to see why debt has been popular, although its glamour may start to fade if interest rates and borrowing costs rise.
Figure 2: Freefalling listed company count…
0
1
2
3
4
5
6
7
8
9‘000 ‘000
0
0.5
1
1.5
2
2.5
3
3.5
4
4.5
1966 1971
US (LHS)
1976 1981 1986 1991 1996 2001 2006 2011 2016
UK (RHS)
-46%
-53%-71%
Data to end 2017. UK figures are for main market only. Source: London Stock Exchange, Schroders, World Bank World Development Indicators (WDI) and World Federation of Exchanges. The WDI cover listed domestic companies and foreign companies which are exclusively listed on an exchange. Investment funds, unit trusts, and companies whose only business goal is to hold shares of other listed companies, such as holding companies and investment companies, regardless of their legal status, are excluded. A company with several classes of shares is counted once.
Figure 3: …caused by a dramatic reduction in IPOs…
0
100
200
300
400
500
600
700
800
0
50
100
150
200
250
300
1970 1975 1980 1985 1990 1995 2000 2005 2010 2015
US (LHS)
UK (RHS)
US IPO data is on consistent basis to WDI data. UK data covers all admissions to the LSE main market. This includes IPOs, re-admission placings and introductions. This approach has been taken to permit the longest possible analysis. Genuine IPO numbers are slightly lower in the UK. Data to end 2017. Source: Jay Ritter, University of Florida, London Stock Exchange, and Schroders.
Figure 4: …and de-listings exceeding new listings
-800
-600
-400
-200
0
200
400
600
Number of new listings minus de-listings
1975 1980 1985 1990 1995 2000 2005 2010 2015
UK
US
Data to 2016. Source: US: The US listing gap, Craig Doidge, Andrew Karolyi and René M. Stulz, Columbia Business School, July 2015, Credit Suisse. UK: London Stock Exchange.
2 US Equity markets, 2018 Outlook, JP Morgan, 14 December 20173 OECD Business & Finance Outlook 2017, OECD Publishing, Paris
2
Private equity is now a more viable long term optionThe private equity industry has grown substantially in scale and accessibility and now competes much more acutely with the public market. Global private equity assets under management rose more than fourfold between 2000 and the middle of 2016 to $2.5 trillion4, a record high. Although still small relative to the $36 trillion market capitalisation of MSCI All-Country World public equity index, private equity has grown 2.5 times faster over this period.
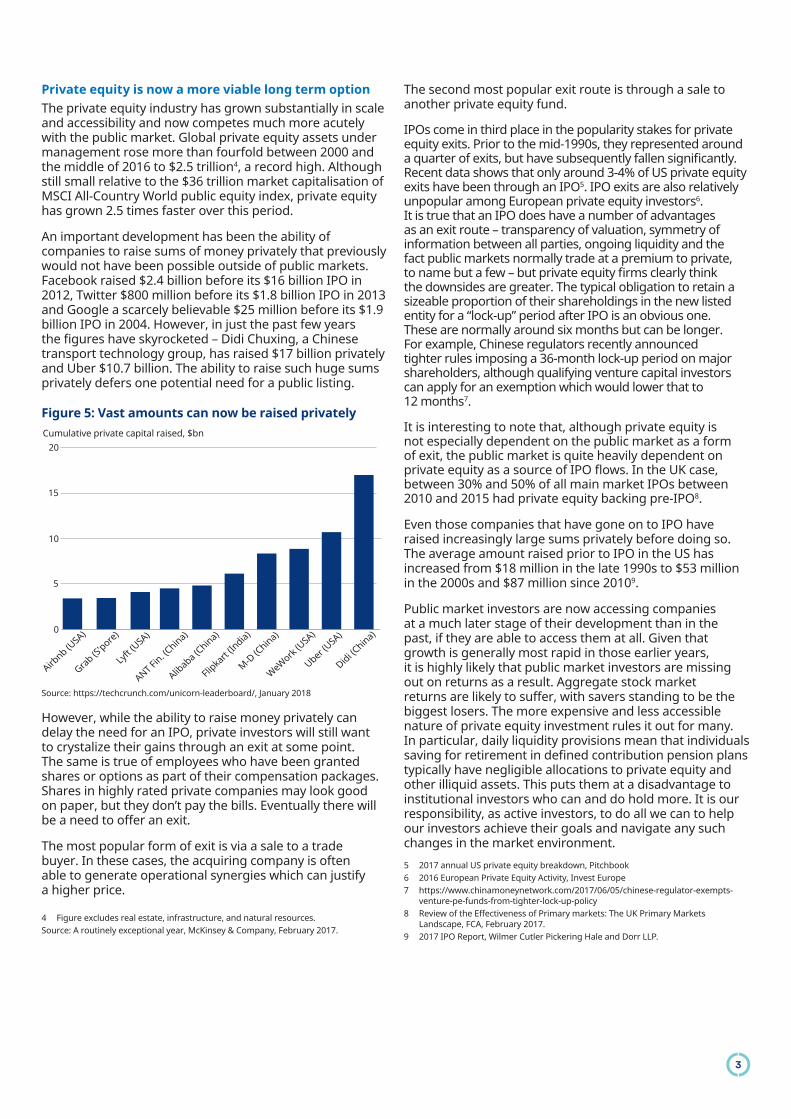
An important development has been the ability of companies to raise sums of money privately that previously would not have been possible outside of public markets. Facebook raised $2.4 billion before its $16 billion IPO in 2012, Twitter $800 million before its $1.8 billion IPO in 2013 and Google a scarcely believable $25 million before its $1.9 billion IPO in 2004. However, in just the past few years the figures have skyrocketed – Didi Chuxing, a Chinese transport technology group, has raised $17 billion privately and Uber $10.7 billion. The ability to raise such huge sums privately defers one potential need for a public listing.
Figure 5: Vast amounts can now be raised privately Cumulative private capital raised, $bn
0
5
10
15
20
Didi (China)
Uber (USA)
WeWork (U
SA)
M-D (C
hina)
Flipka
rt (In
dia)
Alibaba (C
hina)
ANT Fin. (C
hina)
Lyft (
USA)
Grab (S'pore)
Airbnb (U
SA)
Source: https://techcrunch.com/unicorn-leaderboard/, January 2018
However, while the ability to raise money privately can delay the need for an IPO, private investors will still want to crystalize their gains through an exit at some point. The same is true of employees who have been granted shares or options as part of their compensation packages. Shares in highly rated private companies may look good on paper, but they don’t pay the bills. Eventually there will be a need to offer an exit.
The most popular form of exit is via a sale to a trade buyer. In these cases, the acquiring company is often able to generate operational synergies which can justify a higher price.
The second most popular exit route is through a sale to another private equity fund.
IPOs come in third place in the popularity stakes for private equity exits. Prior to the mid-1990s, they represented around a quarter of exits, but have subsequently fallen significantly. Recent data shows that only around 3-4% of US private equity exits have been through an IPO5. IPO exits are also relatively unpopular among European private equity investors6. It is true that an IPO does have a number of advantages as an exit route – transparency of valuation, symmetry of information between all parties, ongoing liquidity and the fact public markets normally trade at a premium to private, to name but a few – but private equity firms clearly think the downsides are greater. The typical obligation to retain a sizeable proportion of their shareholdings in the new listed entity for a “lock-up” period after IPO is an obvious one. These are normally around six months but can be longer. For example, Chinese regulators recently announced tighter rules imposing a 36-month lock-up period on major shareholders, although qualifying venture capital investors can apply for an exemption which would lower that to 12 months7.
It is interesting to note that, although private equity is not especially dependent on the public market as a form of exit, the public market is quite heavily dependent on private equity as a source of IPO flows. In the UK case, between 30% and 50% of all main market IPOs between 2010 and 2015 had private equity backing pre-IPO8.
Even those companies that have gone on to IPO have raised increasingly large sums privately before doing so. The average amount raised prior to IPO in the US has increased from $18 million in the late 1990s to $53 million in the 2000s and $87 million since 20109.
Public market investors are now accessing companies at a much later stage of their development than in the past, if they are able to access them at all. Given that growth is generally most rapid in those earlier years, it is highly likely that public market investors are missing out on returns as a result. Aggregate stock market returns are likely to suffer, with savers standing to be the biggest losers. The more expensive and less accessible nature of private equity investment rules it out for many. In particular, daily liquidity provisions mean that individuals saving for retirement in defined contribution pension plans typically have negligible allocations to private equity and other illiquid assets. This puts them at a disadvantage to institutional investors who can and do hold more. It is our responsibility, as active investors, to do all we can to help our investors achieve their goals and navigate any such changes in the market environment.
3
4 Figure excludes real estate, infrastructure, and natural resources.Source: A routinely exceptional year, McKinsey & Company, February 2017.
5 2017 annual US private equity breakdown, Pitchbook6 2016 European Private Equity Activity, Invest Europe7 https://www.chinamoneynetwork.com/2017/06/05/chinese-regulator-exempts-
venture-pe-funds-from-tighter-lock-up-policy8 Review of the Effectiveness of Primary markets: The UK Primary Markets
Landscape, FCA, February 2017.9 2017 IPO Report, Wilmer Cutler Pickering Hale and Dorr LLP.
Cost and regulation bear down on public marketsThe costs and hassle associated with a public listing have grown. Additional costs are incurred before, during and, on a continuing basis, after an IPO (Figure 6). These are material. For example, median IPO costs are between 9% and 11% of the amount raised in the US, depending on the size of the deal10. Ongoing costs run in the millions of dollars. For such expense to be justified, the benefits of a listing have to outweigh the costs. But with alternative sources of finance now more readily and/or cheaply available, these benefits have diminished, while the costs have increased.
Figure 6: A listing can be expensive
On IPO Ongoing
Underwriting fees Regulation
Professional fees Professional fees
Initial listing fees Annual listing fees
Other direct IPO costs, e.g. printing
Corporate governance, e.g. investor relations department
Source: Schroders
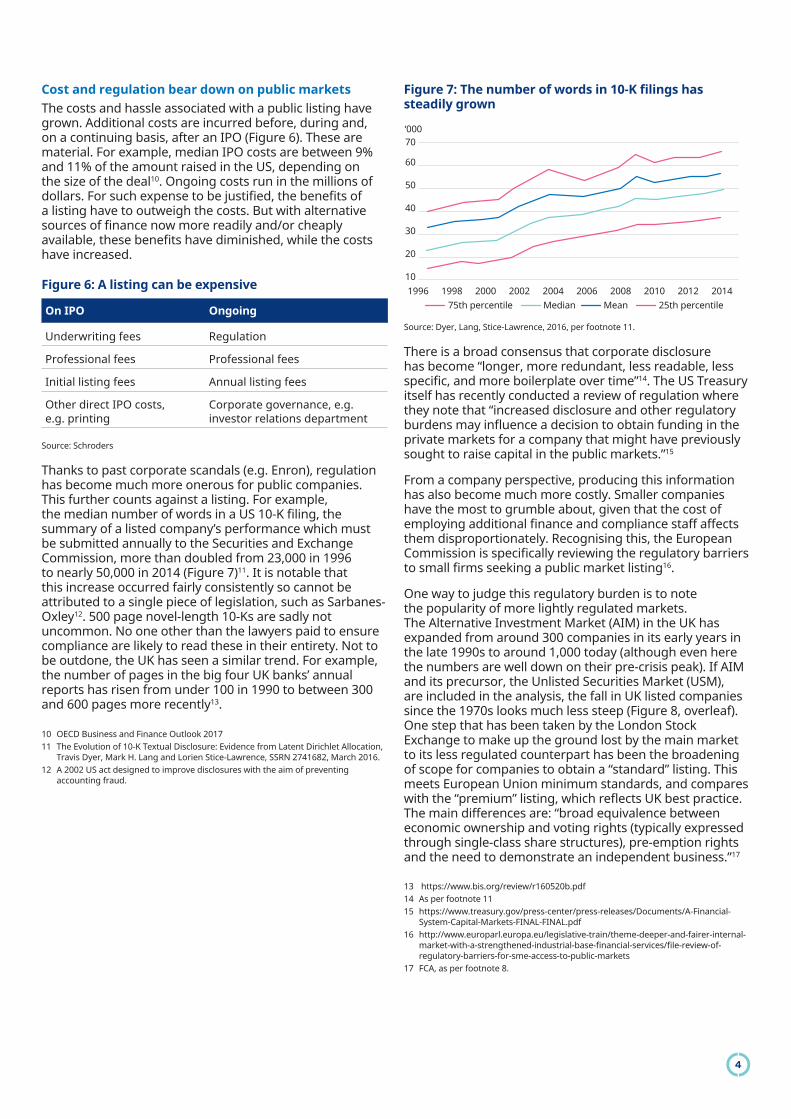
Thanks to past corporate scandals (e.g. Enron), regulation has become much more onerous for public companies. This further counts against a listing. For example, the median number of words in a US 10-K filing, the summary of a listed company’s performance which must be submitted annually to the Securities and Exchange Commission, more than doubled from 23,000 in 1996 to nearly 50,000 in 2014 (Figure 7)11. It is notable that this increase occurred fairly consistently so cannot be attributed to a single piece of legislation, such as Sarbanes- Oxley12. 500 page novel-length 10-Ks are sadly not uncommon. No one other than the lawyers paid to ensure compliance are likely to read these in their entirety. Not to be outdone, the UK has seen a similar trend. For example, the number of pages in the big four UK banks’ annual reports has risen from under 100 in 1990 to between 300 and 600 pages more recently13.
Figure 7: The number of words in 10-K filings has steadily grown
10
20
30
40
50
60
70‘000
1996 1998 2000 2002 2004 2006 2008 2010 2012 201475th percentile MeanMedian 25th percentile
Source: Dyer, Lang, Stice-Lawrence, 2016, per footnote 11.
There is a broad consensus that corporate disclosure has become “longer, more redundant, less readable, less specific, and more boilerplate over time”14. The US Treasury itself has recently conducted a review of regulation where they note that “increased disclosure and other regulatory burdens may influence a decision to obtain funding in the private markets for a company that might have previously sought to raise capital in the public markets.”15
From a company perspective, producing this information has also become much more costly. Smaller companies have the most to grumble about, given that the cost of employing additional finance and compliance staff affects them disproportionately. Recognising this, the European Commission is specifically reviewing the regulatory barriers to small firms seeking a public market listing16.
One way to judge this regulatory burden is to note the popularity of more lightly regulated markets. The Alternative Investment Market (AIM) in the UK has expanded from around 300 companies in its early years in the late 1990s to around 1,000 today (although even here the numbers are well down on their pre-crisis peak). If AIM and its precursor, the Unlisted Securities Market (USM), are included in the analysis, the fall in UK listed companies since the 1970s looks much less steep (Figure 8, overleaf). One step that has been taken by the London Stock Exchange to make up the ground lost by the main market to its less regulated counterpart has been the broadening of scope for companies to obtain a “standard” listing. This meets European Union minimum standards, and compares with the “premium” listing, which reflects UK best practice. The main differences are: “broad equivalence between economic ownership and voting rights (typically expressed through single-class share structures), pre-emption rights and the need to demonstrate an independent business.”17
4
10 OECD Business and Finance Outlook 201711 The Evolution of 10-K Textual Disclosure: Evidence from Latent Dirichlet Allocation,
Travis Dyer, Mark H. Lang and Lorien Stice-Lawrence, SSRN 2741682, March 2016.12 A 2002 US act designed to improve disclosures with the aim of preventing
accounting fraud.
13 https://www.bis.org/review/r160520b.pdf14 As per footnote 1115 https://www.treasury.gov/press-center/press-releases/Documents/A-Financial-
System-Capital-Markets-FINAL-FINAL.pdf16 http://www.europarl.europa.eu/legislative-train/theme-deeper-and-fairer-internal-
market-with-a-strengthened-industrial-base-financial-services/file-review-of-regulatory-barriers-for-sme-access-to-public-markets
17 FCA, as per footnote 8.

To date, this has been a relatively unsuccessful tactic, however. The “standard” name has given the impression of “second best”, especially when compared to “premium”. In addition, FTSE Russell does not permit companies with a standard listing to be included in its benchmark indices, further dampening demand.
Figure 8: Lightly regulated markets have experienced dramatic expansion
0
1
2
3
4
5
'17'14'10'06'02'98'94'90'86'82'78'74'70'66
Number of listed companies, ‘000
Main market USM/AIM
Source: London Stock Exchange
The US Securities and Exchange Commission (SEC) has also taken note of complaints over the negative impact that regulation has been having on demand for IPOs. The Jumpstart Our Business Startups (JOBS) Act of 2012 established less arduous listing requirements for a new class of so-called Emerging Growth Companies, giving them up to five years after the IPO to fully comply with various disclosure and accounting requirements. Since 2012, 85% of all US IPOs have taken advantage of this provision. While it is impossible to say how many would have floated without these regulatory exemptions, they are self-evidently helpful in making it easier for companies to do so.
It is clear that, while regulation can enhance confidence among investors, disproportionate regulation may discourage companies from listing and create an uneven playing field with private companies. The success of lighter-touch regulatory environments in promoting IPO activity shows that a comprehensive assessment of the costs and benefits of regulation may be necessary if policy makers and regulators have any desire to reinvigorate public markets (and we think they should, as we argue in this paper).
Short termism A serious drawback of a public listing is the perception that they encourage short-termism. A focus on quarterly reporting cycles and shareholder pressure to deliver instant results can be distracting and disruptive to corporate strategy.
However, when we dig a little deeper, we find a more complex story and contradictory evidence. Rather than being short-term traders of shares, research has found that asset managers typically invest in UK companies for several years at a time18. This analysis is based on the length of time that an asset manager holds a stock from first investment to final divestment. It paints a picture of asset managers as very long-term investors in businesses.
However, the Bank of England19 has presented conflicting evidence, suggesting that average holding periods across the UK and US markets have fallen to a matter of months. One explanation for this apparent contradiction is that the Bank of England analysis captures the activities of all market participants, including hedge funds and high frequency traders. Given that these other participants account for a much larger share of trading volumes than asset managers, they are likely weighing heavily on the analysis. In addition, the Bank of England estimates holding periods as the inverse of portfolio turnover rates (so a 50% annual turnover rate is equivalent to the entire portfolio being changed every two years, and an estimated holding period of two years). This approach captures any adjustments in the size of a shareholding as “turnover” even if an investor has been a substantial shareholder throughout. This is likely to understate the timeframe over which investors have an active interest in the companies in which they invest. It is also at complete odds with our own experience, which aligns much more closely with the first analysis discussed.
Putting aside any disagreements on holding periods, short- termism is widely considered to be an issue in public markets. This was one of the main conclusions of the Kay Review of UK Equity Markets and Long-term Decision Making in 2012. In the US, over a third of chief financial officers (CFOs) at US public companies complain that their public corporate status forces them to take a more cautious short-term approach to managing their businesses (Figure 9, overleaf). 87% of respondents to a recent survey20 felt that most pressure was to demonstrate strong financial performance within two years or less and 29% felt the main pressure point came at six months or less. Furthermore, 65% felt these pressures had increased in the past five years. An earlier survey also found that almost half of CEOs would reject a positive net present value project if undertaking the project meant missing analysts’ forecasts of earnings21. Similar situations persist around the world. Such short investment horizons demand instant gratification rather than appreciating and valuing what is in the best long-term interests of a company. No one gains from such an outcome (except perhaps chief executives with badly structured compensation packages linked to short-term measures of profit or shareholder return).
5
18 The contribution of asset management to the UK economy, Oxera, July 201619 Box D2, Bank of England, Staff Working Paper No. 571, December 201520 Rising to the challenge of short-termism. FCLT Global, September 2016.21 Graham, Campbell, Harvey, and Rajgopal (2005), “The Economic Implications of
Corporate Financial Reporting.” Journal of Accounting and Economics, 40, 3–73.

Figure 9: The dark side of a public listing
0
10
20
30
40
50
60
70
80
90
100Percentage of CFOs
Effects on firms directly related to costs of being public
Increased administrative
burden
Created budgeting challenges
Focused more
cautious, short-term
view
No significant
impact
Slowed near-term
opportunities for
growth/M&A
Slowed market
expansion plans
Less flexibility to innovate / invest in
R&D
Other
Source: Considering an IPO? The costs of going and being public may surprise you, strategy& (PWC), 2012
This is an area where private equity has an advantage, given its longer investment horizon. Studies have found evidence that private companies invest much more, for a given amount of profits, than otherwise identical public companies22. Of course, not all investment is wise or adds value (and an alternative interpretation would be that public companies are more disciplined), but it is consistent with a longer-term outlook.
The preference for jam today rather than jam tomorrow has always been an issue in markets. However, an over-concentration on the short-term risks creating worse long-term outcomes for all stakeholders. The temptation to turn down profitable investment propositions, limit research and development spending or neglect to invest in the skills of a workforce may reduce costs and boost short-term profits, but all have the potential to reduce productivity and output in the long run. Attempts have been made to rectify this. For example, since 2014 it has no longer been a requirement for UK-listed companies to report quarterly (it had only become mandatory in 2007) and the SEC is considering a similar move for at least certain types of company in the US. However, in the UK case, many companies continue to report quarterly. Furthermore, research has questioned whether the introduction and then removal of the need to report quarterly in the UK has had any impact whatsoever on investment behaviour (a measure of short-termism)23.
Short-termism is a widely-accepted issue and we all stand to benefit from a longer-term culture in capital markets, including equity markets themselves. Experience has shown that such a culture is very challenging to achieve, but that does not diminish its importance as an objective, especially if public equity markets are to compete more equally with private markets.
Unwanted attention and litigation riskWhile raising the profile of a company is a benefit of a listing, not all attention is appreciated. Directors are subject to much closer individual scrutiny. Their salaries are in the public domain. A stray word here or a misplaced comment there can make front page news. Their business practices are put under the microscope and what was acceptable in the private world may fail to pass muster in the court of public opinion. Being forced to defend oneself against allegations, irrespective of their validity, takes up significant management time and can run up expensive legal bills. Litigation risk is a big deal. Many corporations and individuals shy away from such attention, which can affect their directors’ appetite for a flotation.
It is however worth noting that the relatively high levels of de-listings among US companies has not been due to the cost or regulatory burden of being public. By far and away the most common reason has been because one company has been acquired by another and thereby ceased to exist as a standalone entity24. Voluntary de-listings have been few and far between. The UK has had a similar experience, with the difference that around a quarter of those de-listing from the main market between 2010 and 2016 have been overseas companies cancelling a secondary listing in the UK, while retaining their primary listing overseas25. Feedback provided to the FCA has suggested this has been driven by changes in securities regulations in many overseas jurisdictions which have reduced the incentive for a secondary listing abroad, e.g. by permitting increased cross-border trading on domestic exchanges. In contrast to the main UK market, it has been much more common for companies to voluntarily de-list from the junior AIM market. Around a quarter of the de-listings from AIM between 2010 and 2016 were for this reason.
Therefore, while the downsides of a listing are likely to have contributed to the lack of appetite for an IPO, they have not been sufficiently strong to drive existing listed companies away from the main markets. Having gone through the hassle and expense of attaining a listing in the first place, the continuing burden is evidently not enough to put many off. Other than in extreme situations, where the costs are having a materially detrimental impact on the business, a voluntary de-listing is also highly unlikely to be supported by shareholders. Most public equity mandates do not permit asset managers from holding shares in unlisted companies and such an outcome is unlikely to appeal to a majority of individual shareholders either.
22 Corporate Investment and Stock Market Listing: A Puzzle?, 2014, Review of Financial Studies, No.2 (February 2015): 342-390, Asker, Farre-Mensa and Ljungqvist,
23 Consequences of Mandatory Quarterly Reporting: The U.K. Experience, Columbia Business School Research Paper No. 17-33, Nallareddy, Pozen, Rajgopal, 2017
24 The US listing gap, Doidge, Karolyi and Stulz, 201525 FCA, as per footnote 8
6

In contrast, private companies operate in a less transparent and open world. This can shield them from some potentially unwanted attention. However, even here this benefit is eroding, particularly for larger companies. Many large traditional asset managers now also participate in private fundraising rounds. These asset managers mark up or down the valuations of their private assets in a much more transparent and public manner than has normally been the case with private equity. The emergence of secondary trading venues where stakes in private businesses can be bought and sold have also increased transparency. Uber CEO, Dara Khosrowshahi, was recently quoted as saying:
“We have all of the disadvantages of being a public company, as far as the spotlight on us, without any of the advantages. So Travis (Kalanick, former CEO and co-founder) and the whole board now agree we should just go public. The numbers support it.”26
Mature businesses are already cash-rich A lack of confidence about the outlook has held back business investment since the financial crisis and resulted in more mature companies accumulating ever-growing cash balances (Figure 10). These reached a record high in 2017. Against this backdrop, those companies that do find investment opportunities which demand new capital are already well-endowed.
Figure 10: Why raise new money when you have plenty?
0
0.25
0.50
0.75
1.00
1.25
1.50
1.75
1985 1990 1995 2000 2005 2010 2015
Cash levels at S&P 500 firms, $trillion
Note: Covers S&P 500 excluding financials, utilities and telecommunications as these typically maintain high cash reserves as part of their normal operating process. Source: S&P, data to 30 September 2017.
Another point sometimes made is that the new wave of high growth technology businesses that are the economic darlings of the day simply do not need much capital in order to grow. It is true that the likes of Uber, Snapchat and Facebook are all relatively capital-light businesses. They are a far cry from the railroad companies that dominated the US stock market many years ago. However, this argument fails to stand up to scrutiny. For every Uber there is a Tesla, requiring enormous sums of money to harness and commercialise technology. The same could be said of most companies investing to produce a sustainable response to climate change. It is also true of the companies which manufacture the components and hardware on which Uber and the like run their computer programmes.
An alternative reality – emerging markets and developed AsiaWhile equity markets have been a declining force in some parts of the world, they have been thriving in many countries. Emerging markets have fared far better than developed, driven by buoyant growth in the number of listed stocks in emerging Asia and Europe (Figures 11 and 12, overleaf). Stock markets in developed Asia have also expanded.
Developed Europe ex-UK paints a more mixed picture. Some markets, such as Spain, experienced sustained and significant expansion in listed stocks prior to the financial crisis but others, such as France and the Netherlands, have been in long- term decline. In aggregate, the Europe ex-UK company count soared in the 1990s, flat-lined in the years prior to the crisis and has been trending down since.
Some of this can be readily explained. If a country has relatively immature capital markets, as is more common in emerging markets, the rate of growth should also be expected to be higher. Former-communist countries did not have any capital markets at all in 1990, so have been starting from a very low base. The Polish stock market is a good example of this. It had only 22 stocks in 1993 and now has over 800. Similarly, China’s capital markets have rapidly expanded from just over 100 companies in 1993 to over 3,000 now, and are continuing to grow at a rate of several hundred a year.
One would also expect the corporate sector in faster-growing economies to need the most capital. New equity and debt are both required. This has been true across Asia, and in some, but not all, of emerging Europe (Figure 13). The need for new capital is especially strong when business investment is high, as has been the case in markets such as China.
26 City A.M., 9 November 2017
7

Poland
China
Russia
Hong Kong
Indonesia
Korea
Turkey
Malaysia
Thailand
Australia
Singapore
India
Spain
Norway
Philippines
Hungary
Greece
Japan
Switzerland
Peru
Chile
Mexico
Belgium
Canada
Germany
France
US
Brazil
Austria
Argentina
UK
South Africa
Netherlands
-100 0 100 200 300 400 500
3,814%
2,757%
Americas
EMEA
Asia
Poland
China
Russia
Hong Kong
Indonesia
Korea
Turkey
Malaysia
Thailand
Australia
Singapore
India
Spain
Norway
Philippines
Hungary
Greece
Japan
Switzerland
Peru
Chile
Mexico
Belgium
Canada
Germany
France
US
Brazil
Austria
Argentina
UK
South Africa
Netherlands
0 1 2 3 4 5 6 7 8 9 10
Americas
EMEA
Asia
%%
Change in number of stocks 1993-2017
Figure 11: Some markets have had explosive growth Figure 13: Higher economic growth and stock market expansion are relatedReal GDP 1993-2017
Figure 12: Regional disparities are markedMedian change in listed company count, 1993-2017, figures in brackets show number of countries in each regional sample
Median change
EM Asia (8) 120%EM EMEA (6) 92%DM Asia Pacific inc. Japan (4) 80%EM All (18) 60%DM All (15) -10%DM Europe ex UK (8) -29%EM Latin America (5) -30%US -39%UK -48%
Figures in brackets show number of countries in each regional sample; 1993 start date chosen as the earliest date that includes China. All data to end 2017 apart from France, Netherlands and Belgium, which are 2016. Source for Figures 11 and 12: London Stock Exchange, Schroders, World Bank World Development Indicators and World Federation of Exchanges.
Forecasts used for 2017 as data not yet available. Source: IMF World Economic Outlook Database, October 2017 Edition
Debt finance and private markets have played their part in meeting this demand from emerging and Asian markets (for example, Figure 5 shows that emerging market companies have been among the biggest beneficiaries of mega-cap private equity financing). However, demand has been such that public markets have also been major beneficiaries. Indeed, the demand has been sufficient to overcome regulatory hurdles – see boxed section for details of the Chinese listing process as an example. In these markets, the benefits appear still to outweigh the costs.
However, these explanations do not fully explain the changes in stock markets we have seen. Japan had over 3,000 listed companies in 1993, one of the largest in the world, and has experienced both low economic growth and low equity market returns since. Despite that, it has seen a 40% rise in the number of its listed companies. In contrast, Peru and Chile have both performed relatively well in economic terms, but have gone backwards in their equity market development. Latin America in general has underwhelmed over a fairly long timescale (Figure 14).
8

Figure 14: The demise of Latin American equity markets Number of listed companies, rebased to 100
0
20
40
60
80
100
120
140
160
‘16‘12‘08‘04‘00‘96‘92‘88‘84‘80
Brazil Mexico Argentina Chile
Source: Schroders and World Bank World Development Indicators. Data to 2017.
One possible explanation for the downtrend in Latin America is the nature of corporate ownership structures. Companies there are characterised by concentrated ownership (the largest five shareholders have historically owned 80% of voting shares in Latin American countries), low free floats (15-30%), and a complex network of conglomerates30. The OECD has commented that “it is common for the profits of some group companies to serve as ‘cash cows’ to finance the growth of more capital-hungry enterprises in the group”. Such structures diminish the need for external capital and weaken minority shareholder rights, putting off international investors.
Taking emerging and Asian markets together, it seems that economic growth is helpful in boosting demand for equity finance and stock market expansion, while relatively immature markets (and economies) have more chance of growing at a faster rate over time, but that complex ownership structures can count against stock market development. These are only part of a complicated story, but, however difficult it is to ascertain the whole truth, there is clear evidence that it would be premature to call time on public equity markets.
A venue for secondary raisings more than primaryAlthough it seems that fewer companies covet a stock market listing in many parts of the world, that is only part of the story. Seen through a different lens, those same stock markets have been in rude health and have been fulfilling a very valuable function: enabling existing listed companies to raise further equity capital. The amount of money raised by existing listed companies, sometimes known as secondary or “seasoned equity offerings” (SEOs), has remained at relatively high levels. While the number of IPOs in the US fell from over 300 a year on average in the 1980-2000 period to only 108 a year since, the average number of SEOs increased from 360 to 430 a year over that same period (Figure 15). Since 2001, the number of SEOs has outpaced IPOs by a factor of almost four to one.
The China experienceChina has experienced unprecedented growth in the number of its listed companies over recent decades. It presents an intriguing counterpoint to the declines seen in the US.
Some reasons transcend geographic boundaries. High economic growth and business investment have resulted in increased demand for capital. Public equity markets can meet such demand through both primary (IPO) and secondary issuance – secondary fundraising volumes have actually been more than four times the average amount raised annually in primary markets since 201027. Since 2015 the ratio has been even higher at almost eight times. Although debt finance and private equity have also played a part, demand has been sufficiently strong that all have risen together.
However, others are more specific to China. Given the closed nature of the economy, domestic retail investors, who own around 90% of the market, are always on the look out for the next big thing. When one investment has performed well, they look to recycle the gains into a new prospect, equivalent to changing tables at a casino. This results in a ready supply of capital to finance IPOs.
As well as companies seeking a new listing to raise money, the number of listed companies has also been supported by an almost complete absence of companies de-listing. Only 107 companies have de-listed in total since the early 1990s, with annual figures normally in the single digits and very few happening voluntarily28. In contrast, the US long-term average has been over 400 per year. Notoriously weak enforcement of listing rules has been a key reason for low de-list rates (so much so that a popular strategy has been to buy any company whose price has fallen on a “delisting warning”, safe in the knowledge that an eventual delisting is unlikely). Recent rhetoric has been to the effect that a stronger stance will be taken, but that remains to be seen.
De-listings have also been low because of the protracted and complex process to obtaining a listing (which is also evidence that, if demand for capital is sufficiently strong, then companies will not be put off by the hassle-factor). It takes on average two years for a listing to be obtained and the authorities can also decide to bring a complete halt to all IPO activity at times of market turmoil, as occurred for over a year between October 2012 and December 2013, and again for several months in 2015. Interestingly, the regulator also sets the IPO valuation, rather than market forces, which has resulted in questions over impartiality.
Such are the hurdles in obtaining a listing, the listing itself has value. Moreover, academic research has found that Chinese companies tend to raise more money than they need29. This minimises the number of times they have to come to market. While this may make sense for the company, it is likely to be inefficient from an end-investor point of view.
It remains to be seen whether tighter regulation and increased fundraising costs will reduce the appetite for a listing. However, so long as growth remains robust and the economy relatively closed, it seems unlikely that the Chinese stock market will be turning American any time soon.
30 Trends and Factors Impacting on Latin American Equity Market Development, OECD, 2013
27 WIND28 Shanghai Stock Exchange, Shenzhen Stock Exchange and Schroders.29 Internal corporate governance and the use of IPO over-financing: Evidence from
China, China Journal of Accounting Research, Volume 5, Issue 3, September 2012
9

Figure 15: SEO activity has remained very high in the US Number of SEOs
0
100
200
300
400
500
600
700
800
‘15‘10‘05‘00‘95‘90‘85‘80‘75‘70Source: Jay Ritter, University of Florida
There is a similar story in the UK, where around double the amount has been raised from SEOs as IPOs since 2001 (Figure 16). While some of the money raised has been used to finance growth opportunities, some has also been required to recapitalise struggling companies. 2009-10 in particular stands out as a time that banks under pressure from the aftermath of the credit crisis were forced to shore up their capital bases with additional equity. Although this phase has come to an end, the US experience in particular shows that there will often be occasions when existing listed companies have the need or desire to tap the market for additional funds. Even in China, where IPO activity has been very high, amounts raised in secondary fundraisings have been outpacing IPOs by a factor of more than four to one.
Figure 16: SEOs outpace IPOs significantly in the UK
0
20
40
60
80
100
‘17‘15‘10‘05‘00‘95‘90‘85‘80IPOs SEOs
Amount of money raised, £bn
Source: London Stock Exchange and Schroders
Investors should also beware of undervaluing the importance of SEOs or arguing that providing capital to struggling companies is in any way undesirable. Those who backed the banks at that time have since enjoyed stellar gains. For example, HSBC conducted the largest rights issue in UK history in early 2009, raising £12.5 billion at 245p per share. Its share price is now above 800p, more than treble that level. Although not without risk, investing at the time of greatest need can be a very profitable strategy.
Equity is popular as a means of incentivising staffPublic companies use their equity as a means of incentivising employees at all levels of their organisations. At the top, executive remuneration normally includes an element of shares, deferred shares, options or other equity-linked pay. Within S&P 500 companies, over 60% of CEO compensation actually comes in the form of shares or options31. Survey evidence also indicates that around 90% of recently-listed US companies between 2010 and 2015 initiated a new equity incentive plan for employees at IPO32. Senior executives having “skin in the game” in this way is considered a mark of good corporate governance, as it incentivises longer-term behaviour. For this to be effective, it is essential that the terms on which these equity-linked rewards pay out are tied to measures of long- term performance.
However, it is not just at senior levels that equity is used to incentivise employees. The same survey found that over half of newly-listed companies initiated an employee stock purchase plan at IPO, enabling employees to buy shares at a discounted rate.
Public companies are evidently very active in using their stock to incentivise employees and, to the extent that this encourages longer-term decision making, this should have wider benefits than simply to the employees concerned.
Equity as acquisition currencyCompanies are also active users of their stock to finance merger and acquisition (M&A) activity, although less so than in the past. In the second half of the 1990s, over 50% of US M&A activity was wholly funded with stock and a further 21% with a mixture of stock and cash. Only 26% was wholly cash financed. However, with the fall in equity values that occurred during the Dotcom bubble, this situation reversed. Cash asserted itself as the dominant method of deal financing and this situation has persisted through to today, despite the strong recovery in equity valuations (which has raised the purchasing power of equity). In 2016, all-cash deals accounted for 62% of global M&A. This does however indicate that almost 40% of deals had some form of equity financing. Although diminished compared with the past, equity retains a vital and valuable role in financing M&A transactions.31 CEO Pay Trends 2016, Equilar, June 201632 “Private Companies Redesign Their Employee Equity Plans as IPOs Near”, 2015,
Radford Aon Hewitt.
10

The verdict
The number of listed companies and IPOs has slumped in major markets such as the US and UK. But it is not all bad news.
The decline is not symptomatic of a lack of entrepreneurialism. New companies continue to be created at a reassuring rate. It is, however, a sign that companies are choosing to finance themselves differently to the way they have in the past.
1. Cheap debt is more attractive upfront and on an ongoing basis (and has been becoming more so for most of the past three decades).
2. Private markets have grown in scale and accessibility for both primary and secondary market transactions.
3. The costs and hassle associated with a public listing have grown.
4. Mature companies have plenty of cash but are nervous about investing. Both the supply and demand side argue against the need for growth capital.
Put simply, corporate financing needs, such as they are, can be met more cheaply and easily from other sources, without much of the baggage that comes with a public listing. Those companies that do list are tending to be more mature businesses, meaning investors miss out on the higher growth that occurs earlier.
Against that backdrop it should not be a surprise that public company numbers have fallen in many countries. What should perhaps be more of a surprise is that this has not occurred uniformly. Some stock markets have thrived on this basis in many parts of the world. In these markets, the benefits appear still to outweigh the costs.
Some of these influences are cyclical and/or could potentially reverse. The attractions of debt are likely to fade as yields rise and this could allow IPO markets to regain their footing to an extent. This would be more likely if it occurred alongside a pick-up in animal spirits among the business community. Furthermore, any success in efforts to foster a greater long-term culture in public markets or redress the regulatory imbalance between public and private markets could also count in public markets’ favour. Sadly, there is little reason to feel positive on either of these fronts at present.
Realistically, public markets are unlikely to ever fully re-assert themselves in all markets. Now that the private market genie is out of the bottle, it is likely to be a permanent source of competition for capital. So this brings us back to the initial question: what is the point of the equity market? Figure 17 summarises some of our conclusions.
Figure 17: What is the point of the equity market?
Purpose Assessment
Raising growth capital Not delivering on this on a widespread basis; only in select higher-growth countries
Balance sheet repair/ recapitalisation
Highly valued
Provision of liquidity Retains value in providing an exit for founders, early-stage investors and employee shareholders.High trading volumes suggest investors value this function
Staff incentives/remuneration
Widespread use at all levels. Can be a force for good
M&A financing Diminished role but remains important
Provides transparency Has the ability to promote better standards of corporate governance than would be acceptable privately
Efficient capital allocation
Highly important and an advantage over debt markets, but threatened by the growth of passive investing
A cheap, easily accessible way for savers to participate in economic growth
This need is greater than ever, but growth of private markets suggests it is becoming less effective
Source: Schroders
We have already argued that recapitalisations can be a source of value for the company concerned and investors. Both value this function highly.
However, it has been argued that providing an exit for earlier stage investors is in some way less worthy than the raising of growth capital. We disagree. While it is true that this may not seem particularly economically or socially useful, this is not the case. Those same pre-IPO investors are motivated to maximise the value of their stake when they IPO. The more successful a business becomes, the greater the value of their stake. In this way, even if the only point of the equity market was to provide an exit for pre-existing investors, it could still be argued that it was a force for good in economic terms.
A question that lingers is whether any of this matters? Should we care if equity markets fall out of favour with the corporate sector? We feel strongly that the answer is yes, we should. The listing requirements for public companies, arduous as they may be, raise standards of corporate governance in the corporate sector. This has much wider social and economic benefits than is reflected in the performance of the shares. Of course, many private equity investors are also vociferous proponents of the need to focus on environmental, social and governance (ESG) considerations. However, the transparency which comes with a public listing adds extra bite to the argument. The court of public opinion can be an effective judge, even if the justice meted out is sometimes rough.
11

In the same vein, public equity markets, via active equity managers, contribute to efficient allocation of capital. Struggling companies are marked down accordingly. Unless they can make a case for their long-term prospects, which may involve the raising of additional capital, investor flows will be directed elsewhere. Not all business failures are a bad thing. Badly run or uncompetitive businesses deserve to fail rather than suck in capital which could be better deployed elsewhere. This process of creative destruction is essential for a healthily functioning economy. Public markets contribute to this occurring in a transparent and orderly manner. It is worth noting that this can only occur in a world where there are active investors. Passive investors, by definition, do not mark up or down companies in response to changes in fundamentals, ESG concerns or any other considerations. Debt markets play a contrasting role. To avoid the recognition of losses after the financial crisis, lenders frequently allowed and even encouraged borrowers to “amend and extend” the terms of their debt. Healthier propositions will have been starved of capital as a result. This was also official policy after the Japanese equity market crash of the early 1990s. While equity markets can contribute to efficient capital allocation, debt markets have a history of doing the exact opposite.
In a world where companies no longer see the value of a stock market listing to raise growth finance, the economic benefits of stock markets are clearly diminished. In this world, the responsibility of maintaining the economic value of the public market falls squarely on the shoulders of asset owners and asset managers. This can only happen if they take their stewardship responsibilities seriously and behave as active and responsible asset owners to raise standards and push companies in terms of governance.
A further reason why we believe that the decline in appetite for a stock market listing matters is because of the impact on savers. Much of our analysis has focused on the point of the equity market from a company perspective. However, we should not forget savers and investors. Public equity markets represent the cheapest and most accessible way that savers can participate in the growth of the corporate sector. Private equity is excluded on cost or accessibility grounds for many. However, with companies choosing to stay private for longer, investors who focus solely on public markets will miss out on an increasingly large part of the economy. Moreover, many of these companies are in high-growth disruptive industries. If high-quality companies find little reason to go public, then the risk is that over time the quality of the public markets deteriorates. Should this occur, then it is possible that returns from public equity markets in aggregate could move structurally lower relative to private markets. It is our responsibility, as active investors, to do all we can to help our investors achieve their goals and navigate any such changes in the market environment.
In order to maintain their access to these opportunities, investors will need to broaden their scope and embrace private assets, where able. Investors narrowly focused on public markets risk missing out. A more holistic approach to equity investment, where public and private market exposures sit alongside each other, is likely to be more appropriate. However, this does not mean that investors, managers, companies, regulators and politicians are relieved from their responsibility of ensuring that public markets retain their crucial role in the proper functioning of capitalist economies.
12

Important informationThe views and opinions contained herein are those of the authors as at the date of publication and are subject to change due to market and other conditions. Such views and opinions may not necessarily represent those expressed or reflected in other Schroders communications, strategies or funds.
This document is intended to be for information purposes only. The material is not intended as an offer or solicitation for the purchase or sale of any financial instrument or security or to adopt any investment strategy. The information provided is not intended to constitute investment advice, an investment recommendation or investment research and does not take into account specific circumstances of any recipient. The material is not intended to provide, and should not be relied on for, accounting, legal or tax advice.
Information herein is believed to be reliable but Schroders does not represent or warrant its completeness or accuracy. No responsibility or liability is accepted by Schroders, its officers, employees or agents for errors of fact or opinion or for any loss arising from use of all or any part of the information in this document. No reliance should be placed on the views and information in the document when taking individual investment and/or strategic decisions. Schroders has no obligation to notify any recipient should any information contained herein changes or subsequently becomes inaccurate. Unless otherwise authorised by Schroders, any reproduction of all or part of the information in this document is prohibited.
Any data contained in this document has been obtained from sources we consider to be reliable. Schroders has not independently verified or validated such data and it should be independently verified before further publication or use. Schroders does not represent or warrant the accuracy or completeness of any such data.
All investing involves risk including the possible loss of principal.
Past performance is not a guide to future performance and may not be repeated. The value of investments and the income from them may go down as well as up and investors may not get back the amounts originally invested. Exchange rate changes may cause the value of any overseas investments to rise or fall. This document may contain “forward-looking” information, such as forecasts or projections. Please note that any such information is not a guarantee of any future performance and there is no assurance that any forecast or projection will be realised.
European Union / European Economic Area: Issued by Schroder Investment Management Limited, 31 Gresham Street, London, EC2V 7QA. Registered Number 1893220 England. Authorised and regulated by the Financial Conduct Authority.
Note to Readers in Australia: Issued by Schroder Investment Management Australia Limited, Level 20, Angel Place, 123 Pitt Street, Sydney NSW 2000 Australia. ABN 22 000 443 274, AFSL 226473.
Note to Readers in Canada: Schroder Investment Management North America Inc., 7 Bryant Park, New York, NY 10018-3706. NRD Number 12130. Registered as a Portfolio Manager with the Ontario Securities Commission, Alberta Securities Commission, the British Columbia Securities
Commission, the Manitoba Securities Commission, the Nova Scotia Securities Commission, the Saskatchewan Securities Commission and the (Quebec) Autorite des Marches Financiers.
Note to Readers in Hong Kong: Schroder Investment Management (Hong Kong) Limited, Level 33, Two Pacific Place 88 Queensway, Hong Kong. Central Entity Number (CE No.) ACJ591. Regulated by the Securities and Futures Commission.
Note to Readers in Indonesia: PT Schroder Investment Management Indonesia, Indonesia Stock Exchange Building Tower 1, 30th Floor, Jalan Jend. Sudirman Kav 52-53 Jakarta 12190 Indonesia. Registered / Company Number by Bapepam Chairman’s Decree No: KEP-04/PM/MI/1997 dated April 25, 1997 on the investment management activities and Regulated by Otoritas Jasa Keuangan (“OJK”), formerly the Capital Market and Financial Institution Supervisory Agency (“Bapepam dan LK”).
Note to Readers in Japan: Schroder Investment Management (Japan) Limited, 21st Floor, Marunouchi Trust Tower Main, 1-8-3 Marunouchi, Chiyoda-Ku, Tokyo 100-0005, Japan. Registered as a Financial Instruments Business Operator regulated by the Financial Services Agency of Japan. Kanto Local Finance Bureau (FIBO) No. 90.
Note to Readers in People’s Republic of China: Schroder Investment Management (Shanghai) Co., Ltd., RM1101 11/F Shanghai IFC Phase (HSBC Building) 8 Century Avenue, Pudong, Shanghai, China, AMAC registration NO. P1066560. Regulated by Asset Management Association of China.
Note to Readers in Singapore: Schroder Investment Management (Singapore) Ltd, 138 Market Street #23-01, CapitaGreen, Singapore 048946. Company Registration No. 199201080H. Regulated by the Monetary Authority of Singapore.
Note to Readers in South Korea: Schroders Korea Limited, 26th Floor, 136, Sejong-daero, (Taepyeongno 1-ga, Seoul Finance Center), Jung-gu, Seoul 100-768, South Korea. Registered and regulated by Financial Supervisory Service of Korea.
Note to Readers in Switzerland: Schroder Investment Management (Switzerland) AG, Central 2, CH-8001 Zürich, Postfach 1820, CH-8021 Zürich, Switzerland. Enterprise identification number (UID) CHE-101.447.114, reference number CH02039235704. Authorised and regulated by the Swiss Financial Market Supervisory Authority (FINMA).
Note to Readers in Taiwan: Schroder Investment Management (Taiwan) Limited, 9F, 108, Sec.5, Hsin-Yi Road, Hsin-YI District, Taipei 11047 Taiwan, R.O.C. Registered as a Securities Investment Trust Enterprise regulated by the Securities and Futures Bureau, Financial Supervisory Commission, R.O.C.
Note to Readers in the United Arab Emirates: Schroder Investment Management Limited, 1st Floor, Gate Village Six, Dubai International Financial Centre, PO Box 506612 Dubai, United Arab Emirates. Registered Number 1893220 England. Authorised and regulated by the Financial Conduct Authority.
Note to Readers in the United States: Schroder Investment Management North America Inc., 7 Bryant Park, New York NY 10018-3706. CRD Number 105820. Registered as an investment adviser with the US Securities and Exchange Commission. SCH33438
Top Related