


Languages
Pages
Legal


WHAT CIVIL SOCIETY CAN CONTRIBUTE : RESEARCH, TRAINING AND ADVOCACY TO
ADDRESS CHILD HUNGER AND UNDERNUTRITION
David SandersDirector: School of Public Health
University of the Western Cape
Member of Global Steering GroupPeoples Health Movement
A WHO Collaborating Centre for Research and Training in
Human Resources for Health

Outline of Presentation
Trends in child health and nutrition in the era of Primary Health Care - 1980 to 2004 – with special emphasis on Africa’s health situation
Impact of globalisation, health sector reform and HIV/AIDS on poverty, health “determinants”, health systems and human resources for health
The role of research, training and advocacy in addressing inequities and capacity weaknesses, with illustrative examples from Southern Africa

Despite successes, growing inequalities in global health
widening gap in infant mortality experience
40
60
80
100
120
140
160
1960 1981 1999
IMR decline
(Percent)
1960-1981 1981-1999
World 38.5 26.9
SSA 19.2 15.1
IMR: babies dying before age 1 per thousand born live
World
SSA
UNICEF: State of the World’s Children

U5MR in Sub-Saharan Africa
0
50
100
150
200
250
World SA Kenya Swaziland Zimbabwe Botswana
1960 1990 2001
The State of the World’s Children 2003. UNICEF

Global health inequities
• A woman has a nine in ten chance of reaching the age of 65 years in a high-income OECD country,
• but a four in ten chance in Malawi.
• In Tanzania, every sixth child born alive will die before the age of five years,
• while in high income OECD countries, every 167th child dies before the age of five.

Growing inequalities in child health – within countries
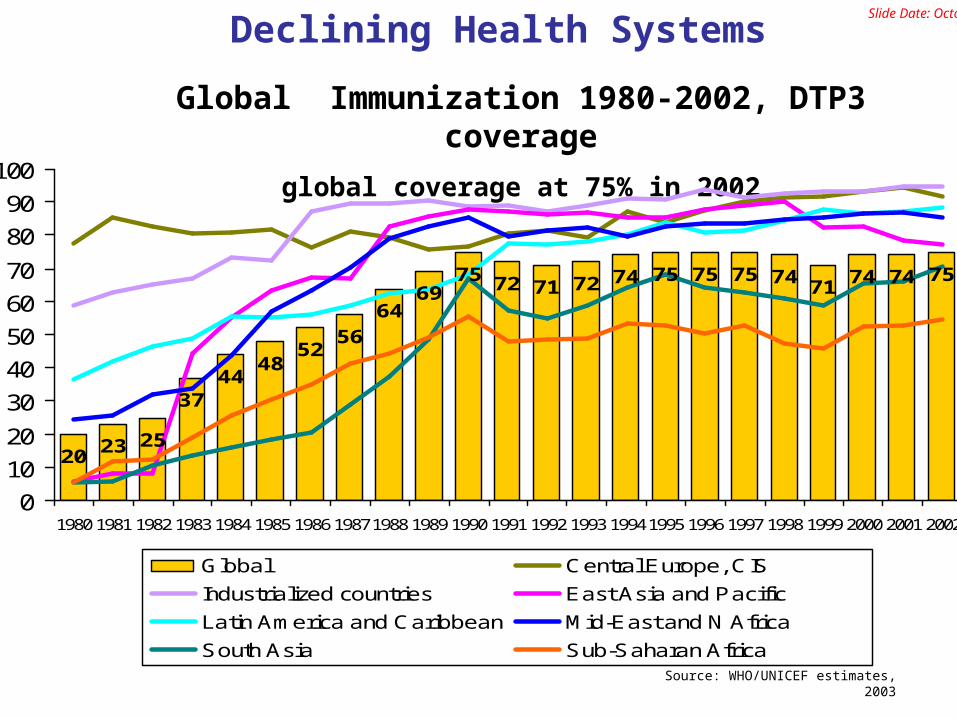
Global Immunization 1980-2002, DTP3 coverage
global coverage at 75% in 2002
2023 25
3744
4852
5664
6975 72 71 72 74 75 75 75 74
7174 74 75
01020
3040506070
8090
100
1980 1981 1982 1983 1984 1985 1986 1987 1988 1989 1990 1991 1992 1993 1994 1995 1996 1997 1998 1999 2000 2001 2002
Global Central Europe, CIS
Industrialized countries East Asia and Pacific
Latin America and Caribbean Mid-East and N Africa
South Asia Sub-Saharan Africa
Slide Date: October 03
Source: WHO/UNICEF estimates, 2003
Declining Health Systems

Leading global risk factors and contributionsto global burden of disease : % DALYs, World
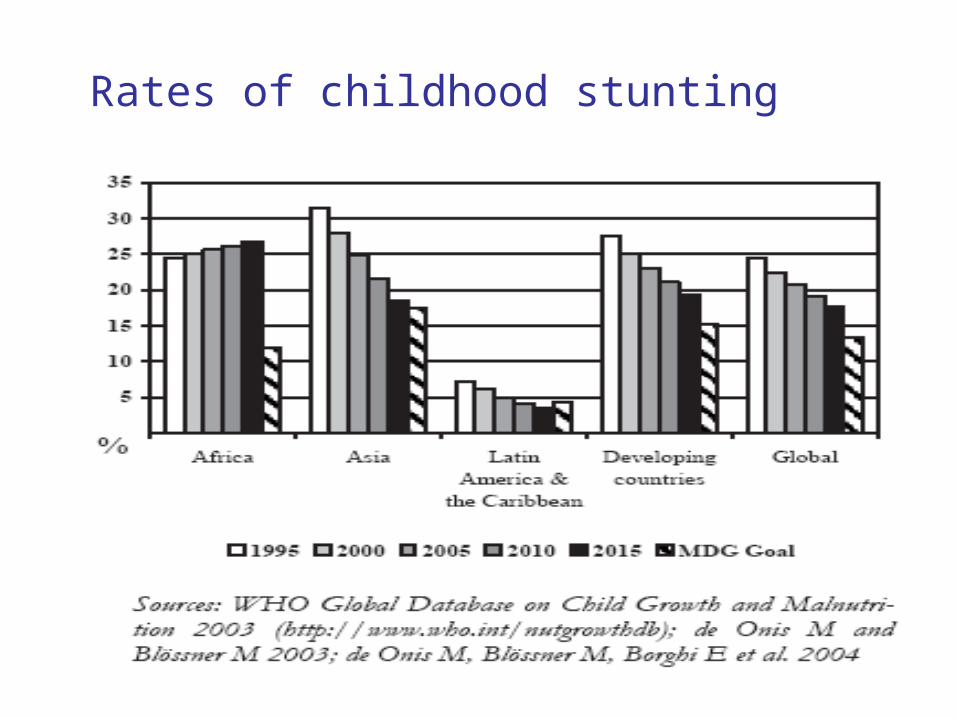
Rates of childhood stunting

The determinants of child mortalityConceptual framework of causality
Undernutrition
Inadequatedietary intake
Disease
Inadequate health services& unhealthy environments
Inadequate carefor children & women
Inadequate access to food
Resources & controlhuman, economic
& organisational resources
Potential resources
Political & ideological factors, economic structure
Outcome
Immediatecauses
Underlyingcauses
Basic causes


2002 FOOD CRISES IN SOUTHERN AFRICA
2002 FOOD CRISES IN SOUTHERN AFRICA
MALAWI: >70% of population facing food shortages; adult HIV prevalence 15%
MOCAMBIQUE: severe floods 2000, 2001 and 2007: drought 2002: adult HIV prevalence 13%
ZAMBIA: second year of crop failure: few food stocks: adult HIV
prevalence 21.5%
LESOTHO: second year of food shortages: maize prices high; adult HIV prevalence 31%
ZIMBABWE: food shortages: 31.4% of pregnant women in rural areas HIV+

Double Burden

Increased Oil Consumption
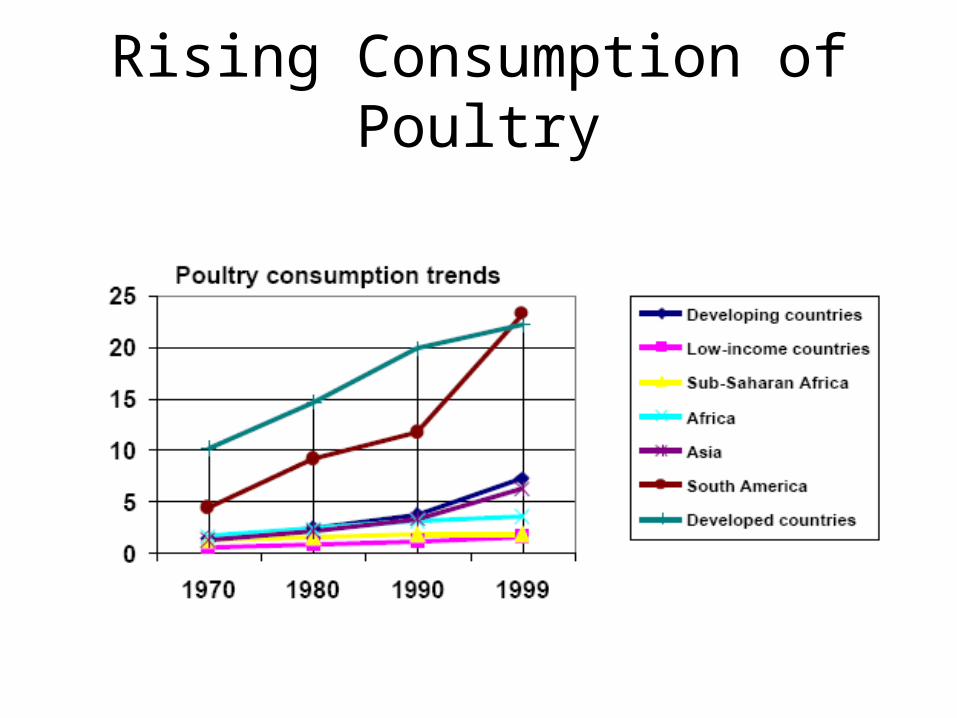
Rising Consumption of Poultry

Increasing poverty and inequality worsened by inequitable globalisation,
Selective PHC and Health sector
“reform”, and
HIV/AIDS
….. result in slow progress and reversals.
BUT what are the key ‘Basic Causes’ of Africa’s Health and Health Care Crisis?

The debt crisis, structural adjustment and globalisation:
• A crucial development in the current phase of globalisation…

External debt grows

External debt
• Between 1970 and 2002, African countries borrowed $540 billion from foreign sources, paid back $550 billion (in principal and interest), but still owe $295 billion (UNCTAD 2004)
• Africa spends more on debt servicing each year than on health and education -- “the building blocks of the AIDS response” (Piot 2004)

Debt Service Payments Dwarf Development Assistance Inflows
-150 -100 -50 0 50
East Asia & Pacific
Latin America, Caribbean
Middle East, North Africa
South Asia
Sub-Saharan Africa
US $ billion, 2002 (Source: Calculated from World Bank World Development Indicators database )
Developmentassistance
Debt service

Structural Adjustment Programmes: the main components
• Cuts in public enterprise deficits
• Reduction in public sector spending & employment
• Introduction of cost recovery in health and education sectors
• Phased removal of subsidies
• Devaluation of local currency
• Trade and financial market liberalisation

Impact of SAPs on health
“The majority of studies in Africa, whether theoretical or empirical, are negative towards structural adjustment and its effects on health outcomes”
Breman and Shelton, WHO CMH WG6, 2001

Globalisation is primarily about trade…
Globalization, defined as the process of increasing economic, political, and social interdependence and global integration which takes place as capital, traded goods, persons, concepts, images, ideas, and values diffuse across state boundaries, is occurring at ever increasing rates
(Hurrell, 1995, p.447).

…..unfair trade

Northern agricultural subsidies:Japan, the EU and the
US Source: UNDP
HDR 2005

Northern agricultural subsidies go
to large farms, not
smallSource: UNDP HDR
2005

Unfair Trade (1)• “..drawing the poorest countries into the global economy
is the surest way to address their fundamental aspirations”
(G8 Communiqué, Genoa, July 22, 2001)
• BUT… many developing countries have destroyed domestic economic sectors, such as textiles and clothing in Zambia (Jeter 2002) and poultry in Ghana (Atarah 2005), by lowering trade barriers and accepting the resulting social dislocations as the price of global integration
.

Unfair Trade (2)
• In addition industrialized countries apply much higher tariffs (tariff peaks), sometimes amounting to more than 100 percent, to the labour-intensive exports that are of special importance to developing countries. For example, the EU tariff on raw cocoa exported from Ghana is just 0.5 percent, but the tariff rises to 30.6 percent on chocolate imported from the same country (Elliott 2004b). Thus, although 90 percent of cocoa beans are grown in developing countries, they account for just four percent of the value of global chocolate production (IMF, 2002).

Trends in income inequality, selected Latin American & Caribbean countries
0
10
20
30
40
50
60
70
1989 1990 1991 1992 1993 1994 1995 1996 1997 1998 1999 2000 2001
UruguayVenezuelaArgentinaCosta RicaChileEl SalvadorJamaicaMexicoBrazil
Share of nationalincome, ratio oftop to bottom decile
Source: de Ferranti et al, 2004 (Table A.2)
The result… unequal growth of wealth within countries

The result… unequal growth of wealth between countries

..and unequal distribution of global income
UNDP 1997

..and growth of poverty
•According to the World Bank’s most recent figures, in sub-Saharan Africa 313 million people, or almost half the population, live below a
standardized poverty line of $1/day or less (Chen and Ravallion 2004).
•Sub-Saharan Africa is the only region of the world in which the number of people living in extreme poverty has increased – indeed, almost
doubling between 1981 and 2001.

Governance - Bribery & Corruption
• SAPs, by lowering public expenditures and workers’ salaries, abetted low level corruption as a means of survival
(Hanlon, How Northern Donors Promote Corruption, The Corner House, 2004)
• Superpowers in Africa “backed venal despots who were less interested in developing their national economies than in looting the assets of their countries…”
• Amongst worst MNC bribery offenders are those located in G8 countries
(Transparency International)

0 500 1000 1500 2000 2500 3000
US dollars
J apan annual dairy subsidy, per cow
EU annual dairy subsidy, per cow
Per capita annual income, sub-Saharan Africa
Per capita cost of package of essential health interventions
Per capita annual health expenditure, 63 low income countries
Why should a Japanese cow enjoy a higher income Why should a Japanese cow enjoy a higher income than an African citizen?than an African citizen?

The Health System, its financing and Health Sector
‘Reform’

Sub-Saharan African Country per capita expenditures on health (1997-2000)
Recommended expenditure: >$60/capita (Brundtland); >$34/capita (CMH)
Number of countries Amount of spending
4 > $60
2 $34 - $60
11 $12 - $34
18 < $12
13 Data not available or population <1.5 million
World Bank, World Bank, World Development ReportWorld Development Report 2004 2004

• For instance, Ethiopia spends 22% of its national budget on health and education, but this amounts to only US$1.50 per capita on health. Even if Ethiopia were to spend its entire budget on healthcare, it would still not meet the WHO target of US$30–40 per capita (Save the Children 2003).
• ““Countries just don’t have enough money.” Countries just don’t have enough money.”
Rt. Hon. Hilary Benn, April 2004, Rt. Hon. Hilary Benn, April 2004, WFPHA/UKPHA, BrightonWFPHA/UKPHA, Brighton
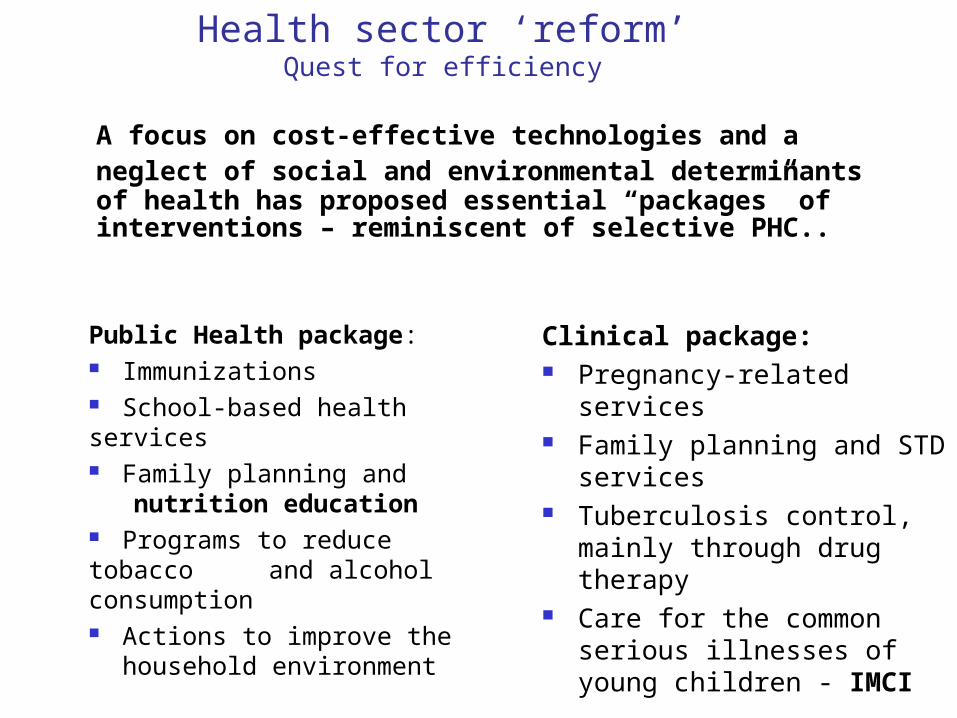
A focus on cost-effective technologies and a neglect of social and environmental determinants of health has proposed essential “packages” of interventions – reminiscent of selective PHC..
Public Health package: Immunizations School-based health services Family planning and nutrition education Programs to reduce tobacco
and alcohol consumption Actions to improve the household environment
Clinical package: Pregnancy-related services Family planning and STD
services Tuberculosis control,
mainly through drug therapy
Care for the common serious illnesses of young children - IMCI
Health sector ‘reform’Quest for efficiency

“[C]ost-effectiveness analyses have shown improved water supply and sanitation to be costly ways of improving people’s health. …. encouraging people to wash their hands and making soap available have reduced the incidence of diarrhoeal disease by 32% to 43%... (Commission on Macroeconomics and Health,2001/02)
For example, water provision can:
Improve hygiene practice and thus reduce incidence of diarrhoeal diseaseSave women’s time for caring and economic activity, thus improving household income and food securityContribute to increased agricultural production, thus improving household income and food security
CEA cannot evaluate the effectiveness of ‘broader’ interventions that may result
in health improvement through numerous direct and indirect
mechanisms

..subverting the Mission of Public Health
“Ensuring the conditions in which people can be healthy”
(Institute of Medicine)


A return to vertical programmes; Erosion of intersectoral work and
community health infrastructures Fragmentation of health services and
reversal of health gains
Health sector ‘reform’ Quest for efficiency cont.- The move from equity and comprehensiveness to efficiency and selectiveness leads to:

AIDS and Aid may both disrupt health systems…
Labonte, 2005, presentation to Nuffield Trust
In 2000, Tanzania was preparing 2,400 quarterly reports on separate aid-funded projects and hosted 1,000 donor visit meetings a year.
At last count there were over 90 GHIs (the best known being GAVI, GFATM, Pepfar), each funding different diseases and programmes.

Health systems & personnel in Africa
Health personnel vital, consume between 60 – 80% of recurrent public health expenditure (WB, 1994).

Burden of diseaseBurden of disease
Share of populationShare of population
Share of health workersShare of health workers
Our Common Interest 2005:184 Our Common Interest 2005:184

NURSE REGISTRATION IN UK :Increase during a period when a “ban” on active international recruitment had just come into effect
Buchan et al 2003

The brain drain
In relation to health care professionals, especially nurses … there are aggressive and targeted international recruitment initiatives.
The UK government, for example, has stated that international recruitment is part of the solution to meeting its staffing needs.
This type of active recruitment can have a marked effect on a sending country, especially because it … is aimed at getting significant numbers of workers from the country …

International migration—winners & losers How much do importing countries gain from
international migration?
UN Conference on Trade and Development (UNCTAD):for each professional aged between 25 and 35 years, US$ $184,000 is saved in training costs by rich countries
(UNECA, 2000)

Global HIV prevalence 40 million people around the
world live with HIV - more than the population of Poland.
Nearly two-thirds of them live in Sub-Saharan Africa, where in the two hardest hit countries HIV prevalence is almost 40%.
The global HIV/Aids epidemic killed more than 3 million people in 2003
there are emerging and growing epidemics in China, Indonesia, Papua New Guinea, Vietnam, several Central Asian Republics, the Baltic States, and North Africa.
The AIDS debate, BBC News

Enhancing Capacity for Public Nutrition Action
Decentralised health services have dramatically increased need for public health skills – for policy, advocacy, planning, programme design, implementation, monitoring and evaluation
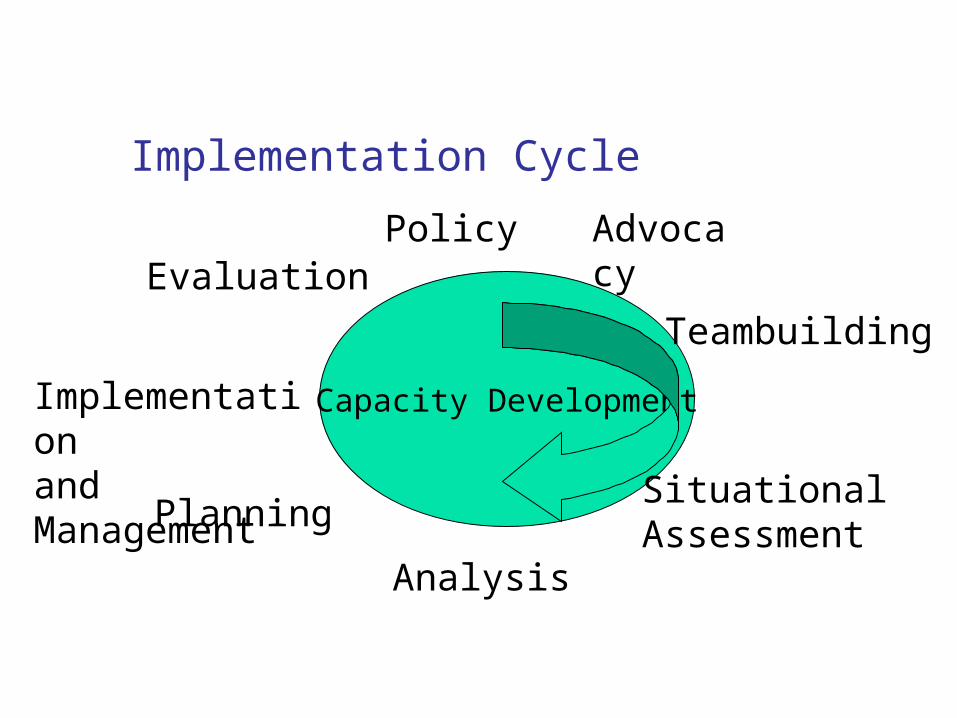
Implementation Cycle
Capacity Development
Advocacy
Teambuilding
Analysis
Situational Assessment
Planning
Implementationand Management
EvaluationPolicy

Components of Capacity to Perform Tasks
Have the knowledge and skills to perform the tasks
Accept responsibility to carry out the tasks
Have the authority to carry out the tasks
Have access to and control of resources necessary to perform the tasksAfter Gillespie and Jonsson

Potter and Brough (2004).
Household and Community Capacities

The Challenge in Research and Training
Need to train personnel from different backgrounds to facilitate process of change
Short to medium term priority is to upskill those already in the field
Needs to be as least disruptive, both to the participants and the health services, as possible

Key focus areas for public health research
Research and advocacy on health determinants (local and global) with an equity lens
Participatory research on health systems, particularly on effectiveness - operational aspects and evaluation, and on human resources
Case studies of comprehensive, community-based approaches
Sanders et al, Bull WHO 2004,
82(10)

1. Examples of Priority Research and Advocacy
Research on health determinants and equity – at a global level

Available from University of Cape Town Press, 2004.
Online ordering andprepublication proofs
available at:http://web.idrc.ca/ev.php?ID=45682_201&ID2=DO_TOPIC
“Determinants” research: a global example

What We Did
Identified health-related commitments made at 1999, 2000, 2001 summits
Updated to 2002, 2003 and 2004 summits
Commitments either relate directly to health, or
Have implications for policy areas that affect the determinants of population health (e.g. macroeconomic policy, trade and market access, environment)
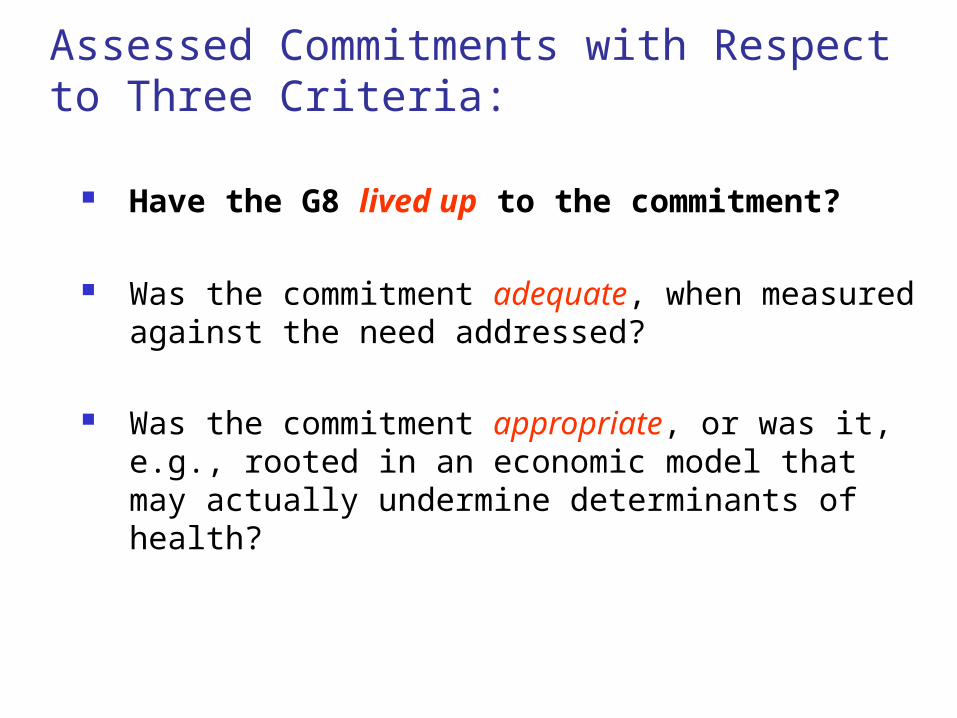
Assessed Commitments with Respect to Three Criteria:
Have the G8 lived up to the commitment?
Was the commitment adequate, when measured against the need addressed?
Was the commitment appropriate, or was it, e.g., rooted in an economic model that may actually undermine determinants of health?
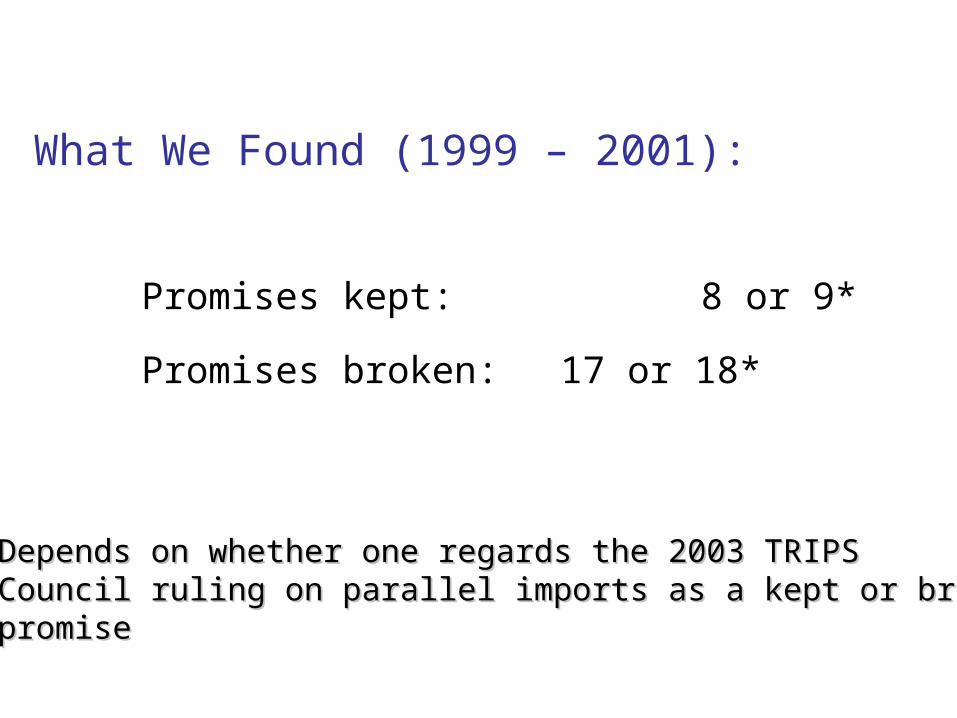
What We Found (1999 – 2001):
Promises kept: 8 or 9*
Promises broken: 17 or 18*
* * Depends on whether one regards the 2003 TRIPSDepends on whether one regards the 2003 TRIPS Council ruling on parallel imports as a kept or brokenCouncil ruling on parallel imports as a kept or broken promisepromise
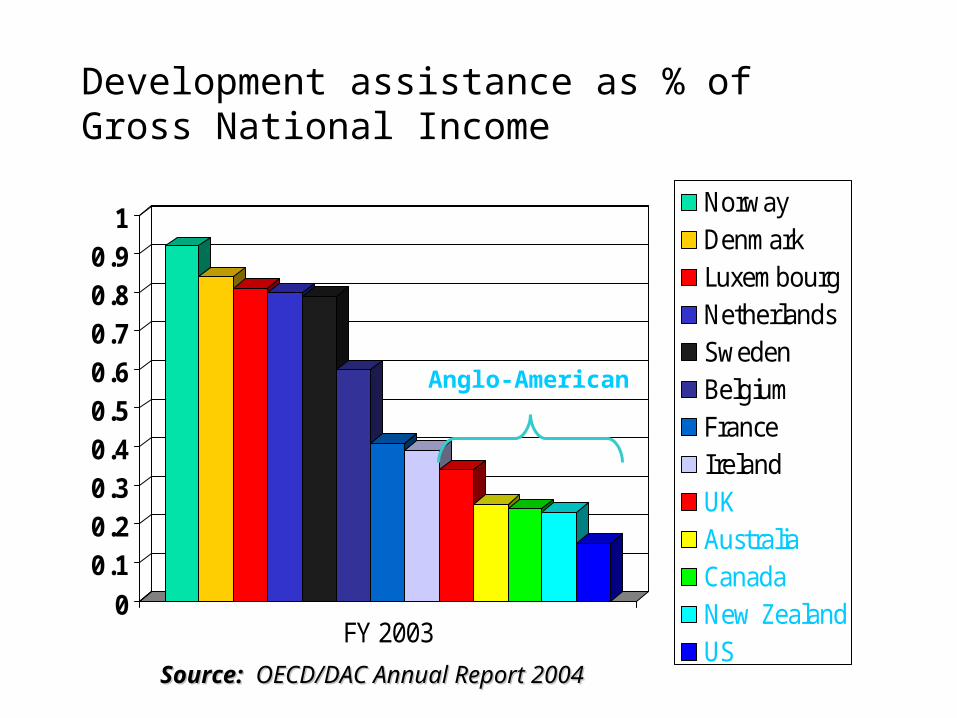
Development assistance as % of Gross National Income
00.10.20.30.40.50.60.70.80.9
1
FY 2003
NorwayDenmarkLuxembourgNetherlandsSwedenBelgiumFranceIrelandUKAustraliaCanadaNew ZealandUS
Source: Source: OECD/DAC Annual Report 2004OECD/DAC Annual Report 2004
Anglo-American

Annual cost of meeting the 0.7 percent of GNI ODA target, in Big Macs/capita
0
10
20
30
40
50
60
70
80
90
Canada
France
Germany
Italy
Japan
U.K.
U.S.
Based on 2002 ODA figures from OECD, Big Mac prices Based on 2002 ODA figures from OECD, Big Mac prices from from The EconomistThe Economist, April 25, 2002, April 25, 2002

“Too much of the history of the industrialised world’s involvement in Africa is a miserable history of broken promises.”
Report of the Commission for Africa, 2005, p.18Report of the Commission for Africa, 2005, p.18
2. Examples of Priority Research
Research on health determinants and equity – at a local level
The Cape Town Equity Gauge

Part of a global movement: Global Equity Gauge Alliance (GEGA)
14 initiatives:
11 country initiatives
3 city initiatives Funded by Rockefeller Foundation

Equity requires a balance between resources and needs
Health DistrictGeographic Area
ResourcesNEEDS

Example: Resource allocation in Primary Care
To assess health need To assess primary care resources and
compare to need To develop a resource allocation tool to
rectify the inequities

0
10
20
30
40
50
Ath
lone
Bla
auw
berg
Cen
tral
Hel
derb
erg
Kha
yelit
sha
Mitc
hells
Pla
in
Nya
nga
Oos
tenb
erg
SP
M
Tyg.
Eas
t
Tyg.
Wes
t
Reg
ion
Infant Mortality Rate
0%
2%
4%
6%
8%
10%
12%
Ath
lon
e
Bla
au
wb
erg
Cen
tral
Held
erb
erg
Kh
aye
lits
ha
Mit
ch
ell
sP
lain
Nyan
ga
Oo
ste
nb
erg
So
uth
Pen
ins
ula
r
Tyg
erb
erg
Eas
t
Tyg
erb
erg
We
st
HIV prevalence 2000(estimate)
0%
20%
40%
60%
Athl
one
Blaa
uwbe
rg
Cent
ral
Held
erbe
rg
Khay
elits
ha
Mitc
hells
Plain
Nyan
ga
Oost
enbe
rg SP
M
Tyge
rber
gEa
st
Tyge
rber
gW
est
TOTA
L
% households below the poverty line
0%10%20%30%40%50%60%
Athlo
ne
Blaa
uwbe
rg
Cen
tral
Held
erbe
rg
Khay
elits
ha
Mitc
hells
Plai
n
Nyan
ga
Oos
tenb
erg
SPM
Tyge
rber
gEa
st
Tyge
rber
gW
est
TOTA
L
% unemployed
Health Need across Cape Town Districts

Distance to Equity in Resource Allocation for Primary Care (Health Centres and Clinics)
-20,000,000
-15,000,000
-10,000,000
-5,000,000
0
5,000,000
10,000,000
15,000,000
20,000,000At
hlon
e
Bla
auw
berg
Cen
tral
Hel
derb
erg
Kha
yelit
sha
Mitc
hells
Pla
in
Nya
nga
Oos
tenb
erg
Sou
thP
enin
sula
Tyge
rber
gE
ast
Tyge
rber
gW
est
ME
TRO
PO
LE

3. Examples of Priority Research
Participatory research on health systems, particularly on effectiveness - operational aspects and evaluation, and on human resources
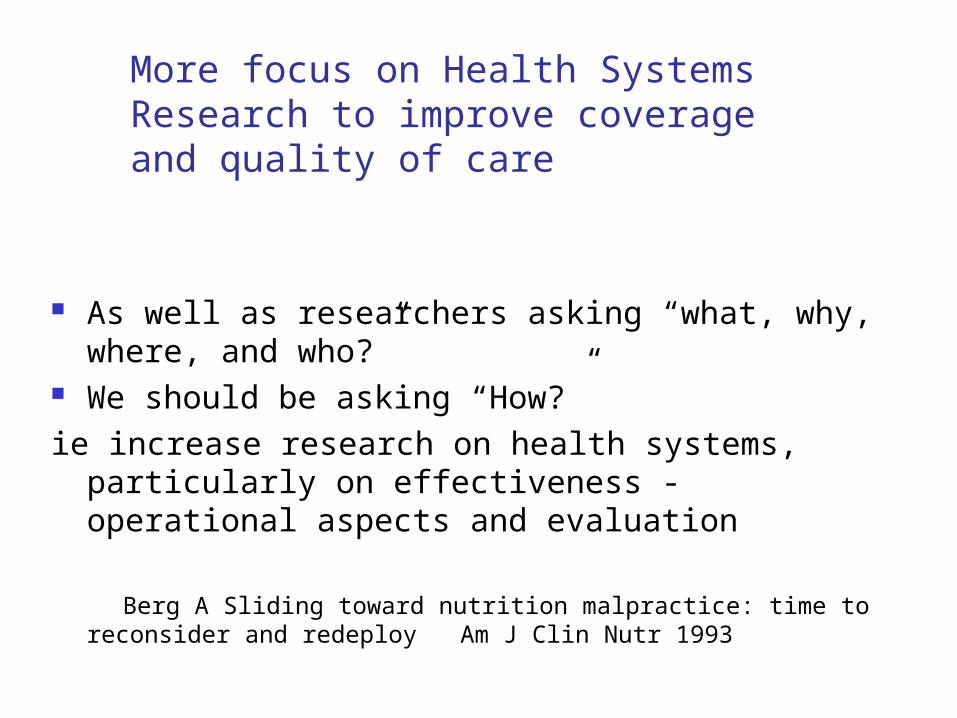
More focus on Health Systems Research to improve coverage and quality of care
As well as researchers asking “what, why, where, and who?”
We should be asking “How?” ie increase research on health systems, particularly
on effectiveness - operational aspects and evaluation
Berg A Sliding toward nutrition malpractice: time to reconsider and redeploy Am J Clin Nutr 1993

AN EXAMPLE OF EFFECTIVENESS RESEARCH: MT. FRERE HEALTH DISTRICT
Eastern Cape Province, South Africa
Former apartheid-era homeland
Estimated Population: 280,000
Infant Mortality Rate: 99/1000
Under 5 Mortality Rate: 108/1000

STUDY SETTING:PAEDIATRIC WARDS
Nurses have the main responsibility for malnourished children
Per Ward: 2-3 nurses and 1-2 nursing
assistants on day duty, and 2 nurses on night duty 10-15 general paediatric
beds and 5-6 malnutrition beds

Implementation Cycle
Capacity Development
Advocacy
Teambuilding
Analysis
Situational Assessment
Planning
Implementationand Management
EvaluationPolicy

CASE FATALITY IN RURAL HOSPITALS
PRE-INTERVENTION CFRs
Mary Terese 46% Sipetu 25%Holy Cross 45% St Margaret’s 24%St. Elizabeth’s 36% Taylor Bequest 21%Mt. Ayliff 34% Greenville 15%St. Patrick’s 30% Rietvlei 10%Bambisana 28%

Implementation Cycle
Capacity Development
Advocacy
Teambuilding
Analysis
Situational Assessment
Planning
Implementationand Management
EvaluationPolicy

WHO 10-STEPS PROTOCOL – Nutrition component of hospital level IMCI
Step 1 Treat/prevent hypoglycaemia
Step 2: Treat/prevent hypothermia
Step 3: Treat/prevent dehydration
Step 4: Correct electrolyte imbalance
Step 5. Treat/prevent infection
Step 6. Correct micronutrient deficiencies
Step 7. Cautious feeding
Step 8. Catch-up growth
Step 9. Stimulation, play and loving care
Step 10. Preparations for discharge

Comparison of recommended and actual practices
SITUATIONAL ANALYSIS IMPLEMENTATION
Recommended practice
Practice prior to intervention
Perceived barriers to quality care
Programme intervention
Changes reported at follow up visits
Step 1: Treat/prevent hypoglycaemia Feed every 2 hours during the day and night. Start straight away.
Children were left waiting in the queue in the outpatient department and during admission procedures. In the wards, they were not fed for at least 11 hours at night Hypoglycaemia not diagnosed
Lack of knowledge about risks of hypoglycaemia Lack of knowledge about how to prevent it Shortage of staff especially during the night No supplies for testing for hypoglycaemia
Training to explain why malnourished children are at increased risk Training on how to prevent and treat hypoglycaemia Motivated for more night staff in paediatric wards Motivated the Department of Health to provide resources (10% glucose and Dextrostix.)
Malnourished childrenfed straightaway and 3 hourly during day and night. The number of night staff was increased Dextrostix and 10% glucose obtained

WHO 10-STEPS TRAINING – Mt. Frere District, Eastern Cape
Developed as part of a District-Level INP
Training & Implementation from March 98 to Aug 99
Two formal training workshops for Paeds staff
On-site facilitation by nurse-trainer
Adaptation of protocols – Now have Eastern Cape Provincial Guidelines
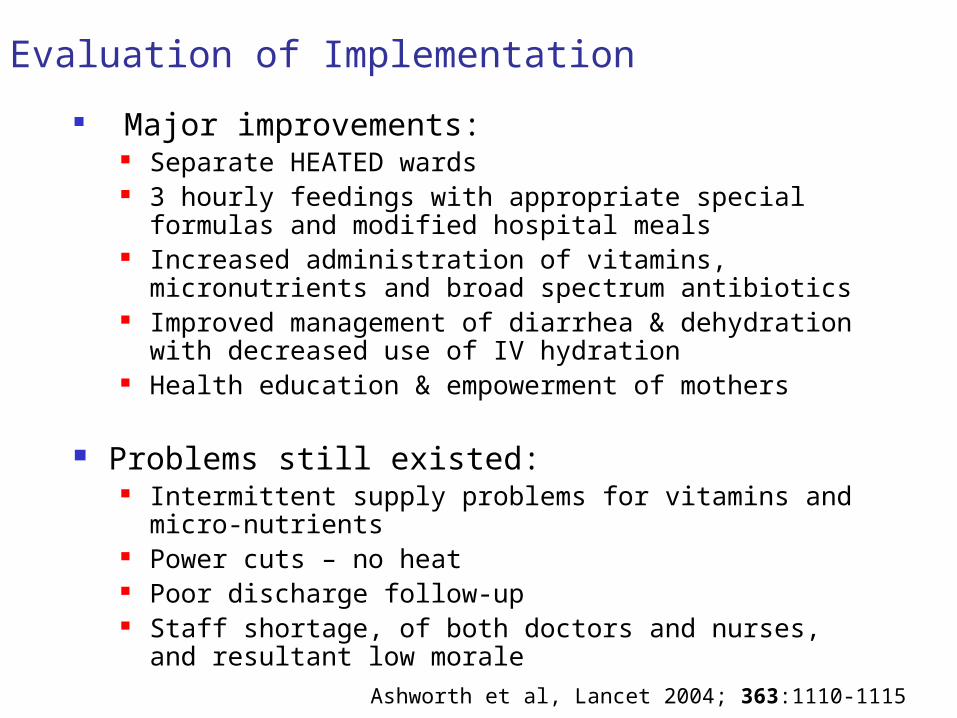
Evaluation of Implementation
Major improvements: Separate HEATED wards 3 hourly feedings with appropriate special formulas
and modified hospital meals Increased administration of vitamins, micronutrients
and broad spectrum antibiotics Improved management of diarrhea & dehydration
with decreased use of IV hydration Health education & empowerment of mothers
Problems still existed: Intermittent supply problems for vitamins and micro-
nutrients Power cuts – no heat Poor discharge follow-up Staff shortage, of both doctors and nurses, and
resultant low moraleAshworth et al, Lancet 2004; 363:1110-1115

CHANGES IN CFRs IN RURAL HOSPITALS
0
5
10
15
20
25
30
35
40
45
50
Holy-cross St. Patricks Mt. Ayliff St. Elizabeth
1998-1999
2000-2001
2002
2003

Educational Strategies
Based on assessed training needs
Problem-oriented Adult education
techniques Linked to systems
development
Distance learning materials
Training guides Location should be
as close to workplace as possible
Training of teams Follow-up support


4. Case studies of comprehensive, community-based approaches

Ceará, Brazil Early1980s IMR over100 per 1,000 and malnutrition very common 1986 statewide survey of child health and nutrition resulted in new health
policies, including GOBI plus vitamin-A supplementation.
Coverage improvement through large new programmes of community health workers and traditional birth attendants.
health services decentralised to rural municipalities with worst health indicators
social mobilisation campaign for child health implemented using media and small radio stations to broadcast educational messages
surveys repeated in 1990 and 1994, and results incorporated into health policy. This process was sustained by four consecutive state governors
Improved outputs By 1994 ORS use increased to more than 50 per cent nearly all children had a growth chart and half had been weighed
within the previous three months immunisation coverage was 90 per cent or higher; and median
breastfeeding duration increased from 4.0 to 6.9 months.
Improved outcome indicators low W/A fell from 12.7% to 9.2%; low H/A from 27.4% to 17.7% reduced diarrhoea from 26.1% to 13.6% IMR fell from 63 per 1,000 live births in 1987 to 39 per 1,000 in 1994 diarrhoea deaths fell from 48% to 29% perinatal deaths increased as a proportion from 7 per cent to 21 per cent and
respiratory infections from 10 per cent to 25 per cent. (Victora et al, 2000)).
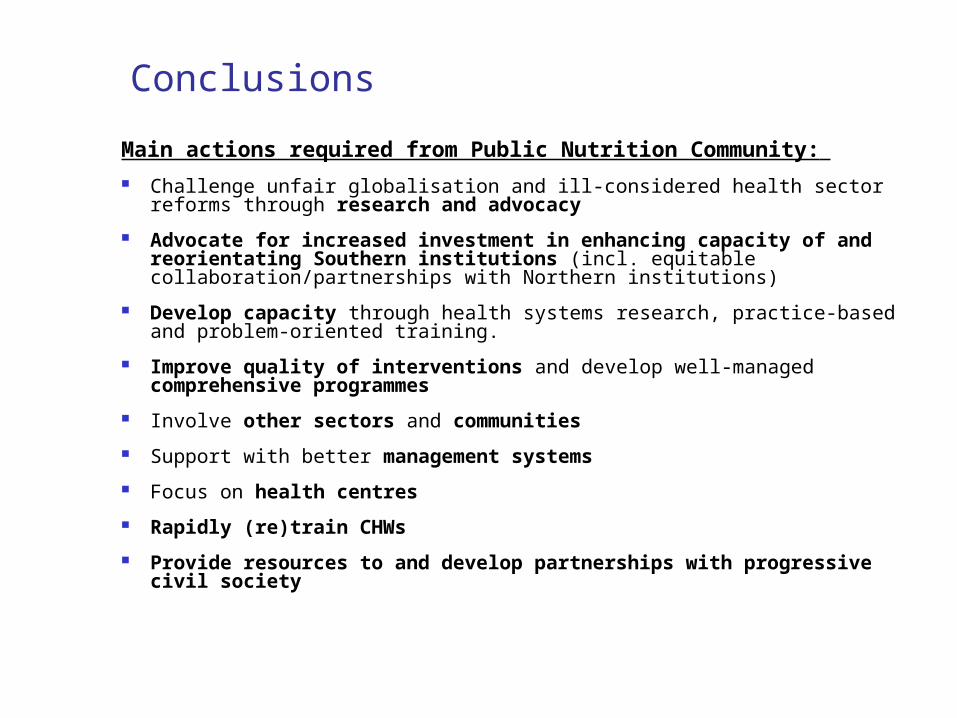
Conclusions
Main actions required from Public Nutrition Community: Challenge unfair globalisation and ill-considered health sector reforms
through research and advocacy
Advocate for increased investment in enhancing capacity of and reorientating Southern institutions (incl. equitable collaboration/partnerships with Northern institutions)
Develop capacity through health systems research, practice-based and problem-oriented training.
Improve quality of interventions and develop well-managed comprehensive programmes
Involve other sectors and communities
Support with better management systems
Focus on health centres
Rapidly (re)train CHWs
Provide resources to and develop partnerships with progressive civil society

PEOPLE´S HEALTH MOVEMENT
The Peoples Health Movement (PHM) is a large global civil society network of health activists supportive of the WHO policy of Health for All and organised to combat the economic and political causes of deepening inequalities in health worldwide and revitalise the implementation of WHO’s strategy of Primary Health Care.
www.phmovement.org

www.ghwatch.org

Unfair Trade (1)• “..drawing the poorest countries into the global economy is the surest way to
address their fundamental aspirations”
(G8 Communiqué, Genoa, July 22, 2001)
• BUT… many developing countries have destroyed domestic economic sectors, such as textiles and clothing in Zambia (Jeter 2002) and poultry in Ghana (Atarah 2005), by lowering trade barriers and accepting the resulting social dislocations as the price of global integration
• Import liberalization was a key element of structural adjustment programs; a recent study found that PRSPs may include “trade-related conditions that are more stringent, in terms of requiring more, or faster, or deeper liberalization, than WTO provisions to which the respective country has agreed”(Brock and McGee 2004) .

The Notion of “Capacity”
Potter and Brough (2004).

Potter and Brough (2004).
Household and Community Capacities

Potter and Brough (2004).
Household and Community Capacities
Top Related