


Languages
Pages
Legal

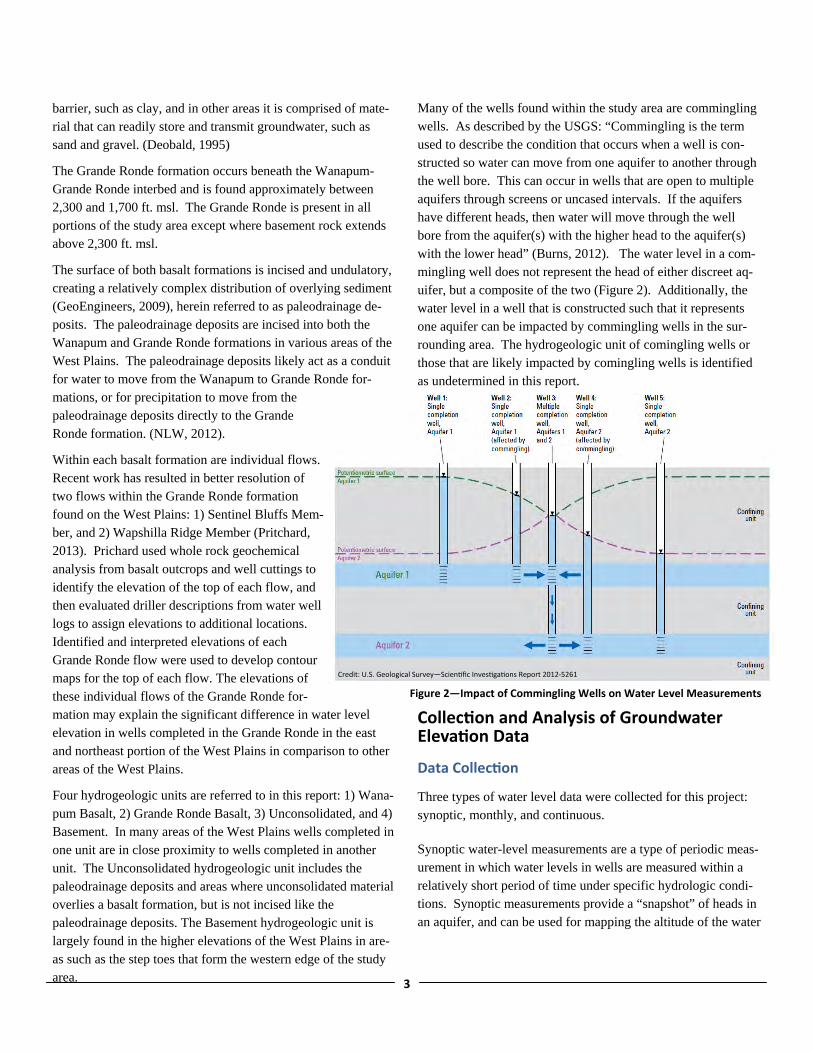
West Plains Hydrogeology
June 30, 2013
Prepared by Spokane County Water Resources
Washington Department of Ecology
Grant G1200159
West Plains Groundwater Eleva on Monitoring and Mapping

Introduc on…………………………………………………………………………………………………….. 1
Study Area Descrip on……..……………………………………………………………………………… 2
Collec on & Analysis of Groundwater Eleva on Data………….…………………………… 3
Data Collec on…….…………….……………………………………………………………………….. 3
Synop c Water Level Measurements…..………………………………………………………. 4
Monthly Water Level Measurements…………………………………………………………. 6
Con nuous Water Level Measurements………………….………..………………………… 13
Summary and Conclusions……………………………………………………………………………….. 18
Maps………………………………………………………………………………………………………………… M‐1
Tables….…………………………………………………………………………………………………………… T‐1
References………………………………………………………………………………………………………..
Table of Contents
Figure 1: West Plains Groundwater Eleva on Monitoring and Mapping Project Study Area 1
Figure 2: Impact of Commingling Wells on Water Level Measurements 3
Figure 3: Project Wells: Loca on, Monitoring Frequency and Hydrogeologic Unit M‐1
Figure 4: Supplemental Wells: Loca on, Monitoring Frequency and Hydrogeologic Unit M‐2
Figure 5: Fall 2011 Synop c Water Level Data M‐3 & M‐4
Figure 6: Spring 2012 Synop c Water Level Data M‐5 & M‐6
Figure 7: Change in Water Level Fall 2011 to Spring 2012 Grande Ronde Unit & Unconsolidated Unit M‐7
Figure 8: Change in Water Level Fall 2011 to Spring 2012 Wanapum Unit & Basement Unit M‐8
Figure 9: Wanapum Unit Water Level Contours M‐9
Figure 10: Grande Ronde Unit Water Level Contours M‐10
Figure 11: Monthly Water Level Data Map M‐11
Figure 12: Well 544269 Strip Log and Hydrograph 6
Figure 13: Well 174648 S p Log and Hydrograph 7
Figure 14: Well Green Hydrograph 8
Figure 15: Well Tareski Hydrograph 8
Figure 16: Well 168759 Strip Log and Hydrograph 9
Figure 17: Well 171100 Strip Log and Hydrograph 9
Figure 18: Well 472828 Strip Log and Hydrograph 10
Figure 19: Well 167996 Strip Log and Hydrograph 10
Figure 20: Well 167998 Strip Log and Hydrograph 11
Figure 21: Well 160959 Strip Log and Hydrograph 11
Figure 22 Well 441147 Strip Log and Hydrograph 12
Figure 23: Well 172184 Strip Log and Hydrograph 13
Figure 24: Well 407776 Strip Log 13
Figure 25: Well 172968 Strip Log 14
Figure 26: Well 439863 Strip Log 14
Figure 27 Well 411175 Strip Log 15
Figure 28: Well 164270 Strip Log 15
Figure 29: Well 295341 Strip Log 16
Figure 30: Well 472535 Strip Log 16
Figure 31: Well 617922 Strip Log 17
Figure 32: Well 167912 Strip Log 17
Figure 33: Lincoln‐Garfield Rd. Well Groundwater Eleva on & Temperature Sept 2011‐June 2013 19
Figures

Tables
Figure 34: Well 172968 Groundwater Eleva on & Temperature Sept 2011‐June 2013 19
Figure 35: Well 172968 Groundwater Eleva on & 7 day average precipita on Sept 2011‐June 2013 20
Figure 36: Well 439863 Groundwater Eleva on & Temperature Sept2011‐June 2013 20
Figure 37: Well 439863 Groundwater Eleva on & 7 day average precipita on Sept2011‐June 2013 21
Figure 38: Four Lakes Water District‐School Well Groundwater Eleva on & Temperature Sept 2011‐June 2013 21
Figure 39: Well 411175 Groundwater Eleva on & Temperature September 2011‐June 2013 22
Figure 41: Well 164270 Groundwater Eleva on & Temperature September 2011‐June 2013 23
Figure 42: Well 295341 Groundwater Eleva on & Temperature September 2011‐June 2013 23
Figure 43: Well 472535 Groundwater Eleva on & Temperature September 2011‐June 2013 24
Figure 44: Well 472535 Groundwater Eleva on & 7 day average precipita on Sept 2011‐June 2013 24
Figure 45: Well 617922 Groundwater Eleva on & Temperature September 2011‐June 2013 25
Figure 46: Well 167912 (165941) Groundwater Eleva on & Temperature September 2011‐June 2013 25
Figure 40: Well 411175 Spokane River Eleva on and Groundwater Eleva on Sept 2011‐June 2013 22
Figures (con nued)
Table 1: Project Wells T‐1
Table 2: Supplemental Wells T‐6
Table 3: Synop c Water Level Data T‐8
Table 4: Change in Water Level Fall to Spring in the Wanapum and Grande Ronde Units 5
Table 5: Monthly Water Level Data T‐11
Table 5.1: Well 544269 T‐11
Table 5.2: Well 174648 T‐11
Table 5.3: Well Green T‐11
Table 5.4: Well Tareski T‐11
Table 5.5: Well 168759 T‐11
Table 5.6: Well 160959 T‐11
Table 5.7 Well 472828 T‐12
Table 5.8: Well 172184 T‐12
Table 5.9: Well 171100 T‐12
Table 5.10: Well 441147 T‐12
Table 5.11: Well 167998 T‐12
Table 5.12: Well 167996 T‐12
Table 6: Supplemental Wells Water Level Data T‐13
Table 6.1: Well 488063 T‐13
Table 6.2: Well 419534 T‐14
Table 6.3: Well VA_CMTRY T‐15
Table 6.4: Well FAFBMWD1 T‐15
Table 6.5: Well 152024 T‐15
Table 6.6: Well 292881 T‐15
Table 6.7 Well 153821 T‐15
Table 6.8: Well 560746 T‐16
Table 6.9: Well 560732 T‐16
Table 6.10: Well 560763 T‐17
Table 6.11: Well 560736 T‐18
Table 6.12: Well 472535 T‐18
Table 6.13: Water Level Data from Deobald & Buchanan T‐20

1
Introduc on
This report describes the work completed for the West Plains Groundwater Elevation Monitoring and Mapping Project (project). The project was funded by a grant from the Washington Department of Ecology’s (Ecology) Water-shed Planning Program. The project scope was developed from recommendations included in the Water Resource Inventory Area (WRIA 54) Watershed Plan and WRIA 54 Detailed Implementation Plan (DIP). The WRIA 54 DIP includes the following recommendation:
Recommendation TI-1: West Plains Hydrogeology Study:
Basalt Aquifer Groundwater Study-The Columbia River Basalt Group aquifers that underlie the West Plains area are used for water supply. Groundwater
levels have declined in some areas, indicating the groundwater resource is potentially strained. These aq-uifers are not well understood. Elsewhere in the Pacific Northwest, basalt aquifers are used extensively for water supply, indicating that a better understanding of the Co-lumbia River Basalt Group aquifer in the West Plains area would be beneficial to understand how this resource can be used in a sustainable way. (Tetra Tech, 2010).
Groundwater elevation data is essential to understanding a hy-drogeologic system. As the USGS writes:
Groundwater systems are dynamic and adjust continually to short-term and long-term changes in climate, groundwater withdrawal, and land use. Water level measurements from observation wells are the principal source of information about the hydrologic stresses acting on aquifers and how these stresses affect groundwater recharge, storage, and dis-
117°25'26"W117°45'26"W
47°45'0"N
47°40'0"N
47°35'0"N
0 2.5 51.25 MilesLegend
Study Area Boundary
Surface/Near Surface Basement Rock
Figure 1—West Plains Groundwater Eleva on Monitoring and Mapping Project Study Area

2
charge. Long term, systematic measurements of water levels provide essential data needed to evaluate changes in the re-source over time, to develop ground water models and fore-cast trends, and to design, implement, and monitor the effec-tiveness of ground water management and protection pro-grams. (Taylor, 2001)
The purpose of the project was two fold: 1) collect, document, and organize groundwater elevation data to be used in future hydrogeologic analysis of the study area and long term water level trend monitoring, and 2) Use groundwater elevation data to develop groundwater elevation contours and evaluate changes in water levels over various time scales. This report includes data collected for this project and data collected by other organi-zations, both current and historical.
Study Area Descrip on
The identification of the geographic area the “West Plains” is used frequently in the region, yet the boundaries of this area are not well defined. It is often used to describe the area west of the Spokane River, south of Deep Creek, north of Interstate 90, and west of Lincoln County. The study area for this project, herein referred to as the West Plains, includes that area plus additional area to the north and south. The area was defined by outcrops of crystalline basement rock that appear to act as a barrier to ground water flow in the basalt aquifers of the West Plains. The boundaries of the basement outcrops have been shown on surfi-cial geology maps in the past, but a more complete boundary has recently been mapped by McCollum and others and is in-cluded in the soon to be released paper entitled Mesoproterozoic and Cambrian Geology of the Northeastern Columbia Plateau of Washington—A View from the Steptoes (McCollum, 2013). Figure 1 shows the study area boundaries and the basement rock.
An understanding of the geologic setting of the West Plains is necessary to interpret the results described in latter sections of this report. The geology and hydrogeology of the Columbia River Basalt Group has been studied extensively and many stud-ies on the West Plains specifically have been completed. The brief summary provided below provides information relevant to the discussion of results provided in latter sections of this report.
The West Plains is located in the northeast corner of the Colum-bia Plateau Regional Aquifer System (CRPAS). The geologic and hydrogeologic setting of the Columbia Plateau has been extensively studied and is well described in many publications. The USGS recently released two reports on the subject: Hydro-geologic framework and hydrologic budget components of the
Columbia Plateau Regional Aquifer System, Washington, Ore-gon and Idaho (Kahle, 2011) and Three-dimensional model of the geologic framework for the Columbia Plateau Regional Aq-uifer System, Idaho, Oregon, and Washington (Burns, 2011). The following portion of the abstract from the first publication listed above provides a succinct description of the CPRAS:
Conceptually, the system is a series of productive basalt aquifers consisting of permeable interflow zones separat-ed by less permeable flow interiors; in places, sedimen-tary aquifers overly the basalts. The aquifer system of the Columbia Plateau Regional Aquifer System (CPRAS) includes seven hydrogeologic units—the over-burden aquifer, three aquifer units in the permeable bas-alt rock, two confining units, and a basement confining unit. The overburden aquifer includes alluvial and collu-vial valley-fill deposits; the three basalt units are the Saddle Mountains, Wanapum, and Grande Ronde Bas-alts and their intercalated sediments. The confining units are equivalent to the Saddle Mountains-Wanapum and Wanapum-Grande Ronde interbeds, referred to in this study as the Mabton and Vantage Interbeds, respectively. The basement confining unit, referred to as Older Bed-rock, consists of pre-Columbia River Basalt Group (CRBG) rocks that generally have much lower permea-bilities than the basalts and are considered the base of the regional flow system. (Kahle, 2011)
The West Plains is on the margin of the CPRAS and generally shares the same conceptual hydrogeology described above, but also has some characteristics that are distinct to the area The West Plains is in effect cut off from the larger CPRAS by step-toes of Pre-CRBG basement rocks, as shown in Figure 1. As a result the general groundwater flow direction is east/northeast as opposed to the west/southwest direction of much of the CPRAS. The West Plains hydrogeologic system has been described in several publications including Hydrogeology of the West Plains Area of Spokane County, Washington (Deobald and Buchanan, 1995), and WRIA 54 Phase 2 Level 1 Data Compilation and Assessment (Tetra Tech, 2007).
The Wanapum and Grande Ronde are the only basalt for-mations present in the West Plains. The Wanapum is the upper most formation and is found approximately between 2,300 ft and 2,450 ft above mean sea level (msl). It is not present in areas where basement rock extends above or where ground sur-face is below this elevation.
The Wanapum-Grande Ronde interbed varies in thickness oc-currence, lithology, and lateral continuity. In some areas the interbed is comprised of material that acts as a groundwater
3
barrier, such as clay, and in other areas it is comprised of mate-rial that can readily store and transmit groundwater, such as sand and gravel. (Deobald, 1995)
The Grande Ronde formation occurs beneath the Wanapum-Grande Ronde interbed and is found approximately between 2,300 and 1,700 ft. msl. The Grande Ronde is present in all portions of the study area except where basement rock extends above 2,300 ft. msl.
The surface of both basalt formations is incised and undulatory, creating a relatively complex distribution of overlying sediment (GeoEngineers, 2009), herein referred to as paleodrainage de-posits. The paleodrainage deposits are incised into both the Wanapum and Grande Ronde formations in various areas of the West Plains. The paleodrainage deposits likely act as a conduit for water to move from the Wanapum to Grande Ronde for-mations, or for precipitation to move from the paleodrainage deposits directly to the Grande Ronde formation. (NLW, 2012).
Within each basalt formation are individual flows. Recent work has resulted in better resolution of two flows within the Grande Ronde formation found on the West Plains: 1) Sentinel Bluffs Mem-ber, and 2) Wapshilla Ridge Member (Pritchard, 2013). Prichard used whole rock geochemical analysis from basalt outcrops and well cuttings to identify the elevation of the top of each flow, and then evaluated driller descriptions from water well logs to assign elevations to additional locations. Identified and interpreted elevations of each Grande Ronde flow were used to develop contour maps for the top of each flow. The elevations of these individual flows of the Grande Ronde for-mation may explain the significant difference in water level elevation in wells completed in the Grande Ronde in the east and northeast portion of the West Plains in comparison to other areas of the West Plains.
Four hydrogeologic units are referred to in this report: 1) Wana-pum Basalt, 2) Grande Ronde Basalt, 3) Unconsolidated, and 4) Basement. In many areas of the West Plains wells completed in one unit are in close proximity to wells completed in another unit. The Unconsolidated hydrogeologic unit includes the paleodrainage deposits and areas where unconsolidated material overlies a basalt formation, but is not incised like the paleodrainage deposits. The Basement hydrogeologic unit is largely found in the higher elevations of the West Plains in are-as such as the step toes that form the western edge of the study area.
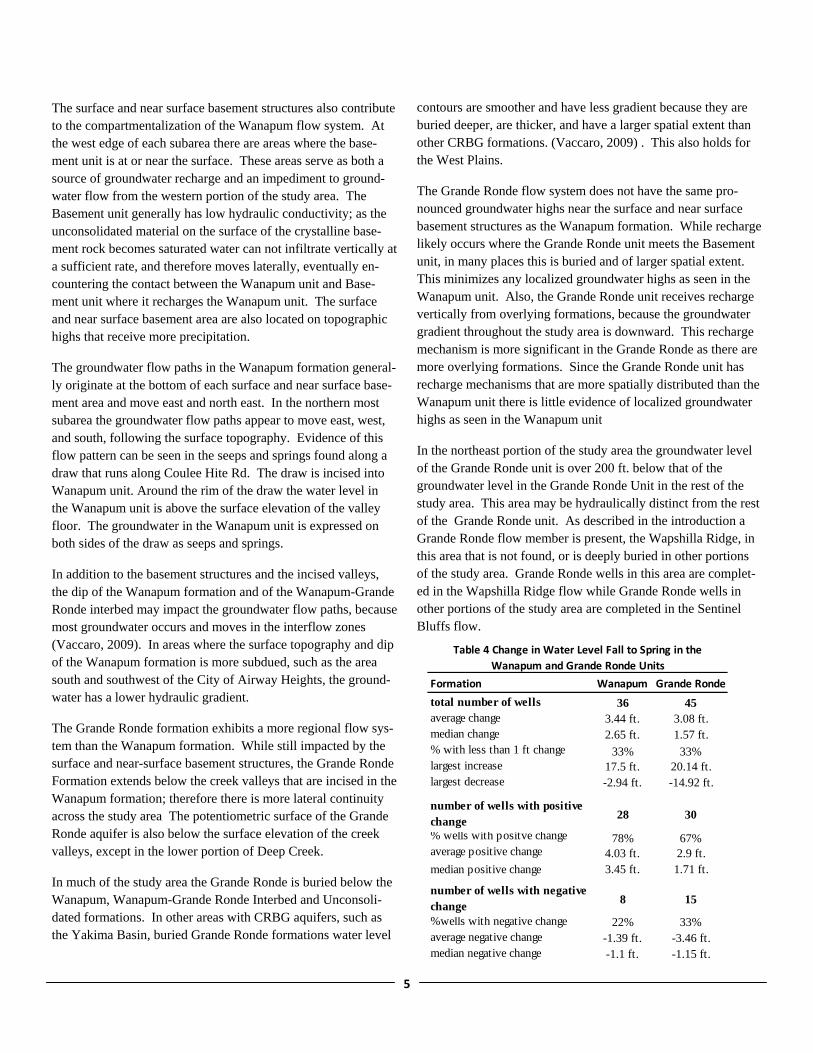
Many of the wells found within the study area are commingling wells. As described by the USGS: “Commingling is the term used to describe the condition that occurs when a well is con-structed so water can move from one aquifer to another through the well bore. This can occur in wells that are open to multiple aquifers through screens or uncased intervals. If the aquifers have different heads, then water will move through the well bore from the aquifer(s) with the higher head to the aquifer(s) with the lower head” (Burns, 2012). The water level in a com-mingling well does not represent the head of either discreet aq-uifer, but a composite of the two (Figure 2). Additionally, the water level in a well that is constructed such that it represents one aquifer can be impacted by commingling wells in the sur-rounding area. The hydrogeologic unit of comingling wells or those that are likely impacted by comingling wells is identified as undetermined in this report.
Collec on and Analysis of Groundwater Eleva on Data
Data Collec on
Three types of water level data were collected for this project: synoptic, monthly, and continuous.
Synoptic water-level measurements are a type of periodic meas-urement in which water levels in wells are measured within a relatively short period of time under specific hydrologic condi-tions. Synoptic measurements provide a “snapshot” of heads in an aquifer, and can be used for mapping the altitude of the water
Credit: U.S. Geological Survey—Scien fic Inves ga ons Report 2012‐5261
Figure 2—Impact of Commingling Wells on Water Level Measurements

4
table or potentiometric surface, determining hydraulic gradients, and defining the physical boundaries of an aquifer (Taylor, 2001).
Monthly measurements are similar to the synoptic measure-ments, except that they provide additional information on sea-sonal water level fluctuations and response to recharge and with-drawal. Both of these types of measurements are collected with a manually operated water level meter.
Continuous water level measurements are collected by an auto-matic water level sensing and recording instrument that is pro-grammed to make measurements at a specified frequency. Con-tinuous water level data can be used to assess aquifer response to such things as rainfall, snowmelt, changes in surface water lev-els, and withdrawals. A quality assurance project plan (QAPP) was developed for data collection activities by Spokane County staff and approved by Ecology (Spokane County, 2011). The QAPP details measurement equipment, procedures, data quality objectives, etc.
In total approximately 600 well owners in the West Plains were invited to participate in the project and approximately 110 were willing. Twenty five wells, of the 110, were not measured due to scheduling conflicts, difficulty finding the well, difficulty re-moving the cap, or a blockage in the well that did not allow the probe to reach water.
Two synoptic measurements events were conducted for this pro-ject. The first event was done between October 17, 2011 and October 21, 2011, and included 85 wells. The second event was done between April 16, 2012 and May 1, 2012, and included 75 wells. Wells were selected based on well construction, location, the hydrogeologic unit in which the well was completed, and willingness of the well owner to participate in the project.
Monthly measurements were collected at 12 locations, and con-tinuous data was collected at 10 locations. Several factors were considered in the selection of the monthly and continuous water level data collection locations including location, aquifer, well construction, type of well (i.e. domestic, municipal production, monitoring), and availability. Figure 3 shows the location and monitoring type of each well measured for this project. A listing of project wells including location, well construction, measure-ment type and interpreted hydrogeologic unit is provided in Ta-ble 1.
In addition to data collected for this project by Spokane County staff, data collected by other organizations is also included in
this report. Data collected by other organizations includes both concurrent data and historical data, dating as far back as 1955. In this report these wells are referred to as supplemental wells. Locations of the supplemental wells are presented in Figure 4, and a listing of the supplemental wells including location, ele-vation, interpreted hydrogeologic unit, and organization that collected the water level data is presented in Table 2 and the supplemental water level data is presented in Tables 6.1 through 6.14.
Synop c Water Level Measurements
Synoptic water level data is presented in Table 3 and is includ-ed in the electronic files that accompany this report. The Octo-ber 2011 synoptic water level data is presented in Figures 5A & 5B, and the April/May 2012 synoptic water level data is pre-sented in Figures 6A and 6B. The difference in water level elevation between the two measurements are shown in Figures 7 & 8.
Synoptic water level measurement data was used to develop contour maps of the potentiometric surface of aquifers in the Wanapum (Figure 9) and Grande Ronde units (Figure 10). The contours are principally based on the October 2012 synoptic water level measurement data. Inverse-distance-weighted spa-tial analysis of the fall water level data for each formation was done to generate a “first cut” of the contours. The first cut con-tours were then overlaid in GIS on the following data layers:
surface contours of each stratigraphic unit;
additional water level data points from the spring synoptic measurement;
water level data reported on well driller logs;
water level contours for the Grande Ronde Aquifer and Wanapum Aquifer from Deobald and Buchanan, 1995.
The first cut contours were then adjusted based on the data de-scribed above. The water level contours presented in Figures 9 and 10 are generalized; they do not represent the localized com-plexity that are the result of groundwater withdrawals, spatially varying aquifer hydraulic properties, variations in recharge, and topography.
The groundwater flow system of the Wanapum unit is compart-mentalized. It can be separated into four distinct subareas of the study area: 1) north of Coulee Creek, 2) between Coulee Creek and Deep Creek, 3) between Deep Creek and Marshall Creek, and 4) south of Marshall Creek. Each of these creeks is incised into the Wanapum formation which interrupts the lat-eral continuity of the formation.
5
The surface and near surface basement structures also contribute to the compartmentalization of the Wanapum flow system. At the west edge of each subarea there are areas where the base-ment unit is at or near the surface. These areas serve as both a source of groundwater recharge and an impediment to ground-water flow from the western portion of the study area. The Basement unit generally has low hydraulic conductivity; as the unconsolidated material on the surface of the crystalline base-ment rock becomes saturated water can not infiltrate vertically at a sufficient rate, and therefore moves laterally, eventually en-countering the contact between the Wanapum unit and Base-ment unit where it recharges the Wanapum unit. The surface and near surface basement area are also located on topographic highs that receive more precipitation.
The groundwater flow paths in the Wanapum formation general-ly originate at the bottom of each surface and near surface base-ment area and move east and north east. In the northern most subarea the groundwater flow paths appear to move east, west, and south, following the surface topography. Evidence of this flow pattern can be seen in the seeps and springs found along a draw that runs along Coulee Hite Rd. The draw is incised into Wanapum unit. Around the rim of the draw the water level in the Wanapum unit is above the surface elevation of the valley floor. The groundwater in the Wanapum unit is expressed on both sides of the draw as seeps and springs.
In addition to the basement structures and the incised valleys, the dip of the Wanapum formation and of the Wanapum-Grande Ronde interbed may impact the groundwater flow paths, because most groundwater occurs and moves in the interflow zones (Vaccaro, 2009). In areas where the surface topography and dip of the Wanapum formation is more subdued, such as the area south and southwest of the City of Airway Heights, the ground-water has a lower hydraulic gradient.
The Grande Ronde formation exhibits a more regional flow sys-tem than the Wanapum formation. While still impacted by the surface and near-surface basement structures, the Grande Ronde Formation extends below the creek valleys that are incised in the Wanapum formation; therefore there is more lateral continuity across the study area The potentiometric surface of the Grande Ronde aquifer is also below the surface elevation of the creek valleys, except in the lower portion of Deep Creek.
In much of the study area the Grande Ronde is buried below the Wanapum, Wanapum-Grande Ronde Interbed and Unconsoli-dated formations. In other areas with CRBG aquifers, such as the Yakima Basin, buried Grande Ronde formations water level
contours are smoother and have less gradient because they are buried deeper, are thicker, and have a larger spatial extent than other CRBG formations. (Vaccaro, 2009) . This also holds for the West Plains.
The Grande Ronde flow system does not have the same pro-nounced groundwater highs near the surface and near surface basement structures as the Wanapum formation. While recharge likely occurs where the Grande Ronde unit meets the Basement unit, in many places this is buried and of larger spatial extent. This minimizes any localized groundwater highs as seen in the Wanapum unit. Also, the Grande Ronde unit receives recharge vertically from overlying formations, because the groundwater gradient throughout the study area is downward. This recharge mechanism is more significant in the Grande Ronde as there are more overlying formations. Since the Grande Ronde unit has recharge mechanisms that are more spatially distributed than the Wanapum unit there is little evidence of localized groundwater highs as seen in the Wanapum unit
In the northeast portion of the study area the groundwater level of the Grande Ronde unit is over 200 ft. below that of the groundwater level in the Grande Ronde Unit in the rest of the study area. This area may be hydraulically distinct from the rest of the Grande Ronde unit. As described in the introduction a Grande Ronde flow member is present, the Wapshilla Ridge, in this area that is not found, or is deeply buried in other portions of the study area. Grande Ronde wells in this area are complet-ed in the Wapshilla Ridge flow while Grande Ronde wells in other portions of the study area are completed in the Sentinel Bluffs flow.
Formation Wanapum Grande Ronde
total number of wells 36 45average change 3.44 ft. 3.08 ft.median change 2.65 ft. 1.57 ft.% with less than 1 ft change 33% 33%largest increase 17.5 ft. 20.14 ft.largest decrease -2.94 ft. -14.92 ft.
number of wells with positive change
28 30
% wells with positve change 78% 67%average positive change 4.03 ft. 2.9 ft.median positive change 3.45 ft. 1.71 ft.
number of wells with negative change
8 15
%wells with negative change 22% 33%average negative change -1.39 ft. -3.46 ft.median negative change -1.1 ft. -1.15 ft.
Table 4 Change in Water Level Fall to Spring in the
Wanapum and Grande Ronde Units

6
The synoptic water level measurements were conducted in the fall and spring which allows a comparison of the change in wa-ter level between Wanapum and Grande Ronde wells. Table 4 presents a comparison of the two units. The average absolute change (both positive and negative) was greater in the Wanapum unit. In the Wanapum unit the change in water level was more pronounced in wells that had a positive increase, which is in contrast to the Grande Ronde unit in which the change was more pronounced in wells that had a negative change in water level. There was a similar proportion of wells in each unit that had a change in water level less than one foot, either positive or nega-tive.
A change in water level from fall to spring could be the result of groundwater recharge or recovery from summer withdrawals in the measured well or wells in the vicinity; likely in many cases it is some combination of the two. In general, between fall and spring the Wanapum unit has a greater magnitude of water level change than the Grande Ronde unit. Change in the Wanapum unit is more likely positive, and in the Grande Ronde unit it is more likely negative. Since the Wanapum unit is either at the surface or below a thin layer of unconsolidated material in many parts of the study area the impact of spring recharge is more pronounced in it in comparison to the Grande Ronde unit. It may be that the cycle of water level changes in the Grande Ronde Unit from groundwater withdrawals and recharge is de-layed such that water level decreases were still occurring at the time of the spring measurement and an increase would occur in late spring/early summer. This pattern can be seen in Well 441147, which is a Grande Ronde well.
Monthly Water Level Measurements
Monthly data is presented in Tables 5.1 through 5.12 and is in-cluded in the electronic files that accompany this report. Below is a brief description, strip log, hydrograph of monthly measure-ments, and discussion of the water level data for each well. A map with the location of each well along with each hydrograph is presented in Figure 11.
Well 544269 Well 544269 is located in the northeast portion of the West Plains on a bluff overlooking Deep Creek. It is a domestic well, though no home has been built to date, and the well has not been used. The well yield reported on the well log is 30 gallons per minute (gpm). The well is 600 feet deep and penetrates the Wanapum, Wanapum/Grande Ronde interbed, Grande Ronde-Sentinel Bluff, Sentinel Bluff-Wapshilla Ridge interbed, and Grande Ronde-Wapshilla Ridge formations. The well is cased
basalt, fractured basalt, hard
clay
sand & gravel
basalt, hard
clay
basalt, hard
basalt, w/clay or
clay, sand
Wanapum
Wanapum/Grande Ronde Interbed
Grande Ronde Flows Interbed
Grande Ronde Sentinel Bluffs
Grande Ronde Wapshilla Ridge
water bearing zone
Static water level 7/14/2008
casing
liner
perforations
Static water level Nov 2012 to May 2013
Figure 12: Well 544269 Strip Log & Hydrograph
1855
1860
1865
1870
1875
1880
1885
Oct‐11
Nov‐11
Dec‐11
Jan‐12
Feb‐12
Mar‐12
Apr‐12
May‐12
Jun‐12
Jul‐12
Aug‐12
Sep‐12
Oct‐12
Nov‐12
Dec‐12
Jan‐13
Feb‐13
Mar‐13
Apr‐13
Well‐544269 Monthly Static Water Level Elevation
groundwater
elevation in
feet above M
SL
Well 544269

7
project the water elevation changed very little in this well. This indicates that the Grande Ronde aquifer in this vicinity is not influenced by short term hydrologic stresses or events such as groundwater withdrawals or recharge.
Figure 13: Well 174648 Strip Log & Hydrograph
Wanapum basalt, hard
basalt, fractured
water bearing zone
Static water level 4/16/96
static water level Oct 2011-May 2013
basalt w/ clay
Grande Ronde Sentinel Bluffs
liner
perforations
2005
2010
2015
2020
2025
2030
2035
Oct‐11
Nov‐11
Dec‐11
Jan‐12
Feb‐12
Mar‐12
Apr‐12
May‐12
Jun‐12
Jul‐12
Aug‐12
Sep‐12
Oct‐12
Nov‐12
Dec‐12
Jan‐13
Feb‐13
Mar‐13
Apr‐13
May‐13
Well ‐174648Monthly Static Water Level Elevation
groundwater
elevation in
feet above M
SL
Well ‐174648Monthly Static Water Level Elevation
groundwater
elevation in
feet above M
SL
Well 174648 to 18 ft below ground surface (bgs), and a PVC liner extends to the bottom of the well. Perforations in the liner are present from 560 ft to 600 ft. Figure 12 presents the lithology, stratigraphy water bearing zones, and well construction. While not noted on the well log, during field measurements it appeared that water was cascading from a water bearing zone above the static water level.
The static water elevation reported on the drillers log is 1778 ft. During the study the static water elevation ranged from 1866 to 1873 ft. msl. (Figure 12) The static water level elevations of Grande Ronde wells south of this well are clustered around an elevation of 2000 ft, and Grande Ronde wells north of this well are clustered around an elevation of 1750 ft. Wells to the south are completed in the Sentinel Bluffs flow and the wells to the north are completed in the Wapshilla Ridge flow. The perfora-tions in this well are located in the Waspshilla Ridge flow, but water also may be cascading from the Sentinel Bluffs flow which would create a composite head of the hydraulically dis-tinct Grande Ronde aquifers in the Wapshilla Ridge and Sentinel Bluffs flows.
This well is approximately 1,200 ft east of Deep Creek. At this location Deep Creek is at an approximate elevation of 1900 ft, 30-35 feet above the static water level of this well. This portion of Deep Creek loses water to the ground water system (Spokane County Water Resources, 2013).
During the study period the water level in this well declined over the summer months reaching a low during October 2012. The well recovered during winter and spring of 2012 and 2013, though it did not return to the level measured during April of 2012.
Well 174648 Well 174648 is located on the eastern edge of the study area, in the Palisades Park neighborhood. It is a domestic well that is currently in use; the pump, though, was not running during any of the measurements and the water level was stable during all measurements. A yield of 10 gpm is reported on the well drill-ers log.
The well is completed in the Grande Ronde unit in the Sentinel Bluffs flow, as shown in Figure 13. The water level in this well is consistent with measurements taken in other wells completed in the Grande Ronde unit in the vicinity. Water level elevations for this well are presented in Figure 13. Over the course of the

8
Well Tareski A well log is not available for this well. The well is a domestic well located on the northeast side of Granite Lake. The well was not in use during any of the measurements, and the water level was stable. The well is located on the edge of an area mapped as surface and near surface basement rock. The water level in the well is relatively shallow, between 10 and 17 bgs. The static water level in the well is above the surface of Granite Lake indicating that ground water flows into the lake. Water levels, shown in Figure 15, show a seasonal pattern but also in-dicate a response to short term hydrologic events, as shown by the increase in water level in August 2012 above the July and September 2012 values.
Well 168759 Well 168759 is a domestic well located just west of Fairchild Air Force Base. The well was not in use during any of the meas-urements with the exception of August 2012, when the well was in use for lawn irrigation. The first 110 feet of the well is in the unconsolidated unit and the last 25 feet are in the Wanapum for-mation (Figure 16). The well is completed in the Wanapum and the water level elevation is consistent with other wells in the vicinity that are completed in the Wanapum. Over the course of the study the water level elevation changed very little, as shown in Figure 16.
The water level recorded on the drillers log on 4/4/1975 was 86.5 ft bgs, which is very similar to the water level elevations
Figure 14
2385
2390
2395
2400
2405
2410
2415
Oct‐11
Nov‐11
Dec‐11
Jan‐12
Feb‐12
Mar‐12
Apr‐12
May‐12
Jun‐12
Jul‐12
Aug‐12
Sep‐12
Oct‐12
Nov‐12
Dec‐12
Jan‐13
Feb‐13
Mar‐13
Apr‐13
May‐13
Well TareskiMonthly Static Water Level Elevation
groundwater
elevation in
feet above M
SL
Well TareskiMonthly Static Water Level Elevation
groundwater
elevation in
feet above M
SL
Figure 15 Well Green A well log is not available for this well, which is why it is not named by an Ecology Well Log ID like other wells in the study. The well is a domestic well located in the southern portion of the study area, one mile north of Marshall Creek. Based on well logs in the vicinity the well is located near a paleodrainage de-posit that is incised into the Wanapum and Grande Ronde for-mations. Surface and near surface basement is located approxi-mately 2 miles southwest of the well.
Water elevation measurements for this well are presented in Figure 14. Water level elevations ranged from 2255 to 2279, a range of 24 feet. Changes in water level followed a seasonal pattern, with increases occurring in February, March, and April and decreases throughout the summer and fall. This well ap-pears to be influenced by annual recharge and water use pat-terns, i.e. snowmelt and summertime water use. Monthly data does not show a response to short term rainfall events.
The water level elevation of the Wanapum formation in the vi-cinity of this well is estimated to be between 2360 ft and 2320 ft and the water level elevation for the Grande Ronde Formation is estimated to be between 2120 ft and 2280 ft. The elevation range of the water level in this well is between the Wanapum and Grande Ronde formations. This is consistent with a well completed in multiple formations. A well located 900 feet south of this well (Ecology Well ID 315938) has a similar static water
level elevation (2274) recorded on its well log. The log for this well shows that the well penetrates two water bearing zones, and that the well is completed such that both water bearing zones contribute to the well.
2250
2255
2260
2265
2270
2275
2280
Oct‐11
Nov‐11
Dec‐11
Jan‐12
Feb‐12
Mar‐12
Apr‐12
May‐12
Jun‐12
Jul‐12
Aug‐12
Sep‐12
Oct‐12
Nov‐12
Dec‐12
Jan‐13
Feb‐13
Mar‐13
Apr‐13
May‐13
Well GreenMonthly Static Water Level Elevation
groundwater
elevation in
feet above M
SL
Well GreenMonthly Static Water Level Elevation
groundwater
elevation in
feet above M
SL

9
measured during the study. This well does not appear to re-spond to short term hydrologic stresses or follow annual water level trends.
Well 171100
Well 171100 is a domestic well located on Indian Prairie be-tween Deep Creek and Coulee Creek. The well was not in use during any of the measurements. Only five measurements were possible due to problems with the water level meter becoming stuck in the well during retrieval. The well penetrates the Wanapum, Wanapum/Grande Ronde Interbed, and Grande Ronde units. The well is completed such that it is open to all units but the water level is consistent with other wells completed in the Grande Ronde unit in the vicinity. During the measure-ment period the water level did not change significantly which is similar to other wells completed in the Grande Ronde formation
basalt, porous or vesicular
Well 168759
basalt basalt, fractured
sand
clay sand & gravel sand & clay
sand, gravel, & clay
unconsolidated
Wanapum Water bearing
Static water level 4/4/1975
Static water Oct 2012-Apri 2013
casing
2355
2360
2365
2370
2375
2380
2385
Oct‐11
Nov‐11
Dec‐11
Jan‐12
Feb‐12
Mar‐12
Apr‐12
May‐12
Jun‐12
Jul‐12
Aug‐12
Sep‐12
Oct‐12
Nov‐12
Dec‐12
Jan‐13
Feb‐13
Mar‐13
Apr‐13
May‐13
Well ‐168759 Monthly Static Water Level Elevation
groundwater
elevation in
feet above M
SL
sand
Wanapum
basalt, hard
basalt, fractured
water bearing
Static water level 8/7/78
static water level Nov 2011-March 2012
casing
clay Wanapum/Grand Ronde interbed
basalt, soft or decomposed
Grand Ronde interbed
Grande Ronde Sentinel Bluffs
Grande Ronde Wapshilla Ridge
2160
2165
2170
2175
2180
2185
2190
Oct‐11
Nov‐11
Dec‐11
Jan‐12
Feb‐12
Mar‐12
Apr‐12
May‐12
Jun‐12
Jul‐12
Aug‐12
Sep‐12
Oct‐12
Nov‐12
Dec‐12
Jan‐13
Feb‐13
Mar‐13
Apr‐13
May‐13
groundwaterelevation in
feet above M
SL
Well ‐171100 Monthly Static Water Level Elevation
Well 171100
Figure 16: Well 168759 Strip Log & Hydrograph
Figure 17: Well 171100 Strip Log & Hydrograph

10
that were measured during the study. The static water level rec-orded on the drillers log on 8/7/1978 was 2175, very similar to the levels measured during this study.
Well 472828 Well 472828 is a domestic well located outside of the study area to the north. The northern boundary of the study area was es-tablished because a basement ridge appears to exist extending east west across Four Mound Prairie. This well was monitored to evaluate differences between wells on either side of the base-ment ridge. Unfortunately no wells were located that could be measured on a monthly basis on the south side of the basement ridge.
Well 472828 demonstrates a typical seasonal pattern, and shows more variation than Grande Ronde wells located in other por-tions of the study area.
Well 167996 Well 167996 is a public supply well that provides water for the Indian Village Estates Water Association (IVEWA). This well is IVEWA’s primary well during most of the year. In the sum-mer a well that withdraws water from a deeper aquifer supple-ments this well. In some years during the late summer the water level drops below the pump intake and the well cannot be used. The well penetrates the Wanapum unit and the top of the Wana-pum/Grande Ronde Interbed (Figure 19). The well shows a typical seasonal pattern and is responsive to both recharge pat-
basalt
basalt w/ clay or shale
static water level 2/12/07
basalt, decomposed
casing
Well 472828
gravel
basalt, fractured
Unconsolidated
Grande Ronde Sentinel Bluffs
liner
perfora-clay
water bearing zone
static water level Oct 2011-Oct
1865
1870
1875
1880
1885
1890
1895
Oct‐11
Nov‐11
Dec‐11
Jan‐12
Feb‐12
Mar‐12
Apr‐12
May‐12
Jun‐12
Jul‐12
Aug‐12
Sep‐12
Oct‐12
Nov‐12
Dec‐12
Jan‐13
Feb‐13
Mar‐13
Apr‐13
May‐13
Well ‐472828 Monthly Static Water Level Elevation
groundwater
elevation in
feet above M
SL
Figure 18 Well 472828 Strip Log and Hydrograph
Wanapum
basalt
basalt, fractured
static water level 4/11/79
static water level Oct 2011-May 2013
clay
casing
Wanapum/Grand Ronde interbed
Well 167996
water bearing zone
2285
2290
2295
2300
2305
2310
2315
2320
Oct‐11
Nov‐11
Dec‐11
Jan‐12
Feb‐12
Mar‐12
Apr‐12
May‐12
Jun‐12
Jul‐12
Aug‐12
Sep‐12
Oct‐12
Nov‐12
Dec‐12
Jan‐13
Feb‐13
Mar‐13
Apr‐13
May‐13
groundwater
elevation in
feet above M
SL
Well ‐167996 Monthly Static Water Level Elevation
Figure 19 Well 167996 Strip Log & Hydrograph

11
terns and summertime withdrawals. Figure 19 presents the wa-ter level elevation of the static water level during the course of the study. Sharp declines in water levels occurred during the summer months.
Well 167998 Well 167998 is located approximately 0.5 miles southeast of well 167996. This well is not in use. It is completed in the same unit as well 167996 as shown in Figure 20, though it does extend beyond the Wanapum/Grande Ronde Interbed into the Grande Ronde formation. It does not extend into a water bear-ing zone within the Grande Ronde unit. Figure 22 presents the
Wanapum
basalt
Basalt w/ clay or shale
static water level 11/7/90
static water level Oct 2011-May 2013
clay
casing
Wanapum/Grand Ronde interbed
Well 167998
clay
basalt, fractured
Unconsolidated
Grande Ronde Sentinel Bluffs
2285
2290
2295
2300
2305
2310
2315
Oct‐11
Nov‐11
Dec‐11
Jan‐12
Feb‐12
Mar‐12
Apr‐12
May‐12
Jun‐12
Jul‐12
Aug‐12
Sep‐12
Oct‐12
Nov‐12
Dec‐12
Jan‐13
Feb‐13
Mar‐13
Apr‐13
May‐13
groundwater
elevation in
feet above M
SL
Well ‐167998 Monthly Static Water Level Elevation
Figure 20 Well 167998 Strip Log & Hydrograph
water level elevation measurements. This well is similar to Well 167996, but the changes are more subdued. The range of water level elevations in 167996 was 26.9 ft while in this well it was 6.7 ft. The well responds to both recharge patterns and summer-time withdrawals.
Well 160959 Well 160959 is located in the northwest portion of the study area. It is a domestic well, though no home has been built to date, and the well has not been used. The well only penetrates the Wanapum unit, as shown in Figure 21. The well demon-strates a typical seasonal pattern, with elevated levels during the
Figure 23: Well 160959 Strip Log
casing
basalt, fractured
Wanapum
basalt, hard
basalt, fractured water bearing zone
Static water level 3/18/94
static water level Oct 2011-May 2013
liner
perforations
Well 160959
2440
2445
2450
2455
2460
2465
2470
Oct‐11
Nov‐11
Dec‐11
Jan‐12
Feb‐12
Mar‐12
Apr‐12
May‐12
Jun‐12
Jul‐12
Aug‐12
Sep‐12
Oct‐12
Nov‐12
Dec‐12
Jan‐13
Feb‐13
Mar‐13
Apr‐13
May‐13
Well ‐160959 Monthly Static Water Level Elevation
groundwater
elevation in
feet above M
SL
Figure 21 Well 160959 Strip Log & Hydrograph

12
early spring and lower levels in the late summer and fall. There are not many residences or other groundwater withdrawals in the vicinity of the well, so lower summer and fall water levels are not likely a result of groundwater withdrawals. The water level changes in this well are similar in magnitude and timing as seen
in Well 167998.
Well 441147 Well 44147 is a domestic well located in the northeastern por-tion of the study area. The well provides water for a vacation home that is not in regular use. During most measurements the home was not occupied, with the exception of July 2012 when the well was in use to irrigate a small lawn. A measurement was not taken on that date.
The well is located 450 feet north of the portion of Coulee Creek that is intermittent most of the year.. The well is completed in an interval described as clay and granite sands on the well log. The description “granite sands” indicates that the well likely draws from a water bearing zone located between the Grande Ronde unit and basement unit.
Water levels measured in this well during the course of the study varied contrary to a regular seasonal pattern; the water levels declined through the spring and increased during the summer months. This is similar to the Lincoln-Garfield Rd well de-scribed in the continuous water level measurement portion of this report. The Lincoln-Garfield Rd Well is 0.5 miles south east of this well. It is possible that each of these wells are re-charged, in part, from surface flows in Deep Creek and Coulee Creek that infiltrate into the ground above each well. Flow in each creek peak in the spring time, and it is possible that the influence of the creek is delayed in these well and is expressed during the summer months.
Well 172184 Well 172184 is located in the northeastern portion of the study area approximately 0.8 miles west of the Spokane River. The well provides water for the Riverside State Park Off Road Vehi-cle Area. During most visits no one was using the park facilities and the pump was not running. The water level was stable dur-ing all measurements.
The well is located in an unconsolidated sand and gravel aquifer, and shows similar water level elevation changes as wells located to the west such as the Lincoln-Garfield Rd. Well and Well 441147. The lowest water elevations occur in the spring and then increase to a yearly maximum in July. The pattern, though in this well is not as pronounced as in the other two wells men-tioned above.
1740
1745
1750
1755
1760
1765
1770
Oct‐11
Nov‐11
Dec‐11
Jan‐12
Feb‐12
Mar‐12
Apr‐12
May‐12
Jun‐12
Jul‐12
Aug‐12
Sep‐12
Oct‐12
Nov‐12
Dec‐12
Jan‐13
Feb‐13
Mar‐13
Apr‐13
May‐13
groundwater
elevation in
feet above M
SL
Well ‐441147 Monthly Static Water Level Elevation
Well 441147
sand
Unconsolidated
basalt, hard
basalt, fractured
water bearing zone
Static water level 5/23/06
static water level Nov 2011-May 2013 casing
basalt, medium
basalt, w/clay or shale
clay
clay-granite sands
Grande Ronde– Wapshilla Ridge
Grand Ronde/basement interbed
basement
Figure 22 Well 441147 Strip Log & Hydrograph

13
1615
1620
1625
1630
1635
1640
1645
Oct‐11
Nov‐11
Dec‐11
Jan‐12
Feb‐12
Mar‐12
Apr‐12
May‐12
Jun‐12
Jul‐12
Aug‐12
Sep‐12
Oct‐12
Nov‐12
Dec‐12
Jan‐13
Feb‐13
Mar‐13
Apr‐13
May‐13
Well ‐172184 Monthly Static Water Level Elevation
groundwater
elevation in
feet above M
SL
Figure 23: Well 172184 Strip Log & Hydrograph
casing
screen
Unconsolidated
sand & gravel
water bearing zone
Static water level 1/18/78
static water level Nov 2011-May 2013
sand
sand & clay
Well 172184 This well is located near the Spokane River. The water eleva-tion in the well ranges between 1627 ft and 1633 ft. The eleva-tion of the Spokane River is approximately 1600 ft; therefore groundwater is flowing from this location into the Spokane Riv-er.
Con nuous Water Level Measurements
Continuous water level measurements were taken in 10 wells between fall 2011 and spring 2013. Figure 3 includes the loca-tion of each well. Continuous measurements, which include water level and temperature, were taken on an hourly basis with automatic data recording devices. Data is presented in Figures 33 through 46, and is included in the electronic files that accom-pany this report. The water level graphs are presented with the same scale on the x and y axis, so that comparisons of the scale of water level changes between the wells can be made. Below is a brief description of each well and discussion of the water level data collected during the study.
Well 407776
sand
sand & gravel
sand & silt
basalt, hard
sand & gravel interbed
basalt, fractured
unconsolidated
Grande Ronde Wapshilla Ridge
Water bearing zones
perforations
casing
Figure 24: Well 407776 Strip Log

14
Lincoln-Garfield Rd. Well A well log is not available for this well, though a well measured for the synoptic measurement that does have a well log (Well 407776) is located approximately 800 ft. southeast of the well. Even though this well does not have a well log it was chosen because it was not in use for all but the last two months of the study period. A strip log of well 407776 is shown in Figure 25. The well is located in the vicinity of Well 441147 and Well 172184, an area with a thick sequence of unconsolidated materi-al underlain by the Wapshilla Ridge flow of the Grande Ronde formation. During the study period the water level elevation varied between 1,737 and 1,750 ft (Figure 33). The highest water level was recorded in September 2011 at the beginning of the study period and the lowest level was recorded in February 2013. The water level appears to follow an annual pattern with low levels occurring in late winter/early spring and increasing to an annual high during late spring/early summer. The water level changes are nearly sinusoidal in nature and do not exhibit any irregular patterns that indicate a response to short term cli-matic events, such as precipitation. In 2013 the low water level is 6 feet lower than it was in 2012. To date it has not recovered to the same level as 2012. This well was not in use until May of 2013, when it was put in use for domestic purposes. The groundwater temperature was relatively constant throughout the study period; temperature changes began to occur when the well was put in use and are likely due to pump operation rather than changes in groundwater temperature.
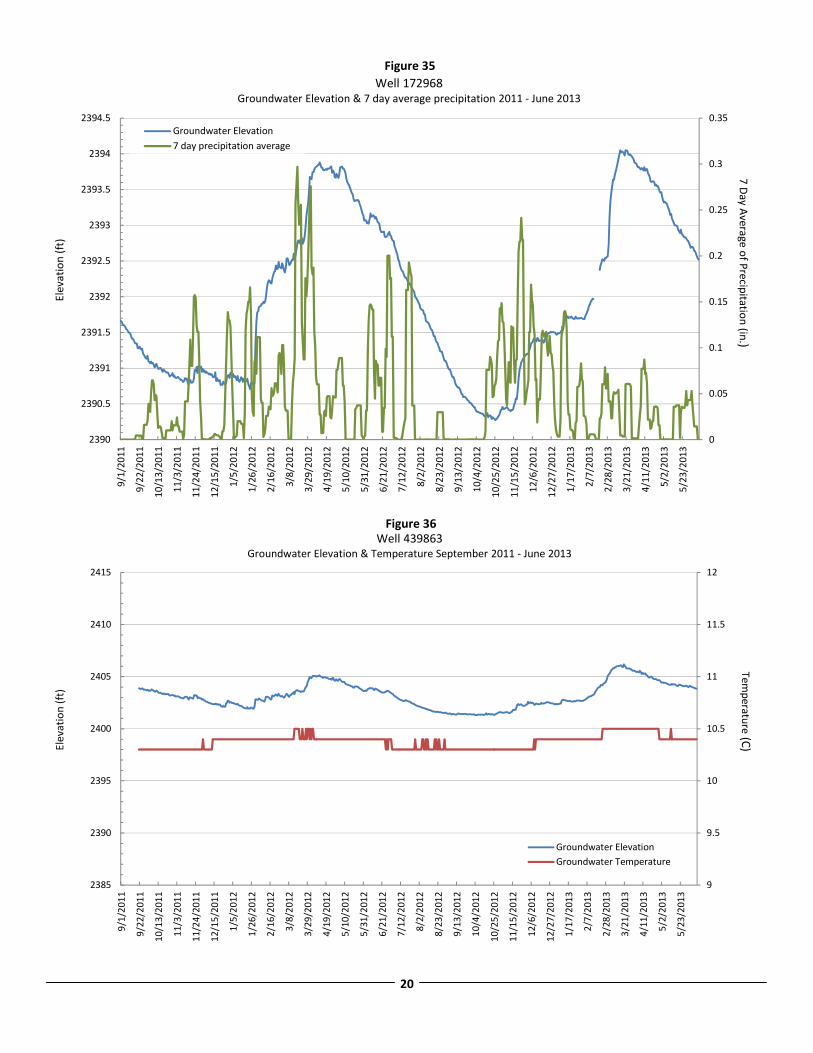
Well 172968 Well 172968 is located in the northern portion of the study area
and is completed in the Wanapum formation. The well provides domestic water for a volunteer fire station. Use of the well is limited. There are no resident personnel and administrative staff are present on a limited basis. There is no outdoor irrigation. Water level elevation varied between 2,390 and 2,394 ft. during the study period (Figure 34) and follows a seasonal pattern. In contrast to the Lincoln-Garfield Rd. well, this well appears to respond to short term climactic events. Figure 35 shows water level changes over the study period with the 7 day rolling aver-age of precipitation. (note: the scale of the water level changes is different on Figure 35 so that changes are more apparent). The 7 day rolling average of precipitation was used instead of daily precipitation so that several days of moderate precipitation would be as evident as one day of significant precipitation.
The water level in this well is impacted by both the amount of precipitation and the time of year. During the winter of 2011/2012 there are precipitation events with little response in water level because the ground is frozen and the precipitation is often snow rather than rain. During the spring of 2012 water level increases are preceded by rainfall events. The water level response to the precipitation events is on the order of days and weeks. During the late spring/and early summer there are rain-fall events of similar magnitude to events that produced water level increases in the early spring that do not produce increases in water level. This is due to the evapotranspiration that occurs during the late spring and summer. In the late spring and sum-mer the precipitation is evaporated or used by plants (transpired) before it infiltrates beyond the root zone, while during the early spring the precipitation does move beyond the root zone before it is evaporated or transpired.
The annual high water level occurred at approximately the same time, within a few weeks, in both 2012 and 2013. The high wa-ter level was approximately the same both years.
Well 172968
sand, gravel, and clay
basalt, hard
clay
basalt, fractured
Wanapum
Grande Ronde Sentinel Bluffs
water bearing zone
unconsolidated casing
perforations
liner
water level Sept 2011 to June 2013
Well 439863
clay
basalt, fractured
basalt, medium Wanapum
casing
water bearing zone
perforations
water level Sept 2011 to June 2013
Figure 25: Well 172968 Strip Log Figure 26: Well 439863 Strip Log

15
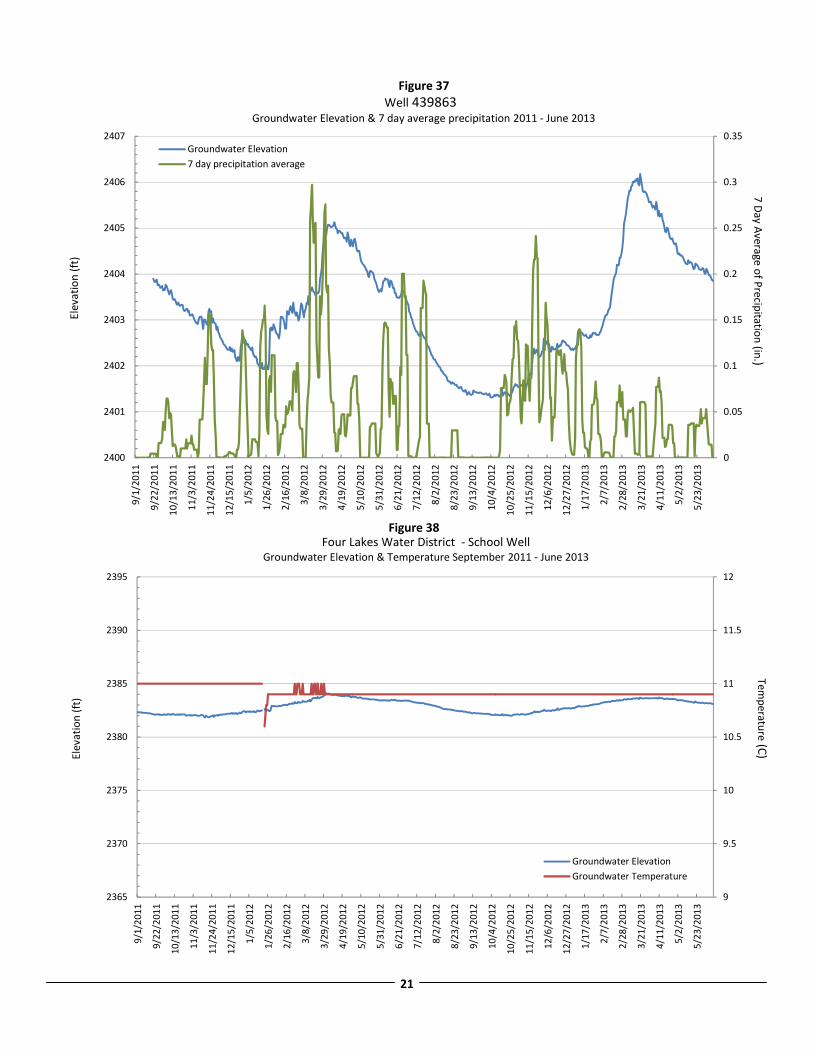
Well 439863 Well 439863 is located approximately 4.7 miles southwest of Well 172968. It is completed in the Wanapum formation. The well was drilled for domestic use, but has not been used to date. Water level elevation varied between 2,401 and 2,406 ft. during the study period (Figure 36). The water level trends in this well are very similar to those in Well 172968 described above.
Figure 37 shows the water level changes and 7 day rolling aver-age of precipitation. The response to precipitation is similar to Well 172968, though it does show more daily variability, which may indicate a more immediate response to precipitation. Also the high water level in 2013 is 1 ft. higher than in 2012. This is in contrast to the Lincoln-Garfield Rd. Well where it is the op-posite, 2013 is lower than 2012.
Four Lakes Water District—School Well A well log is not available for this well, but based on well logs of wells in the vicinity the well is completed in the basement unit. The well is a backup well for the Four Lakes Water Dis-trict and is rarely used. Water level elevation varied between 2,382 and 2,384 during the study period (Figure 38). The water level appears to follow an annual trend with the highest water level occurring in late March/early April and the low water level occurring during October or November. The change in water level was similar for 2012 and 2013.
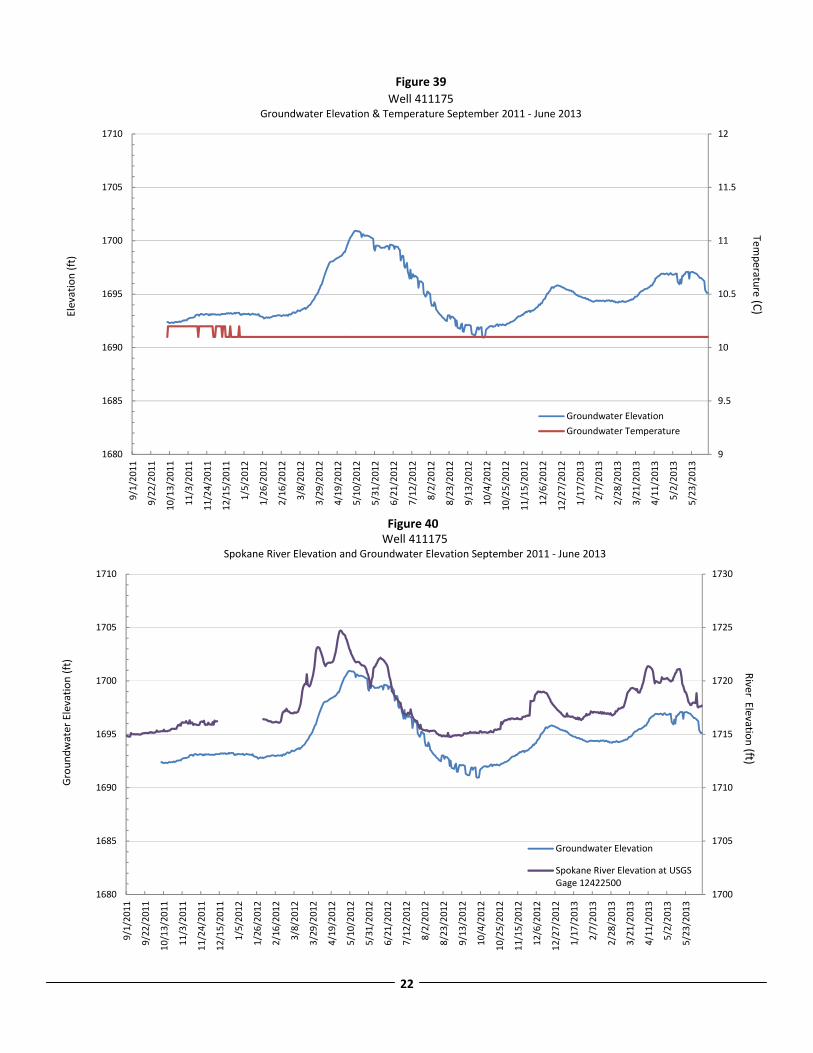
Well 411175 Well 411175 is located on the eastern edge of the study area
approximately 1,800 feet west of the Spokane River. It is locat-ed just outside the boundary of the Spokane Valley Rathdrum Prairie Aquifer as mapped by the USGS (Kahle, 2007). The elevation of the Spokane River in the vicinity of the well is ap-proximately between 1,700 and 1,725 depending on river flow. Water level elevation in the well varied between 1,691 and 1,700 ft. during the study period (Figure 39). Figure 40 shows the wa-ter level elevation in the well and the elevation of the Spokane River measured at the USGS River Gage 12422500 Spokane River at Spokane, WA. Between the gage and the location of the river due east of the well there is an approximate elevation drop of 20 ft.
The water level changes in the well correspond with changes in the stage of the Spokane River. Increases in water level eleva-tion in the well are preceded by approximately 1 to 2 weeks by increases in river stage. This suggests that the aquifer found between the Grande Ronde unit and Basement unit at the edge of the study area and the Spokane River/Spokane Valley Rathdrum Prairie Aquifer system are connected.
Well 164270 Well 164270 was drilled by the Town of Reardan to serve as a municipal supply well, but the production was not adequate to meet their needs. Another well was drilled approximately 150 ft. east of Well 164270, which did meet their needs and is now used as a municipal supply well. Well 164270 is completed in the Grande Ronde unit. The water level elevation varied between
Well 411175
sand & gravel
basalt, fractured
basalt, hard
clay
sand & gravel
Grande Ronde Wapshilla Ridge
unconsolidated
Grande Ronde basement interbed
water bearing zone
water level Sept 2011 to June 2013
casing
screen
Well 164270
clay
basalt, medium
basalt, fractured
basalt, porous
water bearing zones
casing
liner
perforations
water level Sept 2011 to June 2013
Figure 27: Well 411175 Strip Log Figure 28: Well 164270 Strip Log

16
2,351 and 2,381 during the study period (Figure 41)
During the months of August, September, and October of 2012 the water level dropped below the level of the datalogger, and the water level was not measured. This occurred because dur-ing the Fall of 2011 it became apparent that the winter water level increase would go above the rated water level range of the data logger, so it was redeployed at a higher elevation. The redeployed data logger captured the water level highs but did miss the water level low in the summer and fall of 2012.
The water level changes in well 164270 show the influence of the nearby municipal supply well, and annual recharge patterns. Water levels decrease between late April/early May and Sep-tember, which corresponds with increased municipal water use. October through late April the water levels increase as they recover from the increased summer pumping and receive more recharge from precipitation and snow melt. This well is located in the western portion of the study area near the surface and near surface basement, where recharge is likely occurring.
Well 295341 Well 295341 is located in the southern portion of the study area. It is located approximately 600 ft. west of the outlet of Queen Lucas Lake into Minnie Creek. The well is a monitoring well that was drilled for the Marshall Landfill Groundwater Investi-gation. The well is located approximately 500 ft. south of an area mapped as surface and near surface basement. Water level elevation varied between 2,122 and 2,144 ft. during the study period (Figure 42) The water level followed an annual pattern with water level highs in May and lows in February. The water level high in the spring of 2013 was about 3.5 ft. lower than the water level high in 2012.
The elevation of Queen Lucas Lake is approximately 2,130, though it does vary some during the year. The water level ele-vation in Well 295341 is both above an below the elevation of
Queen Lucas Lake depending on time of year. Also, Minnie Creek, the outlet of Queen Lucas Lake, runs seasonally. Aerial photos taken during spring show that Minnie Creek has water, but those taken during the summer show no water in Minnie Creek. The relative elevations of Well 295341, Queen Lucas Lake, and Minnie Creek and the seasonal nature of the ground-water elevation and flow in Minnie Creek suggest a connection between the ground and surface water.
Well 472535 Well 472535 is located in what is often called the “Airport or Polo Grounds Paleodrainage.” A paleodrainage, which is also called a paleochannel, is a channel that was incised into the bas-alt formations and then filled with unconsolidated materials, often sands and gravels. This well is a monitoring well. The water level elevation in this well varied between 2,115, and 2,126 ft. during the study period (Figure 43).
This well showed a similar pattern to the two other wells com-pleted in the unconsolidated unit (Lincoln-Garfield Well, Well 295341); water level highs during the late spring/early summer and water level lows during the late winter. This pattern is the result of precipitation occurring during the winter months as snow onto frozen ground and then thawing during the spring and recharging the aquifer. Also during early spring there is limited evapotranspiration which allows the water to move through the soil to below the root zone. During the summer months precipi-tation is transpired or evaporated before it travels beyond the root zone. In addition to annual trends this well responded to both individual precipitation events and accumulated precipita-tion events, as shown in Figure 44.
Well 472535
Well 295341
unconsolidated sand & gravel
Metamorphic bedrock
basement
casing
screen
water level Sept 2011 to June 2013
sand & gravel
sand
unconsolidated
water level Sept 2011 to June 2013
casing
screen
Figure 29: Well 295341 Strip Log Figure 30: Well 472535 Strip Log

17
During the period between March 20, 2013 and April 17, 2013 there was a water level drop of approximately 4 ft. The drop is immediate, as is the return, and does not fit the data collected during the other parts of the study. Nothing out of the ordinary was encountered at any of the field vis-its, so it is unknown what caused the drop, but no conclu-sions were made based on the data during that period.
Well 617922 Well 617922 is a monitoring well completed in the Grande Ronde unit, though the water level elevation suggests that the well represents a composite of the potentiometric sur-face of both the Wanapum and Grande Ronde Units. It may be that the well construction allows water from both units to be expressed in this well, or that wells in the vicini-ty are creating the composite water level. This well is lo-cated in the central portion of the study area, approximately
1 mile northeast of a cluster of municipal supply wells that provide water for the City of Medical Lake, the City of Airway Heights, and Four Lakes Water District. In recent years this area has been experiencing declining water lev-els, most notably in the Four Lakes Water District well along Craig Rd. As a result of the declining water levels an agreement was reached whereby the City of Airway Heights would reduce and eventually eliminate the use of their well located in this vicinity. The water level elevation in this well varied from 2,251 to 2,297 during the study period (Figure 45). The water level appears to fol-low seasonal fluctuations, though it is not consistent between 2012 and 2013. In 2012 the water level high occurred at the end of June and in 2013 the trend indicates that the water level high was at the beginning of March. The water level lows in 2011 and 2012 oc-curred at the end of September. The water level elevation trend is likely a result of the municipal withdrawals in the vicinity, but it is difficult to determine the relationship since the data does not show a consistent year to year pattern and municipal withdrawals are chang-ing as a result of Airway Heights reducing and eliminating their wa-ter withdrawals from their well in the vicinity. Well 167912 Well 167912 is located in the central portion of the study area, and is completed in the Wanapum unit. It is 0.5 miles north of Well 617922. The well was drilled for domestic purposes but has not been used to date and no pump is installed. This well was originally drilled to 98 feet in July 1973, and deepened to 185 feet in May 1979. The water level elevation varied between 2,337 and 2,344 during the study period (Figure 46). The water level appears to fluctuate sea-
Well 617922
basalt, fractured
basalt, hard
casing
screen
water level Sept 2011 to June 2013
basalt, with clay or shale
clay
Wanapum
Grande Ronde Flows Interbed
Grande Ronde Sentinel Bluffs
Grande Ronde Wapshilla Ridge
Well 167912
basalt, hard
top soil
basalt, soft or decompressed
basalt, fractured
unconsolidated
Wanapum
Grande Ronde
casing water level Sept 2011 to June 2013
Water bearing zones
Figure 31: Well 617922 Strip Log Figure 32: Well 167912 Strip Log

18
sonally, though not the same each year. In 2012 the water level high was in late July, while in 2013 it appears that the water level high may be in May. The pattern of water level fluctua-tions is similar in nature to Well 617922, though the range of fluctuation in Well 617922 is 44 ft. while in Well 167912 it is just 6 ft.
Summary and Conclusions
A groundwater elevation monitoring and mapping project was completed for the West Plains area of Spokane County, Wash-ington. The project included groundwater elevation measure-ments from 124 wells at various frequencies including synoptic, monthly, and continuous between September 2011 and June 2013. The wells included public supply wells, domestic wells, and monitoring wells.
The purpose of the project was two fold: 1) collect, document, and organize groundwater elevation data to be used in future hydrogeologic analysis of the study area and long term water level trend monitoring, and 2) Use groundwater elevation data to develop groundwater elevation contours and evaluate changes in water levels over various time scales.
Key findings of the project include:
The Wanapum aquifer is compartmentalized by incised creek valleys and surface and near-surface basement rock. Localized groundwater highs are created by recharge from the surface and near-surface basement rock .
The Wanapum aquifer discharges to Deep Creek, Coulee Creek and seeps and springs within the study area.
The Wanapum aquifer responds on a time scale of days and weeks to precipitation events during the early spring, but during late spring and summer precipitation is largely lost to evapotranspiration and does impact groundwater levels.
The Grande Ronde aquifer is not impacted by the incised creek valleys and exhibits more lateral continuity through-out the study area. Recharge most likely occurs at the sur-face and near-surface basement structures but also comes from the overlying Wanapum and Unconsolidated units.
The Grande Ronde aquifer on the east edge of the study area is in contact with the SVRP Aquifer-Spokane River system, and based on water level elevation is likely receiv-ing water from the river and aquifer.
Aquifers located in the unconsolidated and paleodrainage units are recharged from both precipitation and surface wa-
ter features depending on their location. Those that are re-charged from precipitation show a relatively quick response to precipitation events, while those that are recharged by infiltration from surface water features have a more con-stant increase and decrease in water level.
There are many wells within the study area that are com-pleted in multiple water bearing formations. This compli-cates the interpretation of groundwater elevation data be-cause a well that is completed in multiple water bearing formations can represent a composite of the potentiometric surface of each aquifer it receives water from.

19
9
9.5
10
10.5
11
11.5
12
1730
1735
1740
1745
1750
1755
17609/1/2011
9/22/2011
10/13/2011
11/3/2011
11/24/2011
12/15/2011
1/5/2012
1/26/2012
2/16/2012
3/8/2012
3/29/2012
4/19/2012
5/10/2012
5/31/2012
6/21/2012
7/12/2012
8/2/2012
8/23/2012
9/13/2012
10/4/2012
10/25/2012
11/15/2012
12/6/2012
12/27/2012
1/17/2013
2/7/2013
2/28/2013
3/21/2013
4/11/2013
5/2/2013
5/23/2013
Groundwater Elevation
Groundwater Temperature
Lincoln‐Garfield Rd. Well Groundwater Elevation & Temperature September 2011 ‐ June 2013
Elevation (ft)
Temperatu
re(C)
9
9.5
10
10.5
11
11.5
12
2375
2380
2385
2390
2395
2400
2405
9/1/2011
9/22/2011
10/13/2011
11/3/2011
11/24/2011
12/15/2011
1/5/2012
1/26/2012
2/16/2012
3/8/2012
3/29/2012
4/19/2012
5/10/2012
5/31/2012
6/21/2012
7/12/2012
8/2/2012
8/23/2012
9/13/2012
10/4/2012
10/25/2012
11/15/2012
12/6/2012
12/27/2012
1/17/2013
2/7/2013
2/28/2013
3/21/2013
4/11/2013
5/2/2013
5/23/2013
Groundwater Elevation
Groundwater Temperature
Well 172968Groundwater Elevation & Temperature September 2011 ‐ June 2013
Elevation (ft)
Temperatu
re(C)
Figure 33
Figure 34
20
9
9.5
10
10.5
11
11.5
12
2385
2390
2395
2400
2405
2410
2415
9/1/2011
9/22/2011
10/13/2011
11/3/2011
11/24/2011
12/15/2011
1/5/2012
1/26/2012
2/16/2012
3/8/2012
3/29/2012
4/19/2012
5/10/2012
5/31/2012
6/21/2012
7/12/2012
8/2/2012
8/23/2012
9/13/2012
10/4/2012
10/25/2012
11/15/2012
12/6/2012
12/27/2012
1/17/2013
2/7/2013
2/28/2013
3/21/2013
4/11/2013
5/2/2013
5/23/2013
Groundwater Elevation
Groundwater Temperature
Well 439863Groundwater Elevation & Temperature September 2011 ‐ June 2013
Elevation (ft)
Temperatu
re(C)
0
0.05
0.1
0.15
0.2
0.25
0.3
0.35
2390
2390.5
2391
2391.5
2392
2392.5
2393
2393.5
2394
2394.59/1/2011
9/22/2011
10/13/2011
11/3/2011
11/24/2011
12/15/2011
1/5/2012
1/26/2012
2/16/2012
3/8/2012
3/29/2012
4/19/2012
5/10/2012
5/31/2012
6/21/2012
7/12/2012
8/2/2012
8/23/2012
9/13/2012
10/4/2012
10/25/2012
11/15/2012
12/6/2012
12/27/2012
1/17/2013
2/7/2013
2/28/2013
3/21/2013
4/11/2013
5/2/2013
5/23/2013
Groundwater Elevation
7 day precipitation average
Well 172968Groundwater Elevation & 7 day average precipitation 2011 ‐ June 2013
Elevation (ft)
7 Day A
verage of P
recipitatio
n(in
.)Figure 35
Figure 36
21
9
9.5
10
10.5
11
11.5
12
2365
2370
2375
2380
2385
2390
2395
9/1/2011
9/22/2011
10/13/2011
11/3/2011
11/24/2011
12/15/2011
1/5/2012
1/26/2012
2/16/2012
3/8/2012
3/29/2012
4/19/2012
5/10/2012
5/31/2012
6/21/2012
7/12/2012
8/2/2012
8/23/2012
9/13/2012
10/4/2012
10/25/2012
11/15/2012
12/6/2012
12/27/2012
1/17/2013
2/7/2013
2/28/2013
3/21/2013
4/11/2013
5/2/2013
5/23/2013
Groundwater Elevation
Groundwater Temperature
Four Lakes Water District ‐ School WellGroundwater Elevation & Temperature September 2011 ‐ June 2013
Elevation (ft)
Temperatu
re(C)
0
0.05
0.1
0.15
0.2
0.25
0.3
0.35
2400
2401
2402
2403
2404
2405
2406
24079/1/2011
9/22/2011
10/13/2011
11/3/2011
11/24/2011
12/15/2011
1/5/2012
1/26/2012
2/16/2012
3/8/2012
3/29/2012
4/19/2012
5/10/2012
5/31/2012
6/21/2012
7/12/2012
8/2/2012
8/23/2012
9/13/2012
10/4/2012
10/25/2012
11/15/2012
12/6/2012
12/27/2012
1/17/2013
2/7/2013
2/28/2013
3/21/2013
4/11/2013
5/2/2013
5/23/2013
Groundwater Elevation
7 day precipitation average
Well 439863Groundwater Elevation & 7 day average precipitation 2011 ‐ June 2013
Elevation (ft)
7 Day A
verage of P
recipitatio
n(in
.)
Figure 37
Figure 38
22
9
9.5
10
10.5
11
11.5
12
1680
1685
1690
1695
1700
1705
17109/1/2011
9/22/2011
10/13/2011
11/3/2011
11/24/2011
12/15/2011
1/5/2012
1/26/2012
2/16/2012
3/8/2012
3/29/2012
4/19/2012
5/10/2012
5/31/2012
6/21/2012
7/12/2012
8/2/2012
8/23/2012
9/13/2012
10/4/2012
10/25/2012
11/15/2012
12/6/2012
12/27/2012
1/17/2013
2/7/2013
2/28/2013
3/21/2013
4/11/2013
5/2/2013
5/23/2013
Groundwater Elevation
Groundwater Temperature
Well 411175Groundwater Elevation & Temperature September 2011 ‐ June 2013
Elevation (ft)
Temperatu
re(C)
1700
1705
1710
1715
1720
1725
1730
1680
1685
1690
1695
1700
1705
1710
9/1/2011
9/22/2011
10/13/2011
11/3/2011
11/24/2011
12/15/2011
1/5/2012
1/26/2012
2/16/2012
3/8/2012
3/29/2012
4/19/2012
5/10/2012
5/31/2012
6/21/2012
7/12/2012
8/2/2012
8/23/2012
9/13/2012
10/4/2012
10/25/2012
11/15/2012
12/6/2012
12/27/2012
1/17/2013
2/7/2013
2/28/2013
3/21/2013
4/11/2013
5/2/2013
5/23/2013
Groundwater Elevation
Spokane River Elevation at USGSGage 12422500
Well 411175Spokane River Elevation and Groundwater Elevation September 2011 ‐ June 2013
Groundwater Elevation (ft)
River Elevatio
n(ft)
Figure 39
Figure 40

23
0
2
4
6
8
10
12
14
2115
2120
2125
2130
2135
2140
2145
9/1/2011
9/22/2011
10/13/2011
11/3/2011
11/24/2011
12/15/2011
1/5/2012
1/26/2012
2/16/2012
3/8/2012
3/29/2012
4/19/2012
5/10/2012
5/31/2012
6/21/2012
7/12/2012
8/2/2012
8/23/2012
9/13/2012
10/4/2012
10/25/2012
11/15/2012
12/6/2012
12/27/2012
1/17/2013
2/7/2013
2/28/2013
3/21/2013
4/11/2013
5/2/2013
5/23/2013
Groundwater Elevation
Groundwater Temperature
Well 295341Groundwater Elevation & Temperature September 2011 ‐ June 2013
Elevation (ft)
Temperatu
re(C)
9
9.5
10
10.5
11
11.5
12
2350
2355
2360
2365
2370
2375
2380
23859/1/2011
9/22/2011
10/13/2011
11/3/2011
11/24/2011
12/15/2011
1/5/2012
1/26/2012
2/16/2012
3/8/2012
3/29/2012
4/19/2012
5/10/2012
5/31/2012
6/21/2012
7/12/2012
8/2/2012
8/23/2012
9/13/2012
10/4/2012
10/25/2012
11/15/2012
12/6/2012
12/27/2012
1/17/2013
2/7/2013
2/28/2013
3/21/2013
4/11/2013
5/2/2013
5/23/2013
Groundwater Elevation
Groundwater Temperature
Well 164270Groundwater Elevation & Temperature September 2011 ‐ June 2013
Elevation (ft)
Temperatu
re(C)
Figure 41
Figure 42

24
8.5
9
9.5
10
10.5
11
2105
2110
2115
2120
2125
2130
21359/1/2011
9/22/2011
10/13/2011
11/3/2011
11/24/2011
12/15/2011
1/5/2012
1/26/2012
2/16/2012
3/8/2012
3/29/2012
4/19/2012
5/10/2012
5/31/2012
6/21/2012
7/12/2012
8/2/2012
8/23/2012
9/13/2012
10/4/2012
10/25/2012
11/15/2012
12/6/2012
12/27/2012
1/17/2013
2/7/2013
2/28/2013
3/21/2013
4/11/2013
5/2/2013
5/23/2013
Groundwater Elevation
Groundwater Temperature
Well 472535Groundwater Elevation & Temperature September 2011 ‐ June 2013
Elevation (ft)
Temperatu
re(C)
0
0.05
0.1
0.15
0.2
0.25
0.3
0.35
2110
2112
2114
2116
2118
2120
2122
2124
2126
2128
9/1/2011
9/22/2011
10/13/2011
11/3/2011
11/24/2011
12/15/2011
1/5/2012
1/26/2012
2/16/2012
3/8/2012
3/29/2012
4/19/2012
5/10/2012
5/31/2012
6/21/2012
7/12/2012
8/2/2012
8/23/2012
9/13/2012
10/4/2012
10/25/2012
11/15/2012
12/6/2012
12/27/2012
1/17/2013
2/7/2013
2/28/2013
3/21/2013
4/11/2013
5/2/2013
5/23/2013
Groundwater Elevation
precipitation‐7 day average
Well 472535Groundwater Elevation & 7 day average precipitation 2011 ‐ June 2013
Elevation (ft)
Temperatu
re(C)
Figure 43
Figure 44

25
11
11.5
12
12.5
13
13.5
14
2250
2255
2260
2265
2270
2275
2280
2285
2290
2295
2300
9/1/2011
9/22/2011
10/13/2011
11/3/2011
11/24/2011
12/15/2011
1/5/2012
1/26/2012
2/16/2012
3/8/2012
3/29/2012
4/19/2012
5/10/2012
5/31/2012
6/21/2012
7/12/2012
8/2/2012
8/23/2012
9/13/2012
10/4/2012
10/25/2012
11/15/2012
12/6/2012
12/27/2012
1/17/2013
2/7/2013
2/28/2013
3/21/2013
4/11/2013
5/2/2013
5/23/2013
Groundwater Elevation
Groundwater Temperature
Well 617922Groundwater Elevation & Temperature September 2011 ‐ June 2013
Elevation (ft)
Temperatu
re(C)
9.00
9.50
10.00
10.50
11.00
11.50
12.00
2325
2330
2335
2340
2345
2350
2355
9/1/2011
9/22/2011
10/13/2011
11/3/2011
11/24/2011
12/15/2011
1/5/2012
1/26/2012
2/16/2012
3/8/2012
3/29/2012
4/19/2012
5/10/2012
5/31/2012
6/21/2012
7/12/2012
8/2/2012
8/23/2012
9/13/2012
10/4/2012
10/25/2012
11/15/2012
12/6/2012
12/27/2012
1/17/2013
2/7/2013
2/28/2013
3/21/2013
4/11/2013
5/2/2013
5/23/2013
Groundwater Elevation
Groundwater Temperature
Well 167912 (165941)Groundwater Elevation & Temperature September 2011 ‐ June 2013
Elevation (ft)
Temperatu
re(C)
Figure 45
Figure 46
26
References
Burns, E.R., Morgan, D.S., Peavler, R.S., and Kahle, S.C., 2011, Three-dimensional model of the geologic framework for the Co-lumbia Plateau Regional Aquifer System, Idaho, Oregon, and Washington: U.S. Geological Survey Scientific Investigations Report 2010-5246, 44 p.
Burns, E.R, Snyder, D.T, Haynes, J.V., and Waibel, M.S., 2012, Groundwater status and trends for the Columbia Plateau Regional Aquifer System, Washington, Oregon, and Idaho: U.S. Geological Survey Scientific Investigations Report 2012-5261, 52 p.
Deobald, W.B. and Buchanan, J.P., 1995, Hydrogeology of the West Plains Area of Spokane County, Washington: Report Prepared for the Spokane County Water Quality Management Program, 111 p.
GeoEngineers, 2009, Quality Assurance Project Plan for the Paleochannel Water Quality Monitoring Study Water Resource Invento-ry Area (WRIA) 54 , 35 p.
Kahle, S.C., and Bartolino, J., 2007, Hydrogeologic framework and water budget of the Spokane Valley-Rathdrum Prairie Aquifer, Spokane County, Washington and Bonner and Kootenai Counties, Idaho: U.S. Geological Survey Scientific Investigations Re-port 2007-5041, 48 p
Kahle, S.C., Morgan, D.S., Welch, W.B., Ely, D.M., Hinkle, S.R., Vaccaro, J.J., and Orzol, L.L., 2011, Hydrogeologic framework and hydrologic budget components of the Columbia Plateau Regional Aquifer System, Washington, Oregon, and Idaho: U.S. Geological Survey Scientific Investigations Report 2011-5124, 66 p.
McCollum, L.B., McCollum, M.B., Hamilton, M.M., and Pritchard, C.J. 2013. Mesoproterozoic and Cambrian Geology of the Northeastern Columbia Plateau of Washington—A View from the Steptoes. (in press)
Northwest Land and Water, 2012, West Plains (WRIA 54) & Lower Hangman Creek Watershed (WRIA 56) Hydrogeologic Charac-terization & Monitoring Well Drilling Final Report. 20 p.
Northwest Land and Water, 2013, Letter Memorandum to Rick Noll, Spokane Conservation District Re: Addendum to June 2012 West Plains and L. Hangman Ck Hydrogeologic Study, variously paginated.
Pritchard, C.J., 2013, Subsurface Projection of the Stratigraphy of the Columbia River Basalt Group and Paleodrainages in the West Plains Area, variously paginated
Spokane County Water Resources, 2011, Quality Assurance Project Plan for West Plains Groundwater Elevation Study, 26 p.
Spokane County Water Resources, 2013, West Plains Hydrogeology: Deep Creek and Coulee Creek Groundwater/Surface Water Interaction, 8 p.
Taylor, C.J., Alley, W.M., 2001, Ground-water-level monitoring and the importance of long-term water-level data: U.S. Geological Survey Circular 1217, 67 p.
Tetra Tech, 2007, Water Resource Inventory Area 54 (Lower Spokane) Watershed Plan Phase 2, Level 1 Data Compilation and Technical Assessment, variously paginated.
Tetra Tech, 2010, WRIA 54-Lower Spokane Watershed Detailed Implementation Plan, variously paginated.
Vaccaro, J.J., Jones, M.A., Ely, D.M., Keys, M.E., Olsen, T.D., Welch, W.B., and Cox, S.E., 2009, Hydrogeologic framework of the Yakima River basin aquifer system, Washington: U.S. Geological Survey Scientific Investigations Report 2009–5152, 106 p.

!A
!A
!A
!A
!A
!A
!A
!A
!A
!A
!A
!A
!A
!.
!.
!.
!.
!.
!.
!.
!.
!.
!.
!.!.
BEAIL152024
616916
495764
436929
413231
413065
408089
366380
351696
339149
322671
189494
172516172437
151012
150380
407776
341226
488063408360
391385
382077
168037
616663
544369
472793
467958408354
392035
382081
381868
373860
370123
369725
363714
351636
338961
330511
174774
172287
169800
169444
169122
166920
163547
162035161565
151647
367533
176121175566
172372
Swanson
Johnson
Spokane Cnty
439863
174246
172968
472535
295341
617922
411175
344207
332625
164270
293479
VA_CMTRY
Hermanson
Green
167996
167998
160959
172184
544269
472828
441147
174648
171100
419534
Tareski
408315
441147
see map inset
Figure 3:Groundwater Level Measurement LocationsWest Plains Area of Spokane County, Washington
!A
!.
560736560763
560732 560746
435794
163104
385958
341409
176286
173437
172674
172609
172168
171368
171363
170761
170102
166156164760
164203
163541
163156
162956
373865
356801
171735
445291
437578
413228
413193
375775
351706
253903
175743
175087
172807
170654
168885
168632
165821
163167
FAFBMWD1
168759
0.85 0 0.850.425 Miles
Measurement Frequency
!.
A
Synoptic
Monthly
Continuous
Hydrogeologic UnitPaleo-drainage depositsWanapum basaltGrande Ronde basaltBasement rockUndetermined
.
428174
West Plains Groundwater Elevation Monitoring & Mapping
M-1

0
0
0
0
560736560763
560732
153821
152024292881
153484
488063
344216
293463
174644
174533
174062
173811
172509
172268171979
171796
170959
170280
170008
169800
169441
169122
168213
167674
167325
167003
166611
165412
165243
165140
164862
164297
163975
163881
163263
163156
162956
159725
158603
156157
155972
155971
155391
153951
Figure 4: Supplemental Well LocationsWest Plains Area of Spokane County, Washington
Hydrogeologic UnitPaleo-drainage deposits
Wanapum basaltGrande Ronde basaltBasement rockUndetermined
VA_CMTRY
163119 & 163120
FAFBMWD1
472535
.0 1 20.5
MilesWest Plains Groundwater
Elevation Monitoring & Mapping
M-2
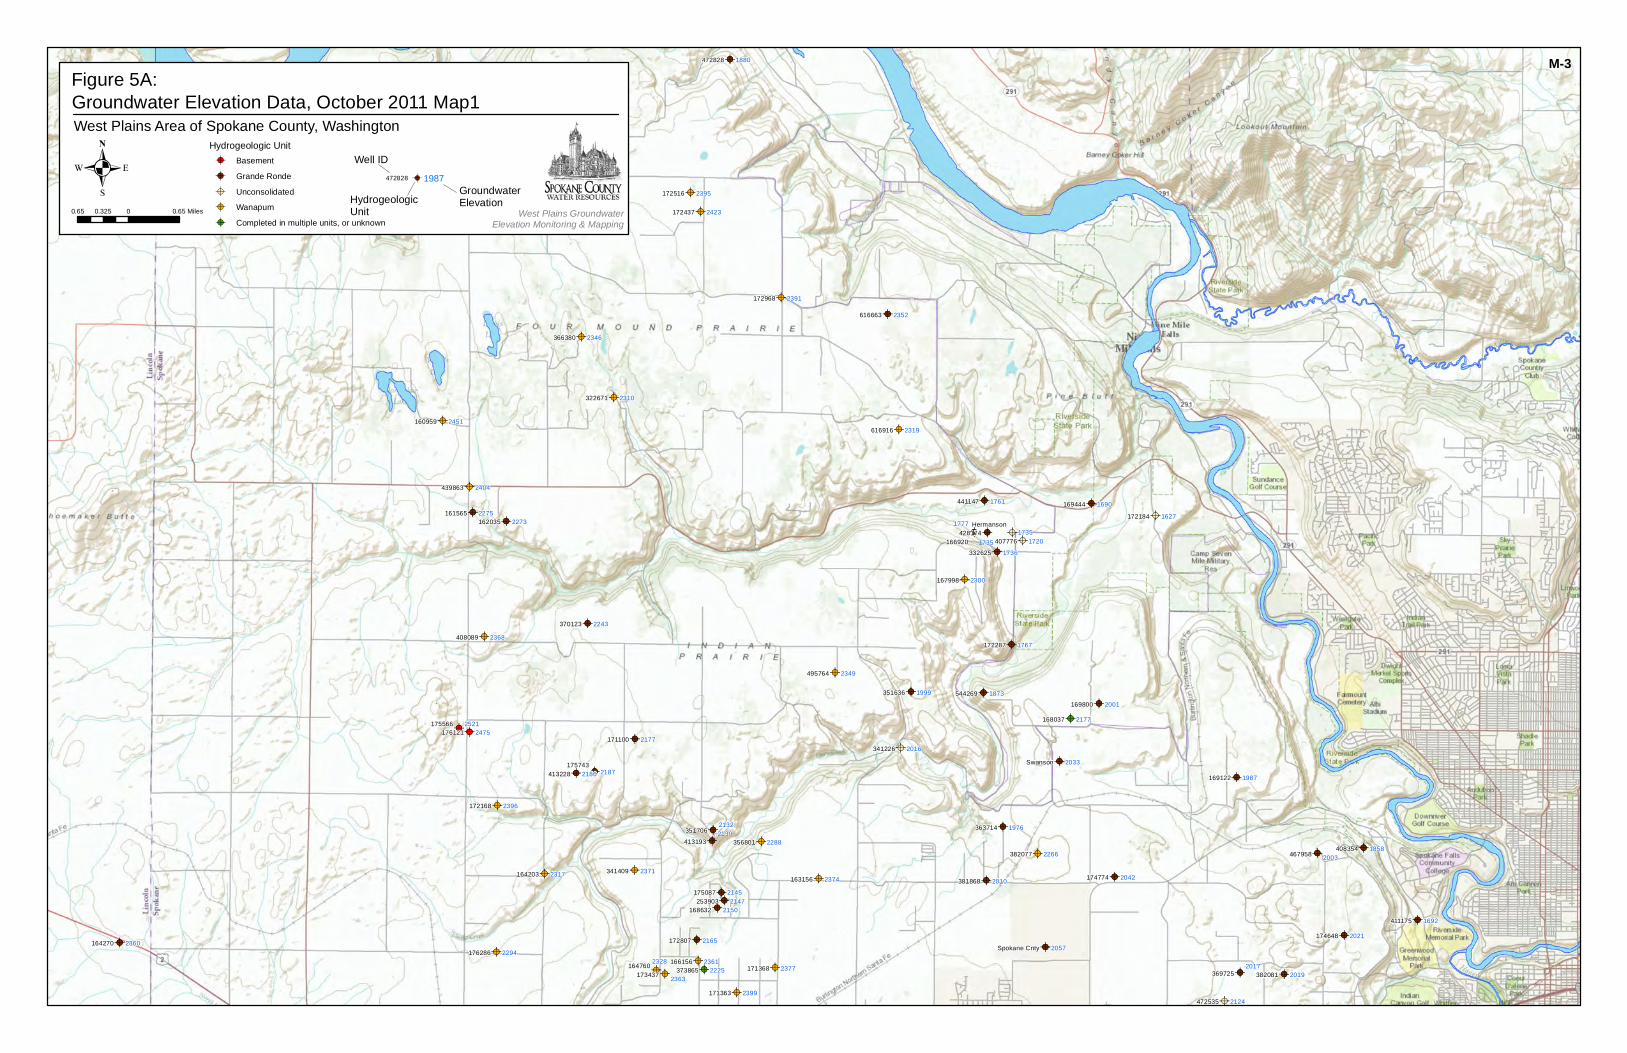
!A !A
!A!A
!A
!A
!A
!A
!A
!A
!A
!A
!A
!A!A
!A
!A
!A
!A
!A
!A
!A !A
!A
!A
!A
!A
!A
!A
!A
!A
!A
!A
!A
!A
!A
!A
!A
!A
!A
!A
!A
!A
!A
!A
!A
!A
!A
!A
!A!A
!A!A
!A
!A!A
!A
!A
!A
!A
!A
!A!A
!A
!A
!A
!A
!A
!A
!A
!A
!A
!A
!A
!A !A
!A!A
!A
!A
!A
!A
!A
!A
!A
!A
!A
!A!A
!A
!A
!A
!A
!A
!A
!A !A
!A
!A
!A
!A
!A
!A
!A
!A
!A
!A
!A
!A
!A
!A
!A
!A
!A
!A
!A
!A
!A
!A
!A
!A
!A
!A
!A
!A!A
!A!A
!A
!A!A
!A
!A
!A
!A
!A
!A!A
!A
!A
!A
!A
!A
!A
!A
!A
!A
!A
!A
!A
616916
495764
439863
408089
366380
341409
322671
176286
173437
172968
172516
172437
172168
171368
171363
167998
166156164760
164203163156
160959
472535
407776
341226
172184
382077
373865
356801
168037
616663
544269
472828
467958
441147
428174
413228
413193
411175
408354
382081
381868
370123
369725
363714351706
351636
332625
253903
175743
175087
174774
174648172807
172287
171100
169800
169444
169122
168632
166920
164270
162035161565
176121175566
Swanson
Hermanson
Spokane Cnty
2033
2319
2349
2404
2368
2346
2371
2310
2294
2363
2391
2395
2423
2396
2377
2399
2300
23612328
23172374
2451
1735
2124
1720
2016
1627
2266
2225
2288
2177
2057
2352
1873
1880
2003
1761
1735
2186
2130
1692
1858
2019
2010
2243
2017
19762132
1999
1736
2147
2187
2145
2042
20212165
1767
2177
2001
1690
1987
2150
1777
2360
22732275
24752521
Groundwater Elevation Data, October 2011 Map1West Plains Area of Spokane County, Washington
.0.65 0 0.650.325 Miles
Figure 5A:
1987
Hydrogeologic Unit
!A Basement
!A Grande Ronde
!A Unconsolidated
!A Wanapum
!A Completed in multiple units, or unknown
472828
GroundwaterElevation
Well ID
HydrogeologicUnit West Plains Groundwater
Elevation Monitoring & Mapping
M-3

!A
!A
!A
!A
!A
!A
!A
!A
!A
!A
!A
!A
!A
!A
!A
!A
!A
!A
!A
!A
!A!A
!A
!A
!A
!A
!A
!A
!A
!A
!A
!A
!A!A
!A
!A!A
!A
!A!A
!A
!A
!A!A
!A
!A
!A
!A
!A
!A
!A!A
!A!A!A !A
!A
!A
!A
!A
!A
!A
!A
!A
!A
!A
!A
!A
!A
!A
!A
!A
!A
!A
!A
!A
!A
!A
!A!A
!A
!A
!A
!A
!A
!A
!A
!A
!A
!A
!A!A
!A
!A!A
!A
!A!A
!A
!A
!A!A
!A
!A
!A
!A
!A
!A
!A!A
!A!A!A !A
!A
!A
BEAILGreen
560736
560763560732
560746
152024
413065
385958
351696
174246
172674
172609
171363
170761170102
168759
163541
162956151012
150380
472535
295341
617922
488063
391385
171735
544369
498282
472793
445291
392035
375775
373860
344207
338961
330511
170654
168885
165821
163167
151647
419534
367533
293479
172372
Johnson
Tareski
FAFBMWD1
VA_CMTRY
2287
2151
24322432
24322432
2148
2350
2359
2378
2378
2339
2324
2395
2399
23972389
2369
2370
2356
2350
2313
2076
2124
2134
2258
2250
2231
2237
2253
2161
2224
2159
2165
2142
2149
1981
2057
2125
1986
2183
2160
2154
2156
2107
2400
2126
2337
2378
2443
Groundwater Elevation Data, October 2011 Map 2West Plains Area of Spokane County, Washington
.0.5 0 0.50.25 Miles
Figure 5B:
1987
Hydrogeologic Unit
!A Basement
!A Grande Ronde
!A Unconsolidated
!A Wanapum
!A Completed in multiple units, or unknown
472828
GroundwaterElevation
Well ID
HydrogeologicUnit
West Plains GroundwaterElevation Monitoring & Mapping
M-4

!A !A
!A!A
!A
!A
!A
!A
!A
!A
!A
!A
!A!A
!A
!A
!A
!A
!A
!A
!A !A
!A
!A
!A
!A
!A
!A
!A
!A
!A
!A
!A
!A
!A
!A
!A
!A
!A
!A
!A
!A
!A
!A
!A
!A!A
!A
!A
!A
!A
!A
!A
!A
!A
!A
!A
!A
!A
!A
!A
!A
!A
!A
!A
!A !A
!A!A
!A
!A
!A
!A
!A
!A
!A
!A
!A
!A!A
!A
!A
!A
!A
!A
!A
!A !A
!A
!A
!A
!A
!A
!A
!A
!A
!A
!A
!A
!A
!A
!A
!A
!A
!A
!A
!A
!A
!A
!A
!A
!A!A
!A
!A!A
!A
!A
!A
!A
!A
!A
!A
!A
!A
!A
!A
!A
!A
!A
!A
!A
!A
!A773951
616916
495764
439863
408089
366380
341409
322671
176286
173437
172968
172516
172437
172168
171368
167998
166156164760
160959
407776
172184
382077
373865
356801
168037
616663
544269
472828
467958
441147
428174
413228
413193
411175
408354
382081
381868
369725
363714351706
351636
332625
253903
175743
175087
174774
174648172807
172287
171100
169444
169122
168632
166920
164270
163547
162035
161565
176121
175566
Hermanson
Spokane Cnty
2322
2353
2406
2373
2350
2374
2311
2291
2364
2394
2395
2422
2396
2377
2306
23612327
2458
17331717
1632
2274
2225
2293
2177
2057
2111
1874
1881
2004
1755
2171
2130
1698
1860
2018
2010
2017
19772133
1998
1726
2149
2186
2147
2044
20212167
1771
2176
1690
1986
2153
1782
2380
1798
2273
2284
2476
2524
Groundwater Elevation Data, Spring 2012 Map 1West Plains Area of Spokane County, Washington
.0.65 0 0.650.325 Miles
Figure 6A:
1987
Hydrogeologic Unit
!A Basement
!A Grande Ronde
!A Unconsolidated
!A Wanapum
!A Completed in multiple units, or unknown
472828
GroundwaterElevation
Well ID
HydrogeologicUnit
West Plains Groundwater Elevation Monitoring & Mapping
M-5

!A
!A
!A
!A
!A
!A
!A
!A
!A
!A
!A
!A
!A
!A
!A
!A
!A
!A!A
!A
!A
!A
!A
!A
!A
!A
!A
!A
!A
!A!A
!A
!A!A
!A
!A
!A!A
!A
!A
!A
!A
!A
!A
!A
!A
!A
!A
!A
!A
!A
!A
!A
!A
!A
!A
!A
!A
!A
!A
!A
!A
!A
!A
!A
!A
!A
!A!A
!A
!A
!A
!A
!A
!A
!A
!A
!A
!A
!A!A
!A
!A!A
!A
!A
!A!A
!A
!A
!A!A
!A
!A
!A
!A
!A
!A
!A
!A
!A
!A
Green
435794
163104
436929
413231
413065
385958
351696
339149189494
174246
172674
172609170761170102
168759
163541
162956
150380
472535
295341
617922
408360
391385
544369
498282
472793
445291
437578
392035
375775
373860
338961
330511
170654
168885
165821
163167
151647
367533
293479
172372
Johnson
Tareski
FAFBMWD1
VA_CMTRY
2287
2155
2332
2234
2347
2338
2345
2371
2375
2386
23212322
2340
2324
239924012397
2370
2372
2356
2331
2126
2141
2279
2261
2306
2236
2162
2224
2160
2168
2157
2139
1982
2131
1986
2184
2152
2158
2160
2116
2402
2338
2380
2446
Groundwater Elevation Data, Spring 2012 Map 2West Plains Area of Spokane County, Washington
.0.65 0 0.650.325 Miles
Figure 6B:
1987
Hydrogeologic Unit
!A Basement
!A Grande Ronde
!A Unconsolidated
!A Wanapum
!A Completed in multiple units, or unknown
472828
GroundwaterElevation
Well ID
HydrogeologicUnit
West Plains Groundwater Elevation Monitoring & Mapping
M-6

")
")
")
")")
3.3
5.7
3.11
1.18
0.86
0.33
0.43
0.74
1.13
3.01
-3.5
0.05
6.02
1.43
-3.2
0.87
2.75
1.57
-0.2
1.390.42
5.37
0.07
1.85
2.05 1.06
0.342.17
-8.2
2.49
3.99
4.18
8.95
-0.38
-6.01
-0.09
-1.15
-9.93
-1.95
-0.78
-0.18
-1.03
-0.32
-14.92
2
6.92
4.82-2.25
472535
407776
295341
172184
544369498282
472828
472793
467958
445291
441147
413228
413193
411175
408354
392035
381868
375775
373860
369725
363714351706
351636
338961
332625
330511
253903
175743
174774
174648172807
172287
171100
169444
169122
168885
165821
163167
162035
161565
VA_CMTRY
Spokane Cnty
Change in water level Fall 2011 to Spring 2012: Grande Ronde Unit &Unconsolidated Unit
West Plains Area of Spokane County, Washington
. 1 0 10.5 Miles
Figure 7:
Change in Water Level
1.7293479
Well ID
Surface & Near Surface Basement Rock
Change in Water Level
-14.9 to -12.0
-12.0 to -10.0
-10.0 to -7.0
-7.0 to -4.0
-4.0 to -1.0
-1.0 to 1.0
1.0 to 4.0
4.0 to 7.0
7.0 to 10.0
10.0 to 13.0
Unconsolidated Unit
Grande Ronde Unit
West Plains Groundwater Elevation Monitoring & Mapping M-7

167996
616916
495764
439863
413065
408089
385958
366380
351696
341409
322671
176286
174246
173437
172968
172674172609
172516
172437
172168
171368
171363
170761
170102
168759
167998
166156164760
163541
162956
160959
150380
391385
382077356801
367533
293479
176121
175566
172372
Johnson
Tareski1.7
2.31
1.74
0.87
2.68
3.11
0
3.1
1.1
0.8
3.79
1.52
5.25
4.32
8.66
2.32
0.19
3.89
0.35
0.48
0.13
4.16
4.577.91
0.38
5.95
0.07
1.34
-0.2
6.99
17.5
8.134.95
-2.94
12.02
-2.45
-2.84
2.882
-0.55
-0.61
-0.0025
Change in water level Fall 2011 to Spring 2012: Wanapum & Basement Units
West Plains Area of Spokane County, Washington
.0.85 0 0.850.425 Miles
Figure 8:
Change in water level
-3.0 to -1.0 ft
-1.0 to 1.0 ft
1.0 to 4.0 ft
4.0 to 7.0 ft
7.0 to 10.0 ft
10.0 to 13.0 ft
13.0 to 17.5 ft
Change in Water Level
1.7293479
Well ID
Surface & Near Surface Basement Rock
Wanapum UnitBasement Unit
West Plains Groundwater Elevation Monitoring & Mapping M-8

!A
!A!A
!A
!A
!A
!A!A
!A
!A
!A
!A
!A
!A
!A
!A
!A!A
!A
!A
!A!A
!A
!A
!A
!A
!A
!A!A
!A
!A
!A
!A
!A
!A
!A
!A
!A
!A
!A
!A
!A
!A
!A
!A!A!A !A
2360
240
0
2440
2320
2280
2470
2470
2400
2320
2320
2280
23602360
2320
2400
2280
2320
2320
2360
23 6 0
2280
2280
24322432
2432 2432
2350
2319
2349
2404
2359
2368
2378
2346
2378
2371
2310
2294
2339
2363
2391
2324 2395
2395
2423
2396
2377
2399
23972389
2369
2300
23612328
2317
2370
2374
2356
2451
2350
2313
2237
22662288
2400
2337
2378
2475
2521
2443
Generalized Groundwater Elevation Contours: Wanapum UnitWest Plains Area of Spokane County, Washington
.1 0 10.5 Miles
Figure 9:
2010
Wanapum Unit Groundwater Elevation, October 2011
Inferred Groundwater Elevation Contour, October 2011
Surface & Near Surface Basement Rock
Basement Unit Groundwater Elevation, October 20111987
1987
M-10
West Plains Groundwater Elevation Monitoring & Mapping
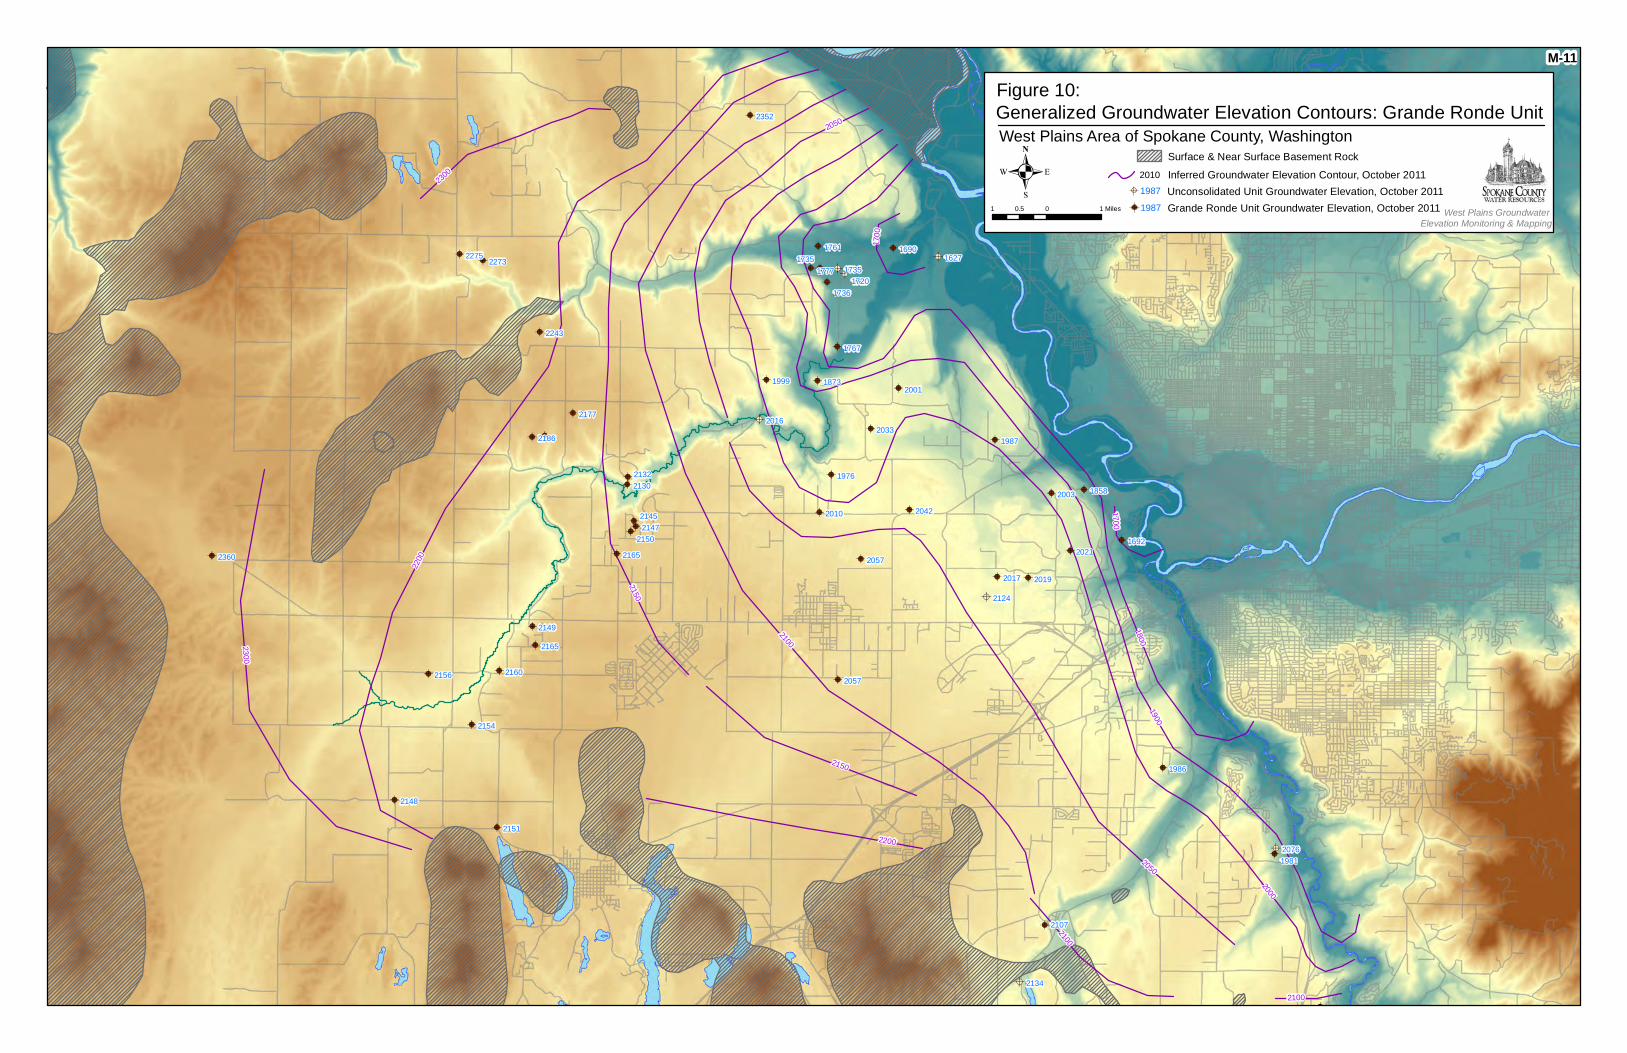
!A
!A!A
!A
!A
!A
!A
!A
!A
!A
!A
!A
!A
!A
!A!A
!A!A
!A
!A
!A
!A
!A
!A
!A
!A !A
!A
!A
!A
!A
!A
!A
!A
!A
!A
!A
!A
!A
!A
!A
!A
!A
!A
!A
!A
!A
!A
!A
!A
!A
!A
!A
!A
2000
1900
2200
2100
2050
1800
2150
230
0
170
0
2200
2150
2050
2100
2100
2300
1700
2151
2033
2148
1735
2076
2124
1720
2016
2134
1627
2057
2352
1873
2003
2165
1761
1735
2186
2130
1692
1858
2019
2010
2149
1981
2243
2017
19762132
1999
2057
1736
1986
2147
21452042
20212165
1767
2177
2001
1690
1987
2160
2150
1777
2154
2360
2156
22732275
2107
Generalized Groundwater Elevation Contours: Grande Ronde UnitWest Plains Area of Spokane County, Washington
.1 0 10.5 Miles
Figure 10:
Inferred Groundwater Elevation Contour, October 20112010
Surface & Near Surface Basement Rock
Unconsolidated Unit Groundwater Elevation, October 2011
Grande Ronde Unit Groundwater Elevation, October 2011
1987
1987
M-11
West Plains Groundwater Elevation Monitoring & Mapping

!.
!.
!.
!.
!.
!.
!.
!.
!.
!.
!.
!.
!.
Green
167996
168759
167998
160959
172184
544269
472828
441147
174648
171100
419534
Tareski
Figure 11:Monthly Water Level MeasurementsWest Plains Area of Spokane County, Washington
Hydrogeologic UnitPaleo-drainage depositsWanapum basaltGrande Ronde basalt
Basement rockUndetermined
2355
2360
2365
2370
2375
2380
2385
Oct‐11
Nov‐11
Dec‐11
Jan‐12
Feb‐12
Mar‐12
Apr‐12
May‐12
Jun‐12
Jul‐12
Aug‐12
Sep‐12
Oct‐12
Nov‐12
Dec‐12
Jan‐13
Feb‐13
Mar‐13
Apr‐13
May‐13
Well ‐168759 Monthly Static Water Level Elevation
groundwaterelevation in
feet above M
SL
1865
1870
1875
1880
1885
1890
1895
Oct‐11
Nov‐11
Dec‐11
Jan‐12
Feb‐12
Mar‐12
Apr‐12
May‐12
Jun‐12
Jul‐12
Aug‐12
Sep‐12
Oct‐12
Nov‐12
Dec‐12
Jan‐13
Feb‐13
Mar‐13
Apr‐13
May‐13
Well ‐472828 Monthly Static Water Level Elevation
groundwater
elevation in
feet above M
SL
2285
2290
2295
2300
2305
2310
2315
Oct‐11
Nov‐11
Dec‐11
Jan‐12
Feb‐12
Mar‐12
Apr‐12
May‐12
Jun‐12
Jul‐12
Aug‐12
Sep‐12
Oct‐12
Nov‐12
Dec‐12
Jan‐13
Feb‐13
Mar‐13
Apr‐13
May‐13
groundwaterelevation in
feet above M
SL
Well ‐167998 Monthly Static Water Level Elevation
2160
2165
2170
2175
2180
2185
2190
Oct‐11
Nov‐11
Dec‐11
Jan‐12
Feb‐12
Mar‐12
Apr‐12
May‐12
Jun‐12
Jul‐12
Aug‐12
Sep‐12
Oct‐12
Nov‐12
Dec‐12
Jan‐13
Feb‐13
Mar‐13
Apr‐13
May‐13
groundwater
elevation in
feet above M
SL
Well ‐171100 Monthly Static Water Level Elevation
1615
1620
1625
1630
1635
1640
1645
Oct‐11
Nov‐11
Dec‐11
Jan‐12
Feb‐12
Mar‐12
Apr‐12
May‐12
Jun‐12
Jul‐12
Aug‐12
Sep‐12
Oct‐12
Nov‐12
Dec‐12
Jan‐13
Feb‐13
Mar‐13
Apr‐13
May‐13
Well ‐172184 Monthly Static Water Level Elevation
groundwater
elevation in
feet above M
SL
2005
2010
2015
2020
2025
2030
2035
Oct‐11
Nov‐11
Dec‐11
Jan‐12
Feb‐12
Mar‐12
Apr‐12
May‐12
Jun‐12
Jul‐12
Aug‐12
Sep‐12
Oct‐12
Nov‐12
Dec‐12
Jan‐13
Feb‐13
Mar‐13
Apr‐13
May‐13
Well ‐174648Monthly Static Water Level Elevation
groundwater
elevation in
feet above M
SL
Well ‐174648Monthly Static Water Level Elevation
groundwater
elevation in
feet above M
SL
2250
2255
2260
2265
2270
2275
2280
Oct‐11
Nov‐11
Dec‐11
Jan‐12
Feb‐12
Mar‐12
Apr‐12
May‐12
Jun‐12
Jul‐12
Aug‐12
Sep‐12
Oct‐12
Nov‐12
Dec‐12
Jan‐13
Feb‐13
Mar‐13
Apr‐13
May‐13
Well GreenMonthly Static Water Level Elevation
groundwaterelevation in
feet above M
SL
Well GreenMonthly Static Water Level Elevation
groundwaterelevation in
feet above M
SL2385
2390
2395
2400
2405
2410
2415
Oct‐11
Nov‐11
Dec‐11
Jan‐12
Feb‐12
Mar‐12
Apr‐12
May‐12
Jun‐12
Jul‐12
Aug‐12
Sep‐12
Oct‐12
Nov‐12
Dec‐12
Jan‐13
Feb‐13
Mar‐13
Apr‐13
May‐13
Well TareskiMonthly Static Water Level Elevation
groundwater
elevation in
feet above M
SL
Well TareskiMonthly Static Water Level Elevation
groundwater
elevation in
feet above M
SL
2285
2290
2295
2300
2305
2310
2315
Oct‐11
Nov‐11
Dec‐11
Jan‐12
Feb‐12
Mar‐12
Apr‐12
May‐12
Jun‐12
Jul‐12
Aug‐12
Sep‐12
Oct‐12
Nov‐12
Dec‐12
Jan‐13
Feb‐13
Mar‐13
Apr‐13
May‐13
groundwater
elevation in
feet above M
SL
Well ‐167998 Monthly Static Water Level Elevation
2285
2290
2295
2300
2305
2310
2315
2320
Oct‐11
Nov‐11
Dec‐11
Jan‐12
Feb‐12
Mar‐12
Apr‐12
May‐12
Jun‐12
Jul‐12
Aug‐12
Sep‐12
Oct‐12
Nov‐12
Dec‐12
Jan‐13
Feb‐13
Mar‐13
Apr‐13
May‐13
groundwater
elevation in
feet above M
SL
Well ‐167996 Monthly Static Water Level Elevation
2440
2445
2450
2455
2460
2465
2470
Oct‐11
Nov‐11
Dec‐11
Jan‐12
Feb‐12
Mar‐12
Apr‐12
May‐12
Jun‐12
Jul‐12
Aug‐12
Sep‐12
Oct‐12
Nov‐12
Dec‐12
Jan‐13
Feb‐13
Mar‐13
Apr‐13
May‐13
Well ‐160959 Monthly Static Water Level Elevation
groundwater
elevation in
feet above M
SL
1740
1745
1750
1755
1760
1765
1770
Oct‐11
Nov‐11
Dec‐11
Jan‐12
Feb‐12
Mar‐12
Apr‐12
May‐12
Jun‐12
Jul‐12
Aug‐12
Sep‐12
Oct‐12
Nov‐12
Dec‐12
Jan‐13
Feb‐13
Mar‐13
Apr‐13
May‐13
groundwater
elevation in
feet above M
SL
Well ‐441147 Monthly Static Water Level Elevation
1855
1860
1865
1870
1875
1880
1885
Oct‐11
Nov‐11
Dec‐11
Jan‐12
Feb‐12
Mar‐12
Apr‐12
May‐12
Jun‐12
Jul‐12
Aug‐12
Sep‐12
Oct‐12
Nov‐12
Dec‐12
Jan‐13
Feb‐13
Mar‐13
Apr‐13
May‐13
Well‐544269 Monthly Static Water Level Elevation
groundwater
elevation in
feet above M
SL
West Plains Groundwater Elevation Monitoring & Mapping
M-11

Top Bottom
151647 - 2261 47.5630 -117.5001 5/11/1992 320 159 320 Domestic grande ronde 110 40 Continuous
164270 - 2447 47.6593 -117.8283 8/12/1991 268 230 260 Monitoring grande ronde 38 187 Continuous
Thorpe Rd - 2396 47.6125 -117.5830 5/10/1979 185 22 268 Domestic wanapum 63 40 Continuous
172968 - 2409 47.7805 -117.6476 2/22/1993 205 35 105 Domestic wanapum 25 10 Continuous
293479 - 2447 47.5562 -117.5931 10/19/1965 200 183 200 Public basement 70 50 Continuous
295341 - 2166 47.5479 -117.5097 10/4/1990 80 63 78 Monitoring unconsolidated 74.5 - Continuous
332625 ABR634 1924 47.7335 -117.5874 5/8/1991 320 314 320 Public grande ronde 234 45 Continuous
344207 AGG478 2372 47.6279 -117.5819 7/11/1994 440 380 440 Public grande ronde 340 100 Continuous
411175 AKA146 1870 47.6655 -117.4707 6/23/2005 264 246 261 Domestic grande ronde 180 50 Continuous
439863 ALR844 2428 47.7448 -117.7331 2/15/2006 120 60 120 Domestic wanapum 38 35 Continuous
472535 - 2268 47.6501 -117.5238 3/23/2002 185 160 185 Monitoring unconsolidated 159 - Continuous
617922 APC141 2424 47.6058 -117.5842 6/30/2009 450 240 310 Monitoring undetermined 180 - Continuous
Hermanson - 1897 47.7371 -117.5832 - - - - Domestic unconsolidated - - Continuous
152024 AHC093 2383 47.5950 -117.7557 1/16/1961 440 129 440 Public grande ronde 160 700 Monthly
160959 ABI141 2484 47.7570 -117.7407 3/18/1994 100 80 100 Domestic wanapum 40 50 Monthly
167998 - 2321 47.7283 -117.5963 11/7/1990 130 20 130 Public wanapum 50 10 Monthly
168759 - 2461 47.6353 -117.6964 4/9/1975 135 110 135 Domestic wanapum 87 24 Monthly
171100 - 2465 47.6981 -117.6869 8/4/1978 475 20 475 Domestic grande ronde 290 25 Monthly
172184 ABR836 1880 47.7404 -117.5437 1/18/1978 303 293 303 Domestic unconsolidated 270 20 Monthly
174648 AAJ814 2218 47.6626 -117.4910 4/16/1996 297 265 295 Domestic grande ronde 229 10 Monthly
419534 AKA181 2376 47.5192 -117.6924 7/15/2005 440 260 440 Public basement 24.1 10 Monthly
441147 ALR168 1869 47.7430 -117.5910 5/31/2006 235 205 225 Domestic grande ronde 139 35 Monthly
472828 APC990 2063 47.8248 -117.6622 2/12/2007 260 210 260 Domestic grande ronde 200 12 Monthly
544269 APC133 2240 47.7072 -117.5909 7/18/2008 600 560 600 Domestic grande ronde 450 30 Monthly
Green - 2344 47.5824 -117.4980 Domestic undetermined - - Monthly
Tareski - 2414 47.5585 -117.6132 Domestic basement - - Monthly
Table 1 Project Wells
log, often at the time of construction; Yield ‐ well yield in gallons per minute recorded on well drillers log; Measurement Frequency ‐ frequency of measurment of well during project
Well ID‐primary well identifier used in project (where possible Ecology Well Log Id used); Well Tag‐Ecology Well Tag ID; Elevation‐Elevation in ft. above MSL derived from USGS DEM; Open Interval‐depth below groundsurface (bgs) of top and bottom of interval open to formation; Hydrogeologic Unit ‐ interpreted hydrogeologic formation which the well draws water from; Static Water Level‐static water level recorded on well drillers
Well TypeHydrogeologic
Unit
Static Water
Level
Measurement
FrequencyYieldWell Tag
Open IntervalWell ID Elevation Latitude Longitude
Date of Well
Construction
Total
Depth
T‐1
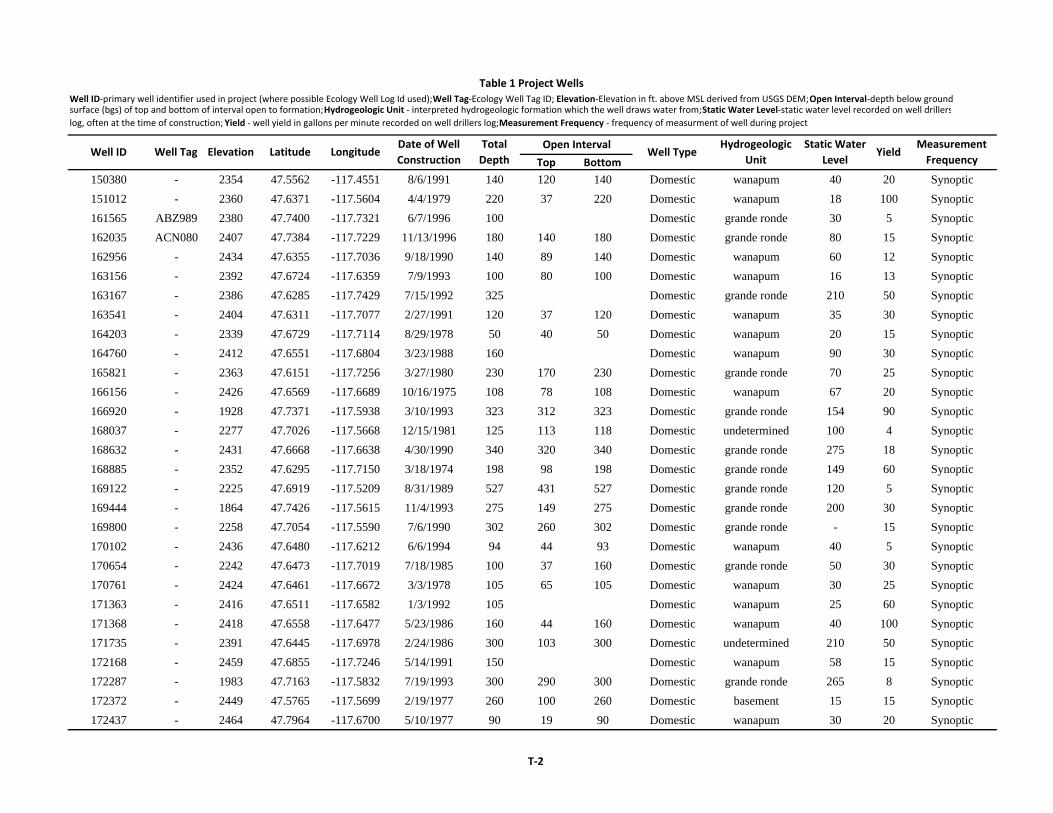
Top Bottom
150380 - 2354 47.5562 -117.4551 8/6/1991 140 120 140 Domestic wanapum 40 20 Synoptic
151012 - 2360 47.6371 -117.5604 4/4/1979 220 37 220 Domestic wanapum 18 100 Synoptic
161565 ABZ989 2380 47.7400 -117.7321 6/7/1996 100 Domestic grande ronde 30 5 Synoptic
162035 ACN080 2407 47.7384 -117.7229 11/13/1996 180 140 180 Domestic grande ronde 80 15 Synoptic
162956 - 2434 47.6355 -117.7036 9/18/1990 140 89 140 Domestic wanapum 60 12 Synoptic
163156 - 2392 47.6724 -117.6359 7/9/1993 100 80 100 Domestic wanapum 16 13 Synoptic
163167 - 2386 47.6285 -117.7429 7/15/1992 325 Domestic grande ronde 210 50 Synoptic
163541 - 2404 47.6311 -117.7077 2/27/1991 120 37 120 Domestic wanapum 35 30 Synoptic
164203 - 2339 47.6729 -117.7114 8/29/1978 50 40 50 Domestic wanapum 20 15 Synoptic
164760 - 2412 47.6551 -117.6804 3/23/1988 160 Domestic wanapum 90 30 Synoptic
165821 - 2363 47.6151 -117.7256 3/27/1980 230 170 230 Domestic grande ronde 70 25 Synoptic
166156 - 2426 47.6569 -117.6689 10/16/1975 108 78 108 Domestic wanapum 67 20 Synoptic
166920 - 1928 47.7371 -117.5938 3/10/1993 323 312 323 Domestic grande ronde 154 90 Synoptic
168037 - 2277 47.7026 -117.5668 12/15/1981 125 113 118 Domestic undetermined 100 4 Synoptic
168632 - 2431 47.6668 -117.6638 4/30/1990 340 320 340 Domestic grande ronde 275 18 Synoptic
168885 - 2352 47.6295 -117.7150 3/18/1974 198 98 198 Domestic grande ronde 149 60 Synoptic
169122 - 2225 47.6919 -117.5209 8/31/1989 527 431 527 Domestic grande ronde 120 5 Synoptic
169444 - 1864 47.7426 -117.5615 11/4/1993 275 149 275 Domestic grande ronde 200 30 Synoptic
169800 - 2258 47.7054 -117.5590 7/6/1990 302 260 302 Domestic grande ronde - 15 Synoptic
170102 - 2436 47.6480 -117.6212 6/6/1994 94 44 93 Domestic wanapum 40 5 Synoptic
170654 - 2242 47.6473 -117.7019 7/18/1985 100 37 160 Domestic grande ronde 50 30 Synoptic
170761 - 2424 47.6461 -117.6672 3/3/1978 105 65 105 Domestic wanapum 30 25 Synoptic
171363 - 2416 47.6511 -117.6582 1/3/1992 105 Domestic wanapum 25 60 Synoptic
171368 - 2418 47.6558 -117.6477 5/23/1986 160 44 160 Domestic wanapum 40 100 Synoptic
171735 - 2391 47.6445 -117.6978 2/24/1986 300 103 300 Domestic undetermined 210 50 Synoptic
172168 - 2459 47.6855 -117.7246 5/14/1991 150 Domestic wanapum 58 15 Synoptic
172287 - 1983 47.7163 -117.5832 7/19/1993 300 290 300 Domestic grande ronde 265 8 Synoptic
172372 - 2449 47.5765 -117.5699 2/19/1977 260 100 260 Domestic basement 15 15 Synoptic
172437 - 2464 47.7964 -117.6700 5/10/1977 90 19 90 Domestic wanapum 30 20 Synoptic
Well Tag Elevation Latitude Longitude
Table 1 Project Wells
Well ID‐primary well identifier used in project (where possible Ecology Well Log Id used); Well Tag‐Ecology Well Tag ID; Elevation‐Elevation in ft. above MSL derived from USGS DEM; Open Interval‐depth below groundsurface (bgs) of top and bottom of interval open to formation; Hydrogeologic Unit ‐ interpreted hydrogeologic formation which the well draws water from; Static Water Level‐static water level recorded on well drillers
log, often at the time of construction; Yield ‐ well yield in gallons per minute recorded on well drillers log; Measurement Frequency ‐ frequency of measurment of well during project
Static Water
LevelYield
Measurement
Frequency
Date of Well
Construction
Total
Depth
Open IntervalWell Type
Hydrogeologic
UnitWell ID
T‐2

Top Bottom
172516 - 2449 47.7999 -117.6729 5/29/1976 123 67 123 Domestic wanapum 55 30 Synoptic
172609 - 2420 47.6467 -117.6331 8/18/1995 120 Domestic wanapum 20 10 Synoptic
172674 - 2406 47.6439 -117.6963 5/13/1978 175 94 175 Domestic wanapum - 40 Synoptic
172807 - 2415 47.6608 -117.6693 7/1/1993 345 260 345 Domestic grande ronde 240 20 Synoptic
173437 - 2414 47.6544 -117.6780 1/13/1981 140 74 140 Domestic wanapum 40 45 Synoptic
174774 AAL205 2309 47.6732 -117.5543 10/8/1997 320 240 320 Domestic grande ronde 200 20 Synoptic
175087 ABI250 2425 47.6696 -117.6626 5/13/1994 345 290 330 Domestic grande ronde 258 15 Synoptic
175566 ABW156 2528 47.6998 -117.7354 12/6/1995 320 230 310 Domestic basement 50 5 Synoptic
175743 ABZ994 2440 47.6920 -117.6978 5/7/1996 340 300 340 Domestic grande ronde 250 15 Synoptic
176121 - 2491 47.6991 -117.7325 10/17/1996 300 98 300 Domestic basement - 1 Synoptic
176286 ACP517 2383 47.6582 -117.7245 9/10/1997 140 100 140 Domestic wanapum 70 40 Synoptic
253903 AEH324 2419 47.6682 -117.6618 5/23/2000 355 295 355 Domestic grande ronde 270 30 Synoptic
322671 AGC271 2322 47.7617 -117.6935 2/4/2002 120 100 120 Domestic wanapum 65 15 Synoptic
330511 AGG672 2267 47.6051 -117.4540 4/4/2002 364 362 364 Domestic grande ronde 300 10 Synoptic
338961 AHC336 2307 47.5418 -117.3918 7/25/2002 280 0 280 Domestic grande ronde 190 60 Synoptic
341226 AAK721 2055 47.6968 -117.6135 6/3/1994 123 114 123 Domestic unconsolidated 47 55 Synoptic
341409 AFO087 2395 47.6737 -117.6866 5/15/2002 50 35 50 Domestic wanapum 25 25 Synoptic
351636 AHS149 2305 47.7073 -117.6109 1/15/2003 370 330 365 Domestic grande ronde 290 10 Synoptic
351696 AHG910 2406 47.5984 -117.5680 10/22/2002 140 120 140 Domestic wanapum 80 50 Synoptic
351706 AHF917 2364 47.6813 -117.6651 11/29/2002 365 314 334 Domestic grande ronde 145 9 Synoptic
356801 AHF929 2378 47.6792 -117.6518 3/11/2003 160 135 155 Domestic undetermined 90 17 Synoptic
363714 AFQ103 2274 47.6823 -117.5852 6/10/2003 385 300 340 Domestic grande ronde 295 10 Synoptic
366380 AHJ220 2370 47.7729 -117.7026 5/14/2003 140 Domestic wanapum 17 20 Synoptic
367533 AHJ211 2373 47.5684 -117.5268 4/4/2003 400 Domestic basement 36 10 Synoptic
369725 AHJ092 2249 47.6555 -117.5196 7/23/2003 300 Domestic grande ronde 225 15 Synoptic
370123 AHC624 2452 47.7195 -117.7002 9/11/2003 330 Domestic grande ronde 223 40 Synoptic
373860 AHJ414 2125 47.5824 -117.4100 11/22/2003 320 240 320 Domestic grande ronde 145 24 Synoptic
373865 AHJ743 2434 47.6553 -117.6672 11/18/2003 320 Domestic mixed 100 50 Synoptic
Table 1 Project Wells
Well ID‐primary well identifier used in project (where possible Ecology Well Log Id used); Well Tag‐Ecology Well Tag ID; Elevation‐Elevation in ft. above MSL derived from USGS DEM; Open Interval‐depth below groundsurface (bgs) of top and bottom of interval open to formation; Hydrogeologic Unit ‐ interpreted hydrogeologic formation which the well draws water from; Static Water Level‐static water level recorded on well drillers
log, often at the time of construction; Yield ‐ well yield in gallons per minute recorded on well drillers log; Measurement Frequency ‐ frequency of measurment of well during project
Well ID Well Tag Elevation Latitude LongitudeDate of Well
Construction
Total
Depth
Open IntervalWell Type
Hydrogeologic
Unit
Static Water
LevelYield
Measurement
Frequency
T‐3

Top Bottom
375775 AHS537 2386 47.6414 -117.7021 11/6/2003 260 240 260 Domestic grande ronde 236 20 Synoptic
381868 ABZ938 2334 47.6723 -117.5897 8/1/1996 480 Domestic grande ronde 400 15 Synoptic
382077 AKT919 2292 47.6774 -117.5755 4/14/2004 128 55 60 Domestic undetermined 50 10 Synoptic
382081 AKT916 2267 47.6553 -117.5074 4/6/2004 360 320 340 Domestic grande ronde 300 20 Synoptic
385958 AHJ563 2443 47.6422 -117.6913 6/18/2004 150 Domestic wanapum 70 15 Synoptic
391385 AHJ107 2319 47.5893 -117.4313 10/6/2004 180 120 175 Domestic undetermined 120 6 Synoptic
392035 AHJ586 2323 47.5245 -117.4650 9/2/2004 240 0 240 Domestic grande ronde 200 5 Synoptic
407776 AEK209 1906 47.7356 -117.5803 2/4/2005 314 290 300 Domestic unconsolidated 220 12 Synoptic
408089 AKO852 2484 47.7169 -117.7287 3/4/2005 220 140 220 Domestic wanapum 112 12 Synoptic
408354 AKM084 2001 47.6788 -117.4857 12/20/2004 320 200 320 Domestic grande ronde 125 30 Synoptic
408360 AKO858 2378 47.5981 -117.6089 11/18/2004 180 120 180 Domestic undetermined 100 30 Synoptic
413065 ALR955 2406 47.5778 -117.6272 6/13/2005 160 Domestic wanapum 60 22 Synoptic
413193 AKY024 2294 47.6793 -117.6654 7/22/2005 295 255 295 Domestic grande ronde 180 20 Synoptic
413228 AKA192 2453 47.6916 -117.7030 6/16/2005 300 260 300 Domestic grande ronde 75 3 Synoptic
428174 AKL353 1907 47.7371 -117.5901 10/7/2005 346 262 272 Domestic grande ronde 215 12 Synoptic
616916 APN344 2331 47.7561 -117.6147 2/1/2006 80 18 80 Domestic wanapum 25 30 Synoptic
437578 APP804 2424 47.6185 -117.7153 5/25/2006 420 380 420 Domestic grande ronde 260 15 Synoptic
445291 APP840 2445 47.6364 -117.7008 5/30/2006 335 295 335 Domestic grande ronde 190 20 Synoptic
467958 APP874 2212 47.6778 -117.4985 10/4/2006 346 339 346 Domestic grande ronde 225 10 Synoptic
472793 APC449 2403 47.4800 -117.3753 3/8/2007 420 360 420 Domestic grande ronde 150 50 Synoptic
495764 BAC719 2373 47.7107 -117.6319 8/28/2007 180 150 180 Domestic wanapum 90 17 Synoptic
498282 - 2403 47.4884 -117.3556 12/14/1994 265 Domestic grande ronde 90 50 Synoptic
544369 BAS080 2366 47.4900 -117.3790 5/2/2008 340 280 340 Domestic grande ronde 120 40 Synoptic
616663 ALT367 2364 47.7776 -117.6181 9/23/2009 525 485 525 Domestic grande ronde 208 18 Synoptic
BEAIL - 2098 47.5839 -117.4096 - - - - Domestic unconsolidated - - Synoptic
Spokane Cnty - 2345 47.6600 -117.5733 - - - - Monitoring grande ronde - - Synoptic
Swanson - 2285 47.6946 -117.5698 - - - - Domestic - - Synoptic
Johnson - 2378 47.5982 -117.6089 - - - - Domestic wanapum - - Synoptic
560746 - 2456 47.6362 -117.6695 10/10/1992 111 99 111 Monitoring Wanapum - - Synoptic
Static Water
LevelYield
Measurement
Frequency
Table 1 Project Wells
Well ID‐primary well identifier used in project (where possible Ecology Well Log Id used); Well Tag‐Ecology Well Tag ID; Elevation‐Elevation in ft. above MSL derived from USGS DEM; Open Interval‐depth below groundsurface (bgs) of top and bottom of interval open to formation; Hydrogeologic Unit ‐ interpreted hydrogeologic formation which the well draws water from; Static Water Level‐static water level recorded on well drillers
log, often at the time of construction; Yield ‐ well yield in gallons per minute recorded on well drillers log; Measurement Frequency ‐ frequency of measurment of well during project
Well ID Well Tag Elevation Latitude LongitudeDate of Well
Construction
Total
Depth
Open IntervalWell Type
Hydrogeologic
Unit
T‐4
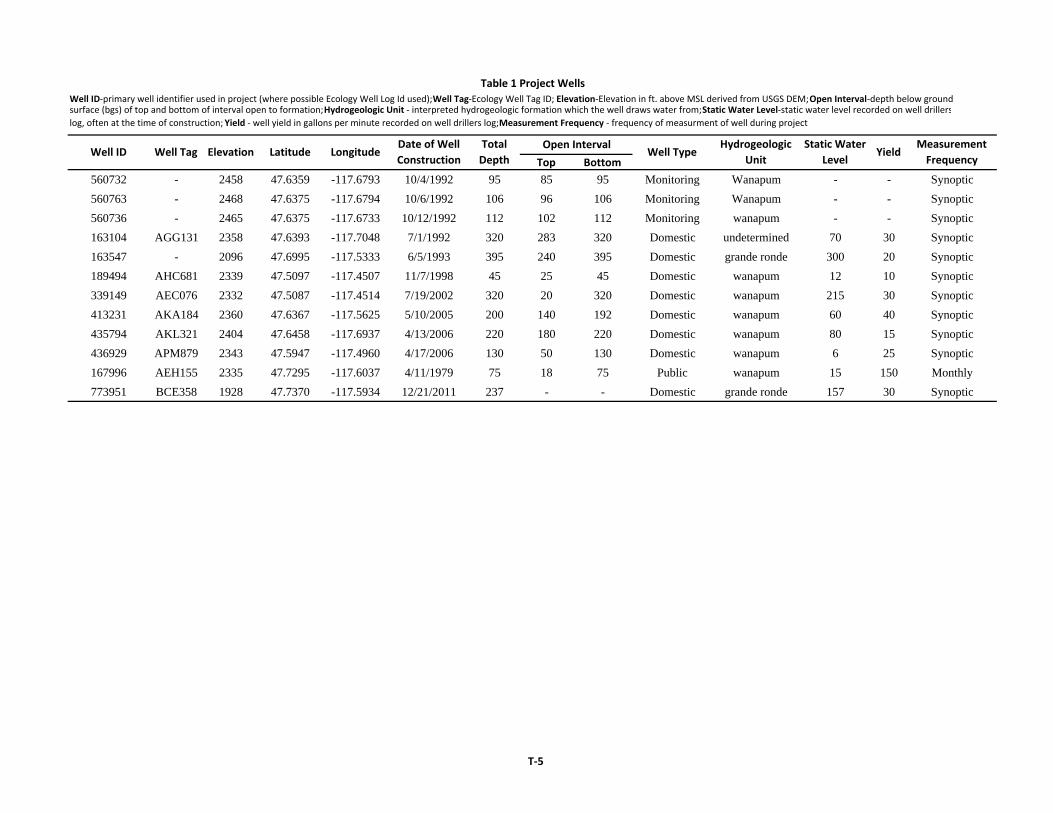
Top Bottom
560732 - 2458 47.6359 -117.6793 10/4/1992 95 85 95 Monitoring Wanapum - - Synoptic
560763 - 2468 47.6375 -117.6794 10/6/1992 106 96 106 Monitoring Wanapum - - Synoptic
560736 - 2465 47.6375 -117.6733 10/12/1992 112 102 112 Monitoring wanapum - - Synoptic
163104 AGG131 2358 47.6393 -117.7048 7/1/1992 320 283 320 Domestic undetermined 70 30 Synoptic
163547 - 2096 47.6995 -117.5333 6/5/1993 395 240 395 Domestic grande ronde 300 20 Synoptic
189494 AHC681 2339 47.5097 -117.4507 11/7/1998 45 25 45 Domestic wanapum 12 10 Synoptic
339149 AEC076 2332 47.5087 -117.4514 7/19/2002 320 20 320 Domestic wanapum 215 30 Synoptic
413231 AKA184 2360 47.6367 -117.5625 5/10/2005 200 140 192 Domestic wanapum 60 40 Synoptic
435794 AKL321 2404 47.6458 -117.6937 4/13/2006 220 180 220 Domestic wanapum 80 15 Synoptic
436929 APM879 2343 47.5947 -117.4960 4/17/2006 130 50 130 Domestic wanapum 6 25 Synoptic
167996 AEH155 2335 47.7295 -117.6037 4/11/1979 75 18 75 Public wanapum 15 150 Monthly
773951 BCE358 1928 47.7370 -117.5934 12/21/2011 237 - - Domestic grande ronde 157 30 Synoptic
Static Water
LevelYield
Measurement
Frequency
Table 1 Project Wells
Well ID‐primary well identifier used in project (where possible Ecology Well Log Id used); Well Tag‐Ecology Well Tag ID; Elevation‐Elevation in ft. above MSL derived from USGS DEM; Open Interval‐depth below groundsurface (bgs) of top and bottom of interval open to formation; Hydrogeologic Unit ‐ interpreted hydrogeologic formation which the well draws water from; Static Water Level‐static water level recorded on well drillers
log, often at the time of construction; Yield ‐ well yield in gallons per minute recorded on well drillers log; Measurement Frequency ‐ frequency of measurment of well during project
Well ID Well Tag Elevation Latitude LongitudeDate of Well
Construction
Total
Depth
Open IntervalWell Type
Hydrogeologic
Unit
T‐5

Top Bottom
488063 BAC801 2375 47.5947 -117.6290 5/20/1959 320 205/380 215/400 Public mixed 145 725 Fairchild AFB
419534 AKA181 2376 47.5192 -117.6924 7/15/2005 440 260 440 Public basement 24.1 10 Fairchild AFB
VA_CMTRY - 2438 47.5879 -117.7153 4/1/1955 343 - - Monitoring mixed 177 50 Ecology
FAFBMWD1 - 2426 47.6393 -117.6292 - - - - Monitoring mixed 137.5 - Ecology
153484 - 2322 47.5444 -117.4401 7/10/1964 122 25 122 Irrigation wanapum 26 400 USGS
292881 AHC094 2383 47.5950 -117.7555 10/29/1957 440 73.5 440 Public mixed 160 1000 USGS
152024 AHC093 2383 47.5946 -117.7558 1/16/1961 440 129 440 Public mixed 160 700+ USGS
153821 - 2367 47.6103 -117.7411 5/1/1969 335 - - Irrigation basement?? 116 - USGS
560746 - 2456 47.6362 -117.6695 10/10/1992 111 99 111 Monitoring wanapum - Waste Mangement
560732 - 2458 47.6359 -117.6793 10/4/1992 95 85 95 Monitoring wanapum - Waste Mangement
560763 - 2468 47.6375 -117.6794 10/6/1992 106 96 106 Monitoring wanapum - Waste Mangement
560736 - 2465 47.6375 -117.6733 10/12/1992 112 102 112 Monitoring wanapum - Waste Mangement
472535 - 2268 47.6501 -117.5238 3/23/2002 185 160 185 Monitoring unconsolidated 159 - Spokane County
152024 AHC093 2380 47.593003 -117.75536 1/16/1961 440 129 440 Public Grande Ronde 160 700+ EWU
152942 - 2350 47.523778 -117.70057 4/22/1994 100 39 100 Domestic Wanapum 20 120 EWU
153951 - 2305 47.648513 -117.54234 2/25/1977 100 19 100 Domestic Wanapum 10 60 EWU
155391 - 2275 47.652111 -117.51562 4/4/1975 148 23 148 Domestic Wanapum 35 40 EWU
155971 - 2490 47.556505 -117.79281 8/10/1977 95 47 95 Domestic Wanapum 65 40 EWU
155972 - 2430 47.552835 -117.80351 9/21/1977 80 18 80 Domestic Wanapum 30 10 EWU
156157 - 2425 47.578388 -117.77147 6/10/1985 75 19 75 Domestic Wanapum 12 75 EWU
158603 - 2385 47.592982 -117.76073 1/20/1984 62 19 62 Domestic Wanapum artesian 25 EWU
159725 AHC092 2425 47.578402 -117.76608 1/12/1978 964 380/836 400/964 Public Basement 52 2500 EWU
162956 - 2430 47.637637 -117.69838 9/18/1990 140 89 140 Domestic Wanapum 60 12 EWU
163156 - 2390 47.673681 -117.63336 7/9/1993 100 18 100 Domestic Wanapum 16 13 EWU
163263 - 2150 47.691795 -117.51015 2/4/1988 203 18 203 Domestic Grande Ronde 160 8 EWU
163881 - 2360 47.616105 -117.7307 11/3/1992 182 30 182 Domestic Wanapum 60 60+ EWU
163975 - 2420 47.59285 -117.59408 8/7/1973 180 31 180 Domestic Wanapum 100 20 EWU
164297 - 2165 47.677421 -117.52605 4/26/1993 400 18 400 Domestic Grande Ronde 345 25 EWU
164862 - 2160 47.695398 -117.5048 10/25/1988 540 298 540 Domestic Grande Ronde 360 5 EWU
165140 - 1995 47.702864 -117.58549 - 175 48 175 Domestic Overburden 115 50+ EWU
165243 - 2410 47.578262 -117.61023 8/28/1992 100 39 100 Domestic Wanapum 30 24 EWU
Table 2 Wells with Supplemental Data
Well ID‐primary well identifier used in project (where possible Ecology Well Log Id used); Well Tag‐Ecology Well Tag ID; Elevation‐Elevation in ft. above MSL derived from USGS DEM; Open Interval‐depth below groundsurface (bgs) of top and bottom of interval open to formation if two numbers are listed there are two open intervals;Hydrogeologic Unit ‐ interpreted hydrogeologic formation which the well draws water from;
Static Water Level‐static water level recorded on well drillers log, often at the time of construction; Yield ‐ well yield in gallons per minute recorded on well drillers log; Organization ‐ organization that collected the data
Well ID Well Tag Elevation Latitude LongitudeDate of Well
ConstructionOrganization
Total
Depth
Open IntervalWell Type
Hydrogeologic
Unit
Static Water
LevelYield
T‐6

Top Bottom
167674 - 2370 47.666596 -117.682 4/10/1976 60 26 60 Domestic Wanapum 15 20 EWU168213 - 2380 47.680939 -117.62263 10/20/1984 225 0 30 Domestic Wanapum 30 70+ EWU
169122 - 2220 47.691821 -117.52099 8/31/1989 527 431 527 Domestic Grande Ronde 120 5 EWU
169441 - 2420 47.655726 -117.66577 3/24/1977 150 77 150 Domestic Wanapum 56 20 EWU
169800 - 2250 47.706407 -117.55854 7/6/1990 302 260 302 Domestic Grande Ronde 250 15 EWU
170008 - 2360 47.581984 -117.64774 9/21/1987 140 43 140 Domestic Basement 10 150 EWU
170280 - 2255 47.659145 -117.49403 5/8/1989 302 200 302 Domestic Grande Ronde 243 17 EWU
170959 - 2375 47.60669 -117.61561 3/22/1978 225 20 225 Domestic Wanapum 21 20 EWU
171796 - 2140 47.695435 -117.53175 8/6/1979 370 357 367 Domestic Overburden 356 3.5 EWU
171979 - 2370 47.677439 -117.6765 12/29/1982 150 19 150 Domestic undetermined 45 50 EWU
172268 - 2310 47.673722 -117.56914 8/7/1979 283 282 283 Domestic Overburden 240 15 EWU
172509 - 2410 47.606628 -117.57796 12/2/1983 60 19 60 Domestic Wanapum 23 25 EWU
173811 - 2380 47.597096 -117.61566 10/25/1985 171 31 170 Domestic Wanapum 29 100 EWU
174062 - 2405 47.563649 -117.61557 4/21/1977 153 50 153 Domestic Basement 50 15 EWU
174533 - 2360 47.637446 -117.56356 11/19/1988 242 76 242 Domestic undetermined 53 15 EWU
174644 - 2265 47.684518 -117.59056 12/3/1993 225 341 358 Domestic Grande Ronde 311 15 EWU
293463 - 2370 47.589214 -117.62629 2/24/1988 125 18 125 Domestic Wanapum 12 20 EWU
344216 AAJ804 2180 47.709826 -117.51037 6/20/1994 782 767 781 Domestic Basement 550 20 EWU
163119 & 163120 2460 47.619421 -117.68752 11/20/1984 200 60 200 Domestic Wanapum 150 12+ EWU
Yield OrganizationTotal
Depth
Open IntervalWell Type
Hydrogeologic
Unit
Static Water
Level
Table 2 Wells with Supplemental Data
Well ID‐primary well identifier used in project (where possible Ecology Well Log Id used); Well Tag‐Ecology Well Tag ID; Elevation‐Elevation in ft. above MSL derived from USGS DEM; Open Interval‐depth below groundsurface (bgs) of top and bottom of interval open to formation if two numbers are listed there are two open intervals;Hydrogeologic Unit ‐ interpreted hydrogeologic formation which the well draws water from;
Static Water Level‐static water level recorded on well drillers log, often at the time of construction; Yield ‐ well yield in gallons per minute recorded on well drillers log; Organization ‐ organization that collected the data
Well ID Well Tag Elevation Latitude LongitudeDate of Well
Construction
T‐7
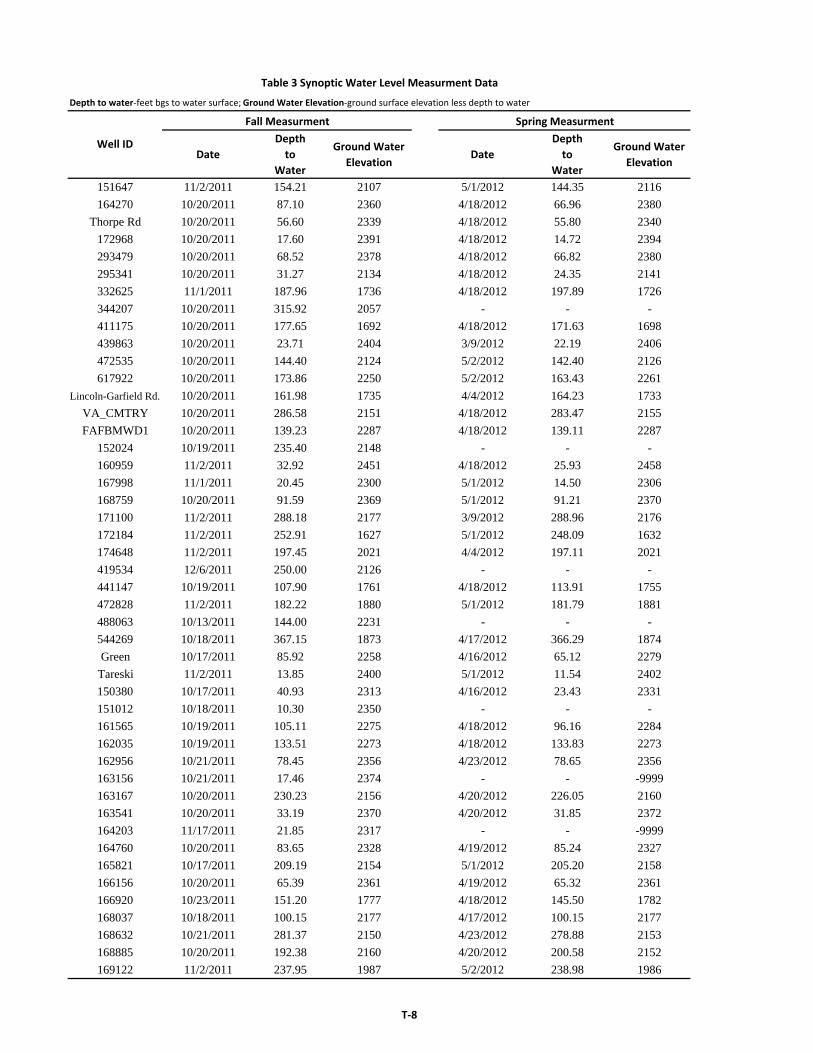
Date
Depth
to
Water
Ground Water
ElevationDate
Depth
to
Water
Ground Water
Elevation
151647 11/2/2011 154.21 2107 5/1/2012 144.35 2116
164270 10/20/2011 87.10 2360 4/18/2012 66.96 2380
Thorpe Rd 10/20/2011 56.60 2339 4/18/2012 55.80 2340
172968 10/20/2011 17.60 2391 4/18/2012 14.72 2394
293479 10/20/2011 68.52 2378 4/18/2012 66.82 2380
295341 10/20/2011 31.27 2134 4/18/2012 24.35 2141
332625 11/1/2011 187.96 1736 4/18/2012 197.89 1726
344207 10/20/2011 315.92 2057 - - -
411175 10/20/2011 177.65 1692 4/18/2012 171.63 1698
439863 10/20/2011 23.71 2404 3/9/2012 22.19 2406
472535 10/20/2011 144.40 2124 5/2/2012 142.40 2126
617922 10/20/2011 173.86 2250 5/2/2012 163.43 2261
Lincoln-Garfield Rd. 10/20/2011 161.98 1735 4/4/2012 164.23 1733
VA_CMTRY 10/20/2011 286.58 2151 4/18/2012 283.47 2155
FAFBMWD1 10/20/2011 139.23 2287 4/18/2012 139.11 2287
152024 10/19/2011 235.40 2148 - - -
160959 11/2/2011 32.92 2451 4/18/2012 25.93 2458
167998 11/1/2011 20.45 2300 5/1/2012 14.50 2306
168759 10/20/2011 91.59 2369 5/1/2012 91.21 2370
171100 11/2/2011 288.18 2177 3/9/2012 288.96 2176
172184 11/2/2011 252.91 1627 5/1/2012 248.09 1632
174648 11/2/2011 197.45 2021 4/4/2012 197.11 2021
419534 12/6/2011 250.00 2126 - - -
441147 10/19/2011 107.90 1761 4/18/2012 113.91 1755
472828 11/2/2011 182.22 1880 5/1/2012 181.79 1881
488063 10/13/2011 144.00 2231 - - -
544269 10/18/2011 367.15 1873 4/17/2012 366.29 1874
Green 10/17/2011 85.92 2258 4/16/2012 65.12 2279
Tareski 11/2/2011 13.85 2400 5/1/2012 11.54 2402
150380 10/17/2011 40.93 2313 4/16/2012 23.43 2331
151012 10/18/2011 10.30 2350 - - -
161565 10/19/2011 105.11 2275 4/18/2012 96.16 2284
162035 10/19/2011 133.51 2273 4/18/2012 133.83 2273
162956 10/21/2011 78.45 2356 4/23/2012 78.65 2356
163156 10/21/2011 17.46 2374 - - -9999
163167 10/20/2011 230.23 2156 4/20/2012 226.05 2160
163541 10/20/2011 33.19 2370 4/20/2012 31.85 2372
164203 11/17/2011 21.85 2317 - - -9999
164760 10/20/2011 83.65 2328 4/19/2012 85.24 2327
165821 10/17/2011 209.19 2154 5/1/2012 205.20 2158
166156 10/20/2011 65.39 2361 4/19/2012 65.32 2361
166920 10/23/2011 151.20 1777 4/18/2012 145.50 1782
168037 10/18/2011 100.15 2177 4/17/2012 100.15 2177
168632 10/21/2011 281.37 2150 4/23/2012 278.88 2153
168885 10/20/2011 192.38 2160 4/20/2012 200.58 2152
169122 11/2/2011 237.95 1987 5/2/2012 238.98 1986
Fall Measurment Spring Measurment
Well ID
Table 3 Synoptic Water Level Measurment Data
Depth to water‐feet bgs to water surface; Ground Water Elevation‐ground surface elevation less depth to water
T‐8

Date
Depth
to
Water
Ground Water
ElevationDate
Depth
to
Water
Ground Water
Elevation
169444 10/19/2011 173.19 1690 4/18/2012 173.37 1690
169800 10/21/2011 256.57 2001 - - -
170102 10/20/2011 46.46 2389 4/20/2012 38.55 2397
170654 10/20/2011 58.83 2183 4/20/2012 58.24 2184
170761 10/20/2011 27.33 2397 5/1/2012 22.76 2401
171363 10/21/2011 16.66 2399 4/23/2012 12.50 2403
171368 10/20/2011 41.26 2377 4/19/2012 41.13 2377
171735 10/21/2011 138.44 2253 - - -
172168 10/21/2011 63.03 2396 4/23/2012 62.55 2396
172287 10/19/2011 215.73 1767 4/18/2012 212.43 1771
172372 11/2/2011 6.24 2443 4/16/2012 3.13 2446
172437 10/19/2011 40.90 2423 4/18/2012 41.45 2422
172516 10/19/2011 54.10 2395 4/18/2012 53.75 2395
172609 11/2/2011 25.02 2395 4/20/2012 21.13 2399
172674 10/21/2011 82.19 2324 4/23/2012 82.19 2324
172807 10/21/2011 249.93 2165 4/23/2012 247.76 2167
173437 10/20/2011 51.01 2363 4/19/2012 50.82 2364
174774 10/18/2011 266.37 2042 4/17/2012 265.31 2044
175087 10/20/2011 280.12 2145 4/19/2012 278.07 2147
175566 10/20/2011 7.50 2521 4/19/2012 4.82 2524
175743 10/20/2011 252.45 2187 4/19/2012 254.40 2186
176121 10/21/2011 16.08 2475 4/23/2012 15.21 2476
176286 10/20/2011 88.73 2294 4/20/2012 91.57 2291
253903 10/20/2011 278.04 2141 4/19/2012 276.19 2143
322671 10/20/2011 11.52 2310 4/19/2012 10.42 2311
330511 10/17/2011 280.72 1986 4/16/2012 280.65 1986
338961 10/17/2011 181.66 2125 4/16/2002 176.29 2131
341226 10/18/2011 39.40 2016 - - -
341409 10/20/2011 23.19 2371 4/19/2012 20.87 2374
351636 10/18/2011 305.80 1999 4/17/2012 306.95 1998
351696 10/17/2011 28.22 2378 4/16/2012 19.56 2386
351706 10/20/2011 231.19 2132 4/19/2012 230.77 2133
356801 10/20/2011 90.80 2288 4/19/2020 85.85 2293
363714 10/18/2011 297.46 1976 4/17/2012 296.07 1977
366380 10/19/2011 23.55 2346 4/18/2012 19.23 2350
367533 10/21/2011 36.18 2337 5/1/2012 34.44 2338
369725 10/18/2011 231.56 2017 4/17/2012 231.76 2017
370123 10/20/2011 208.49 2243 - - -9999
373860 10/17/2011 144.43 1981 4/17/2012 142.86 1982
373865 10/20/2011 208.29 2225 4/19/2012 208.11 2225
375775 10/20/2011 237.50 2149 4/20/2012 234.75 2152
381868 10/18/2011 324.50 2010 4/17/2012 323.63 2010
382077 10/18/2011 26.20 2266 4/19/2012 18.07 2274
382081 10/18/2011 248.53 2019 4/17/2012 248.62 2018
385958 10/20/2011 65.17 2378 4/23/2012 67.62 2375
391385 10/17/2011 81.48 2237 4/16/2012 82.09 2236
Table 3 Synoptic Water Level Measurment Data
Depth to water‐feet bgs to water surface; Ground Water Elevation‐ground surface elevation less depth to water
Well ID
Fall Measurment Spring Measurment
T‐9

Date
Depth
to
Water
Ground Water
ElevationDate
Depth
to
Water
Ground Water
Elevation
392035 10/17/2011 180.66 2142 4/16/2012 183.86 2139
407776 10/19/2011 186.28 1720 4/18/2012 188.61 1717
408089 10/20/2011 116.30 2368 4/19/2012 111.05 2373
408354 10/18/2011 143.06 1858 4/17/2012 141.63 1860
408360 - - - 4/16/2012 71.73 2306
413065 10/17/2011 47.33 2359 4/16/2012 35.31 2371
413193 10/20/2011 164.52 2130 4/19/2012 164.47 2130
413228 10/20/2011 267.25 2186 5/1/2012 282.17 2171
428174 10/19/2011 171.65 1735 4/18/2012 175.15 1732
616916 10/19/2011 12.29 2319 4/18/2012 9.19 2322
437578 10/17/2011 290.10 2134 4/16/2012 267.30 2157
445291 10/20/2011 279.70 2165 4/18/2012 276.69 2168
467958 10/21/2011 209.92 2003 5/1/2012 208.79 2004
472793 10/17/2011 243.96 2159 4/16/2012 243.22 2160
495764 10/19/2011 24.21 2349 4/18/2012 20.42 2353
498282 10/17/2011 179.41 2224 4/23/2012 179.08 2224
544369 10/17/2011 205.13 2161 4/16/2012 203.95 2162
616663 10/19/2011 12.00 2352 5/1/2012 252.95 2111
BEAIL 10/17/2011 22.11 2076 - - -
Spokane Cnty 10/12/2011 288.38 2057 2/7/2012 289.73 2055
Swanson 10/19/2011 252.35 2033 - - -
Johnson 10/17/2011 27.61 2350 4/16/2012 30.55 2347
560746 11/29/2011 24.74 2432 - - -
560732 11/29/2011 26.53 2432 - - -
560763 11/29/2011 35.91 2432 - - -
560736 11/29/2011 32.62 2432 - - -
163104 - - - 4/20/2012 123.65 2234
163547 - - - 4/17/2012 297.53 1798
189494 - - - 4/16/2012 17.16 2322
339149 - - - 4/16/2012 10.62 2321
413231 - - - 4/17/2012 15.16 2345
435794 - - - 4/20/2012 72.43 2332
436929 - - - 4/16/2012 0.00 2343
773951 - - - 4/18/2012 145.19 1783
Table 3 Synoptic Water Level Measurment Data
Depth to water‐feet bgs to water surface; Ground Water Elevation‐ground surface elevation less depth to water
Well ID
Fall Measurment Spring Measurment
T‐10

Table 5 Monthly Water Level Data
Date
Depth
to
Water
Ground
Water
Elevation
DateDepth to
Water
Ground Water
ElevationDate
Depth to
Water
Ground
Water
Elevation
11/2/2011 366.74 1873.26 10/6/2011 198.10 2021.40 10/6/2011 87.42 2258.08
12/8/2011 366.93 1873.07 11/2/2011 197.95 2021.55 11/2/2011 88.78 2256.72
1/6/2012 367.32 1872.68 12/8/2011 197.95 2021.55 12/8/2011 89.59 2255.91
2/3/2012 367.45 1872.55 1/6/2012 197.88 2021.62 1/6/2012 90.52 2254.98
4/17/2012 366.46 1873.54 2/3/2012 197.97 2021.53 2/3/2012 90.75 2254.75
6/11/2012 370.85 1869.15 3/9/2012 197.96 2021.54 3/9/2012 86.90 2258.60
7/9/2012 373.09 1866.91 4/4/2012 197.61 2021.89 4/17/2012 66.62 2278.88
8/3/2012 374.45 1865.55 6/12/2012 197.80 2021.70 5/1/2012 69.62 2275.88
9/6/2012 373.95 1866.05 7/9/2012 197.74 2021.76 6/11/2012 74.27 2271.23
10/3/2012 379.60 1860.40 8/3/2012 197.91 2021.59 7/9/2012 78.50 2267.00
11/7/2012 369.90 1870.10 9/6/2012 197.88 2021.62 8/3/2012 83.20 2262.30
12/7/2012 369.17 1870.83 10/3/2012 198.20 2021.30 9/6/2012 87.53 2257.97
1/4/2013 369.82 1870.18 11/9/2012 197.75 2021.75 10/3/2012 89.30 2256.20
2/1/2013 369.95 1870.05 12/7/2012 197.64 2021.86 11/7/2012 90.65 2254.85
3/6/2013 369.90 1870.10 1/4/2013 197.76 2021.74 12/7/2012 90.75 2254.75
4/3/2013 369.07 1870.93 2/1/2013 197.90 2021.60 1/4/2013 90.51 2254.99
5/10/2013 375.80 1865.70 3/6/2013 197.39 2022.11 2/1/2013 89.77 2255.73
5/10/2013 197.90 2021.60 3/6/2013 78.90 2266.60
4/3/2013 69.80 2275.70
5/10/2013 73.93 2271.57
Date
Depth
to
Water
Ground
Water
Elevation
DateDepth to
Water
Ground Water
ElevationDate
Depth to
Water
Ground
Water
Elevation
11/2/2011 13.85 2400.15 10/6/2011 92.03 2368.97 10/6/2011 32.36 2452.47
12/8/2011 14.16 2399.84 11/2/2011 91.72 2369.28 11/2/2011 33.42 2451.41
1/6/2012 13.18 2400.82 12/8/2011 91.26 2369.74 12/8/2011 32.80 2452.03
2/3/2012 12.32 2401.68 1/6/2012 90.99 2370.01 1/6/2012 32.36 2452.47
3/9/2012 11.76 2402.24 2/3/2012 90.86 2370.14 2/3/2012 31.92 2452.91
4/4/2012 9.93 2404.07 3/9/2012 90.63 2370.37 3/9/2012 28.68 2456.15
5/1/2012 11.54 2402.46 4/4/2012 90.45 2370.55 4/4/2012 26.50 2458.33
6/11/2012 13.58 2400.42 5/1/2012 91.21 2369.79 5/1/2012 26.95 2457.88
7/9/2012 17.58 2396.42 6/11/2012 91.02 2369.98 6/12/2012 27.59 2457.24
8/3/2012 15.31 2398.69 7/9/2012 90.26 2370.74 7/9/2012 31.29 2453.54
9/6/2012 16.48 2397.52 9/6/2012 90.36 2370.64 8/3/2012 32.10 2452.73
10/3/2012 15.42 2398.58 10/3/2012 90.96 2370.04 9/6/2012 33.10 2451.73
11/9/2012 14.28 2399.72 11/9/2012 90.77 2370.23 10/3/2012 34.68 2450.15
12/7/2012 11.89 2402.11 12/7/2012 90.62 2370.38 11/7/2012 35.41 2449.42
1/4/2013 11.64 2402.36 1/4/2013 90.7 2370.3 12/7/2012 31.03 2453.80
2/1/2013 11.56 2402.44 2/1/2013 90.87 2370.13 1/4/2013 29.90 2454.93
3/6/2013 11.33 2402.67 3/6/2013 90.99 2370.01 2/1/2013 28.66 2456.17
4/3/2013 11.62 2402.38 3/6/2013 27.50 2457.33
5/10/2013 14.62 2399.78 4/3/2013 26.71 2458.12
5/10/2013 29.15 2455.68
Table 5.1 Well 544269
Water Level Measurments
Table 5.2 Well 174648
Water Level Measurments
Table 5.3 Well Green
Water Level Measurments
Table 5.4 Well Tareski
Water Level Measurments
Table 5.5 Well 168759
Water Level Measurments
Table 5.6 Well 160959
Water Level Measurments
T‐11
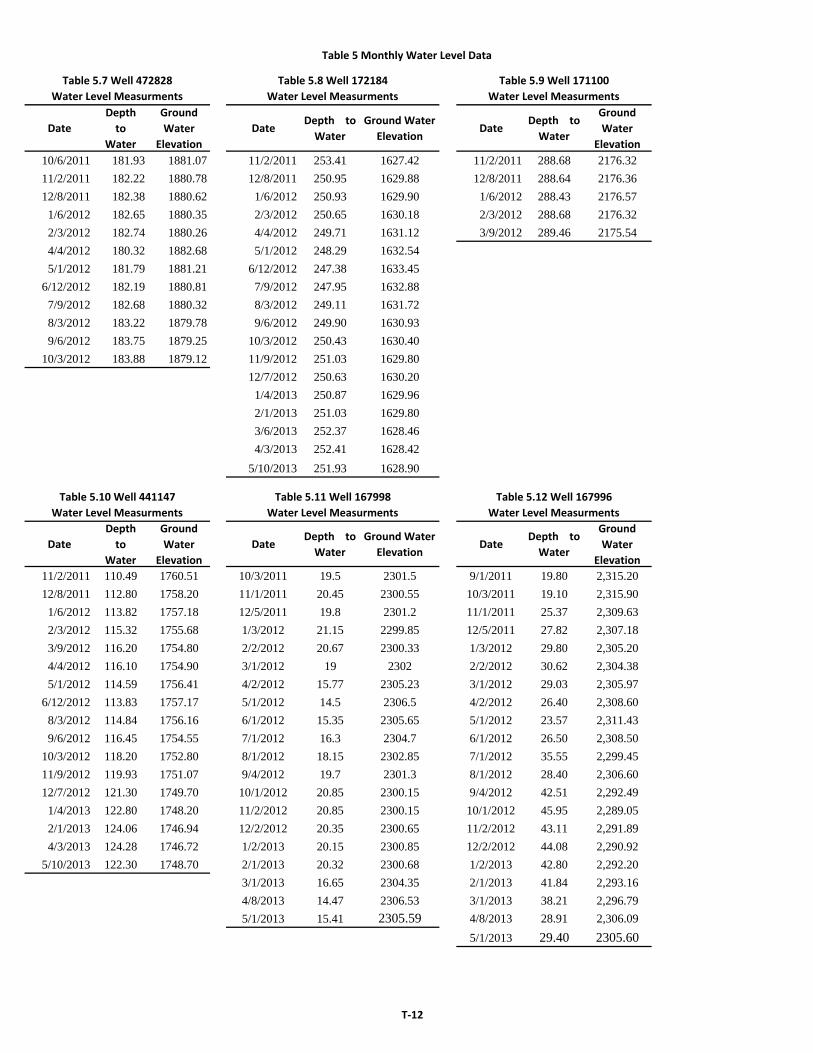
Table 5 Monthly Water Level Data
Date
Depth
to
Water
Ground
Water
Elevation
DateDepth to
Water
Ground Water
ElevationDate
Depth to
Water
Ground
Water
Elevation
10/6/2011 181.93 1881.07 11/2/2011 253.41 1627.42 11/2/2011 288.68 2176.32
11/2/2011 182.22 1880.78 12/8/2011 250.95 1629.88 12/8/2011 288.64 2176.36
12/8/2011 182.38 1880.62 1/6/2012 250.93 1629.90 1/6/2012 288.43 2176.57
1/6/2012 182.65 1880.35 2/3/2012 250.65 1630.18 2/3/2012 288.68 2176.32
2/3/2012 182.74 1880.26 4/4/2012 249.71 1631.12 3/9/2012 289.46 2175.54
4/4/2012 180.32 1882.68 5/1/2012 248.29 1632.54
5/1/2012 181.79 1881.21 6/12/2012 247.38 1633.45
6/12/2012 182.19 1880.81 7/9/2012 247.95 1632.88
7/9/2012 182.68 1880.32 8/3/2012 249.11 1631.72
8/3/2012 183.22 1879.78 9/6/2012 249.90 1630.93
9/6/2012 183.75 1879.25 10/3/2012 250.43 1630.40
10/3/2012 183.88 1879.12 11/9/2012 251.03 1629.80
12/7/2012 250.63 1630.20
1/4/2013 250.87 1629.96
2/1/2013 251.03 1629.80
3/6/2013 252.37 1628.46
4/3/2013 252.41 1628.42
5/10/2013 251.93 1628.90
Date
Depth
to
Water
Ground
Water
Elevation
DateDepth to
Water
Ground Water
ElevationDate
Depth to
Water
Ground
Water
Elevation
11/2/2011 110.49 1760.51 10/3/2011 19.5 2301.5 9/1/2011 19.80 2,315.20
12/8/2011 112.80 1758.20 11/1/2011 20.45 2300.55 10/3/2011 19.10 2,315.90
1/6/2012 113.82 1757.18 12/5/2011 19.8 2301.2 11/1/2011 25.37 2,309.63
2/3/2012 115.32 1755.68 1/3/2012 21.15 2299.85 12/5/2011 27.82 2,307.18
3/9/2012 116.20 1754.80 2/2/2012 20.67 2300.33 1/3/2012 29.80 2,305.20
4/4/2012 116.10 1754.90 3/1/2012 19 2302 2/2/2012 30.62 2,304.38
5/1/2012 114.59 1756.41 4/2/2012 15.77 2305.23 3/1/2012 29.03 2,305.97
6/12/2012 113.83 1757.17 5/1/2012 14.5 2306.5 4/2/2012 26.40 2,308.60
8/3/2012 114.84 1756.16 6/1/2012 15.35 2305.65 5/1/2012 23.57 2,311.43
9/6/2012 116.45 1754.55 7/1/2012 16.3 2304.7 6/1/2012 26.50 2,308.50
10/3/2012 118.20 1752.80 8/1/2012 18.15 2302.85 7/1/2012 35.55 2,299.45
11/9/2012 119.93 1751.07 9/4/2012 19.7 2301.3 8/1/2012 28.40 2,306.60
12/7/2012 121.30 1749.70 10/1/2012 20.85 2300.15 9/4/2012 42.51 2,292.49
1/4/2013 122.80 1748.20 11/2/2012 20.85 2300.15 10/1/2012 45.95 2,289.05
2/1/2013 124.06 1746.94 12/2/2012 20.35 2300.65 11/2/2012 43.11 2,291.89
4/3/2013 124.28 1746.72 1/2/2013 20.15 2300.85 12/2/2012 44.08 2,290.92
5/10/2013 122.30 1748.70 2/1/2013 20.32 2300.68 1/2/2013 42.80 2,292.20
3/1/2013 16.65 2304.35 2/1/2013 41.84 2,293.16
4/8/2013 14.47 2306.53 3/1/2013 38.21 2,296.79
5/1/2013 15.41 2305.59 4/8/2013 28.91 2,306.09
5/1/2013 29.40 2305.60
Table 5.7 Well 472828
Water Level Measurments
Table 5.8 Well 172184
Water Level Measurments
Table 5.9 Well 171100
Water Level Measurments
Table 5.10 Well 441147
Water Level Measurments
Table 5.11 Well 167998
Water Level Measurments
Table 5.12 Well 167996
Water Level Measurments
T‐12

Table 6 Supplmental Well Water Level Data
Date
Depth
to
Water
Ground
Water
Elevation
DateDepth to
Water
Ground Water
ElevationDate
Depth to
Water
Ground
Water
Elevation
1/21/2003 100 2275 7/10/2006 160 2215 8/10/2008 120 2255
1/29/2003 115 2260 7/26/2006 160 2215 8/25/2008 118 2257
2/7/2003 105 2270 8/10/2006 160 2215 9/10/2008 120 2255
3/15/2003 115 2260 9/9/2006 140 2235 9/25/2008 125 2250
4/17/2003 130 2245 9/25/2006 150 2225 10/10/2008 170 2205
4/23/2003 132 2243 10/10/2006 150 2225 10/25/2008 117 2258
5/6/2003 113 2262 12/28/2006 160 2215 11/10/2008 145 2230
5/13/2003 116 2259 1/10/2007 160 2215 11/25/2008 140 2235
5/27/2003 114 2261 2/13/2007 155 2220 12/10/2008 140 2235
6/11/2003 115 2260 3/10/2007 160 2215 12/28/2008 140 2235
6/30/2003 125 2250 3/25/2007 170 2205 1/11/2009 143 2232
7/15/2003 130 2245 4/10/2007 142 2233 1/25/2009 144 2231
9/17/2003 154 2221 4/26/2007 145 2230 2/10/2009 135 2240
9/23/2003 160 2215 5/10/2007 135 2240 2/25/2009 135 2240
10/7/2003 146 2229 5/28/2007 145 2230 3/10/2009 135 2240
10/16/2003 170 2205 6/5/2007 133 2242 3/25/2009 135 2240
12/10/2003 145 2230 6/27/2007 152 2223 4/6/2009 210 2165
12/28/2003 160 2215 7/10/2007 133 2242 4/24/2009 215 2160
1/10/2004 115 2260 7/25/2007 145 2230 5/10/2009 192 2183
1/30/2004 127 2248 8/10/2007 145 2230 5/25/2009 175 2200
3/29/2004 150 2225 8/25/2007 150 2225 6/10/2009 160 2215
1/25/2005 160 2215 9/11/2007 106 2269 6/25/2009 130 2245
2/11/2005 155 2220 9/25/2007 107 2268 7/10/2009 160 2215
3/16/2005 170 2205 10/10/2007 105 2270 7/25/2009 152 2223
4/12/2005 150 2225 10/24/2007 100 2275 8/10/2009 160 2215
5/25/2005 160 2215 11/9/2007 100 2275 8/26/2009 155 2220
6/29/2005 125 2250 11/25/2007 100 2275 9/10/2009 160 2215
7/16/2005 124 2251 12/8/2007 95 2280 9/25/2009 155 2220
9/28/2005 124 2251 12/25/2007 93 2282 10/10/2009 153 2222
10/11/2005 160 2215 1/10/2008 80 2295 10/26/2009 150 2225
11/8/2005 160 2215 1/26/2008 80 2295 11/10/2009 150 2225
12/5/2005 160 2215 2/10/2008 95 2280 11/25/2009 145 2230
1/3/2006 160 2215 2/26/2008 129 2246 12/11/2009 145 2230
1/30/2006 160 2215 3/10/2008 156 2219 12/25/2009 150 2225
2/14/2006 160 2215 3/25/2008 122 2253 1/11/2010 145 2230
3/7/2006 160 2215 4/10/2008 120 2255 1/19/2010 150 2225
3/21/2006 162 2213 4/25/2008 80 2295 2/10/2010 143 2232
4/11/2006 160 2215 5/10/2008 105 2270 2/25/2010 148 2227
4/25/2006 162 2213 5/25/2008 124 2251 3/10/2010 147 2228
5/10/2006 157 2218 6/11/2008 120 2255 4/10/2010 145 2230
5/31/2006 118 2257 6/24/2008 120 2255 4/25/2010 145 2230
6/14/2006 160 2215 7/10/2008 120 2255 5/10/2010 145 2230
6/26/2006 160 2215 7/25/2008 115 2260 5/27/2010 152 2223
Table 6.1 Well 488063
Water Level Measurments
Table 6.1 Well 488063
Water Level Measurments
Table 6.1 Well 488063
Water Level Measurments
T‐13

Table 6 Supplmental Well Water Level Data
Date
Depth
to
Water
Ground
Water
Elevation
DateDepth to
Water
Ground Water
ElevationDate
Depth to
Water
Ground
Water
Elevation
6/10/2010 154 2221 6/10/2012 135 2240 1/10/2010 245 2131
6/25/2010 175 2200 7/11/2012 128 2247 9/25/2010 302 2074
7/10/2010 158 2217 7/25/2012 130 2245 2/1/2011 246 2130
8/10/2010 163 2212 8/25/2012 150 2225 3/12/2011 250 2126
8/25/2010 156 2219 9/10/2012 138 2237 6/25/2011 242 2134
9/10/2010 160 2215 9/25/2012 157 2218 12/6/2011 250 2126
9/25/2010 156 2219 10/10/2012 160 2215 12/10/2011 250 2126
10/11/2010 160 2215 10/25/2012 145 2230 2/11/2012 258 2118
10/26/2010 153 2222 11/10/2012 175 2200 7/5/2012 310 2066
11/9/2010 153 2222 11/25/2012 147 2228
11/25/2010 154 2221 12/10/2012 147 2228
12/10/2010 157 2218 12/25/2012 147 2228
1/10/2011 152 2223 1/10/2013 114 2261
1/25/2011 157 2218 1/25/2013 155 2220
2/10/2011 154 2221 2/10/2013 155 2220
2/25/2011 147 2228 2/27/2013 117 2258
3/10/2011 140 2235 3/12/2013 157 2218
3/25/2011 154 2221 3/27/2013 115 2260
4/10/2011 155 2220 4/10/2013 127 2248
4/25/2011 150 2225 4/29/2013 137 2238
5/15/2011 128 2247
5/25/2011 125 2250
6/10/2011 128 2247
6/25/2011 128 2247
7/10/2011 152 2223
7/25/2011 130 2245
8/10/2011 135 2240
8/26/2011 135 2240
9/10/2011 135 2240
9/25/2011 136 2239
10/13/2011 144 2231
10/25/2011 150 2225
11/18/2011 148 2227
11/25/2011 137 2238
12/10/2011 132 2243
12/25/2011 140 2235
1/10/2012 130 2245
1/25/2012 140 2235
2/10/2012 132 2243
2/25/2012 153 2222
3/10/2012 143 2232
3/25/2012 149 2226
4/10/2012 130 2245
4/25/2012 138 2237
5/1/2012 150 2225
Table 6.1 Well 488063
Water Level Measurments
Table 6.1 Well 488063
Water Level Measurments
Table 6.2 Well 419534
Water Level Measurments
T‐14

Table 6 Supplmental Well Water Level Data
Date
Depth
to
Water
Ground
Water
Elevation
DateDepth to
Water
Ground Water
ElevationDate
Depth to
Water
Ground
Water
Elevation
4/1/1955 177 2261 10/4/2010 141.58 2284.42 1/16/1961 160 2223
4/20/2007 282.05 2155.95 6/28/2012 140.94 2285.06 12/15/1992 213 2170
4/23/2007 282.60 2155.40 4/1/1993 221 2162
7/18/2007 288.00 2150.00 9/15/1993 209 2174
6/4/2008 284.75 2153.25 12/15/1993 210 2173
10/4/2010 288.91 2149.09 6/15/1994 219 2164
6/28/2012 286.59 2151.41
Date
Depth
to
Water
Ground
Water
Elevation
DateDepth to
Water
Ground Water
Elevation
9/1/1957 160 2223 4/11/1975 165 2202
5/12/1966 165 2218 1/23/1976 162 2205
1/10/1967 162 2221 2/17/1977 168 2199
2/22/1967 166 2217 4/26/1977 165 2202
3/22/1967 161 2222 2/15/1978 171 2196
5/8/1967 159 2224 10/10/1979 179 2188
7/7/1967 168 2215 3/21/1980 175.7 2191.3
9/7/1967 165 2218 12/4/1980 180.9 2186.1
10/19/1967 169 2214 3/24/1981 177.4 2189.6
1/2/1968 168 2215 5/27/1981 185 2182
2/26/1968 166 2217 10/23/1981 185.5 2181.5
4/22/1968 168 2215 3/26/1982 176.7 2190.3
6/26/1968 168 2215 10/15/1982 183.2 2183.8
8/27/1968 164 2219 3/29/1983 179.5 2187.5
10/22/1968 164 2219 10/6/1983 191.3 2175.7
4/21/1969 167 2216 4/6/1984 180 2187
7/3/1969 166 2217 11/7/1984 185.5 2181.5
8/28/1969 172 2211 4/25/1985 182 2185
10/28/1969 166 2217 10/14/1985 192.5 2174.5
1/23/1976 174 2209 4/17/1986 186.5 2180.5
2/17/1977 179 2204 10/21/1986 192.5 2174.5
4/28/1987 186.5 2180.5
10/21/1987 192.5 2174.5
4/21/1988 187.8 2179.2
5/9/1988 178 2189
10/11/1988 195.9 2171.1
5/1/1989 191.3 2175.7
10/4/1989 193.6 2173.4
Table 6.3 Well VA_CMTRY
Water Level Measurments
Table 6.4 Well FAFBMWD1
Water Level Measurments
Table 6.5 Well 152024
Water Level Measurments
Table 6.6 Well 292881
Water Level Measurments
Table 6.7 Well 153821
Water Level Measurments
T‐15

Table 6 Supplmental Well Water Level Data
Date
Depth
to
Water
Ground
Water
Elevation
DateDepth to
Water
Ground Water
ElevationDate
Depth to
Water
Ground
Water
Elevation
10/10/1992 30.21 2426.23 37117.00 24.82 2431.54 10/10/1992 34.76 2423.49
3/17/1993 24.50 2431.94 37179.00 26.48 2429.88 3/17/1993 26.46 2431.79
4/1/1993 22.85 2433.59 37298.00 22.88 2433.48 4/1/1993 25.14 2433.11
4/12/1993 22.72 2433.72 37382.00 21.68 2434.68 4/12/1993 24.81 2433.44
6/29/1993 24.07 2432.37 37480.00 23.60 2432.76 6/30/1993 25.44 2432.81
10/8/1993 26.53 2429.91 37578.00 26.31 2430.05 10/8/1993 27.40 2430.85
2/24/1994 27.95 2428.49 37690.00 22.78 2433.58 2/24/1994 29.16 2429.09
5/12/1994 28.30 2428.14 37775.00 22.52 2433.84 5/12/1994 29.49 2428.76
9/8/1994 28.63 2427.81 37872.00 23.90 2432.46 9/8/1994 31.36 2426.89
12/19/1994 28.38 2428.06 37956.00 25.72 2430.64 12/19/1994 29.65 2428.60
3/31/1995 20.47 2435.97 37956.00 25.72 2430.64 3/31/1995 22.40 2435.85
7/17/1995 23.49 2432.95 38033.00 23.59 2432.77 7/17/1995 24.75 2433.50
10/9/1995 25.50 2430.94 38124.00 22.92 2433.44 10/9/1995 26.66 2431.59
12/18/1995 24.18 2432.26 38181.00 20.29 2436.07 12/18/1995 25.83 2432.42
3/18/1996 19.68 2436.76 38320.00 26.54 2429.82 3/18/1996 21.60 2436.65
6/19/1996 22.19 2434.16 38404.00 25.41 2430.95 6/19/1996 23.61 2434.70
8/19/1996 24.35 2432.00 38489.00 24.50 2431.86 8/19/1996 25.48 2432.83
9/20/1996 25.06 2431.29 38588.00 24.40 2431.96 9/20/1996 26.26 2432.05
10/18/1996 26.18 2430.17 38691.00 26.64 2429.72 10/18/1996 27.49 2430.82
10/22/1996 25.87 2430.48 38776.00 20.17 2436.19 10/23/1996 27.05 2431.26
11/26/1996 24.37 2431.98 38873.00 20.99 2435.37 11/26/1996 25.95 2432.36
12/19/1996 21.23 2435.12 38951.00 19.12 2437.24 12/19/1996 23.33 2434.98
1/16/1997 18.72 2437.64 39063.00 24.65 2431.71 1/16/1997 20.49 2437.60
2/24/1997 18.06 2438.30 39118.00 23.82 2432.54 2/5/1997 20.15 2437.94
3/18/1997 17.73 2438.63 39237.00 22.45 2433.91 2/6/1997 20.13 2437.96
7/15/1997 22.02 2434.34 39384.00 25.62 2430.74 2/10/1997 20.28 2437.81
10/14/1997 25.10 2431.26 39622.00 22.13 2434.23 2/14/1997 20.39 2437.70
1/5/1998 25.21 2431.15 39770.00 26.00 2430.36 2/24/1997 19.87 2438.22
5/5/1998 22.96 2433.40 39972.00 22.13 2434.23 2/25/1997 19.67 2438.42
7/22/1998 23.80 2432.56 40126.00 25.13 2431.23 2/26/1997 19.50 2438.59
10/14/1998 25.52 2430.84 40350.00 22.85 2433.51 3/18/1997 19.66 2438.43
1/18/1999 23.43 2432.93 40437.00 24.52 2431.84 7/15/1997 23.56 2434.53
4/27/1999 20.79 2435.57 40518.00 25.27 2431.09 10/14/1997 26.33 2431.76
8/4/1999 23.38 2432.98 40612.00 19.67 2436.69 1/5/1998 26.59 2431.50
12/3/1999 25.36 2431.00 40700.00 19.91 2436.45 5/5/1998 24.63 2433.46
2/25/2000 21.20 2435.16 40779.00 22.51 2433.85 7/22/1998 25.16 2432.93
5/23/2000 21.04 2435.32 40876.00 24.74 2431.62 10/14/1998 26.79 2431.30
7/11/2000 22.28 2434.08 1/18/1999 24.96 2433.13
8/21/2000 23.44 2432.92 4/27/1999 22.42 2435.67
11/6/2000 25.52 2430.84 8/4/1999 24.88 2433.21
2/20/2001 27.40 2428.96 12/3/1999 26.82 2431.27
5/15/2001 24.15 2432.21 2/25/2000 23.30 2434.79
Table 6.8 Well 560746
Water Level Measurments
Table 6.8 Well 560746
Water Level Measurments
Table 6.9 Well 560732
Water Level Measurments
T‐16
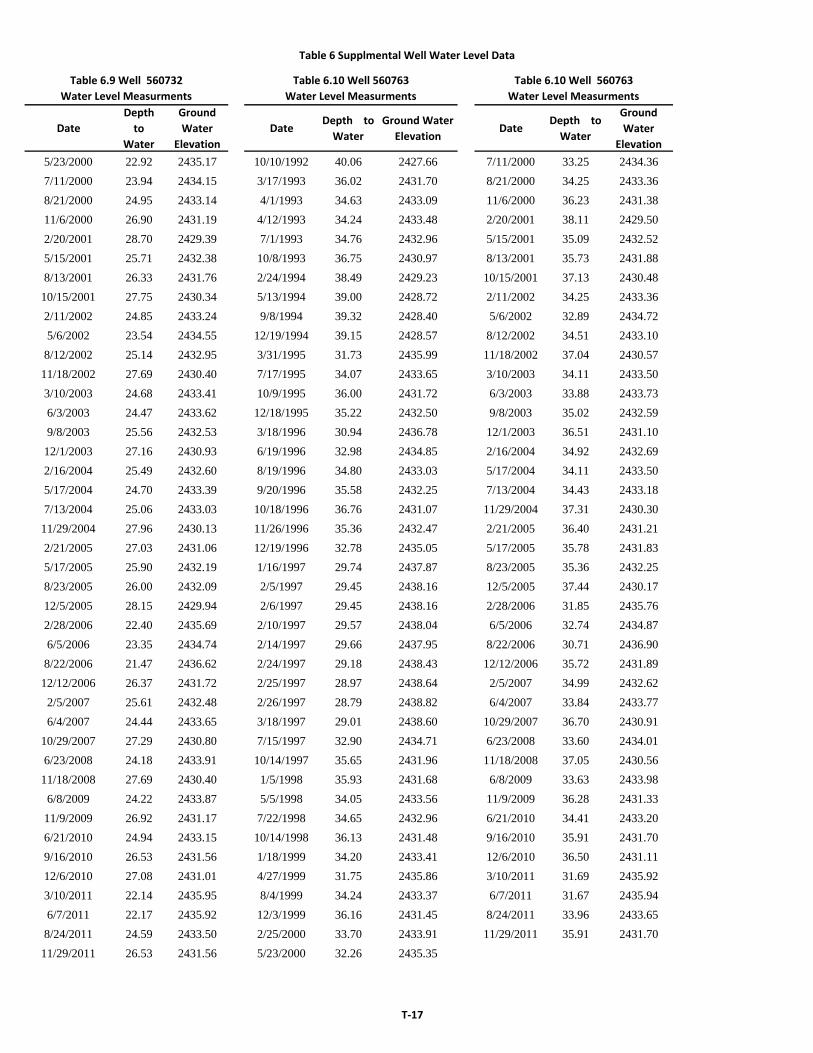
Table 6 Supplmental Well Water Level Data
Date
Depth
to
Water
Ground
Water
Elevation
DateDepth to
Water
Ground Water
ElevationDate
Depth to
Water
Ground
Water
Elevation
5/23/2000 22.92 2435.17 10/10/1992 40.06 2427.66 7/11/2000 33.25 2434.36
7/11/2000 23.94 2434.15 3/17/1993 36.02 2431.70 8/21/2000 34.25 2433.36
8/21/2000 24.95 2433.14 4/1/1993 34.63 2433.09 11/6/2000 36.23 2431.38
11/6/2000 26.90 2431.19 4/12/1993 34.24 2433.48 2/20/2001 38.11 2429.50
2/20/2001 28.70 2429.39 7/1/1993 34.76 2432.96 5/15/2001 35.09 2432.52
5/15/2001 25.71 2432.38 10/8/1993 36.75 2430.97 8/13/2001 35.73 2431.88
8/13/2001 26.33 2431.76 2/24/1994 38.49 2429.23 10/15/2001 37.13 2430.48
10/15/2001 27.75 2430.34 5/13/1994 39.00 2428.72 2/11/2002 34.25 2433.36
2/11/2002 24.85 2433.24 9/8/1994 39.32 2428.40 5/6/2002 32.89 2434.72
5/6/2002 23.54 2434.55 12/19/1994 39.15 2428.57 8/12/2002 34.51 2433.10
8/12/2002 25.14 2432.95 3/31/1995 31.73 2435.99 11/18/2002 37.04 2430.57
11/18/2002 27.69 2430.40 7/17/1995 34.07 2433.65 3/10/2003 34.11 2433.50
3/10/2003 24.68 2433.41 10/9/1995 36.00 2431.72 6/3/2003 33.88 2433.73
6/3/2003 24.47 2433.62 12/18/1995 35.22 2432.50 9/8/2003 35.02 2432.59
9/8/2003 25.56 2432.53 3/18/1996 30.94 2436.78 12/1/2003 36.51 2431.10
12/1/2003 27.16 2430.93 6/19/1996 32.98 2434.85 2/16/2004 34.92 2432.69
2/16/2004 25.49 2432.60 8/19/1996 34.80 2433.03 5/17/2004 34.11 2433.50
5/17/2004 24.70 2433.39 9/20/1996 35.58 2432.25 7/13/2004 34.43 2433.18
7/13/2004 25.06 2433.03 10/18/1996 36.76 2431.07 11/29/2004 37.31 2430.30
11/29/2004 27.96 2430.13 11/26/1996 35.36 2432.47 2/21/2005 36.40 2431.21
2/21/2005 27.03 2431.06 12/19/1996 32.78 2435.05 5/17/2005 35.78 2431.83
5/17/2005 25.90 2432.19 1/16/1997 29.74 2437.87 8/23/2005 35.36 2432.25
8/23/2005 26.00 2432.09 2/5/1997 29.45 2438.16 12/5/2005 37.44 2430.17
12/5/2005 28.15 2429.94 2/6/1997 29.45 2438.16 2/28/2006 31.85 2435.76
2/28/2006 22.40 2435.69 2/10/1997 29.57 2438.04 6/5/2006 32.74 2434.87
6/5/2006 23.35 2434.74 2/14/1997 29.66 2437.95 8/22/2006 30.71 2436.90
8/22/2006 21.47 2436.62 2/24/1997 29.18 2438.43 12/12/2006 35.72 2431.89
12/12/2006 26.37 2431.72 2/25/1997 28.97 2438.64 2/5/2007 34.99 2432.62
2/5/2007 25.61 2432.48 2/26/1997 28.79 2438.82 6/4/2007 33.84 2433.77
6/4/2007 24.44 2433.65 3/18/1997 29.01 2438.60 10/29/2007 36.70 2430.91
10/29/2007 27.29 2430.80 7/15/1997 32.90 2434.71 6/23/2008 33.60 2434.01
6/23/2008 24.18 2433.91 10/14/1997 35.65 2431.96 11/18/2008 37.05 2430.56
11/18/2008 27.69 2430.40 1/5/1998 35.93 2431.68 6/8/2009 33.63 2433.98
6/8/2009 24.22 2433.87 5/5/1998 34.05 2433.56 11/9/2009 36.28 2431.33
11/9/2009 26.92 2431.17 7/22/1998 34.65 2432.96 6/21/2010 34.41 2433.20
6/21/2010 24.94 2433.15 10/14/1998 36.13 2431.48 9/16/2010 35.91 2431.70
9/16/2010 26.53 2431.56 1/18/1999 34.20 2433.41 12/6/2010 36.50 2431.11
12/6/2010 27.08 2431.01 4/27/1999 31.75 2435.86 3/10/2011 31.69 2435.92
3/10/2011 22.14 2435.95 8/4/1999 34.24 2433.37 6/7/2011 31.67 2435.94
6/7/2011 22.17 2435.92 12/3/1999 36.16 2431.45 8/24/2011 33.96 2433.65
8/24/2011 24.59 2433.50 2/25/2000 33.70 2433.91 11/29/2011 35.91 2431.70
11/29/2011 26.53 2431.56 5/23/2000 32.26 2435.35
Table 6.9 Well 560732
Water Level Measurments
Table 6.10 Well 560763
Water Level Measurments
Table 6.10 Well 560763
Water Level Measurments
T‐17
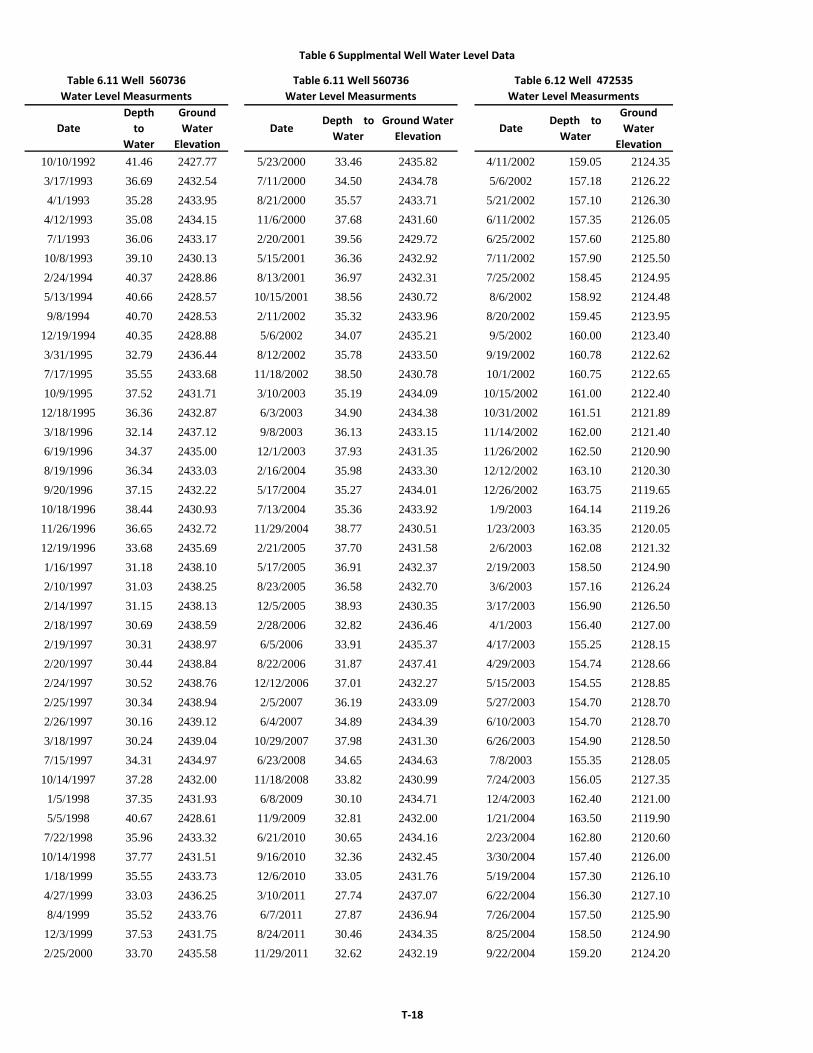
Table 6 Supplmental Well Water Level Data
Date
Depth
to
Water
Ground
Water
Elevation
DateDepth to
Water
Ground Water
ElevationDate
Depth to
Water
Ground
Water
Elevation
10/10/1992 41.46 2427.77 5/23/2000 33.46 2435.82 4/11/2002 159.05 2124.35
3/17/1993 36.69 2432.54 7/11/2000 34.50 2434.78 5/6/2002 157.18 2126.22
4/1/1993 35.28 2433.95 8/21/2000 35.57 2433.71 5/21/2002 157.10 2126.30
4/12/1993 35.08 2434.15 11/6/2000 37.68 2431.60 6/11/2002 157.35 2126.05
7/1/1993 36.06 2433.17 2/20/2001 39.56 2429.72 6/25/2002 157.60 2125.80
10/8/1993 39.10 2430.13 5/15/2001 36.36 2432.92 7/11/2002 157.90 2125.50
2/24/1994 40.37 2428.86 8/13/2001 36.97 2432.31 7/25/2002 158.45 2124.95
5/13/1994 40.66 2428.57 10/15/2001 38.56 2430.72 8/6/2002 158.92 2124.48
9/8/1994 40.70 2428.53 2/11/2002 35.32 2433.96 8/20/2002 159.45 2123.95
12/19/1994 40.35 2428.88 5/6/2002 34.07 2435.21 9/5/2002 160.00 2123.40
3/31/1995 32.79 2436.44 8/12/2002 35.78 2433.50 9/19/2002 160.78 2122.62
7/17/1995 35.55 2433.68 11/18/2002 38.50 2430.78 10/1/2002 160.75 2122.65
10/9/1995 37.52 2431.71 3/10/2003 35.19 2434.09 10/15/2002 161.00 2122.40
12/18/1995 36.36 2432.87 6/3/2003 34.90 2434.38 10/31/2002 161.51 2121.89
3/18/1996 32.14 2437.12 9/8/2003 36.13 2433.15 11/14/2002 162.00 2121.40
6/19/1996 34.37 2435.00 12/1/2003 37.93 2431.35 11/26/2002 162.50 2120.90
8/19/1996 36.34 2433.03 2/16/2004 35.98 2433.30 12/12/2002 163.10 2120.30
9/20/1996 37.15 2432.22 5/17/2004 35.27 2434.01 12/26/2002 163.75 2119.65
10/18/1996 38.44 2430.93 7/13/2004 35.36 2433.92 1/9/2003 164.14 2119.26
11/26/1996 36.65 2432.72 11/29/2004 38.77 2430.51 1/23/2003 163.35 2120.05
12/19/1996 33.68 2435.69 2/21/2005 37.70 2431.58 2/6/2003 162.08 2121.32
1/16/1997 31.18 2438.10 5/17/2005 36.91 2432.37 2/19/2003 158.50 2124.90
2/10/1997 31.03 2438.25 8/23/2005 36.58 2432.70 3/6/2003 157.16 2126.24
2/14/1997 31.15 2438.13 12/5/2005 38.93 2430.35 3/17/2003 156.90 2126.50
2/18/1997 30.69 2438.59 2/28/2006 32.82 2436.46 4/1/2003 156.40 2127.00
2/19/1997 30.31 2438.97 6/5/2006 33.91 2435.37 4/17/2003 155.25 2128.15
2/20/1997 30.44 2438.84 8/22/2006 31.87 2437.41 4/29/2003 154.74 2128.66
2/24/1997 30.52 2438.76 12/12/2006 37.01 2432.27 5/15/2003 154.55 2128.85
2/25/1997 30.34 2438.94 2/5/2007 36.19 2433.09 5/27/2003 154.70 2128.70
2/26/1997 30.16 2439.12 6/4/2007 34.89 2434.39 6/10/2003 154.70 2128.70
3/18/1997 30.24 2439.04 10/29/2007 37.98 2431.30 6/26/2003 154.90 2128.50
7/15/1997 34.31 2434.97 6/23/2008 34.65 2434.63 7/8/2003 155.35 2128.05
10/14/1997 37.28 2432.00 11/18/2008 33.82 2430.99 7/24/2003 156.05 2127.35
1/5/1998 37.35 2431.93 6/8/2009 30.10 2434.71 12/4/2003 162.40 2121.00
5/5/1998 40.67 2428.61 11/9/2009 32.81 2432.00 1/21/2004 163.50 2119.90
7/22/1998 35.96 2433.32 6/21/2010 30.65 2434.16 2/23/2004 162.80 2120.60
10/14/1998 37.77 2431.51 9/16/2010 32.36 2432.45 3/30/2004 157.40 2126.00
1/18/1999 35.55 2433.73 12/6/2010 33.05 2431.76 5/19/2004 157.30 2126.10
4/27/1999 33.03 2436.25 3/10/2011 27.74 2437.07 6/22/2004 156.30 2127.10
8/4/1999 35.52 2433.76 6/7/2011 27.87 2436.94 7/26/2004 157.50 2125.90
12/3/1999 37.53 2431.75 8/24/2011 30.46 2434.35 8/25/2004 158.50 2124.90
2/25/2000 33.70 2435.58 11/29/2011 32.62 2432.19 9/22/2004 159.20 2124.20
Table 6.11 Well 560736
Water Level Measurments
Table 6.11 Well 560736
Water Level Measurments
Table 6.12 Well 472535
Water Level Measurments
T‐18

Table 6 Supplmental Well Water Level Data
Date
Depth
to
Water
Ground
Water
Elevation
DateDepth to
Water
Ground Water
Elevation
10/20/2004 160.10 2123.30 8/21/2009 151.40 2132.0
11/23/2004 160.90 2122.50 9/29/2009 152.20 2131.2
12/21/2004 163.00 2120.40 10/28/2009 153.70 2129.7
1/26/2005 163.60 2119.8 11/30/2009 155.30 2128.1
2/15/2005 163.60 2119.8 5/28/2010 154.60 2128.8
3/30/2005 163.60 2119.8 6/29/2010 153.90 2129.5
4/29/2005 166.10 2117.3 7/29/2010 154.60 2128.8
5/25/2005 164.10 2119.3 8/25/2010 155.20 2128.2
6/27/2005 163.30 2120.1 9/29/2010 155.60 2127.8
8/4/2005 163.60 2119.8 11/5/2010 155.00 2128.4
8/30/2005 164.40 2119 3/29/2011 147.50 2135.9
9/30/2005 165.40 2118 4/29/2011 146.90 2136.5
10/28/2005 166.80 2116.6 6/1/2011 139.00 2144.4
11/28/2005 166.20 2117.2 6/30/2011 140.50 2142.9
12/29/2005 168.40 2115 7/22/2011 142.40 2141.0
1/31/2006 168.10 2115.3 8/17/2011 143.40 2140.0
3/1/2006 166.70 2116.7 9/28/2010 145.60 2137.8
4/20/2006 149.50 2133.9 11/3/2011 148.20 2135.2
5/25/2006 149.40 2134 1/4/2012 153.40 2130.0
6/28/2006 149.40 2134
8/9/2006 151.30 2132.1
9/29/2006 154.40 2129
10/31/2006 155.10 2128.3
12/19/2006 157.20 2126.2
1/24/2007 157.70 2125.7
3/5/2007 156.30 2127.1
4/26/2007 148.70 2134.7
5/31/2007 150.40 2133
6/22/2007 151.50 2131.9
7/27/2007 152.10 2131.3
8/24/2007 154.30 2129.1
10/26/2007 158.60 2124.8
6/9/2008 149.90 2133.5
7/14/2008 143.60 2139.8
8/26/2008 153.10 2130.3
9/26/2008 155.20 2128.2
10/28/2008 156.70 2126.7
11/21/2008 158.30 2125.1
4/20/2009 146.90 2136.5
5/29/2009 147.00 2136.4
6/18/2009 147.80 2135.6
7/29/2009 148.70 2134.7
Table 6.12 Well 472535
Water Level Measurments
Table 6.12 Well 472535
Water Level Measurments
T‐19

Table 6 Supplmental Well Water Level Data
Date
Depth
to
Water
Ground Water
ElevationDate
Depth
to
Water
Ground Water
Elevation
152024 5/1/94 210 2170 9/1/94 219 2161
152942 - - - 10/18/94 13 2337
153951 5/16/94 9 2296 10/14/94 10 2295
155391 5/10/94 53 2222 10/14/94 58 2217
155971 5/2/94 59 2431 10/12/94 62 2428
155972 5/9/94 48 2382 10/12/94 50 2380
156157 5/2/94 16 2409 10/12/94 25 2400
158603 5/2/94 2 2383 10/12/94 7 2378
159725 - - - 12/1/94 125 2300
162956 5/9/94 87 2343 10/12/94 89 2341
163156 5/9/94 19 2371 10/12/94 21 2369
163263 5/10/94 162 1988 10/18/94 163 1987
163881 5/9/94 61 2299 10/12/94 59 2301
163975 5/2/94 41 2379 - - -
164297 5/17/94 283 1882 10/14/94 296 1869
164862 - - - 9/22/94 365 1795
165140 5/31/94 103 1892 10/18/94 104 1891
165243 5/3/94 27 2383 10/12/94 31 2379
165412 5/10/94 274 2146 - - -
166611 - - - 9/22/94 438 1722
167003 5/16/94 30 2280 10/14/94 32 2278
167325 5/9/94 17 2403 10/12/94 20 2400
167674 5/9/94 18 2352 10/12/94 26 2344
168213 5/3/94 41 2339 10/12/94 53 2327
169122 5/10/94 243 1977 10/18/94 238 1982
169441 5/9/94 51 2369 - - -
169800 5/15/94 258 1992 10/21/94 258 1992
170008 5/2/94 8 2352 10/12/94 10 2350
170280 5/17/94 243 2012 10/14/94 244 2011
170959 5/3/94 34 2341 10/12/94 27 2348
171796 5/23/94 337 1803 10/18/94 337 1803
171979 5/9/94 60 2310 10/12/94 71 2299
172268 5/24/94 259 2051 10/18/94 261 2049
172509 5/2/94 18 2392 10/12/94 22 2388
173811 5/3/94 32 2348 10/12/94 35 2345
174062 5/3/94 18 2387 10/12/94 21 2384
174533 5/10/94 64 2296 10/20/94 98 2262
174644 5/15/94 312 1953 10/14/94 313 1952
293463 5/3/94 9 2361 10/12/94 15 2355
344216 9/22/94 555 1625
163119 & 163120 5/16/94 63 2397
Table 6.13 Water Level Data from Deobald & Buchanan, 1995
Well ID
Spring Measurment Fall Measurment
T‐20
Top Related