


Languages
Pages
Legal

Weather Maps 1 4/7/2011
Regents Earth Science Name__________________________ Meteorology Section_____________
Weather Maps Lab #__________ Introduction: Air masses are large portions of the atmosphere that share the same properties, such as temperature and humidity. By studying a weather map, you can locate the boundaries of an air mass and find out about its properties. The movements of air masses play a large role in determining the weather over a given area. In this lab, you will construct two different weather maps using three weather variables: air pressure, temperature, and rainfall. Objectives: Students will be able to construct maps of weather variables and interpret data on weather maps based on the movement of air masses.
Materials: colored pencils
Procedure:
1. Look over the U.S. Cities Weather Data Table. The cities on the data table have been grouped according to a range of air pressures. On the weather map entitled Air Pressure and Temperature, use the assigned colors below to color in the circles for the all the cities in each
group.
• Range 1: 992.1-996.0 mb – orange
• Range 2: 996.1-1000.0 mb – green
• Range 3: 1000.1-1004.0 mb – blue
• Range 4: 1004.1-1008.0 mb – purple
• Range 5: 1008.1-1012.0 mb – red
• Range 6: 1012.1-1016.0 mb – brown
• Range 7: 1016.1-1020.0 mb – yellow
2. Once you have colored in all the circles on the map, use the different colors to help you identify where to draw isobars for 996, 1000, 1004, 1008, 1012, 1016 millibars. Use a pencil to draw and label each isobar.
3. Using the same color as the city circles, lightly shade in each belt between the isobars.
4. Find the low pressure center and label it with a “L.” Find the high pressure center and label it with an “H.”
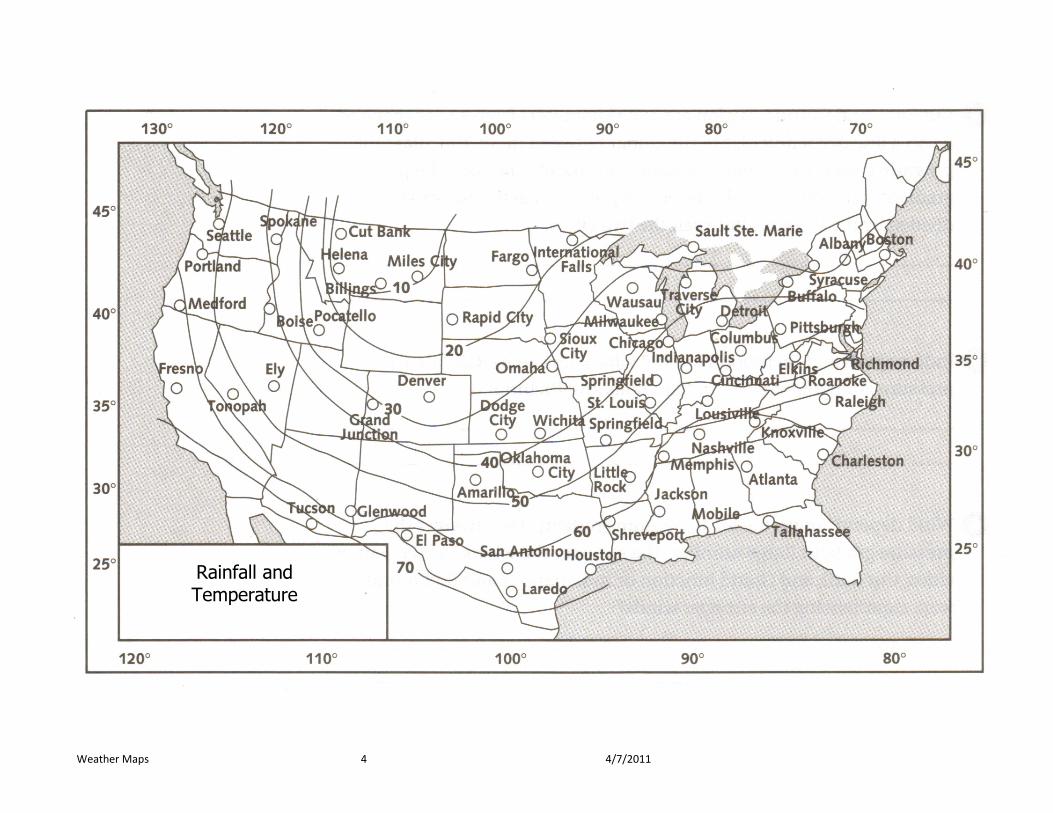
5. On the weather map entitled Rainfall and Temperature, use a red colored pencil to fill in the circles on the map for each city with an “R” (for rain) in the last column of the data table.
6. Use a pencil to carefully draw a circle that encloses all of the cities experiencing rain.
7. Draw the two fronts that are located within this circle. (HINT: fronts extend outward from a low pressure center; use the temperatures of the cities).

Weather Maps 2 4/7/2011
U.S. Cities Weather Data Table
City Air Temp. (°F)
Air Pressure
(mb)
Rain City Air Temp. (°F)
Air Pressure
(mb)
Rain
Range 1- orange Range 4- purple
Indianapolis, IN 48 995.1 R Amarillo, TX 41 1007.8
Louisville, KY 58 995.5 R Buffalo, NY 35 1004.5
Springfield, IL 45 994.9 R Charleston, SC 65 1006.2
St. Louis, MO 46 995.0 R Dodge City, KS 33 1006.5
Range 2- green El Paso, TX 62 1007.9
Chicago, IL 43 997.1 Fresno, CA 65 1007.3
Cincinnati, OH 49 997.3 R International Falls, MN 16 1007.2
Columbus, OH 45 998.3 R Laredo, TX 64 1005.2 R
Little Rock, AR 51 999.9 R Medford, OR 61 1007.9
Memphis, TN 61 998.5 R Raleigh, NC 55 1005.1 R
Milwaukee, WI 39 998.5 Richmond, VA 53 1006.1 R
Nashville, TN 62 997.4 San Antonio, TX 61 1004.8 R
Springfield, MO 44 999.5 Sault Ste. Marie, MI 28 1004.1
Range 3- blue Sioux City, IA 23 1004.2
Atlantic, GA 63 1002.6 Syracuse, NY 28 1006.8
Detroit, MI 43 1000.1 Tallahassee, FL 65 1006.1
Elkins, WV 48 1003.1 R Tonopah, NV 54 1007.8
Houston, TX 68 1003.9 Tucson, AZ 71 1007.5
Jackson, MS 67 1001.5 Range 5- red
Knoxville, TN 61 1000.5 Albany, NY 31 1008.5
Mobile, AL 68 1003.9 Boise, ID 42 1011.1
Oklahoma City, OK 43 1003.1 Boston, MA 35 1008.8
Omaha, NE 31 1003.5 Ely, NV 46 1009.5
Pittsburgh, PA 44 1002.0 R Fargo, ND 17 1008.2
Roanoke, VA 52 1003.5 R Glenwood, KS 57 1008.8
Shreveport, LA 66 1001.8 R Portland, OR 58 1008.1
Traverse City, MI 37 1001.5 Rapid City, SD 17 1011.7
Wausau, WI 32 1001.5 Seattle, WA 53 1009.1
Wichita, KS 35 1003.7 Range 6- brown
Denver, CO 25 1012.2
Grand Junction, CO 31 1013.2
Miles City, MT 9 1013.9
Pocatello, ID 29 1013.5
Spokane, WA 37 1012.8
Range 7- yellow
Billings, MT 8 1016.5
Cut Bank, MT 8 1016.3
Helena, MT 9 1016.8

Weather Maps 3 4/7/2011
Air Pressure and Temperature
Weather Maps 4 4/7/2011
Rainfall and Temperature
Weather Maps 5 4/7/2011
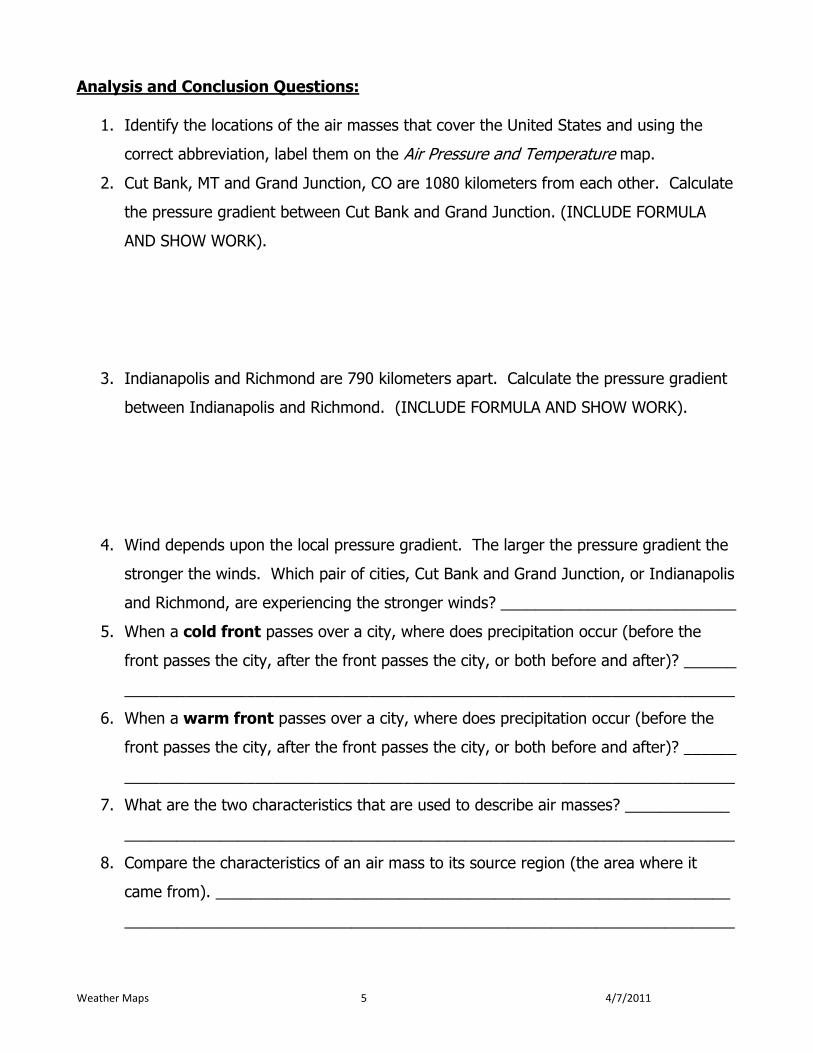
Analysis and Conclusion Questions:
1. Identify the locations of the air masses that cover the United States and using the
correct abbreviation, label them on the Air Pressure and Temperature map.
2. Cut Bank, MT and Grand Junction, CO are 1080 kilometers from each other. Calculate
the pressure gradient between Cut Bank and Grand Junction. (INCLUDE FORMULA
AND SHOW WORK).
3. Indianapolis and Richmond are 790 kilometers apart. Calculate the pressure gradient
between Indianapolis and Richmond. (INCLUDE FORMULA AND SHOW WORK).
4. Wind depends upon the local pressure gradient. The larger the pressure gradient the
stronger the winds. Which pair of cities, Cut Bank and Grand Junction, or Indianapolis
and Richmond, are experiencing the stronger winds? ___________________________
5. When a cold front passes over a city, where does precipitation occur (before the
front passes the city, after the front passes the city, or both before and after)? ______
______________________________________________________________________
6. When a warm front passes over a city, where does precipitation occur (before the
front passes the city, after the front passes the city, or both before and after)? ______
______________________________________________________________________
7. What are the two characteristics that are used to describe air masses? ____________
______________________________________________________________________
8. Compare the characteristics of an air mass to its source region (the area where it
came from). ___________________________________________________________
______________________________________________________________________
Weather Maps 6 4/7/2011
9. Describe the general weather conditions associated with a high pressure area in
terms of:
a. Temperature- ________________________________________________________
b. Wind Patterns- _______________________________________________________
c. Cloud Cover- _________________________________________________________
d. Precipitation- _________________________________________________________
10. Describe the general weather conditions associated with a low pressure area in
terms of:
a. Temperature- ________________________________________________________
b. Wind Patterns- _______________________________________________________
c. Cloud Cover- _________________________________________________________
d. Precipitation- _________________________________________________________
12. Compared to areas of low pressure, why do areas of high pressure have fewer
clouds? _______________________________________________________________
______________________________________________________________________
______________________________________________________________________
______________________________________________________________________
Weather Maps 7 4/7/2011
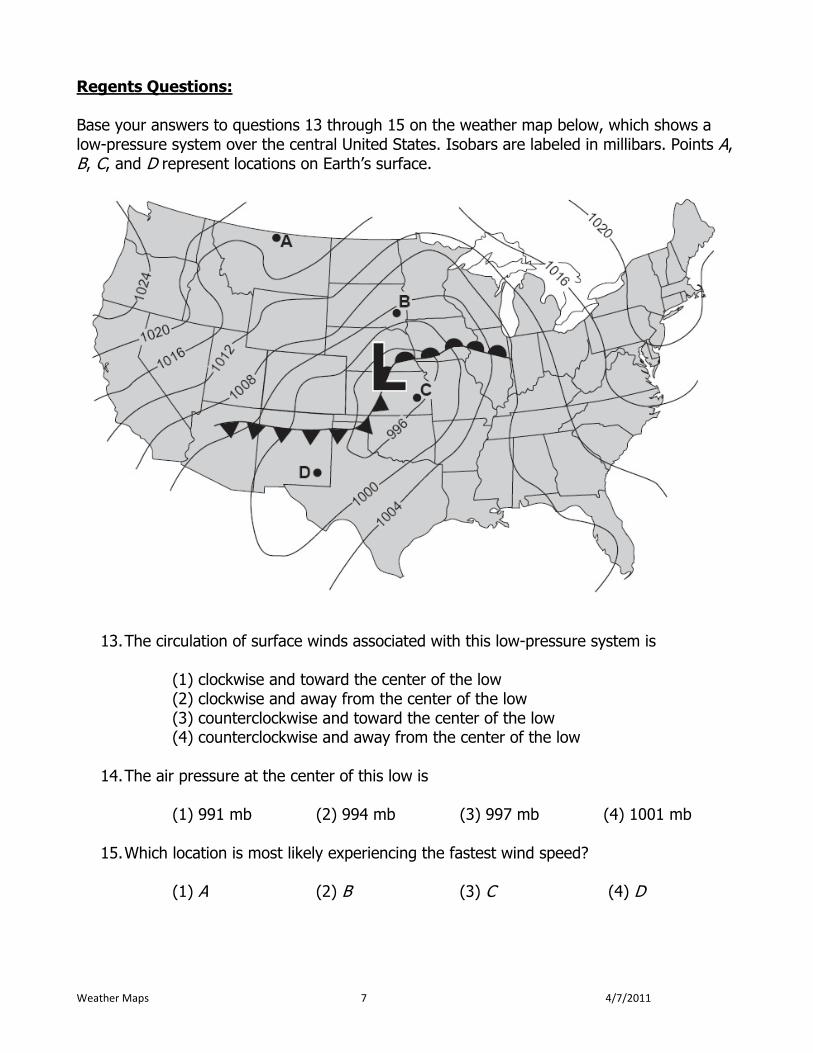
Regents Questions: Base your answers to questions 13 through 15 on the weather map below, which shows a low-pressure system over the central United States. Isobars are labeled in millibars. Points A, B, C, and D represent locations on Earth’s surface.
13. The circulation of surface winds associated with this low-pressure system is
(1) clockwise and toward the center of the low (2) clockwise and away from the center of the low (3) counterclockwise and toward the center of the low (4) counterclockwise and away from the center of the low
14. The air pressure at the center of this low is
(1) 991 mb (2) 994 mb (3) 997 mb (4) 1001 mb
15. Which location is most likely experiencing the fastest wind speed?
(1) A (2) B (3) C (4) D

Weather Maps 8 4/7/2011
Base your answers to questions 16 through 19 on the weather map in your answer booklet, which shows a low-pressure system located over central United States. Points A, B, and C represent locations on Earth’s surface. The isobars on the map show air pressures in millibars.
16. On the map above, draw an arrow, beginning at the L, to show the direction the low-
pressure center will most likely move in the next two days. [1]
17. What evidence shown on the map indicates that point B is most likely experiencing precipitation? [1]
18. What is the two-letter symbol used on a weather map to indicate the warm, moist air mass that is over point C? [1]
19. What evidence shown on the weather map indicates that point C is experiencing greater wind speeds than point A? [1]
Top Related