


Languages
Pages
Legal

2015
WATER SAFETY PLAN
Managing Drinking-Water Quality from
Catchment to Consumer
Revision No. 2

Maynilad Water Safety Plan Revision No.2 / November 2015
2
A collaboration work of the World Health Organization, Department of Health
(Philippines) and Maynilad Water Services, Inc.

Maynilad Water Safety Plan Revision No.2 / November 2015
3
TABLE OF CONTENTS
TITLE Page
Introduction 5
I. Maynilad WSP Team 8
II Water Supply and Process Description 11
A. Water Sources 13 B. Water Treatment
B.1 La Mesa Water Treatment Plant No. 1&2 B.2 Putatan Water Treatment Plant
18
C. Ground Water 37
D Distribution 44
E. Process Flow Diagram Surface Water to Distribution
La Mesa Treatment Plant No 1&2 Putatan Water Treatment Ground Water
47 49 50
III Hazard Identification and Risk Assessment 51
IV Determine and Validate Control Measures, Reassessment and Prioritization of Risks
53
V
VI
Improvement/Upgrade Plan Monitoring of the Control Measures (Operational Monitoring)
53
54
VII Verification 54
VIII Management Procedures 55
IX Supporting Program 56
X Review and Audit 57
XI Revise WSP following an Incident 58
ANNEX I Hazard Identification and Risk Assessment A. Water Source: Surface B. Water Treatment: La Mesa Water treatment Plant 1&2 C. Water Treatment: Putatan Water Treatment Plant D. Groundwater
59 61 65 69

Maynilad Water Safety Plan Revision No.2 / November 2015
4
E. Distribution
ANNEX II Determine and Validate Control Measures, Reassessment and Prioritization of Risks A. Water Source: Surface B. Water Treatment: La Mesa Water treatment Plant 1&2 C. Water Treatment: Putatan Water Treatment Plant D. Groundwater
E. Distribution ANNEX III Improvement/Upgrade Plan
A. Water Source: Surface B. Water Treatment: La Mesa Water treatment Plant 1&2 C. Water Treatment: Putatan Water Treatment Plant D. Groundwater E. Distribution
ANNEX IV Monitoring of Control Measures (Operational Monitoring)
A. Water Source: Surface B. Water Treatment: La Mesa Water treatment Plant 1&2 C. Water Treatment: Putatan Water Treatment Plant D. Groundwater E. Distribution
ANNEX V Verification
A. Water Source: Surface B. Water Treatment: La Mesa Water treatment Plant 1&2 C. Water Treatment: Putatan Water Treatment Plant D. Groundwater E. Distribution
ANNEX VI Supporting Programs
A. Water Source: Surface B. Water Treatment: La Mesa Water treatment Plant 1&2 C. Water Treatment: Putatan Water Treatment Plant D. Groundwater E. Distribution
ANNEX VII Sources of Water, Surface Water ANNEX VIII Gauging Points Threshold Limits ANNEX IX Putatan Water Treatment Plant – Standard Operating
Procedures ANNEX X Informative
70
73 76 87 96 98
102 103 106 113 114
116 118 135 141 142
144 144 146 148 149
150 151 152 153 154
156
157
188
203

Maynilad Water Safety Plan Revision No.2 / November 2015
5
INTRODUCTION
Maynilad Water Services, Inc. (Maynilad) has long recognized the need for and the
importance of the formulation of Water Safety Plans (WSP) to its core business. Even before
the Department of Health (DOH) – the Philippine regulatory agency assigned for monitoring of
water quality – has mandated the formulation of WSP in 2007, Maynilad has already sought
assistance from the DOH and the World Health Organization (WHO) in the preparation of a
WSP for its business operations. In February 2006, Maynilad organized a multi-disciplinary
WSP team coming from its various operating units to assess and develop a model WSP for its
entire system. This WSP covers the water sources, conveyance system, water treatment,
pumps and reservoir, and the distribution network up to its customers. The task is tedious
and complicated since Maynilad does not manage the watershed that acts as the main source
of its water supply. Added to this is the fact that its operation covers surface and ground
water, three different water treatment plants, various facilities and a large and complicated
distribution system network traversing several different political boundaries.
The WSP intends to guarantee that safe drinking water is available to its customers at
all times through a sound water supply practice. This is achieved by 1) preventing the
contamination of the source of the raw water and provision of programs to immediately
resolve occurrences of contamination, 2) ensuring that the final quality of water delivered to
the consuming public are routinely monitored at a defined schedule and the water quality
results meet the established health-based standards set by the DOH and 3) preventing the re-

Maynilad Water Safety Plan Revision No.2 / November 2015
6
contamination of its treated water during storage, distribution and handling until the water
reaches its customers. The WSP is described as a systematic procedure and comprehensive
plan formulated to 1) ensure that the desired water quality is met at all times at every stage of
all its operation, 2) identify parties who will be responsible to undertake the above tasks, 3)
predict events which may impair the quality of water and upset its operations 4) develop
programs that prevent the occurrence of such events and improve the system, 5) prepare
plans to manage the impacts of these events, 6) implement control and monitoring program
to assess effectiveness of the plan, 7) properly record and document the procedures and their
outcomes, 8) conduct regular review and audit of the WSP, 9) revise the plan following an
incident and 10) subject the plan to continual improvement.
The adoption of the WSP and the associated commitment of the company to the
approach translate to a number of benefits. The major benefits of developing and
implementing a water safety plan include the systematic and detailed assessment of its
processes and prioritization of hazards in all its operations and facilities, the establishment of
operational barriers to control hazardous events and the availability of contingency and
mitigating measures to cushion the impacts of these events. The WSP also provides an
organized and structured system to minimize the chances of failure of its services caused by
oversight, lapses on management or operational decisions and identifies parties responsible
for such. This process ensures the consistency of the quality of water supplied to Maynilad’s
customers and provides contingency plans to respond to system failures and unforeseeable
hazardous events and accidents, which may result in the impairment of its operations. On the

Maynilad Water Safety Plan Revision No.2 / November 2015
7
overall, the advantages can be summarized as 1) compliance with water quality targets, 2)
application of best practices to secure water safety, 3) consistent water quality and safety, 4)
plans are in place to prevent crisis scenario from water quality impairment, 5) potential
savings from avoidance of incidents and accidents, 6) improvement in asset management and
7) ensure the satisfaction of customers.
The WSP covers the operations of La Mesa Treatment Plants No. 1 & 2 where the raw
water supply source comes from the Umiray-Angat-Ipo system, the Putatan Water Treatment
Plant, which uses Laguna Lake as supply source, and the ground water supply from small
independent network.

Maynilad Water Safety Plan Revision No.2 / November 2015
8
MAYNILAD WATER SAFETY PLAN TEAM STRUCTURE
FRANCISCO A. ARELLANO Team Leader
RONALDO C. PADUA
Assistant Team Leader
KRIS G. CATANGCATANG Team Coordinator
CONSULTANTS WHO, DOH
LLDA, NWRB DENR, LGU of Norzagaray
NCIP
DISTRIBUTION
Rise Anne M. Xavier Helen B. Labaro
Mark Erwin H. Rodil Ressie D. Vicente
Josephus M. Dela Rosa Alvin Ryan C. Ong
Gian Carlo P. Reyes Judith A. Dangue
WATER TREATMENT – LMTP 1 & 2
Angelo Pablo J. Santos
Edgar P. Mati Ma. Ana E. Tria Juvelene C. Ydia
Chester Y. Del Rosario
GROUND WATER
Rodelio S. David Michael Joseph R.
Buligan Jake N. Aradanas
WATER TREATMENT- PWTP
Shiela Marie F. Afuang Ruel P. Carreos
Elmer Brent T. Cauton Romer S. Jumawan
Mark Vincent Q. Talosig Rodel Rik N. Tumandao
Benjamin C. Villa
WATER SOURCE - SURFACE
Salvador S. Leyble Herminigildo M. Medrano
London Philip L. Israel Marvin Villanueva
Anna Liza P. Porciuncula John Emmanuel B.
Martinez
I. Maynilad WSP Team

Maynilad Water Safety Plan Revision No.2 / November 2015
9
MAYNILAD WATER SAFETY PLAN TEAM
Name Organization / Department
Job Title Responsibility Telephone No.
Francisco A. Arellano CQESH SAVP, Corporate QESH Division
WSP Team Leader (02) 981-3481
Ronaldo C. Padua Water Production Head, Water Production Department
WSP Asst. Team Leader 0928-500-98-78
Kris G. Catangcatang QESH – IMS IMS Officer WSP Team Coordinator (02) 981-3436
Salvador S. Leyble Water Production-CPF Head, CPF Operations - Water source (02) 939-7477
Herminigildo H. Medrano Water Production-CPF Officer, Ipo-Bicti Headworks Operations - Water source (02) 939-7477
London Philip L. Israel Water Production-CPF PID Officer Operations - Water source (02) 939-7477
Marvin Villanueva Water Production-CPF Headworks Controller 3, CPF Operations - Water source (02) 939-7477
Anna Liza P. Porciuncula CQESH – IMS CQESH Officer Monitoring/Audit- Water source (02) 981-3436
John Emmanuel B. Martinez CQESH – EMD CQESH Officer Monitoring/Audit- Water source (02) 981-3484
Angelo Pablo J. Santos La Mesa Water Treatment Plant
Head, LMTP 1 LMTP-Water Treatment Operation
(02) 430-3199 loc. 105
Edgar P. Mati La Mesa Water Treatment Plant
Head, LMTP 2 LMTP-Water Treatment Operation
(02) 430-7324
Ma. Ana E. Tria La Mesa Water Treatment Plant
Head, Planning and Support Services
LMTP-Water Treatment Operation
(02) 430-3199 loc. 105
Juvelene C. Ydia La Mesa Water Treatment Plant
Head, Process Control LMTP-Water Treatment Process Laboratory
(02) 430-3199 loc. 110
Chester Y. Del Rosario CQESH – IMS CQESH Officer Monitoring/Audit- LMTP (02) 981-3436
Shiela Marie F. Afuang Putatan Water Treatment Plant
Officer in-Charge, PWTP PWTP Operations (02) 862-6268

Maynilad Water Safety Plan Revision No.2 / November 2015
10
Name Organization / Department
Job Title Responsibility Telephone No.
Benjamin C. Villa Putatan Water Treatment Plant
Process Control Officer PWTP Operations (02) 862-6268
Romer S. Jumawan Putatan Water Treatment Plant
Shift Officer PWTP - Water Treatment Operation
(02) 862-6268
Mark Vincent Q. Talosig Putatan Water Treatment Plant
Shift Officer PWTP - Water Treatment Operation
(02) 862-6268
Ruel P. Carreos Putatan Water Treatment Plant
Head PWTP Operations (02) 862-6268
Elmer Brent T. Cauton La Mesa Water Treatment Plant
Officer LMTP-Water Treatment Operation
(02) 430-3199 loc. 203
Rodel Rik N. Tumandao Water Supply Operations Head Water Source Management (02) 430-3199 loc. 203
Rise Anne M. Javier CQESH – Central Laboratory Head, Analytical Section Water Quality (02) 430-3199 loc. 201
Ressie D. Vicente Water Network Support Services Head Operations - Water Distribution
(02) 528-4173
Mark Erwin H. Rodil Water Network Central B / South Primary Head
Operations - Water Distribution
(02) 526-6084
Josephus M. Dela Rosa Water Network South District BDOM Head Operations - Water Distribution
(02) 526-6084
Alvin Ryan C. Ong Water Network South District BDOM Engineer Operations - Water Distribution
(02) 526-6084
Helen B. Labaro CQESH – Central Laboratory Head, Surveillance Section Water quality surveillance (02) 430-3199 loc. 201
Gian Carlo P. Reyes CQESH – Central Laboratory CQESH Officer, Analytical Water quality analysis (02) 430-3199 loc. 201
Judith A. Dangue CQESH – Central Laboratory CQESH Analyst, Analytical Water quality analysis (02) 430-3199 loc. 201
Rodelio S. David Water Network Head (Central A BDO) Operations- Groundwater (02) 526-6084

Maynilad Water Safety Plan Revision No.2 / November 2015
11
Name Organization / Department
Job Title Responsibility Telephone No.
Michael Joseph R. Buligan Water Network Engineer (South BDO) Operations-Groundwater (02) 526-6084
Jake N. Aradanas Water Network Engineer (South BDO) Operations - Groundwater (02) 526-6084

Maynilad Water Safety Plan Revision No.2 / November 2015
12
II. WATER SUPPLY and PROCESS DESCRIPTION
Maynilad is the private concessionaire that was awarded the exclusive right to take over
from the Metropolitan Waterworks and Sewerage System (MWSS), a government corporation,
the water supply and sewerage operations in the West Zone of Metro Manila. The West Zone
comprises 60% of the MWSS service population. This is a 25-year concession agreement, which
commenced on August 1, 1997 and will last up to July 31, 2022, and which has been extended
recently for another 15 years. The MWSS service area is divided into two operating zones: the
East Zone, managed by the Manila Water Company Inc. (MWCI) and the West Zone, which
Maynilad operates (Figure 1).
The West Zone concession area (Figure 2) covers a total area of 540 km2 and consists of
ten cities and one municipality in Metro Manila as well as one city and five towns in Cavite
province. At the time of the privatization, there were only around 465,000 service connections
Figure 1. MWSS Metro Manila Service Area Figure 2. Maynilad West Zone Concession Area

Maynilad Water Safety Plan Revision No.2 / November 2015
13
in the West Zone. As of September 2012, Maynilad has installed a total of 1,734,225 water
service connections covering more than 8 million people (Table 1).
Table 1. Basic Information on Maynilad Water (as of September 2012)
Information Number Unit
Total Area of Coverage 540 Sq. km.
Total Number of Customers Residential /Semi-Business Commercial/Industrial
1,056,538 995,800 60,738
Population Served 8,150,856
Total Number of House Service Connection 1,734,225
Facilities Raw Water Conveyance (CPF, from Umiray-Angat-Ipo to
La Mesa Portal) Tunnels Aqueducts Total Treatment Plant Design Capacity La Mesa Water Treatment Plant 1 Peak Capacity La Mesa Water Treatment Plant 2 Peak Capacity Putatan Water Treatment Plant Number of Reservoirs Number of Pumping Stations Number of Deepwells (operational) Total Length of Distribution Line
<200mm diameter 200mm -300mm 350 mm to 3200 mm diameter pi
3 6 2,500 1500 900 100 22 20 10 5500 4213 828 459
MLD MLD MLD MLD Km. Km. Km. Km.
Water Availability 24 hour coverage Less than 24 hour
95 5
% %
Sources of Water Surface Water (99.75%) Umiray-Angat-Ipo system Laguna Lake
Groundwater (0.25%) From small independent network
24.3* 1.03* 0.0625
CMS CMS CMS
Sampling points 866 * Average inflow per annum (refer to Annex VII for the 2011 monthly inflow of Sources of Water, Surface Water)

Maynilad Water Safety Plan Revision No.2 / November 2015
14
A. Water Sources
With the rapid increase in population of Metro Manila, the need for water supply
has greatly increased as well. The metro draws 97% of its raw water supply from the Umiray-
Angat-Ipo system in Norzagaray, Bulacan, and this has been the only source for decades. The
heart of the system is the Angat Dam, which is a multi-purpose dam and is intended for power,
irrigation and water supply. MWSS gets 4,000 MLD of water supply source from this facility and
60% of this is allocated to Maynilad. The Department of Environment and Natural Resources
(DENR) handles the maintenance of the Umiray watershed while the National Power
Corporation (NPC), the power generating company, maintains the Angat watershed and the
DENR, MWSS and the two concessionaires’, MWSI and MWCI, maintain the Ipo watershed. The
remaining 3% of raw water supply is sourced from the Laguna Lake.
The country’s water resources has a land area of 300,000 sq.km., an annual rainfall
of 2,400 mm run off collected from rainfall of 1,000 to 2000 mm and an estimated aggregate
area for groundwater reservoir of 50,000 sq.km. The surface water dependable water supply
with 80% probability is 125.79 MCM. However, only 80% of the Philippine population has
access to safe potable water.
Maynilad, as the concessionaire for the West Zone of greater Metro Manila,
recognized the increasing current and future water supply requirements and therefore sought
to develop an alternate water source to help cater to the customers, specifically in Muntinlupa,
Las Pinas and Cavite. The Laguna Lake was identified in 2009 as an alternate water source to
Angat Dam. And in 2010, a state-of the-art treatment plant was built in Barangay Putatan,
Muntinlupa, to make sure that water drawn from the lake is fit for domestic consumption.
Laguna Lake (Laguna de Bay) is the largest lake in the Philippines located east of
Metro Manila between the provinces of Laguna to the south and Rizal to the north. The
freshwater lake has a surface area of about 911 km2 (352 sq. mi), with an average depth of

Maynilad Water Safety Plan Revision No.2 / November 2015
15
about 2.8 meters (9 ft. 2 in) and an elevation of about 1 meter (3 ft. 3 in) above sea level. In
order to reduce the flooding in Manila along the Pasig River, during heavy rains, the peak water
flows of the Marikina River are diverted via the Manggahan Floodway to Laguna de Bay, which
serves as a temporary reservoir. In case the water level on the lake is higher than the Marikina
River, the flow on the floodway is reversed. In normal circumstances, both Marikina River and
the lake drain through Pasig River to Manila Bay.
The lake has been used as a navigation lane for passenger boats since the Spanish
colonial era. It is also used as a source of water for the Kalayaan Pumped Storage Power Plant in
Kalayaan, Laguna. Other uses of the lake includes fishery, aquaculture, recreation, food support
for the growing duck industry, irrigation and a "virtual" cistern for domestic, agricultural and
industrial effluents. Because of its importance in the development of the Laguna de Bay Region,
unlike other lakes in the country, its water quality and general condition are closely monitored.
At present, this important water resource has been greatly affected by development pressures
like population growth, rapid industrialization, and resources allocation.
The Angat multi-purpose dam located in Norzagaray, Bulacan has a capacity of 850
MCM with an operating level of 181 – 214M and a low level outlet at 101M. Angat watershed
area, which is in the Northern tip of the Sierra Madre Mountain ranges, has an area of about
62,000 hectares. An additional 9 cu m / sec from the Umiray trans-basin tunnel flows to Angat
daily from the Umiray River.
The watershed areas of Angat Dam and the Umiray River are under attack by intruders
and illegal loggers and their activities have resulted to mudslides and flash floods during storms
and heavy rainfall. The result of the abuse especially in the watershed of Umiray River has been
very costly. Aside from the problems for the treatment plants because of the very high
incoming raw water turbidity exceeding 1000 NTU and Manganese that is dissolved by the
raging floodwaters from the natural geological formation, lives were lost and properties were

Maynilad Water Safety Plan Revision No.2 / November 2015
16
destroyed. The activities of the Dumagat, an indigenous tribe who lives primitively in the
watershed are another source of some organic and biological pollutants of the water sources.
Water from the Angat Dam flows to the Ipo Dam through the auxiliary turbines 1, 2, 3, 4
& 5 and terminating at the La Mesa Treatment Plants (Figure 3). Angat Dam releases 41 CMS
daily from its five auxiliary turbines to Ipo Dam, which is no longer an impounding dam but a
diversionary dam. From Ipo Dam the water flows and is diverted to a series of tunnels and
aqueducts conveyance system of about 24 kms. terminating at the La Mesa portal where it is
shared by Maynilad Water’s La Mesa Treatment Plants and Manila Water’s La Mesa Reservoir /
Balara aqueducts on a 60 – 40 % split as per Concession Agreement (Figure 4).

Maynilad Water Safety Plan Revision No.2 / November 2015
17
Figure 3. Headworks and Conveyance

Maynilad Water Safety Plan Revision No.2 / November 2015
18
Figure 4. La Mesa Portal

Maynilad Water Safety Plan Revision No.2 / November 2015
19
B. Water Treatment
Maynilad operates three (3) treatment plants for water production: La Mesa Water
Treatment Plant Nos. 1 and 2 (LMTP 1 and LMTP 2) located in Quezon City and the Putatan
Water Treatment Plant in Muntinlupa.
LMTP 1 uses the standard conventional coagulation-flocculation-sedimentation, rapid gravity
dual-media filtration and chlorine gas disinfection. It has no automation and minimal
rehabilitation since its construction. It has very minimal electro-mechanical equipment and
relies mostly on hydraulic properties of water to backwash its filters and on gravity to convey
raw water from the source, into the plant and out into the distribution system. LMTP 2 also
uses coagulation-flocculation process but employs the pulsator clarifier for turbidity removal. It
undergoes single-media filtration and final disinfection by chlorination. Both systems have
capability for preliminary and post-chlorination. Both plants use alum and polyaluminum
chloride for the coagulation depending on the raw water quality and are aided by application of
polymers to enhance floc formation as pH is adjusted during coagulation, if necessary, using
caustic soda.
Putatan Water Treatment Plant is the state-of-the-art water treatment plant in
Muntinlupa which serves thousands of households in the city. The plant uses dissolved air
flotation, biological aerated filtration, microfiltration, ultrafiltration and reverse osmosis to treat
raw water from Laguna Lake. The plant has been equipped with fourteen (14) trains of
microfilters, six (6) trains of ultrafilters and six (6) trains of reverse osmosis.
The groundwater undergoes only disinfection, either through liquid chlorine or
hypochlorite solution.

Maynilad Water Safety Plan Revision No.2 / November 2015
20
B.1 La Mesa Water Treatment Plants 1 & 2
Both LMTP 1 and LMTP 2 plants are located in the La Mesa Dam compound and are ISO
9001:2008, ISO 1400:2004 and OSHAS 1800 Integrated Management System certified. This is
the proof of Maynilad’s commitment to the quality of its product, protection of the
environment, safety and health of its employees and satisfaction of its customers. The two
plants were officially conferred by TUV: SUD, Philippines on October 18, 2006 with an
Integrated Management System certified. Proudly, Maynilad became the first water utility firm
in the Philippines to have this distinction. As Maynilad continues to operate, it stays focus and
guided by its Quality, Environment, Safety and Health policy and objectives.
The water enters both treatment plants after traveling over 24 kilometers through
tunnels and aqueducts from the Angat-Ipo-Bicti source network. Water passes through screens
that prevent entry of foreign objects such as grass, leaves, tree limbs and other large floatables,
thus protecting our rapid mixers, flocculators, regulated valves and flow meter sensors from
damage.
La Mesa Treatment Plant No. 1, located in Novaliches, Quezon City is Asia’s largest plant
and fourth in the world, started operating in 1982 and was completed in 1983. It was designed
by Camp, Dresser and Mckeey with a capacity of 1500 MLD and peak output of 1650 MLD and is
fully operational for almost 30 years now. This PHP 250 million plant is a low-cost technological
package that features an energy efficient design. It is standard conventional coagulation –
flocculation – sedimentation - rapid gravity filtration-disinfection plant with no automation and
minimal rehabilitation since its construction. It has very minimal electro mechanical equipment
and relies mostly on hydraulic properties of water to backwash its filters and on gravity to
convey raw water from the source, into the plant and out into the distribution system.
Caustic soda is first applied as delivered in 50% concentration before the water enters
the radial gates of LMTP 1. However, this is only conducted if there is a need for pH and/or

Maynilad Water Safety Plan Revision No.2 / November 2015
21
alkalinity correction at the start (Figure 6a and 6b). Hydrated or quick Lime is used as an
alternate to caustic soda and prepared in a 2-3% concentration solution. In the coagulation
process, rapid mixers uniformly disperse aluminum sulfate (8 to 8.5% alumina content and
specific gravity of 1.32 to 1.326) throughout the raw water. After rapid mixing, the water enters
the three stages flocculation chambers where polymer, as coagulant aid, is added in the first
stage. Polymers could be cationic, anionic or non-ionic whichever is best suited for the quality
of incoming raw water. It is prepared in different concentrations depending on the raw water
turbidity being treated. Chlorine may also be added for pre-treatment disinfection where
dosage depends on the demand. The 36 flocculators in each half of the plant is where water is
gently agitated causing the small clusters of suspended solids to collide with and stick to each
other and form into larger particles called ‘floc’. The water then enters the 12 sedimentation
basins where the flocs are settled out by gravity. Intermediate chlorination can be applied in
this process depending on the need. It then proceeds to the filtration process through the 24
filter units in the plant. In order to optimize the operation of the filter units, backwashing is
conducted to remove the collected flocs with the backwashed water being sent to four lagoons
for recovery or recycling back into the plant. Finally, the product water undergoes post-
chlorination (residual chlorine of 1.0 to 1.5 ppm) before being sent out to the distribution
system.
The La Mesa Treatment Plant No. 2 was designed and constructed under the Angat
Water Supply Optimization Project (AWSOP) to supply water to the Northern part of Metro
Manila (included in the West Service Zone as per Concession Agreement) and was
commissioned in 1995. Designed by Degremont of France, it uses coagulation, flocculation,
pulsator-clarifier, filtration, disinfection process having a design capacity of 900 million liters
per day during maximum flow, with an allowable overload of 10% and can produce as high as
990 MLD.
The raw water passes through the bar screens to remove large objects such as rags,
plastics bottles, and other floatables from entering the treatment plant (Figure 7a and 7b).

Maynilad Water Safety Plan Revision No.2 / November 2015
22
Screened water then enters two repartition chambers where four flash mixers (2 for each
repartition) uniformly disperse into the water various treatment chemicals as per the following
injection order:
1. Caustic soda is applied as delivered at 50% concentration if required for pH and/or
alkalinity correction/neutralization; hydrated or quick lime can be used as an
alternative and prepared in 2-3% concentration solution.
2. Chorine for pre-treatment disinfection.
3. Primary coagulant – For LMTP1, Aluminum Sulfate is applied as delivered at 8.00 to
8.50% alumina content and specific gravity of 1.32 to 1.326. Both plants have
provision to use Polyaluminum Chloride as well when the raw water turbidity is low.
4. Polymer, as coagulation aid, that could be cationic, anionic or non-ionic, whichever
is suited, is prepared in concentrations dependent on raw water quality.
In coagulation, fine colloidal suspended solids are gathered into bulky and heavy flocs by
introducing the coagulant into the raw water. The addition of polymer in the flocculation step
hastens the cohesion and relatively increases the volume of the flocs formed. The water then
flows into eight pulsator-clarifiers where the flocs are allowed to suspend at the clarifiers,
which is regularly extracted by means of sludge draw-off valves. The pulsation increases the
time of contact between the water and the sludge - forming blankets thereby, improving water
quality. The blanket also serves as a pre-filter to the clarified water. The clarified water then
undergoes filtration through twenty (20) filter beds. These filters complete the treatment
process by removal of the flocs, which escaped or had passed through the sludge blanket in the
clarifiers. The filters undergo backwashing with the resulting backwash water stored in the
recovery tank and is continuously recovered to combine with the incoming raw water for
another cycle of treatment. The water coming from the filter then undergoes post-chlorination
(residual chlorine of 1.0 to 1.5 ppm) before leaving the plant for distribution.
Other chemical used when beset with high Manganese content is Potassium
Permanganate.

Maynilad Water Safety Plan Revision No.2 / November 2015
23
Both plants have pre-chlorination and post-chlorination (LMTP 1 has an additional
intermediate chlorination provision) to handle high levels of algae and ensure the presence of
required residual chlorine of the finished water up to the farthest end of the distribution
system. Maynilad uses liquid-gas chlorine in its operation and there are no plans to shift to new
disinfection systems in the near future. The use of chlorine has always been effective in treating
the bacteriological and biological agents in water. Chlorine dosage is always within the safe and
prescribed limits to meet the requirements set by the Philippine National Standards for
Drinking Water 2007 and by the MWSI Water Production Quality Plan. Seeing the importance of
chlorination in the treatment of water, sufficient measures are also in place should there be any
failures in the chlorination facilities.
During the dry season, manganese present in the low water levels in Angat Dam can
enter with the raw water to the treatment plants. To address this, there is a stand-by potassium
permanganate treatment unit to precipitate the dissolved manganese and remove it before it
enters the pre-chlorination.
All of the LMTP 1 finished water is sent to Bagbag Reservoir via the 3.2M diameter main
transport pipe while part of LMTP 2 finished water is sent to the 50-ML La Mesa Reservoir and
pumped to the northern distribution system and the other part goes to Bagbag Reservoir in
Novaliches to supply the Central and Southern portion of the service area by gravity.
In the last 6 years, the average monthly output for LMTP 1 & 2 have been 94% and 91%
of their design capacities, respectively, except for the abnormal periods of operation,
specifically when a prolonged period of El Nino was experienced in 1998 which resulted in the
high Manganese content of the raw water. There were also incidents when prolonged rainy
season in Southern Luzon resulted in highly turbid raw water, such as during late November
2004 to January 2005, November 2007, September 2009 and August 2012, that was beyond the
Maynilad Water Safety Plan Revision No.2 / November 2015
24
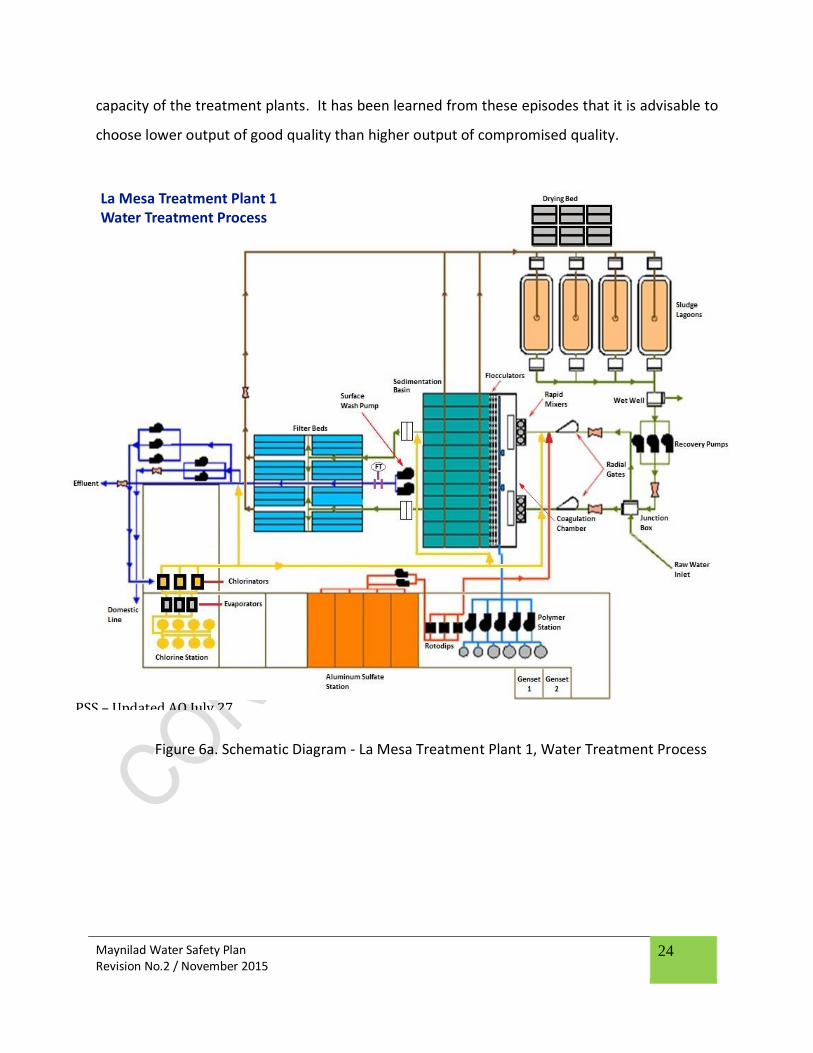
capacity of the treatment plants. It has been learned from these episodes that it is advisable to
choose lower output of good quality than higher output of compromised quality.
Figure 6a. Schematic Diagram - La Mesa Treatment Plant 1, Water Treatment Process
La Mesa Treatment Plant 1
Water Treatment Process
PSS – Updated AO July 27,

Maynilad Water Safety Plan Revision No.2 / November 2015
25
Figure 6b. Block Diagram - La Mesa Treatment Plant No 1, Water Treatment Process
LA MESA TREATMENT PLANT No. 1
WATER TREATMENT PROCESS
BLOCK DIAGRAM
Junction
Box
Structure
Coagulation Sedimentation
Filtration
Recovery
Lagoon
Raw water
from LMTP-
1
Open canal
(Portal)
Caustic
Soda
Potassium
Permanganate
Aluminum
Sulfate Pre-chlorination
Polymer
Losses due to leakages of
24 Butterfly valves
(3.3 mld or 137 cu.m./hr.)
Intermediate Chlorination
Post Chlorination
To Bagbag
Reservoir
Losses due to:
a. Backwashing (2340 cu.m./bed/12 min.)
b. Filter Drain Sluice Gate leakage (negligible)
c. Unfiltered Water (900cu.m./basin) - to be drained
before backwash
Screening Flocculation

Maynilad Water Safety Plan Revision No.2 / November 2015
26
Figure 7a. Schematic Diagram- La Mesa Treatment Plant 2, Water Treatment Process
La Mesa Treatment Plant 2
Water Treatment Process
PSS – Updated AO July 27, 2012

Maynilad Water Safety Plan Revision No.2 / November 2015
27
Figure 7b. Block Diagram - La Mesa Treatment Plant No 2, Water Treatment Process
LA MESA TREATMENT PLANT No. 2
WATER TREATMENT PROCESS
BLOCK DIAGRAM
Flocculation
(Pulsator-
Clarifier)
Coagulation
(Repartition
Building)
Filtration
Washwater
Recovery
Tank
Raw water from
LMTP-2 Open
canal (Portal)
Post Chlorination
Losses due Backwashing:
a. 300 cu.m. / filter bed / 14 min.
b. 1.90 mld from leaks
Screening
(Raw Water
Inlet)
Pre- chlorination
Caustic Soda
Aluminum Sulfate
Polymer
Recovered Water
Caustic Soda
(if necessary) Effluent
Proposed Potassium
Permanganate Application
(300 m. away from the plant)

Maynilad Water Safety Plan Revision No.2 / November 2015
28
B.2 Putatan Water Treatment Plant
The 100-mld Putatan Water Treatment Plant is located in the city of Muntinlupa,
situated 22km south of Metro Manila (Figure 8). The plant is the first water treatment facility
that taps into Laguna Lake as an alternative water source to Angat Dam in Bulacan. Laguna
Lake is the largest lake in the Philippines and the third-largest freshwater lake in South East
Asia. It is also the first significant bulk water supply source for the Greater Manila.
The Putatan Water Treatment Plant Phase 1 (100 MLD) is part of Maynilad capital
expansion program and is supplying the potable water requirement of the cities of Muntinlupa,
Las Pinas, Paranaque and ultimately Cavite City & the municipalities of Rosario, Imus, Noveleta,
Bacoor and Kawit (when Phase 2 -- of 200 MLD capacity -- is completed).
To ensure that water drawn from Laguna Lake is fit for drinking, an advanced process of
microfiltration, ultrafiltration and reverse osmosis has been adopted to purify the water. The
plant has been fabricated with four (4) Dissolved Air Flotation (DAF) cells, twelve (12) Biological
Aerated Filtration cells, five (5) Amiad Strainers, fourteen (14) trains of Microfilters, six (6) trains
of Ultrafilters, six (6) units of Reverse Osmosis (RO) skids, sludge dewatering system, gas
chlorination system and product water pumping system (Figure 9). The design specifications of
the plant are also in compliance with the requirements by the Department of Health (DOH),
Philippine National Standards for Drinking Water (PNSDW).

Maynilad Water Safety Plan Revision No.2 / November 2015
29
Figure 8.Location of Putatan Water Treatment Plant
PWTP
Maynilad Water Safety Plan Revision No.2 / November 2015
30
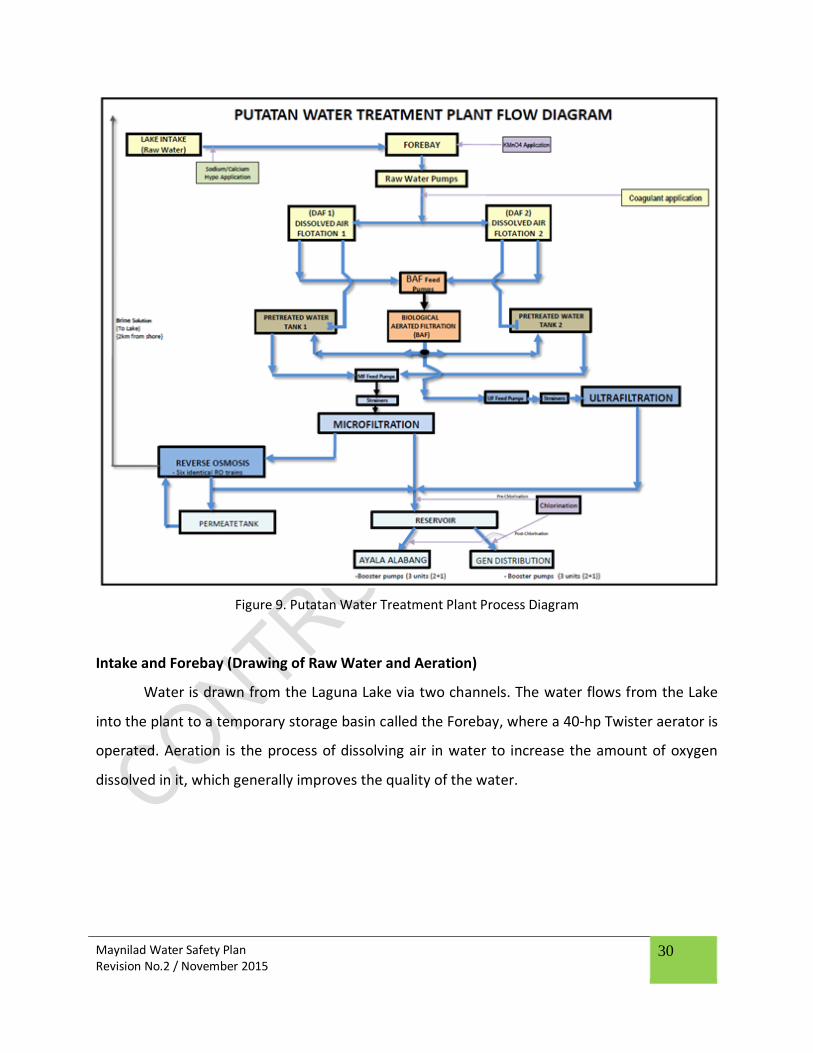
Figure 9. Putatan Water Treatment Plant Process Diagram
Intake and Forebay (Drawing of Raw Water and Aeration)
Water is drawn from the Laguna Lake via two channels. The water flows from the Lake
into the plant to a temporary storage basin called the Forebay, where a 40-hp Twister aerator is
operated. Aeration is the process of dissolving air in water to increase the amount of oxygen
dissolved in it, which generally improves the quality of the water.

Maynilad Water Safety Plan Revision No.2 / November 2015
31
(A)Intake Channel with newly constructed baffle walls, (B) with water hyacinth, (C) box culvert-entrance going to
forebay, (D) sluice gates
Forebay
Parabolic screen was installed to prevent plastics and other trash
from entering the system
Transition pit screen
• Raw water basin
• Aeration process takes place
• Abstraction point of raw water

Maynilad Water Safety Plan Revision No.2 / November 2015
32
Raw Water System
From the Forebay, water is drawn into the pre-treatment stage by means of five vertical
turbine pumps. As the raw water enters the Dissolved Air Flotation chambers, the primary
coagulant, Aluminum Chlorohydrate (ACH) is injected. The coagulant is primarily responsible for
the formation of sludge, which is generally the collection of unwanted substances removed
from the raw water.
Dissolved Air Flotation
Dissolved Air Flotation (DAF) is a process wherein sludge removal is achieved by
dissolving air in the water under pressure in a saturator and then releasing the air at normal
pressure in a flotation tank. The released air forms tiny bubbles, which adhere to the
suspended flocs causing them to float to the surface of the water where they will be removed
by rotary scrapers.
As the raw water injected with ACH is mixed by means of slow and flash mixers, flocs are
formed. These flocs float to the surface of the DAF tank where they are removed by rotary
scrapers into the sludge hopper and pumped to sludge thickener then to decanter (sludge-
dewatering device).
The DAF treated water coming from the DAF system goes to the Biological Aerated
Filtration (BAF) Feed sump then pumped to the BAF system.

Maynilad Water Safety Plan Revision No.2 / November 2015
33
Biological Aerated Filtration System
The Biological Aerated Filtration (BAF) is a biological treatment process that can reduce
the following substances:
Ammonia
Taste and Odor
Assimilable Organic Carbon (AOC)
Suspended Solids (ie. Turbidity)
Color
Manganese
In the BAF process, DAF-treated water flows through tanks (called cells) that are filled with
media (activated carbon, anthracite coal and graded gravel). The media within the filter cells is
tightly packed and provides a surface for microorganisms to attach to and grow on. The
microorganisms consume organic material. The downward flow of water through the tightly
packed media also provides filtering. Air is added to the bottom of the cell to provide oxygen
for the microorganisms. The BAF system typically operates multiple filter cells that are rotated
in and out of service depending on flow rate requirement and concentrations of organic
materials in the influent. During operation, the filter cells are backwashed to remove excess
biological growth and flush out captured suspended solids to ensure they operate well. This is
accomplished by increasing the flow rate through the filter, and agitating the filter media using
an air scour system to fluidize the media bed. The BAF backwash water is returned to the
forebay.
The BAF treated water from BAF flows to the Pre-Treated Tanks before it is pumped to
the Microfiltration system. Separately, the BAF treated water also goes to Ultrafiltration
system.

Maynilad Water Safety Plan Revision No.2 / November 2015
34
Raw Water Pumps
BAF Cells Pretreated Water Tanks
The pre-treatment process is primarily for the removal or reduction of:
• Color
• Iron
• Manganese
• Heavy metals
• Taste and odor
• Algae
• High-level Turbidity
DAF Tank

Maynilad Water Safety Plan Revision No.2 / November 2015
35
Membrane Filtration System
Currently there are two membrane filtration streams in PWTP: the Microfiltration (MF)
– Reverse Osmosis (RO) Stream and Ultrafiltration (UF) Stream. For the MF-RO stream, from the
pretreated water tanks, MF feed pumps, 6 units with 1 unit as stand-by, pump water into the
MF system. The water passes through five 500-micron filter strainers before finally entering the
micro filters. Part of the MF product water is fed to the reverse osmosis stream depending on
the water quality. While for the UF stream, UF feed pumps draw water straight from the BAF
outlet. The UF stream also has 500-micron filter strainers. This is where the UF stream water
passes through prior to entering UF proper.
Microfiltration
Microfiltration (0.1 to 1.0 Am) is ideal for removing suspended particles, bacteria, and
many viruses from water. Microfiltration membranes normally operate at pressures of between
0 to 6.9 bars. It is a means of trapping and removing such contaminants as Giardia cysts (8-30
Am), Cryptosporidium cells (3-8 Am), and other bacteria ranging from 0.2 to 50 Am by means of
a porous barrier that is fixed in place. In microfiltration, such impurities are simply too large to
pass through. To put the size of these particles in perspective, the diameter of a human hair is
in the range of 20 to 120 Am. Membrane treatment performance is relatively insensitive to
rapid changes in the feed water composition unlike systems based on chemical addition and
coagulation. Membrane technology is accepted throughout the world as an effective and
economical water treatment method.

Maynilad Water Safety Plan Revision No.2 / November 2015
36
The plant has 14 MF module racks (shown below as the vertical ecru tubes), which
operate simultaneously. Here, most of the particles are removed to produce clear water that
can already be potable after chlorination. This filtered water is often referred to as the MF
filtrate.
Microfiltration modules.
Ultrafiltration
Ultrafiltration (UF) similar to MF, involves pressure-driven separation of materials from
a feed solution. This technology is used to remove particulate and microbial contaminants, but
it does not remove ions and small molecules. UF typically operates with a feed pressure of 4 to
100 psig and reject solutes ranging in size from 0.03 microns and larger. UF modules are
commercially available in tubular, hollow-fiber, plate and frame, and spiral wound

Maynilad Water Safety Plan Revision No.2 / November 2015
37
configurations. PWTP utilizes the hollow-fiber ceramic modules. The figure below provides a
guide to the relationship between common materials, separation processes, and pore size
measurements.
Material Size and Membrane Process Guide
(Lifted from Dow UF Product Manual)
The UF membrane process separates molecules in solution on the basis of size. The pore
size and molecular weight cut-off (MWCO) are often used to characterize a membrane. The
pore size is the nominal diameter of the openings or micropores in the membrane expressed in
microns. The MWCO is the molecular mass or weight of a solute that rejects greater than 90
percent. The unit of measurement for MWCO is the Dalton (D). Different membrane materials
with the same nominal MWCO may have differing solute rejection. Pore size distribution and
uniformity rather than the chemical nature of the membrane material may cause this effect.
Because factors other than pore size or MWCO affect the performance of membranes,
challenge studies are used to demonstrate membrane performance and benchmark different
membranes.

Maynilad Water Safety Plan Revision No.2 / November 2015
38
The plant has six (6) UF module skids, which serve as standby stream that suffices the
MF production deficit only when it is unable to meet the plant production requirement. The
current plant hydraulic configuration does not allow UF filtrate to pass through the reverse
osmosis membranes. The figure below shows the UF skids.
Ultrafiltration module skids.
Reverse Osmosis
Reverse Osmosis (RO) requires pressure to drive water through a synthetic membrane
to separate the water from the constituents that are dissolved in it. The RO process involves
water and dissolved “salts” diffusing through a semi-permeable membrane. The passage of the
water through the RO membrane occurs at a much faster rate than of the salts. The portion of
the water not passing through the membrane i.e., rejected by the membrane retains most of
the salts and becomes concentrated, thus the name concentrate, brine, or reject. In addition to
rejecting salts, minerals and other inorganic compounds, the RO membrane is also capable of
rejecting most of the organic compounds, such as pesticides, herbicides, color, total organic
carbon (TOC), and disinfection by-products (DBP) precursors that are present in the feed water.
Another benefit of RO membranes is their ability to stop the passage of microorganisms from
the feed side to the permeate side of the membrane. The primary goal of the RO system is the
reduction of Total Dissolved Solids (TDS) during periods of TDS spikes and the lowering of
Disinfection By-Product (DBP) Precursors, Tri-Halo Methane (THM) and Halo Acetic Acid (HAA)
precursors, in order for the blended product water to comply and/or exceeds the PNSDW

Maynilad Water Safety Plan Revision No.2 / November 2015
39
guidelines. The RO system is also designed to reduce or remove other unwanted constituents
that are present in the raw water, such as:
• Iron
• Total Organic Carbon (TOC) and Color
• High Hardness
• Excessive Alkalinity
• Total Dissolved Solids (TDS)
• Ammonia (Laguna Lake has occasional ammonia “spikes”)
• Taste and Odor
Currently for the plant, whenever the TDS reaches 430 ppm, RO units are operated to
exceed the PNSDW standard (equal to or less than 500ppm) (The design blend ratio is 34% RO
permeate and 66% MF filtrate when feed TDS is 700 ppm. Depending on the Feed TDS from
<500 up to 2,800 ppm, any number of RO can be put into operation to maintain blended
product water quality that meets or exceeds the PNSDW standards. The hydraulic design
capacity of the plant is 100 MLD (34 MLD RO, 66 MLD MF Filtrate). The design blend ratio is a
function of the feed water quality and the desired final product water quality data.)
RO Skid

Maynilad Water Safety Plan Revision No.2 / November 2015
40
Chlorination, Storage and Distribution
After the UF and MF-RO process, the water is chlorinated for disinfection purposes. The
plant uses liquid-gas chlorine for this phase, similar to what is used in La Mesa. There is also the
provision of injecting chlorine to the product water before and after the 22 ML reservoir where
water temporarily stored before pumping to Ayala Alabang Village and the general distribution
lines. Chlorination is done to ensure that the PNSDW residual chlorine requirement for the
product water is met. At present, there are 6 product water booster pumps available for
distribution. Three of these are dedicated for Ayala Alabang, and the other three high-pressure
pumps are for general distribution.
Gas Chlorine Tanks

Maynilad Water Safety Plan Revision No.2 / November 2015
41
C. GROUND WATER
The existing deep well facilities in the West Zone include 10 deep well stations, network
of pipelines, elevated water tanks and reservoirs. With the current deep well facilities of West
Zone, it serves the following areas: parts of Valenzuela, Malabon, Quezon City in the North and
parts of Muntinlupa and Cavite in the South.
At present the ten operational deep well pumping stations are: 1.Dona Juana in
Malabon, 2.Brittany in Quezon City, 3.Bagong Silang Phase 10 in Caloocan City, 4.Ayala South
Vale Deepwell 3 in Ayala South Vale, Gawaran, Bacoor, Cavite, 5.Ayala South Vale Deepwell 4 in
St Jude Subd, Bacoor, Cavite, 6.Georosville in Pagasa, Imus, 7.Malagasang 2-D in Imus, 8.Molino
in Bacoor, 9.Pandawan in Rosario, Cavite and 10.Poblacion, Noveleta, Rosario.
The deep well facilities will augment water pressure in the high portions and far end of
the pipelines of the service areas.
The functions of the Deep Well Pumping Plants Operation of Water Network are the
following:
Operates all deep well pumping stations in accordance with approved operating
schedules
Performs preventive maintenance activities to all deep well pumping stations,
equipment and vehicles of the unit
Performs minor repair and maintenance works to all pumping station’s electro-
mechanical equipment and machineries and mechanical equipment used by the unit
Observe and record operating conditions of all pumping stations
Recommends / initiates improvement / rehabilitations of pumping stations, equipment
and vehicles
Perform machining, metal fabrication and welding works
Maynilad Water Safety Plan Revision No.2 / November 2015
42
The water quality of the groundwater is compatible with the PNSDW and thus, do not
require any treatment except for preventive disinfection using Calcium Hypochlorite (HTH). The
dosage is 3 kg HTH to 100 liters of water where the chlorine concentration is regulated by the
chemical feeder. The water sample taken from the distribution line 100 meters away from the
well source should have a minimum 0.30-ppm of residual chlorine. Based on this field testing,
low residual chlorine will increase the chemical feed rate or high residual chlorine will reduce
the chemical feed rate.
If the groundwater source is contaminated, shock chlorination is initiated. Twenty (20)
kg of Calcium Hypochlorite (HTH) granules is thoroughly mixed to 100 liters of clean water. The
chlorine mixture is poured into the sounding tube of the well and is allowed to stay for 24
hours. After 24 hours, well water is pumped out and the water is tested for microbial analysis.
Typically, an MWSS/MWSI well is dug with a depth of 305 meters (1000 ft.). The natural
groundwater aquifer in the franchise area is found in two geological formations occurring at
100-120 m (328-390 ft.) and at 167 m (550 ft.) and below. So as not to compete with the
groundwater source of the Artesian/Shallow wells of locals (e.g. farmers, residence, etc.), wells
start their perforated casing from 600 ft. and below. This also assures that only the
groundwater occurring in the lower but true natural aquifer is abstracted. Refer to “Study for
the Groundwater Development in Metro Manila (SGDMM), June 1992, Volume 1, JICA Report”
(a copy of which is in the possession of the unit in charge of the Deep wells of the Water
Network Department).
The geological formation of the franchise area of Maynilad is formed mainly by the
Guadalupe formation and is underlain by alluvium in the coastal areas. The Guadalupe
Formation forms the good aquifer, which represents the recharge in the franchise area and is
part of the Luzon Central Valley Basin.

Maynilad Water Safety Plan Revision No.2 / November 2015
43
The southern part of the franchise area, particularly the Muntinlupa Area is prone to
land subsidence due mainly to the Marikina Fault Line. This fault line has caused several well
casings of the deep well to slip off-center thus causing intrusion to the well. Fortunately, in
other parts of the franchise area, the Guadalupe Formation is consolidated and the Alluvium
clayey bed is thin therefore, the probability of land subsidence occurring in these areas is nil.
Fluoride, especially in the coastal franchise areas, Cavite area, is relatively high. Since
fluoride occurs naturally in groundwater, it is very difficult to prevent or eradicate. Part of the
short-term solution is to dilute the groundwater with surface water and the long
term/permanent solution is to bring the surface water to these groundwater-supplied areas.
Direct recharge from rainfall was estimated based on the following equation: P=R+E+I
where:
P = mean annual rainfall
R = run off
E = evapotranspiration
I = effective infiltration (all in millimeters)
Based on the same 1992 JICA study mentioned above, values are as follows:
Annual Rainfall = 2, 329.7
Run off = 1, 397.8
Evapotranspiration = 816.6
Recharge = 115.3 (4.9% of annual rainfall)
Fortunately for the franchise area of MWSI, the deep wells in the inclusive zone have
relatively low risk of contamination by pollutants since the area is protected by prehistoric
sedimentary basin. The Southwest Luzon Upland is situated south of the MWSI franchise area.
The elevation decreases towards the north. The southern piedmont area of Taal Volcano is
contiguous to Manila Bay and Laguna de Bay and is widely covered by thick volcanic materials

Maynilad Water Safety Plan Revision No.2 / November 2015
44
and mud flows. The area constitutes a recharge zone of the lake water of the Laguna de Bay
and of the groundwater south of the franchise areas.
Deep well stations operated by Maynilad as of October 2012 including their addresses,
operating schedules, capacities and the influence areas under the Booster and Deep well
Operation and Maintenance of the Water Network Department are listed in Table 2.

Maynilad Water Safety Plan Revision No.2 / November 2015
45
Table 2. LIST OF MAYNILAD OPERATIONAL DEEP WELL STATIONS
Well Name / Address HP
Rating KW
Rating OHT/
CISTERN
Ave. CAPACITY
m³/hr. RISER PIPE OPERATION
Business AREA
Influenced Area
Malabon City
1. Dona Juana Dona Juana Subd., Dampalit
20 15 Direct Pumping
400 ft. 4am-10pm Mal/Nav.
South / Cavite Area
2. Molino Molino Heights, Molino IV, Bacoor Cavite
35 26 Direct Pumping
56.17 15pcs. 125mm dia x 6m
9am-12NN; 4pm – 6pm
Cavite B.A.
3. Malagasang II D Malagasang II D, Imus Cavite
30 22 30,000 gal 50.89 75mm dia 24 hours, intermittent
Cavite B.A.
4. Georosville Georosville Subd, Pagasa, Imus, Cavite
15 11 20,000 gal 43.23 10pcs, 75mm dia x 6m
6am- 10pm Cavite B.A.
5. Pandawan Rosario 25 18.5 Direct 40.12 15pcs,75m 24 hours Cavite B.A.

Maynilad Water Safety Plan Revision No.2 / November 2015
46
Well Name / Address HP
Rating KW
Rating OHT/
CISTERN
Ave. CAPACITY
m³/hr. RISER PIPE OPERATION
Business AREA
Influenced Area
National High School, Rosario, Cavite
Pumping m dia x 6m
6. Poblacion / Town Plaza, Rosario Cavite
30 22 Direct Pumping
32.9 19pcs, 75mm dia x6m
24 hours Cavite B.A.
North Deepwells
7. Bagong Silang Phase 10 / Package 8, Bagong Silang, Caloocan City
30 Direct Pumping
46 24pcs, 3”x20”
7am-12NN North Caloocan BA
North Bus. District
8. Brittany/ Neopolitan IV Subd, Britanny, Farview, Quezon City
20 50,000 gal 30 23pcs 24 hours Novaliches/Valenzuela BA
North District
Muntinlupa / Las Pinas BA
9. ASV-Deepwell 3/ Ayala Southvale, Gawaran, Bacoor, Cavite
50 37 750,000 gals
1300 4am – 10pm Muntinlupa/ Las Pinas BA
Ayala Southvale
10. ASV- Deepwell 4 (St. Jude)/
40 30 75,000 gals 230 5am – 10pm (intermittent
Muntinlupa/ Las Pinas BA
St. Jude Subd.

Maynilad Water Safety Plan Revision No.2 / November 2015
47
Well Name / Address HP
Rating KW
Rating OHT/
CISTERN
Ave. CAPACITY
m³/hr. RISER PIPE OPERATION
Business AREA
Influenced Area
St. Jude Subd., Gawaran Bacoor, Cavite
operation) Gawaran, Bacoor Cavite
Maynilad Water Safety Plan Revision No.2 / November 2015
48
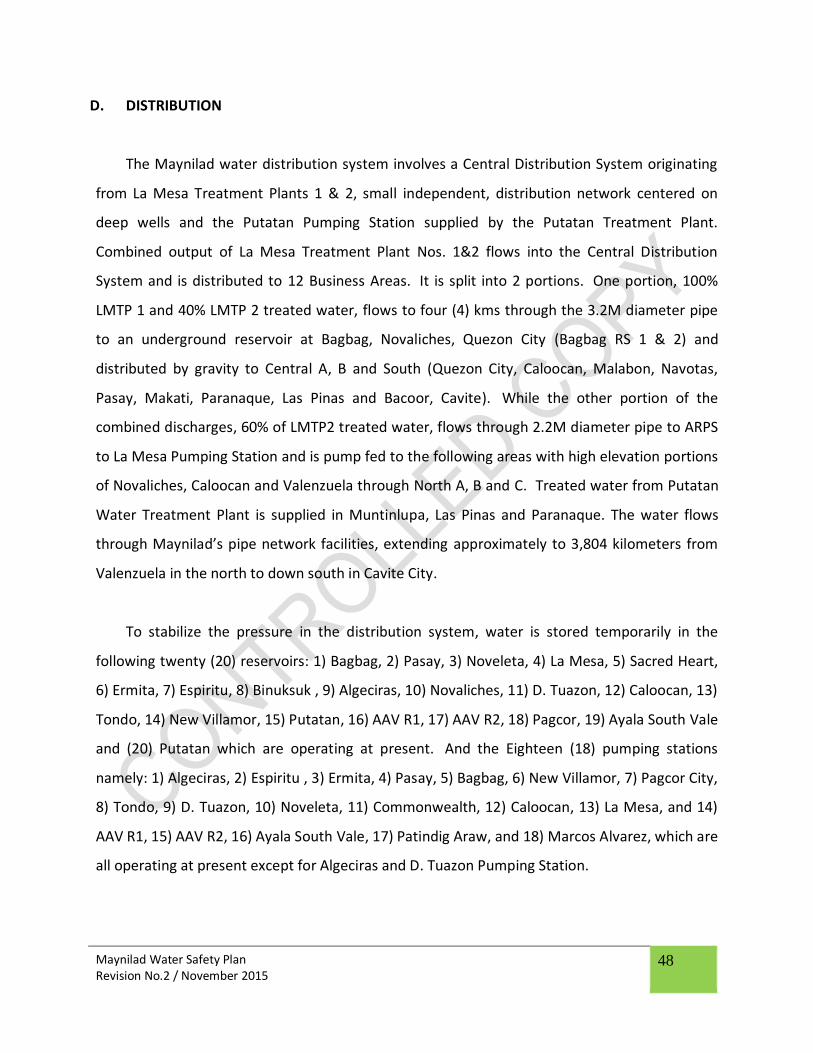
D. DISTRIBUTION
The Maynilad water distribution system involves a Central Distribution System originating
from La Mesa Treatment Plants 1 & 2, small independent, distribution network centered on
deep wells and the Putatan Pumping Station supplied by the Putatan Treatment Plant.
Combined output of La Mesa Treatment Plant Nos. 1&2 flows into the Central Distribution
System and is distributed to 12 Business Areas. It is split into 2 portions. One portion, 100%
LMTP 1 and 40% LMTP 2 treated water, flows to four (4) kms through the 3.2M diameter pipe
to an underground reservoir at Bagbag, Novaliches, Quezon City (Bagbag RS 1 & 2) and
distributed by gravity to Central A, B and South (Quezon City, Caloocan, Malabon, Navotas,
Pasay, Makati, Paranaque, Las Pinas and Bacoor, Cavite). While the other portion of the
combined discharges, 60% of LMTP2 treated water, flows through 2.2M diameter pipe to ARPS
to La Mesa Pumping Station and is pump fed to the following areas with high elevation portions
of Novaliches, Caloocan and Valenzuela through North A, B and C. Treated water from Putatan
Water Treatment Plant is supplied in Muntinlupa, Las Pinas and Paranaque. The water flows
through Maynilad’s pipe network facilities, extending approximately to 3,804 kilometers from
Valenzuela in the north to down south in Cavite City.
To stabilize the pressure in the distribution system, water is stored temporarily in the
following twenty (20) reservoirs: 1) Bagbag, 2) Pasay, 3) Noveleta, 4) La Mesa, 5) Sacred Heart,
6) Ermita, 7) Espiritu, 8) Binuksuk , 9) Algeciras, 10) Novaliches, 11) D. Tuazon, 12) Caloocan, 13)
Tondo, 14) New Villamor, 15) Putatan, 16) AAV R1, 17) AAV R2, 18) Pagcor, 19) Ayala South Vale
and (20) Putatan which are operating at present. And the Eighteen (18) pumping stations
namely: 1) Algeciras, 2) Espiritu , 3) Ermita, 4) Pasay, 5) Bagbag, 6) New Villamor, 7) Pagcor City,
8) Tondo, 9) D. Tuazon, 10) Noveleta, 11) Commonwealth, 12) Caloocan, 13) La Mesa, and 14)
AAV R1, 15) AAV R2, 16) Ayala South Vale, 17) Patindig Araw, and 18) Marcos Alvarez, which are
all operating at present except for Algeciras and D. Tuazon Pumping Station.

Maynilad Water Safety Plan Revision No.2 / November 2015
49
To check the integrity of pipelines, gauging points are placed in different areas in the
distribution system. From the pumping stations, water is distributed to its customers, an
estimated population of eight million through a network of pipelines: primary, secondary and
tertiary mains. The pipeline consist of various materials namely: asbestos cement, cast iron,
concrete, steel, black iron, ductile iron and PVC whose size ranges from 50mm to 3200mm and
is broken down as follows: 459 km of primary mains (350 to 3200 mm diameter ), 828Kms. of
secondary mains (200-300 mm diameter ) and 4,213 km of tertiary mains (<200 mm
diameter). Primarily, steel pipes ranging from 350 mm diameter to 600 mm diameter are
cement coated (inside lining) while those ranging from 750 mm to 2200 mm have asphalt lining.
As of September 2012, 95% of the customers have a 24-hour uninterrupted water supply, while
5% have intermittent water due to low pressure, or no water at all due to inadequacy of the
water supply.
The 12 Business Areas where water is distributed and handle the numerous service
connections are Novaliches-Valenzuela, Fairview-Commonwealth, North Caloocan, Malabon-
Navotas, South Caloocan, Quirino-Roosevelt, South Manila-Pasay-Makati, Sampaloc, Tondo,
Muntinlupa-Las Pinas, Paranaque and Cavite.
To ensure consistency in the daily operations of the water network and to meet customer
requirements, the Maynilad Water Network Department including the seven Pumping Stations
(PS) namely: La Mesa PS, Commonwealth PS, Caloocan PS, D. Tuazon PS, Algeciras PS, Villamor
PS, and the Noveleta PS are certified ISO 9001:2008, ISO 14001:2004, and BS OHSAS 18001:
2007. The management systems include methods for measuring and tracking customer
satisfaction as well as the consistency in the procedures of the daily operations of the water
network and pumping stations that result in a more consistent quality of drinking water
delivered to the consuming public.
Water quality and quantity are monitored regularly. There are 866 monitoring points in the
distribution network to verify the quality of water produced both for surface and deep well
Maynilad Water Safety Plan Revision No.2 / November 2015
50
water supply. The Central Laboratory performs regular examinations for bacteriological,
biological, physical, and chemical analysis.
Compliance with drinking water quality standards is regulated by the Department of Health
(DOH), the lead agency tasked to implement the Sanitation Code of the Philippines. In Metro
Manila, the Metro Manila Drinking Water Quality Monitoring Committee (MMDWQC) monitors
water quality compliance with Philippine National Standards for Drinking Water (PNSDW). This
committee is headed by the DOH and meets and publishes water quality pronouncements
every month.
The Metro Manila Drinking Water Quality Committee member agencies are the
Department of Environment and Natural Resources - Environmental Management Bureau
(DENR-EMB), Metropolitan Waterworks and Sewerage System–Regulatory Office (MWSS-RO),
National Water Resource Board (NWRB), , Department of Health - Bureau of Health Facilities
and Services (DOH-BHFS), Department of Health - East Avenue Medical Center - National
Reference Laboratory (DOH-EAMC-NRL), Maynilad Water, Manila Water and other waterworks
systems.
Water quality and quantity complaints are received by Business Areas, Call Centers and
those referred or forwarded by member agencies of MMDWQC. These water quality and
quantity complaints are investigated separately by the concerned Business Area Unit and the
Central Laboratory Department.
Treated water produced by Maynilad is intended for general consumption by ingestion
from drinking and food preparation and other domestic purposes as well as for commercial and
industrial use. Conforming to standards set by Philippine National Standards for Drinking Water
ensure that MWSI water is safe and potable to drink without further treatment or boiling by the
consumers.
Maynilad Water Safety Plan Revision No.2 / November 2015
51
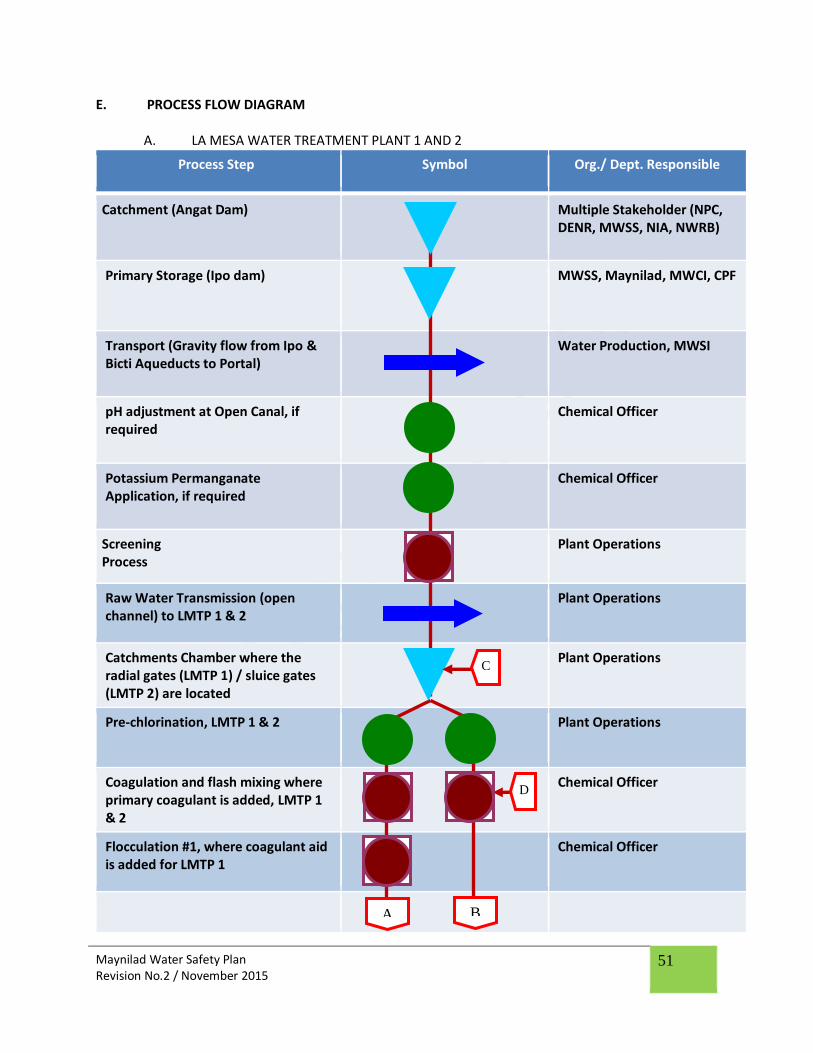
E. PROCESS FLOW DIAGRAM
A. LA MESA WATER TREATMENT PLANT 1 AND 2
Process Step Symbol Org./ Dept. Responsible
Catchment (Angat Dam)
Multiple Stakeholder (NPC, DENR, MWSS, NIA, NWRB)
Primary Storage (Ipo dam)
MWSS, Maynilad, MWCI, CPF
Transport (Gravity flow from Ipo & Bicti Aqueducts to Portal)
Water Production, MWSI
pH adjustment at Open Canal, if required
Chemical Officer
Potassium Permanganate Application, if required
Chemical Officer
Screening Process
Plant Operations
Raw Water Transmission (open channel) to LMTP 1 & 2
Plant Operations
Catchments Chamber where the radial gates (LMTP 1) / sluice gates (LMTP 2) are located
Plant Operations
Pre-chlorination, LMTP 1 & 2
Plant Operations
Coagulation and flash mixing where primary coagulant is added, LMTP 1 & 2
Chemical Officer
Flocculation #1, where coagulant aid is added for LMTP 1
Chemical Officer
C
A B
D

Maynilad Water Safety Plan Revision No.2 / November 2015
52
Process Step Symbol Org./ Dept. Responsible
Flocculation / Clarification, LMTP 2
Chemical Officer Plant Operations
Flocculation #2, LMTP 1
Chemical Officer, LMTP 1
Flocculation #3, LMTP 1
Chemical Officer
Sedimentation, LMTP 1
Plant Operations
Intermediate Chlorination, LMTP 1
Chemical Officer
Filtration, LMTP 1 & 2
Plant Operations
Backwash water to Lagoon for LMTP 1 and recovered water chamber on LMTP 2
Plant Operations
Post Chlorination
Chemical Officer
LMTP 1 Effluent to Bagbag Reservoir via 3.2m diameter main transport pipe
LMTP 2 Effluent: one part to Bagbag, the rest to La Mesa Reservoir via 2.8m diameter main transport pipe
To Distribution Network
Water Network
Reservoir
Pump Operator
Consumer
Water Network/Central Lab / BA
A B
Rec
ov
ery
D C
Rec
ov
ery

Maynilad Water Safety Plan Revision No.2 / November 2015
53
B. PUTATAN WATER TREATMENT PLANT
Process Step Symbol Org./ Dept. Responsible
Intake (Laguna Lake)
LLDA, Maynilad, PWTP, LGU
Forebay (Aeration in Forebay)
PCU, Operation
Addition of Potassium Permanganate in the Treated Water – for Taste and Odor
PCU, Operation
Dissolved Air Flotation (Coagulation/Flocculation/Flotation)
PCU, Operation
Biological Aerated Filtration PCU, Operation
Pretreated Water Tank PCU, Operation
Screening via AMIAD Strainers Operation, Maintenance
Microfiltration
PCU, Operation
Ultrafiltration
Reverse Osmosis -TDS, Taste & Odor, Ammonia Removal (As Needed Process)
PCU, Operation
Chlorination PCU, Operation

Maynilad Water Safety Plan Revision No.2 / November 2015
54
Reservoir PCU, Operation
Distribution System Water Network
Reservoir Pump Operator
Consumer Water Network / Central Lab, BA

Maynilad Water Safety Plan Revision No.2 / November 2015
55
C. GROUND WATER
Process Step Symbol Org./ Dept. Responsible
Catchment / Well
Water Network
Chlorination
Water Network
Distribution System
Water Network
Reservoir
Water Network
Consumer
Water Network/ Central Lab / Business Area
Legend:
Process step
Chemical process
Storage / Reservoir / Catchment
Transport step
Consumer
“As Needed” basis process step
Connector

Maynilad Water Safety Plan Revision No.2 / November 2015
56
III. HAZARD IDENTIFICATION AND RISK ASSESSMENT For each step of the validated process flow diagram, the WSP Team identified what
could go wrong in the water supply system in terms of hazards and hazardous events. The
hazard and hazardous event identification was conducted through existing records, historical
events, local knowledge and onsite visits that can affect the safety of a water supply and
establish what requires controlling the hazards in order to provide safe drinking-water. The
WSP team considered all potential biological, physical and chemical hazards that could be
associated with the water supply.
It is important to rank the hazards in order to establish priorities. The WSP team used a
semi-quantitative risk assessment, to calculate a priority score for each identified hazard. The
objective of the prioritization matrix is to rank hazardous events to provide a focus on the most
significant hazards. The likelihood and severity was derived from the team’s technical
knowledge and expertise, historical data and relevant guidelines. Table 3 describes the semi-
quantitative risk matrix used to rate the likelihood or frequency and severity or consequence of
the hazards when it occurred for calculation of the risk score. The WSP team determined a cut-
off point, which is risk score of 5, above which all hazards will be retained for further
consideration. There is little value in expending a great deal of effort considering very small
risks.
See Annex I for the hazard identification and risk assessment from catchment to
distribution system including consumer premises.

Maynilad Water Safety Plan Revision No.2 / November 2015
57
Table 3. Semi-Quantitative Risk Matrix (from Deere et. al. 2001)
Risk Factor Matrix
Severity / Consequence Insignificant
No Impact/ Not Detectable
Rating 1
Minor Compliance
Impact Rating 2
Moderate Aesthetic
Impact Rating 3
Major Regulatory
Impact Rating 4
Catastrophic Public Health
Impact Rating 5
Like
liho
od
/ Fr
equ
ency
Almost Certain
Once a day Rating 5
5 10 15 20 25
Likely Once a week Rating 4
4 8 12 16 20
Moderate Once a month
Rating 3
3 6 9 12 15
Unlikely Once a year
Rating 2 2 4 6 8 10
Rare Once every
5 years Rating 1
1 2 3 4 5
Risk Score <6 6-9 10-15 >15
Risk Rating Low Medium High Very High
Ranking Likelihood/Frequency Severity/ Consequence
5 Almost Certain - Once per day Catastrophic- Potentially lethal to a large population, likely to have also very significant morbidity
4 Most Likely – Once per week Major - Potentially lethal to a small population, likely to have also significant morbidity
3 Likely – Once per month Moderate - Potentially harmful to a large population but no mortality
2 Unlikely – Once per year minor - Potentially harmful to a small population but no mortality
1 Rare – Once every five years Insignificant- Negligible impact in terms of severity of disease or numbers of people affected

Maynilad Water Safety Plan Revision No.2 / November 2015
58
IV. DETERMINE AND VALIDATE CONTROL MEASURES, REASSESS AND PRIORITIZE THE
RISKS
WSP team documented the existing and potential control measures for each of the
identified hazards from catchment to the point of use. The team validates each control to
determine its efficacy at its point in the water supply system through site inspection,
manufacturer’s specification and based on monitoring data.
Reassessment of risk was conducted taking into account the effectiveness of each of the
controls. The reduction in the risk rating achieved by each control is an indication of its
effectiveness. The risks were prioritized in terms of their likely impact to the capacity of the
system to deliver safe water. High priority risks (risk rating from medium to very high) may
require system modifications or upgrade while lower priority risks (risk rating of low) can often
be minimized as part of routine good practice activities
See Annex II for the determination and validation of control measures, reassessment
and prioritization of risks from catchment to distribution system including consumer premises.
V. IMPROVEMENT / UPGRADE PLAN
An improvement or upgrade plans were drawn up for each of the significant risks with
ineffective or no existing controls identified in the reassessment of risks recognizing that other
less significant risk can also be controlled by these improvement measures. Each of the
identified improvement/upgrade has an owner to take responsibility for its implementation and
target implementation due date were also identified.
Improvement / upgrade plans can include short, medium or long-term programs. These
plans should be monitored to confirm improvements have been made and are effective and
that WSP has been updated accordingly.
Maynilad Water Safety Plan Revision No.2 / November 2015
59
See Annex III for the improvement/upgrade plans from catchment to distribution
system.
VI. MONITORING OF THE CONTROL MEASURES (OPERATIONAL MONITORING)
Operational monitoring includes defining and validating the monitoring of the control
measures and establishing procedures to demonstrate that the controls continue to work.
All control measures identified as “critical” were assigned as “critical control points” and
were monitored against “critical limits or operational limit” criteria. This critical/ operational
limit is a criterion that will indicate whether the control measure is effective and is functioning
as it was designed to be.
Monitoring plan for the whole water supply system indicating an acceptable
critical/operational limit for each control, designated monitoring locations, and established a
schedule for frequency of monitoring and assigned responsible parties. Corrective actions to be
taken in the event that monitoring reveals a parameter to be outside of the acceptable “limits”
were also established.
See Annex IV for the monitoring of the control measures (operational monitoring) from
catchment to distribution system including consumer premises.
Maynilad Water Safety Plan Revision No.2 / November 2015
60
VII. VERIFICATION
Verification provides evidence that the overall system design and operation is capable of
consistently delivering water of the specified quality to meet the health-based targets. It
involves three activities: 1.) Compliance monitoring – confirmation of compliance with water
quality targets, 2.) Internal and external auditing of operational activities – it can have both an
assessment and a compliance checking role. The frequency of audit depends on the level of
confidence required by the water utility and the regulatory body, 3.) Consumer satisfaction –
includes checking that consumers are satisfied with the water supplied
See Annex V for the verification-monitoring plan for the whole water supply system.
VIII. MANAGEMENT PROCEDURES
Management procedures are clear documentation of operational procedures for
actions to be taken when the system is operating under normal conditions, and incident
situations. The procedures should be written by experienced staff and should be updated as
necessary, particularly in light of implementation of the improvement/upgrade plan, review of
incidents, emergencies and near misses. It also includes documentation of the system
assessment, monitoring and communication plans and supporting programs.
Maynilad’s La Mesa Water Treatment Plants 1&2 and the Water Network are ISO
9001:2008/ISO 14001:2004/BS OSHAS 18001:2007 certified. A complete documentation of
Standard Operating Procedures (SOPs), Work Instructions (WI) and Emergency Response
Procedures and Plan (ERP) to guide its day-to-day operations were developed. Refer to ISO
Operational Procedures Manual for La Mesa Water Treatment Plant 1&2 and ISO Operational
Manual Procedures for Water Network. For SOPs of Putatan Water Treatment Plant, refer to
Annex IX and to the Putatan Water Treatment Plant Operational Manual.

Maynilad Water Safety Plan Revision No.2 / November 2015
61
A wide range of records is generated daily as Maynilad continues to operate providing
safe drinking water to its entire service area aside from the actual implementation of the water
safety plan. Regular monitoring of every process step and any necessary corrective actions
taken for every deviation from operational limits, incident response reports are consistently
recorded and kept for future reference. These records are evidences of compliance or
adherence of the organization to the WSP and the Integrated Management System ISO
9001:2008, ISO 14001:2004 and BS OHSAS 18001:2007 for the Water Treatment and Water
Network. Water Treatment and Water Network had developed a document control system
that ensures that all documents are up to date, that the current revisions are in use, readily
available when required and that the obsolete ones are retrieved and discarded. The
documents were kept simple and short as much as possible and the level of detail in the
procedures and work instructions is sufficient to provide assurance of operational control when
performed by competent and well trained operators. ISO documents will always cross
reference with the Water Safety Plan. A record management system was also established.
Records need to be retained and stored at a defined number of years with disposal schedule
and specified storage areas, which are accessible only to authorized personnel. This system of
recording and documentation foster process and records ownership and eventual
implementation of the procedures and more importantly it provides an auditable system
wherein review can be done periodically.
MWSI make use of an electronic medium to all of its documents and some monitoring
records generated by the treatment plant. However, these were also backed up by hard copies.
Maynilad Water Safety Plan Revision No.2 / November 2015
62
IX. SUPPORTING PROGRAMS
Supporting programs are organization-wide activities that should be in place in support
of the delivery of safe quality water. These activities do not directly affect water quality but are
meant to ensure that no additional source of potential hazards will come from the operating /
surrounding environment, the equipment’s used and the people themselves, employees and
visitors alike. The types of supporting programs that Maynilad has in aid of the realization of its
mission are provided in Annex VI. Management commitment entails constant assessment that
shall lead to updating of the existing programs and developing new ones.
X. REVIEW AND AUDIT
Water Safety Plan shall be review at least once a year to ensure that new risks
threatening the water sources, production and distribution of safe water are regularly assessed
and addressed. An updated, relevant WSP will maintain the confidence and support of
employees and stakeholders in the WSP approach.
End-product testing is never enough for potable water suppliers that is why the water
quality management system that is being adopted consists of a system wherein each activity
and process step has a role to play, standards expected of it and specific mechanisms to achieve
them. Following implementation of the Water Safety Plan there is a need to review the
procedures and examination of records to ensure that it is being carried out. This is where
periodic auditing comes in. An audit-based approach places responsibility on every unit
involved to provide information regarding system performance against agreed indicators.
Auditing has both an assessment and a compliance-checking role. It gathers information on the
level of conformance to the quality system as indicated in the WSP and to ISO standards as well
as the degree of compliance to regulatory requirements. Aside from determining if the quality
system is being effectively implemented, it obtains factual input for management decision,
determines if company is at risk, identifies areas or opportunities for improvements, assesses

Maynilad Water Safety Plan Revision No.2 / November 2015
63
individual performance, assists company staff training needs, improve communication and
motivation of personnel.
For maximum effectiveness of the audit system for the ISO certified Maynilad facilities,
the audit requires an Internal Audit procedure that will use well-trained internal auditors. The
auditors should have no direct involvement with the auditee but are qualified enough having a
technical understanding of the audit area.
XI. REVISE THE WSP FOLLOWING AN INCIDENT
To ensure that a WSP covers emerging hazards and issues, the WSP Team should review
it periodically. The implementation of the WSP framework reduces the number and severity of
incidents, emergencies or near misses affecting or potentially affecting the quality and safety of
water. However, such incidents/events may still occur. Hence in addition to the periodic
review of the WSP, review of the WSP following every emergency, incident or unforeseen event
irrespective of new hazards were identified is very important to ensure that the same
incident/emergency will not recur in the future and to determine whether the response was
effective or need to be improved. The result of a post incident review is always likely to identify
areas for improvement whether it is a new hazard, or a revised risk for the risk assessment, a
revision for an operating procedure, a training issue and the WSP must be revised to reflect the
change and incorporate the lessons learned into the WSP documentation, procedures and
supporting programs.

Maynilad Water Safety Plan Revision No.2 / November 2015
64
ANNEX I: HAZARD IDENTIFICATION AND RISK ASSESSMENT
A. Source: Surface Water
Hazardous Event Hazard Likelihood Severity Score Risk Rating
1. Typhoon/Heavy Rains 2. Land slide, mud, debris
Physical (High Turbidity) Chemical Microbial
2.5
5
12.5
High
3. Illegal Logging (denudation of watershed)
Physical (High Turbidity) 3 3 9 Medium
4. Human Access (Dumagat & Illegal Settlers)
Microbial (Fecal/e-coli) 2 5 10 Medium
5. Breakdown of NPC Auxiliary Turbines and Bypass leading to the use of Low Level Outlet (LLO) or spillway
Physical (High Turbidity) & Chemical (Manganese)
2 3 6 Medium
6. Malfunction of turbidimeter 7. (Wrong turbidity measurement leading
to erroneous information can be relayed to water production for treatment)
Physical 2 3 6 Medium
8. La Nina (turbidity) Physical (High Turbidity) 1 4 4 Low
9. Malfunction of silt ejector Physical (High Turbidity) 1 3 3 Low
10. El Nino leading to the use of Low Level Outlet (LLO)
Physical (High Turbidity) & Chemical (Manganese)
1 3 3 Low
11. Disturbance of Manganese deposit within the watershed & sediments (Earthquake, landslide, human activity, terrorist act, project construction etc.)
Chemical 1 4 4 Low
12. Forest Fire Physical (High Turbidity) 2 2 4 Low
13. Terrorist Act Chemical toxic substance & Physical (High Turbidity)
1 4 4 Low

Maynilad Water Safety Plan Revision No.2 / November 2015
65
Hazardous Event Hazard Likelihood Severity Score Risk Rating
14. Oil spill Physical & Chemical 1 1 1 Low
15. Earthquake Physical (High turbidity) 1 3 3 Low
16. Theft/Vandalism of facilities (BNAQ’s) Physical (High turbidity) & Microbial (fecal/e-coli)
1 5 5 Low
17. Breakage of conveyances Physical (High turbidity) 1 3 3 Low

Maynilad Water Safety Plan Revision No.2 / November 2015
66
B. Water Treatment: La Mesa Water Treatment Plant 1&2
Process Step Hazardous Event Hazard Likelihood Severity Score Risk Rating
Caustic Soda Application Overdosing and under dosing of chemicals Chemical 2 2 4 Low
Potassium Permanganate application
Overdosing/ under dosing of chemical Physical Chemical
2 3 6 Medium
Screening (Primary and Secondary)
1. Intrusion of garbage and floatables during normal & stormy weather due to ineffectiveness of screen
Physical Chemical
3
3
9
Medium
Microbial 3 5 15 High
2. Uncontrolled raw water quality due to natural calamities like El Nino, La Nina & flash flooding in far off provinces like Quezon
Physical 2.5 3 7.5 Medium
Chemical 1 3 3 Low
Microbial 1 5 5
Low
Pre-chlorination 1. Formation of disinfection by-products due to high raw water turbidity
Chemical (LMTP 1)
1 4 4 Low
Chemical (LMTP 2)
2 5 10 High
2. Under dosing / no pre-chlorination Microbial 2 5 10 High
3. Less effective disinfection due to high turbidity - LMTP 2
Microbial 2 5 10 High
4. Insufficient Chlorine Supply Microbial 2 5 10 High
5. Chlorine Supply Quality (Non-Compliance)
Chemical 2 4 8 Medium
Microbial 2 5 10 High
Coagulation (LMTP 1 & 2) 1. Incorrect dispersal of coagulant due to rapid mixer trouble
Physical 3 3 9 Medium
Chemical 3 3 9 Medium
2. Overdosing / under dosing Physical 3 2 6 Medium

Maynilad Water Safety Plan Revision No.2 / November 2015
67
Process Step Hazardous Event Hazard Likelihood Severity Score Risk Rating
Chemical 3 3 9 Medium
3. Feed rate interruption due to: a) clogging of feed lines b) dosing pump / transfer pump trouble
Physical 4 2 8 Medium
Chemical 4 2 8 Medium
4. Insufficient Coagulant Supply Physical 2 2 4 Low
Chemical 2 3 6 Medium
5. Coagulant Supply Quality (Non-Compliance)
Physical 2 2 4 Low
Chemical 2 2 4 Low
Flocculation (LMTP 1) 1. Incorrect setting of variators / flocculators
Physical 3 1 3 Low
Chemical 3 2 6 Medium
2. Overdosing/Underdosing of coagulant aid Physical 3 2 6 Medium
Chemical 3 3 9 Medium
Sedimentation (LMTP 1) 1. Sludge blanket formation exceeds 10 meters length from entry into sedimentation basis
Physical 3 2 6 Medium
Chemical 3 2 6 Medium
Microbial 3 5 15 High
2. Sludge bulking Physical 1 3 3 Low
Chemical 1 3 3 Low
Microbial 1 3 3 Low
3. Floating leaves and other floatables Physical 5 1 5 Low
Chemical 5 1 5 Low
Microbial 5 1 5 Low
4. Formation of algae in Sedimentation Basin (Launders)
Microbial 2 3 6 Medium
Pulsation (LMTP 2) 1. Sludge blanket blowdown Physical 2.5 3 7.5 Medium

Maynilad Water Safety Plan Revision No.2 / November 2015
68
Process Step Hazardous Event Hazard Likelihood Severity Score Risk Rating
Chemical 2.5 3 7.5 Medium
Microbial 1 5 5 Low
2. Overdosing/Under dosing of primary coagulant and coagulant aid
Physical 2.5 3 7.5 Medium
Chemical 2.5 3 7.5 Medium
Microbial 1 5 5 Low
3. Vacuum pumps and compressor failure Physical 2.5 3 7.5 Medium
Chemical 2.5 3 7.5 Medium
Microbial 1 5 5 Low
Intermediate Chlorination (LMTP 1)
1. Under dosing Microbial 3 4 12 High
2. Leak in Chlorine Pipes Microbial 2 5 10 High
3. Less effective disinfection due to high turbidity
Microbial 1 4 4 Low
4. Insufficient Chlorine Supply Microbial 2 5 10 High
5. Chlorine Supply Quality (Non-Compliance)
Chemical 2 4 8 Medium
Microbial 2 5 10 High
Filtration (LMTP 1 and LMTP 2)
1. Poor performance of filters as surface wash (LMTP 1), scour air blower (LMTP 2) are not operating well
2. Depleted filter media 3. Electro-mechanical and electro-
pneumatic system failure 4. Excessive algal formation due to irregular
and inefficient backwashing
Physical 1 3 3 Low
Chemical 1 4 4 Low
Microbial 1 5 5 Low

Maynilad Water Safety Plan Revision No.2 / November 2015
69
Process Step Hazardous Event Hazard Likelihood Severity Score Risk Rating
Backwashing Improper Backwashing (Time) Physical 2 3 6 Medium
Microbial 2 5 10 High
Recovery Highly Turbid Recovered Water Physical 5 3 15 Very High
Chemical 5 2 10 High
Microbial 1 5 5 Low
Post chlorination 1. Residual Chlorine greater than 1.50 ppm Chemical 1 4 4 Low
2. Under dosing Microbial 2 5 10 High
3. Leak in Chlorine Pipes Microbial 2 5 10 High
4. Insufficient Chlorine Supply Microbial 1 5 5 Low
5. Chlorine Supply Quality (Non-Compliance)
Chemical 2 4 8 Medium
Microbial 2 5 10 High
All process steps Power outage / unbalanced power supply which stop the entire treatment process
Physical 2 3 6 Medium
Chemical 2 4 8 Medium
Microbial 2 5 10 High
Gen set breakdown Physical 1 3 3 Low
Chemical 1 4 4 Low
Microbial 2 5 5 High
Internal/external sabotage & illegal tampering of plant facilities like opening of alum tank drain, unauthorized resetting of dosing pumps or dumping of large volume of sand upstream
Physical 1 3 3 Low
Chemical 1 4 4 Low
Microbial 1 5 5 Low

Maynilad Water Safety Plan Revision No.2 / November 2015
70
C. Putatan Water Treatment Plant
Process Step
Hazardous Event Hazard Likelihood Severity Score Risk rating
INTA
KE
Elevated levels of chlorides and total dissolved solids during El Nino
Physical
1.5 5 7.5 Medium Chemical
Elevated levels of manganese, ammonia, during El Nino and monsoon seasons
Physical 1.5 5 7.5 Medium
Chemical
Human Access (i.e. garbage and human waste disposal, etc.)
Physical
2 5 10 High Chemical
Microbial
Salt water backflow from Manila Bay
Physical
5 5 25 Very High Chemical
Microbial
Algal Bloom during Dry Season (more pronounced when the wind direction is towards the intake)
Physical
2.5 5 12.5 High Chemical
Microbial
Proliferation of Fish pens resulting to decreased DO, increased TOC, BOD
Physical
3 5 15 High Chemical
Microbial

Maynilad Water Safety Plan Revision No.2 / November 2015
71
Process Step
Hazardous Event Hazard Likelihood Severity Score Risk rating
Intrusion of garbage and other debris when they bypass the channel enclosure when lake water level is high during typhoons or when the size of garbage is small enough to pass through the bar screens
Physical Chemical Microbial
3 5 15 High
Discharges of domestic and industrial wastes nearby the intake
Physical
5 5 25 Very High Chemical
Microbial
Increased turbidity due to lake water disturbance (heavy rains, typhoons, and monsoons)
Physical 2 5 10 High
Production of taste and odor substances from algal cells breakage
Physical
2.5 5 12.5 High Chemical
Microbial
Siltation at the Intake (might contribute to turbidity when the channel level gets heavily silted)
Physical
1 5 5 Low Chemical
Microbial
FOR
EBA
Y
Siltation at the twin box culvert (might contribute to turbidity when the culvert gets heavily silted)
Physical
1 5 5 Low Chemical
Microbial
Intrusion of drainage and sewage from the cracks along the twin box culvert
Physical
2 5 10 High Chemical
Microbial
Algae intrusion
Physical
2 5 10 High Chemical
Microbial
Solid Waste Intrusion (i.e. garbage and twigs)
Physical 5 5 25 Very High
Chemical

Maynilad Water Safety Plan Revision No.2 / November 2015
72
Process Step
Hazardous Event Hazard Likelihood Severity Score Risk rating
Microbial
Intrusion of BAF. MF, UF and RO backwash water from the water recovery system
Physical Chemical Microbial
5 5 25 Very High
Siltation at the bottom of the forebay
Physical
2 5 10 High Chemical
Microbial
Improper dosing of potassium permanganate
Physical
5 5 25 High Chemical
Microbial
DIS
SOLV
ED A
IR F
LOTA
TIO
N
CO
AG
ULA
TIO
N/F
LOC
CU
LAT
ION
/FLO
TATI
ON
Solid Waste Intrusion (e.i.garbage and twigs)
Physical
5 5 25 Very High Chemical
Microbial
Improper dosing of coagulant
Physical
2 5 10 High Chemical
Microbial
Malfunction of pump for coagulant flash mixing
Physical
2 5 10 High Chemical
Microbial
Malfunction of DAF mixers
Physical
2 5 10 High Chemical
Microbial
Usage of non-compliant chemicals
Physical
2 5 10 High Chemical
Microbial
Malfunction of rotary scrapers Physical 2 5 10 High

Maynilad Water Safety Plan Revision No.2 / November 2015
73
Process Step
Hazardous Event Hazard Likelihood Severity Score Risk rating
Chemical
Microbial
Inappropriate saturated water supplied to DAF
Physical
2 5 10 High Chemical
Microbial
Malfunction of air compressors
Physical
2 5 10 High Chemical
Microbial
Malfunction of sludge extraction system
Physical
3 5 15 High Chemical
Microbial
Human access to DAF
Physical
2 5 10 High Chemical
Microbial
Power interruption
Physical
2.5 2 5 High Chemical
Microbial
Power Fluctuation
Physical
4 2 8 Medium Chemical
Microbial
BIO
LOG
ICA
L A
ERA
TED
FILT
RA
TIO
N Over filter-run of BAF Cells
Physical
4 5 20 Very High Chemical
Microbial
Filter clogging
Physical
4 5 20 Very High Chemical
Microbial
Depletion of filter media Physical 1 5 5 Low

Maynilad Water Safety Plan Revision No.2 / November 2015
74
Process Step
Hazardous Event Hazard Likelihood Severity Score Risk rating
Chemical
Microbial
Malfunction of BAF system equipment (Aerator, Airscour blowers, backwash pumps, feed pumps, level sensors and flowmeters)
Physical
2 5 10 High Chemical
Microbial
Human Access to BAF
Physical
2 5 10 High Chemical
Microbial
Power interruption
Physical
2.5 2 5 Low Chemical
Microbial
MIC
RO
FILT
RA
TIO
N Wearing-out of amiad screens Physical 2 2 4 Low
Breakage of MF fibers
Physical
2.5 5 12.5 High Chemical
Microbial
Malfunction of MF valves due to no signal or inaccurate signal given
Physical
4 5 20 Very High Chemical
Microbial
ULT
RA
FILT
RA
TIO
N Wearing-out of amiad screens Physical 2 2 4 Low
Breakage of UF fibers Physical 3 5 15 High

Maynilad Water Safety Plan Revision No.2 / November 2015
75
Process Step
Hazardous Event Hazard Likelihood Severity Score Risk rating
Chemical
Microbial
UF valves malfunction
Physical Chemical Microbial
4 5 20 High
REV
ERSE
OSM
OSI
S
Wearing-out and leakage of RO membranes
Physical
3 5 15 High Chemical
Microbial
No available/ insufficient number of required RO running
Physical
3 3 9 High Chemical
Microbial
CH
LOR
INA
TIO
N
Inaccurate dosing (underdose or overdose) of liquid chlorine
Physical
3 5 15 High Chemical
Microbial
Absence of gas chlorine application due to system shutdown either by equipment malfunction or leaks
Microbial 2 5 10 High
Chlorination water pump malfunction
Chemical
3 5 15 High Microbial
Limited or no supply of liquid/gas chlorine supply Microbial 2 5 10 High
RES
ERV
OI
R
Formation of Disinfection by-Products (DBPs)
3 4 12 High Chemical

Maynilad Water Safety Plan Revision No.2 / November 2015
76
Process Step
Hazardous Event Hazard Likelihood Severity Score Risk rating
Intrusion of rainwater or other unwanted matter to the reservoir
Physical
2.5 5 12.5 High Chemical
Microbial
Short circuiting of chlorine Chemical
2 5 10 Medium Microbial
Reservoir level is less than 15%.
Physical
2.5 4 10 High Chemical
Microbial
Wearing-off of baffle walls
Physical
1 5 5 Low Chemical
Microbial
Discoloration of product water when the reservoir level reached 1.5meters.
Physical
2.5 4 10 High Chemical
Microbial
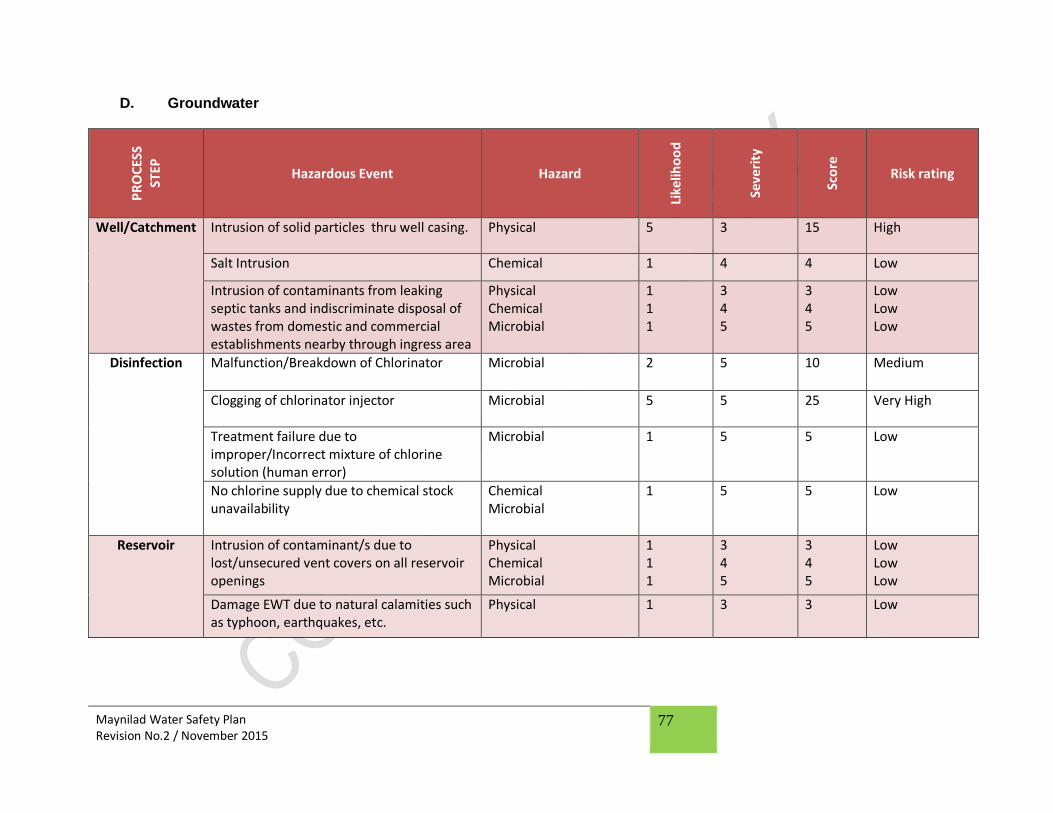
Maynilad Water Safety Plan Revision No.2 / November 2015
77
D. Groundwater
PR
OC
ESS
STEP
Hazardous Event Hazard
Like
liho
od
Seve
rity
Sco
re
Risk rating
Well/Catchment Intrusion of solid particles thru well casing. Physical 5 3 15 High
Salt Intrusion Chemical 1 4 4 Low
Intrusion of contaminants from leaking septic tanks and indiscriminate disposal of wastes from domestic and commercial establishments nearby through ingress area
Physical Chemical Microbial
1 1 1
3 4 5
3 4 5
Low Low Low
Disinfection Malfunction/Breakdown of Chlorinator Microbial 2 5 10 Medium
Clogging of chlorinator injector Microbial 5 5 25 Very High
Treatment failure due to improper/Incorrect mixture of chlorine solution (human error)
Microbial 1 5 5 Low
No chlorine supply due to chemical stock unavailability
Chemical Microbial
1 5 5 Low
Reservoir Intrusion of contaminant/s due to lost/unsecured vent covers on all reservoir openings
Physical Chemical Microbial
1 1 1
3 4 5
3 4 5
Low Low Low
Damage EWT due to natural calamities such as typhoon, earthquakes, etc.
Physical 1 3 3 Low

Maynilad Water Safety Plan Revision No.2 / November 2015
78
E. Distribution
Process Steps Hazardous Event / Cause of
Contamination Hazard Likelihood Severity Risk Risk Rating
Storage 1. Intrusion of contaminants in reservoir due to unsecured/improper vent cover
Physical Chemical Microbial
2
5
10 High
2. Facility damage caused by natural calamity like earthquake/ typhoon, etc.
Physical Chemical Microbial
2 5 10 High
3. Poor construction/workmanship of turn over facilities
Physical Chemical Microbial
2 5 10 High
4. Unprotected service reservoir access
Physical Chemical Microbial
2 5 10 High
Transmission 1. Any hazard not controlled/ mitigated within the water treatment
Physical Chemical Microbial
2.5
5
12.5
High
2. Intrusion of contaminants through leaking/deteriorated pipes during low water pressure
Physical Chemical Microbial
2
5
10
High
3. Intrusion of contaminants due to water line breakage/burst
Physical Chemical Microbial
3 5 15 High
4. Contamination of water supply due to use of unapproved materials
Physical Chemical Microbial
1
5
5
Low
5. Intrusion of contaminants due to pressure fluctuation
Physical Chemical Microbial
1 5 5 Low

Maynilad Water Safety Plan Revision No.2 / November 2015
79
6. Intrusion of contaminants due to cross connection with leaking sewer lines
Physical Chemical Microbial
1 5 5 Low
7. Intrusion of contaminants due to busted pipes that are accidentally damaged by other utilities.
Physical Chemical Microbial
1 5 5 Low
8. Intrusion of contaminants due to deteriorated pipes (cross under pipelines) during low water pressure
Physical Chemical Microbial
2 5 10 High
9. Intrusion of contaminants through deteriorated/leaking pipe/exposed mainline appurtenance due to flooding
Physical Chemical Microbial
1 5 5 Low
10. Intrusion of contaminants during cleaning of manholes for installation/insertion of equipment along the primary lines used for flow and pressure monitoring
Physical Microbial
1 5 5 Low
11. Contamination of water supply due to security / vandalism /sabotage
Physical Chemical Microbial
1 5 5 Low
12. Intrusion of contaminants/ reversed or changed flow disturbing deposits due to opening and closing of valves
Physical Chemical Microbial
2 5 10 High
13. Intrusion of contaminants due to intermittent water supply during drought (El Nino)
Physical Chemical Microbial
3 5 15 High
Consumer premises 1. Any hazard not controlled/ mitigated within the distribution
Physical Chemical
2.5 5 12.5 High

Maynilad Water Safety Plan Revision No.2 / November 2015
80
system Microbial
2. Lead contamination due to use of lead pipes within the customer premises
Chemical 1 4 4 Low
3. Contamination by backflow due to unauthorized/illegal connection
Physical Chemical Microbial
2 5 10 High
4. Contamination of water supply due to mixing of surface water and private groundwater source
Physical Chemical Microbial
2 5 10 High

Maynilad Water Safety Plan Revision No.2 / November 2015
81
ANNEX II: Determine and Validate Control Measures, Reassess and Prioritize the Risks
A. Water Source: Surface
Hazardous Event Hazard
Like
liho
od
Seve
rity
Sco
re
Risk Rating
Control Measures Validation of
Control Measures
Reassessment of Risk Post
Control
Typhoon/Heavy Rains/Landslide/Mud/Debris (High turbidity)
Physical (High Turbidity)
2.5
5
12.5
High
Reforestation/Tree planting in coordination with DENR,MWSS, NPC, and other stakeholders
In place but no significant effect yet. Reforestation continuous
Medium
Sabo Dam construction Not in place. Proposal for the conduct of Feasibility Study for the construction of Sabo Dam is currently being planned.
Medium. (Medium to low rating expected)
Illegal Logging (denudation of watershed)
Physical (High Turbidity)
4 2 8 Medium Coordination with DENR through MWSS on Security intervention
DENR Security not so active.
Medium.
Human Access (Dumagat & Illegal Settlers)
Microbial (Fecal/e-coli)
2 5 10 Medium Coordination with DENR through MWSS on Security intervention
DENR Security not so active
Medium.
Breakdown of NPC Auxiliary Turbines and Bypass leading to the use of Low Level Outlet (LLO) or spillway
Physical (High Turbidity) & Chemical (Manganese)
2 3 6 Medium Coordination and proper communication with NPC for the preventive maintenance and repair of turbine facilities and
In place but needs to strengthen MWSS-CPF assistance and support
Medium.

Maynilad Water Safety Plan Revision No.2 / November 2015
82
Hazardous Event Hazard
Like
liho
od
Seve
rity
Sco
re
Risk Rating
Control Measures Validation of
Control Measures
Reassessment of Risk Post
Control
bypass
Malfunction of turbidimeter (wrong turbidity measurement leading to erroneous information can be relayed to water production for treatment)
Physical 2 3 6 Medium Regular calibration of turbidimeter
Not in place. Medium
La Nina (turbidity) Physical (High Turbidity)
1 4 4 Low Reforestation/Tree planting
Reforestation/ Tree planting in place
Low rating maintained
Malfunction of silt ejector Physical (High Turbidity)
1 3 3 Low Preventive maintenance Preventive maintenance and repair in place
Low rating maintained
El Nino leading to the use of Low Level Outlet (LLO)
Physical (High Turbidity) & Chemical (Manganese)
1 3 3 Low Cloud seeding In place. Cloud seeding being done as the need arises.
Low
Disturbance of Manganese deposit at the dam’s water bed and within the watershed (Earthquake, landslide, human activity, terrorist act, project construction, etc.)
Chemical 1 4 4 Low Simultaneous but controlled use of LLO with auxiliary, bypass, & spillway releases during sufficient & high water level at Angat (in coordination with NPC) Minimize use of LLO
Not in place.
Low

Maynilad Water Safety Plan Revision No.2 / November 2015
83
Hazardous Event Hazard
Like
liho
od
Seve
rity
Sco
re
Risk Rating
Control Measures Validation of
Control Measures
Reassessment of Risk Post
Control
during supply shortage (in coordination with NPC)
Forest Fire Physical (High Turbidity)
2 2 4 Low DENR Security intervention
DENR Security not so active. Pocket forest fire no significant impact
Low.
Oil spill (motor boats, bancas used for fishing and means of transportation)
Physical & Chemical
1 1 1 Low Precautionary notice to all concern, IEC
No precaution Low rating maintained
Theft/Vandalism of facilities (BNAQ’s)
Physical (High turbidity) & Microbial (fecal/e-coli)
2 2 4 Low Security Patrol Fencing
In place. New roving patrol to secure BNAQ right of way Not in place. Proposed project fencing on schedule
Low rating maintained
Terrorist Act to Bicti-Novaliches Aqueduct (BNAQ)
Chemical Physical (High Turbidity)
1 5 5 Low Security Patrol / Military intervention Fencing
Security Patrol and Military intervention in place Not in place. Proposed project fencing on schedule
Low rating maintained
Breakage of conveyances Physical (High turbidity)
1 4 4 Low Preventive maintenance Preventive maintenance in place, repair as necessary
Low rating maintained

Maynilad Water Safety Plan Revision No.2 / November 2015
84
B. Water Treatment: La Mesa Water Treatment Plant 1&2
Process Step Hazardous Event
Hazard
Like
liho
od
Seve
rity
Sco
re Risk
Rating Control Measure Validation of control
measure Reassessment of risk post-
control
Caustic Soda Application
Overdosing and under dosing of chemicals
Chemical 2 2 4 Low Calibration of dosing application system
Actual chemical consumption is according to recommended dose
In place, pH result is within the desired parameter due to proper implementation of procedure
Low
Potassium Permanganate
application
Overdosing/ under dosing of chemical
Physical Chemical
2 3 6 Medium Calibration of dosing application system;
Actual chemical consumption is according to recommended dose
In place. Mn result is within the desired parameter due to proper implementation of procedure
Low
Screening (Primary / Secondary)
Intrusion of garbage and floatables during normal & stormy weather due to ineffectiveness of screen
Physical
3
3
9
Medium
1. Regular cleaning of screens to prevent clogging and to maintain flow rate
Screen in place; functional/operational however, size of the screen is not enough to trap all the floatables. Manner of installation was not optimized. Intrusion of garbage whenever the screens are being pulled up for cleaning and repair
Medium
Chemical 3
3
9
Medium
Microbial 3 5 15 High 2. Adequate pre- In place. Records show Low
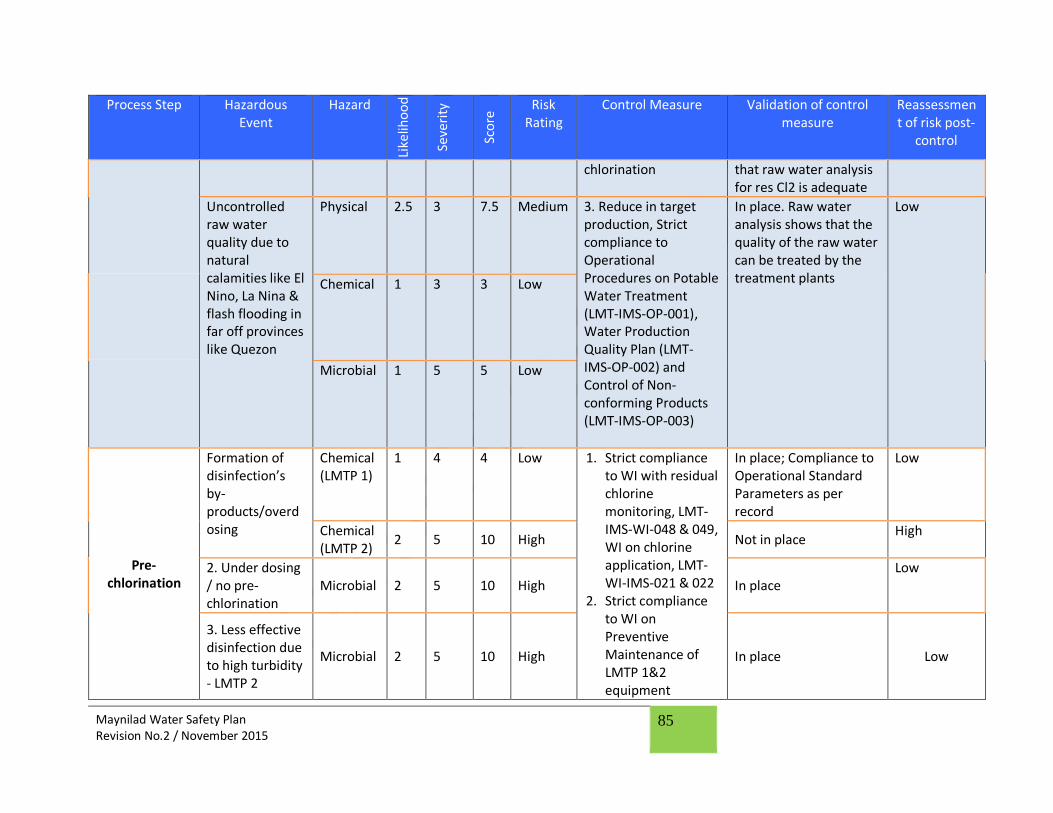
Maynilad Water Safety Plan Revision No.2 / November 2015
85
Process Step Hazardous Event
Hazard
Like
liho
od
Seve
rity
Sco
re Risk
Rating Control Measure Validation of control
measure Reassessment of risk post-
control
chlorination that raw water analysis for res Cl2 is adequate
Uncontrolled raw water quality due to natural calamities like El Nino, La Nina & flash flooding in far off provinces like Quezon
Physical 2.5 3 7.5 Medium 3. Reduce in target production, Strict compliance to Operational Procedures on Potable Water Treatment (LMT-IMS-OP-001), Water Production Quality Plan (LMT-IMS-OP-002) and Control of Non-conforming Products (LMT-IMS-OP-003)
In place. Raw water analysis shows that the quality of the raw water can be treated by the treatment plants
Low
Chemical 1 3 3 Low
Microbial 1 5 5 Low
Pre-chlorination
Formation of disinfection’s by-products/overdosing
Chemical (LMTP 1)
1 4 4 Low 1. Strict compliance to WI with residual chlorine monitoring, LMT-IMS-WI-048 & 049, WI on chlorine application, LMT-WI-IMS-021 & 022
2. Strict compliance to WI on Preventive Maintenance of LMTP 1&2 equipment
In place; Compliance to Operational Standard Parameters as per record
Low
Chemical (LMTP 2)
2 5 10 High Not in place High
2. Under dosing / no pre-chlorination
Microbial 2 5 10 High In place Low
3. Less effective disinfection due to high turbidity - LMTP 2
Microbial 2 5 10 High In place Low

Maynilad Water Safety Plan Revision No.2 / November 2015
86
Process Step Hazardous Event
Hazard
Like
liho
od
Seve
rity
Sco
re Risk
Rating Control Measure Validation of control
measure Reassessment of risk post-
control
3. Duplicate facilities like chlorinators
4. Insufficient Chlorine Supply
Microbial 2 5 10 High 1. Regular Stock Monitoring; Maintain Stock Balance
2. Accreditation of Multiple Supplier
3. Use of alternative Chemical for Disinfection
In place. Stock balance is closely monitored physically and is reflected in SAP.
Low
5. Chlorine Supply Quality (Non-Compliance)
Chemical 2 4 8 Medium 1. Use of alternative Chemical for Disinfection
2. Certificate of Analysis is required before delivery acceptance
In place. Low
Microbial 2 5 10 High
Coagulation
Incorrect dispersal of coagulant due to rapid mixer trouble
Physical 3 3 9 Medium 1. PMS rapid mixers / feed pumps / transfer pumps weekly
2. Ocular inspection & Creation of Job Order per shift for immediate action of TPM
In place. When not all Rapid Mixers are operational, adjustments in mixing speed are done on the flocculators.
Low.
Chemical 3 3 9 Medium

Maynilad Water Safety Plan Revision No.2 / November 2015
87
Process Step Hazardous Event
Hazard
Like
liho
od
Seve
rity
Sco
re Risk
Rating Control Measure Validation of control
measure Reassessment of risk post-
control
Overdosing / under dosing
Physical 3 2 6 Medium Online water quality monitoring and manual calibration as basis of chemical dosing adjustment
In place, but needs improvement. As evidenced by records on file, dosing equipment need replacement
Medium
Chemical 3 3 9 Medium Strict compliance to WI on Alum Application, LMT-IMS-WI-013. For strict implementation
Feed rate interruption due to (a). Clogging of feed lines and (b). Dosing pump / transfer pump trouble
Physical 4 2 6 Medium 1. Regular flushing of feed lines
2. Strict compliance to WI on PM of LMTP 1&2 equipment
In place but needs improvement
Medium
Chemical 4 2 6 Medium Medium
Insufficient Coagulant Supply
Physical 2 2 4 Medium 1. Accreditation of multiple supplier
2. Alternative chemical for coagulation
3. Chemical dosing optimization
4. Strict implementation of raw material specification contracts and refer
In place. Deliveries are accepted after passing the set quality standards
Low
Chemical 2 3 6 Medium In place. Appropriate dose recommendations are done according to monitored results.
Low
Coagulant Supply Quality (Non Compliance)
Physical 2 2 4 Low
In place. Deliveries are accepted after passing the set quality standards
Low,

Maynilad Water Safety Plan Revision No.2 / November 2015
88
Process Step Hazardous Event
Hazard
Like
liho
od
Seve
rity
Sco
re Risk
Rating Control Measure Validation of control
measure Reassessment of risk post-
control
Chemical 2 2 4 Low
to LMT-IMS-WI-001, Acceptance and Storage Procedure on Treatment Chemicals
In Place Low
Flocculation (LMTP 1)
Incorrect setting of variators / flocculators
Physical 3 1 3 Low 1. Follow flocculation
process WI 2. PMS of dosing
pumps / accessories and flocculation facilities
Chemical 3 2 6 Medium
Overdosing / Under dosing of coagulant aid
Physical 3 2 6 Medium 1. Strict compliance
to WI on Polymer solution preparation
2. Strict compliance to WI with pH, turbidity monitoring, LMT-IMS-WI-048 &049
In place. Applicable procedures are being followed.
Low
Chemical 3 3 9 Medium
Sedimentation (LMTP 1)
Sludge blanket formation exceeds 10 meters length from entry into
Physical 3 2 6 Medium 1. Regular onsite
inspection, maintain optimum chemical dosing and calibration
In place. Proper dosing and calibration are being followed
Low
Chemical 3 2 6 Medium In Place Low

Maynilad Water Safety Plan Revision No.2 / November 2015
89
Process Step Hazardous Event
Hazard
Like
liho
od
Seve
rity
Sco
re Risk
Rating Control Measure Validation of control
measure Reassessment of risk post-
control
sedimentation basin
Microbial 3 5 15 High 2. Sludge depth
profiling twice a year
3. Strict compliance to WI on Cleaning of Sedimentation Basins
4. . Strict compliance to WI with pH, turbidity & residual chlorine monitoring, LMT-IMS-WI-048 & 049
In Place Low
Sludge bulking Physical 1 3 3 Low
In place. Sludge profile and cleaning of sedimentation basins are done regularly
Low
Chemical 1 3 3 Low
Microbial 1 3 3 Low
Floating leaves and other floatables
Physical 5 1 5 Low 1. Scoop out floatables manually daily
In Place Low Chemical 5 1 5 Low
Microbial 5 1 5 Low
Formation of algae in Sedimentation Basin (Launders)
Microbial 2 3 6 Medium
Regular manual scrubbing and pressure washing of launders.
In place but needs improvement
Low, addition to the existing control measure is the use of Sodium Hypochlorite
Pulsation (LMTP 2)
Sludge blanket blow down Physical 2.5 3 7.5 Medium
1. Maintain correct sludge homogeneity
In place but needs improvement
Medium
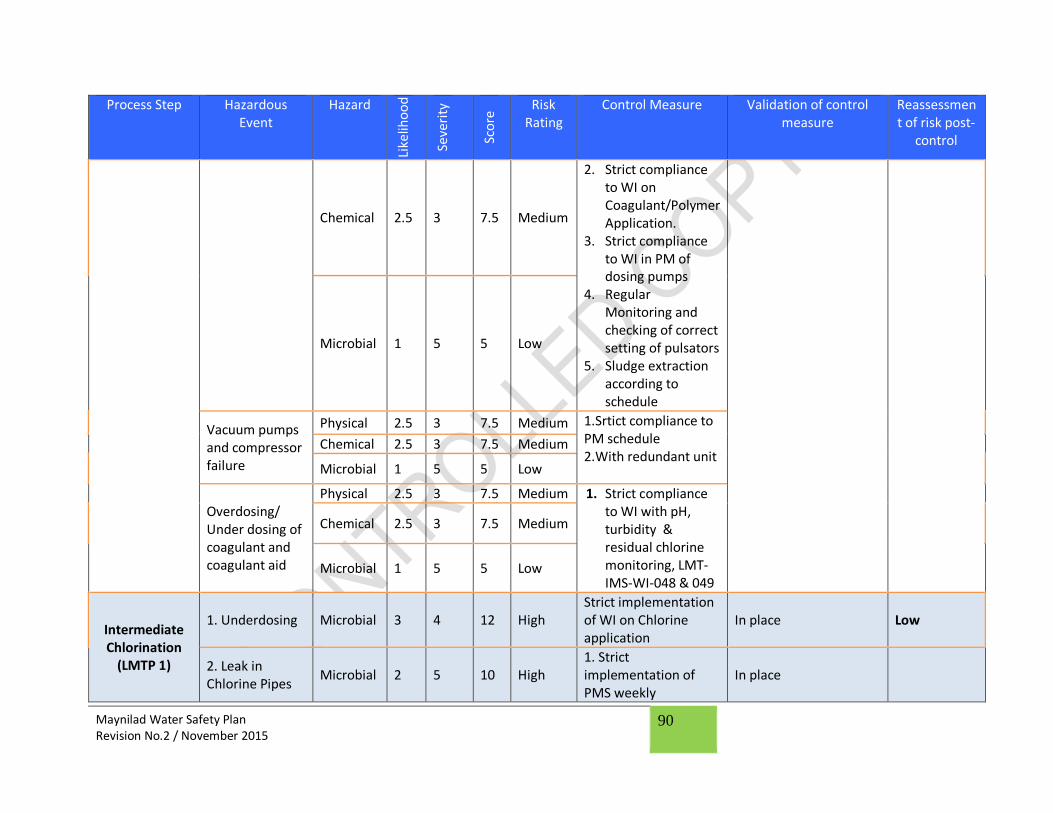
Maynilad Water Safety Plan Revision No.2 / November 2015
90
Process Step Hazardous Event
Hazard
Like
liho
od
Seve
rity
Sco
re Risk
Rating Control Measure Validation of control
measure Reassessment of risk post-
control
Chemical 2.5 3 7.5 Medium
2. Strict compliance to WI on Coagulant/Polymer Application.
3. Strict compliance to WI in PM of dosing pumps
4. Regular Monitoring and checking of correct setting of pulsators
5. Sludge extraction according to schedule
Microbial 1 5 5 Low
Vacuum pumps and compressor failure
Physical 2.5 3 7.5 Medium 1.Srtict compliance to PM schedule 2.With redundant unit
Chemical 2.5 3 7.5 Medium
Microbial 1 5 5 Low
Overdosing/ Under dosing of coagulant and coagulant aid
Physical 2.5 3 7.5 Medium 1. Strict compliance to WI with pH, turbidity & residual chlorine monitoring, LMT-IMS-WI-048 & 049
Chemical 2.5 3 7.5 Medium
Microbial 1 5 5 Low
Intermediate Chlorination
(LMTP 1)
1. Underdosing Microbial 3 4 12 High Strict implementation of WI on Chlorine application
In place Low
2. Leak in Chlorine Pipes
Microbial 2 5 10 High 1. Strict implementation of PMS weekly
In place

Maynilad Water Safety Plan Revision No.2 / November 2015
91
Process Step Hazardous Event
Hazard
Like
liho
od
Seve
rity
Sco
re Risk
Rating Control Measure Validation of control
measure Reassessment of risk post-
control
3. Less effective disinfection due to high turbidity
Microbial 1 4 4 Low Maintain settled water turbidity at <10NTU
In place , coagulation, flocculation & sedimentation process are effective
Low
4. Insufficient Chlorine Supply
Microbial 2 5 10 High
1. Regular Stock Monitoring; Maintain Stock Balance
2. Accreditation of Multiple Supplier
In place , stock balance is closely monitored physically and is reflected in SAP.
Low
5.Chlorine Supply Quality ( Non-Compliance)
Chemical 2 4 8 Medium 1. Use of alternative Chemical for disinfection
2. Submission of Certificate of Analysis by suppliers
In place Low Microbial 2 5 10 High
Filtration (LMTP 1/ LMTP 2)
1. Poor performance of filters as surface wash (LMTP 1), scour air blower (LMTP 2) are not operating well 2. Depleted filter media 3. Electro-mechanical and electro-
Physical 1 3 3 Low 1. Strict compliance to WI with pH, turbidity & residual chlorine monitoring, LMT-IMS-WI-048 & 049
2. Strict compliance to PMS weekly
3. Strict compliance to WI on backwashing
In place. procedures are being followed
Low Chemical 1 4 4 Low
Microbial 1 5 5 Low

Maynilad Water Safety Plan Revision No.2 / November 2015
92
Process Step Hazardous Event
Hazard
Like
liho
od
Seve
rity
Sco
re Risk
Rating Control Measure Validation of control
measure Reassessment of risk post-
control
pneumatic system failure 4. Excessive algal formation due to irregular and inefficient backwashing
Backwashing
Improper Backwashing (Time)
Physical 2 3 6 Medium 1. Strict Compliance to Proper Backwashing Procedure (Time of Rinsing, Scheduled Date of Backwash)
In place, regular back washing as per schedule in the WI. Criteria for backwashing are monitored & responded to immediately
Low
Microbial 2 5 10 High
Recovery Highly Turbid Recovered Water
Physical 5 3 15 Very High
1. Allow Settling time of washed water at the lagoons before recovery;
2. Shut off recovery pumps at LMTP 1 if recovered water turbidity is high
3. Additional coagulant dose at LMTP 2 during recovery.
In place, for improvement
High, for implementation of sludge management master plan
Chemical 5 2 10 High
Microbial 1 5 5 Low
Post Chlorination
1. Residual Chlorine greater than 1.50 ppm
Chemical 1 4 4 Low 1. Strict compliance to
WI with pH, turbidity &
In place Low

Maynilad Water Safety Plan Revision No.2 / November 2015
93
Process Step Hazardous Event
Hazard
Like
liho
od
Seve
rity
Sco
re Risk
Rating Control Measure Validation of control
measure Reassessment of risk post-
control
2. Under dosing
Microbial
2 5 10 High
residual chlorine monitoring, LMT-IMS-WI-048 & 049
2. Strict compliance to WI on chlorine application
3. PMS weekly 4. Efficient
chlorination facilities with back-ups
5.Operator's competency on proper Chlorine handling
3. Leak in Chlorine Pipes
2 5 10 High
4. Insufficient Chlorine Supply
1 5 5 Low Regular Stock Monitoring; Maintain Stock Balance
5. Chlorine Supply Quality (non-compliance)
Chemical 2 4 8 Medium Accreditation of Multiple Supplier
Microbial 2 5 10 High
Alternative Chemical for Disinfection
All Process Step
1. Power outage / unbalanced power supply which stop the entire treatment process
Physical 2 3 6 Medium 1. Back-up power generation
2. Efficient Genset working condition, refer to WI on Gen Set Operation and Refuelling,LMT-
In place; automatic shift to generator set in case of power outage
Low
Chemical 2 4 8 Medium
Microbial 2 5 10 High

Maynilad Water Safety Plan Revision No.2 / November 2015
94
Process Step Hazardous Event
Hazard
Like
liho
od
Seve
rity
Sco
re Risk
Rating Control Measure Validation of control
measure Reassessment of risk post-
control
2. Gen set breakdown
Physical 1 3 3 Low IMS-WI-036, LMT-IMS-WI-038 & LMT-IMS-WI-039
Chemical 1 4 4 Low
Microbial 1 5 5 High
3. Internal/external sabotage (i.e. Terrorist attack) & illegal tampering of plant facilities like opening of alum tank drain, unauthorized resetting of dosing pumps or dumping of large volume of sand upstream
Physical 1 3 3 Low
3. Maintaining tight security measures round the clock
In place with enough security force assigned in the plants
Low but can still be improved Chemical 1 4 4 Low
Microbial 1 5 5 Low

Maynilad Water Safety Plan Revision No.2 / November 2015
95
C. Water Treatment: Putatan Water Treatment Plant
Pro
cess
St
ep
Hazardous Event Hazard
Like
liho
od
Seve
rity
Sco
re
Risk rating
Control Measure Validation of
control measure
Reassessment of risk post
control
INTA
KE
Elevated levels of chlorides and total dissolved solids during El Nino
Physical
1.5 5 7.5 Medium Coordination with MMDA on the operation of Manggahan
and Napindan Floodgates Not yet in place Medium Chemical
Elevated levels of manganese, ammonia, during El Nino and monsoon seasons
Physical
1.5 5 7.5 Medium
Full utilization of Automatic Weather Station (AWS)
In place but data gathered are not yet
fully used Medium
Chemical Chlorine application for ammoina reduction
Effective dosing Low Microbial
Human Access Physical
Physical
2 5 10 High Heighten security around the intake
Effective security around the premises
Low Chemical
Microbial
Salt water backflow from Manila Bay
Physical
5 5 25 Very High
Coordination with MMDA on the operation of Napindan
and Manggahan Flood Gates Not yet in place Very High Chemical
Microbial
Algal Bloom Physical
Chemical Microbial
2.5 5 12.5 High
Putting water lilies along the intake flow path; Installation
of movable plank at the intake entry points
Effective in reducing algae growth within
the area planted; Medium
Proliferation of Fish pens
Physical
3 5 15 High
Coordination with LLDA and other stakeholders to
regulate fish pen
Not in place High Chemical
Microbial
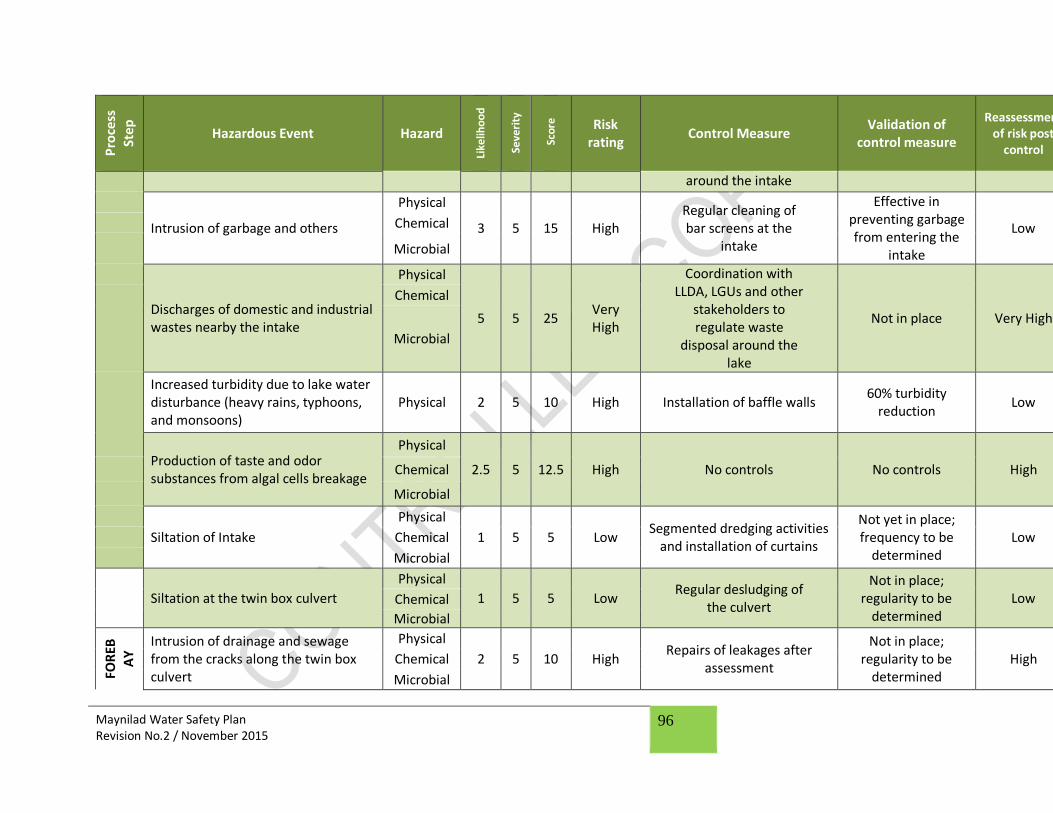
Maynilad Water Safety Plan Revision No.2 / November 2015
96
Pro
cess
St
ep
Hazardous Event Hazard
Like
liho
od
Seve
rity
Sco
re
Risk rating
Control Measure Validation of
control measure
Reassessment of risk post
control
around the intake
Intrusion of garbage and others
Physical
3 5 15 High Regular cleaning of bar screens at the
intake
Effective in preventing garbage from entering the
intake
Low Chemical
Microbial
Discharges of domestic and industrial wastes nearby the intake
Physical
5 5 25 Very High
Coordination with LLDA, LGUs and other
stakeholders to regulate waste
disposal around the lake
Not in place Very High
Chemical
Microbial
Increased turbidity due to lake water disturbance (heavy rains, typhoons, and monsoons)
Physical 2 5 10 High Installation of baffle walls 60% turbidity
reduction Low
Production of taste and odor substances from algal cells breakage
Physical
2.5 5 12.5 High No controls No controls High Chemical
Microbial
Siltation of Intake
Physical
1 5 5 Low Segmented dredging activities
and installation of curtains
Not yet in place; frequency to be
determined Low Chemical
Microbial
Siltation at the twin box culvert
Physical
1 5 5 Low Regular desludging of
the culvert
Not in place; regularity to be
determined Low Chemical
Microbial
FOR
EBA
Y Intrusion of drainage and sewage
from the cracks along the twin box culvert
Physical
2 5 10 High Repairs of leakages after
assessment
Not in place; regularity to be
determined High Chemical
Microbial

Maynilad Water Safety Plan Revision No.2 / November 2015
97
Pro
cess
St
ep
Hazardous Event Hazard
Like
liho
od
Seve
rity
Sco
re
Risk rating
Control Measure Validation of
control measure
Reassessment of risk post
control
Algae intrusion
Physical
2 5 10 High No controls No controls High Chemical
Microbial
Solid Waste Intrusion (e.i.garbage and twigs)
Physical
5 5 25 Very High
Regular cleaning of the forebay
Not in place Very High Chemical
Microbial
Intrusion of BAF. MF, UF and RO backwash water from the water recovery system
Physical
5 5 25 Very High
Dosing of KMnO4 In place Low Chemical
Microbial
Siltation at the bottom of the forebay
Physical
2 5 10 High Biennial desludging and Operation of Aerators
Effective desludging based on sludge
profiling conducted; Currently in Place
Low Chemical
Microbial
Improper dosing of potassium permanganate
Physical
5 5 25 High Chemical Optimization Effective dosing
system Low Chemical
Microbial
Solid Waste Intrusion (e.i.garbage and twigs)
Physical
5 5 25 Very High
Operation of mechanical trash rack at
forebay outlet including PMS Effective screening Low Chemical
Microbial
Improper dosing of coagulant
Physical
2 5 10 High Replacement of automatic
chemical dosing pump remote operation
Effective dosing but still needs to
reconnect to SCADA for remote monitoring
Medium Chemical
Microbial
DIS
SOLV
E
D A
IR
FLO
TATI
ON
CO
AG
ULA
TIO
N/F
LO
CC
ULA
TIO
N/F
LOTA
TIO
N Malfunction of pump for coagulant
flash mixing
Physical
2 5 10 High PMS and installation of
back-up pump In place. Reduced
downtime Low Chemical
Microbial
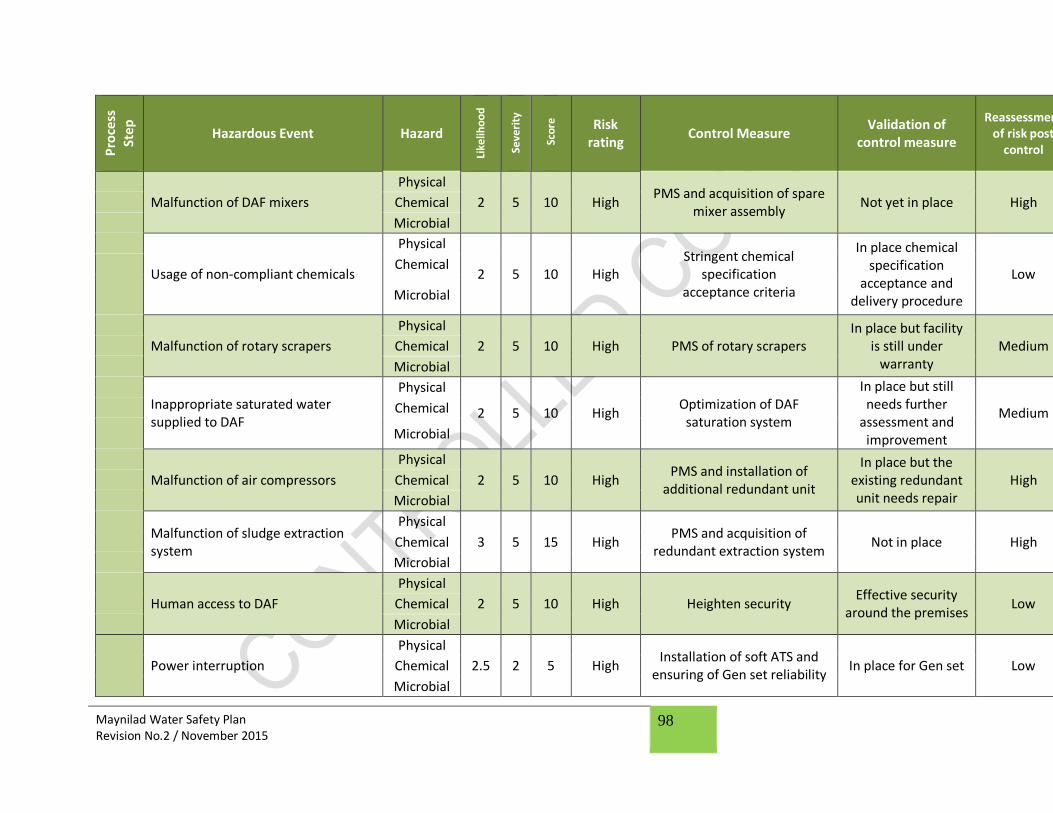
Maynilad Water Safety Plan Revision No.2 / November 2015
98
Pro
cess
St
ep
Hazardous Event Hazard
Like
liho
od
Seve
rity
Sco
re
Risk rating
Control Measure Validation of
control measure
Reassessment of risk post
control
Malfunction of DAF mixers
Physical
2 5 10 High PMS and acquisition of spare
mixer assembly Not yet in place High Chemical
Microbial
Usage of non-compliant chemicals
Physical
2 5 10 High Stringent chemical
specification acceptance criteria
In place chemical specification
acceptance and delivery procedure
Low Chemical
Microbial
Malfunction of rotary scrapers
Physical
2 5 10 High PMS of rotary scrapers In place but facility
is still under warranty
Medium Chemical
Microbial
Inappropriate saturated water supplied to DAF
Physical
2 5 10 High Optimization of DAF
saturation system
In place but still needs further
assessment and improvement
Medium Chemical
Microbial
Malfunction of air compressors
Physical
2 5 10 High PMS and installation of
additional redundant unit
In place but the existing redundant unit needs repair
High Chemical
Microbial
Malfunction of sludge extraction system
Physical
3 5 15 High PMS and acquisition of
redundant extraction system Not in place High Chemical
Microbial
Human access to DAF
Physical
2 5 10 High Heighten security Effective security
around the premises Low Chemical
Microbial
Power interruption
Physical
2.5 2 5 High Installation of soft ATS and
ensuring of Gen set reliability In place for Gen set Low Chemical
Microbial
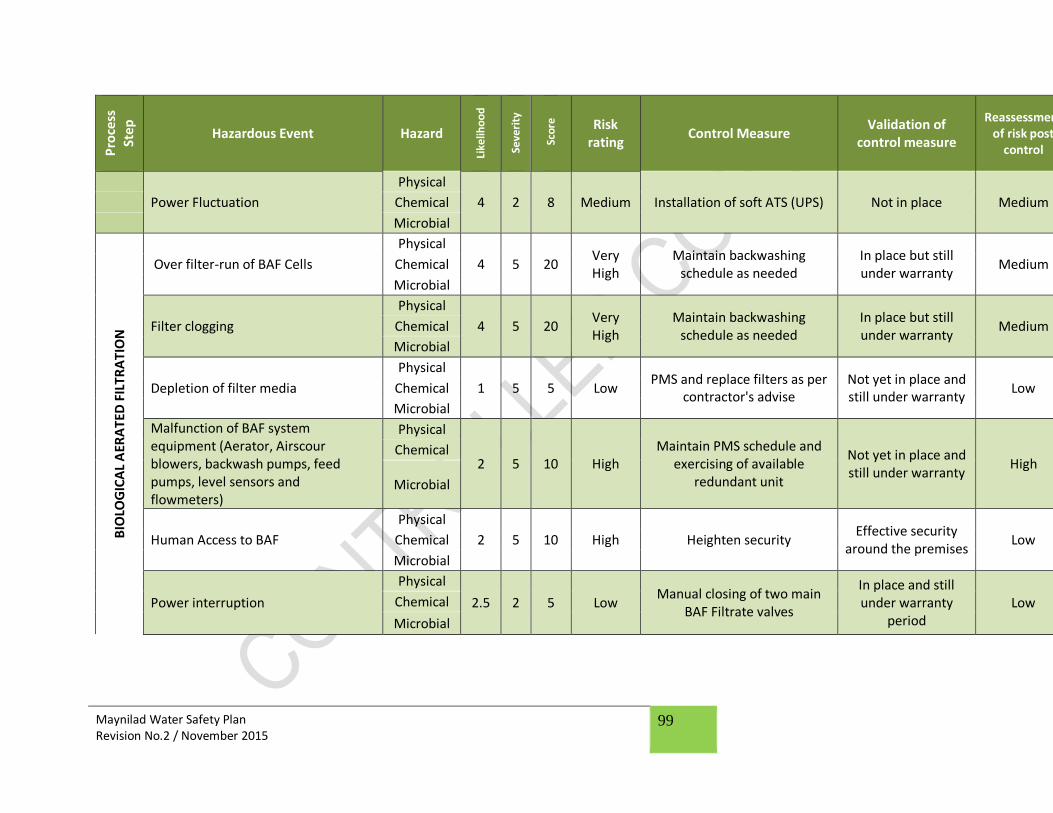
Maynilad Water Safety Plan Revision No.2 / November 2015
99
Pro
cess
St
ep
Hazardous Event Hazard
Like
liho
od
Seve
rity
Sco
re
Risk rating
Control Measure Validation of
control measure
Reassessment of risk post
control
Power Fluctuation
Physical
4 2 8 Medium Installation of soft ATS (UPS) Not in place Medium Chemical
Microbial
BIO
LOG
ICA
L A
ERA
TED
FIL
TRA
TIO
N
Over filter-run of BAF Cells
Physical
4 5 20 Very High
Maintain backwashing schedule as needed
In place but still under warranty
Medium Chemical
Microbial
Filter clogging
Physical
4 5 20 Very High
Maintain backwashing schedule as needed
In place but still under warranty
Medium Chemical
Microbial
Depletion of filter media
Physical
1 5 5 Low PMS and replace filters as per
contractor's advise Not yet in place and still under warranty
Low Chemical
Microbial
Malfunction of BAF system equipment (Aerator, Airscour blowers, backwash pumps, feed pumps, level sensors and flowmeters)
Physical
2 5 10 High Maintain PMS schedule and
exercising of available redundant unit
Not yet in place and still under warranty
High Chemical
Microbial
Human Access to BAF
Physical
2 5 10 High Heighten security Effective security
around the premises Low Chemical
Microbial
Power interruption
Physical
2.5 2 5 Low Manual closing of two main
BAF Filtrate valves
In place and still under warranty
period Low Chemical
Microbial

Maynilad Water Safety Plan Revision No.2 / November 2015
100
Pro
cess
St
ep
Hazardous Event Hazard
Like
liho
od
Seve
rity
Sco
re
Risk rating
Control Measure Validation of
control measure
Reassessment of risk post
control
MIC
RO
FILT
RA
TIO
N Wearing-out of amiad screens Physical 2 2 4 Low
Automatic stop of Amiad strainer with
unlikely flow rate and pressure and replacement
In place but still no redundant screens
Low
Breakage of MF fibers
Physical
2.5 5 12.5 High Ensure efficient pretreatment. In place Low Chemical
Microbial
Malfunction of MF valves due to no signal or inaccurate signal given
Physical
4 5 20 Very High
Automatic/ manual stop of MF rack with alarm indicating failed
open/close valves
In place effective alarm system
Low Chemical
Microbial
ULT
RA
FILT
RA
TIO
N Wearing-out of amiad screens Physical 2 2 4 Low
Automatic stop of Amiad strainer with
unlikely flow rate and pressure and replacement
In place but still no redundant screens
Low
Breakage of UF fibers
Physical
3 5 15 High Ensure efficient pre-treatment and follow other instructions
from the contractor
In place and still under warranty
period Low Chemical
Microbial
UF valves malfunction
Physical
4 5 20 High Create PMS scheme In place but still under warranty
Low Chemical
Microbial
REV
ERSE
O
SMO
SIS
Wearing-out and leakage of RO membranes
Physical
3 5 15 High
Automatic shutdown of RO skids with
alarmed operating limits, and membrane
replacement
In place alarm system but no spare
membranes Medium
Chemical
Microbial

Maynilad Water Safety Plan Revision No.2 / November 2015
101
Pro
cess
St
ep
Hazardous Event Hazard
Like
liho
od
Seve
rity
Sco
re
Risk rating
Control Measure Validation of
control measure
Reassessment of risk post
control
No available/ insufficient number of required RO running
Physical
3 3 9 High Reduce in water
production Effective Low Chemical
Microbial
CH
LOR
INA
TIO
N
Inaccurate dosing (underdose or overdose) of liquid chlorine
Physical
3 5 15 High
Regular PMS and optimization of
chlorine dose; Standby NaOCl, CaOCl
In place and effective
Low Chemical
Microbial
Absence of gas chlorine application due to system shutdown either by equipment malfunction or leaks
Microbial 2 5 10 High Standby Chlorination ( NaOCl,
Ca(OCl)2) and regular PMS
In place and effective standby
alternative chlorine dosing system and
PMS scheme
Low
Chlorination water pump malfunction
Chemical
3 5 15 High Create PMS scheme and
procure spare parts In place Medium Microbial
Limited or no supply of liquid/gas chlorine supply
Microbial 2 5 10 High Ensuring buffer stock and use
of alterntive disinfectants ( NaOCl, Ca(OCl)2)
In place and effective standby
alternative chlorine dosing system
Low
RES
ERV
OIR
Formation of Disinfection by-Products (DBPs)
3 4 12 High Inclusion of BAF process In place and
effective but still under warranty
Medium Chemical
Intrusion of rainwater or other unwanted matter to the reservoir
Physical Chemical Microbial
2.5 5 12.5 High Proper and secured
covers on all reservoir openings
In place and effective
Low

Maynilad Water Safety Plan Revision No.2 / November 2015
102
Pro
cess
St
ep
Hazardous Event Hazard
Like
liho
od
Seve
rity
Sco
re
Risk rating
Control Measure Validation of
control measure
Reassessment of risk post
control
Short circuiting of chlorine Chemical
2 5 10 Medium Enough retention time
is achieved using reservoir baffle walls
In place and effective
Low Microbial
Reservoir level is less than 15%.
Physical
2.5 4 10 High
Automatic shutdown of product water pump before reaching 15% water level at
reservoir
In place Low Chemical
Microbial
Wearing-off of baffle walls
Physical
1 5 5 Low Regular PMS Not in place Low Chemical
Microbial
Discoloration of product water when the reservoir level reached 1.5meters.
Physical
2.5 4 10 High Regular cleaning and
maintaining high level (3meters) of reservoir
In place but still needs for further
assessment Medium Chemical
Microbial
D. Groundwater
PR
OC
ESS
STEP
Hazardous Event Hazard
Like
liho
o
d
Seve
rity
Sco
re
Ris
k ra
tin
g
Control Measure Validation of control
measure
Reassessment of risk post-
control
Wel
l/C
atch
me
nt
Intrusion of solid particles through well casing causing turbid water.
Physical 5 3 15 High Maintain the pump rating capacity as per specifications.
Pump rating capacity is maintained however need to conduct pump well test to check water level drawdown
High

Maynilad Water Safety Plan Revision No.2 / November 2015
103
PR
OC
ESS
STEP
Hazardous Event Hazard
Like
liho
o
d
Seve
rity
Sco
re
Ris
k ra
tin
g
Control Measure Validation of control
measure
Reassessment of risk post-
control
Salt Intrusion Chemical 1 4 4 Low Maintain the pump rating capacity as per specifications
Pump rating capacity is not maintain as per specs.
Low.
Intrusion of contaminants from leaking septic tanks and indiscriminate disposal of wastes from domestic and commercial establishments nearby through ingress area
Physical Chemical Microbial
1 5
5
Low
Coordination with LGU and other concerned government offices.
In place Low
Dis
infe
ctio
n
Treatment failure due to clogging of chlorinator injector
Microbial 5 5 25 Very High
Daily preventive maintenance
In place however clogging of injector still occurs.
Very high
Treatment failure due to improper/Incorrect mixture of chlorine solution (human error)
Microbial 1 5 5 Low Procedures (SOPs) proper mixing of chlorine solution
Continuing operators training/orientation on Groundwater Standard Operational Procedures
In place. SOP’s were properly implemented. Pump operators were monitored after the training and effectiveness were validated by the results of periodic sampling of Central Laboratory
Low.
No chlorine supply due to chemical stock unavailability
Chemical Microbial
1 5 5 Low Implementation of monthly maintaining stock balance
In place. Effective delivery procedure
Low

Maynilad Water Safety Plan Revision No.2 / November 2015
104
PR
OC
ESS
STEP
Hazardous Event Hazard
Like
liho
o
d
Seve
rity
Sco
re
Ris
k ra
tin
g
Control Measure Validation of control
measure
Reassessment of risk post-
control
Malfunction/Breakdown of Chlorinator
Microbial 2 5 10 Medium Periodic maintenance and inspection on status of chlorinator With redundant unit
In place. Regular preventive maintenance is conducted by Maintenance Group With spare unit
Low.
Re
serv
oir
Intrusion of contaminant/s due to lost/unsecured vent covers on all reservoir openings
Physical Chemical Microbial
1
5
5
Low
Proper and secured covers on all reservoir openings
Vent covers are in place and effective
Low
Damage EWT due to natural calamities such as typhoon, earthquakes, etc.
Physical 1 3 3 Low Conduct periodic inspection and maintenance on the integrity of EWT Structures
In place. Low.

Maynilad Water Safety Plan Revision No.2 / November 2015
105
E. Distribution
Process Steps
Hazardous Event / Cause of Contamination
Hazard
Like
liho
od
Seve
rity
Ris
k
Ris
k R
ati
ng
Control Measure Validation of
control measure
Reassessment of risk post-
control
Storage 1. Intrusion of contaminants in reservoir due to unsecured/improper vent cover
Physical Chemical Microbial
2
5
10 High Proper and secured covers on all reservoir openings
In place. Low
2. Facility damage caused by natural calamity like earthquake/ typhoon,etc.
Physical Chemical Microbial
2 5 10 High Ensure proper design of facility Continuing reassessment of facility integrity
In place Low
3. Poor construction/workmanship of turned over facilities
Physical Chemical Microbial
2 5 10 High Review and assess the design of the facility and make the necessary agreement with the third party Regular inventory of Asset (Age, specs and design)
In place Low
4. Unprotected service reservoir access
Physical Chemical Microbial
2 5 10 High Fencing and security personnel deployment
In place Low
Transmission 1. Any hazard not controlled/ mitigated within the water treatment (La Nina/typhoon)
Physical Chemical Microbial
2.5
5
12.5
High
Regular water quality monitoring On-line chlorination (as the need arises)
In place but needs improvement
Medium
2. Contamination of water supply by backflow due to unauthorized/ illegal connection
Physical Chemical Microbial
2
5
10
High
Regular leak detection within the system Regular monitoring of zone management on unaccounted-for-water
In place but needs improvement
Medium

Maynilad Water Safety Plan Revision No.2 / November 2015
106
Process Steps
Hazardous Event / Cause of Contamination
Hazard
Like
liho
od
Seve
rity
Ris
k
Ris
k R
ati
ng
Control Measure Validation of
control measure
Reassessment of risk post-
control
3. Intrusion of contaminants due to water line breakage/burst
Physical Chemical Microbial
3 5 15 High Pressure management initiatives on District Meter Areas
Optimization on the operation of pump stations
In place but needs improvement
Medium
4. Contamination of water supply due to use of unapproved materials
Physical Chemical Microbial
1
5
5
Low
Material specification acceptance criteria
In place Low
5. Intrusion of contaminants due to pressure fluctuation
Physical Chemical Microbial
1 5 5 Low Maintain adequate water pressure 24hours 7 days a week
Pressure management initiatives on District Meter Areas
In place Low
6. Intrusion of contaminants due to cross under with leaking drainage during low water pressure
Physical Chemical Microbial
1 5 5 Low Maintain adequate water pressure 24/7 Regular updating/ monitoring of GIS mapping Regular water quality monitoring
In place Low
7. Intrusion of contaminants due to busted pipes that are accidentally damaged by other utilities.
Physical Chemical Microbial
1 5 5 Low Close coordination with other agencies
In place Low
8. Intrusion of contaminants due to deteriorated pipes (cross under pipelines) during low water pressure
Physical Chemical Microbial
2 5 10 High Maintain adequate water pressure 24/7 Regular monitoring of gauging/pressure point
In place but for improvement
Medium

Maynilad Water Safety Plan Revision No.2 / November 2015
107
Process Steps
Hazardous Event / Cause of Contamination
Hazard
Like
liho
od
Seve
rity
Ris
k
Ris
k R
ati
ng
Control Measure Validation of
control measure
Reassessment of risk post-
control
9. Intrusion of contaminants through deteriorated/leaking pipe/exposed mainline appurtenances due to flooding
Physical Chemical Microbial
2 5 10 High Regular assessment of isolation valve
In place Low
10. Intrusion of contaminants during cleaning of manholes for installation/insertion of equipment along the primary lines used for flow and pressure monitoring
Physical Chemical Microbial
1 5 5 Low Regular maintenance of manholes, proper cleaning of instrument and correct installation of equipment. Strict implementation of manhole cleaning and installation procedures
In place Low
11. Contamination of water supply due to security / vandalism /sabotage
Physical Chemical Microbial
1 5 5 Low Close coordination with LGU’s and Barangay Reward campaign system (Anti-illegal reward program: MWSI Oplan SIKAD)
In place Low
12. Intrusion of contaminants/ reversed or changed flow disturbing deposits due to opening and closing of valves
Physical Chemical Microbial
1 5 5 Low Strict implementation of operational procedure for valving
In place Low
13. Intrusion of contaminants due to intermittent water supply during drought (El Nino)
Physical Chemical Microbial
2 5 10 High Regular leak detection and water quality monitoring Pressure management initiatives on DMA
In place but needs improvement
Medium
Consumer premises
1. Any hazard not controlled/ mitigated within the
Physical Chemical
3 5 15 High Information and education campaign
In place but needs improvement
Medium

Maynilad Water Safety Plan Revision No.2 / November 2015
108
Process Steps
Hazardous Event / Cause of Contamination
Hazard
Like
liho
od
Seve
rity
Ris
k
Ris
k R
ati
ng
Control Measure Validation of
control measure
Reassessment of risk post-
control
distribution system Microbial
2. Lead contamination due to use of lead pipes within the consumer premises
Chemical 2.5 5 12.5 High Information and education campaign
In place Low
3. Contamination by backflow due to unauthorized/illegal connection
Physical Chemical Microbial
2 5 10 High Information and education campaign
In place but needs improvement
Medium
4. Contamination of water supply due to mixing of surface water and customer’s private well
Physical Chemical Microbial
2 5 10 High Maintain adequate water pressure 24/7 Information and education campaign
In place Low

Maynilad Water Safety Plan Revision No.2 / November 2015
109
ANNEX III: UPGRADE/ IMPROVEMENT PLAN
A. Water Sources: Surface
Issues Action Identified specific improvement plan
Accountability/ies Due
High turbidity during typhoon and heavy rains
Initiate tree planting activity in collaboration with other stakeholders (DENR, NPC, MWSS, MWC, LGU’s) Conduct feasibility study for the construction of Sabo Dam
Tree Planting in collaboration with other stakeholders (DENR, NPC, MWSS, MWC) Construction of Sabo Dam
QESH/Environment Management Dept. CPF & PMG
Continuous activity ASAP, if found worthy
Malfunction of Turbidimeter Regular calibration of turbidimeter Provision of spare turbidimeter
Prepare calibration program for turbidimeter Purchase new spare turbidimeter
CPF & PSS Quarterly (primary standard calibration), Daily check using secondary standard 1st quarter of 2013

Maynilad Water Safety Plan Revision No.2 / November 2015
110
B. Water Treatment: La Mesa Water Treatment Plant 1&2
Process Step / Issues Issues Action Identified specific improvement plan
Accountability/ies Due
Screening (Primary/Secondary)
The installed screens in the open canal at LMTP 1 and adjacent to LMTP 2 plant inlet had been identified as insufficient to prevent entry of debris from Umiray-Angat-Ipo Dams. Significant amount of debris were known to have entered the plants leading to (1) decrease in detention period in the coagulation& flocculation process and (2) prolonged cleaning process in the chambers.
Study the possibility of optimizing screen installation. Required CAPEX project had been identified and was submitted to PMG for design.
CAPEX project on the repair of current screens and installation of additional mechanical grit or trash rack at LMTP 1&2 open canals had been approved and now with PMG.
WP / PMG EO 2013
During extreme weather conditions, raw water with very high turbidity and suspended solids had entered LMTP 1&2. This episode had happened repeatedly and the control measure in place affects our service level to our customers.
Reduce the turbidity & suspended solids of the incoming raw water upstream of the La Mesa portal to a maximum of 500 NTU only as per plant design.
Prepare proposal for the installation of a system that would reduce most suspended solids before the water enters the plant.
CPF, WP & PMG
Prepare proposal for the possibility of joint use of La Mesa Dam during poor raw water quality periods.
CPF, WP, PMG & MWSS
Pre-chlorination The risks of forming disinfection by-products during
Review and improve LMTP 2 plant design
Installation of new intermediate
WP / PMG EO 2015

Maynilad Water Safety Plan Revision No.2 / November 2015
111
Process Step / Issues Issues Action Identified specific improvement plan
Accountability/ies Due
chlorination of very turbid water had been identified at LMTP 2. LMTP 2 is not designed to accept any control measure.
chlorination point of application so that no chlorination of very turbid water will happen.
Disinfection is less effective in water with very high turbidity. No control measure can be effected at LMTP 2.
Coagulation
Overdosing / underdosing of coagulant caused by old equipment had been identified in the risk assessment process. The existing controls are not enough to eliminate occurrence of the problem.
The need to replace with a new application system had been approved and will be implemented.
The CAPEX project on "Installation of New Coagulant System" had been submitted to PMG. It is now in the final stages of design.
WP / PMG EO 2013 Interruption of coagulant feedrate had been identified as a continuing risk due to clogging of feedlines and trouble in dosing pump or transfer pump. Existing control is not enough to significantly lower the risks.
Sedimentation
Noticeable formation of algae in the launders of the sedimentation basins had been identified to possibly cause biological, taste and odor problems if not removed completely.
The sedimentation basin cleaning procedure will be reviewed.
Develop a procedure for use of Sodium Hypochlorite solution in cleaning the sedimentation basin launders.
WP EO 2013

Maynilad Water Safety Plan Revision No.2 / November 2015
112
Process Step / Issues Issues Action Identified specific improvement plan
Accountability/ies Due
Pulsation (LMTP 2)
1. Sludge blanket blow down Review LMTP 2 sludge management; redesign, as an option will be considered if necessary. Service of a consultant will be tapped.
1. Replace Defective Pulsator Setting Controls;
2. Increase size of conveyance pipe accordingly;
3. Additional Sludge Slurry Pumps
WP / PMG EO 2015 Overdosing/ Under dosing of coagulant and coagulant aid
Vacuum pumps and compressor failure
Recovery Highly Turbid Recovered Water
(1). Restore original storage capacity of 4 lagoons for LMTP 1.
Implement effective sludge management system
WP / PMG
EO 2015
(2) Review LMTP 2 wash water recovery system.
Prepare proposal for the construction of overflow type weir
All Process Step 2. Overdosing/ Under dosing of coagulant and coagulant aid
Improve the security protocols of the plants.
Installation of Close-Circuit Television (CCTV) at strategic places of the plants
WP / PMG/ Fleet & Premises
EO 2013

Maynilad Water Safety Plan Revision No.2 / November 2015
113
C. Water Treatment Plant: Putatan Water Treatment Plant
Issues Action Identified Specific Improvement Plan Accountabilities Due
1. Risk assessment process has identified that, indeed, there are
elevated levels of chlorides and total dissolved solids during El Nino. But at
the moment, there is no existing control measure to prevent its effect.
Coordinate with MMDA on the operation of
Manggahan and Napindan Floodgates during El Nino events
Close Napindan flood gates and open the Manggahan floodgates to provide dilution to existing Laguna Lake water.
PWTP, MMDA, LLDA, TMT
Before End of 2015
2. Risk assessment process has identified that the control measure to address elevated levels of manganese during El Nino and monsoon seasons is not enough to prevent its effect in
the lake water quality.
Make use of the data from installed
Automatic Weather Station at the Intake
Apply relevant statistical methods to correlate weather conditions to water
quality parameters. This will help in predicting the occurrence of elevated
levels of the stated parameters.
PWTP Jan-16
3. Risk assessment process has identified that there is salt water
backflow from Manila Bay and other tributaries. However, there is no
control measure at hand.
Coordinate with MMDA on the
Napindan Gates operation
If it is not possible to fully close, at least minimize the opening of
Napindan flood gates to reduce backflow from Manila Bay and open
Manggahan Flood gate to futher reduce salinity of the lake water
PWTP, MMDA, LLDA, TMT
Before End of 2015
4. Risk assessment process has identified that the control measure to prevent algal bloom is not enough in averting its effects on water quality.
Installation of movable plank at
intake points on top of placing water lilies along the water flow
path.
Install movable plank that could serve as barrier to the algal bloom aside from
putting water lilies on the water flow path.
PWTP, PMD 1st Quarter of
2016
5. Risk assessment process has identified for proliferation of fish pens
causing nutrient overloading in the lake. However, there is no approach to quantify and regulate the number of fishes seeded in every fish pens.
Coordinate with LLDA, LGUs and other
involved agencies for strict and monitored
regulation of fish pens around the intake.
Identify the area within the lake and the specific fish pens wherein PWTP
will closely monitor the fish pens. Monitor feeding details and number of
fishes seeded each fish pen.
PWTP, LLDA, LGU, CQESH
Every quarter

Maynilad Water Safety Plan Revision No.2 / November 2015
114
Issues Action Identified Specific Improvement Plan Accountabilities Due
6. For the discharges (domestic and industrial wastes) at the intake, there
is no currently identified control measure to prevent their effects on
the water quality.
Coordinate with LLDA, LGUs and other
stakeholders to regulate waste disposal in the
lake.
Identify the types of industries and other possible domestic waste outlets
surrounding the intake. Once identified, coordinate with the
concerned LGUs (ie. LLDA) regarding the implementation of discharge
policies.
PWTP, LLDA, LGU, CQESH
Every quarter
7. Risk assessment process has identified for the production of taste and odor substances from algal cells breakage at the lake. But there is no identified control measure regarding
this hazard.
Choose the appropriate
equipment that could immediately analyze
taste and odor compounds and, if possible, map the
existence of algae that produced them.
Procure the chosen technology that could analyze taste and odor
compounds and recommend proper lake management based on data
gathered.
PWTP, CQESH, Procurement
Jan-16
8. Risk assessment process has identified that there is no control
measure to address the intrusion of drainage and sewage from the cracks
along the twin box culvert.
Yearly monitoring of twin box culvert
through CCTV and leak detection
Repair of major leaks and/or rehabilitation of damaged twin box
culvert.
PWTP, WN, PMD
Annually
9. Risk assessment process has identified that there is no control
measure to address algae intrusion in the forebay.
Implement measure to control risks arising
from algal bloom.
Cover the forebay area with appropriate material that can inhibit
the growth of algae and shutdown the aerators.
PWTP As Needed
10. Risk assessment process has identified for the solid waste
intrusion. As of the moment, control measure is still to be determined.
Establish regular cleaning schedule
Manual removal of solid wastes accumulated at the forebay.
PWTP As Needed

Maynilad Water Safety Plan Revision No.2 / November 2015
115
Issues Action Identified Specific Improvement Plan Accountabilities Due
11. Risk assessment process has identified that the control measure to prevent improper coagulant dosing is
not enough because the remote operation of the chemical dosing system is defective. Thus, water
quality is still at risk.
Procure a replacement unit for
the defective instrument that enables remote operation of the chemical dosing
system
Replace the defective instrument and perform signal fine-tuning and
synchronize with the existing chemical dosing system
PWTP, A&I, PMD
1st Quarter of 2016
12. Risk assessment process has identified that the control measure for
the malfunctioning of DAF mixers is already thought-of but not yet in
place.
Create a PMS scheme and procure a
redundant assembly for added reliability.
Perform PMS according to its schedule and ensure availability of spare parts
PWTP, Procurement
2nd Quarter of 2016
13. Risk assessment process has identified that the control measure for the malfunctioning of rotary scrapers is not yet fully implemented because the equipment is still under warranty.
Create a PMS scheme Implement and monitor the PMS
scheme created after the instrument has been turned-over.
PWTP, PMD Before End of 2016
14. Risk assessment process has identified that the control measure for the inappropriate supply of saturated
water to DAF still needs further assessment and improvement.
Optimize the DAF saturation system
Work with the initial settings from the contractor and slowly iterate until the
optimum operating values are achieved.
PWTP, PMD Before End of 2016
15. Risk assessment process has identified that the control measure for the malfunctioning of air compressors
is already in place and effective but still needs reliability enhancement.
Create a PMS scheme and procure
redundant units for added reliability.
Perform PMS according to its schedule PWTP,
Procurement Before End of 2015

Maynilad Water Safety Plan Revision No.2 / November 2015
116
Issues Action Identified Specific Improvement Plan Accountabilities Due
16. Risk assessment process has identified that the control measure for
the malfunctioning of sludge extraction system is not yet in place.
Create a PMS scheme and acquire
redundant system for added reliability.
Perform PMS according to its schedule PWTP,
Procurement, PMD
2nd Quarter of 2016
17. Risk assessment process has identified that the control measure for
the power fluctuation is not yet in place. Thus, this hazard still pose
threat to the treated water quality.
Procure applicable soft ATS (UPS) for the
DAF system Install the acquired soft ATS (UPS) PWTP, PMD Before End of 2016
18. Risk assessment process has identified that the control measure for
the over filter-run of BAF cells is in place but still under warranty.
Set backwashing schedule
Strictly implement and monitor BAF backwashing schedules.
PWTP, PMD Before End of 2016
19. Risk assessment process has identified that the control measure for
the filter clogging is in place but still under warranty.
Set backwashing schedule
Strictly implement and monitor BAF backwashing schedules.
PWTP, PMD Before End of 2016
20. Risk assessment process has identified that the control measure for
the malfunctioning of BAF system equipment and communication
elements is not yet in place and still under warranty.
Create PMS scheme Perform PMS according to its schedule PWTP, PMD Before End of 2016
21. Risk assessment process has identified that the control measure for
the wearing-out and leakage of RO membranes is in place but still needs
spare filters to increase reliability.
Identify RO membrane breakages
and perform necessary inspection
procedures.
Procure the needed number of membranes to be replaced and
continue the scheduled PMS activities to check possible wearing-out and/or
leakages.
PWTP, Logistics, PMD
Before End of 2016

Maynilad Water Safety Plan Revision No.2 / November 2015
117
Issues Action Identified Specific Improvement Plan Accountabilities Due
22. Risk assessment process has identified that the control measure for chlorination water pump malfunction
is in place yet can still improve.
Set regular PMS schedule and
integrate to new management program
Perform regular PMS schedule and ensure availabilty of spare parts.
PWTP, Procurement
Before End of 2015
23. Risk assessment process has identified that the control measure in the formation of DBPs is effective but
still under warranty.
Integrate BAF to the whole treatment
process
Optimize BAF process according to contractor's instructions.
PWTP, PMD Before End of 2016
24. Risk assessment process has identified that the control measure to
prevent discoloration of product water is currently in place but still
needs improvement.
Coordinate with SPM regarding the most convenient time to clean the reservoir
Perform regular reservoir cleaning to avoid siltation and deposition of other
contaminants. PWTP, SPM
Every 5 years for reservoir cleaning

Maynilad Water Safety Plan Revision No.2 / November 2015
118
D. Groundwater
Issues Action Identified specific improvement plan
Accountability/ies Due
Daily blow-off of well is needed prior to its operation due to turbid water
Since deep well water is supplied to small area, SPM Group studies the possibility of surface water introduction to its area of influence.
Feasibility study on the replacement of groundwater by surface
Water Network /SPM Group
2013-2014
Clogging of Chlorinator Injector
Replace granular chlorine to liquid or gas chlorination.
Shifting from granular chlorine to gas/liquid chlorine
Water Network /SPM Group
2013-2014

Maynilad Water Safety Plan Revision No.2 / November 2015
119
E. Distribution
Issues Action Identified specific improvement plan
Accountability/ies Due
1. It has been identified in the risk assessment that there were times during La Nina or typhoon treated water from the Water Production which is being supplied to the customers did not comply with aesthetics standard parameters.
Regular water quality monitoring is being conducted within the distribution system however, this is not enough to ensure acceptability and safety of the water being supplied On-line chlorination (as the need arises)
Provision for permanent on-line chlorination to all pumping stations
Water Network 2014
2. Contamination of water supply by backflow due to unauthorized/ illegal connection
Regular leak detection within the system Regular monitoring of zone management on unaccounted-for-water reported
Continuous establishment of District Metered Area Partial pipe replacement program
NRW On-going
3. Intrusion of contaminants due to water line breakage/burst
Pressure management initiatives on District Metered Areas
Optimization on the operation of pump stations
Continuous establishment of District Metered Area Partial pipe replacement
NRW On-going
4. Intrusion of contaminants due to deteriorated pipes (cross under pipelines) during low water pressure
Maintain adequate water pressure 24/7 Regular monitoring of gauging/pressure point
Continuous partial pipe replacement program
NRW/BA/Water Network
On-going
5. Intrusion of contaminants Regular leak detection and Establish program on Water Network 2013

Maynilad Water Safety Plan Revision No.2 / November 2015
120
Issues Action Identified specific improvement plan
Accountability/ies Due
due to intermittent water supply during drought (El Nino)
water quality monitoring Pressure management initiatives on DMA
adjustment of pressure reducing valves during drought Prepare redundant deep well facilities to augment necessary water supply requirement
6. Any hazard not controlled/ mitigated within the distribution system
Information and education campaign
Provision for permanent on-line chlorination to all pumping stations Improve IEC to include health hazards
BA/Water Network/Corporate Communication
2013
7. Contamination by backflow due to unauthorized/illegal connection
Information and education campaign
Improve IEC to include health hazards
BA/Corporate Communication
2013

Maynilad Water Safety Plan Revision No.2 / November 2015
121
ANNEX IV: MONITORING OF THE CONTROL MEASURES (OPERATIONAL MONITORING)
A. Water Source: Surface
Process Step Control
Measure Critical Limit Where When How Who
Corrective Action
Catchment Typhoon/Heavy Rains/Landslide/Mud/Debris (High turbidity)
Reforestation (Planting 50,000 trees/year)
Watershed is >85%forest covered. No illegal logging/kaingin activities allowed within the watershed
Watershed June-December
Planting trees CQESH in collaboration with other participating units/agencies
Periodic tree planting Prohibition of kaingin activities within the watershed
Sabo Dam construction
Sabo Dam Feasibility Study result should limit turbidity to maximum of 500NTU
PMG/CPF
Project schedule
Visual monitoring
CPF/PMG Review and reassessment of FS
Catchment Illegal Logging (denudation of watershed)
DENR Security intervention
No illegal logging
Watershed Continuous Visual monitoring
DENR/Military intervention
Prevention & apprehension of logging activities
Catchment Human Access (Dumagat& Illegal Settlers)
DENR Security intervention
No illegal settlers
Watershed Continuous Visual monitoring
DENR/Security Patrol
Resettlement of Illegal Settlers
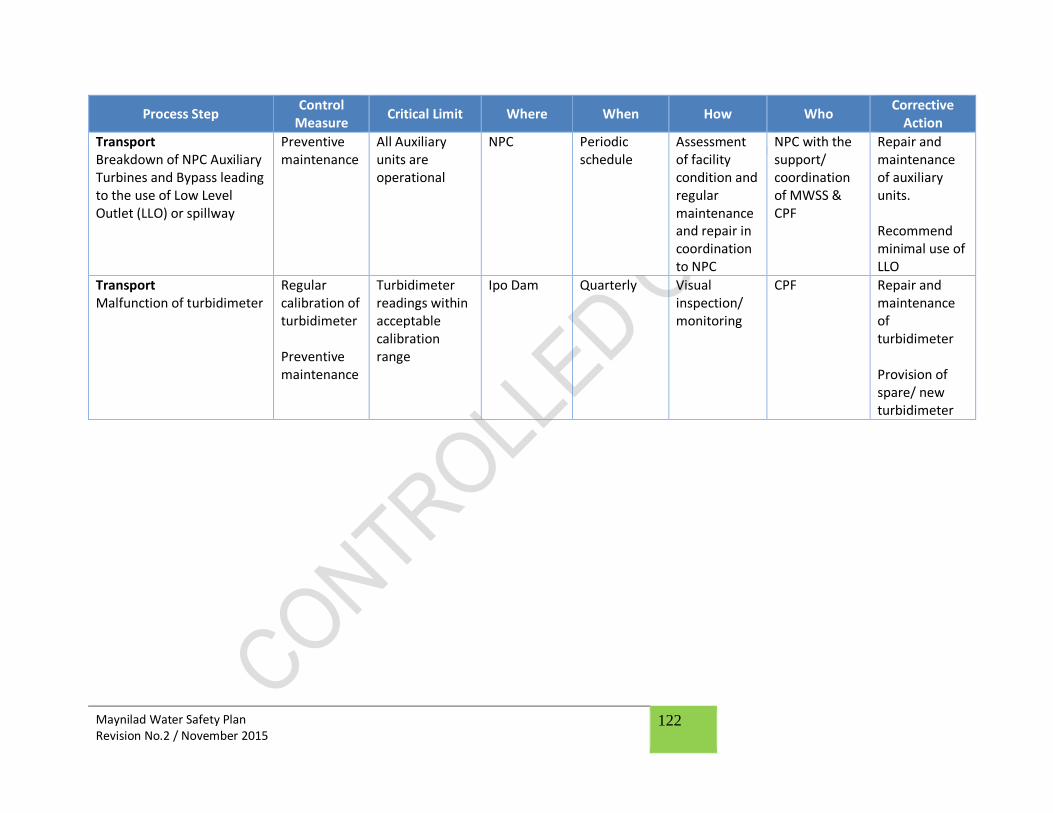
Maynilad Water Safety Plan Revision No.2 / November 2015
122
Process Step Control
Measure Critical Limit Where When How Who
Corrective Action
Transport Breakdown of NPC Auxiliary Turbines and Bypass leading to the use of Low Level Outlet (LLO) or spillway
Preventive maintenance
All Auxiliary units are operational
NPC Periodic schedule
Assessment of facility condition and regular maintenance and repair in coordination to NPC
NPC with the support/ coordination of MWSS & CPF
Repair and maintenance of auxiliary units. Recommend minimal use of LLO
Transport Malfunction of turbidimeter
Regular calibration of turbidimeter Preventive maintenance
Turbidimeter readings within acceptable calibration range
Ipo Dam Quarterly Visual inspection/ monitoring
CPF Repair and maintenance of turbidimeter Provision of spare/ new turbidimeter

Maynilad Water Safety Plan Revision No.2 / November 2015
123
B. Water Treatment: La Mesa Water Treatment Plant 1&2
Pro
cess
Step
s Hazardous Event
Control Measure
Operational Range and
Critical Limits Where When How Who Corrective Action
Caustic Soda Application
Overdosing and under dosing of chemicals
Calibration of dosing application system
pH of raw water 7.8 to 8
LMTP 1 & 2 Open Canal
Every 2 hours
pH meter readings
PCU & Plant
Operators
1. Immediate adjustment of chemical dosing (increase or decrease)
2. Shift to standby dosing pump
3. Re- calibration of the dosing pumps
Actual chemical consumption is according to recommended dose
Actual consumption is +/- 2% of recommended dose
Daily Application report/Storage tanks
Potassium Permangana
te application
Overdosing and under dosing of chemicals
Calibration of dosing application system
Dose = 2 x dissolved Mn of raw water; for FAQ and SW Mn dissolved = 0
Raw Water - open canal, Finished Water – effluent
Hourly Mn analysis PCU & Plant
Operators
1. Immediate adjustment of chemical dosing (increase or decrease)
2. Shift to standby dosing pump
3. Re- calibration Actual chemical consumption is according to recommended dose
Actual consumption is +/- 2% of recommended dose
Daily Application Report / Storage Tanks
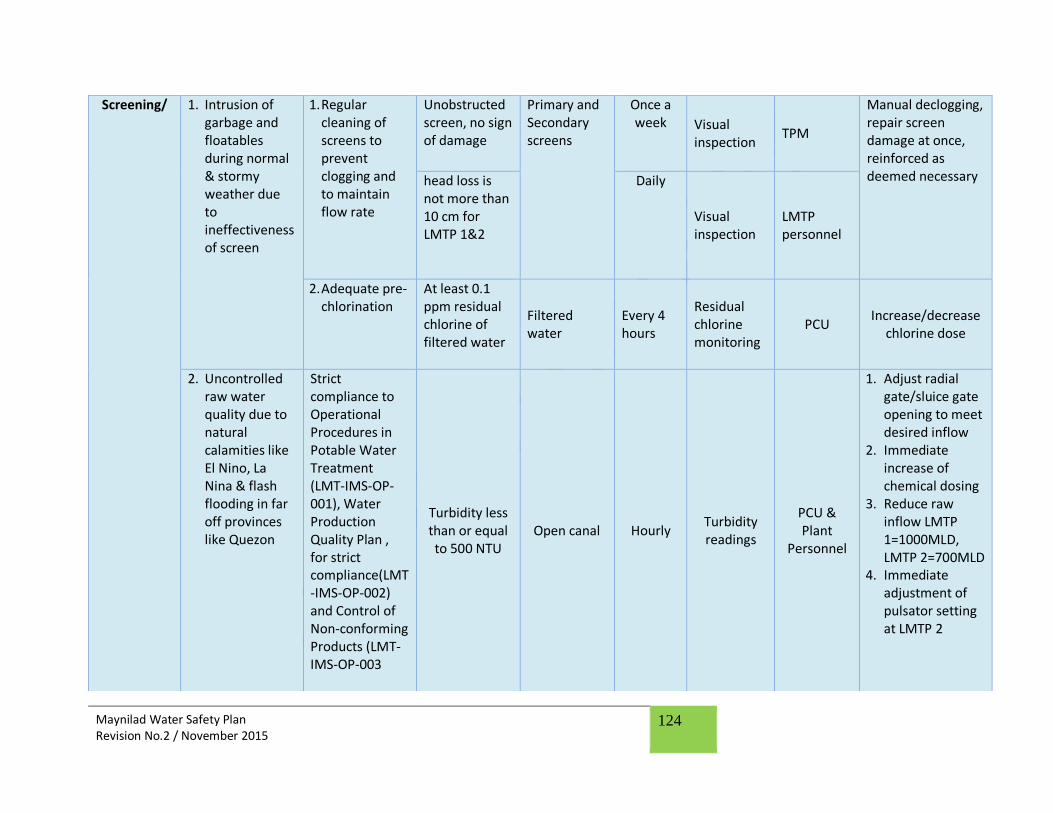
Maynilad Water Safety Plan Revision No.2 / November 2015
124
Screening/
1. Intrusion of garbage and floatables during normal & stormy weather due to ineffectiveness of screen
1. Regular cleaning of screens to prevent clogging and to maintain flow rate
Unobstructed screen, no sign of damage
Primary and Secondary screens
Once a week Visual
inspection TPM
Manual declogging, repair screen damage at once, reinforced as deemed necessary head loss is
not more than 10 cm for LMTP 1&2
Daily
Visual inspection
LMTP personnel
2. Adequate pre-chlorination
At least 0.1 ppm residual chlorine of filtered water
Filtered water
Every 4 hours
Residual chlorine monitoring
PCU Increase/decrease
chlorine dose
2. Uncontrolled raw water quality due to natural calamities like El Nino, La Nina & flash flooding in far off provinces like Quezon
Strict compliance to Operational Procedures in Potable Water Treatment (LMT-IMS-OP-001), Water Production Quality Plan , for strict compliance(LMT-IMS-OP-002) and Control of Non-conforming Products (LMT-IMS-OP-003
Turbidity less than or equal to 500 NTU
Open canal Hourly Turbidity readings
PCU & Plant
Personnel
1. Adjust radial gate/sluice gate opening to meet desired inflow
2. Immediate increase of chemical dosing
3. Reduce raw inflow LMTP 1=1000MLD, LMTP 2=700MLD
4. Immediate adjustment of pulsator setting at LMTP 2

Maynilad Water Safety Plan Revision No.2 / November 2015
125
Pre-chlorination
1. Formation of disinfection’s by-products due to high raw water turbidity
2. Under dosing / no pre-chlorination
3. Less effective disinfection due to high turbidity - LMTP 2
Strict Compliance to WI with residual chlorine monitoring, WI on chlorine application, LMT-IMS-WI-021, 022, 048 & 049
<50NTU raw water turbidity
Plant influent
Every 2 hours
Turbidity readings
PCU
Shift to intermediate chlorination (LMTP 1), Maintain pre-chlorination at 1.2 ppm(LMTP 2)
Maintain residual chlorine of at least 50% of the pre-chlorination dose
Chemically treated water
Every 4 hours
Residual chlorine monitoring
PCU and plant
personnel Make necessary pre-chlorination dose adjustment
Make necessary post chlorination dose adjustment
4. Leak in Chlorine pipes
1. Strict compliance to WI on Preventive Maintenance of LMTP 1&2 equipment
Good working condition
Chlorine dosing system
Daily Inspection TPM/Plant operators
Repair/Replacement of defective parts
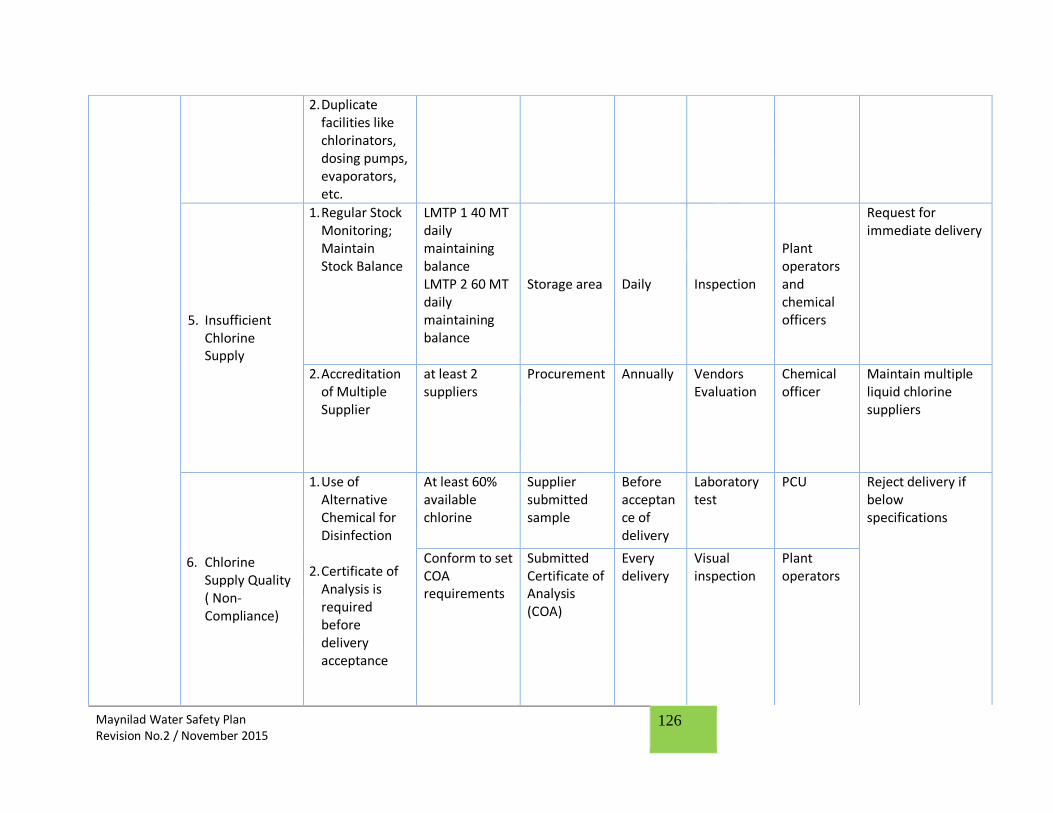
Maynilad Water Safety Plan Revision No.2 / November 2015
126
2. Duplicate facilities like chlorinators, dosing pumps, evaporators, etc.
5. Insufficient Chlorine Supply
1. Regular Stock Monitoring; Maintain Stock Balance
LMTP 1 40 MT daily maintaining balance LMTP 2 60 MT daily maintaining balance
Storage area Daily Inspection
Plant operators and chemical officers
Request for immediate delivery
2. Accreditation of Multiple Supplier
at least 2 suppliers
Procurement Annually Vendors Evaluation
Chemical officer
Maintain multiple liquid chlorine suppliers
6. Chlorine Supply Quality ( Non-Compliance)
1. Use of Alternative Chemical for Disinfection
2. Certificate of Analysis is required before delivery acceptance
At least 60% available chlorine
Supplier submitted sample
Before acceptance of delivery
Laboratory test
PCU Reject delivery if below specifications
Conform to set COA requirements
Submitted Certificate of Analysis (COA)
Every delivery
Visual inspection
Plant operators

Maynilad Water Safety Plan Revision No.2 / November 2015
127
Coagulation (LMTP 1&2)
1. Incorrect dispersal of coagulant due to rapid mixer trouble
1.PMS rapid mixers / feed pumps / transfer pumps weekly
Coagulant feed rate based on recommended dose
LMTP 1 at rotodip; LMTP 2 at dosing pumps
every 2 hours; every change of raw inflow
Calibration PCU & Plant Operators
Real time chemical feed rate adjustment for every change of raw inflow Flushing of feedlines at least once daily Verification of actual measurement
2. Ocular inspection & Creation of Job Order per shift for immediate action of TPM
2. Overdosing / under dosing 1. 1. Online
water quality monitoring and manual calibration as basis of chemical dosing adjustment
Daily maintaining
balance 1000 MT for
Alum; 200 MT for PACl
Storage tanks
Once per shift
Actual measureme
nt; Chemical inventory
Plant Operators/ Chemical
officer
Maintain daily balance/ notify
supplier for immediate delivery
at least 2 suppliers
c/o procurement Availability of
alternate suppliers
2. Strict compliance to WI on Alum Application, LMT-IMS-WI-013. For strict implementation
at least 2 suppliers
c/o procurement Availability of alternate suppliers
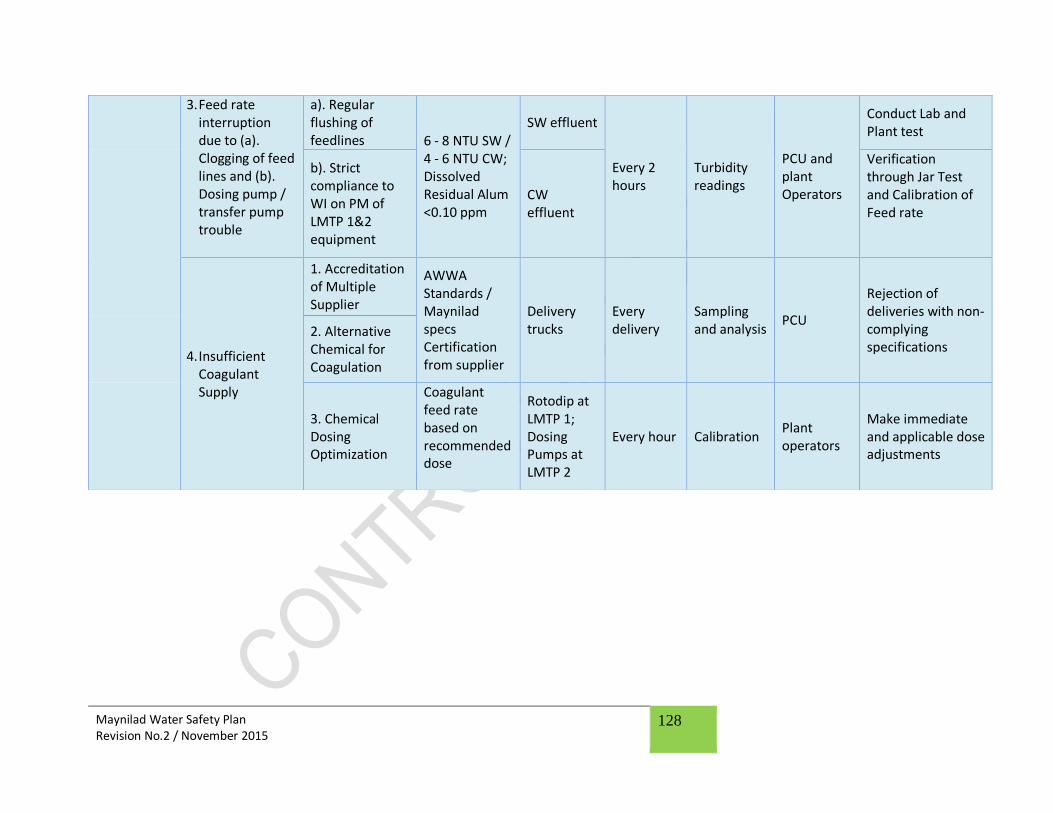
Maynilad Water Safety Plan Revision No.2 / November 2015
128
3. Feed rate interruption due to (a). Clogging of feed lines and (b). Dosing pump / transfer pump trouble
a). Regular flushing of feedlines 6 - 8 NTU SW /
4 - 6 NTU CW; Dissolved Residual Alum <0.10 ppm
SW effluent
Every 2 hours
Turbidity readings
PCU and plant Operators
Conduct Lab and Plant test
b). Strict compliance to WI on PM of LMTP 1&2 equipment
CW effluent
Verification through Jar Test and Calibration of Feed rate
4. Insufficient Coagulant Supply
1. Accreditation of Multiple Supplier
AWWA Standards / Maynilad specs Certification from supplier
Delivery trucks
Every delivery
Sampling and analysis
PCU
Rejection of deliveries with non-complying specifications
2. Alternative Chemical for Coagulation
3. Chemical Dosing Optimization
Coagulant feed rate based on recommended dose
Rotodip at LMTP 1; Dosing Pumps at LMTP 2
Every hour Calibration Plant operators
Make immediate and applicable dose adjustments

Maynilad Water Safety Plan Revision No.2 / November 2015
129
5. Coagulant Supply Quality (Non Compliance)
Strict implementation of raw material specification contracts and refer to LMT-IMS-WI-001, Acceptance and Storage Procedure on Treatment Chemicals
Alum alumina content=8.0 to 8.5% / PACl alumina content=9.0 to 10%
Sample from delivery & Storage Tanks
Every 5 delivery or as needed
Laboratory Tests
PCU Reject delivery if below specification
Flocculation (LMTP 1)
1. Incorrect setting of variators / flocculators
1. Follow flocculation process WI
Flocculation speed
depends on raw water quality 1st
stage= 60 rpm; 2nd stage =20-
30rpm; 3rdstage= 0-
15rpm
Flocculators
Every shift Inspection Plant
operators
Maintain correct flocculator settings;
Immediate adjustment of
setting as applicable; Repair
and Calibration
2. PMS of dosing pumps / accessories and flocculation facilities
2. Overdosing / Under dosing of coagulant aid
1. Strict compliance to WI on Polymer solution preparation
Based on Jar Test Result
Polymer Application Area
Every shift Inspection, Calibration
PCU & Plant Operators
Perform Jar Test as needed/ Verify polymer feed rate

Maynilad Water Safety Plan Revision No.2 / November 2015
130
2. Strict compliance to WI with pH, turbidity monitoring, LMT-IMS-WI-048 &049
Sedimentation
1. Sludge blanket formation exceeds 10 meters length from entry into sedimentation basin
1. Regular onsite inspection, maintain optimum chemical dosing and calibration
Settled Water Turbidity= 4.0
-7.0 NTU; Retention Time: 80 minutes
Coagulant/ Polymer
Application Point
Every 2 hours
Turbidity readings
PCU & Plant Operators
Immediate adjustment of
chemical dosing as applicable;
calibration of dosing pumps
2. Sludge depth profiling twice a year
1.50 M Sludge depth; SW
turbidity 6-8 NTU
Sedimentation Basin
Every 6 months
Sludge Profiling
Instrument
Plant operators
Immediate cleaning of sedimentation
basins
3. Strict compliance to WI on Cleaning of Sedimentation Basins

Maynilad Water Safety Plan Revision No.2 / November 2015
131
2. Sludge bulking
4. Strict compliance to WI with pH, turbidity & residual chlorine monitoring, LMT-IMS-WI-048 & 049
3. Floating leaves and other floatables
Scoop out floatables manually daily
No floatables Sedimentation Basin
Daily Visual
Inspection Plant
Operators
Immediate scooping of floatables
4. Formation of algae in Sedimentation Basin (Launders)
Regular manual scrubbing and pressure washing of launders.
No Algae Formation
Sedimentation Basin
Daily Visual
Inspection Plant
Operators
Immediate cleaning of sedimentation
basins
Pulsation (LMTP 2)
1. Sludge blanket blow down
1. Maintain correct sludge homogeneity
Within 10% difference between top and bottom percent solids of sludge blanket
Sludge blanket
Whenever sludge blanket formation is poor
Homogeneity test
PCU/Plant Operators
1. Adjust pulsator settings

Maynilad Water Safety Plan Revision No.2 / November 2015
132
2. Strict compliance to WI on Coagulant/Polymer Application.
Actual consumption is equal to plus or minus 2% of the recommended dose
Daily Application Report / Storage Tank in use
Every 2 hours
Calibration Plant Operators
Real time chemical feed rate adjustment for every change of raw inflow Flushing of feed lines at least once daily Verification of actual measurement Repair/Replacement of parts
3. Strict compliance to WI in PM of dosing pumps
Good working condition
Dosing pumps
Hourly PM TPM
4.Regular Monitoring and checking of correct setting of pulsators
Refer to table on Raw Water Turbidity vs. Pulsator settings
Inlet channel
Every 2 hrs.
Turbidity readings
PCU
Make immediate and applicable pulsator setting adjustments
Air admission valve must be fully close during suction
Pulsator chamber
at least every 4 hrs.
Inspection Plant Operators

Maynilad Water Safety Plan Revision No.2 / November 2015
133
5. Sludge extraction according to schedule
Sludge concentrator tank must be 3/4 full only
Sludge concentrator tank
At least every 2 hrs.
Inspection Plant operators
1. Make immediate sludge extraction 2. Divert affected clarified water to wash water recovery tank 3. Backwash all affected filter beds
2. Overdosing/ Under dosing of coagulant and coagulant aid
1. Strict compliance to WI on Coagulant/Polymer Application
Based on Jar Test Result
Coagulant/Polymer Application Area
Every shift Inspection, Calibration
PCU & Plant operators
Perform Jar Test as needed/ Verify polymer feedrate
2. Strict compliance to WI with pH, turbidity monitoring, LMT-IMS-WI-048 &049
3.Vaccum pumps and air
compressor failure
1.Srtict compliance to PM schedule
good working condition
Vacuum pump
house & filtration
pump gallery
PM schedule
Inspection TPM & Plant
operators
Repair/Replacement of defective parts
2.With redundant unit
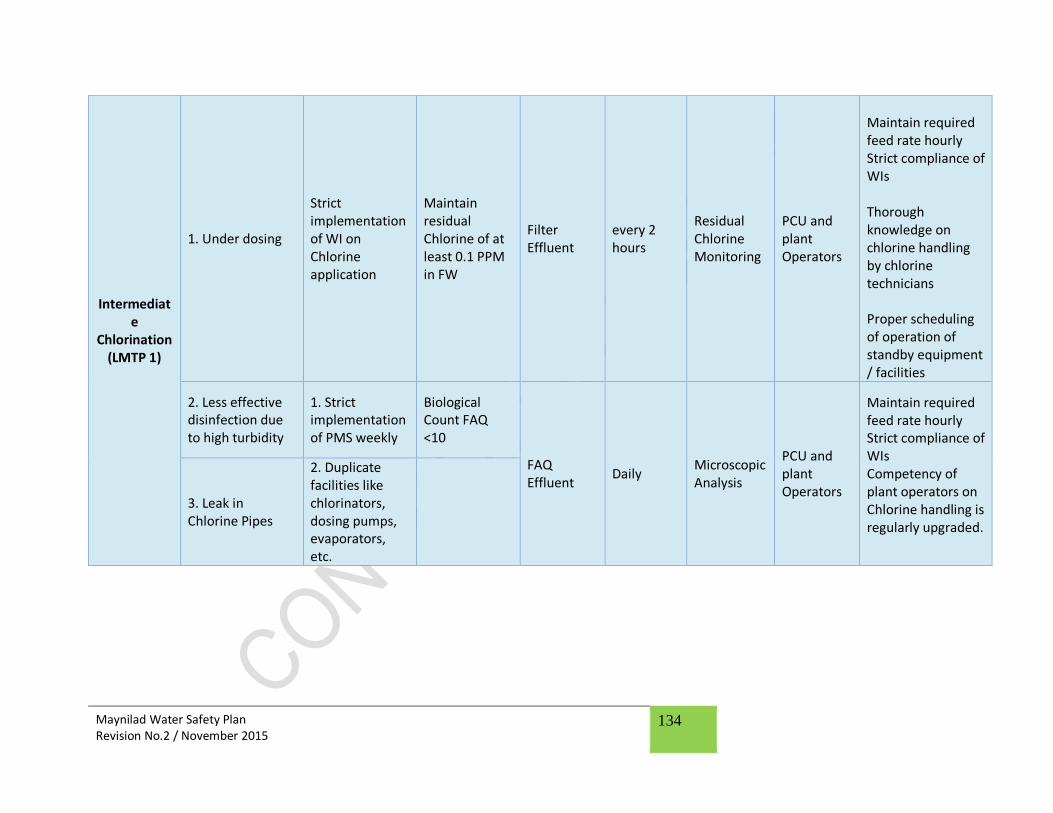
Maynilad Water Safety Plan Revision No.2 / November 2015
134
Intermediate
Chlorination (LMTP 1)
1. Under dosing
Strict implementation of WI on Chlorine application
Maintain residual Chlorine of at least 0.1 PPM in FW
Filter Effluent
every 2 hours
Residual Chlorine Monitoring
PCU and plant Operators
Maintain required feed rate hourly Strict compliance of WIs Thorough knowledge on chlorine handling by chlorine technicians Proper scheduling of operation of standby equipment / facilities
2. Less effective disinfection due to high turbidity
1. Strict implementation of PMS weekly
Biological Count FAQ <10
FAQ Effluent
Daily Microscopic Analysis
PCU and plant Operators
Maintain required feed rate hourly Strict compliance of WIs Competency of plant operators on Chlorine handling is regularly upgraded.
3. Leak in Chlorine Pipes
2. Duplicate facilities like chlorinators, dosing pumps, evaporators, etc.

Maynilad Water Safety Plan Revision No.2 / November 2015
135
4. Insufficient Chlorine Supply
1. Regular Stock Monitoring; Maintain Stock Balance
LMTP 1 40 MT daily maintaining balance LMTP 2 60 MT daily maintaining balance
Storage Area
Daily Inspection Chemical Officer
Maintain multiple liquid chlorine suppliers. Increase storage capacity
2. Accreditation of Multiple Supplier
At least two suppliers
Procurement
Annually Vendor's Evaluation
Chemical Officer
5.Chlorine Supply Quality (Non-Compliance)
1. Use of alternative Chemical for disinfection
At least 60% available Chlorine
Supplier's submitted sample
Before acceptance of delivery
Laboratory Tests
PCU
Reject delivery if below specification 2. Submission of
Certificate of Analysis by suppliers
Conform to set COA requirements
Submitted COA
Every delivery
Visual Inspection
Plant operators
Backwashing
1. Poor performance of filters as surface wash (LMTP 1), scour air blower (LMTP 2) are not operating well
Strict compliance to WI on pH, turbidity & Residual Chlorine monitoring,
Filtered Water Turbidity:
LMTP 1- < 5 NTU; LMTP 2-
< 5 NTU; Filtration Rate: LMTP 1= 14.5
FW Effluent Every 2 hours
Turbidity readings
PCU & Plant
operators
Backwash immediately; Follow backwashing procedure Replenish Filter Media to meet

Maynilad Water Safety Plan Revision No.2 / November 2015
136
2. Depleted filter media
LMT-IMS-WI-048 & 049
m3/m2/hr ; LMTP 2: 12.2
m3/m2/hr LOH:
2.2m(LMTP 1), 2.0(LMTP 2).
LOR: at most is 72 hrs.
FW Effluent Every 2 hours
Turbidity readings
PCU & Plant
operators
Depth: LMTP 1 Anthracite= 0.50 m; Sand= 0.25 m; LMTP 2 - Silica Sand= 1.3 m
3. Excessive algal formation due to irregular and inefficient backwashing
Strict compliance to WI on backwashing
Maintain at least 0.1ppm residual chlorine
Filter beds Semi-Annual
Actual measurement
Plant operators
4. Electro-mechanical and electro-pneumatic system failure
Strict compliance to weekly PMS and Redundant unit
Good working condition
Pneumatic pumps
Weekly PM TPM Repair/Replacement of defective parts
Recovery
Highly Turbid Recovered Water
1. Allow Settling time of washed water at the lagoon before recovery
For LMTP 1 : Wetwell Water Turbidity: 30 NTU; Wetwell Elevation: 68.5m For LMTP 2: water level is at least 1.5m
Lagoon
Per shift
Turbidity readings; Measurement of elevation
PCU & Plant operators
For LMTP 1: No recovery at >30 NTU recovered washed water. Increased coagulant dose as needed. For LMTP 2: No recovery at < 1.5 m
2.Shut off recovery pumps at LMTP 1 if recovered water turbidity is high
Wet well

Maynilad Water Safety Plan Revision No.2 / November 2015
137
3. Additional coagulant dose at LMTP 2 during recovery.
Recovery Tanks
water level. Increased dose as needed.
Post Chlorination
1. Residual Chlorine greater than 1.50 ppm
1. Strict compliance to WI with pH, turbidity & residual chlorine monitoring, LMT-IMS-WI-048 &049
2. Strict compliance to WI on chlorine application
3. PMS weekly 4. Efficient
chlorination facilities with back-ups
5. Operator know how on proper chlorine handling
1.0-1.5 ppm FAQ Residual Chlorine
FAQ effluent
Every 2 hours
Residual chlorine monitoring
PCU Immediate Adjustment of chlorine dosage
2. Under dosing
maintain residual Chlorine of at least 0.1 PPM in FW
Filter effluent
Every 2 hours
Residual chlorine monitoring PCU and
plant operators
Maintain required feed rate hourly Strict compliance of WIs Thorough knowledge on chlorine handling by chlorine technicians
Biological Count FAQ <10
FAQ effluent
Daily Microscopic analysis
3. Leak in Chlorine Pipes
Good working condition
Chlorination system
Daily Inspection TPM and plant operators
Proper scheduling of operation of standby equipment / facilities
No downtime Chlorine Piping System
Daily Inspection TPM and plant operators

Maynilad Water Safety Plan Revision No.2 / November 2015
138
4. Insufficient Chlorine Supply
1. Regular Stock Monitoring; Maintain Stock Balance
LMTP 1 40 MT daily maintaining balance Storage
Area Daily Inspection
Chemical Officer
Request for immediate delivery LMTP 2 60 MT
daily maintaining balance
Plant Operators
1. Accreditation of Multiple Supplier
At least two suppliers
Procurement
Annually Vendor's Evaluation
Chemical Officer
Maintain multiple liquid chlorine suppliers. Increase storage capacity
5.Chlorine Supply Quality (Non-Compliance)
1. Use of alternative Chemical for disinfection
At least 60% available Chlorine
Supplier's submitted sample
Before acceptance of delivery
Laboratory Tests
PCU
Reject delivery if below specification 2. Submission of
Certificate of Analysis by suppliers
Conform to set COA requirements
Submitted COA
every delivery
Visual Inspection
Plant Operators
All Process Step
Power at all times; Power Restoration
within 5 minutes; Diesel fuel is at
least 5000L (Minimum stock)
Genset / Diesel Storage Tanks
Daily Inspection TPM and
plant operators
TPM and plant
operators
Power at all times; Power
Restoration within 5 minutes;
Diesel fuel
Genset / Diesel Storage Tanks

Maynilad Water Safety Plan Revision No.2 / November 2015
139
2. Gen set breakdown
is at least 5000L
(Minimum stock)
3. Internal/external sabotage (i.e. Terrorist attack) & illegal tampering of plant facilities like opening of alum tank drain, unauthorized resetting of dosing pumps or dumping of large volume of sand upstream
1. Maintaining tight security measures round the clock
Zero incident Entire Treatment Plant
24/7 Strict Inspection
Security & WP Personnel
Controlled Entry into Plant Premises; Implementation of Emergency Procedure. Increase security force
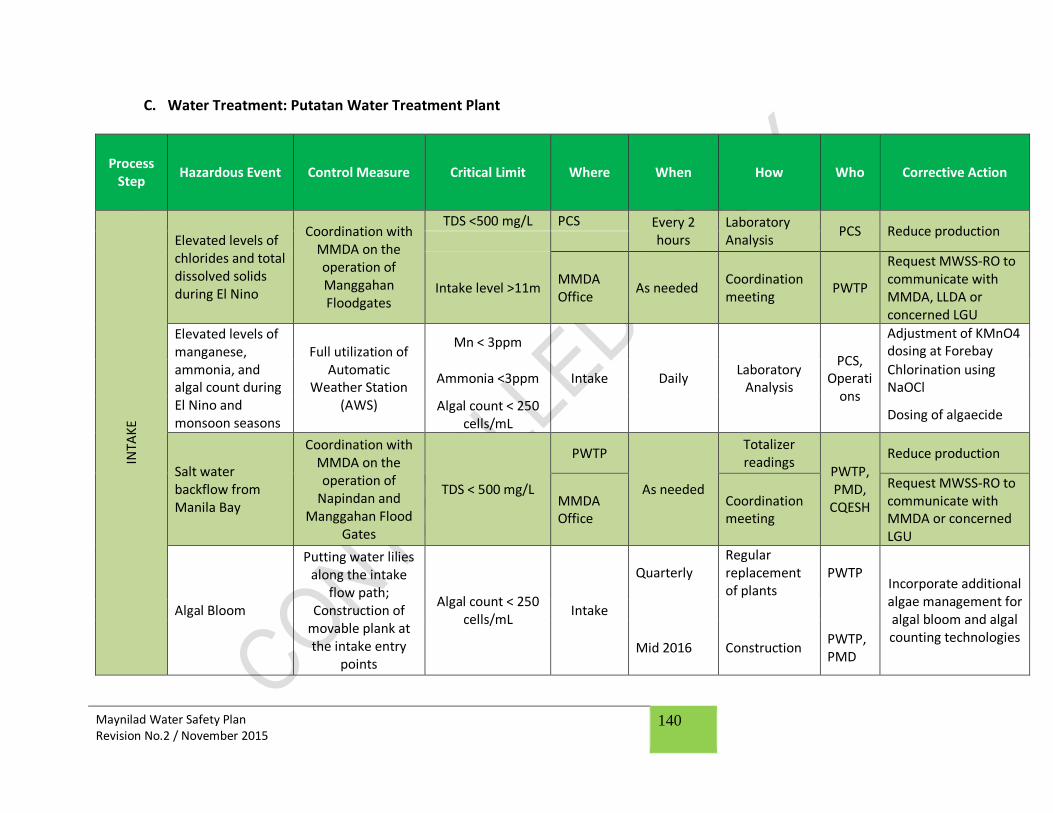
Maynilad Water Safety Plan Revision No.2 / November 2015
140
C. Water Treatment: Putatan Water Treatment Plant
Process Step
Hazardous Event Control Measure Critical Limit Where When How Who Corrective Action
INTA
KE
Elevated levels of chlorides and total dissolved solids during El Nino
Coordination with MMDA on the operation of Manggahan Floodgates
TDS <500 mg/L PCS Every 2 hours
Laboratory Analysis
PCS Reduce production
Intake level >11m MMDA Office
As needed Coordination meeting
PWTP
Request MWSS-RO to communicate with MMDA, LLDA or concerned LGU
Elevated levels of manganese, ammonia, and algal count during El Nino and monsoon seasons
Full utilization of Automatic
Weather Station (AWS)
Mn < 3ppm
Intake Daily Laboratory
Analysis
PCS, Operati
ons
Adjustment of KMnO4 dosing at Forebay
Ammonia <3ppm Chlorination using NaOCl
Algal count < 250 cells/mL
Dosing of algaecide
Salt water backflow from Manila Bay
Coordination with MMDA on the operation of
Napindan and Manggahan Flood
Gates
TDS < 500 mg/L
PWTP
As needed
Totalizer readings
PWTP, PMD,
CQESH
Reduce production
MMDA Office
Coordination meeting
Request MWSS-RO to communicate with MMDA or concerned LGU
Algal Bloom
Putting water lilies along the intake
flow path; Construction of
movable plank at the intake entry
points
Algal count < 250 cells/mL
Intake
Quarterly Regular replacement of plants
PWTP Incorporate additional algae management for algal bloom and algal counting technologies
Mid 2016 Construction PWTP, PMD

Maynilad Water Safety Plan Revision No.2 / November 2015
141
Process Step
Hazardous Event Control Measure Critical Limit Where When How Who Corrective Action
Proliferation of Fish pens
Coordination with LLDA and other stakeholders to
regulate the operation of fish
pens around the intake
<10,000 pieces of fish per 500
square meters
LLDA Office
Quarterly Visual Inspection
PWTP, CQESH
Alert LLDA regarding areas where there are overcrowding in fish pens
Discharges of domestic and industrial wastes nearby the intake
Coordination with LLDA, LGUs and
other stakeholders to regulate waste
disposal and discharge around
the lake
Compliance with the DENR
Administrative Order 90-35 or
the "Revised Effluent
Regulations if 1990" Table 2
Effluent Standards:
Conventional and Other
Pollutants in Protected Waters.
LLDA Office
Quarterly Visual
Inspection PWTP, CQESH
Alert LLDA regarding water quality spikes
Production of taste and odor substances from algal cells breakage
No controls Threshold Odor
Number <2.9 Intake Daily
Laboratory Analysis (Bio
Count) PCS
Incorporate additional treatment process for
taste and odor substances

Maynilad Water Safety Plan Revision No.2 / November 2015
142
Process Step
Hazardous Event Control Measure Critical Limit Where When How Who Corrective Action
2-MIB and Geosmin <20 ug/L
As needed
FOR
EBA
Y
Intrusion of drainage and sewage from the cracks along the twin box culvert
Repairs of leakages after assessment
DO > 3 mg/L Twin box culvert
As needed Rehabilitation PWTP, PMD
Temporarily operate aerator during spikes
in water quality
Algae intrusion No controls Algal count < 250
cells/mL Forebay Daily
Laboratory Analysis (Bio
Count) PCS
Incorporate additional treatment process for
algal bloom
Solid Waste Intrusion (ie. garbage and twigs)
No controls No visible floatables
Forebay As needed Visual
Inspection PWTP
Manual removal of solid wastes
accumulated at the forebay.
DA
F
Improper dosing of coagulant
Replacement of automatic chemical
dosing pump remote operation
Turbidity < 10 DAF Daily Verification PWTP
Operations
Manually operated dosing
Malfunction of DAF mixers
PMS and acquisition of spare
mixer assembly
Less or absence of sludge formation on the flotation
cell, DAF Monthly Conducting
PMS
PWTP TPM,
Operations
Repair, Reduced production (DAF Flow)
No significant reduction of
turbidity
Malfunction of rotary scrapers
PMS of rotary scrapers
No sludge overflow
DAF Weekly Inspection PWTP TPM,
Repair, Reduced production (Shut-off

Maynilad Water Safety Plan Revision No.2 / November 2015
143
Process Step
Hazardous Event Control Measure Critical Limit Where When How Who Corrective Action
Operations
DAF Cell with defective rotary
scraper)
Inappropriate saturated water supplied to DAF
Optimization of DAF
saturation system
Less or absence of sludge formation on the flotation
cell; DAF As needed
Visual inspection and
use of turbidimeter, respectively
PCS-PWTP, TPM
Repair, Reduced production
DAF Outflow Turbidity < 10
Malfunction of air compressors
PMS and installation of
redundant unit
DAF Outflow Turbidity < 10
DAF Daily Inspection
PWTP TPM,
Operations
Closed-looping of air supply from redundant
compressor
Malfunction of sludge extraction system
PMS and acquisition of
redundant spare parts (ie. Pumps)
Sludge level <40% DAF Quarterly Inspection
PWTP TPM,
Operations
Repair, Reduced production (Shut-off
DAF Cell with defective sludge
extraction system)
Power Fluctuation Installation of soft
ATS (UPS)
Power at all times; Restoration of power within 5 mins; Fuel stock
>15,000 L
DAF As needed Inspection
PWTP TPM,
Operations
Repair; Maintain fuel stock
BA
F
Over filter-run of BAF Cells
Maintain backwashing
schedule as needed
Filter running time < set optimum
BAF As needed Filter run
monitoring
PWTP Operati
ons Backwashing
Filter clogging Maintain
backwashing Actual flow is not less than the Set
BAF As needed BAF Outflow Totalizer and
PWTP Operati
Backwashing

Maynilad Water Safety Plan Revision No.2 / November 2015
144
Process Step
Hazardous Event Control Measure Critical Limit Where When How Who Corrective Action
schedule as needed flow Headloss monitoring
ons
Malfunction of BAF system equipment (Aerator, Airscour blowers, backwash pumps, feed pumps, level sensors and flowmeters) and communication elements
Maintain PMS schedule
Equipment is in operation
BAF
As per instruction
by contractor
PMS and Monitoring
PWTP TPM,
Operations
Repair, Reduced production, Activate By-pass from DAF to
Pre-treated Tank
RO
Wearing-out and leakage of RO membranes
Automatic shutdown
of RO skids with alarmed operating
limits, and membrane
replacement
Salt rejection < 90 %, No significant
decrease in Pressure Drop
RO As needed
Laboratory Analysis, Pressure
Drop, and Visual
Inspection (Probing)
PWTP TPM, PWTP PCS,
PWTP Operati
ons
Reduce production; membrane
replacement
CH
LOR
INA
TIO
N Chlorination
water pump malfunction
Create PMS scheme and
procure spare parts
Free residual chlorine should be 1.0 to 1.35 mg/L
Chlorine Building
Daily Laboratory
Analysis and Inspection
PWTP
Chlorine direct feeding, repair; use alternative disinfectant
RES
ERV
OIR
Formation of Disinfection by-Products (DBPs)
Inclusion of BAF to the overall process
Bromoform < 0.10 ppm,
Dibromochloromethane < 0.10 ppm, Bromodichlorome
Reservoir As needed Laboratory
Analysis PWTP
Reduction of chlorine dosages

Maynilad Water Safety Plan Revision No.2 / November 2015
145
Process Step
Hazardous Event Control Measure Critical Limit Where When How Who Corrective Action
thane < 0.06 ppm, Chloroform < 0.20
ppm
Discoloration of product water
Regular cleaning Mn < 0.03 ppm, Color < 10 ACU
Reservoir As needed Follow
cleaning schedule
PWTP TPM
Reduced production, operations of RO
D. Groundwater
Process Step Control
Measure Critical Limit
Where to monitor
When to monitor
How to monitor
Who will monitor
Corrective Action
Catchment (Well) Maintain pump rating capacity as per specs
Clear well water Well Before initial operation.
visual inspection
Pump Operator.
Conduct blow-off /flushing prior to well operation
Chlorination/Treatment Daily preventive maintenance of chlorine injector
Res. Chlorine :0.5 – 1.2ppm
Chlorine injector
Daily Chlorine comparator
Pump Operator
Increase or reduce dosage of chlorine.
Introduction of surface water to the area.
Shift disinfection process from granular chlorine to liquid chlorine

Maynilad Water Safety Plan Revision No.2 / November 2015
146
E. Distribution
Hazardous Event Control
measure
Operational Range and
Critical Limits
Where to monitor
How to monitor
Frequency of
monitoring
Who will monitor
Corrective action
Any hazard not controlled/ mitigated within the water treatment (La Nina/typhoon)
Regular water quality monitoring
Res Cl2 = 0.4 – 1.4ppm
Turbidity –
0.5NTU
Pumping Station
Distribution
system
Chlorine Analyzer
Turbidimeter
Daily
Weekly
Water Network
Water Network
Flushing of lines On-line chlorination
Contamination of water supply by backflow due to unauthorized/ illegal connection
Regular leak detection within the system Regular monitoring of zone management on unaccounted-for-water
Zero leak
All accounted-for-water for
residential and commercial
establishment
NRW
BA
Water Audit Visual inspection
Monthly
Monthly
NRW
BA
Immediate leak repair Close illegal connection and encourage regularization of water connection
Intrusion of contaminants due to water line breakage/burst
Pressure management initiatives on District Metered Areas
Optimization
100% DMA Target
completed
Increase power
District metered
areas
Pumping
PMA establishment
monitoring
Power
Monthly
Monthly
Water Network
Water network
Immediate pipe repair Flushing of waterline

Maynilad Water Safety Plan Revision No.2 / November 2015
147
Hazardous Event Control
measure
Operational Range and
Critical Limits
Where to monitor
How to monitor
Frequency of
monitoring
Who will monitor
Corrective action
on the operation of pump stations
efficiency by 3% every year
station
consumption monitoring
Intrusion of contaminants due to deteriorated pipes (cross under pipelines) during low water pressure
Maintain adequate water pressure 24/7
Regular monitoring of gauging/pressure point
7 psi water pressure
Adequate pressure on
gauging points (primary lines) Refer to Annex
8 for GP’s Threshold Limits
Distribution system
Gauging points
Service Level Improvement
Monitoring
Telemetry Data
Monthly
Monthly
Water Network
Water Network
Repair/Installation of chamber for cross under pipelines Flushing of lines Chlorine injection
Intrusion of contaminants due to intermittent water supply during drought (El Nino)
Maintain adequate water pressure 24/7 Regular monitoring of gauging/pressure point
7 psi water pressure
Adequate pressure on
gauging points (primary lines)
Distribution system
Gauging points
Service Level Improvement
Monitoring
Telemetry Data
Monthly
Monthly
Water Network
Water Network
Immediate repair and flushing of lines Delivering water through water tankers
Any hazard not controlled/ mitigated within the distribution
Information and education campaign
N/A N/A N/A N/A Call Center Leak repair Flushing of lines Improve pressure

Maynilad Water Safety Plan Revision No.2 / November 2015
148
Hazardous Event Control
measure
Operational Range and
Critical Limits
Where to monitor
How to monitor
Frequency of
monitoring
Who will monitor
Corrective action
system

Maynilad Water Safety Plan Revision No.2 / November 2015
149
ANNEX V: VERIFICATION
A. Water Source: Surface
Process Step Type of Activity What When Who Records
Catchment & Transport
Internal Auditing (IA) and External Auditing (EA)
Flow rate IA - monthly schedule EA - every 6 month
IA - CQESH Auditors EA - Regulatory/ Independent Auditors
Database
B. Water Treatment: La Mesa Water Treatment plant 1&2
Type of Activity What Where When Who Records
Water Quality Monitoring
Residual Chlorine is monitored in the plants' effluent.
Plants’ effluent Every 2 hours in the effluent during normal operations.
Process Control specialist
Database
Residual Chlorine is monitored in chemically treated, settled and filtered water inside the plants
Chemically treated, settled and filtered water inside the plants
Every 4 hours during normal operations.
Process Control specialist
Database
E. Coli is monitored in the plants' effluent.
Plants' effluent Daily Central Laboratory Database
Residual Alum, Fe, Sulfates & other chemical content are monitored in the plants effluent
Plants' effluent Daily Process Control Specialist
Database
Manganese and Dissolved Oxygen are monitored at the plants influent & effluent
Plants influent & effluent
Once a Shift Process Control Specialist
Database
Turbidity is monitored in Raw water, chemically Every 2 hours for Process Control Database

Maynilad Water Safety Plan Revision No.2 / November 2015
150
Type of Activity What Where When Who Records
Raw water, chemically treated, settled and clarified water, filtered and finished water.
treated, settled and clarified water, filtered and finished water.
plants' influent and effluent and every 4 hours for the other stages.
Specialist
Jar Test is performed to verify the correctness of the chemical dose being applied
Process Control Laboratory
At least twice a day Process Control Specialist
Jar Test Forms
Audit of Records Generated
Internal and External Audits are conducted to verify conformance to Quality Plan and Control of Non-Conforming Product documents
LMTP 1 and LMTP 2 Annually Internal Auditors / TUV:SUD Auditors
Audit Reports
Audit of Instrument Calibration
Turbidimeter, chlorine meter, pH meter, DO meter, spectrophotometer, analytical balance, online analyzers and flow meters
Laboratory
Annually Internal Auditors / TUV:SUD Auditors
Audit Reports
Aesthetic Quality Acceptability
Odor, Taste and Color Plant’s Effluent
Hourly All users inside the plant.
Logbook
Application of Chemical Dose
Calibration of chemical dose being applied is verified to ensure continuous accuracy of application.
Chemical dosing point Hourly Plant Operators Daily Application Forms
Testing of Treatment Chemicals
Aluminum Sulfate, Polymer and Poly Aluminum Chloride
Laboratory Every Delivery Process Control Specialist
Analysis Results

Maynilad Water Safety Plan Revision No.2 / November 2015
151
C. Water Treatment: Putatan Water Treatment Plant
VERIFICATION ACTIVITY
TYPE OF ACTIVITY
LOCATION OF ACTIVITY FREQUENCY OF
ACTIVITY WHO WILL MONITOR RECORDS
MICROBIAL
Bacteriological Tests WATER QUALITY
MONITORING
Product water sampling faucet at PWTP DAILY Process Control Services Logbook and
Database
Biological Analysis
Product water sampling faucet at PWTP and Raw water sampling at Forebay
DAILY Process Control Services Logbook and
Database
2-MIB & Geosmin
WATER QUALITY MONITORING
Raw water Sampling and Product Water
WEEKLY THIRD PARTY LABORATORY HIRED
BY CLAB Logbook and
Database
CHEMICAL DAILY
(PNSDW except Nitrates,
nitrites, DBPs, heavy metals)
Residual Chlorine
WATER QUALITY MONITORING
Product water sampling faucet at PWTP EVERY 15 MINUTES
Process Control Services Logbook and
Database
Total Chlorine Product water sampling faucet at PWTP Daily: Every 5AM, 10AM, 3PM, 8PM
Sulfates Intake, AR Once a Day: every 6am
Iron, Total AR Once a Day: every 6am
Phosphorus Intake, BAF Inlet Once a Day: every 6am
Silica MF Once a Day: every 6am
Residual Aluminum
BAF Outlet, AR Once a Day: every 6am
Manganese Intake, Forebay, BAF Inlet, BAF Outlet,
MF, UF, AR Daily: Every 2 hours
Ammonia-Nitrogen
Intake, Forebay, BAF Inlet, BAF Outlet, MF, UF, AR
Daily: Every 2 hours

Maynilad Water Safety Plan Revision No.2 / November 2015
152
VERIFICATION ACTIVITY
TYPE OF ACTIVITY
LOCATION OF ACTIVITY FREQUENCY OF
ACTIVITY WHO WILL MONITOR RECORDS
Chlorides Intake, Forebay, BAF Outlet, AR,
Housing Daily: Every 6 AM
Alkalinity Intake, Forebay, BAF Outlet, AR,
Housing Daily: Every 6 AM
Acidity Intake, Forebay, BAF Outlet, AR,
Housing Daily: Every 6 AM
Total Hardness Intake, Forebay, BAF Outlet, AR,
Housing Daily: Every 6 AM
Calcium Hardness
Intake, Forebay, BAF Outlet, AR, Housing
Daily: Every 6 AM
Dissolved Oxygen
Intake, Forebay, BAF Inlet, BAF Outlet, MF, UF, AR
Daily: Every 6 AM
PHYSICAL
Temperature
WATER QUALITY MONITORING
Intake, Forebay, BAF Inlet, BAF Outlet, MF, UF, AR
Daily: Every 2 hours
Process Control Services Logbook and
Database
Turbidity Intake, Forebay, BAF Inlet, BAF Outlet,
MF, UF, AR Daily: Every 2 hours
pH Intake, Forebay, BAF Inlet, BAF Outlet,
MF, UF, AR Daily: Every 2 hours
Color Intake, Forebay, BAF Inlet, BAF Outlet,
MF, UF, AR Daily: Every 2 hours
Odor Intake, Forebay, BAF Inlet, BAF Outlet,
MF, UF, AR Daily: Every 2 hours
Taste Intake, Forebay, BAF Inlet, BAF Outlet,
MF, UF, AR Daily: Every 2 hours
Salinity Intake, Forebay, BAF Inlet, BAF Outlet,
MF, UF, AR Daily: Every 2 hours
TDS Intake, Forebay, BAF Inlet, BAF Outlet,
MF, UF, AR Daily: Every 2 hours
Conductivity Intake, Forebay, BAF Inlet, BAF Outlet, Daily: Every 2 hours

Maynilad Water Safety Plan Revision No.2 / November 2015
153
VERIFICATION ACTIVITY
TYPE OF ACTIVITY
LOCATION OF ACTIVITY FREQUENCY OF
ACTIVITY WHO WILL MONITOR RECORDS
MF, UF, AR
TSS Intake, Forebay, BAF Inlet, BAF Outlet,
MF, UF, AR, Housing Daily: Every 6 AM
Dissolved Oxygen
Intake, Forebay, BAF Inlet, BAF Outlet, MF, UF, AR
Daily: Every 6 AM
PHYSICAL INTERNAL AUDITING
Product water sampling faucet at PWTP
DAILY CENTRAL LABORATORY Logbook and
Database (PNSDW)
NO DEFINITE SCHEDULE
INTERNAL AUDIT OF CQESH
CHEMICAL INTERNAL AUDITING
Product water sampling faucet at PWTP
DAILY CENTRAL LABORATORY Logbook and
Database (PNSDW plus TOC)
NO DEFINITE SCHEDULE
INTERNAL AUDIT CQESH
CHEMICAL
INTERNAL AUDITING
Product water sampling faucet at PWTP ONCE A MONTH
THIRD PARTY LABORATORY HIRED BY CLAB
Logbook and Database
(DBPs, VOCs, etc.)
2-MIB & Geosmin
TWICE A MONTH
MICROBIAL
EXTERNAL AUDITING
Product water sampling faucet at PWTP
TWICE A MONTH MWSS-RO
Logbook and Database
(PNSDW) QUARTERLY DOH
QUARTERLY MUNICIPAL HEALTH OFFICE
PHYSICAL
EXTERNAL AUDITING
Product water sampling faucet at PWTP
TWICE A MONTH MWSS-RO
Logbook and Database
(PNSDW) QUARTERLY DOH
QUARTERLY MUNICIPAL HEALTH OFFICE
CHEMICAL EXTERNAL AUDITING
Product water sampling faucet at PWTP TWICE A MONTH MWSS-RO Logbook and
Database (PNSDW) QUARTERLY DOH

Maynilad Water Safety Plan Revision No.2 / November 2015
154
VERIFICATION ACTIVITY
TYPE OF ACTIVITY
LOCATION OF ACTIVITY FREQUENCY OF
ACTIVITY WHO WILL MONITOR RECORDS
QUARTERLY MUNICIPAL HEALTH OFFICE
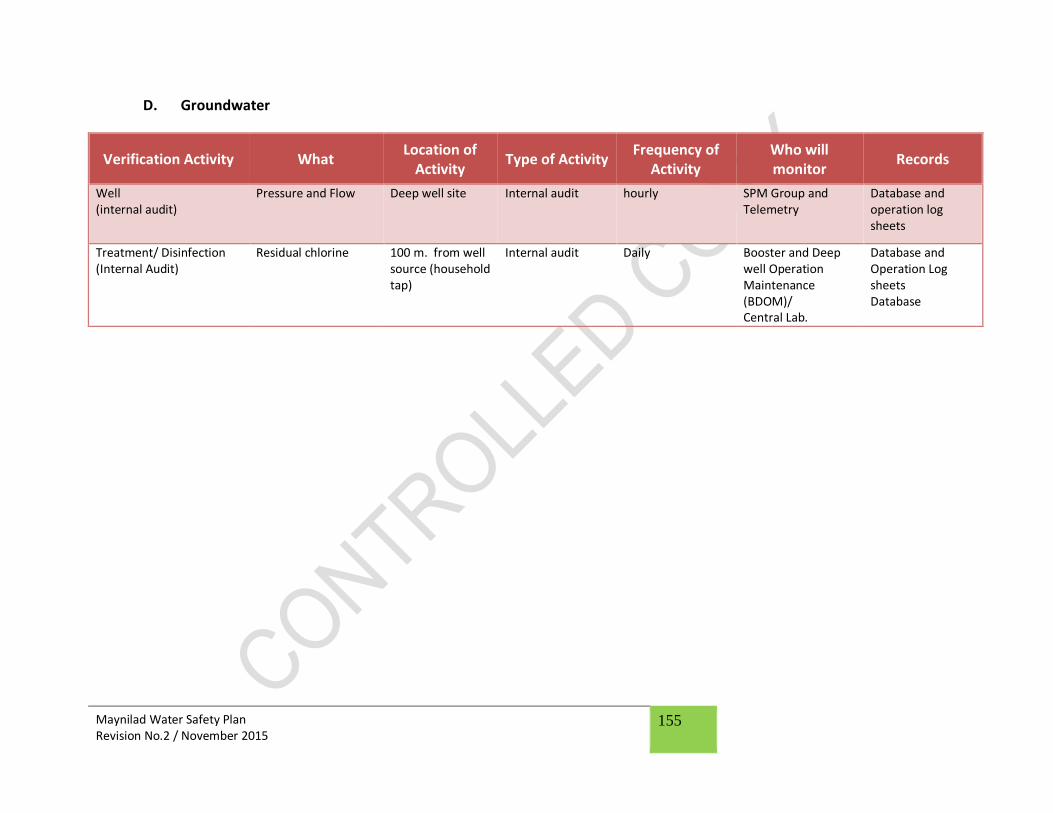
Maynilad Water Safety Plan Revision No.2 / November 2015
155
D. Groundwater
Verification Activity What Location of
Activity Type of Activity
Frequency of Activity
Who will monitor
Records
Well (internal audit)
Pressure and Flow Deep well site Internal audit hourly SPM Group and Telemetry
Database and operation log sheets
Treatment/ Disinfection (Internal Audit)
Residual chlorine 100 m. from well source (household tap)
Internal audit Daily
Booster and Deep well Operation Maintenance (BDOM)/ Central Lab.
Database and Operation Log sheets Database

Maynilad Water Safety Plan Revision No.2 / November 2015
156
E. Distribution
Verification Activity Type of Activity Location of Activity Frequency of Activity Who will Monitor Records
Microbial Water Quality Monitoring
Customer’s tap (regular sampling point)
Reservoir water
Sources: a) Surface b) Ground water
Monthly Daily Semi-annual Annual
Central Lab/MWSS-RO /LGU
Central Lab /MWSS-RO
Central Lab /MWSS-RO Central Lab /MWSS-RO
Database
Physical and Chemical Water Quality Monitoring
Customer’s tap (regular sampling point)
Reservoir water
Sources: c) Surface d) Ground water
Monthly Monthly Semi-annual Annually
Central Lab/MWSS-RO /LGU
Central Lab /MWSS-RO
Central Lab /MWSS-RO Central Lab /MWSS-RO
Database
Verification of field activities Leak detection Pipe repair Line repair
Internal Audit Distribution network Daily Bus. Area / NRW/ Water Network
Database
Customer Survey
Customer Satisfaction
Call Center/BA/ Central Laboratory
Daily Customer Care /Bus Area /Zone/
Central Lab
Database CRMS
Instrument calibration
Internal Audit Central lab / Water Network
Annual/before every use
-ISO accredited Inst. Supplier -CL/Network
Certificate/log Book
Regulatory compliance External Audit Customer’s tap Monthly MWSS-RO/LGU/DOH Monthly pronouncement/Audit Report

Maynilad Water Safety Plan Revision No.2 / November 2015
157
ANNEX VI: SUPPORTING PROGRAMS
A. Water Source: Surface
PROGRAM PURPOSE SPECIFIC ACTIVITY
1 Training and awareness To ensure personnel’s ability and understanding on the water source protection and its optimization for the implementation of water safety practices Program for Catchment protection through education & awareness activities of concerned communities & stakeholders.
WSP Training & Watershed Management Training Formal liaison with government agencies that have control of the catchment)
2 Research & development To support decisions made to improve or maintain water quality
Continuing research & benchmarking with other utility company (local & abroad)
3 Calibration of Instruments i.e. Turbidimeter etc.
To ensure that different equipment’s are accurate and reliable in reading different parameters being measured
(1). In-house calibration; (2). Third party calibration, 3) Calibration schedule
4 Preventive maintenance To ensure that different equipment’s are checked and maintain to avoid process and equipment malfunction. To ensure that all assets are in good working condition.
Preventive maintenance & repair schedule of equipment
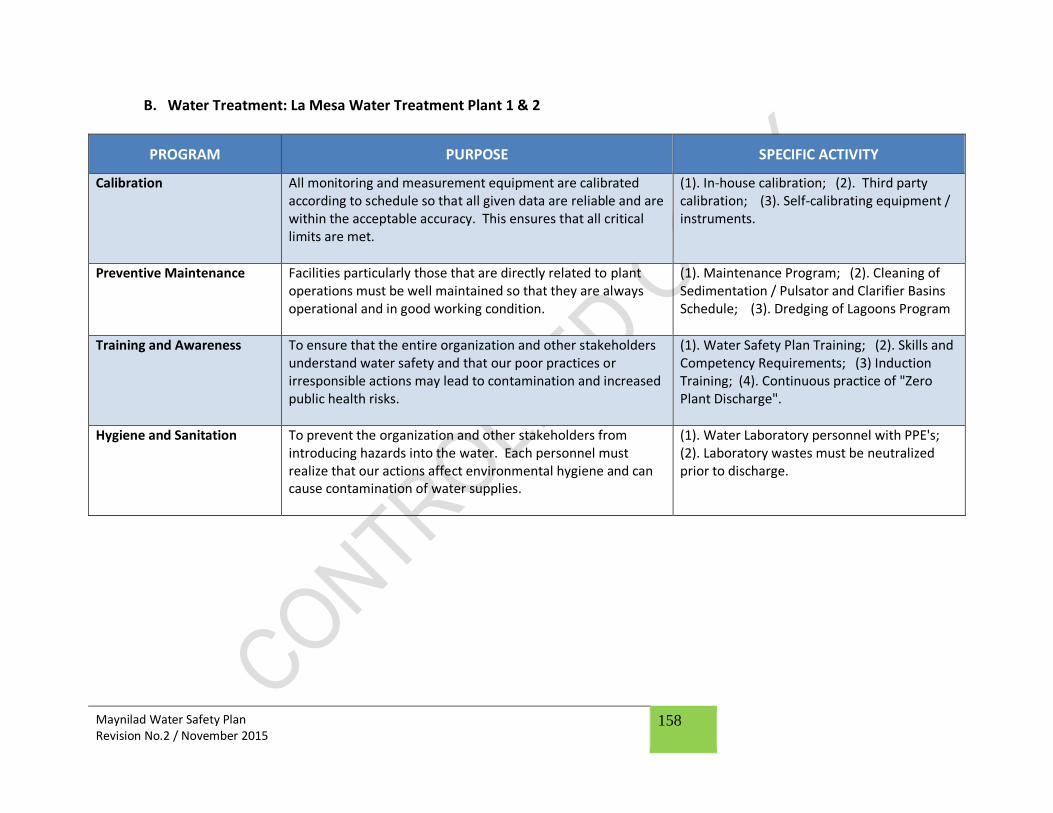
Maynilad Water Safety Plan Revision No.2 / November 2015
158
B. Water Treatment: La Mesa Water Treatment Plant 1 & 2
PROGRAM PURPOSE SPECIFIC ACTIVITY
Calibration All monitoring and measurement equipment are calibrated according to schedule so that all given data are reliable and are within the acceptable accuracy. This ensures that all critical limits are met.
(1). In-house calibration; (2). Third party calibration; (3). Self-calibrating equipment / instruments.
Preventive Maintenance Facilities particularly those that are directly related to plant operations must be well maintained so that they are always operational and in good working condition.
(1). Maintenance Program; (2). Cleaning of Sedimentation / Pulsator and Clarifier Basins Schedule; (3). Dredging of Lagoons Program
Training and Awareness To ensure that the entire organization and other stakeholders understand water safety and that our poor practices or irresponsible actions may lead to contamination and increased public health risks.
(1). Water Safety Plan Training; (2). Skills and Competency Requirements; (3) Induction Training; (4). Continuous practice of "Zero Plant Discharge".
Hygiene and Sanitation To prevent the organization and other stakeholders from introducing hazards into the water. Each personnel must realize that our actions affect environmental hygiene and can cause contamination of water supplies.
(1). Water Laboratory personnel with PPE's; (2). Laboratory wastes must be neutralized prior to discharge.

Maynilad Water Safety Plan Revision No.2 / November 2015
159
C. Treatment: Putatan Water Treatment Plant
PROGRAM PURPOSE SPECIFIC ACTIVITY
CALIBRATION To ensure accurate and reliable reading of different parameters being measured especially for chemical dosing pumps, online analyzers, flow meters, pneumatic valves and level sensors.
Calibration schedule of equipment
Self-calibrating equipment
PREVENTIVE MAINTENANCE
To aid in the prediction and addressing of TDS spikes and algal bloom recurrence
Acquisition of relevant technologies
To ensure that different equipment are checked and maintained to avoid process and equipment malfunction.
Maintenance program
To ensure that all assets are in good working condition.
Intake, Twin box channels and Forebay dredging/cleaning program
Water reservoir cleaning program
HYGIENE AND SANITATION
To prevent incorporation of hazards by personnel or situations who are directly involved in the water treatment process
Water Audit
Power Audit
PPEs worn by all personnel
CHEMICAL STORAGE
IMPROVEMENT
Ensure that chemicals are not contaminated and leaking in their respective storages that could affect the effectivity of the chemicals used.
Check for chemical leaks
Proper storage and handling
TRAINING AND AWARENESS
To ensure personnel’s ability and understanding on the water treatment process and its optimization for the implementation of water safety practices
WSP Training
Competency requirement
Equipment and process trainings

Maynilad Water Safety Plan Revision No.2 / November 2015
160
D. Groundwater
PROGRAM PURPOSE SPECIFIC ACTIVITY
CALIBRATION
To ensure that different equipment are accurate and reliable in reading different parameters being measured.
Programs / schedules for calibration of equipment
PREVENTIVE MAINTENANCE To ensure that different equipment are checked and maintain to avoid process and equipment malfunction. To ensure that all assets are in good working condition.
Preventive maintenance & repair schedule of equipment Reservoir cleaning program
HYGIENE AND SANITATION To prevent incorporation of hazards by personnel or situations that directly involved in the water treatment process
Proper Handling of Chlorine Personal Protective Equipment
TRAINING AND AWARENESS To ensure personnel’s ability and understanding on the water treatment process and its optimization for the implementation of water safety practices
Regular training on chlorine handling WSP Training

Maynilad Water Safety Plan Revision No.2 / November 2015
161
E. Distribution
PROGRAM PURPOSE SPECIFIC ACTIVITY
CALIBRATION To ensure that critical limit monitoring is reliable and of acceptable accuracy
Calibration Schedules Self-calibrating equipment
PREVENTIVE MAINTENANCE To ensure that different equipment are checked and maintain to avoid process and equipment malfunction. To ensure that all assets are in good working condition.
Preventive maintenance & repair schedule of equipment
HYGIENE AND SANITATION To prevent incorporation of hazards by personnel or situations that directly involved in the network activities
PPEs
Develop participatory hygiene awareness and education program
Water quality analysis done in the laboratory and field must conform with the Standard Operating Procedures
Develop participatory hygiene awareness and education program
TRAINING AND AWARENESS To ensure personnel’s ability and understanding on the water treatment process and its optimization for the implementation of water safety practices
WSP Training
Competency requirement Induction Training
RESEARCH AND DEVELOPMENT To support decisions made to improve or maintain water quality
Understanding potential hazards Research into better indicators of contamination

Maynilad Water Safety Plan Revision No.2 / November 2015
162
CUSTOMER COMPLAINT PROTOCOL To ensure that customers are responded to if water quality questions are raised
Call Center Training on Proper Handling of Customer Complaints
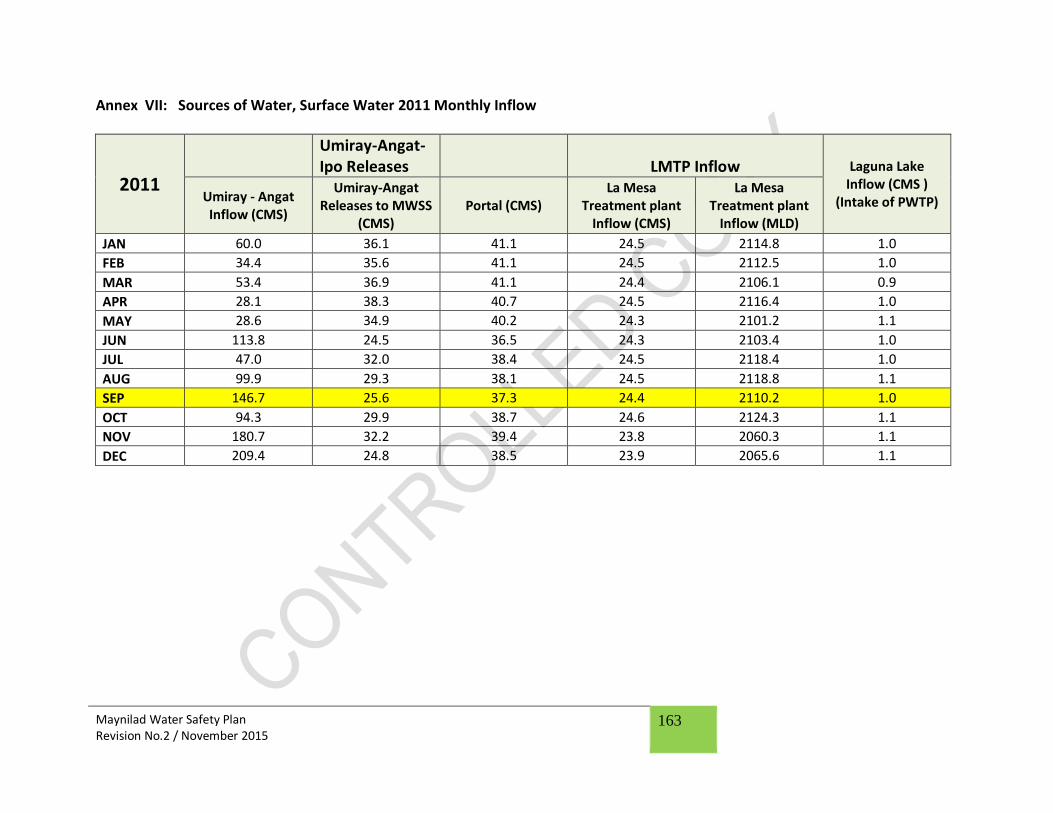
Maynilad Water Safety Plan Revision No.2 / November 2015
163
Annex VII: Sources of Water, Surface Water 2011 Monthly Inflow
2011
Umiray-Angat-Ipo Releases LMTP Inflow Laguna Lake
Inflow (CMS ) (Intake of PWTP) Umiray - Angat
Inflow (CMS)
Umiray-Angat Releases to MWSS
(CMS) Portal (CMS)
La Mesa Treatment plant
Inflow (CMS)
La Mesa Treatment plant
Inflow (MLD)
JAN 60.0 36.1 41.1 24.5 2114.8 1.0
FEB 34.4 35.6 41.1 24.5 2112.5 1.0
MAR 53.4 36.9 41.1 24.4 2106.1 0.9
APR 28.1 38.3 40.7 24.5 2116.4 1.0
MAY 28.6 34.9 40.2 24.3 2101.2 1.1
JUN 113.8 24.5 36.5 24.3 2103.4 1.0
JUL 47.0 32.0 38.4 24.5 2118.4 1.0
AUG 99.9 29.3 38.1 24.5 2118.8 1.1
SEP 146.7 25.6 37.3 24.4 2110.2 1.0
OCT 94.3 29.9 38.7 24.6 2124.3 1.1
NOV 180.7 32.2 39.4 23.8 2060.3 1.1
DEC 209.4 24.8 38.5 23.9 2065.6 1.1
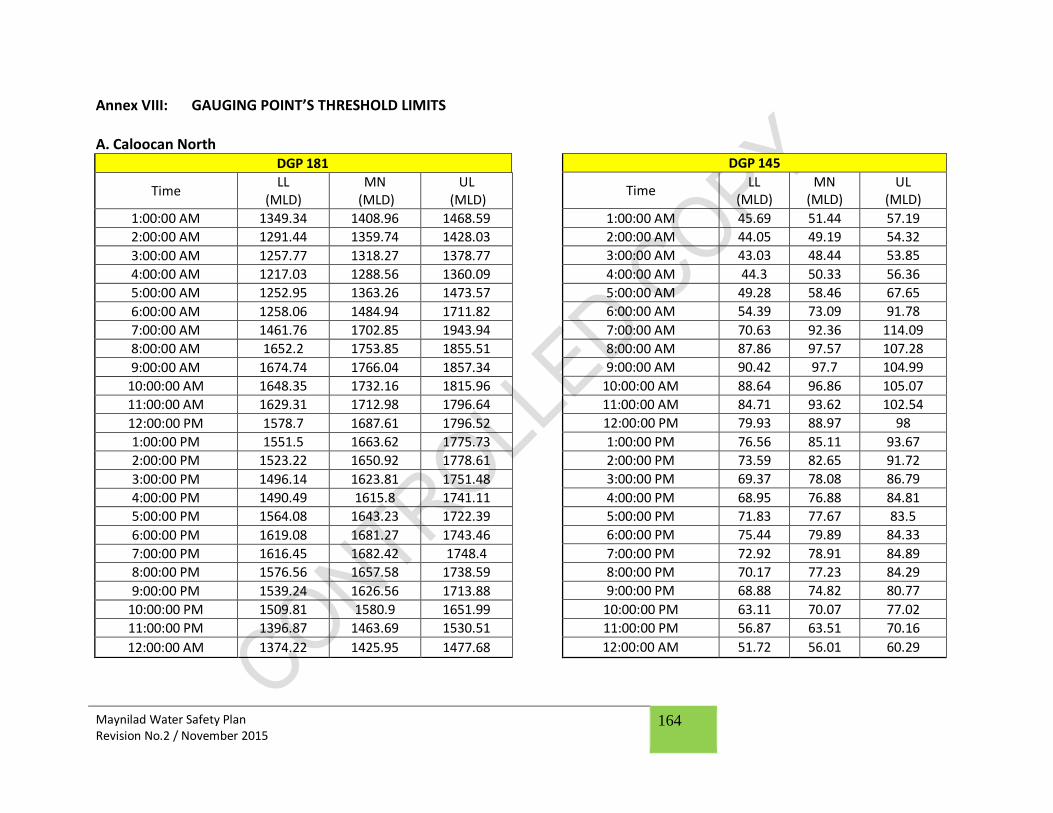
Maynilad Water Safety Plan Revision No.2 / November 2015
164
Annex VIII: GAUGING POINT’S THRESHOLD LIMITS A. Caloocan North
DGP 145
Time LL
(MLD) MN
(MLD) UL
(MLD)
1:00:00 AM 45.69 51.44 57.19
2:00:00 AM 44.05 49.19 54.32
3:00:00 AM 43.03 48.44 53.85
4:00:00 AM 44.3 50.33 56.36
5:00:00 AM 49.28 58.46 67.65
6:00:00 AM 54.39 73.09 91.78
7:00:00 AM 70.63 92.36 114.09
8:00:00 AM 87.86 97.57 107.28
9:00:00 AM 90.42 97.7 104.99
10:00:00 AM 88.64 96.86 105.07
11:00:00 AM 84.71 93.62 102.54
12:00:00 PM 79.93 88.97 98
1:00:00 PM 76.56 85.11 93.67
2:00:00 PM 73.59 82.65 91.72
3:00:00 PM 69.37 78.08 86.79
4:00:00 PM 68.95 76.88 84.81
5:00:00 PM 71.83 77.67 83.5
6:00:00 PM 75.44 79.89 84.33
7:00:00 PM 72.92 78.91 84.89
8:00:00 PM 70.17 77.23 84.29
9:00:00 PM 68.88 74.82 80.77
10:00:00 PM 63.11 70.07 77.02
11:00:00 PM 56.87 63.51 70.16
12:00:00 AM 51.72 56.01 60.29
DGP 181
Time LL
(MLD) MN
(MLD) UL
(MLD)
1:00:00 AM 1349.34 1408.96 1468.59
2:00:00 AM 1291.44 1359.74 1428.03
3:00:00 AM 1257.77 1318.27 1378.77
4:00:00 AM 1217.03 1288.56 1360.09
5:00:00 AM 1252.95 1363.26 1473.57
6:00:00 AM 1258.06 1484.94 1711.82
7:00:00 AM 1461.76 1702.85 1943.94
8:00:00 AM 1652.2 1753.85 1855.51
9:00:00 AM 1674.74 1766.04 1857.34
10:00:00 AM 1648.35 1732.16 1815.96
11:00:00 AM 1629.31 1712.98 1796.64
12:00:00 PM 1578.7 1687.61 1796.52
1:00:00 PM 1551.5 1663.62 1775.73
2:00:00 PM 1523.22 1650.92 1778.61
3:00:00 PM 1496.14 1623.81 1751.48
4:00:00 PM 1490.49 1615.8 1741.11
5:00:00 PM 1564.08 1643.23 1722.39
6:00:00 PM 1619.08 1681.27 1743.46
7:00:00 PM 1616.45 1682.42 1748.4
8:00:00 PM 1576.56 1657.58 1738.59
9:00:00 PM 1539.24 1626.56 1713.88
10:00:00 PM 1509.81 1580.9 1651.99
11:00:00 PM 1396.87 1463.69 1530.51
12:00:00 AM 1374.22 1425.95 1477.68

Maynilad Water Safety Plan Revision No.2 / November 2015
165
OLD GP D. TUAZON
Time LL (MLD) MN
(MLD) UL (MLD)
1:00:00 AM 24.96 30.59 36.21
2:00:00 AM 22.36 30.00 37.63
3:00:00 AM 23.66 30.28 36.91
4:00:00 AM 24.23 31.08 37.92
5:00:00 AM 26.81 33.75 40.70
6:00:00 AM 31.84 42.11 52.37
7:00:00 AM 37.91 50.96 64.01
8:00:00 AM 44.33 53.88 63.44
9:00:00 AM 46.02 53.98 61.94
10:00:00 AM 48.98 53.89 58.80
11:00:00 AM 46.90 52.41 57.91
12:00:00 PM 44.60 49.73 54.86
1:00:00 PM 43.17 48.92 54.66
2:00:00 PM 43.31 47.43 51.54
3:00:00 PM 42.12 44.71 47.30
4:00:00 PM 39.94 43.43 46.91
5:00:00 PM 39.73 43.66 47.58
6:00:00 PM 40.79 44.84 48.89
7:00:00 PM 40.65 44.13 47.60
8:00:00 PM 39.13 43.70 48.28
9:00:00 PM 37.26 41.99 46.72
10:00:00 PM 32.22 39.86 47.50
11:00:00 PM 30.78 36.07 41.37
12:00:00 AM 28.04 33.00 37.96
GP 8th St
Time LL (MLD) MN (MLD) UL (MLD)
1:00:00 AM 289.39 355.58 421.78
2:00:00 AM 273.14 341.50 409.86
3:00:00 AM 277.23 334.01 390.78
4:00:00 AM 268.74 330.84 392.94
5:00:00 AM 284.41 351.19 417.98
6:00:00 AM 270.41 408.03 545.66
7:00:00 AM 329.33 468.76 608.18
8:00:00 AM 381.37 478.21 575.05
9:00:00 AM 398.61 480.87 563.13
10:00:00 AM 377.19 459.40 541.61
11:00:00 AM 373.38 451.56 529.74
12:00:00 PM 371.39 448.54 525.69
1:00:00 PM 359.77 445.41 531.05
2:00:00 PM 354.00 442.24 530.47
3:00:00 PM 343.42 436.40 529.38
4:00:00 PM 345.29 435.85 526.41
5:00:00 PM 367.26 447.03 526.79
6:00:00 PM 377.11 457.48 537.84
7:00:00 PM 376.27 458.95 541.63
8:00:00 PM 367.44 453.84 540.25
9:00:00 PM 357.95 446.71 535.47
10:00:00 PM 340.23 428.83 517.42
11:00:00 PM 328.60 382.17 435.75
12:00:00 AM 309.86 368.57 427.29

Maynilad Water Safety Plan Revision No.2 / November 2015
166
GP PLARIDEL
Time LL (MLD) MN
(MLD) UL (MLD)
1:00:00 AM 7.33 8.17 9.00
2:00:00 AM 6.63 7.52 8.41
3:00:00 AM 6.28 7.16 8.04
4:00:00 AM 6.37 7.28 8.19
5:00:00 AM 7.19 8.64 10.09
6:00:00 AM 8.11 12.29 16.47
7:00:00 AM 11.27 16.27 21.27
8:00:00 AM 14.54 17.62 20.70
9:00:00 AM 16.16 17.87 19.58
10:00:00 AM 15.85 17.72 19.58
11:00:00 AM 14.75 16.87 18.99
12:00:00 PM 13.61 16.07 18.53
1:00:00 PM 14.18 15.96 17.74
2:00:00 PM 13.65 15.58 17.51
3:00:00 PM 12.32 14.49 16.67
4:00:00 PM 12.24 14.13 16.01
5:00:00 PM 12.85 14.24 15.64
6:00:00 PM 13.54 14.59 15.64
7:00:00 PM 13.74 14.41 15.08
8:00:00 PM 13.35 14.30 15.25
9:00:00 PM 13.07 13.77 14.47
10:00:00 PM 11.81 12.90 13.99
11:00:00 PM 9.85 11.37 12.90
12:00:00 AM 5.72 9.20 12.67
GP QUEZON AVE
Time LL (MLD) MN
(MLD) UL (MLD)
1:00:00 AM 14.90 15.76 16.63
2:00:00 AM 14.71 15.54 16.36
3:00:00 AM 14.36 15.61 16.85
4:00:00 AM 14.83 15.91 17.00
5:00:00 AM 15.86 16.69 17.52
6:00:00 AM 16.77 18.27 19.77
7:00:00 AM 18.64 20.78 22.91
8:00:00 AM 20.01 21.70 23.40
9:00:00 AM 20.42 21.72 23.02
10:00:00 AM 20.58 21.81 23.05
11:00:00 AM 20.30 21.46 22.62
12:00:00 PM 19.32 20.51 21.69
1:00:00 PM 18.83 20.09 21.36
2:00:00 PM 18.47 19.73 20.99
3:00:00 PM 17.89 19.11 20.34
4:00:00 PM 17.78 19.00 20.22
5:00:00 PM 17.96 19.19 20.42
6:00:00 PM 17.98 19.24 20.51
7:00:00 PM 18.02 19.10 20.18
8:00:00 PM 18.10 19.09 20.08
9:00:00 PM 17.98 18.72 19.45
10:00:00 PM 17.26 18.00 18.74
11:00:00 PM 16.51 17.39 18.27
12:00:00 AM 15.61 16.40 17.20
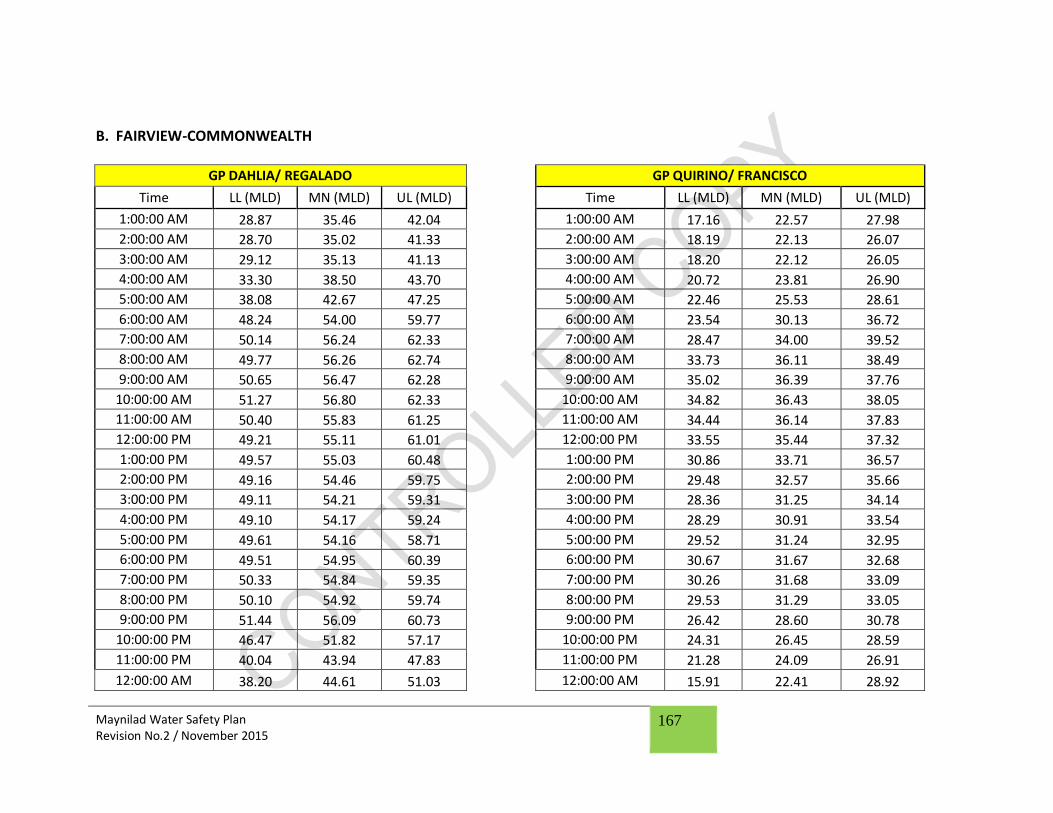
Maynilad Water Safety Plan Revision No.2 / November 2015
167
B. FAIRVIEW-COMMONWEALTH
GP DAHLIA/ REGALADO GP QUIRINO/ FRANCISCO
Time LL (MLD) MN (MLD) UL (MLD)
Time LL (MLD) MN (MLD) UL (MLD)
1:00:00 AM 28.87 35.46 42.04
1:00:00 AM 17.16 22.57 27.98
2:00:00 AM 28.70 35.02 41.33
2:00:00 AM 18.19 22.13 26.07
3:00:00 AM 29.12 35.13 41.13
3:00:00 AM 18.20 22.12 26.05
4:00:00 AM 33.30 38.50 43.70
4:00:00 AM 20.72 23.81 26.90
5:00:00 AM 38.08 42.67 47.25
5:00:00 AM 22.46 25.53 28.61
6:00:00 AM 48.24 54.00 59.77
6:00:00 AM 23.54 30.13 36.72
7:00:00 AM 50.14 56.24 62.33
7:00:00 AM 28.47 34.00 39.52
8:00:00 AM 49.77 56.26 62.74
8:00:00 AM 33.73 36.11 38.49
9:00:00 AM 50.65 56.47 62.28
9:00:00 AM 35.02 36.39 37.76
10:00:00 AM 51.27 56.80 62.33
10:00:00 AM 34.82 36.43 38.05
11:00:00 AM 50.40 55.83 61.25
11:00:00 AM 34.44 36.14 37.83
12:00:00 PM 49.21 55.11 61.01
12:00:00 PM 33.55 35.44 37.32
1:00:00 PM 49.57 55.03 60.48
1:00:00 PM 30.86 33.71 36.57
2:00:00 PM 49.16 54.46 59.75
2:00:00 PM 29.48 32.57 35.66
3:00:00 PM 49.11 54.21 59.31
3:00:00 PM 28.36 31.25 34.14
4:00:00 PM 49.10 54.17 59.24
4:00:00 PM 28.29 30.91 33.54
5:00:00 PM 49.61 54.16 58.71
5:00:00 PM 29.52 31.24 32.95
6:00:00 PM 49.51 54.95 60.39
6:00:00 PM 30.67 31.67 32.68
7:00:00 PM 50.33 54.84 59.35
7:00:00 PM 30.26 31.68 33.09
8:00:00 PM 50.10 54.92 59.74
8:00:00 PM 29.53 31.29 33.05
9:00:00 PM 51.44 56.09 60.73
9:00:00 PM 26.42 28.60 30.78
10:00:00 PM 46.47 51.82 57.17
10:00:00 PM 24.31 26.45 28.59
11:00:00 PM 40.04 43.94 47.83
11:00:00 PM 21.28 24.09 26.91
12:00:00 AM 38.20 44.61 51.03
12:00:00 AM 15.91 22.41 28.92
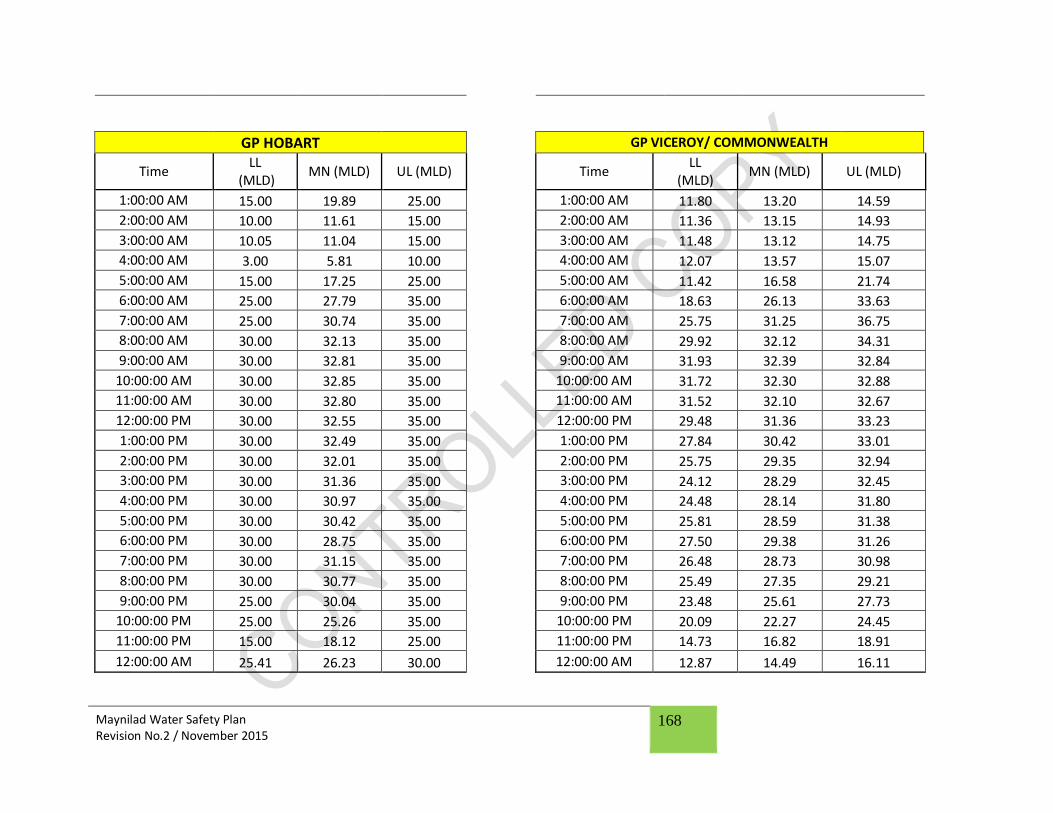
Maynilad Water Safety Plan Revision No.2 / November 2015
168
GP HOBART GP VICEROY/ COMMONWEALTH
Time LL
(MLD) MN (MLD) UL (MLD)
Time LL
(MLD) MN (MLD) UL (MLD)
1:00:00 AM 15.00 19.89 25.00
1:00:00 AM 11.80 13.20 14.59
2:00:00 AM 10.00 11.61 15.00
2:00:00 AM 11.36 13.15 14.93
3:00:00 AM 10.05 11.04 15.00
3:00:00 AM 11.48 13.12 14.75
4:00:00 AM 3.00 5.81 10.00
4:00:00 AM 12.07 13.57 15.07
5:00:00 AM 15.00 17.25 25.00
5:00:00 AM 11.42 16.58 21.74
6:00:00 AM 25.00 27.79 35.00
6:00:00 AM 18.63 26.13 33.63
7:00:00 AM 25.00 30.74 35.00
7:00:00 AM 25.75 31.25 36.75
8:00:00 AM 30.00 32.13 35.00
8:00:00 AM 29.92 32.12 34.31
9:00:00 AM 30.00 32.81 35.00
9:00:00 AM 31.93 32.39 32.84
10:00:00 AM 30.00 32.85 35.00
10:00:00 AM 31.72 32.30 32.88
11:00:00 AM 30.00 32.80 35.00
11:00:00 AM 31.52 32.10 32.67
12:00:00 PM 30.00 32.55 35.00
12:00:00 PM 29.48 31.36 33.23
1:00:00 PM 30.00 32.49 35.00
1:00:00 PM 27.84 30.42 33.01
2:00:00 PM 30.00 32.01 35.00
2:00:00 PM 25.75 29.35 32.94
3:00:00 PM 30.00 31.36 35.00
3:00:00 PM 24.12 28.29 32.45
4:00:00 PM 30.00 30.97 35.00
4:00:00 PM 24.48 28.14 31.80
5:00:00 PM 30.00 30.42 35.00
5:00:00 PM 25.81 28.59 31.38
6:00:00 PM 30.00 28.75 35.00
6:00:00 PM 27.50 29.38 31.26
7:00:00 PM 30.00 31.15 35.00
7:00:00 PM 26.48 28.73 30.98
8:00:00 PM 30.00 30.77 35.00
8:00:00 PM 25.49 27.35 29.21
9:00:00 PM 25.00 30.04 35.00
9:00:00 PM 23.48 25.61 27.73
10:00:00 PM 25.00 25.26 35.00
10:00:00 PM 20.09 22.27 24.45
11:00:00 PM 15.00 18.12 25.00
11:00:00 PM 14.73 16.82 18.91
12:00:00 AM 25.41 26.23 30.00
12:00:00 AM 12.87 14.49 16.11

Maynilad Water Safety Plan Revision No.2 / November 2015
169
GP WINSTON
Time LL
(MLD) MN (MLD) UL (MLD)
1:00:00 AM 21.70 30.02 38.34
2:00:00 AM 15.94 22.23 28.53
3:00:00 AM 16.06 21.78 27.49
4:00:00 AM 14.79 20.60 26.42
5:00:00 AM 19.08 30.56 42.03
6:00:00 AM 28.55 41.47 54.39
7:00:00 AM 38.46 49.18 59.91
8:00:00 AM 46.08 53.12 60.16
9:00:00 AM 49.43 55.62 61.81
10:00:00 AM 53.36 57.38 61.40
11:00:00 AM 54.77 57.76 60.75
12:00:00 PM 53.30 57.03 60.76
1:00:00 PM 51.48 55.56 59.63
2:00:00 PM 46.78 53.70 60.61
3:00:00 PM 44.09 51.52 58.95
4:00:00 PM 44.01 50.18 56.35
5:00:00 PM 45.00 49.69 54.37
6:00:00 PM 47.29 50.21 53.14
7:00:00 PM 48.54 50.54 52.53
8:00:00 PM 47.68 50.29 52.89
9:00:00 PM 46.16 48.85 51.55
10:00:00 PM 37.69 42.89 48.09
11:00:00 PM 31.73 35.50 39.26
12:00:00 AM 27.37 33.17 38.97

Maynilad Water Safety Plan Revision No.2 / November 2015
170
C. NAVOTAS - VALENZUELA
GP F. DELA CRUZ/ MAYSAN GP SALVADOR JORDAN PLAINS
Time LL
(MLD) MN (MLD) UL (MLD)
Time LL
(MLD) MN (MLD)
UL (MLD)
1:00:00 AM 9.00 11.98 14.00
1:00:00 AM 120.00 141.71 160.00
2:00:00 AM 9.00 11.86 14.00
2:00:00 AM 120.00 143.84 160.00
3:00:00 AM 9.00 11.88 14.00
3:00:00 AM 130.00 151.34 190.00
4:00:00 AM 9.00 12.72 15.00
4:00:00 AM 140.00 165.38 190.00
5:00:00 AM 9.00 12.22 15.00
5:00:00 AM 170.00 206.12 230.00
6:00:00 AM 12.00 14.92 19.00
6:00:00 AM 220.00 246.16 270.00
7:00:00 AM 12.00 16.69 19.00
7:00:00 AM 240.00 256.24 300.00
8:00:00 AM 12.00 17.42 20.00
8:00:00 AM 240.00 276.35 300.00
9:00:00 AM 12.00 17.33 20.00
9:00:00 AM 240.00 272.74 300.00
10:00:00 AM 12.00 17.19 20.00
10:00:00 AM 240.00 283.33 300.00
11:00:00 AM 12.00 16.97 20.00
11:00:00 AM 240.00 258.43 300.00
12:00:00 PM 12.00 16.39 20.00
12:00:00 PM 240.00 266.78 300.00
1:00:00 PM 12.00 15.95 19.00
1:00:00 PM 220.00 251.88 270.00
2:00:00 PM 12.00 15.57 19.00
2:00:00 PM 220.00 239.18 270.00
3:00:00 PM 11.00 14.44 18.00
3:00:00 PM 220.00 233.86 260.00
4:00:00 PM 11.00 14.31 18.00
4:00:00 PM 220.00 242.23 260.00
5:00:00 PM 11.00 14.28 18.00
5:00:00 PM 220.00 242.71 260.00
6:00:00 PM 11.00 14.72 18.00
6:00:00 PM 220.00 249.46 260.00
7:00:00 PM 11.00 14.72 18.00
7:00:00 PM 220.00 248.88 260.00
8:00:00 PM 10.00 14.41 17.00
8:00:00 PM 210.00 243.86 260.00
9:00:00 PM 10.00 13.77 17.00
9:00:00 PM 250.00 278.21 290.00
10:00:00 PM 8.00 13.14 14.00
10:00:00 PM 240.00 268.25 290.00
11:00:00 PM 8.00 13.00 14.00
11:00:00 PM 180.00 214.63 250.00
12:00:00 AM 8.00 11.71 14.00
12:00:00 AM 120.00 155.38 180.00
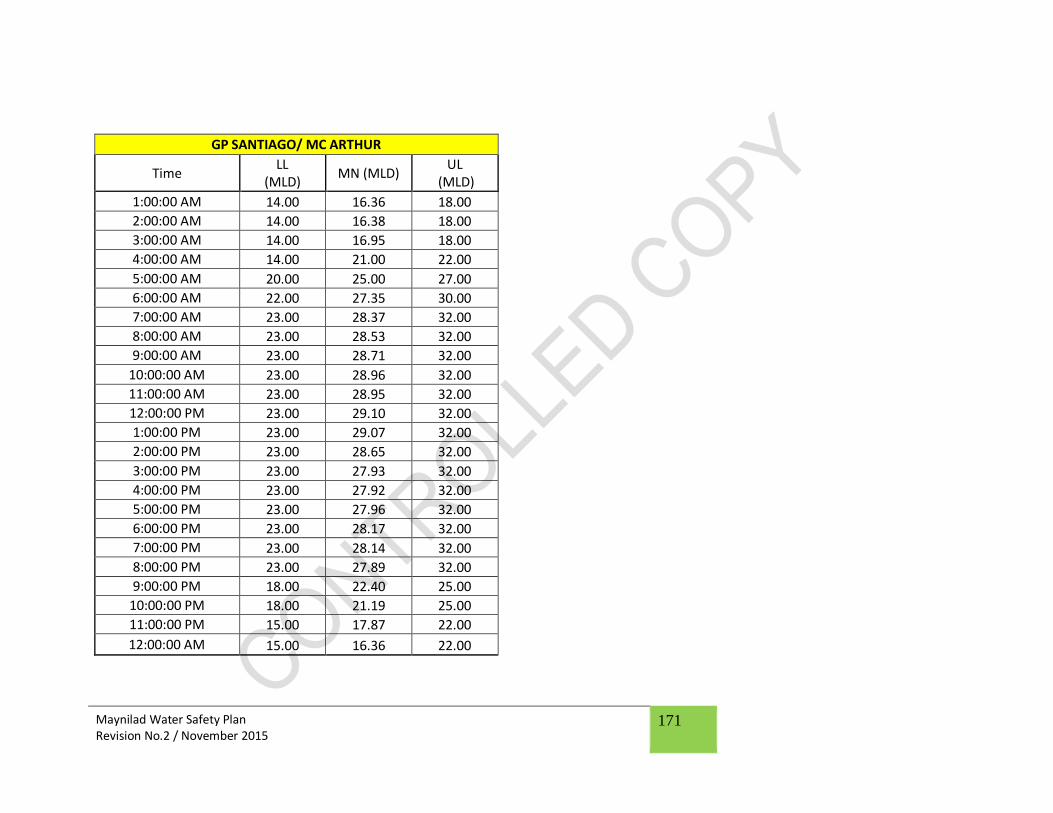
Maynilad Water Safety Plan Revision No.2 / November 2015
171
GP SANTIAGO/ MC ARTHUR
Time LL
(MLD) MN (MLD)
UL (MLD)
1:00:00 AM 14.00 16.36 18.00
2:00:00 AM 14.00 16.38 18.00
3:00:00 AM 14.00 16.95 18.00
4:00:00 AM 14.00 21.00 22.00
5:00:00 AM 20.00 25.00 27.00
6:00:00 AM 22.00 27.35 30.00
7:00:00 AM 23.00 28.37 32.00
8:00:00 AM 23.00 28.53 32.00
9:00:00 AM 23.00 28.71 32.00
10:00:00 AM 23.00 28.96 32.00
11:00:00 AM 23.00 28.95 32.00
12:00:00 PM 23.00 29.10 32.00
1:00:00 PM 23.00 29.07 32.00
2:00:00 PM 23.00 28.65 32.00
3:00:00 PM 23.00 27.93 32.00
4:00:00 PM 23.00 27.92 32.00
5:00:00 PM 23.00 27.96 32.00
6:00:00 PM 23.00 28.17 32.00
7:00:00 PM 23.00 28.14 32.00
8:00:00 PM 23.00 27.89 32.00
9:00:00 PM 18.00 22.40 25.00
10:00:00 PM 18.00 21.19 25.00
11:00:00 PM 15.00 17.87 22.00
12:00:00 AM 15.00 16.36 22.00

Maynilad Water Safety Plan Revision No.2 / November 2015
172
D. QUIRINO-ROOSEVELT
DGP 181 DGP 145
Time LL
(MLD) MN (MLD)
UL (MLD)
Time LL
(MLD) MN
(MLD) UL
(MLD)
1:00:00 AM 1349.34 1408.96 1468.59
1:00:00 AM 45.69 51.44 57.19
2:00:00 AM 1291.44 1359.74 1428.03
2:00:00 AM 44.05 49.19 54.32
3:00:00 AM 1257.77 1318.27 1378.77
3:00:00 AM 43.03 48.44 53.85
4:00:00 AM 1217.03 1288.56 1360.09
4:00:00 AM 44.3 50.33 56.36
5:00:00 AM 1252.95 1363.26 1473.57
5:00:00 AM 49.28 58.46 67.65
6:00:00 AM 1258.06 1484.94 1711.82
6:00:00 AM 54.39 73.09 91.78
7:00:00 AM 1461.76 1702.85 1943.94
7:00:00 AM 70.63 92.36 114.09
8:00:00 AM 1652.2 1753.85 1855.51
8:00:00 AM 87.86 97.57 107.28
9:00:00 AM 1674.74 1766.04 1857.34
9:00:00 AM 90.42 97.7 104.99
10:00:00 AM 1648.35 1732.16 1815.96
10:00:00 AM 88.64 96.86 105.07
11:00:00 AM 1629.31 1712.98 1796.64
11:00:00 AM 84.71 93.62 102.54
12:00:00 PM 1578.7 1687.61 1796.52
12:00:00 PM 79.93 88.97 98
1:00:00 PM 1551.5 1663.62 1775.73
1:00:00 PM 76.56 85.11 93.67
2:00:00 PM 1523.22 1650.92 1778.61
2:00:00 PM 73.59 82.65 91.72
3:00:00 PM 1496.14 1623.81 1751.48
3:00:00 PM 69.37 78.08 86.79
4:00:00 PM 1490.49 1615.8 1741.11
4:00:00 PM 68.95 76.88 84.81
5:00:00 PM 1564.08 1643.23 1722.39
5:00:00 PM 71.83 77.67 83.5
6:00:00 PM 1619.08 1681.27 1743.46
6:00:00 PM 75.44 79.89 84.33
7:00:00 PM 1616.45 1682.42 1748.4
7:00:00 PM 72.92 78.91 84.89
8:00:00 PM 1576.56 1657.58 1738.59
8:00:00 PM 70.17 77.23 84.29
9:00:00 PM 1539.24 1626.56 1713.88
9:00:00 PM 68.88 74.82 80.77
10:00:00 PM 1509.81 1580.9 1651.99
10:00:00 PM 63.11 70.07 77.02
11:00:00 PM 1396.87 1463.69 1530.51
11:00:00 PM 56.87 63.51 70.16
12:00:00 AM 1374.22 1425.95 1477.68
12:00:00 AM 51.72 56.01 60.29

Maynilad Water Safety Plan Revision No.2 / November 2015
173
OLD GP D. TUAZON GP QUEZON AVE
Time LL
(MLD) MN
(MLD) UL
(MLD)
Time LL
(MLD) MN
(MLD) UL
(MLD)
1:00:00 AM 24.96 30.59 36.21
1:00:00 AM 14.90 15.76 16.63
2:00:00 AM 22.36 30.00 37.63
2:00:00 AM 14.71 15.54 16.36
3:00:00 AM 23.66 30.28 36.91
3:00:00 AM 14.36 15.61 16.85
4:00:00 AM 24.23 31.08 37.92
4:00:00 AM 14.83 15.91 17.00
5:00:00 AM 26.81 33.75 40.70
5:00:00 AM 15.86 16.69 17.52
6:00:00 AM 31.84 42.11 52.37
6:00:00 AM 16.77 18.27 19.77
7:00:00 AM 37.91 50.96 64.01
7:00:00 AM 18.64 20.78 22.91
8:00:00 AM 44.33 53.88 63.44
8:00:00 AM 20.01 21.70 23.40
9:00:00 AM 46.02 53.98 61.94
9:00:00 AM 20.42 21.72 23.02
10:00:00 AM 48.98 53.89 58.80
10:00:00 AM 20.58 21.81 23.05
11:00:00 AM 46.90 52.41 57.91
11:00:00 AM 20.30 21.46 22.62
12:00:00 PM 44.60 49.73 54.86
12:00:00 PM 19.32 20.51 21.69
1:00:00 PM 43.17 48.92 54.66
1:00:00 PM 18.83 20.09 21.36
2:00:00 PM 43.31 47.43 51.54
2:00:00 PM 18.47 19.73 20.99
3:00:00 PM 42.12 44.71 47.30
3:00:00 PM 17.89 19.11 20.34
4:00:00 PM 39.94 43.43 46.91
4:00:00 PM 17.78 19.00 20.22
5:00:00 PM 39.73 43.66 47.58
5:00:00 PM 17.96 19.19 20.42
6:00:00 PM 40.79 44.84 48.89
6:00:00 PM 17.98 19.24 20.51
7:00:00 PM 40.65 44.13 47.60
7:00:00 PM 18.02 19.10 20.18
8:00:00 PM 39.13 43.70 48.28
8:00:00 PM 18.10 19.09 20.08
9:00:00 PM 37.26 41.99 46.72
9:00:00 PM 17.98 18.72 19.45
10:00:00 PM 32.22 39.86 47.50
10:00:00 PM 17.26 18.00 18.74
11:00:00 PM 30.78 36.07 41.37
11:00:00 PM 16.51 17.39 18.27
12:00:00 AM 28.04 33.00 37.96
12:00:00 AM 15.61 16.40 17.20

Maynilad Water Safety Plan Revision No.2 / November 2015
174
GP PLARIDEL
Time LL
(MLD) MN
(MLD) UL
(MLD)
1:00:00 AM 7.33 8.17 9.00
2:00:00 AM 6.63 7.52 8.41
3:00:00 AM 6.28 7.16 8.04
4:00:00 AM 6.37 7.28 8.19
5:00:00 AM 7.19 8.64 10.09
6:00:00 AM 8.11 12.29 16.47
7:00:00 AM 11.27 16.27 21.27
8:00:00 AM 14.54 17.62 20.70
9:00:00 AM 16.16 17.87 19.58
10:00:00 AM 15.85 17.72 19.58
11:00:00 AM 14.75 16.87 18.99
12:00:00 PM 13.61 16.07 18.53
1:00:00 PM 14.18 15.96 17.74
2:00:00 PM 13.65 15.58 17.51
3:00:00 PM 12.32 14.49 16.67
4:00:00 PM 12.24 14.13 16.01
5:00:00 PM 12.85 14.24 15.64
6:00:00 PM 13.54 14.59 15.64
7:00:00 PM 13.74 14.41 15.08
8:00:00 PM 13.35 14.30 15.25
9:00:00 PM 13.07 13.77 14.47
10:00:00 PM 11.81 12.90 13.99
11:00:00 PM 9.85 11.37 12.90
12:00:00 AM 5.72 9.20 12.67
GP 8th St
Time LL
(MLD) MN
(MLD) UL
(MLD)
1:00:00 AM 289.39 355.58 421.78
2:00:00 AM 273.14 341.50 409.86
3:00:00 AM 277.23 334.01 390.78
4:00:00 AM 268.74 330.84 392.94
5:00:00 AM 284.41 351.19 417.98
6:00:00 AM 270.41 408.03 545.66
7:00:00 AM 329.33 468.76 608.18
8:00:00 AM 381.37 478.21 575.05
9:00:00 AM 398.61 480.87 563.13
10:00:00 AM 377.19 459.40 541.61
11:00:00 AM 373.38 451.56 529.74
12:00:00 PM 371.39 448.54 525.69
1:00:00 PM 359.77 445.41 531.05
2:00:00 PM 354.00 442.24 530.47
3:00:00 PM 343.42 436.40 529.38
4:00:00 PM 345.29 435.85 526.41
5:00:00 PM 367.26 447.03 526.79
6:00:00 PM 377.11 457.48 537.84
7:00:00 PM 376.27 458.95 541.63
8:00:00 PM 367.44 453.84 540.25
9:00:00 PM 357.95 446.71 535.47
10:00:00 PM 340.23 428.83 517.42
11:00:00 PM 328.60 382.17 435.75
12:00:00 AM 309.86 368.57 427.29

Maynilad Water Safety Plan Revision No.2 / November 2015
175
F. CALOOCAN SOUTH
DGP 141 (without Cal PS Operation) DGP 141 (with Cal PS Operation)
Time LL
(MLD) MN
(MLD) UL
(MLD)
Time LL
(MLD) MN
(MLD) UL
(MLD)
1:00:00 AM 43.67 47.95 52.23
1:00:00 AM 47.15 48.86 50.57
2:00:00 AM 43.74 47.87 52.01
2:00:00 AM 46.49 48.71 50.93
3:00:00 AM 43.97 48.15 52.33
3:00:00 AM 46.31 48.96 51.61
4:00:00 AM 44.81 48.95 53.09
4:00:00 AM 47.53 49.80 52.07
5:00:00 AM 46.52 50.33 54.14
5:00:00 AM 49.24 51.56 53.88
6:00:00 AM 48.10 52.65 57.20
6:00:00 AM 51.95 52.05 52.14
7:00:00 AM 49.59 54.42 59.25
7:00:00 AM 32.72 36.65 40.58
8:00:00 AM 50.60 55.27 59.94
8:00:00 AM 32.48 33.56 34.64
9:00:00 AM 50.59 55.23 59.87
9:00:00 AM 30.52 33.78 37.05
10:00:00 AM 50.58 55.69 60.81
10:00:00 AM 32.57 36.85 41.14
11:00:00 AM 50.45 55.37 60.29
11:00:00 AM 30.22 37.43 44.64
12:00:00 PM 50.68 54.89 59.11
12:00:00 PM 30.15 39.46 48.76
1:00:00 PM 50.27 54.52 58.77
1:00:00 PM 52.94 54.35 55.77
2:00:00 PM 49.73 53.97 58.21
2:00:00 PM 53.26 54.18 55.09
3:00:00 PM 48.92 53.01 57.10
3:00:00 PM 53.08 53.47 53.87
4:00:00 PM 48.68 52.57 56.46
4:00:00 PM 52.68 53.15 53.61
5:00:00 PM 48.90 52.51 56.11
5:00:00 PM 51.92 53.07 54.22
6:00:00 PM 49.04 52.64 56.24
6:00:00 PM 52.55 53.16 53.77
7:00:00 PM 48.89 52.46 56.04
7:00:00 PM 52.24 53.29 54.34
8:00:00 PM 48.53 52.13 55.72
8:00:00 PM 52.35 53.14 53.94
9:00:00 PM 48.22 51.81 55.40
9:00:00 PM 51.84 52.75 53.66
10:00:00 PM 47.81 51.10 54.40
10:00:00 PM 51.59 52.19 52.79
11:00:00 PM 47.09 50.68 54.28
11:00:00 PM 50.46 51.58 52.70
12:00:00 AM 45.49 49.22 52.95
12:00:00 AM 47.83 50.14 52.45

Maynilad Water Safety Plan Revision No.2 / November 2015
176
DGP 169
Time LL
(MLD) MN
(MLD) UL
(MLD)
1:00:00 AM 20.74 21.86 22.98
2:00:00 AM 20.14 21.59 23.04
3:00:00 AM 20.39 21.72 23.04
4:00:00 AM 20.74 21.88 23.02
5:00:00 AM 21.59 22.65 23.72
6:00:00 AM 21.72 24.41 27.10
7:00:00 AM 23.62 25.51 27.39
8:00:00 AM 24.26 25.75 27.24
9:00:00 AM 24.62 25.79 26.96
10:00:00 AM 24.86 25.98 27.09
11:00:00 AM 24.66 25.74 26.83
12:00:00 PM 24.54 25.35 26.16
1:00:00 PM 24.35 25.17 25.99
2:00:00 PM 24.31 25.09 25.87
3:00:00 PM 23.91 24.78 25.64
4:00:00 PM 23.77 24.45 25.12
5:00:00 PM 23.30 24.33 25.36
6:00:00 PM 23.13 24.58 26.03
7:00:00 PM 22.98 24.43 25.87
8:00:00 PM 22.97 24.24 25.51
9:00:00 PM 22.86 24.05 25.25
10:00:00 PM 22.27 23.70 25.13
11:00:00 PM 21.92 23.32 24.73
12:00:00 AM 21.36 22.57 23.77
GP Mabini/ Laon-Laan
Time LL
(MLD) MN
(MLD) UL
(MLD)
1:00:00 AM 68.93 73.20 77.48
2:00:00 AM 67.40 71.83 76.25
3:00:00 AM 68.42 72.03 75.65
4:00:00 AM 71.23 74.17 77.10
5:00:00 AM 76.02 81.33 86.63
6:00:00 AM 82.52 94.93 107.34
7:00:00 AM 95.47 103.99 112.51
8:00:00 AM 101.68 106.57 111.45
9:00:00 AM 102.97 106.33 109.69
10:00:00 AM 102.70 107.43 112.15
11:00:00 AM 101.31 107.42 113.54
12:00:00 PM 99.25 105.27 111.29
1:00:00 PM 98.14 103.51 108.88
2:00:00 PM 95.61 101.08 106.55
3:00:00 PM 92.91 98.34 103.78
4:00:00 PM 92.78 97.58 102.38
5:00:00 PM 93.92 97.58 101.24
6:00:00 PM 96.22 98.80 101.38
7:00:00 PM 97.62 99.52 101.41
8:00:00 PM 95.07 98.15 101.24
9:00:00 PM 92.25 95.56 98.86
10:00:00 PM 87.66 91.46 95.27
11:00:00 PM 82.06 86.31 90.55
12:00:00 AM 73.07 77.71 82.35

Maynilad Water Safety Plan Revision No.2 / November 2015
177
G. MALABON-NAVOTAS
SBGP 46 GP REPARO 450
Time LL
(MLD) MN
(MLD) UL
(MLD)
Time LL
(MLD) MN
(MLD) UL
(MLD)
1:00:00 AM 95.50 115.50 130.50
1:00:00 AM 3.84 6.84 10.84
2:00:00 AM 93.88 113.88 128.88
2:00:00 AM 3.47 6.47 10.47
3:00:00 AM 98.90 118.90 133.90
3:00:00 AM 3.84 6.84 10.84
4:00:00 AM 99.60 119.60 134.60
4:00:00 AM 3.35 6.35 10.35
5:00:00 AM 107.36 127.36 142.36
5:00:00 AM 5.11 8.11 12.11
6:00:00 AM 124.12 144.12 159.12
6:00:00 AM 9.41 12.41 16.41
7:00:00 AM 143.51 163.51 178.51
7:00:00 AM 13.16 16.16 20.16
8:00:00 AM 157.64 177.64 192.64
8:00:00 AM 13.56 16.56 20.56
9:00:00 AM 166.12 186.12 201.12
9:00:00 AM 12.84 15.84 19.84
10:00:00 AM 169.79 189.79 204.79
10:00:00 AM 12.96 15.96 19.96
11:00:00 AM 165.27 185.27 200.27
11:00:00 AM 12.90 15.90 19.90
12:00:00 PM 161.21 181.21 196.21
12:00:00 PM 12.17 15.17 19.17
1:00:00 PM 159.30 179.30 194.30
1:00:00 PM 10.83 13.83 17.83
2:00:00 PM 156.08 176.08 191.08
2:00:00 PM 10.23 13.23 17.23
3:00:00 PM 147.90 167.90 182.90
3:00:00 PM 8.87 11.87 15.87
4:00:00 PM 144.12 164.12 179.12
4:00:00 PM 8.61 11.61 15.61
5:00:00 PM 142.05 162.05 177.05
5:00:00 PM 8.98 11.98 15.98
6:00:00 PM 143.74 163.74 178.74
6:00:00 PM 9.30 12.30 16.30
7:00:00 PM 141.84 161.84 176.84
7:00:00 PM 9.45 12.45 16.45
8:00:00 PM 138.08 158.08 173.08
8:00:00 PM 9.96 12.96 16.96
9:00:00 PM 131.38 151.38 166.38
9:00:00 PM 9.59 12.59 16.59
10:00:00 PM 122.26 142.26 157.26
10:00:00 PM 8.42 11.42 15.42
11:00:00 PM 112.00 132.00 147.00
11:00:00 PM 6.47 9.47 13.47
12:00:00 AM 104.42 124.42 139.42
12:00:00 AM 5.00 8.00 12.00

Maynilad Water Safety Plan Revision No.2 / November 2015
178
H. TONDO
SBGP 66 GP MUELLE
Time LL
(MLD) MN
(MLD) UL
(MLD)
Time LL
(MLD) MN
(MLD) UL
(MLD)
1:00:00 AM 636.72 656.72 686.72
1:00:00 AM 97.36 107.36 117.36
2:00:00 AM 618.57 638.57 668.57
2:00:00 AM 99.59 109.59 119.59
3:00:00 AM 604.12 624.12 654.12
3:00:00 AM 101.27 111.27 121.27
4:00:00 AM 580.88 600.88 630.88
4:00:00 AM 102.05 112.05 122.05
5:00:00 AM 572.75 592.75 622.75
5:00:00 AM 98.84 108.84 118.84
6:00:00 AM 594.20 614.20 644.20
6:00:00 AM 54.14 64.14 74.14
7:00:00 AM 646.39 666.39 696.39
7:00:00 AM 46.16 56.16 66.16
8:00:00 AM 667.67 687.67 717.67
8:00:00 AM 48.26 58.26 68.26
9:00:00 AM 676.45 696.45 726.45
9:00:00 AM 49.50 59.50 69.50
10:00:00 AM 657.00 677.00 707.00
10:00:00 AM 52.29 62.29 72.29
11:00:00 AM 654.04 674.04 704.04
11:00:00 AM 50.48 60.48 70.48
12:00:00 PM 647.84 667.84 697.84
12:00:00 PM 49.25 59.25 69.25
1:00:00 PM 651.80 671.80 701.80
1:00:00 PM 67.56 77.56 87.56
2:00:00 PM 649.59 669.59 699.59
2:00:00 PM 68.56 78.56 88.56
3:00:00 PM 655.83 675.83 705.83
3:00:00 PM 67.79 77.79 87.79
4:00:00 PM 663.71 683.71 713.71
4:00:00 PM 67.74 77.74 87.74
5:00:00 PM 661.87 681.87 711.87
5:00:00 PM 66.44 76.44 86.44
6:00:00 PM 664.04 684.04 714.04
6:00:00 PM 48.37 58.37 68.37
7:00:00 PM 665.44 685.44 715.44
7:00:00 PM 46.92 56.92 66.92
8:00:00 PM 665.23 685.23 715.23
8:00:00 PM 46.57 56.57 66.57
9:00:00 PM 673.73 693.73 723.73
9:00:00 PM 46.51 56.51 66.51
10:00:00 PM 661.85 681.85 711.85
10:00:00 PM 64.61 74.61 84.61
11:00:00 PM 632.41 652.41 682.41
11:00:00 PM 66.50 76.50 86.50
12:00:00 AM 624.38 644.38 674.38
12:00:00 AM 64.09 74.09 84.09

Maynilad Water Safety Plan Revision No.2 / November 2015
179
I. SOUTH MANILA-PASAY-MAKATI
SBGP 66 GP MUELLE
Time LL
(MLD) MN
(MLD) UL
(MLD)
Time LL
(MLD) MN
(MLD) UL
(MLD)
1:00:00 AM 636.72 656.72 686.72
1:00:00 AM 97.36 107.36 117.36
2:00:00 AM 618.57 638.57 668.57
2:00:00 AM 99.59 109.59 119.59
3:00:00 AM 604.12 624.12 654.12
3:00:00 AM 101.27 111.27 121.27
4:00:00 AM 580.88 600.88 630.88
4:00:00 AM 102.05 112.05 122.05
5:00:00 AM 572.75 592.75 622.75
5:00:00 AM 98.84 108.84 118.84
6:00:00 AM 594.20 614.20 644.20
6:00:00 AM 54.14 64.14 74.14
7:00:00 AM 646.39 666.39 696.39
7:00:00 AM 46.16 56.16 66.16
8:00:00 AM 667.67 687.67 717.67
8:00:00 AM 48.26 58.26 68.26
9:00:00 AM 676.45 696.45 726.45
9:00:00 AM 49.50 59.50 69.50
10:00:00 AM 657.00 677.00 707.00
10:00:00 AM 52.29 62.29 72.29
11:00:00 AM 654.04 674.04 704.04
11:00:00 AM 50.48 60.48 70.48
12:00:00 PM 647.84 667.84 697.84
12:00:00 PM 49.25 59.25 69.25
1:00:00 PM 651.80 671.80 701.80
1:00:00 PM 67.56 77.56 87.56
2:00:00 PM 649.59 669.59 699.59
2:00:00 PM 68.56 78.56 88.56
3:00:00 PM 655.83 675.83 705.83
3:00:00 PM 67.79 77.79 87.79
4:00:00 PM 663.71 683.71 713.71
4:00:00 PM 67.74 77.74 87.74
5:00:00 PM 661.87 681.87 711.87
5:00:00 PM 66.44 76.44 86.44
6:00:00 PM 664.04 684.04 714.04
6:00:00 PM 48.37 58.37 68.37
7:00:00 PM 665.44 685.44 715.44
7:00:00 PM 46.92 56.92 66.92
8:00:00 PM 665.23 685.23 715.23
8:00:00 PM 46.57 56.57 66.57
9:00:00 PM 673.73 693.73 723.73
9:00:00 PM 46.51 56.51 66.51
10:00:00 PM 661.85 681.85 711.85
10:00:00 PM 64.61 74.61 84.61
11:00:00 PM 632.41 652.41 682.41
11:00:00 PM 66.50 76.50 86.50
12:00:00 AM 624.38 644.38 674.38
12:00:00 AM 64.09 74.09 84.09

Maynilad Water Safety Plan Revision No.2 / November 2015
180
J. SAMPALOC
GP ESPANA/ HALCON GP SOBRIEDAD/ BATANES
Time LL
(MLD) MN
(MLD) UL
(MLD)
Time LL
(MLD) MN
(MLD) UL
(MLD)
1:00:00 AM 34.93 39.93 54.93
1:00:00 AM 247.90 252.90 257.90
2:00:00 AM 32.92 37.92 52.92
2:00:00 AM 242.32 247.32 252.32
3:00:00 AM 31.82 36.82 51.82
3:00:00 AM 238.29 243.29 248.29
4:00:00 AM 32.48 37.48 52.48
4:00:00 AM 245.50 250.50 255.50
5:00:00 AM 37.62 42.62 57.62
5:00:00 AM 260.93 265.93 270.93
6:00:00 AM 50.30 55.30 70.30
6:00:00 AM 291.47 296.47 301.47
7:00:00 AM 66.50 71.50 86.50
7:00:00 AM 296.24 301.24 306.24
8:00:00 AM 72.31 77.31 92.31
8:00:00 AM 295.08 300.08 305.08
9:00:00 AM 73.84 78.84 93.84
9:00:00 AM 262.98 267.98 272.98
10:00:00 AM 74.10 79.10 94.10
10:00:00 AM 258.72 263.72 268.72
11:00:00 AM 71.76 76.76 91.76
11:00:00 AM 255.97 260.97 265.97
12:00:00 PM 68.82 73.82 88.82
12:00:00 PM 259.70 264.70 269.70
1:00:00 PM 67.05 72.05 87.05
1:00:00 PM 257.65 262.65 267.65
2:00:00 PM 64.65 69.65 84.65
2:00:00 PM 261.89 266.89 271.89
3:00:00 PM 61.65 66.65 81.65
3:00:00 PM 269.83 274.83 279.83
4:00:00 PM 60.58 65.58 80.58
4:00:00 PM 269.97 274.97 279.97
5:00:00 PM 60.95 65.95 80.95
5:00:00 PM 270.97 275.97 280.97
6:00:00 PM 61.30 66.30 81.30
6:00:00 PM 272.98 277.98 282.98
7:00:00 PM 61.54 66.54 81.54
7:00:00 PM 273.70 278.70 283.70
8:00:00 PM 59.80 64.80 79.80
8:00:00 PM 282.69 287.69 292.69
9:00:00 PM 57.63 62.63 77.63
9:00:00 PM 280.58 285.58 290.58
10:00:00 PM 54.07 59.07 74.07
10:00:00 PM 267.18 272.18 277.18
11:00:00 PM 44.07 49.07 64.07
11:00:00 PM 262.68 267.68 272.68
12:00:00 AM 38.86 43.86 58.86
12:00:00 AM 265.86 270.86 275.86
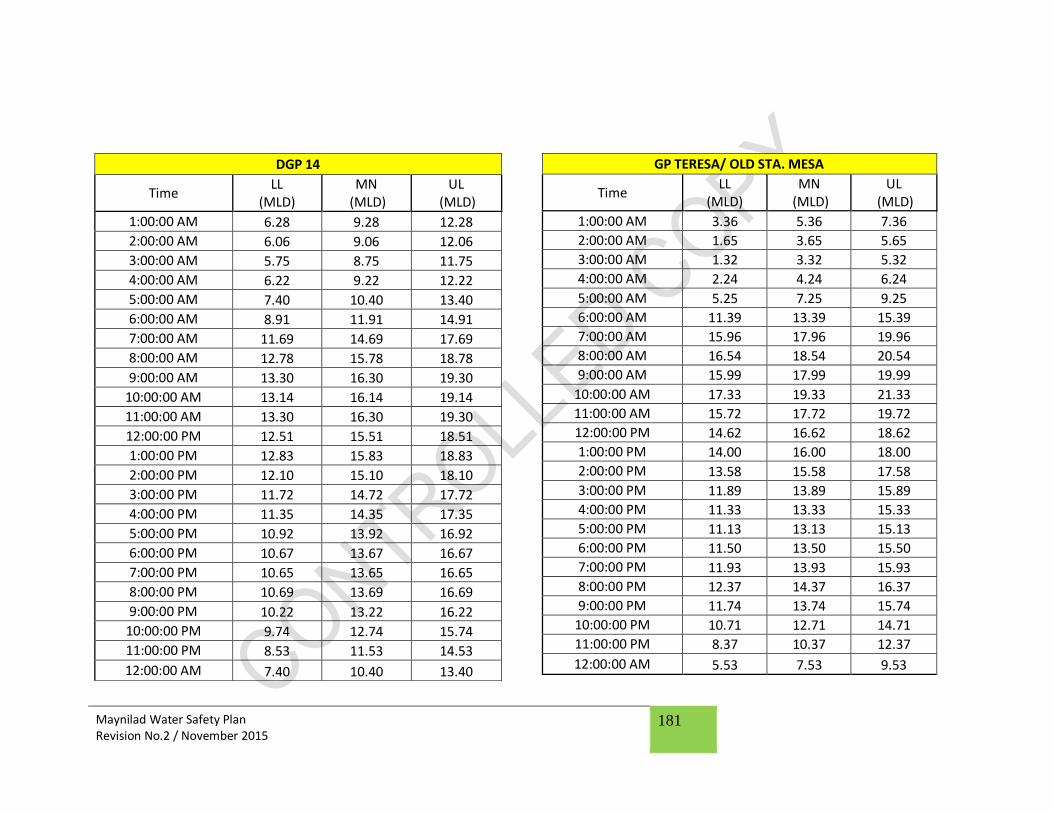
Maynilad Water Safety Plan Revision No.2 / November 2015
181
GP TERESA/ OLD STA. MESA
Time LL
(MLD) MN
(MLD) UL
(MLD)
1:00:00 AM 3.36 5.36 7.36
2:00:00 AM 1.65 3.65 5.65
3:00:00 AM 1.32 3.32 5.32
4:00:00 AM 2.24 4.24 6.24
5:00:00 AM 5.25 7.25 9.25
6:00:00 AM 11.39 13.39 15.39
7:00:00 AM 15.96 17.96 19.96
8:00:00 AM 16.54 18.54 20.54
9:00:00 AM 15.99 17.99 19.99
10:00:00 AM 17.33 19.33 21.33
11:00:00 AM 15.72 17.72 19.72
12:00:00 PM 14.62 16.62 18.62
1:00:00 PM 14.00 16.00 18.00
2:00:00 PM 13.58 15.58 17.58
3:00:00 PM 11.89 13.89 15.89
4:00:00 PM 11.33 13.33 15.33
5:00:00 PM 11.13 13.13 15.13
6:00:00 PM 11.50 13.50 15.50
7:00:00 PM 11.93 13.93 15.93
8:00:00 PM 12.37 14.37 16.37
9:00:00 PM 11.74 13.74 15.74
10:00:00 PM 10.71 12.71 14.71
11:00:00 PM 8.37 10.37 12.37
12:00:00 AM 5.53 7.53 9.53
DGP 14
Time LL
(MLD) MN
(MLD) UL
(MLD)
1:00:00 AM 6.28 9.28 12.28
2:00:00 AM 6.06 9.06 12.06
3:00:00 AM 5.75 8.75 11.75
4:00:00 AM 6.22 9.22 12.22
5:00:00 AM 7.40 10.40 13.40
6:00:00 AM 8.91 11.91 14.91
7:00:00 AM 11.69 14.69 17.69
8:00:00 AM 12.78 15.78 18.78
9:00:00 AM 13.30 16.30 19.30
10:00:00 AM 13.14 16.14 19.14
11:00:00 AM 13.30 16.30 19.30
12:00:00 PM 12.51 15.51 18.51
1:00:00 PM 12.83 15.83 18.83
2:00:00 PM 12.10 15.10 18.10
3:00:00 PM 11.72 14.72 17.72
4:00:00 PM 11.35 14.35 17.35
5:00:00 PM 10.92 13.92 16.92
6:00:00 PM 10.67 13.67 16.67
7:00:00 PM 10.65 13.65 16.65
8:00:00 PM 10.69 13.69 16.69
9:00:00 PM 10.22 13.22 16.22
10:00:00 PM 9.74 12.74 15.74
11:00:00 PM 8.53 11.53 14.53
12:00:00 AM 7.40 10.40 13.40
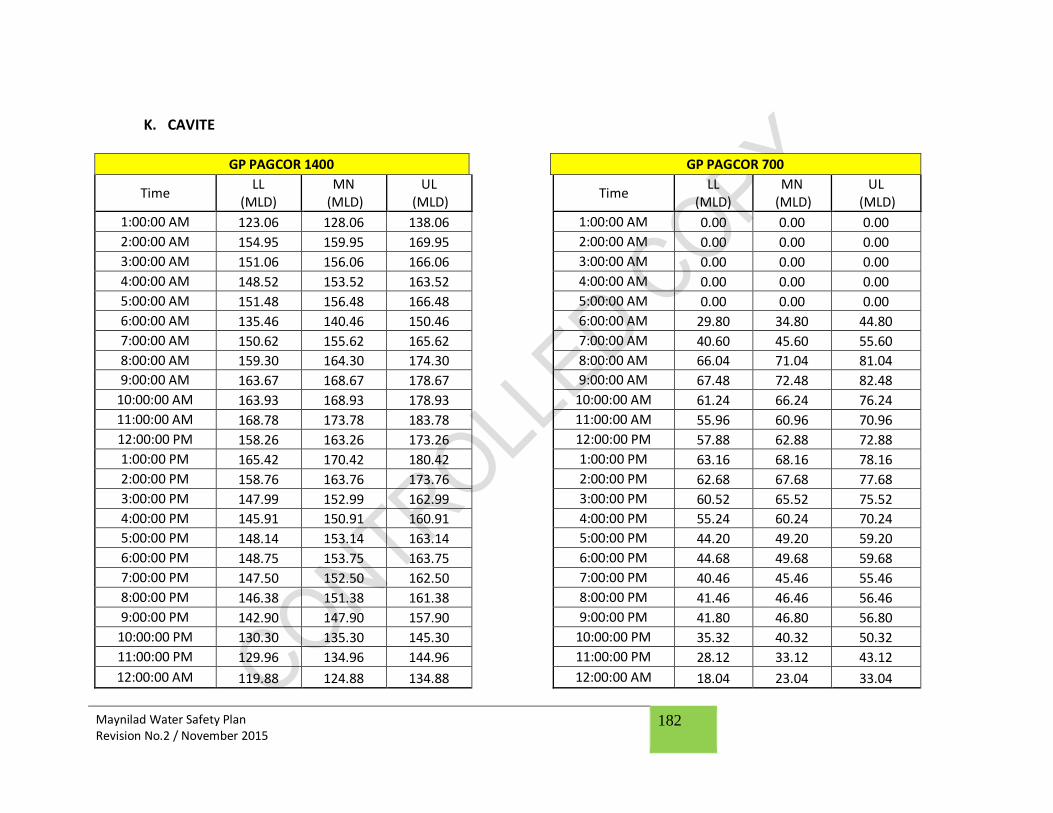
Maynilad Water Safety Plan Revision No.2 / November 2015
182
K. CAVITE
GP PAGCOR 1400 GP PAGCOR 700
Time LL
(MLD) MN
(MLD) UL
(MLD)
Time LL
(MLD) MN
(MLD) UL
(MLD)
1:00:00 AM 123.06 128.06 138.06
1:00:00 AM 0.00 0.00 0.00
2:00:00 AM 154.95 159.95 169.95
2:00:00 AM 0.00 0.00 0.00
3:00:00 AM 151.06 156.06 166.06
3:00:00 AM 0.00 0.00 0.00
4:00:00 AM 148.52 153.52 163.52
4:00:00 AM 0.00 0.00 0.00
5:00:00 AM 151.48 156.48 166.48
5:00:00 AM 0.00 0.00 0.00
6:00:00 AM 135.46 140.46 150.46
6:00:00 AM 29.80 34.80 44.80
7:00:00 AM 150.62 155.62 165.62
7:00:00 AM 40.60 45.60 55.60
8:00:00 AM 159.30 164.30 174.30
8:00:00 AM 66.04 71.04 81.04
9:00:00 AM 163.67 168.67 178.67
9:00:00 AM 67.48 72.48 82.48
10:00:00 AM 163.93 168.93 178.93
10:00:00 AM 61.24 66.24 76.24
11:00:00 AM 168.78 173.78 183.78
11:00:00 AM 55.96 60.96 70.96
12:00:00 PM 158.26 163.26 173.26
12:00:00 PM 57.88 62.88 72.88
1:00:00 PM 165.42 170.42 180.42
1:00:00 PM 63.16 68.16 78.16
2:00:00 PM 158.76 163.76 173.76
2:00:00 PM 62.68 67.68 77.68
3:00:00 PM 147.99 152.99 162.99
3:00:00 PM 60.52 65.52 75.52
4:00:00 PM 145.91 150.91 160.91
4:00:00 PM 55.24 60.24 70.24
5:00:00 PM 148.14 153.14 163.14
5:00:00 PM 44.20 49.20 59.20
6:00:00 PM 148.75 153.75 163.75
6:00:00 PM 44.68 49.68 59.68
7:00:00 PM 147.50 152.50 162.50
7:00:00 PM 40.46 45.46 55.46
8:00:00 PM 146.38 151.38 161.38
8:00:00 PM 41.46 46.46 56.46
9:00:00 PM 142.90 147.90 157.90
9:00:00 PM 41.80 46.80 56.80
10:00:00 PM 130.30 135.30 145.30
10:00:00 PM 35.32 40.32 50.32
11:00:00 PM 129.96 134.96 144.96
11:00:00 PM 28.12 33.12 43.12
12:00:00 AM 119.88 124.88 134.88
12:00:00 AM 18.04 23.04 33.04

Maynilad Water Safety Plan Revision No.2 / November 2015
183
GP COASTAL/ KABIHASNAN GP MALAMOK
Time LL
(MLD) MN
(MLD) UL
(MLD)
Time LL
(MLD) MN
(MLD) UL
(MLD)
1:00:00 AM 0.00 0.20 0.00
1:00:00 AM 34.16 39.16 44.16
2:00:00 AM 0.00 0.14 0.00
2:00:00 AM 35.59 40.59 45.59
3:00:00 AM 0.00 0.24 0.00
3:00:00 AM 37.26 42.26 47.26
4:00:00 AM 0.00 0.15 0.00
4:00:00 AM 36.96 41.96 46.96
5:00:00 AM 0.00 0.10 0.00
5:00:00 AM 36.25 41.25 46.25
6:00:00 AM 31.83 36.83 41.83
6:00:00 AM 36.29 41.29 46.29
7:00:00 AM 53.48 58.48 63.48
7:00:00 AM 36.53 41.53 46.53
8:00:00 AM 71.92 76.92 81.92
8:00:00 AM 38.36 43.36 48.36
9:00:00 AM 70.61 75.61 80.61
9:00:00 AM 37.49 42.49 47.49
10:00:00 AM 62.46 67.46 72.46
10:00:00 AM 36.78 41.78 46.78
11:00:00 AM 57.15 62.15 67.15
11:00:00 AM 37.70 42.70 47.70
12:00:00 PM 64.47 69.47 74.47
12:00:00 PM 36.99 41.99 46.99
1:00:00 PM 67.03 72.03 77.03
1:00:00 PM 38.44 43.44 48.44
2:00:00 PM 66.24 71.24 76.24
2:00:00 PM 39.18 44.18 49.18
3:00:00 PM 64.72 69.72 74.72
3:00:00 PM 39.70 44.70 49.70
4:00:00 PM 57.23 62.23 67.23
4:00:00 PM 39.76 44.76 49.76
5:00:00 PM 53.69 58.69 63.69
5:00:00 PM 39.59 44.59 49.59
6:00:00 PM 52.84 57.84 62.84
6:00:00 PM 39.36 44.36 49.36
7:00:00 PM 53.56 58.56 63.56
7:00:00 PM 39.24 44.24 49.24
8:00:00 PM 57.79 62.79 67.79
8:00:00 PM 39.01 44.01 49.01
9:00:00 PM 58.19 63.19 68.19
9:00:00 PM 39.30 44.30 49.30
10:00:00 PM 40.03 45.03 50.03
10:00:00 PM 38.69 43.69 48.69
11:00:00 PM 32.48 37.48 42.48
11:00:00 PM 37.13 42.13 47.13
12:00:00 AM 0.30 5.30 10.30
12:00:00 AM 34.70 39.70 44.70

Maynilad Water Safety Plan Revision No.2 / November 2015
184
GP EVANGELISTA/ COASTAL
Time LL
(MLD) MN
(MLD) UL
(MLD)
1:00:00 AM 15.60 18.60 21.60
2:00:00 AM 15.68 18.68 21.68
3:00:00 AM 16.13 19.13 22.13
4:00:00 AM 16.22 19.22 22.22
5:00:00 AM 16.37 19.37 22.37
6:00:00 AM 17.67 20.67 23.67
7:00:00 AM 19.74 22.74 25.74
8:00:00 AM 22.07 25.07 28.07
9:00:00 AM 22.80 25.80 28.80
10:00:00 AM 23.00 26.00 29.00
11:00:00 AM 22.93 25.93 28.93
12:00:00 PM 22.35 25.35 28.35
1:00:00 PM 22.37 25.37 28.37
2:00:00 PM 22.20 25.20 28.20
3:00:00 PM 21.54 24.54 27.54
4:00:00 PM 21.06 24.06 27.06
5:00:00 PM 20.80 23.80 26.80
6:00:00 PM 20.90 23.90 26.90
7:00:00 PM 20.82 23.82 26.82
8:00:00 PM 20.49 23.49 26.49
9:00:00 PM 19.94 22.94 25.94
10:00:00 PM 18.95 21.95 24.95
11:00:00 PM 17.50 20.50 23.50
12:00:00 AM 16.27 19.27 22.27

Maynilad Water Safety Plan Revision No.2 / November 2015
185
L. MUNTINLUPA-LAS PINAS
GP MARCOS ALVAREZ/ ALAZAP GP NIA 600
Time LL
(MLD) MN
(MLD) UL
(MLD)
Time LL
(MLD) MN
(MLD) UL
(MLD)
1:00:00 AM 7.17 12.17 17.17
1:00:00 AM 2.18 5.18 8.18
2:00:00 AM 6.99 11.99 16.99
2:00:00 AM 1.87 4.87 7.87
3:00:00 AM 6.94 11.94 16.94
3:00:00 AM 3.84 6.84 9.84
4:00:00 AM 6.98 11.98 16.98
4:00:00 AM 3.91 6.91 9.91
5:00:00 AM 7.34 12.34 17.34
5:00:00 AM 3.89 6.89 9.89
6:00:00 AM 8.58 13.58 18.58
6:00:00 AM 6.72 9.72 12.72
7:00:00 AM 10.56 15.56 20.56
7:00:00 AM 10.66 13.66 16.66
8:00:00 AM 12.24 17.24 22.24
8:00:00 AM 13.20 16.20 19.20
9:00:00 AM 12.55 17.55 22.55
9:00:00 AM 14.86 17.86 20.86
10:00:00 AM 12.49 17.49 22.49
10:00:00 AM 15.34 18.34 21.34
11:00:00 AM 12.16 17.16 22.16
11:00:00 AM 14.45 17.45 20.45
12:00:00 PM 11.76 16.76 21.76
12:00:00 PM 13.97 16.97 19.97
1:00:00 PM 11.62 16.62 21.62
1:00:00 PM 12.48 15.48 18.48
2:00:00 PM 11.29 16.29 21.29
2:00:00 PM 11.52 14.52 17.52
3:00:00 PM 10.63 15.63 20.63
3:00:00 PM 10.25 13.25 16.25
4:00:00 PM 10.40 15.40 20.40
4:00:00 PM 9.84 12.84 15.84
5:00:00 PM 10.20 15.20 20.20
5:00:00 PM 9.29 12.29 15.29
6:00:00 PM 10.32 15.32 20.32
6:00:00 PM 9.38 12.38 15.38
7:00:00 PM 10.25 15.25 20.25
7:00:00 PM 8.76 11.76 14.76
8:00:00 PM 9.97 14.97 19.97
8:00:00 PM 8.26 11.26 14.26
9:00:00 PM 9.57 14.57 19.57
9:00:00 PM 7.70 10.70 13.70
10:00:00 PM 9.00 14.00 19.00
10:00:00 PM 6.72 9.72 12.72
11:00:00 PM 8.10 13.10 18.10
11:00:00 PM 4.70 7.70 10.70
12:00:00 AM 2.19 7.19 12.19
12:00:00 AM 3.34 6.34 9.34

Maynilad Water Safety Plan Revision No.2 / November 2015
186
DGP 067T GP ALAZAP 1400
Time LL
(MLD) MN
(MLD) UL
(MLD)
Time LL
(MLD) MN
(MLD) UL
(MLD)
1:00:00 AM 23.80 26.80 29.80
1:00:00 AM 17.16 22.16 32.16
2:00:00 AM 23.91 26.91 29.91
2:00:00 AM 14.37 19.37 29.37
3:00:00 AM 25.07 28.07 31.07
3:00:00 AM 22.43 27.43 37.43
4:00:00 AM 24.66 27.66 30.66
4:00:00 AM 24.34 29.34 39.34
5:00:00 AM 25.92 28.92 31.92
5:00:00 AM 27.11 32.11 42.11
6:00:00 AM 28.39 31.39 34.39
6:00:00 AM 44.19 49.19 59.19
7:00:00 AM 32.93 35.93 38.93
7:00:00 AM 55.70 60.70 70.70
8:00:00 AM 38.49 41.49 44.49
8:00:00 AM 75.54 80.54 90.54
9:00:00 AM 39.11 42.11 45.11
9:00:00 AM 76.70 81.70 91.70
10:00:00 AM 38.77 41.77 44.77
10:00:00 AM 79.21 84.21 94.21
11:00:00 AM 39.38 42.38 45.38
11:00:00 AM 76.43 81.43 91.43
12:00:00 PM 38.06 41.06 44.06
12:00:00 PM 73.05 78.05 88.05
1:00:00 PM 38.43 41.43 44.43
1:00:00 PM 75.37 80.37 90.37
2:00:00 PM 38.48 41.48 44.48
2:00:00 PM 70.55 75.55 85.55
3:00:00 PM 36.79 39.79 42.79
3:00:00 PM 65.16 70.16 80.16
4:00:00 PM 35.97 38.97 41.97
4:00:00 PM 61.67 66.67 76.67
5:00:00 PM 35.66 38.66 41.66
5:00:00 PM 61.03 66.03 76.03
6:00:00 PM 35.51 38.51 41.51
6:00:00 PM 62.16 67.16 77.16
7:00:00 PM 35.46 38.46 41.46
7:00:00 PM 59.93 64.93 74.93
8:00:00 PM 35.14 38.14 41.14
8:00:00 PM 62.41 67.41 77.41
9:00:00 PM 33.98 36.98 39.98
9:00:00 PM 59.40 64.40 74.40
10:00:00 PM 31.79 34.79 37.79
10:00:00 PM 46.61 51.61 61.61
11:00:00 PM 28.11 31.11 34.11
11:00:00 PM 44.21 49.21 59.21
12:00:00 AM 24.84 27.84 30.84
12:00:00 AM 19.41 24.41 34.41

Maynilad Water Safety Plan Revision No.2 / November 2015
187
GP PNR 900
Time LL
(MLD) MN
(MLD) UL
(MLD)
1:00:00 AM 3.62 6.62 9.62
2:00:00 AM 3.55 6.55 9.55
3:00:00 AM 3.35 6.35 9.35
4:00:00 AM 3.43 6.43 9.43
5:00:00 AM 4.10 7.10 10.10
6:00:00 AM 6.92 9.92 12.92
7:00:00 AM 10.02 13.02 16.02
8:00:00 AM 14.25 17.25 20.25
9:00:00 AM 17.19 20.19 23.19
10:00:00 AM 17.58 20.58 23.58
11:00:00 AM 16.86 19.86 22.86
12:00:00 PM 15.91 18.91 21.91
1:00:00 PM 14.82 17.82 20.82
2:00:00 PM 12.99 15.99 18.99
3:00:00 PM 11.43 14.43 17.43
4:00:00 PM 11.17 14.17 17.17
5:00:00 PM 10.42 13.42 16.42
6:00:00 PM 9.92 12.92 15.92
7:00:00 PM 9.38 12.38 15.38
8:00:00 PM 8.73 11.73 14.73
9:00:00 PM 8.09 11.09 14.09
10:00:00 PM 7.00 10.00 13.00
11:00:00 PM 5.41 8.41 11.41
12:00:00 AM 4.54 7.54 10.54

Maynilad Water Safety Plan Revision No.2 / November 2015
188
M. PARANAQUE
GP MARCELO GP DONA SOLEDAD
Time LL
(MLD) MN
(MLD) UL
(MLD)
Time LL
(MLD) MN
(MLD) UL
(MLD)
1:00:00 AM 11.81 13.81 15.81
1:00:00 AM 15.92 17.92 19.92
2:00:00 AM 11.51 13.51 15.51
2:00:00 AM 15.87 17.87 19.87
3:00:00 AM 11.28 13.28 15.28
3:00:00 AM 15.85 17.85 19.85
4:00:00 AM 11.44 13.44 15.44
4:00:00 AM 15.76 17.76 19.76
5:00:00 AM 12.58 14.58 16.58
5:00:00 AM 15.12 17.12 19.12
6:00:00 AM 14.64 16.64 18.64
6:00:00 AM 15.05 17.05 19.05
7:00:00 AM 17.18 19.18 21.18
7:00:00 AM 18.35 20.35 22.35
8:00:00 AM 17.32 19.32 21.32
8:00:00 AM 17.49 19.49 21.49
9:00:00 AM 17.26 19.26 21.26
9:00:00 AM 18.51 20.51 22.51
10:00:00 AM 16.93 18.93 20.93
10:00:00 AM 17.59 19.59 21.59
11:00:00 AM 16.61 18.61 20.61
11:00:00 AM 17.61 19.61 21.61
12:00:00 PM 16.65 18.65 20.65
12:00:00 PM 17.97 19.97 21.97
1:00:00 PM 15.80 17.80 19.80
1:00:00 PM 17.62 19.62 21.62
2:00:00 PM 15.66 17.66 19.66
2:00:00 PM 18.53 20.53 22.53
3:00:00 PM 15.53 17.53 19.53
3:00:00 PM 18.51 20.51 22.51
4:00:00 PM 15.76 17.76 19.76
4:00:00 PM 18.48 20.48 22.48
5:00:00 PM 15.98 17.98 19.98
5:00:00 PM 18.30 20.30 22.30
6:00:00 PM 15.88 17.88 19.88
6:00:00 PM 17.61 19.61 21.61
7:00:00 PM 15.91 17.91 19.91
7:00:00 PM 18.30 20.30 22.30
8:00:00 PM 15.51 17.51 19.51
8:00:00 PM 17.45 19.45 21.45
9:00:00 PM 15.16 17.16 19.16
9:00:00 PM 17.26 19.26 21.26
10:00:00 PM 14.92 16.92 18.92
10:00:00 PM 18.25 20.25 22.25
11:00:00 PM 13.84 15.84 17.84
11:00:00 PM 17.26 19.26 21.26
12:00:00 AM 12.61 14.61 16.61
12:00:00 AM 18.14 20.14 22.14

Maynilad Water Safety Plan Revision No.2 / November 2015
189
DGP 319 GP ROXAS/ RUSSEL
Time LL
(MLD) MN
(MLD) UL
(MLD)
Time LL
(MLD) MN
(MLD) UL
(MLD)
1:00:00 AM 48.18 50.18 52.18
1:00:00 AM 9.47 11.47 13.47
2:00:00 AM 45.38 47.38 49.38
2:00:00 AM 7.51 9.51 11.51
3:00:00 AM 46.19 48.19 50.19
3:00:00 AM 7.81 9.81 11.81
4:00:00 AM 47.34 49.34 51.34
4:00:00 AM 8.29 10.29 12.29
5:00:00 AM 67.17 69.17 71.17
5:00:00 AM 10.92 12.92 14.92
6:00:00 AM 82.03 84.03 86.03
6:00:00 AM 13.21 15.21 17.21
7:00:00 AM 94.96 96.96 98.96
7:00:00 AM 16.62 18.62 20.62
8:00:00 AM 96.81 98.81 100.81
8:00:00 AM 21.09 23.09 25.09
9:00:00 AM 97.00 99.00 101.00
9:00:00 AM 22.85 24.85 26.85
10:00:00 AM 100.17 102.17 104.17
10:00:00 AM 21.26 23.26 25.26
11:00:00 AM 97.34 99.34 101.34
11:00:00 AM 20.43 22.43 24.43
12:00:00 PM 95.25 97.25 99.25
12:00:00 PM 21.38 23.38 25.38
1:00:00 PM 84.69 86.69 88.69
1:00:00 PM 19.78 21.78 23.78
2:00:00 PM 82.41 84.41 86.41
2:00:00 PM 21.69 23.69 25.69
3:00:00 PM 80.63 82.63 84.63
3:00:00 PM 20.53 22.53 24.53
4:00:00 PM 79.79 81.79 83.79
4:00:00 PM 18.81 20.81 22.81
5:00:00 PM 80.32 82.32 84.32
5:00:00 PM 18.27 20.27 22.27
6:00:00 PM 82.34 84.34 86.34
6:00:00 PM 18.30 20.30 22.30
7:00:00 PM 82.36 84.36 86.36
7:00:00 PM 17.18 19.18 21.18
8:00:00 PM 80.49 82.49 84.49
8:00:00 PM 17.48 19.48 21.48
9:00:00 PM 78.95 80.95 82.95
9:00:00 PM 16.22 18.22 20.22
10:00:00 PM 76.70 78.70 80.70
10:00:00 PM 16.26 18.26 20.26
11:00:00 PM 65.58 67.58 69.58
11:00:00 PM 13.88 15.88 17.88
12:00:00 AM 62.54 64.54 66.54
12:00:00 AM 12.77 14.77 16.77

Maynilad Water Safety Plan Revision No.2 / November 2015
190
GP SALES 300 DGP 069T
Time LL
(MLD) MN
(MLD) UL
(MLD)
Time LL
(MLD) MN
(MLD) UL
(MLD)
1:00:00 AM 9.66 11.66 13.66
1:00:00 AM 9.35 11.35 13.35
2:00:00 AM 9.27 11.27 13.27
2:00:00 AM 8.57 10.57 12.57
3:00:00 AM 9.44 11.44 13.44
3:00:00 AM 8.60 10.60 12.60
4:00:00 AM 9.16 11.16 13.16
4:00:00 AM 8.41 10.41 12.41
5:00:00 AM 9.62 11.62 13.62
5:00:00 AM 10.52 12.52 14.52
6:00:00 AM 11.00 13.00 15.00
6:00:00 AM 12.96 14.96 16.96
7:00:00 AM 12.87 14.87 16.87
7:00:00 AM 16.18 18.18 20.18
8:00:00 AM 13.15 15.15 17.15
8:00:00 AM 16.01 18.01 20.01
9:00:00 AM 13.12 15.12 17.12
9:00:00 AM 17.02 19.02 21.02
10:00:00 AM 13.18 15.18 17.48
10:00:00 AM 17.02 19.02 21.02
11:00:00 AM 13.09 15.09 17.09
11:00:00 AM 16.41 18.41 20.41
12:00:00 PM 12.97 14.97 16.97
12:00:00 PM 16.10 18.10 20.10
1:00:00 PM 12.61 14.61 16.61
1:00:00 PM 15.56 17.56 19.56
2:00:00 PM 12.76 14.76 16.76
2:00:00 PM 14.97 16.97 18.97
3:00:00 PM 12.67 14.67 16.67
3:00:00 PM 14.09 16.09 18.09
4:00:00 PM 12.26 14.26 16.26
4:00:00 PM 13.58 15.58 17.58
5:00:00 PM 12.40 14.40 16.40
5:00:00 PM 13.11 15.11 17.11
6:00:00 PM 12.20 14.20 16.20
6:00:00 PM 13.94 15.94 17.94
7:00:00 PM 11.96 13.96 15.96
7:00:00 PM 13.78 15.78 17.78
8:00:00 PM 11.63 13.63 15.63
8:00:00 PM 14.40 16.40 18.40
9:00:00 PM 11.97 13.97 15.97
9:00:00 PM 13.37 15.37 17.37
10:00:00 PM 11.60 13.60 15.60
10:00:00 PM 13.39 15.39 17.39
11:00:00 PM 10.44 12.44 14.44
11:00:00 PM 11.57 13.57 15.57
12:00:00 AM 9.84 11.84 13.84
12:00:00 AM 9.38 11.38 13.38
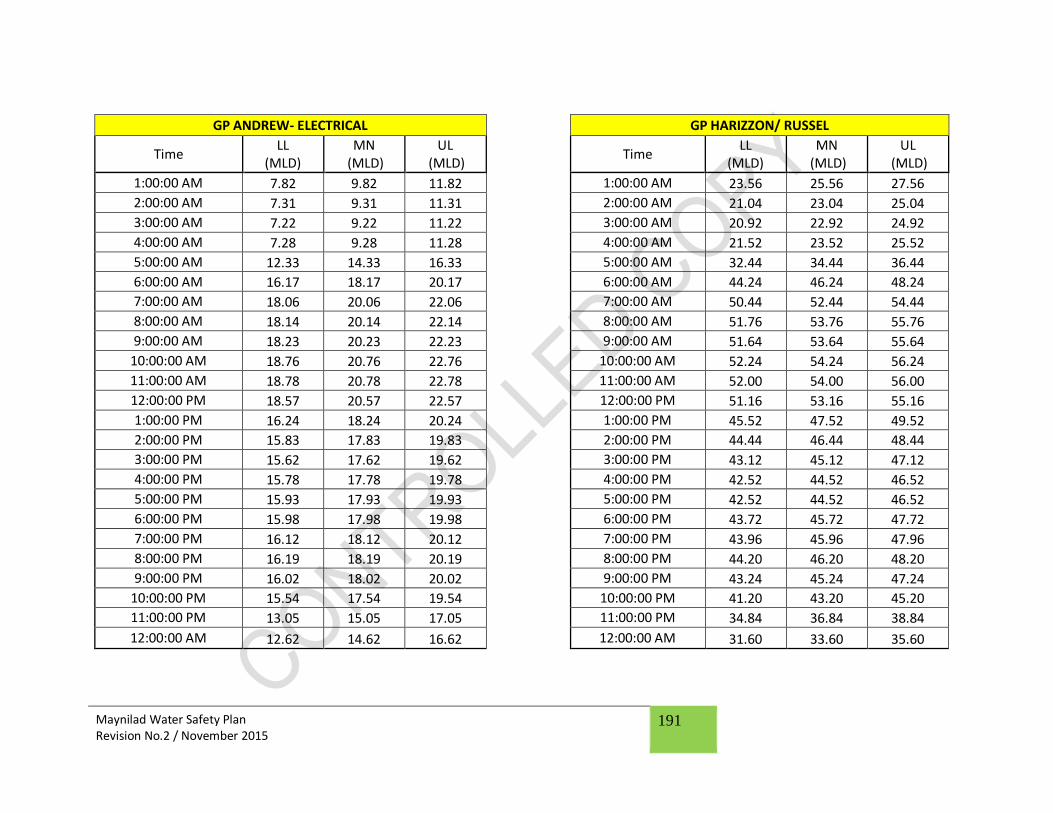
Maynilad Water Safety Plan Revision No.2 / November 2015
191
GP ANDREW- ELECTRICAL GP HARIZZON/ RUSSEL
Time LL
(MLD) MN
(MLD) UL
(MLD)
Time LL
(MLD) MN
(MLD) UL
(MLD)
1:00:00 AM 7.82 9.82 11.82
1:00:00 AM 23.56 25.56 27.56
2:00:00 AM 7.31 9.31 11.31
2:00:00 AM 21.04 23.04 25.04
3:00:00 AM 7.22 9.22 11.22
3:00:00 AM 20.92 22.92 24.92
4:00:00 AM 7.28 9.28 11.28
4:00:00 AM 21.52 23.52 25.52
5:00:00 AM 12.33 14.33 16.33
5:00:00 AM 32.44 34.44 36.44
6:00:00 AM 16.17 18.17 20.17
6:00:00 AM 44.24 46.24 48.24
7:00:00 AM 18.06 20.06 22.06
7:00:00 AM 50.44 52.44 54.44
8:00:00 AM 18.14 20.14 22.14
8:00:00 AM 51.76 53.76 55.76
9:00:00 AM 18.23 20.23 22.23
9:00:00 AM 51.64 53.64 55.64
10:00:00 AM 18.76 20.76 22.76
10:00:00 AM 52.24 54.24 56.24
11:00:00 AM 18.78 20.78 22.78
11:00:00 AM 52.00 54.00 56.00
12:00:00 PM 18.57 20.57 22.57
12:00:00 PM 51.16 53.16 55.16
1:00:00 PM 16.24 18.24 20.24
1:00:00 PM 45.52 47.52 49.52
2:00:00 PM 15.83 17.83 19.83
2:00:00 PM 44.44 46.44 48.44
3:00:00 PM 15.62 17.62 19.62
3:00:00 PM 43.12 45.12 47.12
4:00:00 PM 15.78 17.78 19.78
4:00:00 PM 42.52 44.52 46.52
5:00:00 PM 15.93 17.93 19.93
5:00:00 PM 42.52 44.52 46.52
6:00:00 PM 15.98 17.98 19.98
6:00:00 PM 43.72 45.72 47.72
7:00:00 PM 16.12 18.12 20.12
7:00:00 PM 43.96 45.96 47.96
8:00:00 PM 16.19 18.19 20.19
8:00:00 PM 44.20 46.20 48.20
9:00:00 PM 16.02 18.02 20.02
9:00:00 PM 43.24 45.24 47.24
10:00:00 PM 15.54 17.54 19.54
10:00:00 PM 41.20 43.20 45.20
11:00:00 PM 13.05 15.05 17.05
11:00:00 PM 34.84 36.84 38.84
12:00:00 AM 12.62 14.62 16.62
12:00:00 AM 31.60 33.60 35.60

Maynilad Water Safety Plan Revision No.2 / November 2015
192
GP WELLA
Time LL
(MLD) MN
(MLD) UL
(MLD)
1:00:00 AM 53.71 55.71 57.71
2:00:00 AM 52.15 54.15 56.15
3:00:00 AM 51.33 53.33 55.33
4:00:00 AM 51.91 53.91 55.91
5:00:00 AM 57.67 59.67 61.67
6:00:00 AM 71.50 73.50 75.50
7:00:00 AM 91.18 93.18 95.18
8:00:00 AM 92.29 94.29 96.29
9:00:00 AM 92.60 94.60 96.60
10:00:00 AM 94.82 96.82 98.82
11:00:00 AM 93.85 95.85 97.85
12:00:00 PM 91.69 93.69 95.69
1:00:00 PM 86.10 88.10 90.10
2:00:00 PM 83.50 85.50 87.50
3:00:00 PM 81.34 83.34 85.34
4:00:00 PM 80.24 82.24 84.24
5:00:00 PM 80.63 82.63 84.63
6:00:00 PM 78.84 80.84 82.84
7:00:00 PM 79.54 81.54 83.54
8:00:00 PM 77.29 79.29 81.29
9:00:00 PM 75.41 77.41 79.41
10:00:00 PM 73.36 75.36 77.36
11:00:00 PM 60.58 62.58 64.58
12:00:00 AM 56.79 58.79 60.79
GP KAYBUBOY
Time LL
(MLD) MN
(MLD) UL
(MLD)
1:00:00 AM 22.76 24.76 26.76
2:00:00 AM 20.72 22.72 24.72
3:00:00 AM 19.75 21.75 23.75
4:00:00 AM 20.32 22.32 24.32
5:00:00 AM 33.70 35.70 37.70
6:00:00 AM 45.86 47.86 49.86
7:00:00 AM 55.82 57.82 59.82
8:00:00 AM 58.01 60.01 62.01
9:00:00 AM 58.83 60.83 62.83
10:00:00 AM 60.93 62.93 64.93
11:00:00 AM 59.80 61.80 63.80
12:00:00 PM 57.80 59.80 61.80
1:00:00 PM 50.36 52.36 54.36
2:00:00 PM 47.93 49.93 51.93
3:00:00 PM 46.59 48.59 50.59
4:00:00 PM 45.23 47.23 49.23
5:00:00 PM 45.41 47.41 49.41
6:00:00 PM 47.27 49.27 51.27
7:00:00 PM 48.41 50.41 52.41
8:00:00 PM 46.29 48.29 50.29
9:00:00 PM 45.09 47.09 49.09
10:00:00 PM 43.29 45.29 47.29
11:00:00 PM 34.65 36.65 38.65
12:00:00 AM 32.67 34.67 36.67

Maynilad Water Safety Plan Revision No.2 / November 2015
193
DGP 072T
Time LL
(MLD) MN
(MLD) UL
(MLD)
1:00:00 AM 0.00 1.34 3.34
2:00:00 AM 0.00 1.34 3.34
3:00:00 AM 0.00 1.31 3.31
4:00:00 AM 0.00 1.34 3.34
5:00:00 AM 0.00 1.63 3.63
6:00:00 AM 0.20 2.20 4.20
7:00:00 AM 0.99 2.99 4.99
8:00:00 AM 1.06 3.06 5.06
9:00:00 AM 1.68 3.68 5.68
10:00:00 AM 4.36 6.36 8.36
11:00:00 AM 4.15 6.15 8.15
12:00:00 PM 3.63 5.63 7.63
1:00:00 PM 2.93 4.93 6.93
2:00:00 PM 2.27 4.27 6.27
3:00:00 PM 0.44 2.44 4.44
4:00:00 PM 0.49 2.49 4.49
5:00:00 PM 0.58 2.58 4.58
6:00:00 PM 0.60 2.60 4.60
7:00:00 PM 0.64 2.64 4.64
8:00:00 PM 0.50 2.50 4.50
9:00:00 PM 0.22 2.22 4.22
10:00:00 PM 0.13 2.13 4.13
11:00:00 PM -0.26 1.74 3.74
12:00:00 AM -0.40 1.60 3.60
GP KABIHASNAN/ COASTAL
Time LL
(MLD) MN
(MLD) UL
(MLD)
1:00:00 AM 44.76 46.76 48.76
2:00:00 AM 42.18 44.18 46.18
3:00:00 AM 42.75 44.75 46.75
4:00:00 AM 43.70 45.70 47.70
5:00:00 AM 61.46 63.46 65.46
6:00:00 AM 74.77 76.77 78.77
7:00:00 AM 85.61 87.61 89.61
8:00:00 AM 87.58 89.58 91.58
9:00:00 AM 87.67 89.67 91.67
10:00:00 AM 90.04 92.04 94.04
11:00:00 AM 88.41 90.41 92.41
12:00:00 PM 86.33 88.33 90.33
1:00:00 PM 76.82 78.82 80.82
2:00:00 PM 74.69 76.69 78.69
3:00:00 PM 72.81 74.81 76.81
4:00:00 PM 72.62 74.62 76.62
5:00:00 PM 73.08 75.08 77.08
6:00:00 PM 74.37 76.37 78.37
7:00:00 PM 74.44 76.44 78.44
8:00:00 PM 73.12 75.12 77.12
9:00:00 PM 71.49 73.49 75.49
10:00:00 PM 69.89 71.89 73.89
11:00:00 PM 60.21 62.21 64.21
12:00:00 AM 57.40 59.40 61.40

Maynilad Water Safety Plan Revision No.2 / November 2015
194
Legend: LL – Lower Limit MN – Mean UL – Upper Limit MLD – Million Liters per Day GP – Gauging Point
GP PS BANK SUCAT
Time LL
(MLD) MN
(MLD) UL
(MLD)
1:00:00 AM 7.81 9.81 11.81
2:00:00 AM 7.12 9.12 11.12
3:00:00 AM 6.88 8.88 10.88
4:00:00 AM 7.28 9.28 11.28
5:00:00 AM 9.04 11.04 13.04
6:00:00 AM 14.02 16.02 18.02
7:00:00 AM 22.35 24.35 26.35
8:00:00 AM 22.84 24.84 26.84
9:00:00 AM 23.20 25.20 27.20
10:00:00 AM 22.77 24.77 26.77
11:00:00 AM 21.95 23.95 25.95
12:00:00 PM 21.01 23.01 25.01
1:00:00 PM 19.57 21.57 23.57
2:00:00 PM 18.60 20.60 22.60
3:00:00 PM 17.46 19.46 21.46
4:00:00 PM 16.95 18.95 20.95
5:00:00 PM 17.30 19.30 21.30
6:00:00 PM 17.36 19.36 21.36
7:00:00 PM 17.39 19.39 21.39
8:00:00 PM 16.19 18.19 20.19
9:00:00 PM 15.70 17.70 19.70
10:00:00 PM 13.68 15.68 17.68
11:00:00 PM 10.47 12.47 14.47
12:00:00 AM 8.34 10.34 12.34

Maynilad Water Safety Plan Revision No.2 / November 2015
195
Annex IX: Putatan Water Treatment Plant - Standard Operating Procedures i. ALGAE
PUTATAN WATER TREATMENT PLANT STANDARD OPERATING PROCEDURE
TASTE AND ODOR MITIGATING ACTIONS ALGAE COUNT MONITORING
Daily Biological Test of the Intake, Forebay, MF Filtrate and Product waters is done every morning and in the afternoon wherein the individual algal count of microorganisms present in the sample water is measured. At the end of the day, a water forecast is reported to the Water Production, Water Treatment, Business Area and Water Network Head to provide a probable water quality for the next day. The following alert levels have been established
1. Alert Level 1 (Low)
In case of significant algae count, any mitigating measures that have been done to address the
problem must also be included. Below is the sample messages that can be reported:
PWTP Update: As of 11/3/2011, the total algal count at the Intake is 235/mL with insignificant number of taste and odor-causing microorganisms. Good water quality is expected tomorrow. Thank you. 2. Alert Level 2 (Medium)
When Biological test shows alarming results (algal count of > 500 to <2000 cell/mL), water quality should be closely monitored for any occurrence of undesirable taste and odor in the water. Frequent tasting and smelling of product water (water at the reservoir) must be done by non-PWTP personnel to describe the taste and odor of the water. Jar testing of potassium permanganate dose must be conducted and manganese test be determined. Based on the results, PCU must recommend appropriate KMnO4 dosage for the Shift officer to implement. Upon application of the adjusted dose, the pre-treated tank water, MF inlet water and MF Filtrate water must be closely observed for any change of color (pinkish, brownish, greenish and yellowish) water. When there is an apparent change in color, PCU personnel must be informed for adjustment of KMnO4 dose. Below is the sample messages that can be reported:
PWTP Update: As of 11/3/2011, the total algal count at the Intake is 890/mL with significant number of taste and odor-causing microorganisms. Potassium permanganate dosing has been increased from 0.15 to 0.4ppm and two RO racks are already running. Please be vigilant and report to us any incident of T&O related issues. Thank you.
While waiting for jar test result of KMnO4 and the effect of adjusted dosing, the Shift officer must decrease production, and run at least four ROs to dilute the water and minimize any problematic

Maynilad Water Safety Plan Revision No.2 / November 2015
196
water that may have entered the reservoir. The decrease in production must be coordinated immediately with water network to manage water supply and pressure. This should be done until biological test shows insignificant number of algae count. 3. Alert Level 3 (High)
When taste and/or odor problem is first detected (algal count of > 2000 to < 5000 cell/ml), the PCU personnel must inform the Shift Officer, PCU supervisor, plant head and concerned heads immediately. Depending on the available ROs that can be simultaneously run, the Shift Officer must compute the decrease in production that must be implemented to have an MFRO blend of 50-50%. Sample computation: Available ROs = 4 Permeate Flow rate of each RO rack = 60 L/s Total permeate flow of four RO = 60 x 4 = 240 L/s 50 % RO water Brine solution flow rate = 16 L/s x 4 = 64 L/s Total RO feed water = 240 + 64 = 304 L/s MF Filtrate should also be 240 L/s to have a 50-50% blended product water. MF Feed = 240 + 304 = 544 L/s MF has a recovery of 95%, so: 544/0.95 = 572 L/s 572 L/s is equivalent to approximately 49.5 or 50 MLD.
Water Network should be informed about the computed decrease in production setting for proper water supply and pressure management in the distribution system.
Jar testing of KMnO4 should be conducted. Implement the recommended KMnO4 dose and monitor for any color change in the pre-treated tank and MF inlet. Taste-and-Odor testing of product water by non-PWTP personnel must be done every hour for monitoring of water quality status inside the plant.
Water quality should be monitored at specific locations. a. Water quality at PWTP – PWTP personnel b. Monitoring points at AAV and General Distribution – Water Network personnel c. Customer complaints – Business Area personnel
This should be done until biological test shows insignificant number of algae count. 4. Alert Level 4 (Very High) Procedures for alert levels 2 and 3 should be followed when uncontrolled and/or unforeseen algal bloom occurs (algal count of > 50,000 cell/mL). In addition, the following are ought to be executed.
a. Isolation of reservoir inlet – plant personnel
b. Reduce production and flushing of contaminated MF Filtrate – plant personnel

Maynilad Water Safety Plan Revision No.2 / November 2015
197
c. Flushing at the network distribution system – Water Network personnel
This should be done until biological test shows insignificant number of algae count.

Maynilad Water Safety Plan Revision No.2 / November 2015
198
ii. TOTAL DISSOLVED SOLIDS
PUTATAN WATER TREATMENT PLANT STANDARD OPERATING PROCEDURE
TOTAL DISSOLVED SOLIDS (TDS) MITIGATING ACTIONS TDS MONITORING
Total Dissolved Solids of the Intake, Forebay, MF Filtrate and Product waters is at constant
monitored done every two hours. When the TDS measured spikes especially at the MF Filtrate, this
triggered the operation through PCU and also serves as a caution for the quality of water that has effect
or could pose risk to the distribution if MF Filtrate is not taken care of. Although the effect is categorized
as secondary parameters from PSNDW, TDS has other quality problem that goes with it especially Taste
and Odor as from the previous data suggest. And these quality problems may the source of customer’s
complaints. To alleviate this PWTP has created early warning or alert level so that concerned
departments could adjust in advance especially the Water Network and Business Area.
The operational limit of TDS at the MF Filtrate is set to have 430mg/L. Above 430mg/L the
following Alert Levels are established for the proper action.
1. Alert Level 1 (MF Filtrate TDS= 431 mg/L to 470mg/L) Alert Level 1 has TDS ranges from 431 mg/L to 470 mg/L at the MF Filtrate. When verified that
TDS at the MF have Alert Level 1 Level, Shift Officer on duty will:
A. Use or refer to the calculated or the tabulated TDS SOP Data (Excel File). Table 1 is the sample of the Tabulated TDS-RO-Prod Data.
Table 1. Alert Level 1 with TDS=431ppm Tabulated TDS-RO-Prod Data.
Production Setting,
MLD
Alert Level 1 = 431- 470 mg/l TDS
1 2 3 4 5 6
100 435 414 393 372 352 331
95 434 412 390 368 346 324
90 433 410 386 363 340 317
85 431 407 382 358 333 308
80 430 404 378 352 325 299
75 428 400 372 345 317 289
70 426 396 366 337 307 277
65 424 392 360 327 295 263
60 421 386 352 317 282 247
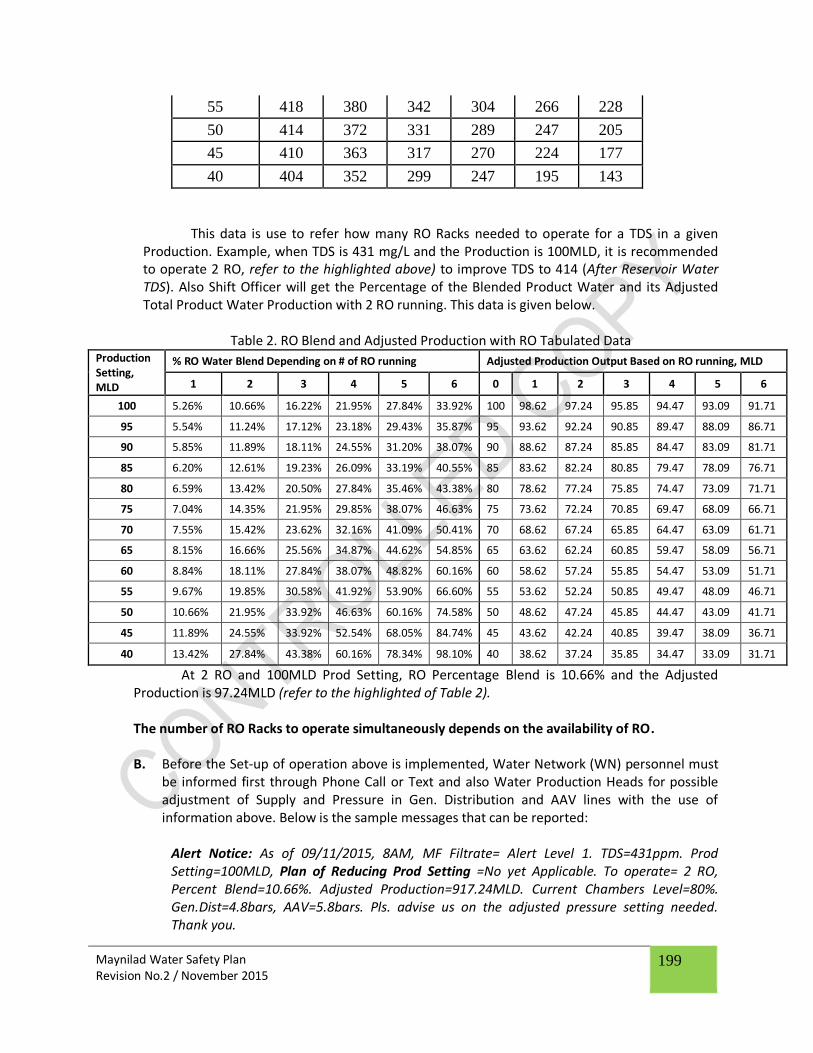
Maynilad Water Safety Plan Revision No.2 / November 2015
199
55 418 380 342 304 266 228
50 414 372 331 289 247 205
45 410 363 317 270 224 177
40 404 352 299 247 195 143
This data is use to refer how many RO Racks needed to operate for a TDS in a given Production. Example, when TDS is 431 mg/L and the Production is 100MLD, it is recommended to operate 2 RO, refer to the highlighted above) to improve TDS to 414 (After Reservoir Water TDS). Also Shift Officer will get the Percentage of the Blended Product Water and its Adjusted Total Product Water Production with 2 RO running. This data is given below.
Table 2. RO Blend and Adjusted Production with RO Tabulated Data Production Setting, MLD
% RO Water Blend Depending on # of RO running Adjusted Production Output Based on RO running, MLD
1 2 3 4 5 6 0 1 2 3 4 5 6
100 5.26% 10.66% 16.22% 21.95% 27.84% 33.92% 100 98.62 97.24 95.85 94.47 93.09 91.71
95 5.54% 11.24% 17.12% 23.18% 29.43% 35.87% 95 93.62 92.24 90.85 89.47 88.09 86.71
90 5.85% 11.89% 18.11% 24.55% 31.20% 38.07% 90 88.62 87.24 85.85 84.47 83.09 81.71
85 6.20% 12.61% 19.23% 26.09% 33.19% 40.55% 85 83.62 82.24 80.85 79.47 78.09 76.71
80 6.59% 13.42% 20.50% 27.84% 35.46% 43.38% 80 78.62 77.24 75.85 74.47 73.09 71.71
75 7.04% 14.35% 21.95% 29.85% 38.07% 46.63% 75 73.62 72.24 70.85 69.47 68.09 66.71
70 7.55% 15.42% 23.62% 32.16% 41.09% 50.41% 70 68.62 67.24 65.85 64.47 63.09 61.71
65 8.15% 16.66% 25.56% 34.87% 44.62% 54.85% 65 63.62 62.24 60.85 59.47 58.09 56.71
60 8.84% 18.11% 27.84% 38.07% 48.82% 60.16% 60 58.62 57.24 55.85 54.47 53.09 51.71
55 9.67% 19.85% 30.58% 41.92% 53.90% 66.60% 55 53.62 52.24 50.85 49.47 48.09 46.71
50 10.66% 21.95% 33.92% 46.63% 60.16% 74.58% 50 48.62 47.24 45.85 44.47 43.09 41.71
45 11.89% 24.55% 33.92% 52.54% 68.05% 84.74% 45 43.62 42.24 40.85 39.47 38.09 36.71
40 13.42% 27.84% 43.38% 60.16% 78.34% 98.10% 40 38.62 37.24 35.85 34.47 33.09 31.71
At 2 RO and 100MLD Prod Setting, RO Percentage Blend is 10.66% and the Adjusted Production is 97.24MLD (refer to the highlighted of Table 2).
The number of RO Racks to operate simultaneously depends on the availability of RO.
B. Before the Set-up of operation above is implemented, Water Network (WN) personnel must
be informed first through Phone Call or Text and also Water Production Heads for possible adjustment of Supply and Pressure in Gen. Distribution and AAV lines with the use of information above. Below is the sample messages that can be reported:
Alert Notice: As of 09/11/2015, 8AM, MF Filtrate= Alert Level 1. TDS=431ppm. Prod Setting=100MLD, Plan of Reducing Prod Setting =No yet Applicable. To operate= 2 RO, Percent Blend=10.66%. Adjusted Production=917.24MLD. Current Chambers Level=80%. Gen.Dist=4.8bars, AAV=5.8bars. Pls. advise us on the adjusted pressure setting needed. Thank you.

Maynilad Water Safety Plan Revision No.2 / November 2015
200
(It is assumed that the WN is the one who will inform other Departments regarding the Supply and Pressure of the Distribution lines).
C. When Go Signal and Pressure Setting (as needed) are given by Water Network Personnel,
Shift Officer will proceed to operate RO Racks (2RO as example above). And reduce the Production Setting as recommended by the Tabulated Data. If no response from WN through text and call, Shift Officer will call Plant Manager for permission to implement plan. If Plant Manager is unavailable, Shift Officer may call to Water Prod Head or Water Supply Operations Head for the implementation of plan.
D. If there is a need of Operating RO Units and Reducing the Production Setting, Shift Officer
may again follow A to C. Operating RO Units and Reducing the Production Setting is needed when but not limited to:
i. If the targeted value (suggested outcome or does not resulted to) of TDS at the
Table 1 is not meet and upon the advice of PCU. ii. If another quality problem arises as advice from PCU (i.e color, taste and odor,
etc.) with the TDS level. If there is an option of choosing between increasing operations of RO Racks at given Prod Setting and Reducing Prod Setting and reducing RO operations, the former will be followed.
E. Shift Officer will always follow an Option/Plan with high Production Output without
compromising water quality.
F. If taste and odor problem arise together with the TDS level Shift Officer Taste and Odor Problem S.O.P.
G. This should be done until MF Filtrate TDS shows insignificant number level. Information or
report is also be sent to contacts in Step B if TDS Level is insignificant, equal or below
operational TDS limit otherwise further instructed by Plant Manager or Water Prod Head or
Water Supply Operations Head to retained operation status.
2. Alert Level 2 (MF Filtrate TDS= 471 mg/L to 510 mg/L)
Alert Level 2 has TDS level ranges from 471mg/L to 510 mg/L at the MF Filtrate. When verified
that TDS at the MF have Alert Level 2 Level, Shift Officer on duty will follow the same steps (A-F) as Alert Level 1. Alert Level 2 has recommended RO Operations of 3-4 Racks.
Example of table extracted from excel file Table 3 (at TDS=486mg/L) is used instead of the sample table Table 1 for Alert Level 3 (excel file) for Step A and is shown below and the Adjusted Production Table to use is still Table 2.
Table 3. Alert Level 2 with TDS=486ppm Tabulated TDS-RO-Prod Data.
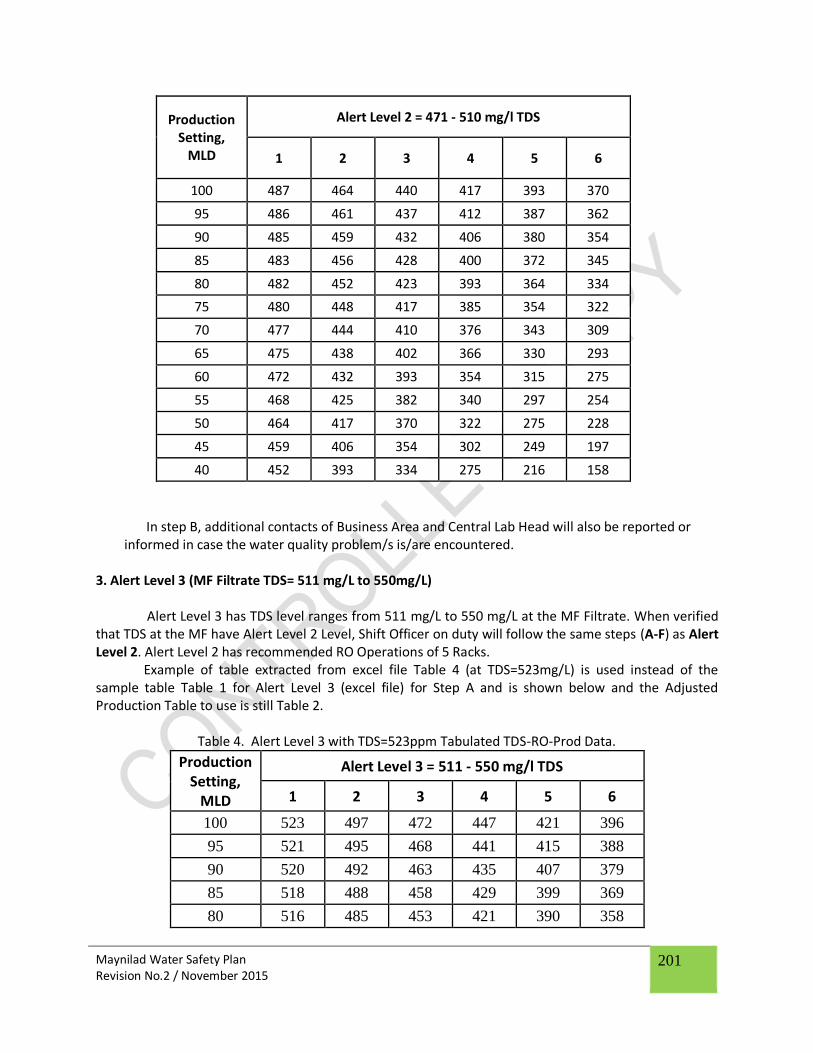
Maynilad Water Safety Plan Revision No.2 / November 2015
201
Production Setting,
MLD
Alert Level 2 = 471 - 510 mg/l TDS
1 2 3 4 5 6
100 487 464 440 417 393 370
95 486 461 437 412 387 362
90 485 459 432 406 380 354
85 483 456 428 400 372 345
80 482 452 423 393 364 334
75 480 448 417 385 354 322
70 477 444 410 376 343 309
65 475 438 402 366 330 293
60 472 432 393 354 315 275
55 468 425 382 340 297 254
50 464 417 370 322 275 228
45 459 406 354 302 249 197
40 452 393 334 275 216 158
In step B, additional contacts of Business Area and Central Lab Head will also be reported or
informed in case the water quality problem/s is/are encountered.
3. Alert Level 3 (MF Filtrate TDS= 511 mg/L to 550mg/L) Alert Level 3 has TDS level ranges from 511 mg/L to 550 mg/L at the MF Filtrate. When verified
that TDS at the MF have Alert Level 2 Level, Shift Officer on duty will follow the same steps (A-F) as Alert Level 2. Alert Level 2 has recommended RO Operations of 5 Racks. Example of table extracted from excel file Table 4 (at TDS=523mg/L) is used instead of the sample table Table 1 for Alert Level 3 (excel file) for Step A and is shown below and the Adjusted Production Table to use is still Table 2.
Table 4. Alert Level 3 with TDS=523ppm Tabulated TDS-RO-Prod Data.
Production Setting,
MLD
Alert Level 3 = 511 - 550 mg/l TDS
1 2 3 4 5 6
100 523 497 472 447 421 396
95 521 495 468 441 415 388
90 520 492 463 435 407 379
85 518 488 458 429 399 369
80 516 485 453 421 390 358

Maynilad Water Safety Plan Revision No.2 / November 2015
202
75 514 480 447 413 379 345
70 512 476 439 403 367 331
65 509 470 431 392 353 314
60 506 463 421 379 337 294
55 502 456 410 364 317 271
50 497 447 396 345 294 244
45 492 435 379 323 266 210
40 485 421 358 294 231 168
4. Alert Level 4 (MF Filtrate TDS= 551 mg/L and above)
Alert Level 4 has TDS level ranges from 551 mg/L and above at the MF Filtrate. When verified that TDS at the MF have Alert Level 2 Level, Shift Officer on duty will follow the same steps (A-F) as Alert Level 2. Alert Level 4 has recommended RO Operations of 6 Racks. Example of table extracted from excel file Table 5 (at TDS=575mg/L) is used instead of the sample table Table 1 for Alert Level 4 for Step A and is shown below (and the Adjusted Production Table to use is still Table 2.
Table 5. Alert Level 4 with TDS=575ppm Tabulated TDS-RO-Prod Data.
Production Setting,
MLD
Alert Level 4 = 551 mg/l TDS and above
1 2 3 4 5 6
100 572 544 516 488 461 433
95 571 541 512 483 453 424
90 569 538 507 476 445 414
85 567 534 502 469 436 403
80 565 530 495 461 426 391
75 563 526 488 451 414 377
70 560 520 481 441 401 361
65 557 514 471 428 386 343
60 554 507 461 414 368 321
55 549 499 448 397 347 296
50 544 488 433 377 321 265
45 538 476 414 352 290 228
40 530 461 391 321 251 182

Maynilad Water Safety Plan Revision No.2 / November 2015
203
iii. Ammonia
PUTATAN WATER TREATMENT PLANT STANDARD OPERATING PROCEDURE
Ammonia-Nitrogen Spikes Mitigating Actions
Residual chlorine is just one of the important parameters that the Philippine National Standard
for Drinking Water requires to measure. Its presence in the water is an indication of sufficiency of
treatment or chlorination, and is therefore an assurance of protection of the microbiological quality
(PNSDW 2007).
On the study conducted by BC Villa entitled “Dealing with Ammonia-Nitrogen Spikes at Putatan
Treatment Plant”, the low residual chlorine problem in PWTP occurred on late 2010 despite of having
high chlorine dosages. The ammonia-nitrogen content in the raw water was said to be associated with
this problem (Ammonia-nitrogen and chlorine were correlated by a so-called Breakpoint Chlorination
curve), so it was suggested to analyse the Ammonia-nitrogen content of the untreated water for
possible high nitrogen content of the Laguna Lake. Sources of Ammonia-nitrogen include decaying
plants and animals, animal waste, industrial waste effluent, agricultural runoff and atmospheric nitrogen
which are all highly present around the lake.
To alleviate the Ammonia-Nitrogen Spikes in PWTP, Maynilad tapped Wabag to construct a
Biological Aerated Filtration (BAF)
A protocol for Ammonia was created. This protocol also serves as an alert system so that
concerned departments could adjust in advance especially the Water Network and Business Area. The following procedures are to be followed:
1. Observe behavior of Chlorine Residual readings.
2. If residual chlorine in After Reservoir water does not reached the required operational
parameter (1.0 to 1.3ppm) with chlorine dose at MAXIMUM setting on PRE-CHLORINATION and
POST CHLORINATION OF GENERAL DISTRIBUTION and AAV, check the ammonia-nitrogen
concentration of the MF FILTRATE water.

Maynilad Water Safety Plan Revision No.2 / November 2015
204
When ammonia-nitrogen concentration in MF is equal or greater than 0.60 ppm since
the operational limit of Ammonia-Nitrogen at the MF Filtrate that the existing Gas Chlorination
system can treat is set to 0.60mg/L max. Beyond this, problems on low residual chlorine occur.
It is recommend to do the following, one step at a time:
A.1. Run the standby sodium hypochlorite chlorination system at the reservoir.
(Use Ammonia Mitigation Using NaOCl Updated file for dosing matrix)
Example: Ammonia at MF=0.85ppm; NaOCl percent Chlorine: 8.0% Spec gravity:
1.12
Remaining Ammonia for NaOCl treatment= (0.85ppm-0.6ppm)= 0.25ppm
Chlorine dose required for 0.25ppm Ammonia =5.55ppm (see Ammonia Mitigation
Using NaOCl Updated file for dosing matrix)
Ammonia Level Chlorine dose
required (ppm)
0.01-0.05 3.55
0.06-0.09 4.05
0.10-0.15 5.05
0.16-0.2 5.25
0.21-0.25 5.55
0.26-0.3 6.05
0.31-0.35 6.15
0.36-0.4 6.8
0.41-0.45 7.05
Table. 1. Ammonia Mitigation Using NaOCl Updated file for dosing matrix
Base from above value the required dosing of NaOCl is:
NaOCl (L/hr)= (RAW WATER (MLD)*CHLORINE DOSE Required) (NaOCl percent Chlorine*Specific gravity of NaOCl*24)
= ((100 MLD)*5.55mg/L))/(.08*1.12*24))= 258.09 L/hr
If the residual chlorine of After Reservoir water is still not met by Sodium Hypochlorite
dosing at Reservoir.

Maynilad Water Safety Plan Revision No.2 / November 2015
205
A.2. Run the Reverse Osmosis (RO) Units. Until the desired value of Ammonia in the
blended water (MF Filtrate and RO permeate) that can be treated by Sodium
Hypochlorite.
Ex. At Ammonia level of MF Filtrate =>0.6mg/L, a required =>2 units or racks of RO is
recommended to operate.
Also refer to Revised RO Protocol vs Ammonia 2015 Matrix. See Tables below.
Production Setting,
MLD
Alert Level 1 = 0.60-0.85mg/L Ammonia NH3-N = 0.85mg/L
1 2 3 4 5 6
100 0.81 0.77 0.72 0.68 0.64 0.60
95 0.81 0.76 0.72 0.67 0.63 0.58
90 0.80 0.76 0.71 0.66 0.62 0.57
85 0.80 0.75 0.70 0.65 0.60 0.55
80 0.80 0.74 0.69 0.64 0.59 0.53
75 0.79 0.74 0.68 0.63 0.57 0.51
70 0.79 0.73 0.67 0.61 0.55 0.49
65 0.79 0.72 0.66 0.59 0.53 0.46
60 0.78 0.71 0.64 0.57 0.50 0.43
55 0.77 0.70 0.62 0.54 0.47 0.39
50 0.77 0.68 0.60 0.51 0.43 0.35
45 0.76 0.66 0.57 0.48 0.38 0.29
40 0.74 0.64 0.53 0.43 0.32 0.22
Production Setting,
MLD
Alert Level 2 = >0.85-0.90mg/L Ammonia NH3-N = 0.90mg/L
1 2 3 4 5 6
100 0.86 0.81 0.77 0.72 0.68 0.63
95 0.85 0.81 0.76 0.71 0.67 0.62
90 0.85 0.80 0.75 0.70 0.65 0.60
85 0.85 0.80 0.74 0.69 0.64 0.59
80 0.84 0.79 0.73 0.68 0.62 0.57
75 0.84 0.78 0.72 0.66 0.60 0.54
70 0.84 0.77 0.71 0.65 0.58 0.52
65 0.83 0.76 0.69 0.63 0.56 0.49
60 0.83 0.75 0.68 0.60 0.53 0.46
55 0.82 0.74 0.66 0.58 0.50 0.41
50 0.81 0.72 0.63 0.54 0.46 0.37
45 0.80 0.70 0.60 0.50 0.41 0.31
40 0.79 0.68 0.57 0.46 0.34 0.23
Production Setting,
MLD
Alert Level 3 = >0.90-1.06mg/L Ammonia NH3-N = 1.06mg/L
1 2 3 4 5 6

Maynilad Water Safety Plan Revision No.2 / November 2015
206
100 1.01 0.96 0.90 0.85 0.80 0.75
95 1.00 0.95 0.89 0.84 0.78 0.73
90 1.00 0.94 0.89 0.83 0.77 0.71
85 1.00 0.94 0.88 0.81 0.75 0.69
80 0.99 0.93 0.86 0.80 0.73 0.67
75 0.99 0.92 0.85 0.78 0.71 0.64
70 0.99 0.91 0.84 0.76 0.69 0.61
65 0.98 0.90 0.82 0.74 0.66 0.58
60 0.97 0.89 0.80 0.71 0.62 0.54
55 0.96 0.87 0.77 0.68 0.58 0.49
50 0.96 0.85 0.75 0.64 0.54 0.43
45 0.94 0.83 0.71 0.59 0.48 0.36
40 0.93 0.80 0.67 0.54 0.41 0.27
Production Setting,
MLD
Alert Level 4 = >1.06mg/L Ammonia NH3-N = 1.20mg/L
1 2 3 4 5 6
100 1.14 1.08 1.02 0.96 0.90 0.84
95 1.14 1.08 1.01 0.95 0.89 0.83
90 1.13 1.07 1.00 0.94 0.87 0.80
85 1.13 1.06 0.99 0.92 0.85 0.78
80 1.13 1.05 0.98 0.90 0.83 0.76
75 1.12 1.04 0.96 0.88 0.80 0.73
70 1.12 1.03 0.95 0.86 0.78 0.69
65 1.11 1.02 0.93 0.84 0.74 0.65
60 1.10 1.00 0.90 0.80 0.71 0.61
55 1.09 0.98 0.88 0.77 0.66 0.55
50 1.08 0.96 0.84 0.73 0.61 0.49
45 1.07 0.94 0.80 0.67 0.54 0.41
40 1.05 0.90 0.76 0.61 0.46 0.31
B. Reduce production. Up to BAF effective capacity for Ammonia removal or until its BAF’s
treated water Ammonia desired value is met.
C. Run standby sodium hypochlorite chlorination system at the Intake. The plant can only
treat 3 ppm of Ammonia. Beyond this, there will be a dosing of sodium hypochlorite at the
Intake to reached desired 3ppm level. Use the Mitigation Using NaOCl Updated file for
dosing matrix.
Ex. Ammonia at Intake=3.5ppm; NaOCl percent Chlorine: 8.0% Spec gravity: 1.12

Maynilad Water Safety Plan Revision No.2 / November 2015
207
Remaining Ammonia for NaOCl treatment= (3.25ppm-3ppm)= 0.25ppm
Chlorine dose required for 0.25ppm Ammonia =5.55ppm (see Ammonia Mitigation
Using NaOCl Updated file for dosing matrix)
Ammonia Level Chlorine dose
required (ppm)
0.01-0.05 3.55
0.06-0.09 4.05
0.10-0.15 5.05
0.16-0.2 5.25
0.21-0.25 5.55
0.26-0.3 6.05
0.31-0.35 6.15
0.36-0.4 6.8
0.41-0.45 7.05
Table. 1. Ammonia Mitigation Using NaOCl Updated file for dosing matrix
Base from above value the required dosing of NaOCl is:
NaOCl (L/hr)= (RAW WATER (MLD)*CHLORINE DOSE Required) (NaOCl percent Chlorine*Specific gravity of NaOCl*24)
= ((100 MLD)*5.55mg/L))/(.08*1.12*24))= 258.09 L/hr
3. Continue doing the above step/s until the Ammonia-Nitrogen of the MF Filtrate is 0.30 ppm
again and or until the residual chlorine stabilizes to desired limit.
For the notification of other concerning persons or departments, an Alert Level is
established based on the level of Ammonia at MF Filtrate. PWTP will send the
information to concerned Personnel regarding the alert level status with corresponding
recommendation/s in terms of Production output, number/s of RO to be operated, # of
available RO units available and RO blend for supply and pressure management.
The Alert Levels are:
1. Alert Level 1 if MF Filtrate NH3-N= >0.6mg/L-0.85mg/L
2. Alert Level 2 if MF Filtrate NH3-N >0.85-0.9 mg/L

Maynilad Water Safety Plan Revision No.2 / November 2015
208
3. Alert Level 3 if MF Filtrate NH3-N >0.9mg/L-1.06mg/L
4. Alert Level 4 if MF Filtrate NH3-N >1.06mg/L and above
If the problem already exists related with Ammonia (Residual Chlorine) in the Gen.Dist and AAV line, inform and coordinate with Water Network (Booster Operation- R1/R2 and Bautista personnel) for additional chlorination until required Residual Chlorine is met.
Take note also that RO Units availability is also a factor to be considered since not at all times all 6
RO Units are available due to PM, CIP Cleaning, Pre-filter change etc. Production can vary due to
this.
Usage of Ca(OCl)2 is not considered in this protocol

Maynilad Water Safety Plan Revision No.2 / November 2015
209
Annex X: INFORMATIVE
Bagbag RS 1&2 Bagbag Reservoir No. 1&2 CMS Cubic Meter per Second DBP Disinfection By-Product DOH Department of Health HAA Halo Acetic Acid ISO International Organization for Standardization JICA Japan International Cooperation Agency LMTP La Mesa Water Treatment Plant MLD Million Liters per Day MCM Million Cubic Meter MF Microfiltration MMDWQC Metro Manila Drinking Water Quality Committee MWSI Maynilad Water Services, Inc. MWSS Metropolitan Waterworks and Sewerage System NTU Nephelometric Turbidity Unit PHP Philippine Peso PNSDW Philippine National Standards for Drinking Water PPM Part Per Million PVC Poly Vinyl Chloride RO Reverse Osmosis SGDMM Study for Groundwater Development in Metro Manila TUV: SUD is a service provider for a comprehensive and integrated suite of
product testing, inspection and certification services THM Tri-Halo Methane WHO World Health Organization
Top Related